Article

Analysis of the Seismic Performance of Rectangular Recycled Aggregate Concrete Columns with Different Parameters

1
School of Urban Construction, Wuhan University of Science and Technology, Wuhan 430081, China
2
School of Civil Engineering, Wuhan University, Wuhan 430062, China
3
Guangxi Key Laboratory of Disaster Prevention and Engineering Safety, Guangxi University, Nanning 530004, China
4
Key Laboratory of Disaster Prevention and Structural Safety of Ministry of Education, Guangxi University, Nanning 530004, China
5
Hubei Provincial Engineering Research Center of Urban Regeneration, Wuhan 430065, China
6
Key Laboratory of Impact and Safety Engineering, Ministry of Education, Ningbo University, Ningbo 315211, China
7
Hubei Province Key Laboratory of Systems Science in Metallurgical Process, Wuhan 430065, China
8
School of Civil Engineering, Shandong Xiehe University, Jinan 250299, China
9
School of Civil Engineering, Hubei Engineering University, Xiaogan 432000, China
*
Authors to whom correspondence should be addressed.
Buildings 2023, 13(7), 1761; https://doi.org/10.3390/buildings13071761
Submission received: 5 May 2023 / Revised: 22 June 2023 / Accepted: 30 June 2023 / Published: 11 July 2023
(This article belongs to the Section Building Materials, and Repair & Renovation)

Abstract

:
The influence of various seismic parameters on the seismic performance of rectangular reinforced recycled concrete columns was comprehensively revealed through collecting and screening experimental data from 53 rectangular recycled aggregate concrete columns. The research results showed that the bearing capacity of the specimens decreased and the ductility performance increased, which were attributed to the following factors. a. The increase in the replacement ratio and slenderness ratio of recycled coarse aggregate, and b. the reduction in the axial compression ratio and the strength of recycled aggregate concrete. The seismic design limitations and boundary conditions of this study are γ ∈ [0, 100%], n0 ∈ [0, 0.9], λ0 ∈ [5.06, 18.479], λ ∈ [1.09, 3.93], ρsl ∈ [1.01%, 2.45%], ρsv ∈ [1.4%, 5.33%], and f ∈ [C30, C50]. Thus, it is recommended that for the seismic design value of rectangular recycled aggregate concrete columns, the optimal longitudinal reinforcement rate be set at 1.59%.

1. Introduction

The construction industry has undergone rapid development in recent years. However, there has been a significant increase in the generation and emission of urban waste, particularly construction waste [1]. According to statistics, construction waste constitutes approximately 40% of total urban waste, of which waste concrete is the most important component, accounting for 58.8% [2]. In recent years, the application of recycled concrete technology research has created effective methods for the utilization of construction waste [3]. Recycled aggregate concrete is a novel form of concrete that can partially or completely substitute natural aggregates. It is produced from waste concrete according to specific ratios and gradations [4]. In the 1950s, recycled aggregate concrete was mainly used in non-load-bearing systems such as roads. With the continuous development of the modernization process, building types are becoming increasingly diverse, and the structural dimensions are getting larger [5]. Recycled aggregate concrete columns, as the primary vertical load-bearing members, are a vital component of seismic defense for buildings, and their seismic performance has attracted significant attention from a growing number of scholars [6].
Scholars have conducted extensive research on the parameters affecting the seismic performance of rectangular recycled concrete columns. However, quantifying the seismic design range of these selected parameters has proven challenging due to the high cost of experiments and time-consuming simulation operations. Liu et al. [7] prepared four rectangular recycled concrete columns using 1:2 scaling and conducted low perimeter repeated load damage tests to investigate the effects of three levels of recycled coarse aggregate replacement rates (0, 50%, and 100%) and two axial load ratios (0.15 and 0.35) on their seismic performance, and pointed out that the requirement of the axial load ratio must be strictly controlled in seismic design. Gaurav et al. [8] studied the effects of concrete grades (normal, medium, and high strength), recycled concrete aggregate replacement levels (0%, 50%, and 100%), reinforcement diameters (db) (12 mm and 20 mm), joint lengths (5 db, 10 db, 15 db, and 25 db), reinforcement surface properties, and the concrete protective layer (c)—reinforcement diameter (c/db = 1.25 and 2.00), and proposed a descriptive bond strength equation for recycled aggregate concretes to give the most accurate and conservative estimate of splice bond strength. Yuan et al. [9] investigated the seismic performance of precast recycled fine aggregate (RFA) concrete columns with compression sleeve joints, considering the effects of axial compression ratios (from 0 to 0.55), longitudinal reinforcement ratios (1.01%, 1.59%, and 2.45%), the replacement rate of RFA in concrete (0, 30%, and 70%), and fabrication methods (cast-in-place and precast), and theoretically calculated the strength of the columns according to the Chinese code GB 50010-2010 and the American code ACI 318-19. Cai et al. [10] investigated the effects of axial load ratios and CFRP externally restrained and spiral-grooved ultra-high strength reinforcement on the seismic performance of concrete members mixed with recycled coarse aggregate and proposed an iterative method to investigate the relationship between reinforcement slip and reinforcement stress. Ma et al. [11] investigated the effects of recycled coarse aggregate replacement rates, axial compression ratios, and hoop reinforcement rates on the seismic performance of recycled aggregate concrete columns in detail based on low cycle load tests on seven 1:2.5 scale column specimens. Zhang [12] conducted seven comparative tests on the seismic performance of short recycled concrete columns with 1/2 scaling to investigate the effects of reinforcement rates (0.4%, 0.9%, and 1.29%) and cross-reinforcement. Zhang et al. [13] conducted four comparative tests on the seismic performance of recycled concrete short-column models with a shear–span ratio of 1.75, and the models were scaled down by 1/2. Model 1 was a normal concrete short column, Model 2 was a recycled concrete short column with 50% recycled coarse and fine aggregate replacements, Model 3 was a recycled concrete short column with 100% recycled coarse and fine aggregate replacements, and Model 4 was a recycled concrete short column with 100% recycled coarse and fine aggregate replacements and cross reinforcement. Yin et al. [14,15] studied the effects of reinforcement ratios (1.02%, 2.31%, and 3.51%), axial compression ratios (0.2, 0.4, and 0.8), and recycled coarse and fine aggregate replacement ratios (0, 50% and 100%) on the seismic performance of recycled concrete columns, and established a practical calculation method for bearing capacity based on the strength discount of the recycled concrete. Peng et al. [16] conducted a comparative test study of seven recycled concrete columns and two ordinary concrete columns under low circumferential repeated loads, discussed the effects of axial compression ratios, longitudinal reinforcement rates, and volume hoop ratios in the encrypted zone on the ductile performance and ultimate deformation capacity of the specimens, and proposed design recommendations for recycled concrete columns. Bai et al. [17] designed and fabricated nine recycled concrete columns with a shear span ratio of 4.2 using recycled coarse aggregate replacement rates (0, 50%, 100%), axial compression ratios (0.15, 0.30, 0.45) and volumetric hoop ratios (1.64%, 1.09%, 0.66%) as control variables to systematically investigate the seismic performance of recycled concrete columns.
According to the parameter data aforementioned, there has been extensive research on the parameters influencing the seismic performance of rectangular reinforced recycled concrete columns, but their variety and design range is relatively limited. In engineering practice, choosing the optimal seismic performance parameter of reinforced recycled concrete columns requires reading a significant amount of literature and data, invariably consuming a huge amount of time and energy.
The seismic capacity surpassing and damage destruction of rectangular recycled concrete columns occurring when encountering seismic hazards is a structural systemic damage mechanism, which is generally described by ductility, energy dissipation, and bearing capacity. The factors contributing to this particular case, covering external and internal causes, mainly include the recycled coarse aggregate replacement ratio (γ), axial compression ratio (n0), slenderness ratio (λ0), shear span ratio (λ), hoop reinforcement rate (ρsv), longitudinal reinforcement rate (ρsl), and recycled concrete strength grade (f).
This study conducted a lot of literature reading and experimental data collection, aiming at finding the mechanism and influence law of various parameters on the seismic performances of rectangular recycled concrete columns through the application of statistical methods in the resistance seismic test. These parameters include the recycled coarse aggregate replacement rate (γ), axial compression ratio (n0), slenderness ratio (λ0), shear span ratio (λ), hoop reinforcement rate (ρsv), longitudinal reinforcement rate (ρsl), and strength grade of the recycled concrete (f). Additionally, the feasible range of values for the obtained conclusions was also quantified and analyzed. This study provides a basis for identifying the best seismic performance parameters and their ranges within which recycled concrete columns should be designed.

2. Experimental Data Collection

2.1. Theoretical Derivation

Many parameters can affect the seismic performance of rectangular recycled aggregate concrete columns, such as the recycled coarse aggregate replacement ratio (γ), axial compression ratio (n0), slenderness ratio (λ0), shear span ratio (λ), hoop reinforcement rate (ρsv), longitudinal reinforcement rate (ρsl), and recycled aggregate concrete strength grade (f). To further study the theoretical significance of each parameter, it is essential to derive their theoretical equations.
The recycled coarse aggregate replacement ratio (γ) is the proportion of natural coarse aggregate taken as the equivalent replacement of recycled coarse aggregate according to the mass equivalent rectangular method [18], and its value ranges from 0 to 100%, which is calculated by Equation (1).
γ = m 0 m × 100 %
where m0 is the mass of recycled coarse aggregate and m is the mass of natural coarse aggregate.
The axial compression ratio (n0) usually includes the test axial compression ratio and the design axial compression ratio [19]. Since the data collected in this study were derived from experiments, the test axial compression ratio is used for calculation in this study, as in Equation (2).
n 0 = N i j A i f i
where N is the axial pressure at the end of the column and Aifi is the product of the area occupied by the material of the rectangular recycled aggregate concrete column section and the yield strength.
The slenderness ratio (λ0) is the ratio of the calculated length of the rectangular recycled aggregate concrete column to the gyration radius of the column section [20], which is calculated from Equation (3).
λ 0 = L h L w
where Lh and LW are the calculated length and short side width of the rectangular recycled aggregate concrete column section, respectively.
The shear span ratio (λ) refers to the ratio of the product of the component’s sectional bending moment to the product of the shear force and the effective height [21], which is calculated from Equation (4).
λ = M V h 0
where M and V are the bending moments and the shear force of the rectangular recycled aggregate concrete column, respectively [22], and h0 is the effective height of the column section in the direction parallel to the bending moment M, which is calculated by Equation (5).
h 0 = H 2 a s
where H is the height of the column section in the direction parallel to the bending moment M and as is the thickness of the protective layer in the direction of H.
In concrete structures, the hoop reinforcement rate is used to reflect the content of hoop reinforcement relative to concrete and is divided into volume and area hoop reinforcement rates [23]. In this study, the area hoop reinforcement rate (ρsv) is used, which is the entirety of each limb of the hoop that plays the role of shear along the length of the component within one spacing of the hoop and is calculated by Equation (6).
ρ s v = 1 n A s v i b s
where Asvi is the area of the single-limb section of the ith hoop reinforcement; n is the number of hoop limbs that plays a shear role; b is the width of the component, which is perpendicular to the direction of shear force; and s is the hoop spacing.
The longitudinal reinforcement rate (ρsl) is the ratio of the cross-sectional area of the longitudinal reinforcement to the cross-sectional area of the rectangular recycled aggregate concrete column, which is calculated by Equation (7).
ρ s l = 1 k A s l j L W L h
where Aslj is the area of the single-limb section of the jth longitudinal reinforcement; k is the number of longitudinal limbs and others as above.
The strength of recycled aggregate concrete is concrete that uses recycled aggregates to formulate it. The strength grade of recycled aggregate concrete (f) can be calculated based on the strength grade of the concrete [24].

2.2. Data Selection

To obtain the test data of the recycled coarse aggregate replacement ratio (γ), axial compression ratio (n0), slenderness ratio (λ0), shear span ratio (λ), hoop reinforcement rate (ρsv/%), longitudinal reinforcement rate (ρsl/%) and strength grade of recycled aggregate concrete (f), a thorough review of the literature was conducted in relevant fields, and 53 sets of test data for rectangular recycled aggregate concrete columns were comprehensively compared and selected to meet the requirements of this study. The data are shown in Table 1.

2.3. Characteristic Point Data Collection

The skeleton curve is the trajectory of the maximum peak of horizontal force reached in each cyclic loading, which reflects the different stages and characteristics (strength, stiffness, ductility, energy dissipation, and collapse resistance, etc.) of force and deformation of the component, and is also an important basis for determining the characteristic points in the resilience model [25,26]. To better elucidate the mechanism of the influence of different parameters on the seismic performance of rectangular recycled aggregate concrete columns, the yield load (Py) and yield displacement (Δy) at the yield point, the peak load (Pm) and peak displacement (Δm) at the peak point, and the ultimate load (Pu) and ultimate displacement (Δu) at the breaking point are calculated for forward and reverse loading, and the displacement ductility coefficients of each specimen are given [18,19], which are shown in Equation (8).
μ = Δ u Δ y
where Δu is the ultimate displacement at the breaking point and Δy is the yield displacement at the yield point.
For the purpose of analysis and comparison, the values of each characteristic point and the corresponding values obtained through Equation (8) are listed in Table 2.

2.4. Tests Description

In this study, the single variable method is used to separately examine the effects of the recycled coarse aggregate replacement ratio, axial compression ratio, slenderness ratio, shear span ratio, hoop reinforcement rate, longitudinal reinforcement rate, and recycled aggregate concrete strength grade on the seismic performance of rectangular recycled aggregate concrete columns. The CTFM7.5C [8], C2, C3, C4, and C5 [16] test samples are used to evaluate the recycled coarse aggregate replacement ratio, and all other test variables are the same for each specimen other than the various recycled coarse aggregate replacement ratios. C3-4-C30-0, C3-4-C30-0.2, C3-4-C30-0.4, and C3-4-C30-0.6 [9] test samples are used to evaluate the influence of axial compression ratio, and all test factors are the same for each specimen aside from the varying axial compression ratios. When studying the effect of shear span ratio, the test specimens are SRRC1, SRRC2, SRRC3 [17], SRRC4, SRRC8, SRRC10, and SRRC13 [11], and all test variables are the same except for the shear span ratio. To examine the impact of hoop reinforcement rate, the test samples are SRRC9, SRRC10 [17], SRRC13, SRRC16, and SRRC17 [11], and all the test variables are identical outside the various hoop reinforcement rates. For the study of the slenderness ratio, the test samples are SRRC1, SRRC2, SRRC3 [17], SRRC4, SRRC8, SRRC10, and SRRC13 [11], and all the test variables are the same except for the different slenderness ratios. The test samples used to evaluate the longitudinal reinforcement rate are RC1, RC6, and RC7 [20], and all test variables are identical for each specimen, with the exception of the longitudinal reinforcement rate. To study the effect of recycled aggregate concrete strength grade, the test samples are C5-4-C30-0.4, C5-4-C40-0.4, and C5-4-C50-0.4 [9], and all test variables are the same for each specimen except for the recycled aggregate concrete strength grade.

3. Parameters Analysis

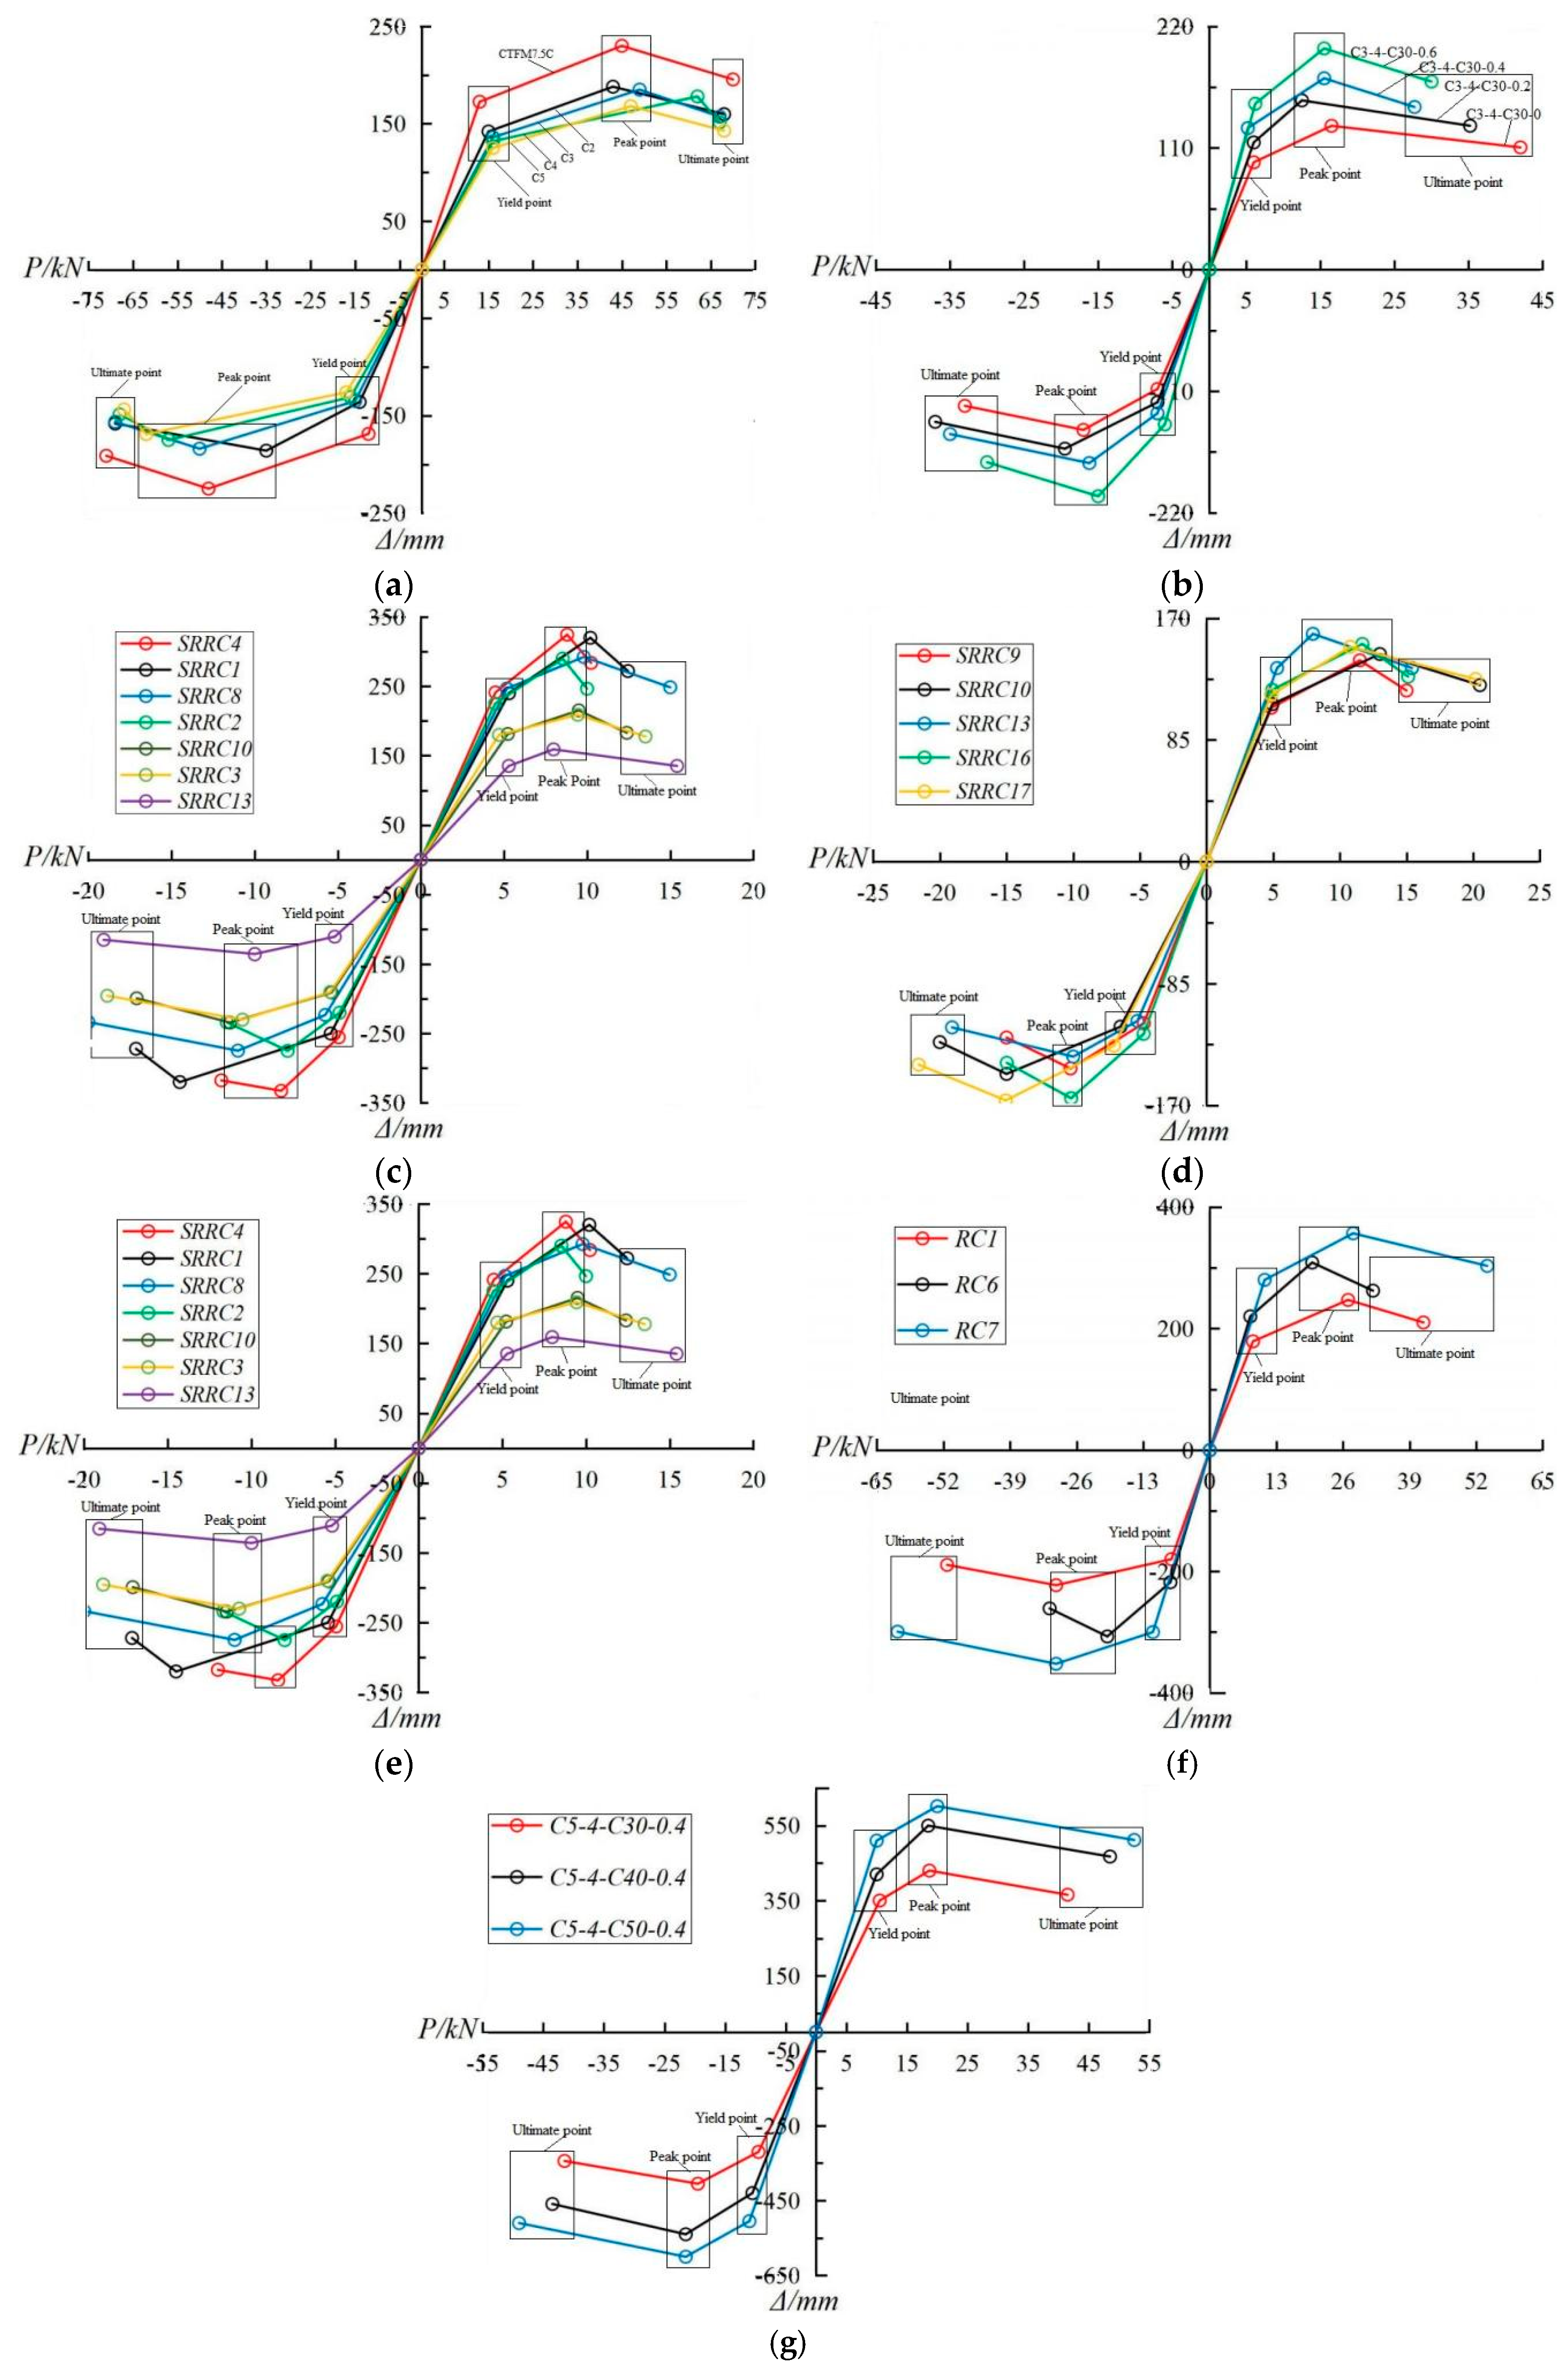
3.1. Skeleton Curve Analysis

The load(P)-displacement (Δ) skeleton curve law of the recycled aggregate concrete column under a single variable is shown in Figure 1. As can be seen from Figure 1a, when the replacement rate increases, the skeleton curve approaches the horizontal coordinate, indicating a gradual decrease in the specimen’s bearing capacity, P, and a weakening of the structure’s seismic capacity, and the ultimate displacement on the skeleton curve moves closer toward the vertical coordinate, while the yield displacement moves away from it, which implies a decrease in ductility of the specimen. From Figure 1b, it can be seen that when the axial compression ratio increases, the skeleton curve moves away from the horizontal coordinate, which indicates that the bearing capacity, P, of the specimen is gradually increased and the seismic capacity of the structure is gradually enhanced. Simultaneously, an increase in the axial compression ratio results in the ultimate displacement on the skeleton curve approaching the vertical coordinate, while the yield displacement is basically unchanged, which indicates that the ductility of the specimen is decreasing. As can be seen from Figure 1c, when the shear span ratio increases, the skeleton curve moves closer to the horizontal coordinate, which indicates that the bearing capacity, P, of the specimen is gradually reduced and the seismic capacity of the structure is gradually weakened. Meanwhile, when the shear span ratio increases, the ultimate displacement on the skeleton curve moves away from the vertical coordinate while the yield displacement is basically unchanged, indicating that the ductility of the specimen is improving. From Figure 1d, it can be seen that when the hoop reinforcement rate increases, the skeleton curve initially moves away from the horizontal coordinate and then returns closer to it, which means that the bearing capacity, P, of the specimen increases first and then decreases, and the seismic capacity of the structure is improved initially and then diminished. When the hoop reinforcement rate is about 1.36%, the structure exhibits the highest seismic capacity. When the hoop reinforcement rate increases, the ultimate displacement on the skeleton curve moves away from the vertical coordinate while the yield displacement is basically unchanged, indicating an improvement in the specimen’s ductility. As can be seen from Figure 1e, when the slenderness ratio increases, the skeleton curve approaches the horizontal coordinate, implying a gradual reduction of the bearing capacity and the seismic capacity. Meanwhile, as the slenderness ratio increases, the ultimate displacement on the skeleton curve moves away from the vertical coordinate while the yield displacement remains relatively constant, which indicates that the ductility of the specimen is improving. As can be seen from Figure 1f, when the longitudinal reinforcement ratio increases, the skeleton curve exhibits an increasing distance from the horizontal coordinate, indicating a gradual improvement of the bearing capacity P as well as the seismic capacity. At the same time, when the longitudinal reinforcement rate increases, the ultimate displacement and yield displacement on the skeleton curve exhibit an increasing distance from the longitudinal coordinate, and when the longitudinal reinforcement rate is around 1.59%, the displacement ductility coefficient μ of the specimen is the largest, indicating that the ductility of the specimen is the best at this time. From Figure 1g, it can be seen that when the recycled aggregate concrete strength grade increases, the skeleton curve moves away from the horizontal coordinate, which indicates that the bearing capacity P of the specimen is increasing and the seismic resistance of the structure is also enhancing. Meanwhile, when the recycled aggregate concrete strength grade increases, the ultimate displacement on the skeleton curve moves away from the vertical coordinate while the yield displacement is basically unchanged, indicating a progressive enhancement in the specimen’s ductility.
From the aforementioned analysis, it is initially concluded that as the recycled coarse aggregate replacement ratio rises, the structure’s seismic and ductility performance are negatively correlated and both decline, with the replacement rate of 0–30% providing the structure’s best overall seismic performance. Likewise, the total seismic resistance of the structure is at its highest when the concrete strength grade is between C40 and C50 since the seismic and ductility performance of the structure are positively associated and both of them continue to improve as the concrete strength grade improves. As the hoop reinforcement rate rises, the structure’s seismic performance is first strengthened and then decreased, so the structure’s seismic resistance is greatest when the hoop reinforcement rate is close to 1.36%. Similarly, when the longitudinal reinforcement rate keeps increasing, the ductility performance of the structure first increases and then decreases, so when the longitudinal reinforcement rate is around 1.59%, it has the strongest seismic capacity.

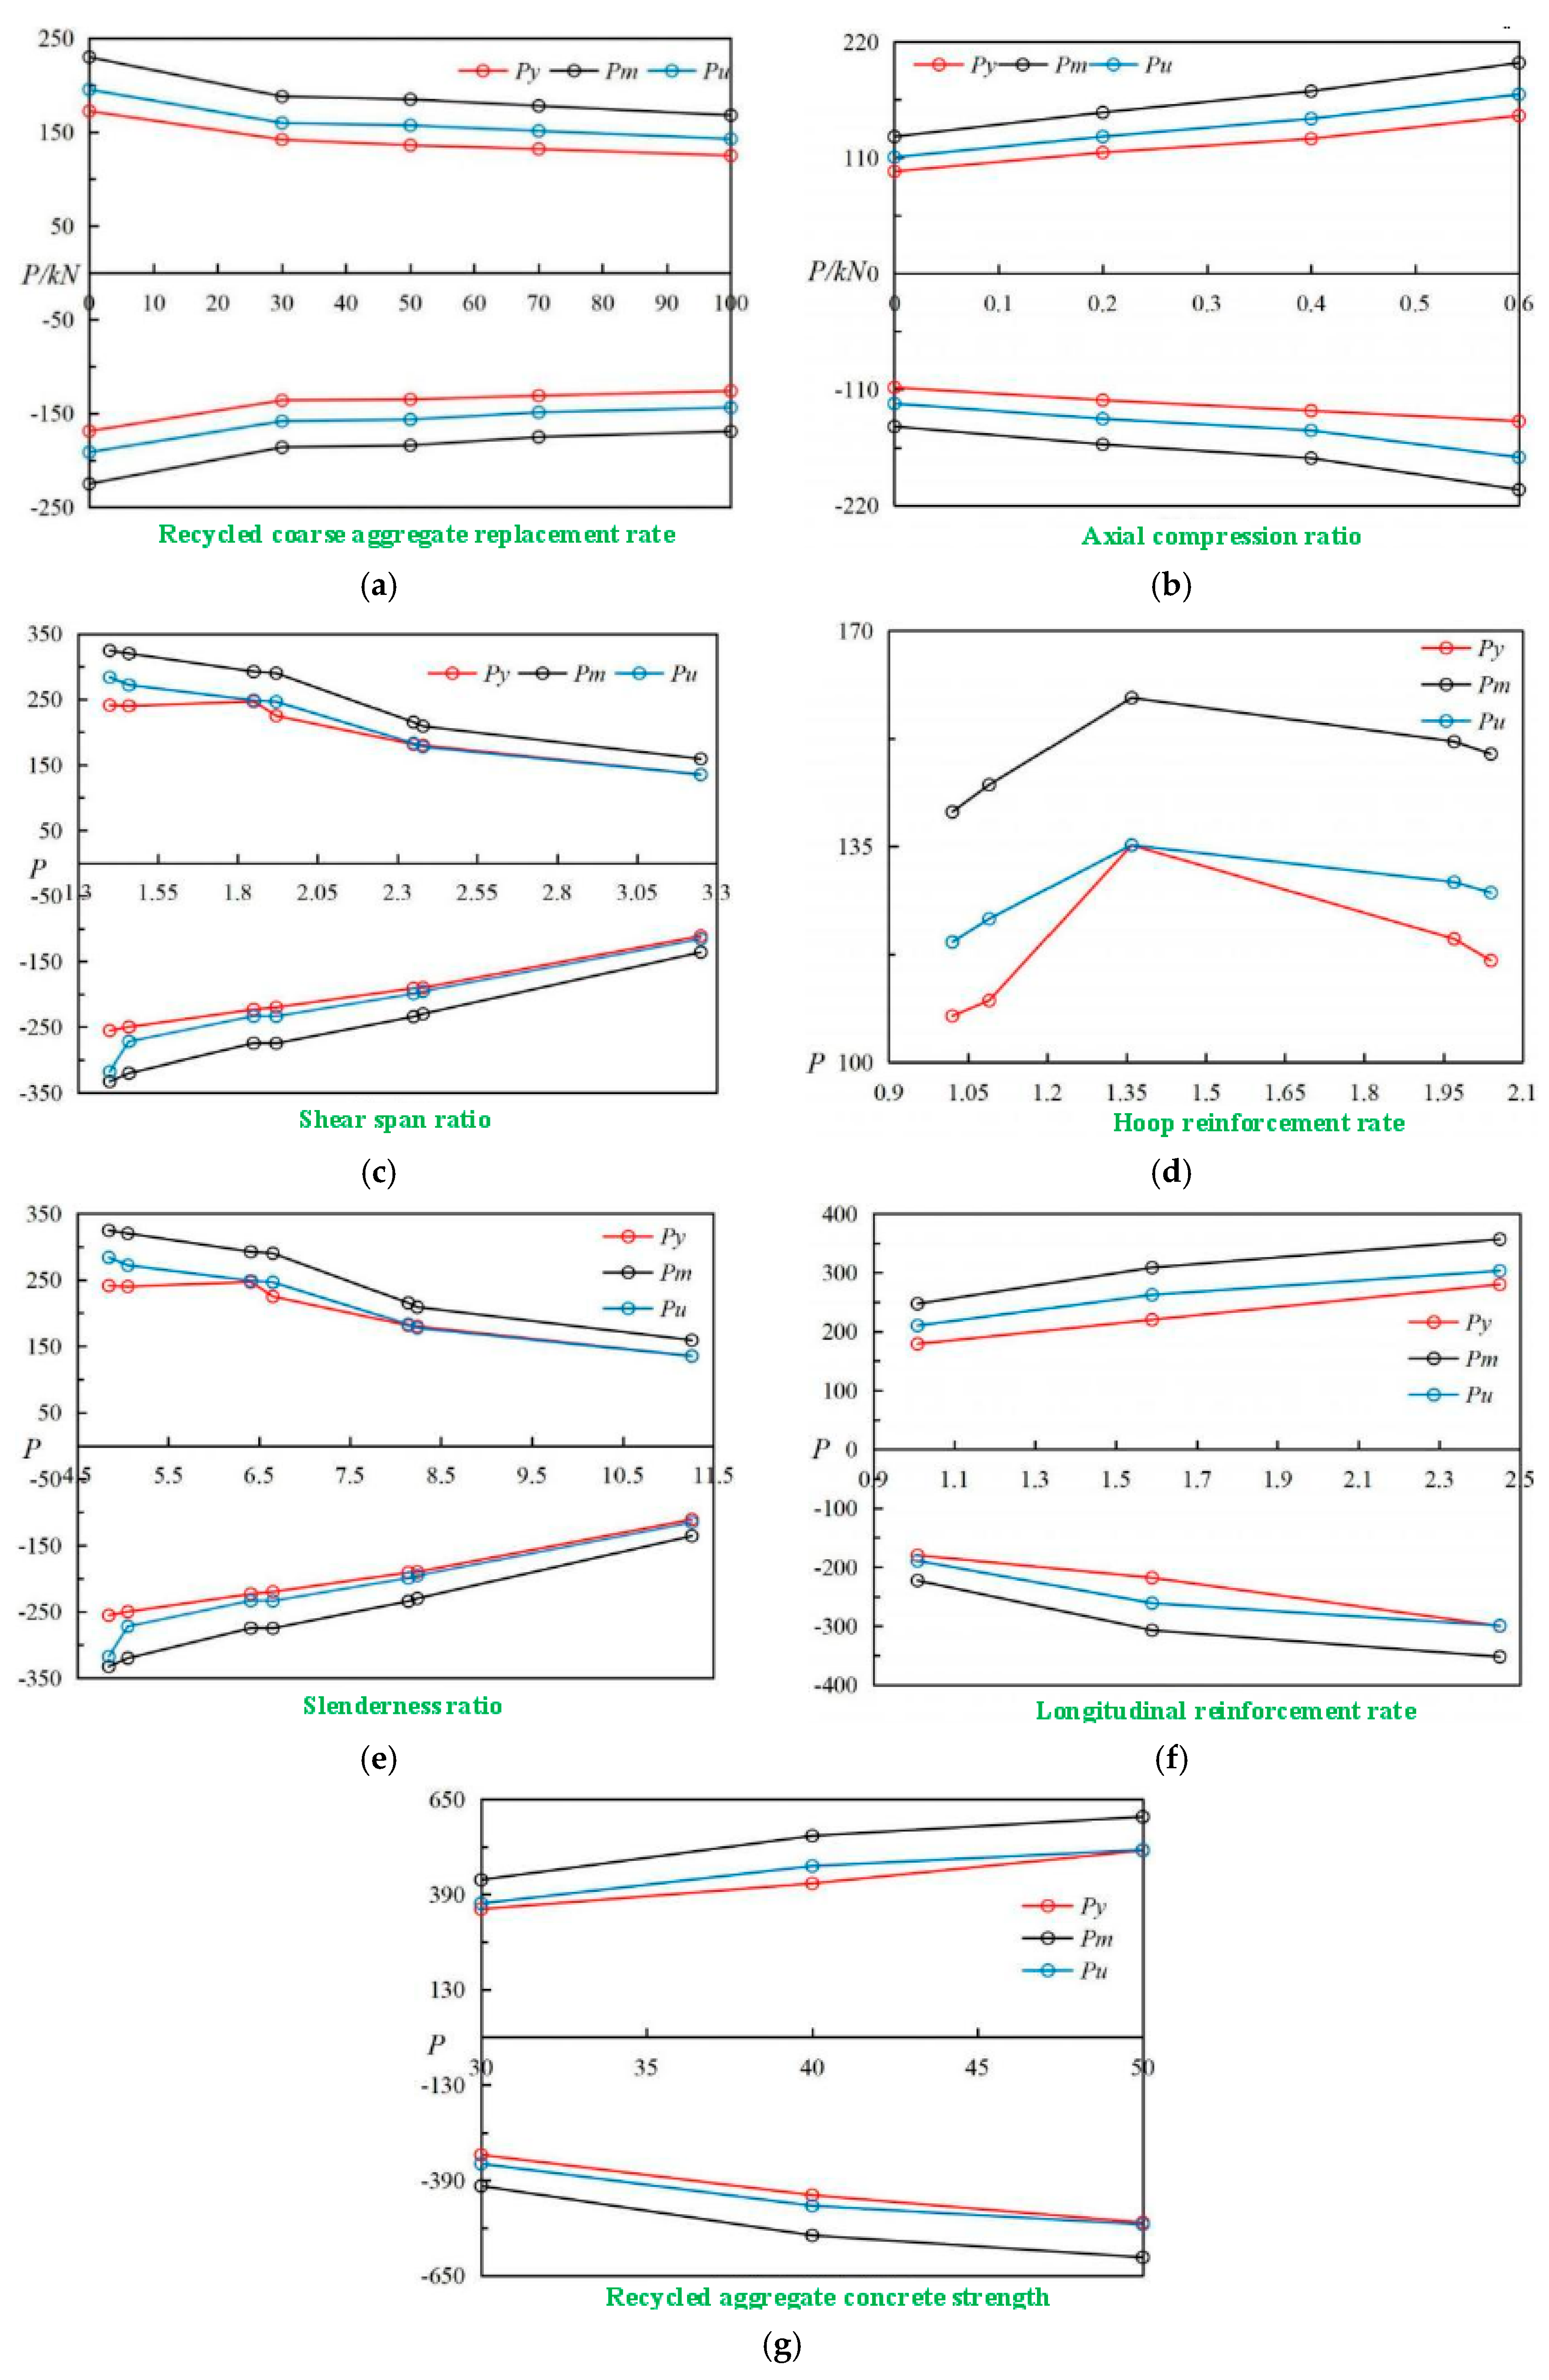
3.2. Load-Bearing Capacity Analysis

Figure 2 shows the load-bearing capacity curve’s law of recycled aggregate concrete columns under a single variable. It can be seen that the bearing capacity law under forward and reverse loading exhibits variable sensitivity to distinct parameters, but it is still within the controllable range. From Figure 2a, it can be seen that the bearing capacity gradually decreases with the increase in the recycled coarse aggregate replacement rate, indicating that the recycled coarse aggregate replacement rate is unfavorable to the improvement of the seismic capacity of the structure. The bearing capacity–recycled coarse aggregate replacement rate curve shows an overall negative correlation, and a faster decline in bearing capacity occurs between 0–30% and 50–100% of the recycled coarse aggregate replacement rate, while the decline rate slows down within the 30–50% range of recycled coarse aggregate replacement rate. It indicates that the structural seismic capacity decreases faster when the recycled coarse aggregate replacement rate is between 0–30% and 50–100%, while it slows down when the recycled coarse aggregate replacement rate is between 30 and 50%. When the recycled coarse aggregate replacement rate is 0–30%, Py, Pm, and Pu decrease by 18.9%, 18.3%, and 18.3%, respectively; when the recycled coarse aggregate replacement rate is 30–50%, Py, Pm, and Pu decrease by 4.2%, 1.6%, and 1.6%, respectively; when the recycled coarse aggregate replacement rate is 50–70%, Py, Pm, and Pu decrease by 2.9%; and when the replacement rate of recycled coarse aggregate is 70–100%, Py, Pm, and Pu decrease by 5.3%, 5.6%, and 5.6%, respectively. From the data above, it can be inferred that an increase in ductility and energy dissipation occurs when the replacement rate of recycled coarse aggregate is 0–30% and 30–50%, but this increase is accompanied by a decrease in stiffness and brittleness; while the stiffness and brittleness of the structure are stronger, but the ductility and energy-consuming ability are worse when the replacement rate is 50–70% and 70–100%. From Figure 2b, it can be seen that the bearing capacity gradually improves with the increase in the axial compression ratio, which indicates that the axial compression ratio is beneficial to the seismic capacity of the structure. The bearing capacity–axial compression ratio curve shows a positive correlation as a whole, and a slower improvement in bearing capacity occurs between 0 and 0.4 of the axial compression ratio, while the improvement rate accelerates within the 0.4 to 0.6 range of the axial compression ratio. It indicates that the seismic capacity of the structure increases slowly when the axial compression ratio is between 0 and 0.4, while it speeds up when the axial compression ratio is between 0.4 and 0.6. When the axial compression ratio is 0–0.2, Py, Pm, and Pu increase by 18.6%, 17.7%, and 17.7%, respectively; when the axial compression ratio is 0.2–0.4, Py, Pm, and Pu increase by 11.3%, 13.1%, and 13.1%, respectively; and when the axial compression ratio is 0.4–0.6, Py, Pm, and Pu increase by 17.2%, 15.6%, and 15.6%, respectively. It can be inferred that an increase in stiffness and brittleness occurs at the axial compression ratios of 0–0.2 and 0.4–0.6, but this increase is accompanied by a decrease in ductility and energy dissipation; while at the axial compression ratios of 0.2–0.4, the ductility and energy dissipation of the structure are higher, but the stiffness and brittleness are lower. From Figure 2c, it can be seen that as the shear span ratio increases, the bearing capacity decreases, indicating that the shear span ratio is unfavorable to the improvement of the seismic capacity of the structure. The load-carrying capacity–shear span ratio curve is negatively correlated overall, and a faster decline in bearing capacity occurs between 1.92 and 2.38 of the shear span ratio, while the decline rate slows down within the 1.4–1.92 and 2.38–3.25 ranges of shear span ratio. It means that when the shear span ratio is 1.92–2.38, the structural seismic capacity decreases faster, while it slows down when the shear span ratio is 1.4–1.92 and 2.38–3.25. When the shear span ratio is 1.4–1.92, Py, Pm, and Pu decrease by 6.7%, 10.6%, and 13.1%, respectively; when the shear span ratio is 1.92–2.38, Py, Pm, and Pu decrease by 20%, 27.9%, and 27.9%, respectively; when the shear span ratio is 2.38–3.25, Py, Pm, and Pu decrease by 24.9%, 23.9%, and 23.9%, respectively. It can be inferred that an improvement in stiffness and brittleness occurs when the shear span ratio is 1.4 to 1.92 and 1.92 to 2.38, but this increase is accompanied by a decline in ductility and energy dissipation; while the ductility and energy consumption of the structure are higher when the shear span ratio is 2.38 to 3.25, but the stiffness and brittleness are worse. In addition, it can be seen from the curves that when the shear span ratio is 1.4–1.46 under reverse loading and when it is 1.85–1.92 under forward loading, the bearing capacity changes abruptly, which may be caused by experimental error. When the shear span ratio is 2.38–3.25, the Py and Pu curves are close to overlapping, indicating that the brittleness of the structure is more obvious while the ductility is affected. As can be seen from Figure 2d, the bearing capacity improves initially and then diminishes as the hoop reinforcement rate increases, indicating that the seismic capacity of the structure is enhanced first and then decreases. When the hoop reinforcement rate is 1.02–1.36%, the bearing capacity–hoop reinforcement rate curve is positively correlated; while the bearing capacity–hoop reinforcement rate curve is negatively correlated when it is 1.36–2.04%. This indicates that the best seismic performance of the structure occurs at the hoop reinforcement rate of 1.36%. When the hoop reinforcement rate is 1.02–1.36%, Py, Pm, and Pu increase by 25.8%, 13.2%, and 13.2%, respectively; when the hoop reinforcement rate is 1.36–2.04%, Py, Pm, and Pu decrease by 13.8%, 5.7%, and 5.7%, respectively. It can be inferred that growth in stiffness and brittleness occurs at the hoop reinforcement rate of 1.02% to 1.36%, but this increase is accompanied by a reduction in ductility and energy dissipation, while at the hoop reinforcement rate of 1.36% to 2.04%, the structure is more ductile and energy-consuming, but less rigid and brittle. In addition, it can be seen from the curves that when the hoop reinforcement rate is 1.36%, the Py and Pu curves are close to overlapping, indicating that the brittleness of the structure is the strongest at this time while the ductility is affected. From Figure 2e, it can be seen that as the slenderness ratio increases, the bearing capacity decreases, indicating that the slenderness ratio is unfavorable to the improvement of the seismic capacity of the structure. The bearing capacity–slenderness ratio curve is negatively correlated overall, and a faster decline in bearing capacity occurs between 6.65 and 8.24 of the slenderness ratio, while the decline rate slows down within the 4.85–6.65 and 8.24–11.26 ranges of slenderness ratio. This means that when the slenderness ratio is 6.65–8.24, the seismic capacity of the structure weakens faster, and it slows down when the slenderness ratio is 4.85–6.65 and 8.24–11.26. When the slenderness ratio is 4.85–6.65, Py, Pm, and Pu decrease by 6.7%, 10.6%, and 13.1%, respectively; when the slenderness ratio is 6.65–8.24, Py, Pm, and Pu decrease by 20%, 27.9%, and 27.9%, respectively; and when the slenderness ratio is 8.24–11.26, Py, Pm, and Pu decrease by 24.9%, 23.9%, and 23.9%, respectively. It can be inferred that an increase in stiffness and brittleness occurs when the slenderness ratio is 4.85–6.65 and 6.65–8.24, but this increase is accompanied by a decrease in ductility and energy dissipation, while the ductility and energy consumption of the structure is higher when the slenderness ratio is 8.24–11.26. In addition, it can be seen from the curves that when the slenderness ratio is 4.85–5.06 under reverse loading and 6.41–6.65 under forward loading, the load-carrying capacity changes abruptly, which may be caused by experimental error. When the slenderness ratio is 8.24–11.26, the Py and Pu curves are close to overlapping, which indicates that the structure is more brittle but less ductile. From Figure 2f, it can be seen that as the longitudinal reinforcement rate increases, the bearing capacity is enhanced, indicating that the longitudinal reinforcement rate is beneficial to the improvement of the seismic capacity of the structure. The bearing capacity–longitudinal reinforcement rate curve is positively correlated overall, and faster growth in bearing capacity occurs between 1.01% and 1.59% of the longitudinal reinforcement rate, while the growth rate slows down within the 1.59% to 2.45% range of longitudinal reinforcement rate. This means that when the longitudinal reinforcement rate is between 1.01% and 1.59%, the structural seismic capacity grows faster, and it slows down when the longitudinal reinforcement rate is between 1.59% and 2.45%. When the longitudinal reinforcement rate is from 1.01% to 1.59%, Py, Pm, and Pu increase by 22.9%, 24.9%, and 24.9%, respectively; when the longitudinal reinforcement rate is from 1.59% to 2.45%, Py, Pm, and Pu increase by 27.3%, 15.6%, and 15.6%, respectively. It can be inferred that an increase in ductility and energy dissipation occurs at the longitudinal reinforcement rate of 1.01% to 1.59%, but this increase is accompanied by a decrease in stiffness and brittleness, while at the longitudinal reinforcement rate of 1.59% to 2.45%, the structure has more stiffness and brittleness but less ductility and energy consumption. In addition, it can be seen from the curves that when the longitudinal reinforcement rate is 1.01% and 2.45%, the Py and Pu curves are close to overlapping, indicating that the structure is more brittle but less ductile at this time. From Figure 2g, it can be seen that as the recycled aggregate concrete strength grade increases, the bearing capacity improves, indicating that the recycled aggregate concrete strength grade is beneficial to the improvement in the seismic capacity of the structure. The bearing capacity–recycled aggregate concrete strength grade curve is overall positively correlated, and faster growth in bearing capacity occurs between C30 and C40 of the recycled aggregate concrete strength grade, while the growth rate slows down within the C40 and C50 ranges of recycled aggregate concrete strength grade. This means that the structural seismic capacity grows faster when the recycled aggregate concrete strength grade is C30 and C40 and slows down when the recycled aggregate concrete strength grade is C40 and C50. Py, Pm, and Pu increase by 20%, 18.6%, and 18.6% when the recycled aggregate concrete strength grades are C30 and C40, respectively; and Py, Pm, and Pu increase by 21.4%, 9.5%, and 9.5% when the recycled aggregate concrete strength grades are C40 and C50, respectively. It can be inferred that an enhancement in stiffness and brittleness occurs at recycled aggregate concrete strength grades C30-C40 and C40-C50, but this increase is accompanied by a weakening in ductility and energy dissipation. In addition, it can be seen from the curves that the Py and Pu curves are close to overlapping when the recycled aggregate concrete strength grades are C30 and C50, indicating that the structure is more brittle but less ductile at this time.
The study above makes it clear that when various parameters are changed, the sensitivity to structural bearing capacity and seismic performance differs. The average growth rate of structural bearing capacity is 21.85%, which has the highest sensitivity when the longitudinal reinforcement rate increases. Additionally, when longitudinal reinforcement rates rise, the average growth rate of structural carrying capacity falls from 24.2% to 19.5%, indicating a gradual loss of sensitivity. The average reduction rate of structural carrying capacity is 19.9%, and the sensitivity is rather high when the slenderness ratio and shear span ratio rise. Additionally, the average loss in structural carrying capacity with an increase in the slenderness ratio and shear span ratio first rises from 10.1% to 25.3% and then falls to 24.2%, demonstrating that the sensitivity initially improves and then drops. When the concrete strength grade increases, the average growth rate of structural bearing capacity is 16.3%, and the sensitivity is relatively high. With the increasing concrete strength grade, the average growth rate of structural bearing capacity decreases from 19.1% to 13.5%, which indicates that the sensitivity gradually declines. When the axial compression ratio improves, the average enhancement rate of structural bearing capacity is 15.5%, which is less sensitive. With the increase in axial compression ratio, the average growth rate of structural bearing capacity decreases from 18% to 12.5% and then increases to 16.1%, meaning that the sensitivity diminishes first and then increases. The average change rate of structural bearing capacity is 12.9% when the hoop reinforcement rate rises and sensitivity decreases. Furthermore, as the hoop rate rises, the structural bearing capacity’s average growth rate shifts from 17.4% to an average reduction rate of 8.4%, suggesting that the sensitivity steadily declines. When the recycled coarse aggregate replacement rate increases, the average improvement rate of structural bearing capacity is 7.35%, and the sensitivity is the lowest. In addition, as the replacement rate rises, the average growth rate of structural bearing capacity first falls from 18.5% to 2.5% before gradually rising to 2.9% and 5.5%, indicating an initial decrease and then an increase in sensitivity.

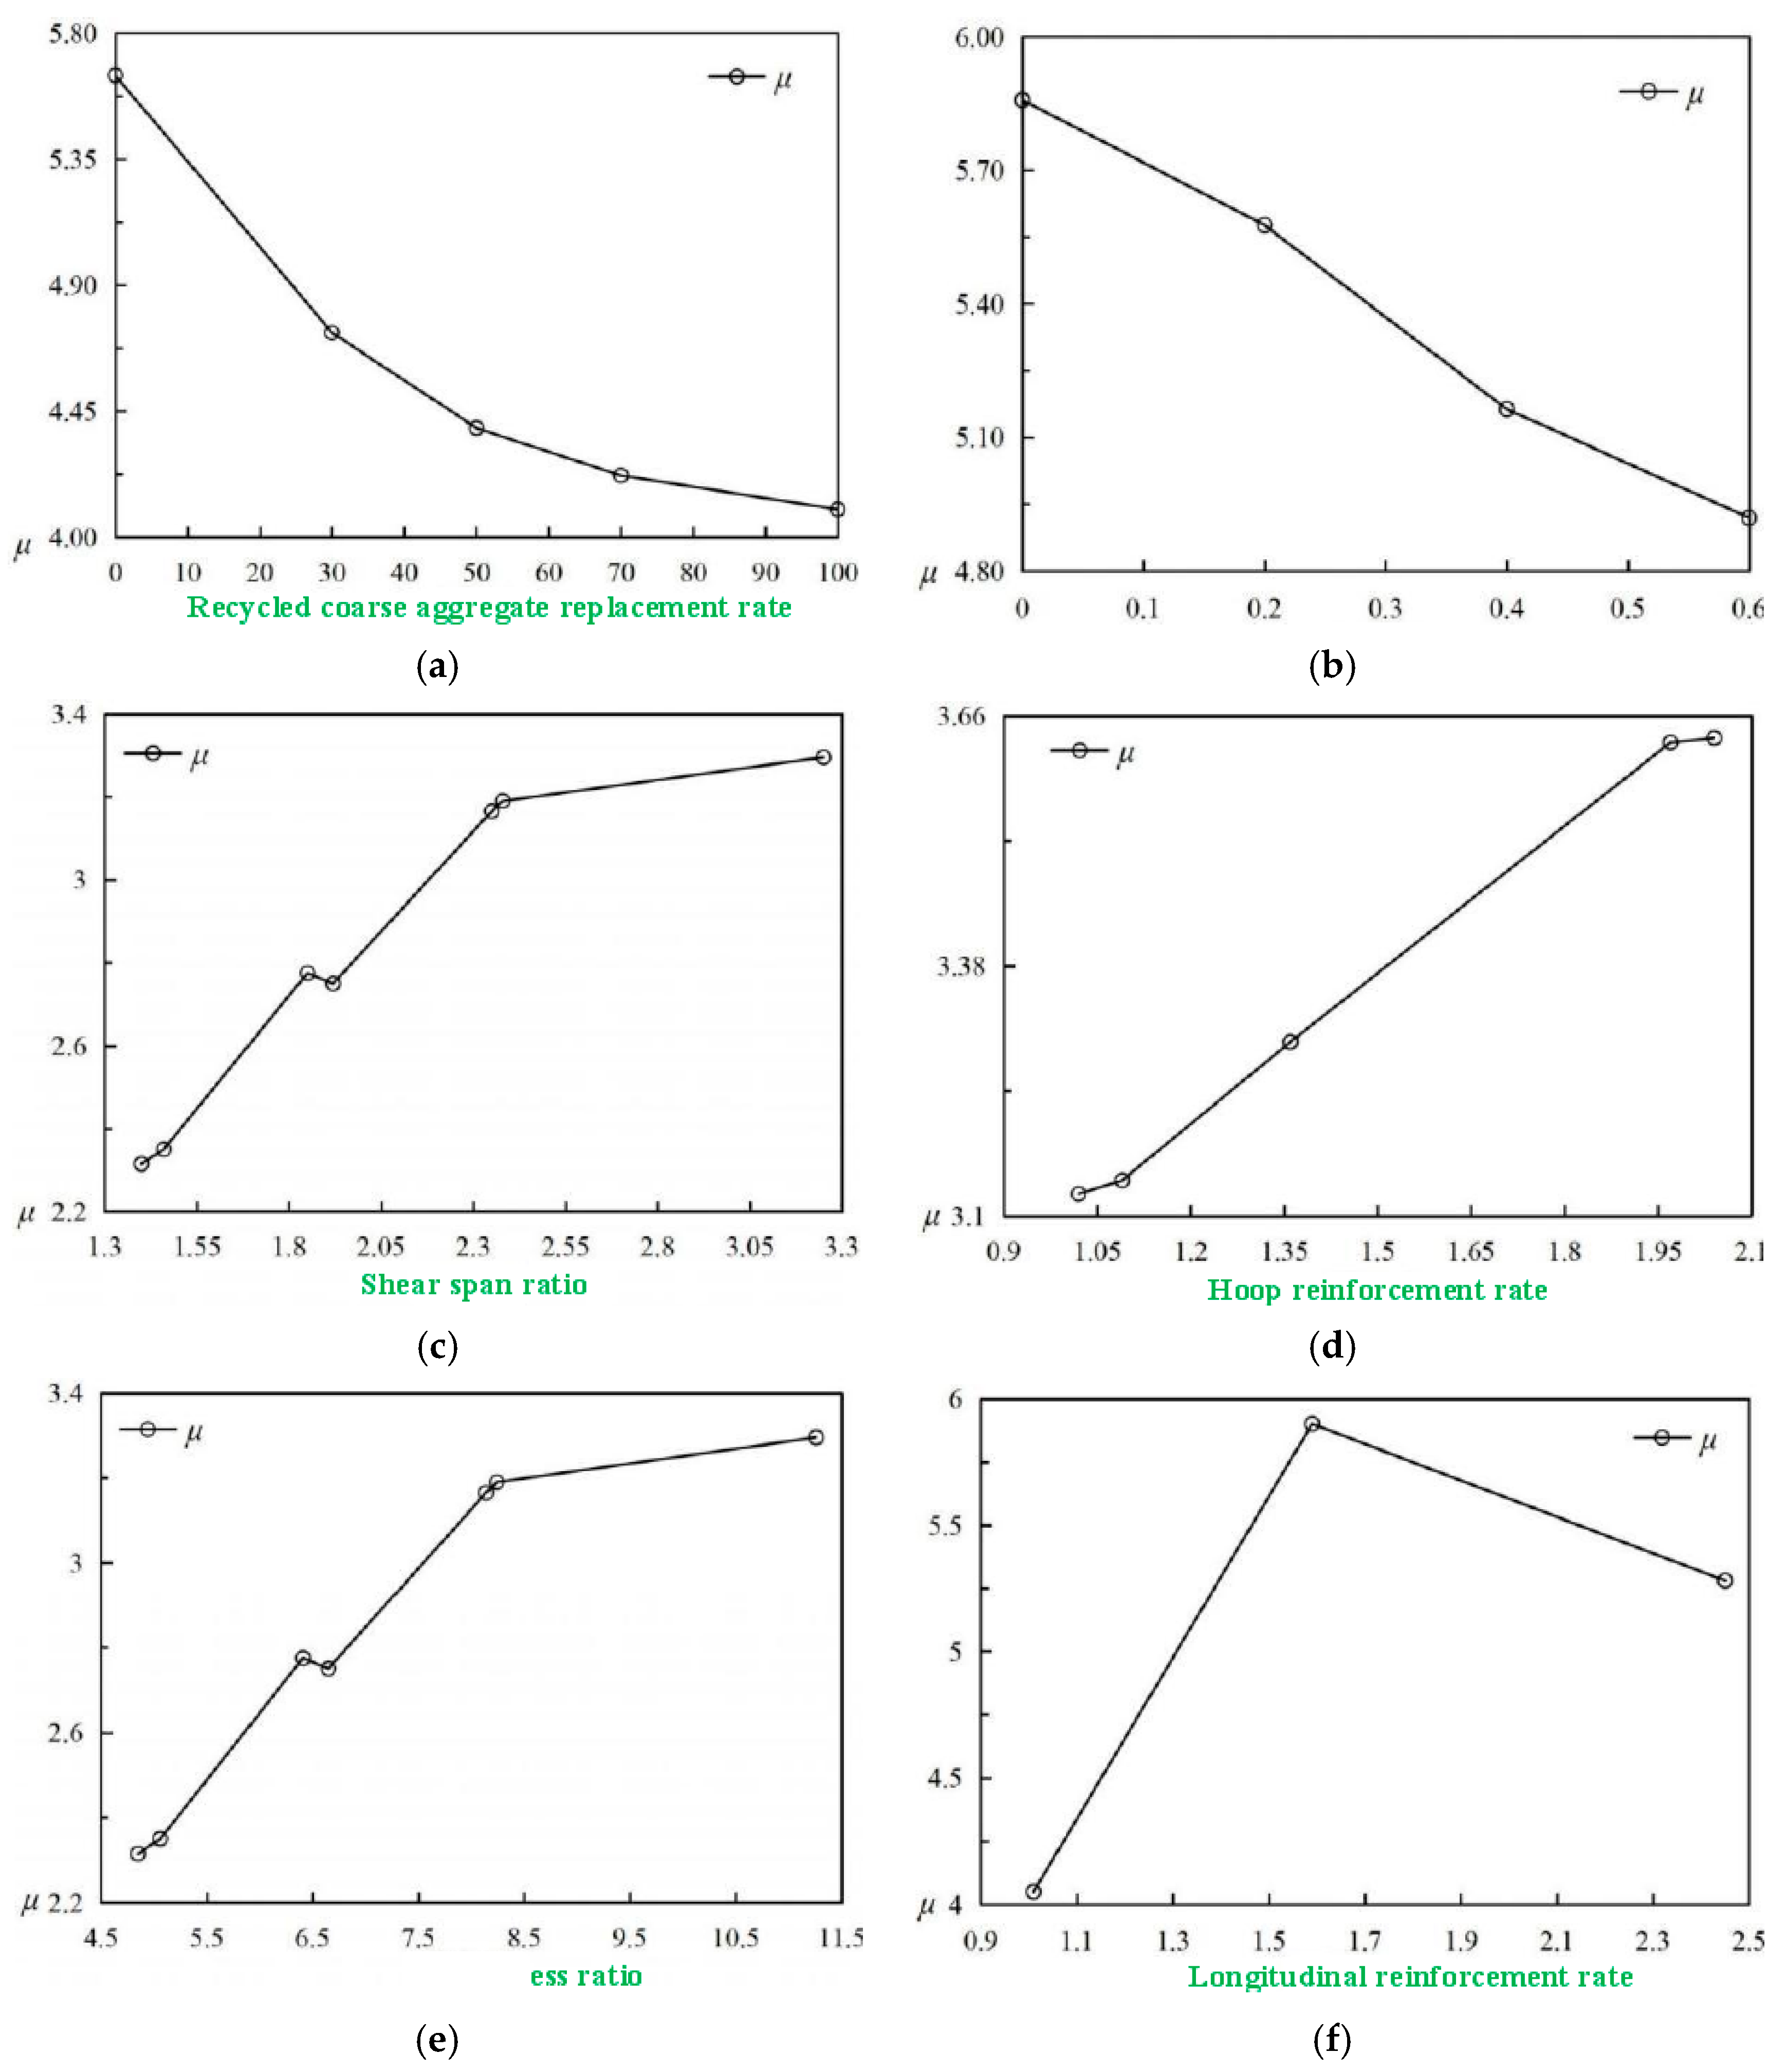
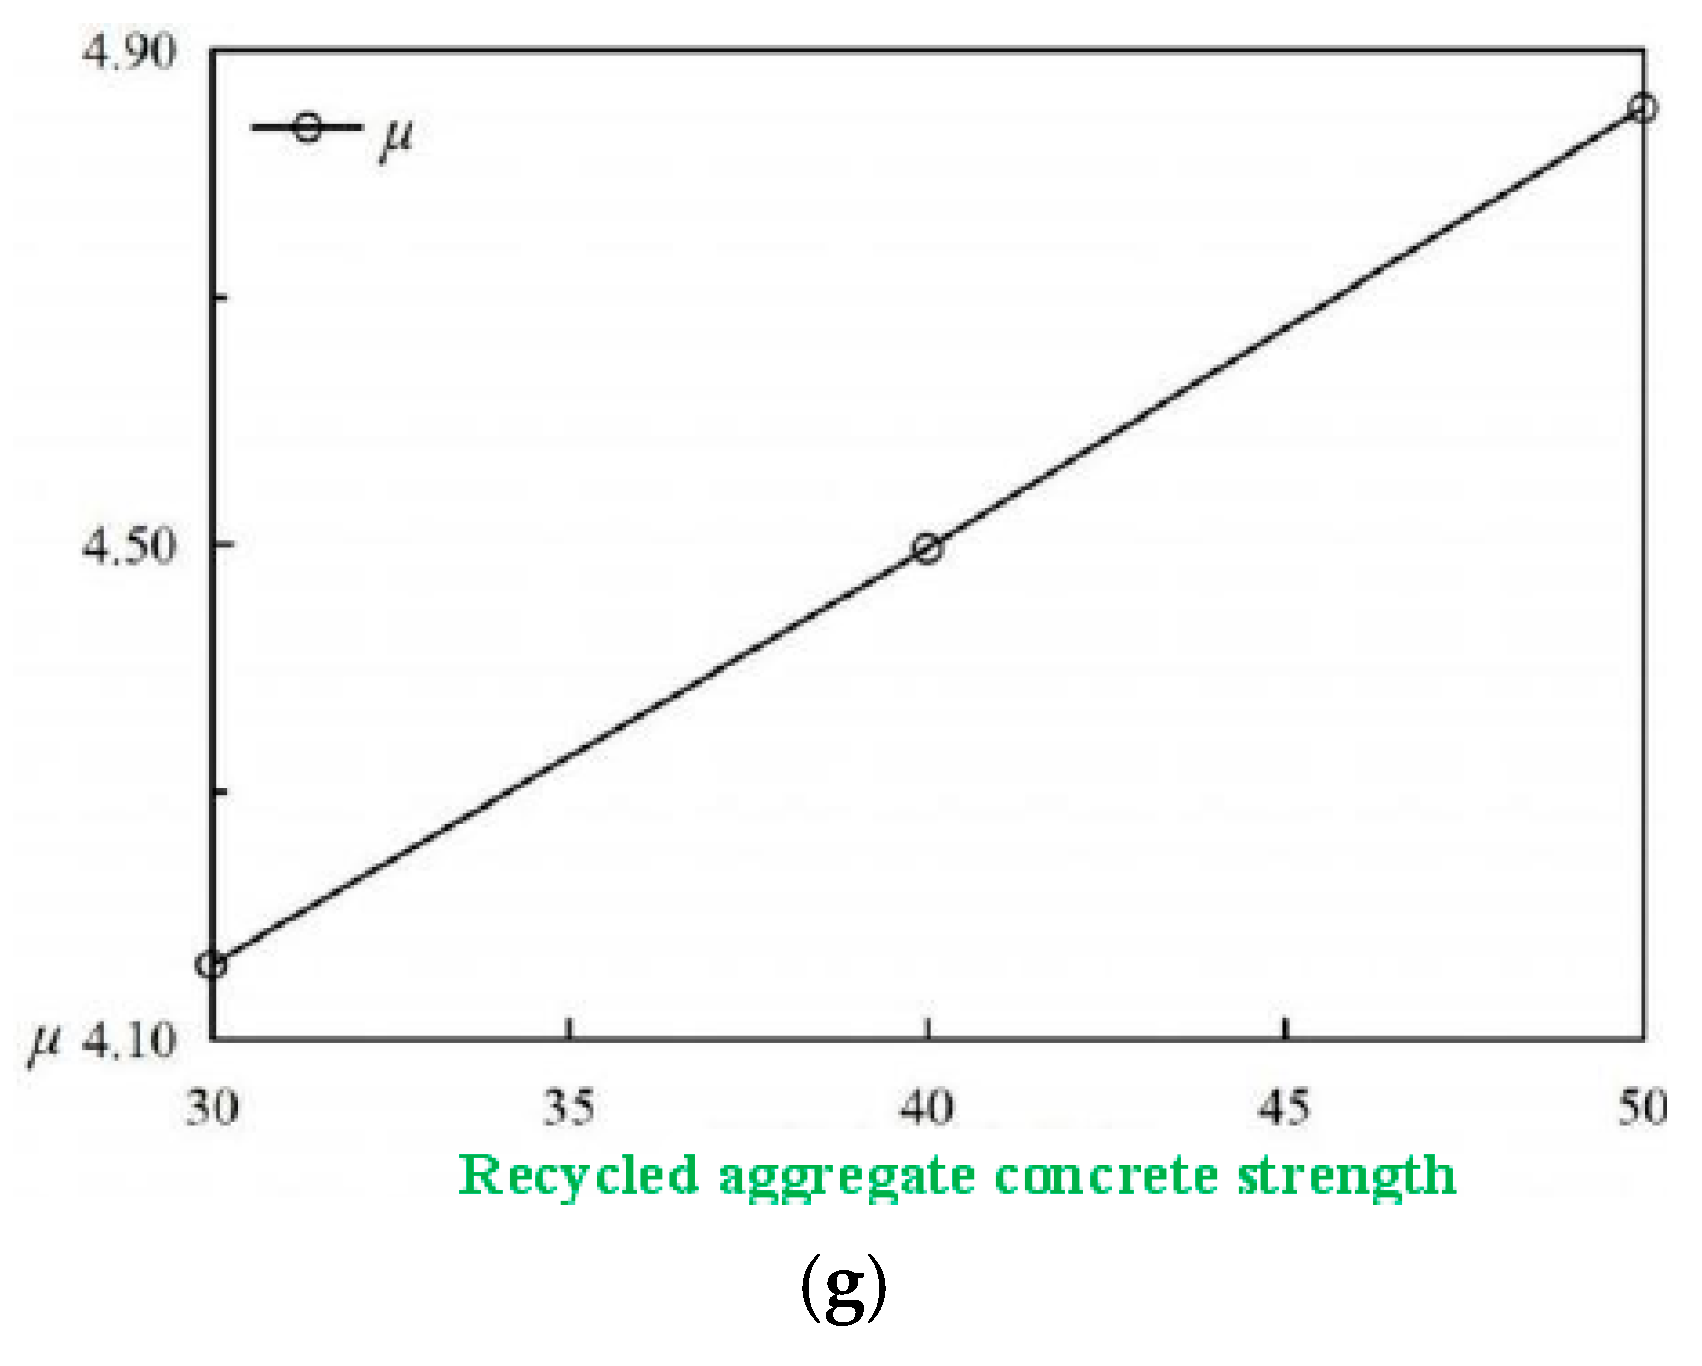
3.3. Ductility Performance Analysis

Figure 3 illustrates the ductility performance curve pattern of recycled aggregate concrete columns under a single variable. It is evident from the figure that each parameter significantly affects the ductility performance of the recycled aggregate concrete column. As depicted in Figure 3a, the displacement ductility coefficient μ gradually decreases with an increase in the replacement rate, indicating a gradual decrease in the ductility of the components. The μ-recycled coarse aggregate replacement rate curve is negatively correlated overall, and μ decreases by 16.3%, 7.2%, 3.9%, and 2.8% when the recycled coarse aggregate replacement rate is 0–30%, 30–50%, 50–70%, and 70–100%, respectively. The reduction range gradually decreases, indicating a slowing rate of structural ductility reduction. Considering the effect of replacement rate on bearing capacity and μ, when the replacement rate of recycled coarse aggregate is 0–30%, the seismic capacity of the structure is stronger, and at the same time, its ductility reduction rate is smaller, moreover, its ductility and energy dissipation capacity is stronger, so it is recommended to use the components with the replacement rate of the recycled coarse aggregate of 0–30%. As depicted in Figure 3b, the displacement ductility coefficient μ gradually decreases with an increase in the axial compression ratio, indicating a gradual decrease in the ductility of the components. The μ–axial compression ratio curve is negatively correlated on the whole, and μ decreases by 4.8%, 7.5%, and 4.7% when the axial compression ratio is 0–0.2, 0.2–0.4, and 0.4–0.6, respectively. The reduction range increases initially and then decreases, indicating an enhancement of structural ductility first and then a gradual reduction. Considering the effect of axial compression ratio on bearing capacity and μ, when the axial compression ratio is 0.2–0.4, the seismic capacity of the structure is stronger, and at the same time, its ductility and energy dissipation capacity is better, but the stiffness and brittleness are worse; therefore, the sudden rupture of the structure will not occur, so it is recommended to use the components with the axial compression ratio of 0.2–0.4. As depicted in Figure 3c, the displacement ductility coefficient μ gradually increases with an enhancement in the shear span ratio, indicating a gradual increase in the ductility of the components. The μ–shear span rate curve as a whole is positively correlated, and μ increases by 19.9%, 15.0%, and 3.3% when the shear span ratio is 1.4–1.85, 1.85–2.38, and 2.38–3.25, respectively. The growing range gradually decreases, indicating a slowing rate of structural ductility growth. In addition, when the shear span ratio is 1.85–1.92, the curve changes abruptly, which may be due to construction-induced error. Considering the effect of the shear span ratio on bearing capacity and μ, when the shear span ratio is 1.92–2.38, the seismic capacity of the structure is stronger; meanwhile, its ductility coefficient is larger, and thus, its ductile performance is better, and the energy dissipation capacity is stronger, while it exhibits poor brittleness, so the sudden rupture of the structure will not occur, thereby the components with shear span ratios of 1.92–2.38 are recommended. From Figure 3d, it can be seen that the displacement ductility coefficient μ gradually increases with an enhancement in the hoop reinforcement rate, indicating a gradual increase in the ductility of the components. The μ–hoop reinforcement rate curve as a whole is positively correlated. When the hoop reinforcement rate is 1.02–1.36%, μ increases by 5.4%, and when the hoop reinforcement rate is 1.36–2.04%, μ increases by 10.3%, and the growing range gradually increases, indicating a growth rate of structural ductility enhancement. Considering the influence of the hoop reinforcement rate on the bearing capacity and μ, when the hoop reinforcement rate is about 1.36%, the structure has the best seismic capacity and better energy dissipation performance, and its ductility coefficient is larger; hence its ductility performance is better. Moreover, it exhibits poor brittleness, and the sudden rupture of the structure will not occur, so it is recommended to use the components with a hoop reinforcement rate of 1.36%. As can be seen from Figure 3e, the displacement ductility coefficient μ gradually increases with an enhancement in the slenderness ratio, indicating a gradual increase in the ductility of the components. The μ–slenderness rate curve as a whole is positively correlated. When the slenderness ratio is 4.85 to 6.41, 6.41 to 8.24, and 8.24 to 11.26, μ increases by 19.9%, 15.0%, and 3.3%, respectively, and the extent of growth gradually decreases, indicating a slowing rate of structural ductility growth. In addition, the curve changes abruptly when the slenderness ratio is 6.41–6.65, which may be due to construction-induced error, and the ductility does not change. Considering the influence of the slenderness ratio on the bearing capacity and μ, when the slenderness ratio is 6.65–8.24, the seismic capacity of the structure is stronger, and its ductility coefficient is larger, namely better ductile performance, in addition, the energy dissipation capacity is stronger, while it exhibits poor brittleness, and the sudden rupture of the structure will not occur, so the components with the slenderness ratio of 6.65–8.24 are recommended. As depicted in Figure 3f, the displacement ductility coefficient μ improves initially and then diminishes with an enhancement in the longitudinal reinforcement rate, indicating an increase first and then a decrease in the ductility of the components. When the longitudinal reinforcement rate is 1.01% to 1.59%, μ increases by 45.7%; when the longitudinal reinforcement rate is 1.59% to 2.45%, μ decreases by 10.5%, indicating that the ductility performance of the structure is the best when the longitudinal reinforcement rate is 1.59%. Considering the influence of the longitudinal reinforcement rate on the bearing capacity and μ, when the longitudinal reinforcement rate is 1.59%, the seismic capacity of the structure and energy dissipation performance is better; meanwhile, its ductility coefficient is the largest; thus, its ductility performance is the best, but it exhibits poor brittleness, and the sudden rupture of the structure will not occur, so the component with the longitudinal reinforcement rate of 1.59% is recommended. As depicted in Figure 3g, the displacement ductility coefficient μ gradually increases with an enhancement in the recycled aggregate concrete strength grade, indicating a gradual increase in the ductility of the components. The μ–recycled aggregate concrete strength grade curve is overall positively correlated, and μ increases by 8.2% when the recycled aggregate concrete strength grade is C30 and C40, and by 7.8% when the recycled aggregate concrete strength grade is C40 and C50, indicating that the ductility of the structure increases roughly the same when the recycled aggregate concrete strength grades are C30 and C40 and C40 and C50. Considering the effect of recycled aggregate concrete strength grade on bearing capacity and μ, when the recycled aggregate concrete strength grade is C40 and C50, the structure has better seismic capacity and energy dissipation performance. In the meantime, its ductility coefficient is the largest, so its ductility performance is the best, but it exhibits poor brittleness, and the sudden rupture of the structure will not occur; accordingly, the recycled aggregate concrete strength grades of C40 and C50 are recommended for the components. In this study, the seismic design limitations and boundary conditions are γ ∈ [0, 100%], n0 ∈ [0, 0.9], λ0 ∈ [5.06, 18.479], λ ∈ [1.09, 3.93], ρsl ∈ [1.01%, 2.45%], ρsv ∈ [1.4%, 5.33%], and f ∈ [C30, C50].

4. Conclusions

Based on the skeleton curves, ductility, brittleness, stiffness, and energy dissipation capacity analysis, the influence mechanisms on the seismic performance of 53 rectangular recycled aggregate concrete columns were generalized and summarized. These influence factors include recycled coarse aggregate replacement rate, axial compression ratio, shear span ratio, hoop reinforcement rate, slenderness ratio, longitudinal reinforcement rate, and recycled aggregate concrete strength grade. Seven limitations and boundary conditions were given, and the conclusions are as follows.
(1)
For the seismic design of rectangular recycled aggregate concrete columns, it is recommended to adopt a replacement rate of recycled coarse aggregate ranging from 0% to 30%, a slenderness ratio between 6.65 and 8.24, an axial compression ratio ranging from 0.2 to 0.4, a shear span ratio between 1.92 and 2.38, and a recycled aggregate concrete strength of either C40 or C50 to ensure satisfactory bearing capacity and ductility performance.
(2)
As the longitudinal reinforcement rate increases, the bearing capacity of the specimen also increases, while the ductility performance exhibits an initial improvement followed by a subsequent reduction. The optimal longitudinal reinforcement rate for the seismic design of rectangular recycled aggregate concrete columns is recommended to be around 1.59%.
(3)
As the hoop reinforcement rate enhances, the ductility performance of the specimen also improves, while the bearing capacity exhibits an initial increase followed by a subsequent decrease. The best hoop reinforcement rate for the seismic design of rectangular recycled aggregate concrete columns is recommended to be approximately 1.36%.
(4)
The sensitivity of different parameters to the seismic performance of the structure varies. The sensitivity of longitudinal reinforcement rate, slenderness ratio, shear span ratio, concrete strength grade, and axial compression ratio is stronger, while the sensitivity of hoop reinforcement rate and recycled coarse aggregate replacement rate is poor. To attain the best performance of the structure, engineers must take economic rationality into account and alter the fewest factors. Therefore, it is recommended to change the longitudinal reinforcement rate, slenderness ratio, shear span ratio, concrete strength grade, and axial compression ratio of the specimen to improve the seismic performance of the structure.
(5)
In this study, the seismic design limitations and boundary conditions are γ ∈ [0, 100%], n0 ∈ [0, 0.9], λ0 ∈ [5.06, 18.479], λ ∈ [1.09, 3.93], ρsl ∈ [1.01%, 2.45%], ρsv ∈ [1.4%, 5.33%], and f ∈ [C30, C50].
(6)
This study reviewed and collected a large amount of data from the literature, and the conclusions are very effective, but there are still certain aspects to be improved. For instance, when the hoop reinforcement rate is around 1.36% and the longitudinal reinforcement rate is about 1.59%, the data and the seismic performance of the structure need to be supplemented and further studied. In addition, the scope of the parameters needs to be widened to make the conclusions more general. The aforementioned will be added and improved in future research.

Author Contributions

H.M.: data curation, formal analysis, investigation, methodology, project administration and writing—review & editing; S.P., N.D., L.H. and C.W.: data curation, formal analysis, investigation, methodology, project administration and writing—review & editing; C.X., Y.Z., J.S., S.L. and Y.H.: data curation, formal analysis, funding acquisition, investigation and methodology. All authors have read and agreed to the published version of the manuscript.

Funding

This research is funded by ‘Natural Science Foundation of Hubei Province of China (CN)’—‘China’ (Grant No. 2022CFB662), ‘Supported by the Systematic Project of Guangxi Key Laboratory of Disaster Prevention and Engineering Safety of China (CN)’—‘China’ (Grant No. 2022ZDK024), ‘Hubei Construction Science and Technology Plan Project of China (CN)’—‘China’ (Grant No. 202144), ‘Hubei Provincial Excellent Young and Middle aged Science and Technology Innovation Team Project of Colleges and Universities of China (CN)’—‘China’ (Grant No. T2022002), ‘Wuhan University of Science and Technology College Student Innovation and Entrepreneurship Training Program Project of China (CN)’—‘China’ (Grant No. 2022SA11X), ‘Key Laboratory of Impact and Safety Engineering (Ningbo University), Ministry of Education of China (CN)’—‘China’ (Grant No. CJ202306), and their support is gratefully acknowledged.

Informed Consent Statement

The authors declare that they have no known competing financial interests or personal relationships that could have appeared to influence the work reported in this paper.

Data Availability Statement

Some or all data, models, or code that support the findings of this study are available from the corresponding author upon reasonable request.

Conflicts of Interest

The authors declare no conflict of interest.

References

  1. Xiao, J.; Wang, C.; Ding, T.; Akbarnezhad, A. A recycled aggregate concrete high-rise building: Structural performance and embodied carbon footprint. J. Clean. Prod. 2018, 199, 868–881. [Google Scholar] [CrossRef]
  2. Xiao, J.Z.; Xia, B.; Xiao, X.W. Theoretical framework for sustainability design of engineering structures. China Civ. Eng. J. 2020, 53, 1–12. [Google Scholar]
  3. Ding, T.; Xiao, J.Z.; Tam, V.W. A closed-loop life cycle assessment of recycled aggregate concrete utilization in China. Waste Manag. 2016, 56, 367–375. [Google Scholar] [CrossRef] [PubMed]
  4. Cao, W.L.; Zhao, Y.X.; Ye, T.P. A review of recent advances in the long-term working characteristic of recycled concrete structure. J. Harbin Inst. Technol. 2019, 51, 1–17. [Google Scholar]
  5. Dong, H.; Song, Y.; Cao, W.; Sun, W.; Zhang, J. Flexural bond behavior of reinforced recycled aggregate concrete. Constr. Build. Mater. 2019, 213, 514–527. [Google Scholar] [CrossRef]
  6. Ollivier, J.R.; Maso, J.C.; Bourdette, B. Interfacial transition zone in concrete. Adv. Cem. Based Mater. 1995, 2, 30–38. [Google Scholar] [CrossRef]
  7. Liu, C.; Fan, J.; Bai, G.; Quan, Z.; Fu, G.; Zhu, C.; Fan, Z. Cyclic load tests and seismic performance of recycled aggregate concrete (RAC) columns. Constr. Build. Mater. 2019, 195, 682–694. [Google Scholar] [CrossRef]
  8. Gaurav, G.; Singh, B. Experimental investigation for splice strength of deformed steel bars in normal-, medium- and high-strength recycled aggregate concrete. Constr. Build. Mater. 2021, 266, 121185. [Google Scholar] [CrossRef]
  9. Yuan, C.M.; Cai, J.; Chen, Q.J.; Liu, X.; Huang, H.; Zuo, Z.; He, A. Experimental study on seismic behaviour of precast recycled fine aggregate concrete columns with pressed sleeve connections. Structures 2023, 48, 1373–1390. [Google Scholar] [CrossRef]
  10. Cai, R.; Zhang, J.; Liu, Y.; Tao, X. Seismic behavior of recycled concrete columns reinforced with ultra-high-strength steel bars. Eng. Struct. 2023, 279, 115633. [Google Scholar] [CrossRef]
  11. Ma, H.; Xue, J.; Zhang, X.; Luo, D. Seismic performance of steel-reinforced recycled concrete columns under low cyclic loads. Constr. Build. Mater. 2013, 48, 229–237. [Google Scholar] [CrossRef]
  12. Zhang, Y.D. Experimental study on the seismic behavior of recycled concrete short columns with different stirrup ratios. Build. Struct. 2011, 41, 272–276. [Google Scholar]
  13. Zhang, Y.Q.; Cao, W.L.; Zhang, J.W. An experimental study on the seismic behavior of recycled concrete short columns with crossed reinforcing bars. Technol. Earthq. Disaster Prev. 2010, 5, 89–98. [Google Scholar]
  14. Yin, H.P.; Cao, W.L.; Zhang, Y.J.; Zhang, J. An Experimental study on the seismic behavior of recycled concrete columns with different reinforcement ratio. Technol. Earthq. Disaster Prev. 2010, 5, 99–107. [Google Scholar]
  15. Yin, H.P.; Cao, W.L.; Zhang, Y.J.; Zhang, J. An experimental study on the seismic behavior of recycled concrete columns with different recycled aggregate substitution ratios. World Earthq. Eng. 2010, 26, 57–63. [Google Scholar]
  16. Peng, Y.K.; Wu, H.; Gao, Q.C. Experimental study on seismic behavior of recycled concrete slender columns. J. Southeast Univ. 2013, 43, 576–581. [Google Scholar]
  17. Bai, G.; Liu, C.; Zhao, H.; Yao, F.; Zhu, L. Experimental research on seismic behavior of recycled concrete frame columns. J. Earthq. Eng. Eng. Vib. 2011, 31, 61–66. [Google Scholar]
  18. Peng, S.; Liu, G.; Xiong, Z.; Wang, J.; Li, G. Effect of confinement materials and damage degree on the seismic behavior of RRACFST columns. J. Build. Eng. 2022, 57, 104938. [Google Scholar] [CrossRef]
  19. Peng, S.; Xiong, Z. Experimental study on the seismic behavior of CFRP-strengthened seismic-damaged recycled aggregate concrete-filled rectangular steel tube frame columns. J. Build. Eng. 2022, 45, 103422. [Google Scholar] [CrossRef]
  20. GB50010-2010; Code for Design of Concrete Structures. China Architecture and Building Press: Beijing, China, 2010. (In Chinese)
  21. Peng, S.; Xiong, Z.; Zeng, X.G. A restoring force model for CFRP seismic-damaged RACFST columns: Theoretical, experimental, and simulation analysis. Structures 2022, 40, 273–283. [Google Scholar] [CrossRef]
  22. Ai, L.; Soltangharaei, V.; Ziehl, P. Evaluation of ASR in concrete using acoustic emission and deep learning. Nucl. Eng. Des. 2021, 380, 111328. [Google Scholar] [CrossRef]
  23. Ai, L.; Soltangharaei, V.; Ziehl, P. Developing a heterogeneous ensemble learning framework to evaluate Alkali-silica reaction damage in concrete using acoustic emission signals. Mech. Syst. Signal Process. 2022, 172, 108981. [Google Scholar] [CrossRef]
  24. Peng, S.; Xu, C.; Lu, M.; Yang, J. Experimental research and finite element analysis on seismic behavior of CFRP-strengthened seismic-damaged composite steel-concrete frame columns. Eng. Struct. 2018, 155, 50–60. [Google Scholar] [CrossRef]
  25. Soltangharaei, V.; Ai, L.; Anay, R.; Bayat, M.; Ziehl, P. Implementation of information entropy, b-value, and regression analyses for temporal evaluation of acoustic emission data recorded during ASR cracking. Pract. Period. Struct. Des. Constr. 2021, 26, 04020065. [Google Scholar] [CrossRef]
  26. Soltangharaei, V.; Anay, R.; Ai, L.; Giannini, E.R.; Zhu, J.; Ziehl, P. Temporal evaluation of ASR cracking in concrete specimens using acoustic emission. J. Mater. Civ. Eng. 2020, 32, 04020285. [Google Scholar] [CrossRef]
Figure 1. Diagram of P−Δ skeleton curves with different parameters. (a) Recycled coarse aggregate replacement rate. (b) Axial compression ratio. (c) Shear span ratio. (d) Hoop reinforcement rate. (e) Slenderness ratio. (f) Longitudinal reinforcement rate. (g) Recycled aggregate concrete strength grade.
Buildings 13 01761 g001
Figure 2. Diagram of load−bearing capacity curves with different parameters. (a) Recycled coarse aggregate replacement rate. (b) Axial compression ratio. (c) Shear span ratio. (d) Hoop reinforcement rate. (e) Slenderness ratio. (f) Longitudinal reinforcement rate. (g) Recycled aggregate concrete strength grade.
Buildings 13 01761 g002
Figure 3. Diagram of ductility performance curve with different parameters. (a) Recycled coarse aggregate replacement rate. (b) Axial compression ratio. (c) Shear span ratio. (d) Hoop reinforcement rate. (e) Slenderness ratio. (f) Longitudinal reinforcement rate. (g) Recycled aggregate concrete strength grade.
Buildings 13 01761 g003aBuildings 13 01761 g003b
Table 1. Test variables of each specimen.
ReferenceSpecimenγ/%Lw*Lh*t*H/mmn0λ0λρsv/%ρsl/%f
Wu [20]RC130400*400*4*12000.33.0033.931.59C35
RC230400*400*4*120003.0033.931.59C35
RC330400*400*4*12000.153.0033.931.59C35
RC430400*400*4*12000.453.0033.931.59C35
RC530400*400*4*12000.63.0033.931.59C35
RC630400*400*4*12000.33.0033.931.01C35
RC730400*400*4*12000.33.0033.932.45C35
RC80400*400*4*12000.33.0033.931.59C35
RC970400*400*4*12000.33.0033.931.59C35
RC1030400*400*4*12000.153.0033.931.59C35
Bai et al. [17]SRRC1100180*240*4*3500.61.461.461.361.42C40
SRRC2100180*240*4*4600.61.921.921.361.42C40
SRRC3100180*240*4*5700.62.382.381.361.42C40
SRRC40180*240*4*7800.63.253.251.361.42C40
SRRC550180*240*4*7800.63.253.251.361.42C40
SRRC6100180*240*4*7800.63.253.251.361.42C40
SRRC7100180*240*4*7800.43.253.251.361.42C40
SRRC8100180*240*4*7800.83.253.251.361.42C40
SRRC9100180*240*4*7800.63.253.251.091.42C40
SRRC10100180*240*4*7800.63.253.251.971.42C40
SRRC11100180*240*4*7800.63.253.251.361.42C50
SRRC12100180*240*4*7800.63.253.251.361.42C60
SRRC13100180*240*4*7800.63.253.251.361.42C40
SRRC14100180*240*4*7800.63.253.251.361.42C40
Ma et al. [11]SRRC10180*240*4*3350.61.401.41.361.42C40
SRRC230180*240*4*3350.61.401.41.361.42C40
SRRC370180*240*4*3350.61.401.41.361.42C40
SRRC4100180*240*4*3350.61.401.41.361.42C40
SRRC5100180*240*4*3350.31.401.41.361.42C40
SRRC6100180*240*4*3350.91.401.41.361.42C40
SRRC7100180*240*4*3350.61.401.41.021.42C40
SRRC8100180*240*4*3350.61.401.42.041.42C40
SRRC9100180*240*4*4450.61.851.851.361.42C40
SRRC10100180*240*4*5650.62.352.351.361.42C40
SRRC110180*240*4*7800.63.253.251.361.42C40
SRRC1270180*240*4*7800.63.253.251.361.42C40
SRRC13100180*240*4*7800.63.253.251.361.42C40
SRRC14100180*240*4*7800.33.253.251.361.42C40
SRRC15100180*240*4*7800.93.253.251.361.42C40
SRRC16100180*240*4*7800.63.253.251.021.42C40
SRRC17100180*240*4*7800.63.253.252.041.42C40
Peng et al. [16]C230300*300*7.5*16000.45.335.333.771.5C30
C350300*300*7.5*16000.45.335.333.771.5C30
C470300*300*7.5*16000.45.335.333.771.5C30
C5100300*300*7.5*16000.45.335.333.771.5C30
Gaurav et al. [8]CTFM7.5C0300*300*7.5*16000.45.335.333.771.5C30
Yuan et al. [9]C3-4-C30-00300*300*4*120004.0041.891.51C30
C3-4-C30-0.20300*300*4*12000.24.0041.891.51C30
C3-4-C30-0.40300*300*4*12000.44.0041.891.51C30
C3-4-C30-0.60300*300*4*12000.64.0041.891.51C30
C5-4-C30-0.40500*500*4*20000.44.0041.891.51C30
C5-4-C40-0.40500*500*4*20000.44.0041.891.51C40
C5-4-C50-0.40500*500*4*20000.44.0041.891.51C50
Table 2. Characteristic point parameters of each specimen.
ReferenceSpecimenLoad TypeYield PointPeak PointUltimate Pointμ
PyΔyPmΔmPuΔu
Wu [20]RC1+2208.44308.5527262.2741.725.9
-2187.48307.1930261.1151.28
RC2+1046.9147.9110125.7272.989.45
-1409.17170.8960145.2676.39
RC3+1958.88273.5929232.5553.896.06
-2179.98271.3730230.6660.34
RC4+2506.27347.9114295.7226.094
-2527.07308.3120262.0627.13
RC5+2506.41354.8113301.5920.813.72
-2606.75326.8220277.828.25
RC6+1797.91247.1220210.0531.884.05
-1807.68222.7920189.3731.26
RC7+28010.71356.5628303.0854.175.28
-30011.1352.1930299.3660.95
RC8+2206.79281.3519239.1540.715.26
-2157.56268.8820228.5534.14
RC9+2459.6299.4326254.5249.185.49
-2209.29257.1820218.654.44
RC10+1809.04250.8125213.1953.697.2
-1908.79211.9421180.1574.34
Bai et al. [17]SRRC1+2404.493208.827210.242.35
-2504.943208.427212
SRRC2+2455.329010.2246.512.462.75
-2205.4227514.5233.7517.13
SRRC3+1805.172099.8177.65153.19
-1905.7523011195.520
SRRC4+1305.11609136153.49
-804.2114013.411917
SRRC5+1003.8915510131.75133.36
-1003.851529.8127.513
SRRC6+1254.281507127.512.53.31
-1004.341401011916
SRRC7+1036.0813014110.5345.21
-115614819125.829
SRRC8+1485.871758148.7511.82.18
-1305.51709.5144.513
SRRC9+1104.8714511.5123.25153.14
-1154.714810.2125.815
SRRC10+1204.9415213129.220.53.63
-1206.4516515140.2520
SRRC11+1354.871758148.75133.1
-1054.2514812125.815
SRRC12+14041788151.313.83
-1256.2715011.8127.516
SRRC13+1505.341808153142.98
-1184.7915012127.516
SRRC14+1604.112007.5170122.65
-1506.4717011.5144.515
Ma et al. [11]SRRC1+250.53.68328.28.3527910.212.66
-249.83.77322.78.3274.39.62
SRRC2+266.93.71343.47.57291.98.932.60
-259.23.67327.38.08303.310.25
SRRC3+274.74.583347.92286.810.62.35
-262.74.77328.38.4827911.4
SRRC4+241.24.47324.58.53283.8102.32
-255.54.89332.68.01317.611.67
SRRC5+215.83.98306.210.7260.317.874.07
-258.94.393318.39281.415.98
SRRC6+299.64.97403.77.29347.28.632.04
-268.43.283577.48319.47.67
SRRC7+269.44.61324.87.64304.49.282.18
-2663.44312.66.31292.68.1
SRRC8+245.74.48332.410.4311.112.972.76
-323.44.2377.27.8936511
SRRC9+246.85.23292.49.5248.612.392.78
-223.35.37274.711.5233.517.09
SRRC10+181.34.7215.39.4418313.513.17
-190.95.45234.310.7199.218.86
SRRC11+125.74.751487.01125.813.893.47
-112.84.58145.810.8123.918.39
SRRC12+117.54.31153.39.98130.314.323.34
-118.34.25155.99.37132.514.31
SRRC13+135.25.29159.17.98135.215.413.30
-1115.18135.99.99115.519.08
SRRC14+100.25.75127.814.2108.632.185.22
-112.66.19143.616.112229.98
SRRC15+146.15.52169.48.514411.162.19
-1435.42168.38.4314312.82
SRRC16+107.54.93140.611.7119.515.123.13
-112.64.71144.210.2122.614.98
SRRC17+116.54.8515010.8127.520.183.64
-128.36.94166.515.1141.521.59
Peng et al. [16]C2+1421518843159.8684.73
-1361418635158.169
C3+1361618549157.25674.39
-1351518450156.469
C4+1321617862151.3674.22
-1311617557148.7568
C5+1251616847142.8684.10
-1261716962143.6567
Gaurav et al. [8]CTFM7.5C+172.51323045195.5705.65
-168.751222548191.2571
Yuan et al. [9]C3-4-C30-0+97613016.5110.5425.86
-108714517123.2533
C3-4-C30-0.2+115615312.5130.0535.25.58
-120716219.5137.737
C3-4-C30-0.4+1285.217315.5147.0527.75.16
-130717516.2148.7535
C3-4-C30-0.6+1506.220015.5170304.92
-140620515174.2530
C5-4-C30-0.4+35010.543018.7365.541.54.16
-3209.540519.5344.2541.5
C5-4-C40-0.4+4201055018.5467.548.54.50
-43010.554021.545943.5
C5-4-C50-0.4+5101060220511.752.54.85
-5051160021.551049
Disclaimer/Publisher’s Note: The statements, opinions and data contained in all publications are solely those of the individual author(s) and contributor(s) and not of MDPI and/or the editor(s). MDPI and/or the editor(s) disclaim responsibility for any injury to people or property resulting from any ideas, methods, instructions or products referred to in the content.

