Article

Parameter Selection for Concrete Constitutive Models in Finite Element Analysis of Composite Columns

1
AECOM, Chicago, IL 60601, USA
2
Technion, Israel Institute of Technology, Haifa 3200003, Israel
3
University of Illinois at Chicago, Chicago, IL 60607, USA
4
University of Colorado, Boulder, CO 80309, USA
5
University of Maryland, College Park, MD 20742, USA
6
AFRY, 00580 Helsinki, Finland
7
HDR, Denver, CO 80202, USA
*
Author to whom correspondence should be addressed.
Buildings 2023, 13(7), 1759; https://doi.org/10.3390/buildings13071759
Submission received: 6 June 2023 / Revised: 23 June 2023 / Accepted: 29 June 2023 / Published: 11 July 2023
(This article belongs to the Special Issue Steel-Concrete Composite Structures: Design and Construction)

Abstract

:
Concrete, as a complex and anisotropic material, poses challenges in accurately simulating its behavior in numerical simulations. This paper focuses on selecting an appropriate constitutive model for simulating the behavior of a steel–concrete composite column using finite element analysis under compression and push-out tests. Two models are analyzed and compared, namely, Drucker–Prager and concrete damage plasticity. The results demonstrate that the concrete damage plasticity model outperforms the Drucker–Prager model in all six test cases, indicating its superior accuracy in capturing the composite column’s behavior. This study enhances the reliability of numerical simulations for steel–concrete composite structures by choosing the most suitable constitutive model, parallel with extensive sensitivity analysis and model calibration. The findings emphasize the significance of meticulous model selection and precise parameter definition for achieving accurate predictions of concrete behavior. This research contributes to advancing the understanding and modeling of concrete’s intricate behavior in structural analyses.

1. Introduction

The selection and parameterization of a model significantly impact its simulation results, influencing the design and safety of the analyzed structure. Optimizing the model parameters and performing meticulous calibration are vital steps in accurately capturing the material behavior under diverse loading conditions. Additionally, rigorous verification and validation procedures enhance the reliability and accuracy of simulation results, instilling confidence in their validity. Thus, the combination of selecting an appropriate constitutive model, optimizing its parameters, and conducting verification, validation, and calibration processes are essential for conducting reliable and accurate finite element simulations in structural engineering applications.
The task of selecting the most suitable constitutive model and its parameters can be challenging due to several sources of uncertainty. These uncertainties arise from factors such as experimental measurement errors, inherent variability in material properties, and simplifications made during the modeling process. Even under the same loading conditions, different constitutive models can yield varying responses and failure modes. A constitutive model establishes the relationship between a material’s mechanical or thermal responses and the corresponding loading conditions, playing a crucial role in formulating governing equations, conservation laws, and kinematic relations in finite element modeling. The choice of a constitutive model depends on the selected modeling technique, as certain techniques necessitate advanced models that consider multiple variables. The variability of constitutive models plays a significant role in uncertainty assessments for structural systems.
Concrete and steel are two widely used materials in structural engineering and construction. They have widely different properties such as tensile capacity and ductility yet have very similar thermal expansion coefficients. Combining these two materials creates an efficient composite structural element, which is commonly used in beams and columns. The sources of uncertainty in constitutive models applied in continuum finite element simulations include the following.
Continuum-based Concrete Nonlinearity: Several constitutive models have been proposed for nonlinear response of concrete material in finite element formulations. These models include fixed/rotating smeared crack [1,2,3,4,5], plasticity [6,7], damage mechanics [8,9], fracture mechanics [10], and different micro-plane models [11,12].
Concrete Fracture Initiation: In nonlinear models, it is crucial to define an appropriate criteria for crack initiation and propagation. There are two distinct methods used to model joints, cracks, and flaws in concrete structures. The first method is discrete fracture formulation [13], such as in the cohesive crack model and discontinuity in finite element model [14,15,16]. The second method involves models with distributed cracking/damage using continuum finite elements and discrete elements such as a random lattice or particle model [17]. Several studies have compared the discrete and smeared crack models, including their inherent uncertainties [18,19,20,21,22,23,24,25]. Based on a detailed analysis of several concrete beams, columns, and shear wall models, it is recommended to use discrete or smeared models for plain concrete with a known crack path, and smeared models for reinforced concrete [26]. For unknown crack paths, discrete or smeared models should be used for plain concrete and combined or smeared model for reinforced concrete.
Reinforcement Modeling: There are two methods to model the reinforcing rebar in a concrete structure, namely, the discrete and smeared model approaches [27]. In the discrete model approach, individual rebars are explicitly modeled using link-type or solid-type elements. This approach involves using different steel and concrete material models that need to be properly linked to each other at the interface, enabling very detailed steel–concrete modeling. In the smeared modeling approach, the material properties of the elements which the rebar passes through are modified to reflect a homogenized property of both concrete and steel. In the smeared modeling approach, the rebar is not typically modeled separately, which reduces computational time and complexity.
Bond Strength Modeling: The complex interaction between the concrete and reinforcement is characterized by bond strength models, which enable force transfer and deformation compatibility between the reinforcing steel bars and the surrounding concrete. These models can be divided into three main categories, with a large variability among different representations: empirical models developed by regression analysis on the experimental tests [28,29,30], analytical models [31,32,33,34], and probabilistic models [35,36].
Uncertainty in (reinforced) concrete constitutive models has been studied previously [37,38,39,40,41,42,43]. The above studies have identified the importance of accounting for the randomness in the choice of constitutive model and its parameters in the damage response of structural systems. Addressing such uncertainties in composite structures is even more challenging due to the complex interaction between concrete and steel.
Several studies have examined the modeling of composite structures, with most being limited to frame elements and relyingg on uniaxial constitutive relationships. Notable studies have focused on composite columns, including Schneider [44], who conducted an experimental and numerical investigation into the effects of geometric shapes, steel tube properties, and concrete confinement on composite column capacity. Hajjar et al. [45] proposed a dispersed plasticity approach for modeling concrete-filled tubes (CFTs) acting as beam-columns using slip effects. The study analyzed rectangular and square CFT beam-columns subjected to monotonic loading using 3D analysis. Varma et al. [46] studied high-strength square CFT beam-columns subjected to seismic loads. Hu et al. [47] employed the Abaqus finite element package to study CFT columns with confinement effects, and tested three different types of sections: circular sections with no ties, and square sections with and without reinforcing ties. Kostic et al. [48] investigated the nonlinear behavior of a beam-column element used to analyze rectangular CFT columns. Their study focused on a sensitivity analysis of model parameters and their impact on the accuracy of the results. Zhou et al. [49] conducted an eccentric compression test on square tube steel-reinforced concrete (SRC) columns to evaluate the performance of centrally and eccentrically loaded SRC columns. Lai and Varma [50] developed a unique stress–strain relationship for the concrete core and steel tube of slender and non-compact CFT section through 3D finite element analysis. The CFT columns had various geometric and material parameters, providing accurate predictions for the behavior of such members.
Wang et al. [51] conducted an experimental study on the axial compressive behavior of circular fiber-reinforced polymer (FRP) steel tubed concrete stub columns. Their study showed that FRP confinement significantly enhanced the axial compressive strength and ductility of the columns. The confinement mechanism was attributed to the increase in the lateral pressure on the concrete core, which prevented the concrete from buckling and improved the load transfer between the concrete and the steel tube. Wei et al. [52] presented a comprehensive literature review on the confinement effectiveness of circular concrete-filled steel tubular columns under axial compression. Their review covered a wide range of topics, including the definition of confinement, the different methods of confinement, the factors affecting confinement effectiveness, and both experimental and numerical studies. Their paper concluded that confinement is an important factor in the behavior of concrete-filled steel tubular columns, and that it can significantly increase the strength and ductility of these columns. Le Hoang and Fehling [53] studied the compressive behavior of circular steel tube confined concrete (STCC) stub columns. The results of their study showed that the confinement provided by the steel tube significantly increased the strength and ductility of the concrete core. The same study showed that the concrete strength, steel yield strength, and steel tube thickness all affected the behavior of circular STCC stub columns. Wang et al. [54] investigated the compressive behavior of carbon fiber-reinforced polymer (CFRP) steel composite tube steel-reinforced columns with high-strength concrete. The study was conducted using a combination of experimental and numerical methods. The results of the study showed that CFRP steel composite tubes can effectively prevent both buckling of the steel tube and concrete crushing. The same study showed that CFRP steel composite tubed columns have a higher compressive strength and ductility than conventional steel-reinforced concrete columns. Chen et al. [55] conducted an experimental study on the compressive behavior of CFRP-confined post heated square CFST stub columns. The study investigated the effects of CFRP confinement, post heating, and concrete strength on the load bearing capacity, ductility, and failure mode of the columns. The results showed that CFRP confinement significantly improved the load-bearing capacity and ductility of the columns, while post heating had only a minor effect. The failure mode of the columns was changed from brittle to ductile with CFRP confinement.
One major limitation observed in previous studies is the absence of a comprehensive parametric and sensitivity analysis, as well as the lack of generalization of the proposed procedures for various cases involving different shapes, dimensions, materials, and loading conditions. It is essential to validate the proposed methodology through experimental testing on a wide range of cases to ensure its applicability and effectiveness in real-world scenarios.
This research aims to investigate the mechanical behavior of composite columns with different cross-sections, which poses a challenge in understanding their overall behavior. In order to represent the behavior of concrete, both the Drucker–Prager (DP) and concrete damage plasticity (CDP) model are utilized, with focus on CDP model’s parameter selection. There are two main reasons for considering these two models. First, both are widely recognized and extensively used constitutive models in the analysis of concrete structures. Moreover, they are commonly available in commercial finite element software packages, making them accessible and applicable for practitioners in the field. Second, to ensure consistency and minimize uncertainties associated with different software packages, we specifically focused on utilizing a single software package, Abaqus, providing a reliable and standardized framework for our study.
The primary objective of this study was to determine the most accurate CDP model parameters and gain insights into their mechanical behavior without the need to conduct experimental work for future similar specimens. This approach is shown to be practical and cost-effective, significantly reducing the time and effort required to comprehend the mechanical behavior of composite columns. To explore the effects of changing CDP variables and parameters on the structure’s performance, we conducted a sensitivity and optimization study using finite element analysis. This technique allows for parametric studies by systematically varying unknown variables such as mesh size, dilation angle, or the shape of the yield surface. In contrast, experimental tests would require physical modifications and repeated testing, making the process more challenging and time-intensive in the laboratory. Therefore, the contribution of this paper lies in a series of detailed model calibration and sensitivity analyses aimed at quantifying the uncertainties in numerical simulations. It establishes a generalized procedure to calibrate composite structures using the CDP constitutive model. Furthermore, it provides recommendations for practitioners regarding the optimal choice of these parameters.

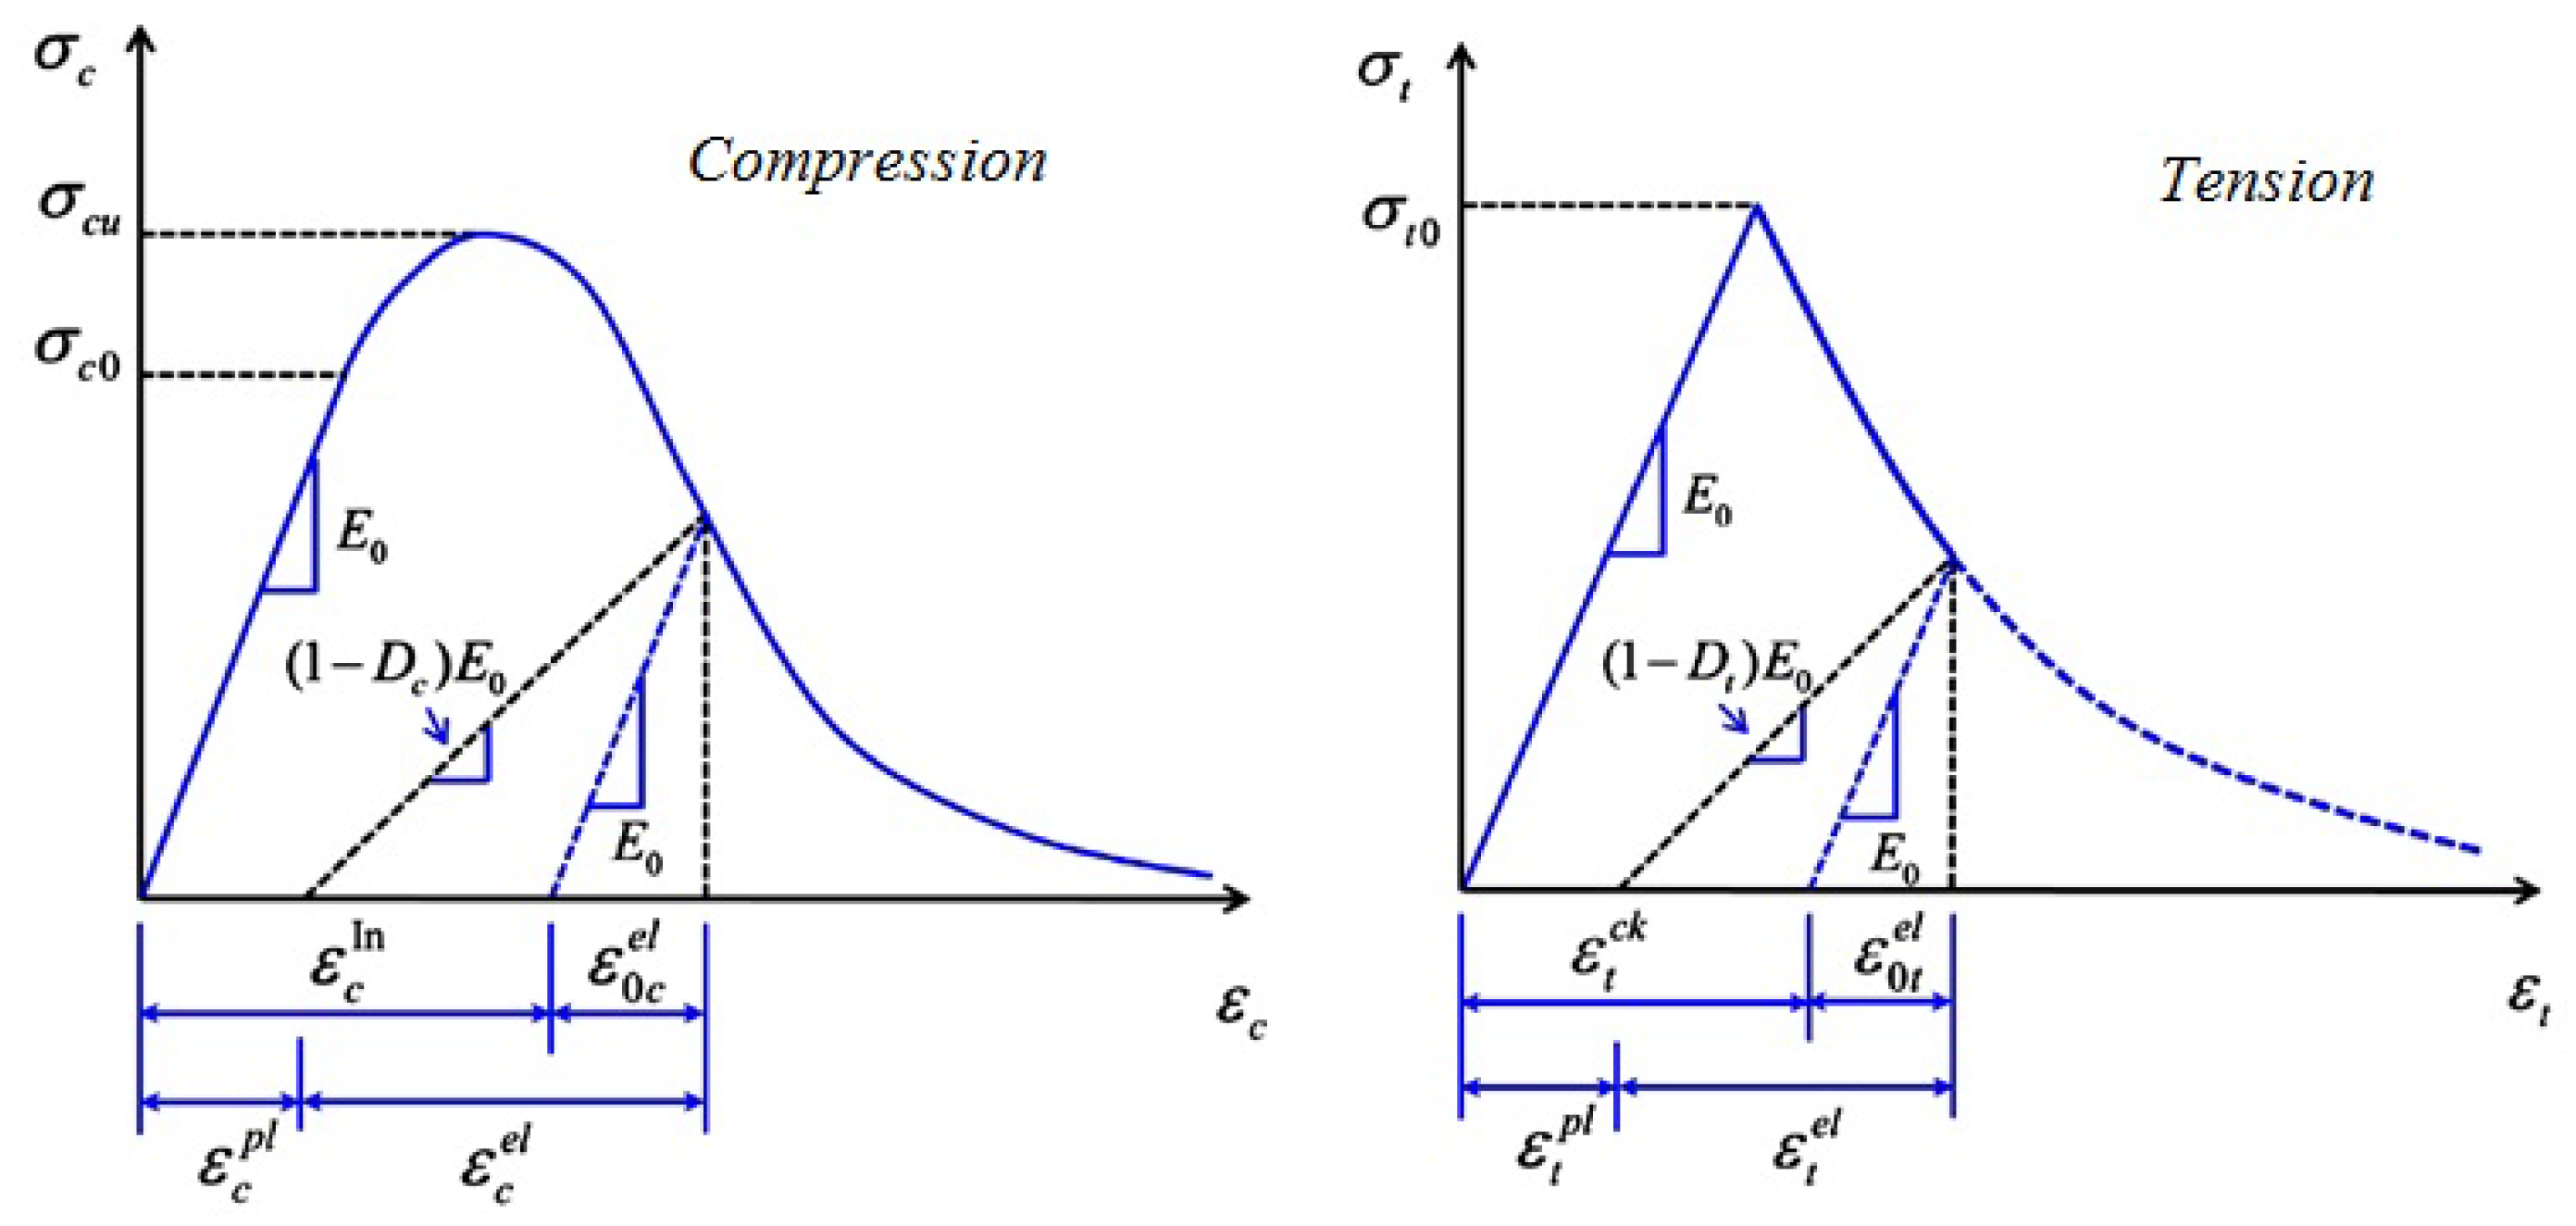
2. Characteristics and Simulation of Concrete Materials

A comprehensive understanding of various crucial aspects is necessary in order to accurately model concrete behavior in composite structures. These aspects include the constitutive behavior of concrete, the plastic behavior of the steel components, and their composite behavior. This understanding plays a vital role in selecting an appropriate approach for the mathematical model and determining the values of the model’s parameters. Unreinforced concrete can be described as a cohesive and frictional material composed of stiff particles or aggregates with diverse shapes and sizes. These particles are bound together by a cementitious matrix. Cracks develop when this system is subjected to different loading conditions, and exhibit distinct behaviors under tension and compression [56]. In compression, cracks tend to close, and are capable of transmitting significant compressive stresses. Conversely, tensile forces cause cracks to open up, eliminating the ability of the concrete to bear additional tension and significantly reducing its ability to withstand shear loading.
Finite element simulations offer a valuable tool for simulating concrete behavior in composite structures. One advantage of finite element analysis is the ability to eliminate structural and modeling features that have negligible impact on the overall behavior of the structure without compromising the simulation’s accuracy. For instance, in composite buildings the behavior of studs can be represented using beam elements if their individual behavior is not of critical importance. This simplifies the modeling process and allows for more efficient simulations. It is essential to emphasize the limitations of finite element simulations, including but not limited to mesh dependency, computational intensity, modeling assumptions, user expertise, numerical errors, appropriate material modeling, and the verification and validation process.
The linear behavior of concrete is characterized by its modulus of elasticity, denoted as E c , and its Poisson’s ratio ν c . Within the commercially available finite element analysis software Abaqus, there are several material models available to simulate the nonlinear behavior of concrete, two of which, the DP and CDP models, are used in this paper [57]. The DP model is well-suited for accurately describing materials that are sensitive to applied pressure, such as concrete, soil, and rock. However, it falls short in capturing the tensile behavior of brittle materials, which is crucial for modeling concrete cracking behavior [58]. In contrast, the CDP model, which incorporates a non-associative flow, is able to account for concrete damage [59]. Therefore, it is considered an ideal model for representing concrete behavior in composite structures, where the reinforcement ductility is important. This model is able to simulate concrete behavior under various loading conditions and account for the development and evolution of damage in the material. By accurately determining the parameters of this model, it is possible to predict the behavior of composite structures without the need to conduct costly and time-consuming experimental work.

Concrete Damage Plasticity Model: A Brief Review

The concrete damage plasticity model is notable for its ability to capture the complete plastic behavior of concrete under both tensile and compressive stresses thanks to its distinctive damage characteristics. Creating an appropriate damage simulation model utilizing CDP is beneficial for analyzing reinforced concrete structures exposed to any loading condition, including static and dynamic loading. The CDP model incorporates two major failure modes, namely, tensile cracking and compressive crushing. Furthermore, the model describes the uniaxial tensile and compressive behavior of concrete through damage plasticity. Hardening and softening damage parameters are defined to represent cracking (tension), crushing (compression), the yield surface progression, and elastic stiffness degradation [60].
To define the compressive stress–strain relationship of concrete, the stress σ c and inelastic strain ε c i n are respectively used to represent the stress and strain values, while the damage property D c represents the inelastic strain. Therefore, the total strain values can be converted to inelastic strains ε c i n = ε c ε 0 c e l , where ε 0 c e l = σ c E 0 . The accuracy of the damage curve is checked using the plastic strain values ε c p l :
ε c p l = ε c i n D c 1 D c σ c E 0
Concrete’s post-failure tensile stress–strain correlation is used to simulate the behavior of reinforced concrete in tension. This relationship takes into account tension stiffening, steel and concrete interaction, and strain softening. To develop this model, the Young’s modulus E 0 , tensile stress σ t , tensile stress at failure σ t 0 , cracking strain values σ t c r , and damage parameter values D t all need to be defined. The cracking strain is calculated as ε t c r = ε t ε 0 t e l , where ε 0 t e l = σ t E 0 . Furthermore, corrective measures should be taken to ensure that the plastic strain values are neither negative nor decreasing with increasing stress:
ε t p l = ε t c r D t 1 D t σ t E 0
A typical stress–strain relationship for the concrete damage plasticity model in both compression and tension is provided in Figure 1.
The constitutive CDP parameters fundamentally define the flow potential G and yield surface shape. The Drucker–Prager hyperbolic function is defined as
G = σ c ϵ σ t tan Ψ 2 + q ¯ 2 p ¯ tan Ψ σ
where σ c and σ t are the uniaxial strengths of concrete in compression and tension, respectively, Ψ is the dilation angle in the p q plane, and ϵ is an eccentricity of the inelastic potential surface.
The p q plane includes the flow potential surface, where p ¯ = 1 / 3 σ ¯ I is the effective hydrostatic stress, q ¯ = 3 / 2 S ¯ S ¯ is the von Mises equivalent stress, S ¯ is the deviatoric part of the effective stress tensor σ ¯ , and I is the moment of inertia.
In the CDP model, after defining all the parameters the yield function takes the following form controlled by the hardening variables:
F = 1 1 α q ¯ 3 α p ¯ + β ( ε p l ) σ ¯ ^ m a x γ σ ¯ ^ m a x σ ¯ c ( ε c p l ) 0
with the function β ( ε p l ) defined as
β ( ε p l ) = σ ¯ c ( ε c p l ) σ ¯ t ( ε t p l ) 1 α 1 + α
where σ ¯ c and σ ¯ t are the effective compressive and tensile cohesion stresses, respectively.
In addition, α and γ are dimensionless material constants. The coefficient α is typically determined from the initial equi-biaxial ( σ b 0 ) and uni-axial ( σ c 0 ) compressive yield stress as follows:
α = σ b 0 / σ c 0 1 2 σ b 0 / σ c 0 1
where the ratio of σ b 0 / σ c 0 for concrete is typically in the range of 1.10–1.16.
The presence of the coefficient γ in the yield function is limited to stress states characterized by triaxial compression:
γ = 3 1 K c 2 K c 1
The parameter K c should be identified as well, although it is limited by the availability of complete concrete triaxial test data. Otherwise, a sensitivity analysis must be performed to obtain an accurate and compatible value for the parameter. Typical values are between 0.64 to 0.8; K c = 2/3 in the Rankine formulation and K c = 1 in the Drucker–Prager model. Another parameter included in the CDP model is the ratio of initial equi-biaxial to uniaxial compressive yield strengths f b , 0 f c , 0 = σ b , 0 σ c , 0 , where σ b , 0 is the compressive stress under biaxial loading and σ c , 0 is the compressive stress under uniaxial loading. The default value of this ratio is 1.16. The input viscosity parameter μ is disregarded in this study and has a default value of zero, as viscoplasticity does not apply to concrete.

3. Experimental Data and Numerical Models

3.1. Data Collection

This study used previous experimental work by Schneider [44] and Chen and Han [7] on composite columns with various dimensions and cross-sectional shapes (circular and square) as a source of data. The authors identified significant factors affecting the behavior and capacity of these axially loaded columns and sought to improve their mechanical properties. These factors encompass dimensions of the composite column, such as diameter, height, steel case thickness, as well as the ratio between the column diameter and steel case thickness. Building on this work, Hu et al. [47] performed an enhanced study using the Abaqus package to explore the nonlinear behavior of the columns, with a particular focus on the concrete confinement effect of columns designed using the Saenz equation [62]. They proposed a numerical technique to define the mathematical parameters related to the stress–strain relationship, adopting the Drucker–Prager model to simulate the concrete’s behavior. This approach was used to define the modulus of elasticity and Poisson’s ratio to represent the linear part of the behavior, while the hardening curve was used to model the nonlinear part. They then validated their simulation procedure on more complicated specimens.
Other researchers, including Zhou et al. [49], have conducted experimental and analytical studies on square composite columns with embedded steel sections and studs, evaluating their capacity under axial compression with and without eccentricity. Tao et al. [63] tested a composite square column with studs on the interior walls to study the bond behavior in concrete through a push-out test, while Pagoulatou et al. [64] performed numerical analysis on circular concrete-filled double-skinned steel tubes using the Drucker–Prager model. Li et al. [65] examined the behavior of tapered CFSDT columns through experimental and numerical tests. Table 1 displays the main properties of the specimens considered in this investigation, including f c (concrete compressive strength), f y (steel yield stress), D or B (the diameter or side length of the cross-section), D / t (the diameter to steel-case thickness ratio), and L (the specimens’ length).

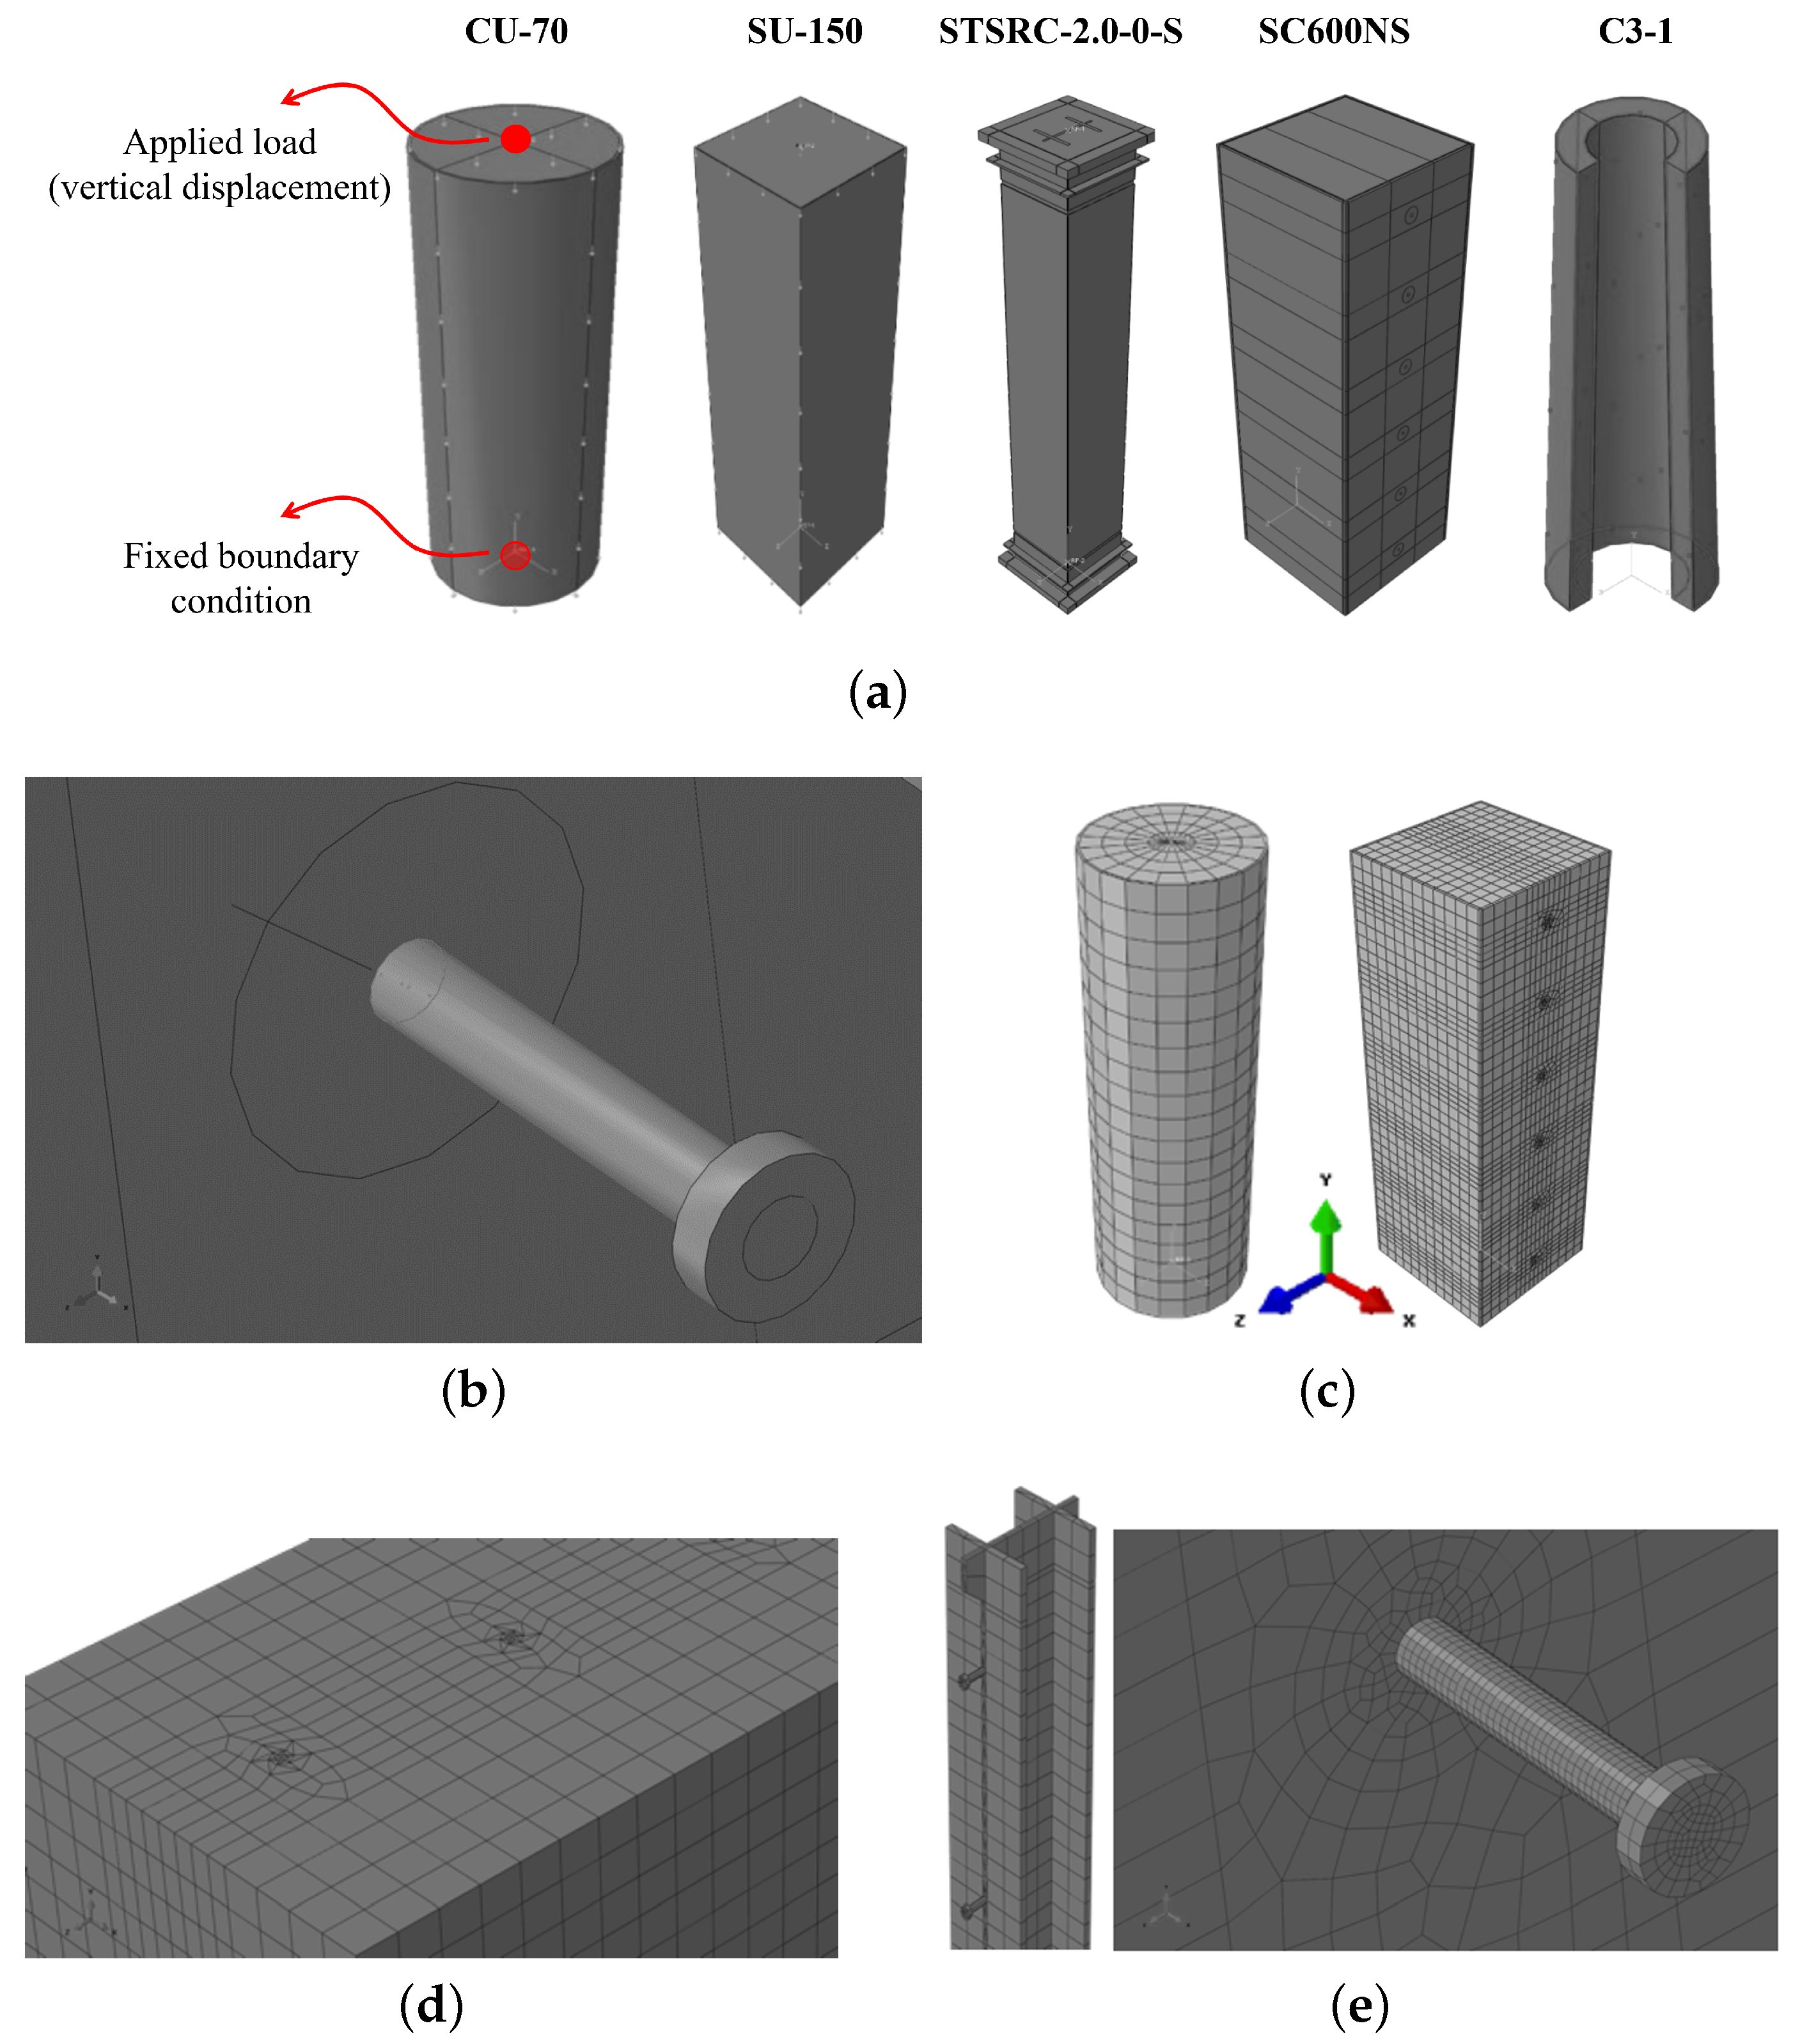
3.2. Finite Element Considerations

This section discusses the complications involved in finite element modeling with Abaqus, including the interaction between the concrete and the steel surface, boundary conditions, loading, etc.
The CDP model in Abaqus was used to simulate concrete behavior by taking into consideration the confinement effect. The modulus of elasticity was calculated using E c = 4700 f c [MPa], where f c is the concrete’s compressive strength. To represent the stress–strain curves of concrete under both tension and compression, the Saenz equation [66] and Hu et al. [47] approach were utilized, adding the confinement effect of concrete to the composite behavior. In addition, the column equations for double-skinned steel tubes from Mander’s approach [67] were used to simulate the behavior of concrete in double-skinned columns. A bilinear stress–strain curve was used for steel, with a slope change point on the yield strength. The initial modulus of elasticity E s and Poisson’s ratio ν s for the steel were set to 200,000 N/mm 2 (MPa) and 0.3, respectively.
In order to accurately model the experimental data, reference points were established at both ends of the specimens. The reference points were connected to the equivalent point nodes via tie connections to ensure proper load transfer and boundary conditions. A tie connection in Abaqus is a type of constraint that joins two separate regions even if the meshes created on the surfaces of the regions are dissimilar. It achieves this by effectively linking or “tying” the two surfaces together, ensuring that they do not experience any relative motion between them. The CU-70 and SU-150 specimens were modeled as two separate components, namely, the steel tube and concrete filling. To define the interaction between the steel and concrete surfaces, master and slave surfaces were utilized. In Abaqus, the master surface is the surface that imposes the contact constraints, whereas the slave surface is the surface that is subject to these constraints. The steel tube was selected as the master surface, and the interaction was modeled as “hard contact” for normal behavior (i.e., fully transferable forces between surfaces) and “penalty friction”, with a coefficient of friction of 0.25 for tangential behavior (i.e., frictional contacts with slippage). The same interactions were applied to simulate the interaction of the steel case and concrete core for the STSRC-2.0-0-S and SC600NS specimens. According to experimental tests by Hajjar et al. [45] on composite columns, the failure process initiates with local buckling in the steel case, which subsequently causes debonding between the steel case and the filled concrete. As a result of this debonding, voids are formed, ultimately leading to crushing in the filled concrete. This phenomenon elucidates the rationale behind designating the steel contact surface as the primary component, as the stresses first develop in the steel and subsequently transfer to the stresses within the filled concrete. To establish contact between the studs and section flanges in Specimen STSRC-2.0-0-S and between the studs and case interior walls in Specimen SC600NS, a tie connection was utilized. In the latter two specimens, the embedded region option was employed to connect the tied stud set and steel section to the concrete. Figure 2b provides details on the tie connection used in Specimen SC600NS, where faces with matching shapes were selected to define the interaction area.
All specimens were subjected to specific boundary conditions. The bottom of each specimen was fixed against all degrees of freedom by attaching a reference point to all corresponding nodes. Similarly, the top of each specimen was fixed against all types of rotations and lateral displacements (in the x and z directions) by means of a secondary reference point. The top reference point was able to deform along the longitudinal axis (y), along which the compressive loads were applied. Loads were applied using a displacement-controlled method whereby a non-zero displacement value was specified at the top reference point and the weight was added as a gravity load on the y-axis with a value of 9807 mm/s 2 .
The use of a fully integrated element such as C3D8R in Abaqus allows for accurate stress and strain predictions throughout the model. The average mesh size used in this study (35 mm) was chosen in order to balance computational efficiency and accuracy. The meshing arrangement was designed to capture the geometric features of the specimens while minimizing the number of elements required (Figure 2c). The partitioning command in Abaqus was used to ensure proper contact between the steel section, studs, and concrete, allowing for accurate transfer of both loads and boundary conditions. The detailed meshes of the studs and the steel case in specimens STSRC-2.0-0-S and SC600NS (Figure 2d,e) ensured accurate prediction of stress and strain concentration in these regions.

4. Results

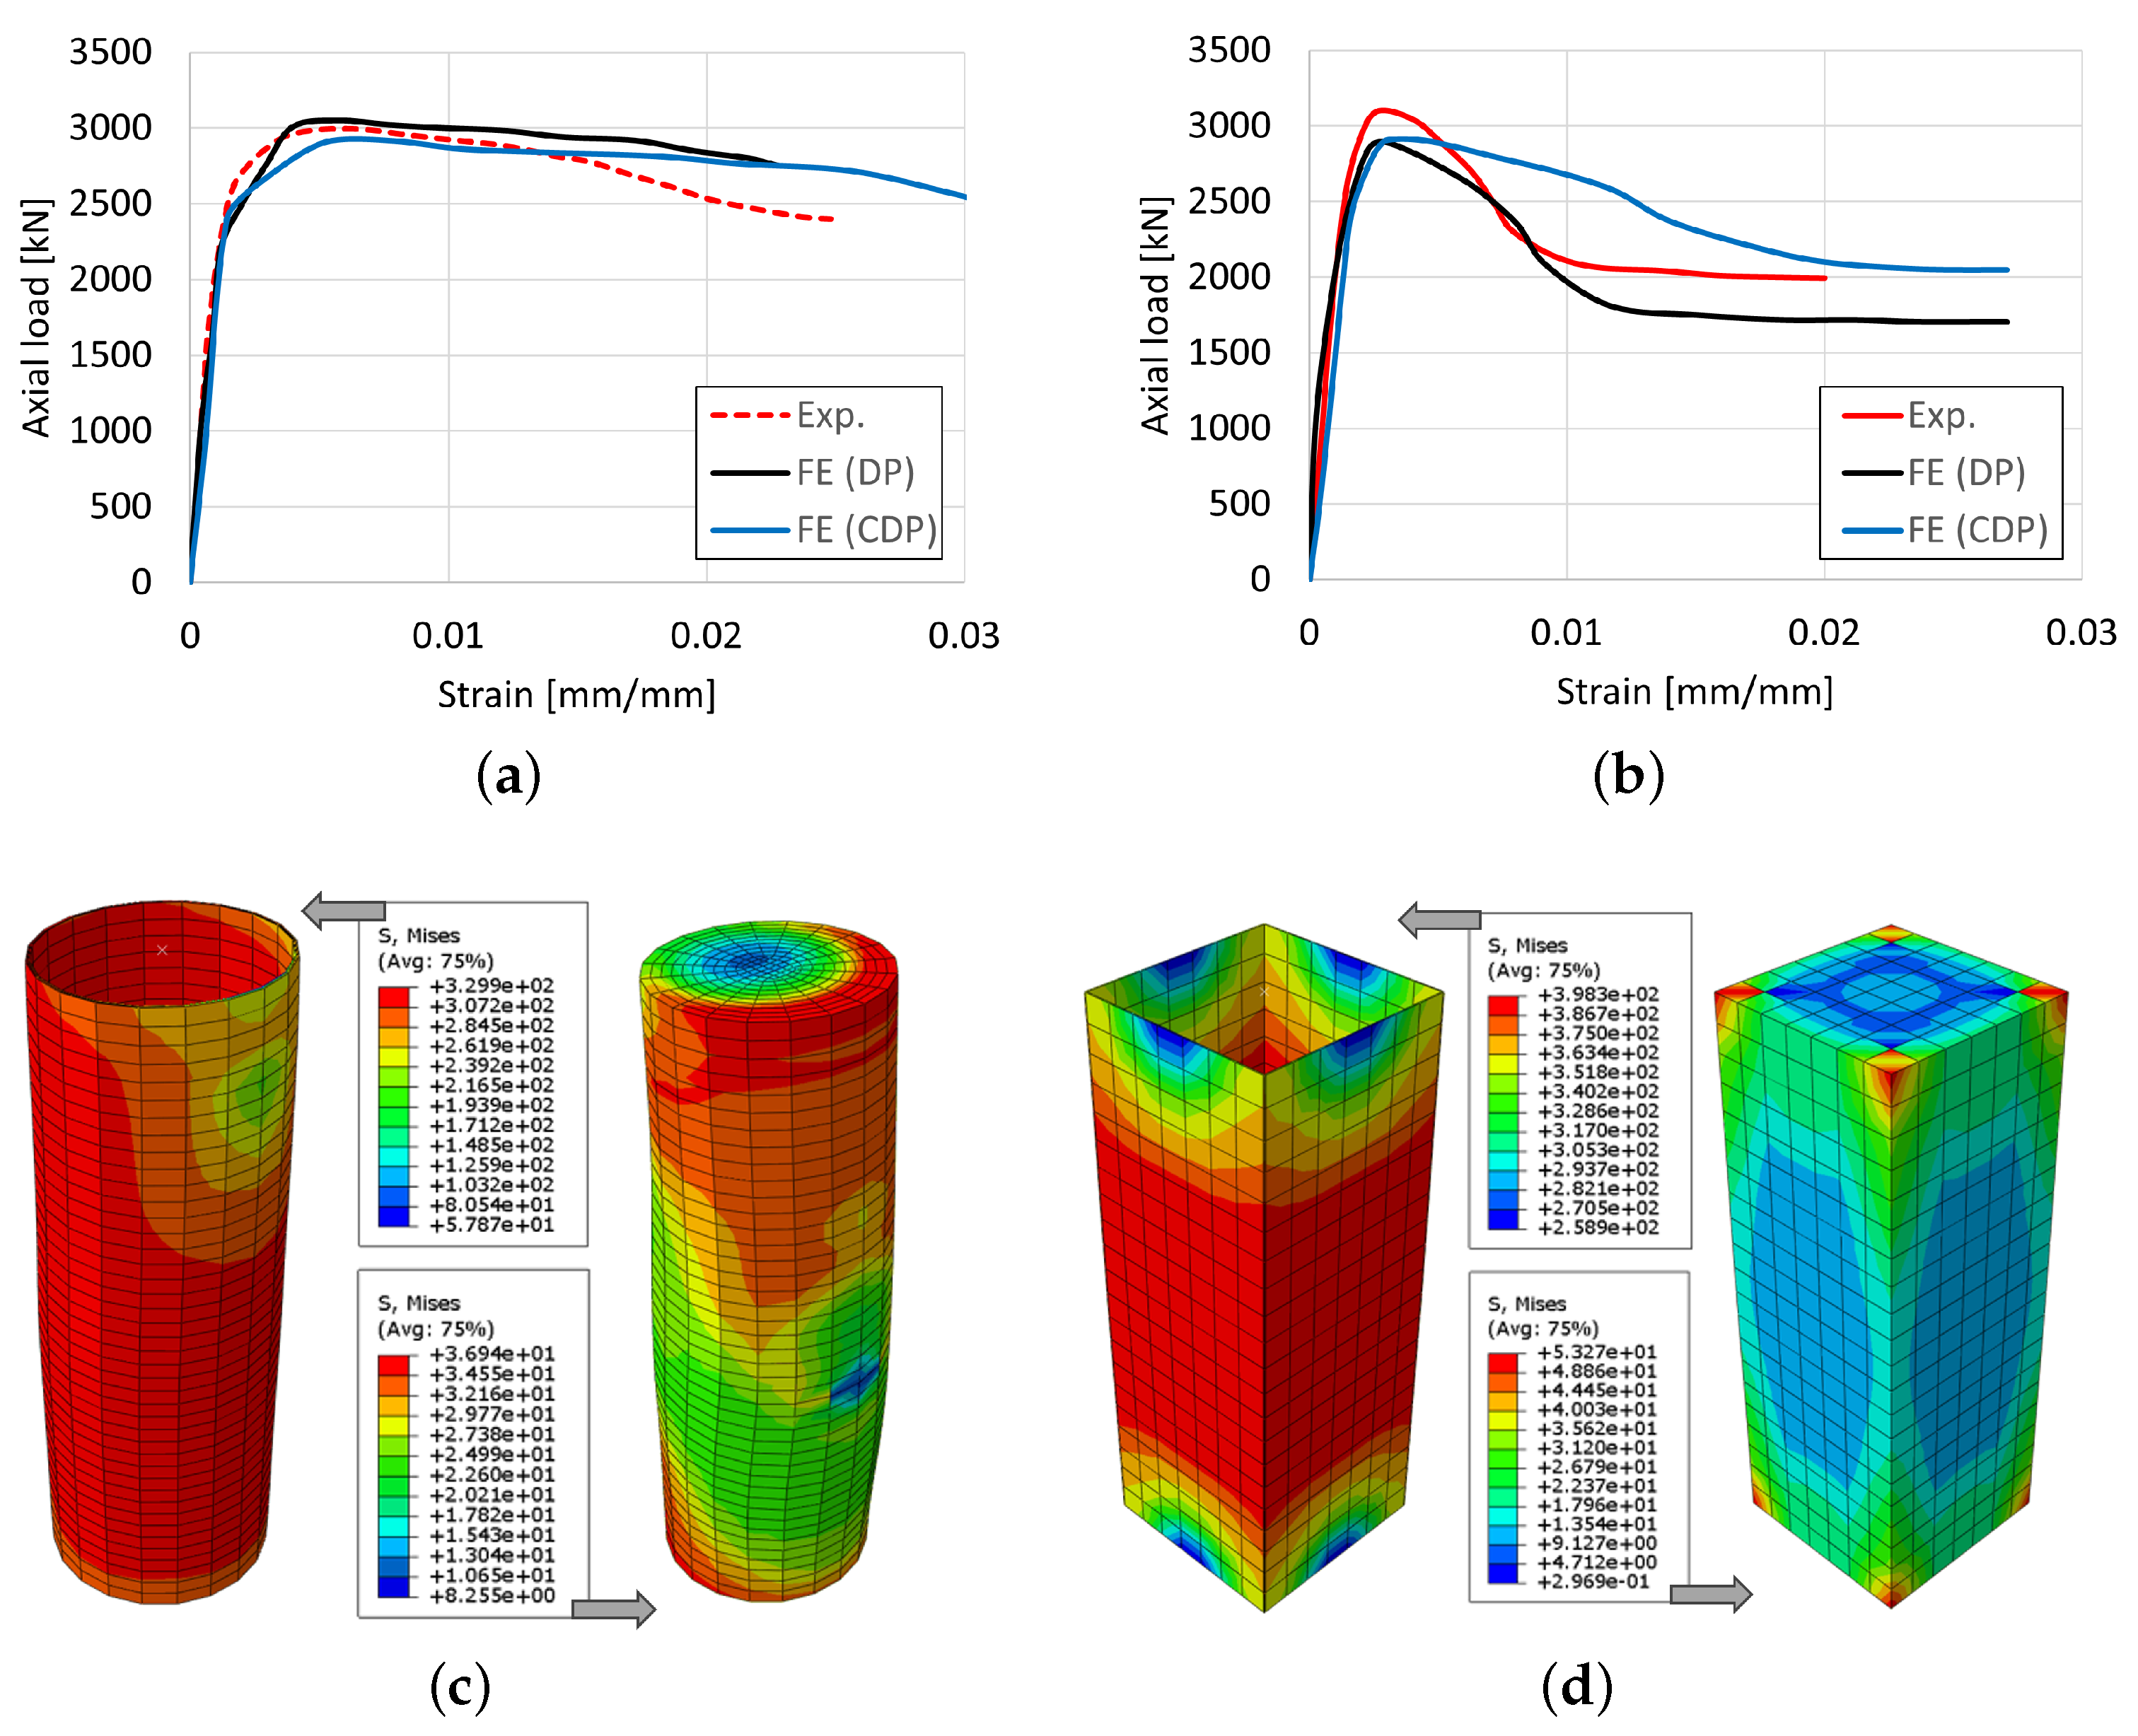
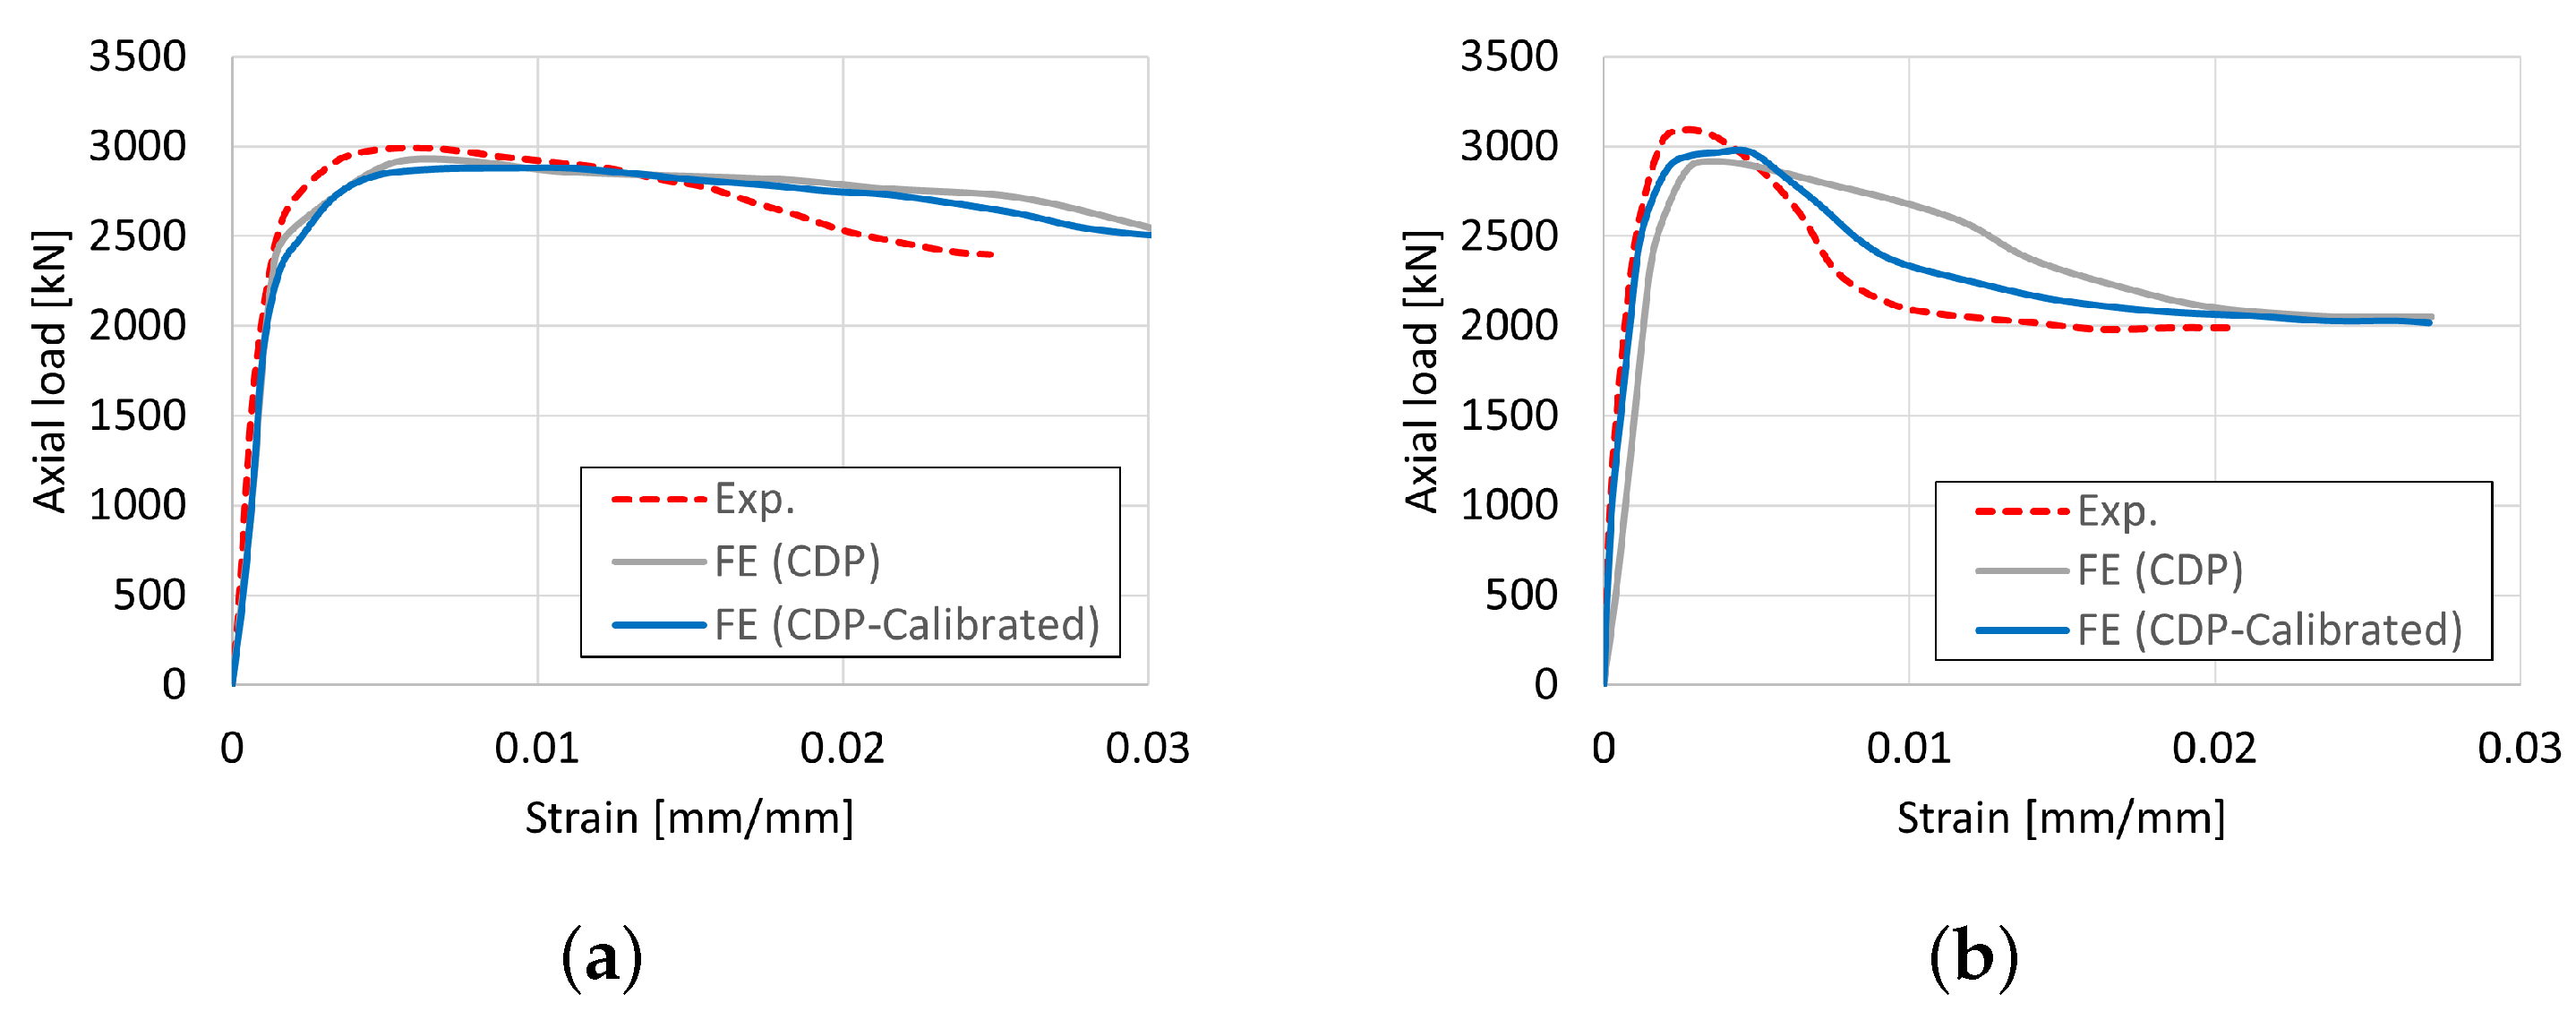
4.1. Initial Comparison

This section commences by comparing the experimental and numerical results before model calibration. Figure 3a,b depicts a comparison between the experimental results and the two constitutive models for two structural models, CU-70 and SU-150. The finite element results utilizing the Drucker–Prager model, which includes a hardening curve defining the nonlinear portion of the stress–strain curve, exhibits favorable agreement with the experimental tests. The percentage differences between the DP model and the experimental results for Specimen CU-70 are 0.9% and 16.7% at the maximum capacity and failure point, respectively, while for Specimen SU-150, these percentage differences amount to 6.4% and 12.5%, respectively.
Comparing the results of the uncalibrated Concrete Damage Plasticity model with the experimental tests reveals an acceptable agreement, which could be further enhanced by conducting a sensitivity analysis of the parameters employed for concrete modeling. The percentage differences between the CDP model and the experimental results are 2.1% and 12.1% at the maximum capacity and failure point, respectively, for CU-70 and 7.5% and 2.8%, respectively, for SU-150.
Additionally, Figure 3c,d showcases the stress distribution in both the steel case and concrete core for specimens CU-70 and SU-150. The agreement between the experimental and analytical results is confirmed by these figures. In specimen CU-70, the stress distribution aligns well with the actual experimental findings reported in [45]. It can be observed that there is debonding between the steel case and the filled-in concrete, leading to the failure of the specimen. In the case of specimen SU-150, a noticeable stress concentration can be observed at the edges of the square shape. This behavior is commonly observed in square sections subjected to axial compression in concrete.

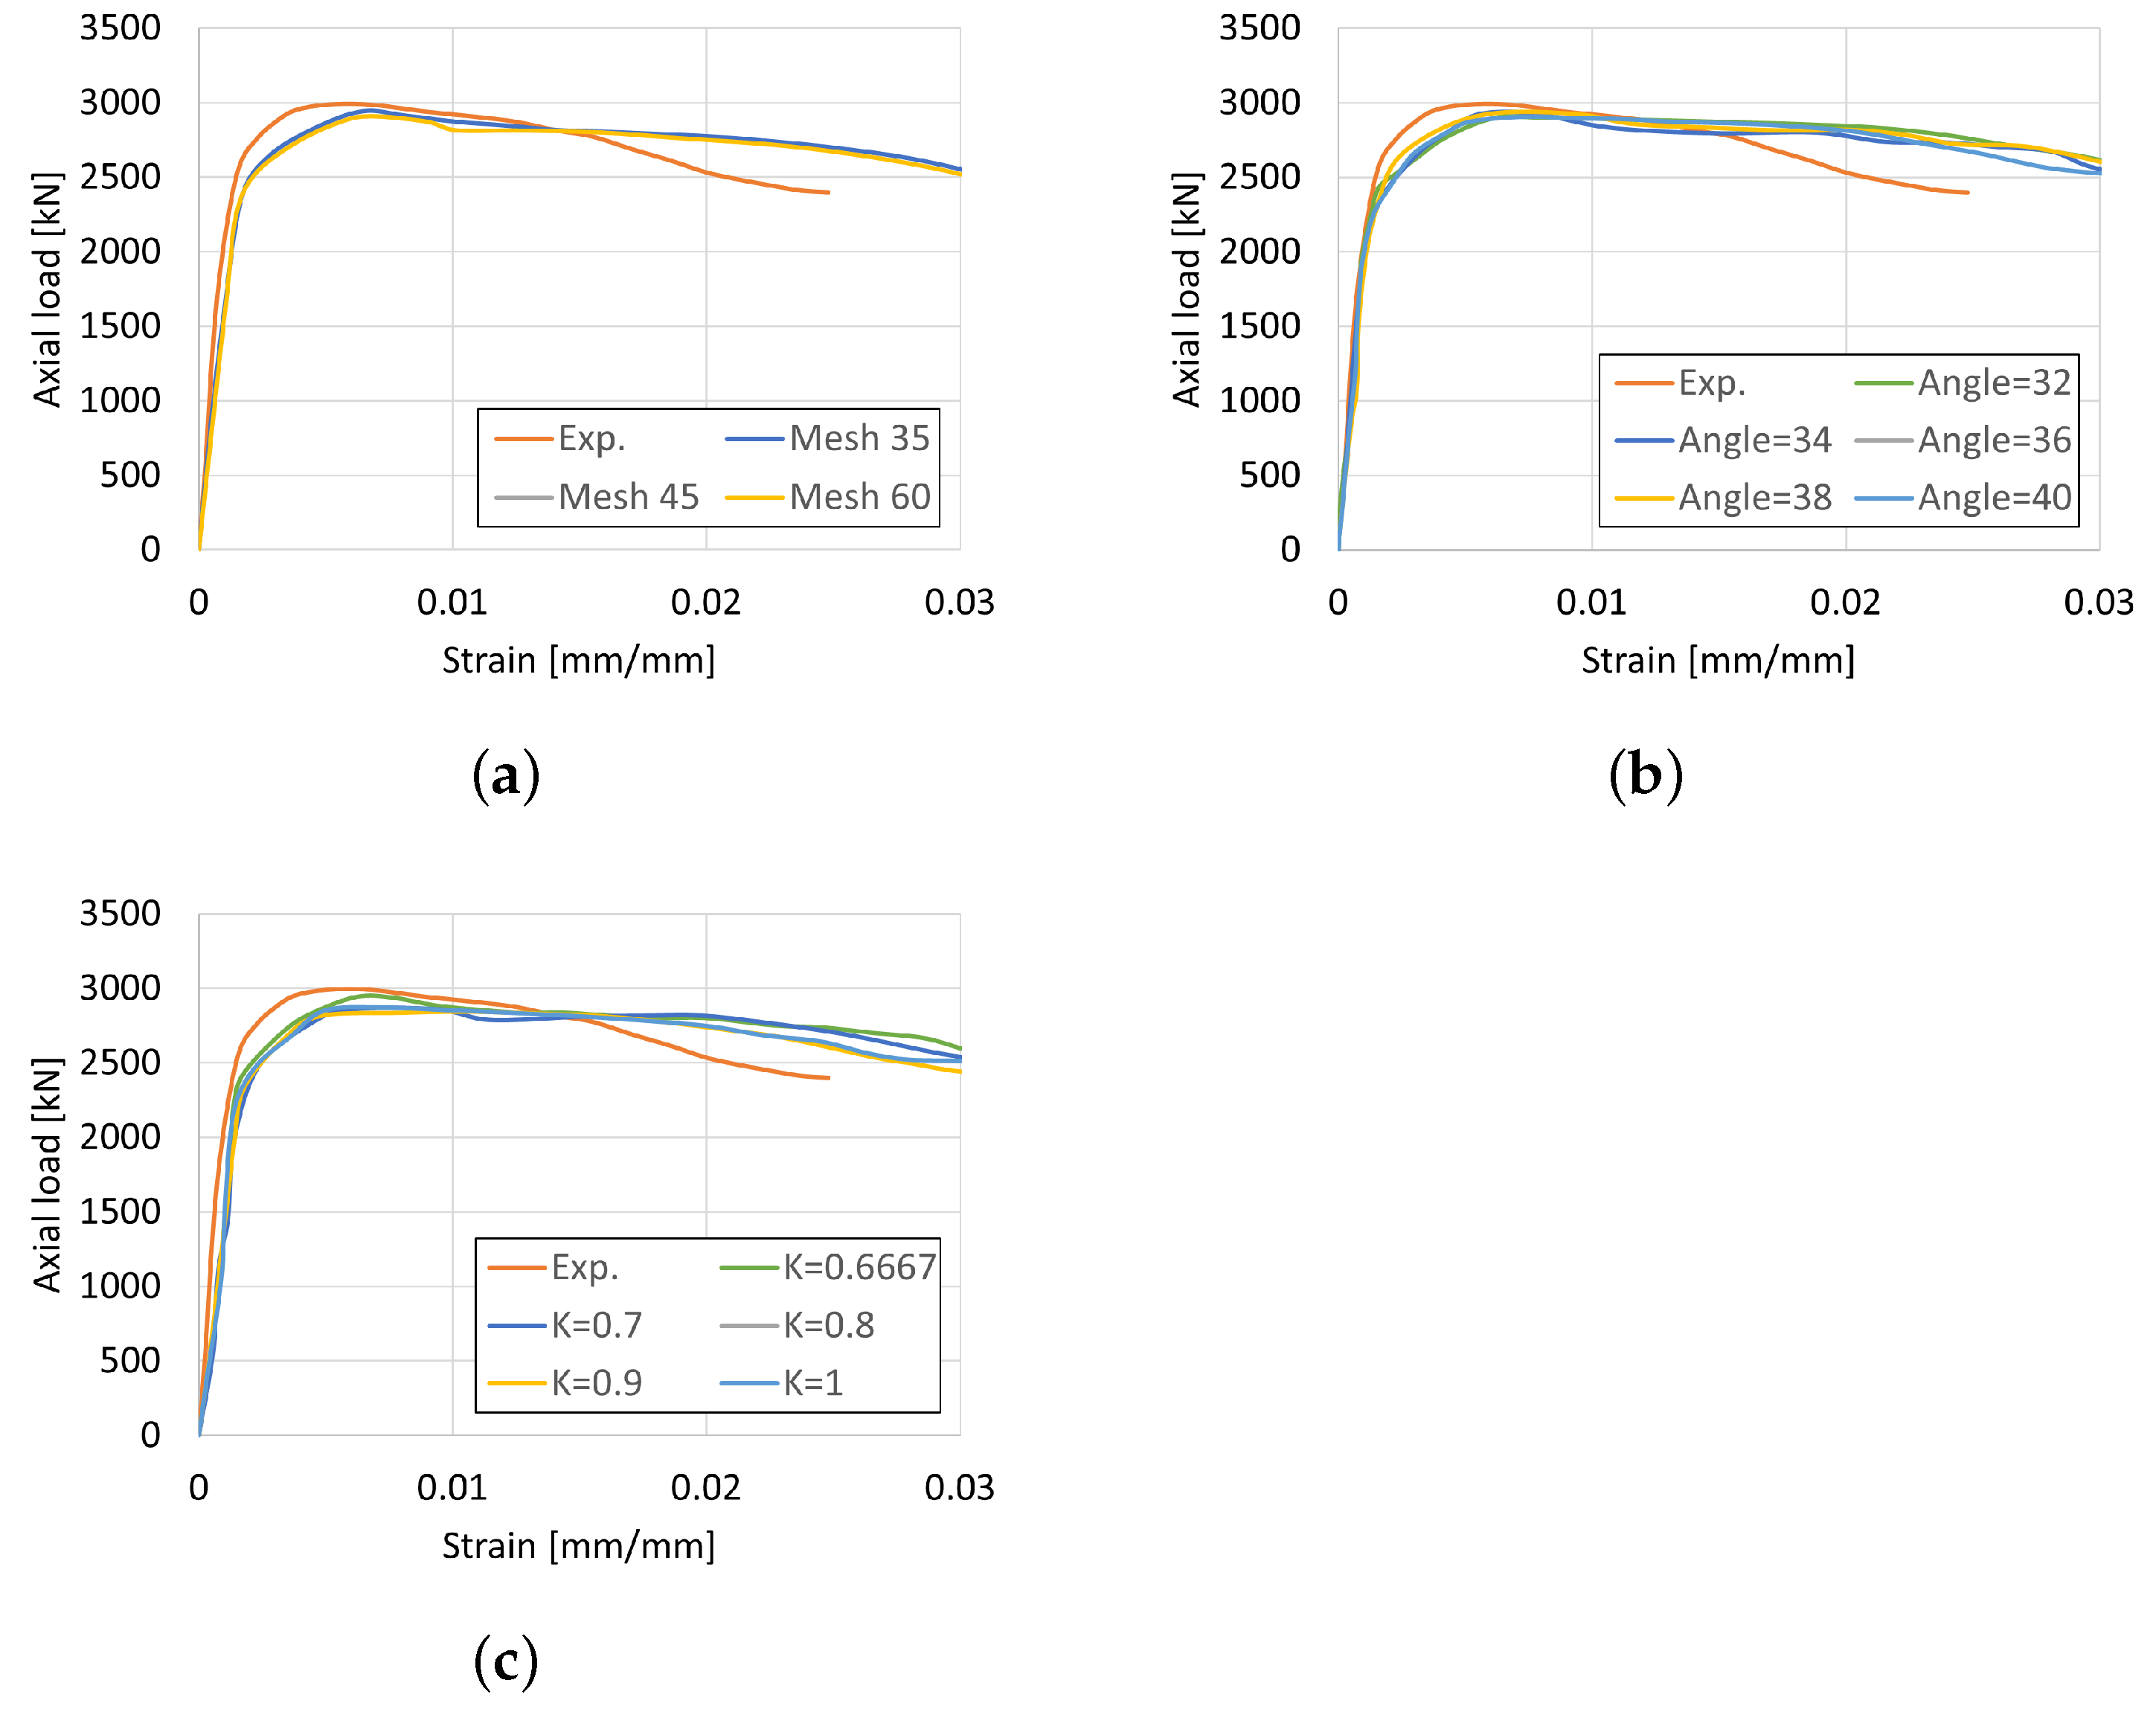
4.2. Sensitivity Analysis

In order to obtain the most accurate results using the Concrete Damage Plasticity model, the constitutive material model parameters and other analysis characteristics were investigated and calibrated. Specimen CU-70 was chosen as the control specimen to examine the CDP parameters and perform model calibration. Initially, the CDP default parameter values were obtained from the Abaqus manual. These values were as follows: dilatation angle = 36 , eccentricity = 0.1, ratio of initial cracking stress in bending to initial cracking stress in compression f b 0 f c 0 = 1.16, ratio of initial yield stress in bending to initial cracking stress in bending K c = 0.667, and viscosity parameter T = 0.
To determine the optimized mesh size, a mesh convergence study was conducted. The selection of an appropriate mesh size is crucial in finite element simulations, as using a finer mesh can result in localization and non-convergence of the solution. Consequently, plasticity models that exhibit softening behavior are often affected by the mesh size. In this study, mesh sizes of 35 mm, 45 mm, and 60 mm were tested, taking into account the maximum aggregate size. The choice of these mesh sizes aimed to avoid the numerical issue known as “hourglassing,” which causes nonphysical deformation and distortion, particularly in integrated elements with a coarse mesh such as the C3D8R element. The 35 mm mesh size was selected, as it was larger than the maximum aggregate size yet not excessively coarse. Figure 4a demonstrates that all tested mesh sizes yielded similar results for the failure load. However, as the 35 mm mesh size provided slightly more reliable results, it was chosen for all subsequent analyses of all specimens.
Concrete is a brittle material which undergoes significant volume changes due to inelastic strains. This phenomenon is known as dilatancy. The dilation angle is a material parameter that characterizes this volume change [68]. According to Chen and Han [7], frictional materials such as concrete follow a non-associated flow rule of dilatancy. Thus, the dilation angle was further investigated as a crucial parameter for concrete behavior. Previous studies, such as Lee and Fenves [62], proposed a dilatancy parameter value of 0.2 in the Drucker–Prager inelastic function. Other researchers, including Wu et al. [69] and Voyiadjis et al. [70], stated that the parameter value typically ranges between 0.2 and 0.3. Consequently, the dilation angle in the Concrete Damage Plasticity model falls within the specified range of 31 to 42 . To determine the most reliable value for the dilation angle in this investigation, a range of values was tested using finite element analysis, as shown in Figure 4b. The results indicate that the ultimate load before failure is highest for dilation angles of 38 and 40 . Considering that the failure load was slightly higher at a dilation angle of 38 , this value was chosen for all specimens. However, the results were relatively close for all tested models using dilation angle values between 34 and 40 .
In addition to the sensitivity analysis conducted earlier, a further investigation was carried out to explore the impact of different values of the Kc parameter in the CDP model. Figure 4c illustrates the influence of varying the K c value on the behavior of the tested specimen. Five different values of the Kc parameter were tested: 0.667, 0.7, 0.8, 0.9, and 1. The results indicate that varying the K c parameter does not significantly affect the load–strain response of the specimen. As the K c parameter decreases, both the load and the ultimate displacement values tend to increase minimally. Based on these findings, it was determined that for all future analyses the default value of 0.667 for the K c parameter would be selected.
After conducting a thorough sensitivity analysis to determine the parameters for the CDP model, the following values were selected: Dilatation angle = 38 , Eccentricity = 0.1, f b 0 f c 0 ratio = 1.16, K c = 0.667, and a mesh size of 35 mm. Using these parameters, updated finite element simulations were conducted for the CU-70 and SU-150 specimens. Figure 5 illustrates the updated results. The calibrated numerical results show better agreement with the experiments compared to the initial default results. It should be noted that in the Drucker–Prager model the tension behavior of concrete is completely neglected, making it suitable for axial compression tests. The concrete’s behavior is defined by the hardening curve in compression only after the linear portion ( 0.5 f c ) based on the DP model. On the other hand, the CDP model allows for a comprehensive definition of the concrete’s behavior in both compression and tension.

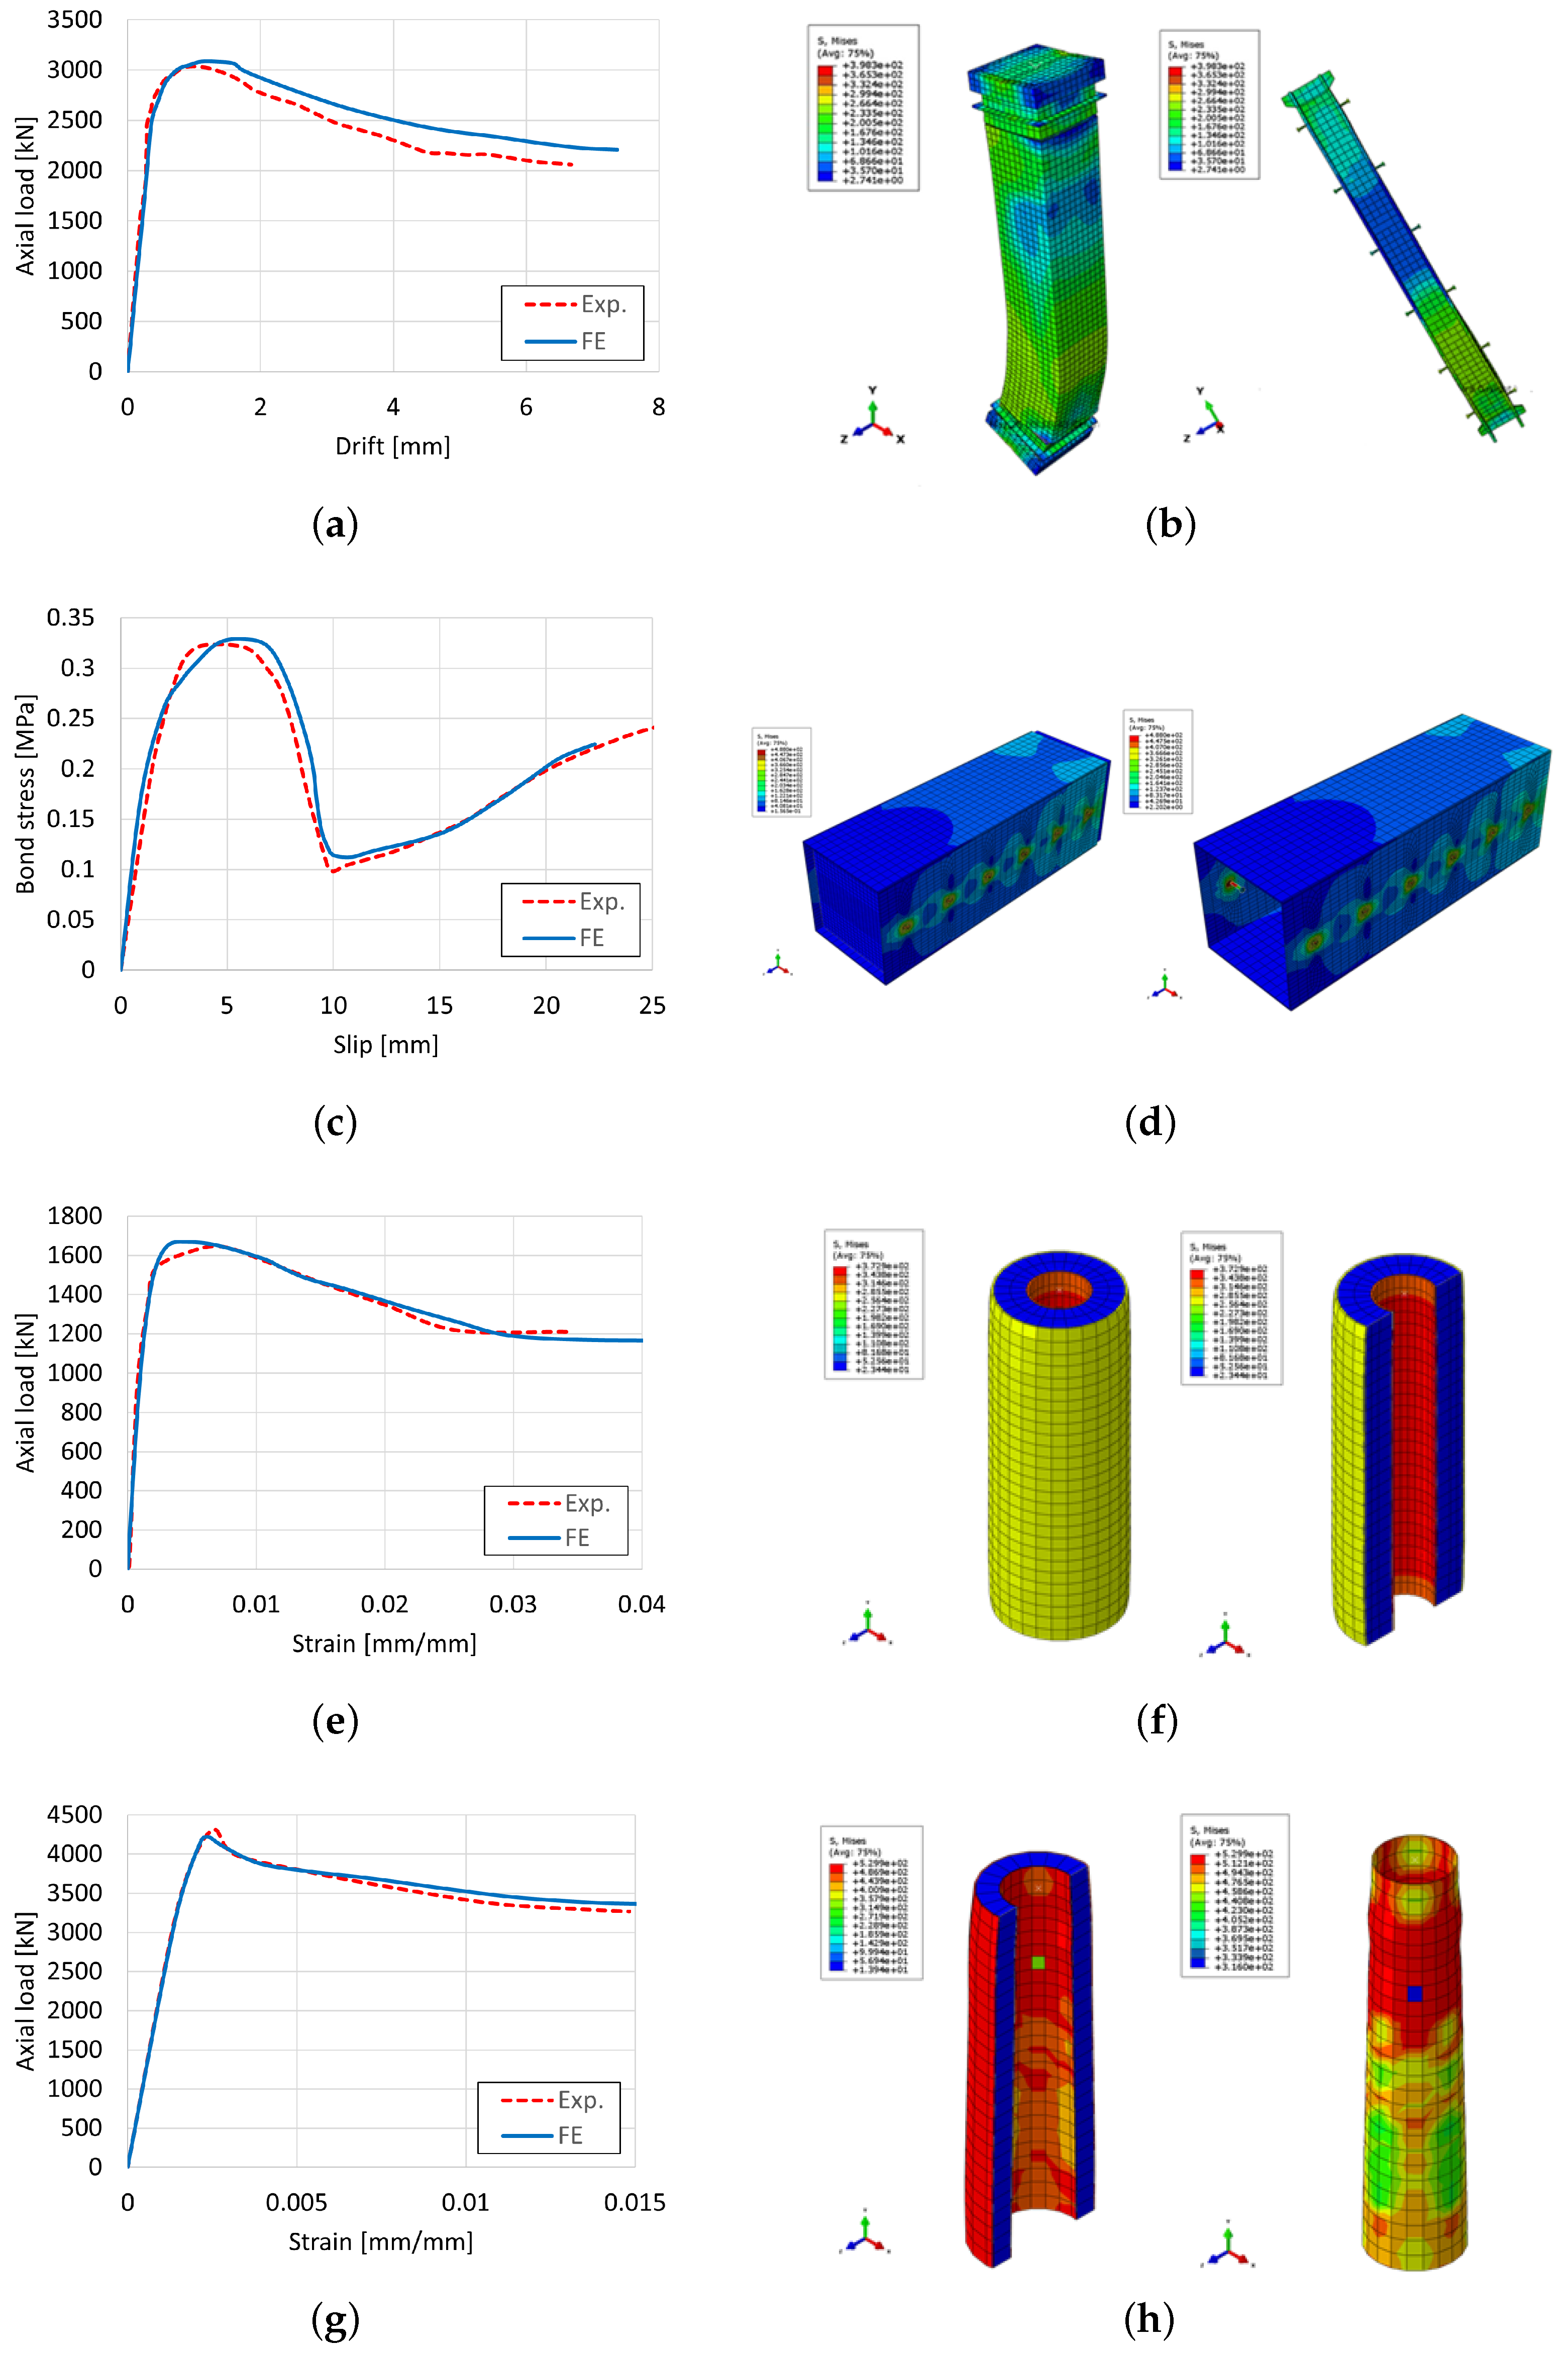
4.3. Generalized Assessment

In this section, the optimal parameters for the CDP constitutive model determined in the previous subsection are applied. The set of direct finite element simulations listed in Table 1 was conducted on four new specimens. The results of these simulations are presented in Figure 6, where the first column displays the capacity curves and the second column depicts the stress distribution within the specimens.
The validity of the model was confirmed through the analysis of the STSRC-2.0-0-S specimen in compression and the SC600NS specimen in pushout tests. These tests involved detailed composite sections comprising steel sections and studs. Figure 6a presents a comparison between the numerical and experimental tests, specifically the axial load versus the mid-span deflection curve for specimen STSRC-2.0-0-S. The verification results from embedded steel section and shear stud model demonstrate the accuracy of the model. The percentage differences between the CDP model and the experimental results at the maximum capacity and failure point are 2.1% and 4.9%, respectively. Furthermore, Figure 6b displays the stress distribution within the entire specimen (left) and the embedded steel section with studs (right). The results for the bond stresses versus slippage for specimen SC600NS with shear studs are presented in Figure 6c. The bond stresses were calculated by dividing the applied load by the contact surface area. This analysis further confirms the accuracy of the concrete model utilized in all the conducted verifications. The percentage differences between the CDP model and the experimental results at the maximum capacity and failure point were found to be 2.8% and 11.5%, respectively. Figure 6d displays the stress distribution within the entire specimen (left) and the steel cage with struts (right).
Figure 6e illustrates the comparison between the axial load capacity and axial strain for specimen cc3a based on both the CDP model and experimental tests. Good agreement is observed between the two. The percentage differences between the calibrated CDP model and the experimental results were found to be 1.1% at maximum capacity and 4.2% at the failure point. Additionally, a numerical simulation using the DP constitutive model was conducted (not shown here). The results indicate that the DP model exhibits better agreement at the failure point compared to the CDP model; however, the overall behavior of the CDP model is deemed more reliable than the DP model. Furthermore, Figure 6f depicts the stress distribution within the entire specimen (left) and the inner tube section (right). The axial load versus axial strain relationship for specimen C3-1 is presented in Figure 6g. The calibrated CDP model demonstrates excellent agreement with the experimental results. The percentage differences between the CDP model and the experimental results at the failure point and maximum capacity were 2.4% and 1.9%, respectively. Furthermore, Figure 6h displays the stress distribution within the entire specimen (left) and the inner tube section (right).

5. Conclusions

This study presents an efficient method for simulating concrete behavior in composite structures, addressing a significant challenge in the field of simulation. The focus is on the concrete damage plasticity (CDP) model in comparison with experimental tests conducted by previous researchers as well as other simulation models, particularly the Drucker–Prager (DP) model. A simplified methodology using a sensitivity study is proposed to determine the most accurate parameters for the CDP model, ensuring reliable and realistic simulations.
The validity of the CDP model is demonstrated through the analysis of six specimens in four different categories. To obtain the optimal parameters and model properties, an extensive sensitivity analysis is performed, considering factors such as the mesh size, dilation angle, and K c factor. The results of the finite element simulations are compared with experimental data in terms of axial load versus strain, load versus mid-span deflection, and bond stresses versus slippage for various specimen types.
Remarkable agreement is achieved between the finite element and experimental results across all specimen categories, affirming the accuracy and validity of the calibrated CDP model. Moreover, the comparison between the CDP and DP models reveals distinct concrete behaviors, with the CDP model demonstrating greater reliability in predicting concrete response. This highlights the significance of employing the CDP model for analyzing various types of concrete structures under different loading conditions encompassing both static and dynamic scenarios.
The development of a reliable damage CDP simulation model holds immense value in the analysis of concrete structures, enabling the evaluation of their behavior at different scales and providing more accurate results. An important aspect of this study is the ability to define the necessary CDP parameters without relying on extensive experimental work by instead leveraging the knowledge of the concrete’s compressive strength ( f c ). This practical and economical approach emphasizes the core principle of simulation, namely, simplicity.
Overall, this research contributes to advancing the understanding and modeling of concrete behavior in composite structures, offering a robust and efficient approach for simulating and predicting the response under various loading conditions.
In addition to the CDP model explored in this paper, for which we used the Abaqus finite element package, there exist several other constitutive models and software packages that are frequently utilized by researchers and practitioners. Future work could extend the research presented here to incorporate these alternative models and investigate the variability between different software packages (i.e., model-to-model variability). Such a study would provide valuable insights into the complexity of different constitutive models, the accuracy of their results, and the simplicity of model calibration. Furthermore, although the current results focus on static loading conditions for composite structures, it is crucial to explore the behavior under dynamic loading as well. This would involve calibrating additional parameters in order to accurately capture dynamic effects, making the calibration process more intricate. Therefore, future studies should consider the optimization of dynamic material properties and model parameters to enhance the understanding and prediction of dynamic responses in steel–concrete composite structures. Moreover, it is recommended that different load cases be explored and analyzed, including eccentric loading and bending loading, in order to gain a deeper understanding of the behavior of the concrete model under varied loading conditions. By investigating these additional load cases, knowledge of the model’s performance can be enhanced and its accuracy and reliability can be assessed in more complex scenarios.

Author Contributions

Conceptualization, K.A.B., M.A.H.-A., M.M., C.T. and T.F.; Methodology, K.A.B. and M.M.; Software, K.A.B.; Validation, M.A.H.-A. and T.F.; Formal analysis, K.A.B.; Investigation, K.A.B., M.A.H.-A. and M.M.; Resources, M.M. and C.T.; Data curation, C.T.; Writing—original draft, K.A.B.; Writing—review & editing, M.A.H.-A. and T.F.; Visualization, K.A.B. and M.A.H.-A.; Funding acquisition, M.A.H.-A. All authors have read and agreed to the published version of the manuscript.

Funding

This research received no external funding.

Data Availability Statement

Data available on reasonable request from the first or corresponding authors.

Conflicts of Interest

The authors declare no conflict of interest.

References

  1. Willam, K.; Pramono, E.; Stur, S. Fundamental issues of smeared crack models. In Proceedings of the SEM-RILEM International Conference on Fracture of Concrete and Rock, Houston, TX, USA, 17–19 June 1987; Shah, S.P., Swartz, S.E., Eds.; Springer: New York, NY, USA, 1987; pp. 192–207. [Google Scholar]
  2. Malvar, L.; Fourney, M. A three dimensional application of the smeared crack approach. Eng. Fract. Mech. 1990, 35, 251–260. [Google Scholar] [CrossRef]
  3. Weihe, S.; Kroplin, B.; DeBorst, R. Classification of smeared crack models based on material and structural properties. Int. J. Solids Struct. 1998, 35, 1289–1308. [Google Scholar] [CrossRef]
  4. Cervera, M.; Chiumenti, M. Smeared crack approach: Back to the original track. Int. J. Numer. Anal. Methods Geomech. 2006, 30, 1173–1199. [Google Scholar] [CrossRef]
  5. Hariri-Ardebili, M.; Seyed-Kolbadi, S. Seismic cracking and instability of concrete dams: Smeared crack approach. Eng. Fail. Anal. 2015, 52, 45–60. [Google Scholar] [CrossRef]
  6. Jirásek, M.; Bazant, Z.P. Inelastic Analysis of Structures; John Wiley & Sons: Hoboken, NJ, USA, 2001. [Google Scholar]
  7. Chen, W.F.; Han, D.J. Plasticity for Structural Engineers; J. Ross Publishing: New York, NY, USA, 2007. [Google Scholar]
  8. Cedolin, L. Stability of Structures: Elastic, Inelastic, Fracture and Damage Theories; World Scientific: Singapore, 2010. [Google Scholar]
  9. Bittnar, Z.; Šejnoha, J. Numerical Methods in Structural Mechanics; Thomas Telford: London, UK, 1996. [Google Scholar]
  10. Bažant, Z.P.; Planas, J. Fracture and Size Effect in Concrete and Other Quasibrittle Materials; Routledge: London, UK, 2019. [Google Scholar]
  11. Bažant, Z.P.; Caner, F.C.; Carol, I.; Adley, M.D.; Akers, S.A. Microplane model M4 for concrete. I: Formulation with work-conjugate deviatoric stress. J. Eng. Mech. 2000, 126, 944–953. [Google Scholar] [CrossRef] [Green Version]
  12. Caner, F.C.; Bažant, Z.P. Microplane model M7 for plain concrete. I: Formulation. J. Eng. Mech. 2013, 139, 1714–1723. [Google Scholar] [CrossRef]
  13. Cervenka, J.; Chandra, J.; Saouma, V. Mixed Mode Fracture of Cementitious Bimaterial Interfaces; Part II: Numerical Simulation. Eng. Fract. Mech. 1998, 60, 95–107. [Google Scholar] [CrossRef]
  14. Ngo, D.; Scordelis, A.C. Finite element analysis of reinforced concrete beams. J. Proc. 1967, 64, 152–163. [Google Scholar]
  15. Belytschko, T.; Black, T. Elastic crack growth in finite elements with minimal remeshing. Int. J. Numer. Methods Eng. 1999, 45, 601–620. [Google Scholar] [CrossRef]
  16. Jirásek, M. Comparative study on finite elements with embedded discontinuities. Comput. Methods Appl. Mech. Eng. 2000, 188, 307–330. [Google Scholar] [CrossRef]
  17. Cusatis, G.; Pelessone, D.; Mencarelli, A. Lattice discrete particle model (LDPM) for failure behavior of concrete. I: Theory. Cem. Concr. Compos. 2011, 33, 881–890. [Google Scholar] [CrossRef]
  18. Rots, J.G.; Blaauwendraad, J. Crack models for concrete, discrete or smeared? Fixed, multi-directional or rotating? In HERON; Delft University of Technology: Delft, The Netherlands, 1989; Volume 34. [Google Scholar]
  19. Rots, J.G. Smeared and discrete representations of localized fracture. In Current Trends in Concrete Fracture Research; Springer: Dordrecht, The Netherlands, 1991; pp. 45–59. [Google Scholar]
  20. Willam, K.; Carol, I.; UPC, B. Discrete Versus smeared crack analysis. In Proceedings of the 2nd International Association of Fracture Mechanics for Concrete and Concrete Structures, Zurich, Switzerland, 25–28 July 1995. [Google Scholar]
  21. Borst, R.d.; Remmers, J.J.; Needleman, A.; Abellan, M.A. Discrete vs smeared crack models for concrete fracture: Bridging the gap. Int. J. Numer. Anal. Methods Geomech. 2004, 28, 583–607. [Google Scholar] [CrossRef]
  22. Hariri-Ardebili, M.; Saouma, V. Sensitivity and Uncertainty Quantification of the Cohesive Crack Model. Eng. Fract. Mech. 2016, 155, 18–35. [Google Scholar] [CrossRef]
  23. Bejarano-Urrego, L.; Verstrynge, E.; Giardina, G.; Van Balen, K. Crack growth in masonry: Numerical analysis and sensitivity study for discrete and smeared crack modelling. Eng. Struct. 2018, 165, 471–485. [Google Scholar] [CrossRef]
  24. Dias-da Costa, D.; Cervenka, V.; Graça-e Costa, R. Model uncertainty in discrete and smeared crack prediction in RC beams under flexural loads. Eng. Fract. Mech. 2018, 199, 532–543. [Google Scholar] [CrossRef]
  25. Rimkus, A.; Cervenka, V.; Gribniak, V.; Cervenka, J. Uncertainty of the smeared crack model applied to RC beams. Eng. Fract. Mech. 2020, 235, 107088. [Google Scholar] [CrossRef]
  26. Jendele, L.; Cervenka, J.; Saouma, V.; Pukl, R. On the choice between discrete or smeared approach in practical structural FE analyses of concrete structures. In Proceedings of the Fourth International Conference on Analysis of Discontinuous Deformation Glasgow, Scotland, UK, 6–8 June 2001. [Google Scholar]
  27. Dahmani, L.; Khennane, A.; Kaci, S. Crack identification in reinforced concrete beams using ANSYS software. Strength Mater. 2010, 42, 232–240. [Google Scholar] [CrossRef]
  28. Esfahani, M.R.; Rangan, B.V. Bond between normal strength and high-strength concrete (HSC) and reinforcing bars in splices in beams. Struct. J. 1998, 95, 272–280. [Google Scholar]
  29. Zuo, J.; Darwin, D. Splice Strength of Conventional and High Relative Rib Area Bars in Normal and High-Strength Concrete; American Concrete Institute: Farmington Hills, MI, USA, 2000. [Google Scholar]
  30. Harajli, M. Comparison of bond strength of steel bars in normal-and high-strength concrete. J. Mater. Civ. Eng. 2004, 16, 365–374. [Google Scholar] [CrossRef]
  31. Cairns, J.; Abdullah, R.B. Bond strength of black and epoxy-coated reinforcement-a theoretical approach. Mater. J. 1996, 93, 362–369. [Google Scholar]
  32. Wang, X.; Liu, X. A strain-softening model for steel–concrete bond. Cem. Concr. Res. 2003, 33, 1669–1673. [Google Scholar] [CrossRef]
  33. Canbay, E.; Frosch, R.J. Bond strength of lap-spliced bars. ACI Struct. J. 2005, 102, 605. [Google Scholar]
  34. Wang, H. An analytical study of bond strength associated with splitting of concrete cover. Eng. Struct. 2009, 31, 968–975. [Google Scholar] [CrossRef]
  35. Huang, Q.; Gardoni, P.; Trejo, D.; Pagnotta, A. Probabilistic model for steel–concrete bond behavior in bridge columns affected by alkali silica reactions. Eng. Struct. 2014, 71, 1–11. [Google Scholar] [CrossRef]
  36. Yu, B.; Tang, R.k.; Li, B. Probabilistic bond strength model for reinforcement bar in concrete. Probabilistic Eng. Mech. 2020, 61, 103079. [Google Scholar] [CrossRef]
  37. Jankowiak, T.; Lodygowski, T. Identification of parameters of concrete damage plasticity constitutive model. Found. Civ. Environ. Eng. 2005, 6, 53–69. [Google Scholar]
  38. Syed, S.; Gupta, A. Seismic fragility of RC shear walls in nuclear power plant part 1: Characterization of uncertainty in concrete constitutive model. Nucl. Eng. Des. 2015, 295, 576–586. [Google Scholar] [CrossRef]
  39. Engen, M.; Hendriks, M.A.; Köhler, J.; Øverli, J.A.; Åldstedt, E. A quantification of the modelling uncertainty of non-linear finite element analyses of large concrete structures. Struct. Saf. 2017, 64, 1–8. [Google Scholar] [CrossRef]
  40. Cervenka, V.; Cervenka, J.; Kadlec, L. Model uncertainties in numerical simulations of reinforced concrete structures. Struct. Concr. 2018, 19, 2004–2016. [Google Scholar] [CrossRef]
  41. Hariri-Ardebili, M.; Saouma, V. Sensitivity and uncertainty analysis of AAR affected reinforced concrete shear walls. Eng. Struct. 2018, 172, 334–345. [Google Scholar] [CrossRef]
  42. Castaldo, P.; Gino, D.; Bertagnoli, G.; Mancini, G. Partial safety factor for resistance model uncertainties in 2D non-linear finite element analysis of reinforced concrete structures. Eng. Struct. 2018, 176, 746–762. [Google Scholar] [CrossRef]
  43. Bovo, M.; Buratti, N. Evaluation of the variability contribution due to epistemic uncertainty on constitutive models in the definition of fragility curves of RC frames. Eng. Struct. 2019, 188, 700–716. [Google Scholar] [CrossRef]
  44. Schneider, S.P. Axially loaded concrete-filled steel tubes. J. Struct. Eng. 1998, 124, 1125–1138. [Google Scholar] [CrossRef]
  45. Hajjar, J.F.; Schiller, P.H.; Molodan, A. A distributed plasticity model for concrete-filled steel tube beam-columns with interlayer slip. Eng. Struct. 1998, 20, 663–676. [Google Scholar] [CrossRef]
  46. Varma, A.H.; Ricles, J.M.; Sause, R.; Lu, L.W. Seismic behavior and modeling of high-strength composite concrete-filled steel tube (CFT) beam–columns. J. Constr. Steel Res. 2002, 58, 725–758. [Google Scholar] [CrossRef]
  47. Hu, H.T.; Huang, C.S.; Wu, M.H.; Wu, Y.M. Nonlinear analysis of axially loaded concrete-filled tube columns with confinement effect. J. Struct. Eng. 2003, 129, 1322–1329. [Google Scholar] [CrossRef] [Green Version]
  48. Kostic, S.M.; Filippou, F.C.; Deretic-Stojanovic, B. Generalized plasticity model for inelastic RCFT column response. Comput. Struct. 2016, 168, 56–67. [Google Scholar] [CrossRef]
  49. Zhou, X.; Yan, B.; Liu, J. Behavior of square tubed steel reinforced-concrete (SRC) columns under eccentric compression. Thin-Walled Struct. 2015, 91, 129–138. [Google Scholar] [CrossRef]
  50. Lai, Z.; Varma, A.H. Effective stress-strain relationships for analysis of noncompact and slender filled composite (CFT) members. Eng. Struct. 2016, 124, 457–472. [Google Scholar] [CrossRef]
  51. Wang, Y.; Chen, G.; Wan, B.; Han, B.; Ran, J. Axial compressive behavior and confinement mechanism of circular FRP-steel tubed concrete stub columns. Compos. Struct. 2021, 256, 113082. [Google Scholar] [CrossRef]
  52. Wei, Y.; Jiang, C.; Wu, Y.F. Confinement effectiveness of circular concrete-filled steel tubular columns under axial compression. J. Constr. Steel Res. 2019, 158, 15–27. [Google Scholar] [CrossRef]
  53. Le Hoang, A.; Fehling, E. Numerical study of circular steel tube confined concrete (STCC) stub columns. J. Constr. Steel Res. 2017, 136, 238–255. [Google Scholar] [CrossRef]
  54. Wang, J.; Cheng, L.; Yang, J. Compressive behavior of CFRP-steel composite tubed steel-reinforced columns with high-strength concrete. J. Constr. Steel Res. 2018, 150, 354–370. [Google Scholar] [CrossRef]
  55. Chen, Y.; Wang, K.; He, K.; Wei, J.; Wan, J. Compressive behavior of CFRP-confined post heated square CFST stub columns. Thin-Walled Struct. 2018, 127, 434–445. [Google Scholar] [CrossRef]
  56. Darwin, D.; Pecknold, D.A. Nonlinear biaxial stress-strain law for concrete. J. Eng. Mech. Div. 1977, 103, 229–241. [Google Scholar] [CrossRef]
  57. Han, L.H.; Huo, J.s. Concrete-filled hollow structural steel columns after exposure to ISO-834 fire standard. J. Struct. Eng. 2003, 129, 68–78. [Google Scholar] [CrossRef]
  58. Resende, L.; Martin, J.B. Formulation of Drucker-Prager cap model. J. Eng. Mech. 1985, 111, 855–881. [Google Scholar] [CrossRef] [Green Version]
  59. Genikomsou, A.S.; Polak, M.A. Finite element analysis of punching shear of concrete slabs using damaged plasticity model in ABAQUS. Eng. Struct. 2015, 98, 38–48. [Google Scholar] [CrossRef]
  60. ABAQUS. ABAQUS Version 6.14—Documentation Manual; ABAQUS: Providence, RI, USA, 2014. [Google Scholar]
  61. Hafezolghorani, M.; Hejazi, F.; Vaghei, R.; Jaafar, M.S.B.; Karimzade, K. Simplified damage plasticity model for concrete. Struct. Eng. Int. 2017, 27, 68–78. [Google Scholar] [CrossRef]
  62. Lee, J.; Fenves, G.L. Plastic-damage model for cyclic loading of concrete structures. J. Eng. Mech. 1998, 124, 892–900. [Google Scholar] [CrossRef]
  63. Tao, Z.; Song, T.Y.; Uy, B.; Han, L.H. Bond behavior in concrete-filled steel tubes. J. Constr. Steel Res. 2016, 120, 81–93. [Google Scholar] [CrossRef]
  64. Pagoulatou, M.; Sheehan, T.; Dai, X.; Lam, D. Finite element analysis on the capacity of circular concrete-filled double-skin steel tubular (CFDST) stub columns. Eng. Struct. 2014, 72, 102–112. [Google Scholar] [CrossRef] [Green Version]
  65. Li, W.; Ren, Q.X.; Han, L.H.; Zhao, X.L. Behaviour of tapered concrete-filled double skin steel tubular (CFDST) stub columns. Thin-Walled Struct. 2012, 57, 37–48. [Google Scholar] [CrossRef]
  66. Desayi, P.; Krishnan, S. Equation for the stress-strain curve of concrete. J. Proc. 1964, 61, 345–350. [Google Scholar]
  67. Mander, J.; Priestley, M.; Park, R. Observed stress-strain behavior of confined concrete. J. Struct. Eng. 1988, 114, 1827–1849. [Google Scholar] [CrossRef]
  68. Vermeer, P. Non-associated plasticity for soils, concrete and rock. In Physics of Dry Granular Media; Springer: Dordrecht, The Netherlands, 1998; pp. 163–196. [Google Scholar]
  69. Wu, J.Y.; Li, J.; Faria, R. An energy release rate-based plastic-damage model for concrete. Int. J. Solids Struct. 2006, 43, 583–612. [Google Scholar] [CrossRef] [Green Version]
  70. Voyiadjis, G.Z.; Taqieddin, Z.N.; Kattan, P.I. Theoretical formulation of a coupled elastic—Plastic anisotropic damage model for concrete using the strain energy equivalence concept. Int. J. Damage Mech. 2009, 18, 603–638. [Google Scholar] [CrossRef]
Figure 1. Stress–strain relationship for the concrete damage plasticity model in compression and tension [61].
Buildings 13 01759 g001
Figure 2. Visualization of geometries, boundary conditions, finite element meshes, and interaction surfaces; no scale. (a) Model geometry and boundary conditions; (b) interaction surfaces between studs and case inner face; (c) mesh pattern; (d) mesh of concrete in SC600NS; and (e) studs on steel section flange (left: STSRC-2.0-0-S; right: SC600NS).
Buildings 13 01759 g002
Figure 3. Axial load vs. axial strain for two specimens, including the stress distribution in steel cage and concrete core in MPa for both specimens: (a) CU-70, load–strain curves; (b) SU-150, load–strain curves; (c) CU-70, stress distribution; (d) SU-150, stress distribution.
Buildings 13 01759 g003
Figure 4. Sensitivity analysis results in terms of axial load vs. axial strain for CU-70 specimen: (a) mesh size, (b) dilation angle, and (c) shape of the yield surface.
Buildings 13 01759 g004
Figure 5. Updated axial load vs. axial strain for two specimen after performing sensitivity analysis and calibration: (a) CU-70 and (b) SU-150.
Buildings 13 01759 g005
Figure 6. Generalized capacity curves for four new specimen after model calibration, including the stress distribution in MPa: (a) capacity curve, STSRC-2.0-0-S; (b) stress distribution, STSRC-2.0-0-S; (c) capacity curve, SC600NS; (d) stress distribution, SC600NS; (e) capacity curve, cc3a; (f) stress distribution, cc3a; (g) capacity curve, C3-1; (h) stress distribution, C3-1.
Buildings 13 01759 g006
Table 1. Collected experimental models from [47,49,64,65].
SpecimenCross-SectionD or B [mm]D/tL [mm] f c [MPa] f y [MPa]
CU-70Circular2807084031.15272.6
SU-150Square30015084027.27341.7
STSRC-2.0-0-SSquare200100120061.1290.1
SC600NSSquare60060180054.4356
cc3aCircular1806054047.4275.9
C3-1Circular35086105042.5439.3
Disclaimer/Publisher’s Note: The statements, opinions and data contained in all publications are solely those of the individual author(s) and contributor(s) and not of MDPI and/or the editor(s). MDPI and/or the editor(s) disclaim responsibility for any injury to people or property resulting from any ideas, methods, instructions or products referred to in the content.

