Article

Time-Varying Evolution Behaviors of Steel–Concrete Composite Girders with Differentiated Connectors

1
School of Civil Engineering, North China University of Technology, Beijing 100144, China
2
Department of Civil Engineering, Tsinghua University, Beijing 100084, China
3
China-Road Transportation Verification & Inspection Hi-Tech Co., Ltd., Beijing 100088, China
4
China Construction Infrastructure Co., Ltd., Beijing 100029, China
*
Author to whom correspondence should be addressed.
Buildings 2023, 13(5), 1137; https://doi.org/10.3390/buildings13051137
Submission received: 21 March 2023 / Revised: 12 April 2023 / Accepted: 20 April 2023 / Published: 24 April 2023
(This article belongs to the Special Issue Steel-Concrete Composite Structures: Design and Construction)

Abstract

:
To improve the cracking resistance of a concrete slab in the hogging moment region, a new concept called uplift-restricted and slip-permitted (URSP) connection technology has been proposed. Several studies have been conducted on URSP connectors, but investigations into the time-varying evolution behaviors of composite beams with URSP connectors are still lacking. In this paper, three types of elaborate finite element models of composite girders with differentiated connectors and different construction methods were established. Simulation of the concrete shrinkage and creep effect was realized using a user subroutine based on an improved rate-type formulation. The performances of the composite girders in three schemes were analyzed and compared in both the construction and service stages. The results demonstrated that the URSP connection technique can effectively increase the prestressing efficiency and decrease the tensile stress of the concrete induced by dead loads and vehicle loads. With an increasing service time, the concrete shrinkage effect will enhance the advantage of the URSP connection technique, and the creep effect will reduce this advantage. Finally, parametric analyses were conducted, and a value of 0.2 is recommended for the URSP length ratio to promote practical applications.

1. Introduction

Steel–concrete composite girder bridges can benefit from the advantages of both concrete and steel materials; thus, they have been widely used in railway and highway bridges [1,2,3,4,5,6,7,8]. However, in the hogging moment region of continuous composite girder bridges, the composite action between the steel girder and the concrete slab induces an adverse state of tension in the concrete and compression in the steel girder [3,9,10,11]. In addition, the tensile stress in the concrete slab caused by concrete shrinkage and the creep effect cannot be effectively released due to the constraint of the shear connector, which has a negative influence on the long-term performance and durability of the composite girder system.
The crack resistance of composite girder bridges has attracted wide engineering and academic attention. Currently, the technical means to address the cracking of concrete slabs in composite girders mainly include increasing the reinforcement ratio, longitudinal prestressing, adopting grouped stud connectors, and optimizing construction [8,11,12]. However, a large reinforcement ratio will affect the pouring quality of the concrete. When prestressing technology is adopted, the applied longitudinal prestressing force will be transferred to the steel girder through the shear connectors, thus significantly reducing the compressive prestress in the concrete slab. To improve the prestressing efficiency, grouped stud connectors combined with post-connected construction have been proposed [8,9,10,11,12,13]. The concrete in the precast holes is poured, and the concrete slab and the steel girder are connected after longitudinal prestressing. However, the arrangement of grouped stud connectors will affect the structural integrity of the composite girder, and no effective anti-uplift action exists in the steel–concrete interface between adjacent group studs. Moreover, the concrete in the precast hole has no prestress, and the tensile stress in the concrete slab caused by the pavement loads, vehicle loads, concrete shrinkage, and the creep effect still cannot be effectively released.
In recent years, Nie et al. [14] have proposed a new concept for the crack-resistant design of concrete slabs in the hogging moment region of composite structures, namely, uplift-restricted and slip-permitted (URSP) connection technology. Traditional stud connectors provide both shear and uplift resistance at the steel–concrete interface, and the shear resistance of stud connectors is the fundamental reason for the tensile stress of concrete slabs in the negative moment region of composite structures. The URSP connectors can effectively reduce the tensile stress of concrete slabs by permitting free slip at the steel–concrete interface. Meanwhile, the uplift restriction of the connector is retained to prevent the separation of the steel girder and the concrete slab. Two types of URSP connectors have been proposed [15,16,17], as shown in Figure 1.
Several studies have been conducted on the short-term performance of URSP connectors. The results of push-out tests [16] demonstrated that URSP-T connectors (Figure 1) realized permitted slip and restricted uplift at the steel–concrete interface. Therefore, a load–slip curve for this type of connector and a hysteresis model were proposed. Experimental studies on simply supported beams and two continuous composite beams with URSP-S connectors were also conducted [18]. The test results showed that URSP connectors significantly improved the crack resistance of concrete slabs and hardly affected the load capacity of composite beams. In addition, the behaviors of the steel–concrete composite frame, in which the URSP-S connectors were applied in the hogging moment regions, were investigated by using a finite element (FE) analysis [19]. Suggestions for the design and construction of URSP connectors were proposed based on research on a three-span continuous composite girder bridge. Based on the research above, URSP connectors have also been applied in practical engineering and have demonstrated good application effects [16,17].
Previous studies have focused on the short-term performances of URSP connectors and composite beams with URSP connectors. However, the actual stress state of the concrete slab is significantly affected by the construction scheme, and the shrinkage and creep effects. In addition, it is difficult to predict these effects in composite girders in which both the stud and URSP connectors are applied. Therefore, it is quite necessary to investigate the time-varying evolution behaviors of steel–concrete composite girders with differentiated connectors. The main contribution of this work includes: (1) Developing elaborate finite element models of composite girders with different construction schemes and connectors; (2) Revealing the creep and shrinkage effects on the behaviors of the composite girders with differentiated connectors in both the construction and service stages; and (3) Design suggestions for URSP connectors based on the results of parametric analyses.

2. Elaborate FE Modeling

2.1. User Subroutine UMAT for Creep and Shrinkage Effects

Currently, a one-dimensional (1D) FE model is generally applied to analyze the behaviors of composite girders in practical designs. However, this simplified model has several limitations in simulation analysis. For example, the shear lag effect cannot be reasonably considered in the 1D analysis, which may lead to significant errors when estimating the long-term behavior of the composite girders [20,21]. In addition, the concrete shrinkage and creep effects are often ignored or simulated by simplistic methods in 1D models, which are incapable of accurately predicting the long-term performance of composite girders. Therefore, in this paper three-dimensional (3D) FE models for composite girders were established in ABAQUS, and the concrete shrinkage and creep were considered by using the user subroutine UMAT.
In recent years, researchers have developed several analytical models and proposed numerical analysis methods for the concrete shrinkage and creep effect [22,23,24,25,26,27,28,29,30]. To avoid the high cost of storing a complex stress history in the concrete creep analysis, the rate-type algorithm proposed by Yu et al. [31] was adopted in the user subroutine. As the rate-type algorithm is unconditionally stable, the step size can be larger, resulting in a high calculation efficiency. The Kelvin rheological model was adopted to simulate the creep behavior of the concrete, the basic mechanical formula of which can be expressed as:
E ε t + η ε ˙ t = σ t
where E is Young’s modulus, ε is the concrete strain, η is the viscosity, and σ is the concrete stress. When the compliance function J(t,t0) is expanded by the Dirichlet series, it can be expressed as:
J t , t 0 = 1 E 0 + i = 1 m 1 D i t 0 1 exp t t 0 τ i
where τi represents the retardation times, and it is recommended that τ1 = 1, τ2 = 10, τ3 = 100, and τ4 = 1000 [32]. According to Bazant [32], this can achieve an acceptable accuracy when m equals 4. Di is the distinctive moduli. When considering the aging effect of the concrete, we can obtain the following:
ε ˙ i ( t ) + τ i ε ¨ i ( t ) = σ ˙ ( t ) D i ( t )
Equation (3) is rewritten in the form of the Kelvin model as:
γ ˙ i ( t ) + 1 τ i γ i ( t ) = σ ˙ t D i t
where the intermediate variable γi(t) is:
γ i ( t ) = τ i ε ˙ i ( t )
Based on time discretion, when considering the step from tn to tn+1, the corresponding increments are: Δt = tn+1tn, Δσ = σ(tn+1) − σ(tn), Di(n+1)/2 = Di(tn + Δt/2). Then, the above formula can be approximately expressed as:
γ ˙ i ( t ) + 1 τ i γ i ( t ) = Δ σ Δ t D i n + 1 / 2
The special solution of the equation is:
γ i ( t ) = τ i Δ σ Δ t D i n + 1 / 2 1 exp t t n τ i + γ i ( n ) exp t t n τ i
The following recurrence relation can be obtained:
γ i ( n + 1 ) = λ i Δ σ D i n + 1 / 2 + β i γ i ( n )
where
β i = exp Δ t τ i λ i = τ i Δ t 1 β i
Then, the strain component can be obtained by integrating Equation (8):
Δ ε i = 1 τ i t n t n + 1 γ i t dt = 1 λ i D i n + 1 / 2 Δ σ + 1 β i γ i ( n )
By summing the strain components, the total strain increment can be expressed as:
Δ ε = i = 0 m Δ ε i = i = 0 m 1 λ i D i n + 1 / 2 + 1 E 0 Δ σ + i = 0 m 1 β i γ i ( n )
where the first term is essentially a linear term [32]. Accordingly, the concept of the incremental elastic modulus E ¯ is defined as [32]:
1 E ¯ = i = 0 m 1 λ i D i n + 1 / 2 + 1 E 0
The second term in Equation (11) is the strain increment due to concrete creep:
Δ ε c = i = 0 m 1 β i γ i ( n )
The stress increment in each step can be expressed as:
Δ σ = E ¯ Δ ε Δ ε c
The recurrence relation of the intermediate variables γ i ( n + 1 ) and γ i ( n ) can be obtained according to Equations (6) and (14), and then an increment step is completed.
According to the above algorithm, a UMAT subroutine was developed to calculate the concrete shrinkage and creep effect based on ABAQUS 2019. A flow chart of the user subroutine is illustrated in Figure 2. When using the subroutine, the concrete parameters can be defined in the material module directly, including the elastic modulus, Poisson’s ratio, standard value of the concrete cube compressive strength, theoretical thickness of components, relative humidity, loading age, etc.

2.2. Elaborate FE Modeling Considering the Construction Stages

A three-span continuous composite girder bridge, which was built in Shandong Province, China, was selected here to serve as an example to allow investigation of the concrete shrinkage and creep effect in composite girders with differentiated connectors. The elevation view of the bridge is shown in Figure 3a, and the span lengths were 45, 60, and 45 m. Figure 3b shows the typical cross section of the girder, consisting of three box girders. The depth and the total width of the concrete slab were 400 mm and 20.25 m, respectively. The height of the steel box girder was 2.1 m, the total girder height was 2.5 m, and the widths of the top and bottom flanges were 0.9 m and 3.5 m, respectively. The variation in the slab depth in the transverse direction only occurred in the cantilever part and can thus be neglected in the FE model.
According to the preliminary analysis results, each hogging moment region was determined to be 24 m long, as shown in Figure 3a. In the sagging moment regions, the thicknesses of the top flange, web, and bottom flange were 20 mm, 18 mm, and 30 mm, respectively, whereas in the hogging moment region, these thicknesses were 40 mm, 18 mm, and 30 mm, respectively. Solid plate diaphragms were arranged at a spacing of 4 m. The elastic modulus and Poisson’s ratio of the steel used for the steel girder were 206 GPa and 0.3, respectively; these two values were 34.5 GPa and 0.2 for the concrete used for the slabs. A total of 30 groups of prestressing tendons with a diameter of 15.24 mm were arranged in the concrete slab above each box girder in the hogging moment region. The prestressing stress of the tendon was 1750 MPa, the construction joints were 1 m long, and the uniformly distributed deck pavement load was 62 kN/m. The humidity was set as 80%, and concrete shrinkage started three days after casting.
To investigate the concrete shrinkage and creep effect in composite girders with differentiated connectors, three connection and construction schemes were considered:
(1) Scheme U refers to the scheme in which the URSP connectors were applied in the hogging moment regions and the normal shear studs were used in the sagging moment regions; (2) Scheme S refers to the scheme in which the normal shear studs were adopted for the entire length of the bridge, and integral cast in situ slabs were applied in the hogging moment regions; (3) Scheme P represents the scheme in which normal shear studs were adopted for the entire length of the bridge, but precast holes were arranged in the hogging moment regions, and the post-connected construction was adopted.
As shown in Figure 4, the major construction steps in the three schemes were as follows. (a) After erecting the steel girder, the precast concrete slab segments were placed onto the steel girder in the sagging moment regions. Concrete slab segments were connected to the steel girder through shear studs by pouring the high-strength cement into the precast holes. (b) The concrete slabs in the hogging moment regions were cast in place. In Scheme P, holes were preserved in the slab for post-connection of the concrete slab to the steel girder, while in Scheme S and Scheme U, the integral concrete slabs were cast. The curing of the concrete lasted for 7 days. (c) The tendons in the concrete slabs were prestressed. In Scheme P, the preserved holes were then filled with high-strength cement to connect the concrete slab to the steel girder. (d) The construction joints were cast to connect the sagging and hogging moment regions. (e) The deck pavement was constructed.
The element types and the 3D FE model are shown in Figure 5. The construction process of the concrete slab and the prestressing tendons was simulated by setting the activation state of the corresponding elements in the “interaction” module through the “model change” in each step. The prestressed tendons were tied to the concrete slab, and the prestressing force was applied by decreasing the temperature of the tendons. Surface-to-surface contact was adopted in order to simulate the interaction between the concrete slab and the steel girder, in which “hard contact” was selected to define the normal behavior for both the traditional shear studs and the URSP connectors. Only the URSP-S connectors were adopted, since this type of URSP connector is more convenient in construction and beam tests have been conducted [18] that could be used for the validation of the FE models. Different cohesion behaviors of the contacts were defined for different connectors. The cohesion stiffness in the longitudinal direction of the girder (the tangential direction of the surface contact) of the shear connectors was determined according to the stud shear stiffness k [5]:
k = 0.43 A st E c f c 0.7 A st γ s f
where Ast and f are the stud cross-sectional area and tension strength, respectively; γs is the ratio of the ultimate strength to the yield strength of the stud. The stiffness coefficient in the tangential direction was specified as 358.4 for shear studs and 0.11 for URSP-S connectors [19]. Meanwhile, the activation state of the contact could be specified in the interaction manager in ABAQUS.
In Scheme P, the preserved holes were filled with high-strength cement after prestressing the tendons in the concrete slab; thus, the contact that simulated the effect of shear studs was inactive before casting the construction joints. Therefore, a temporary boundary condition of vertical supports was added to the concrete slabs in the hogging moment regions in order to simulate the support provided by the steel tub girder. Furthermore, this boundary condition was inactive after the shear connection between the concrete slab and steel girder was created. The simulation of the post-connected construction could be realized.
To date, elaborate FE modeling of composite girders considering the construction stages for three schemes with different construction methods and interfacial connectors has been accomplished through the comprehensive use of the model change, surface-to-surface contact, and boundary conditions in ABAQUS.

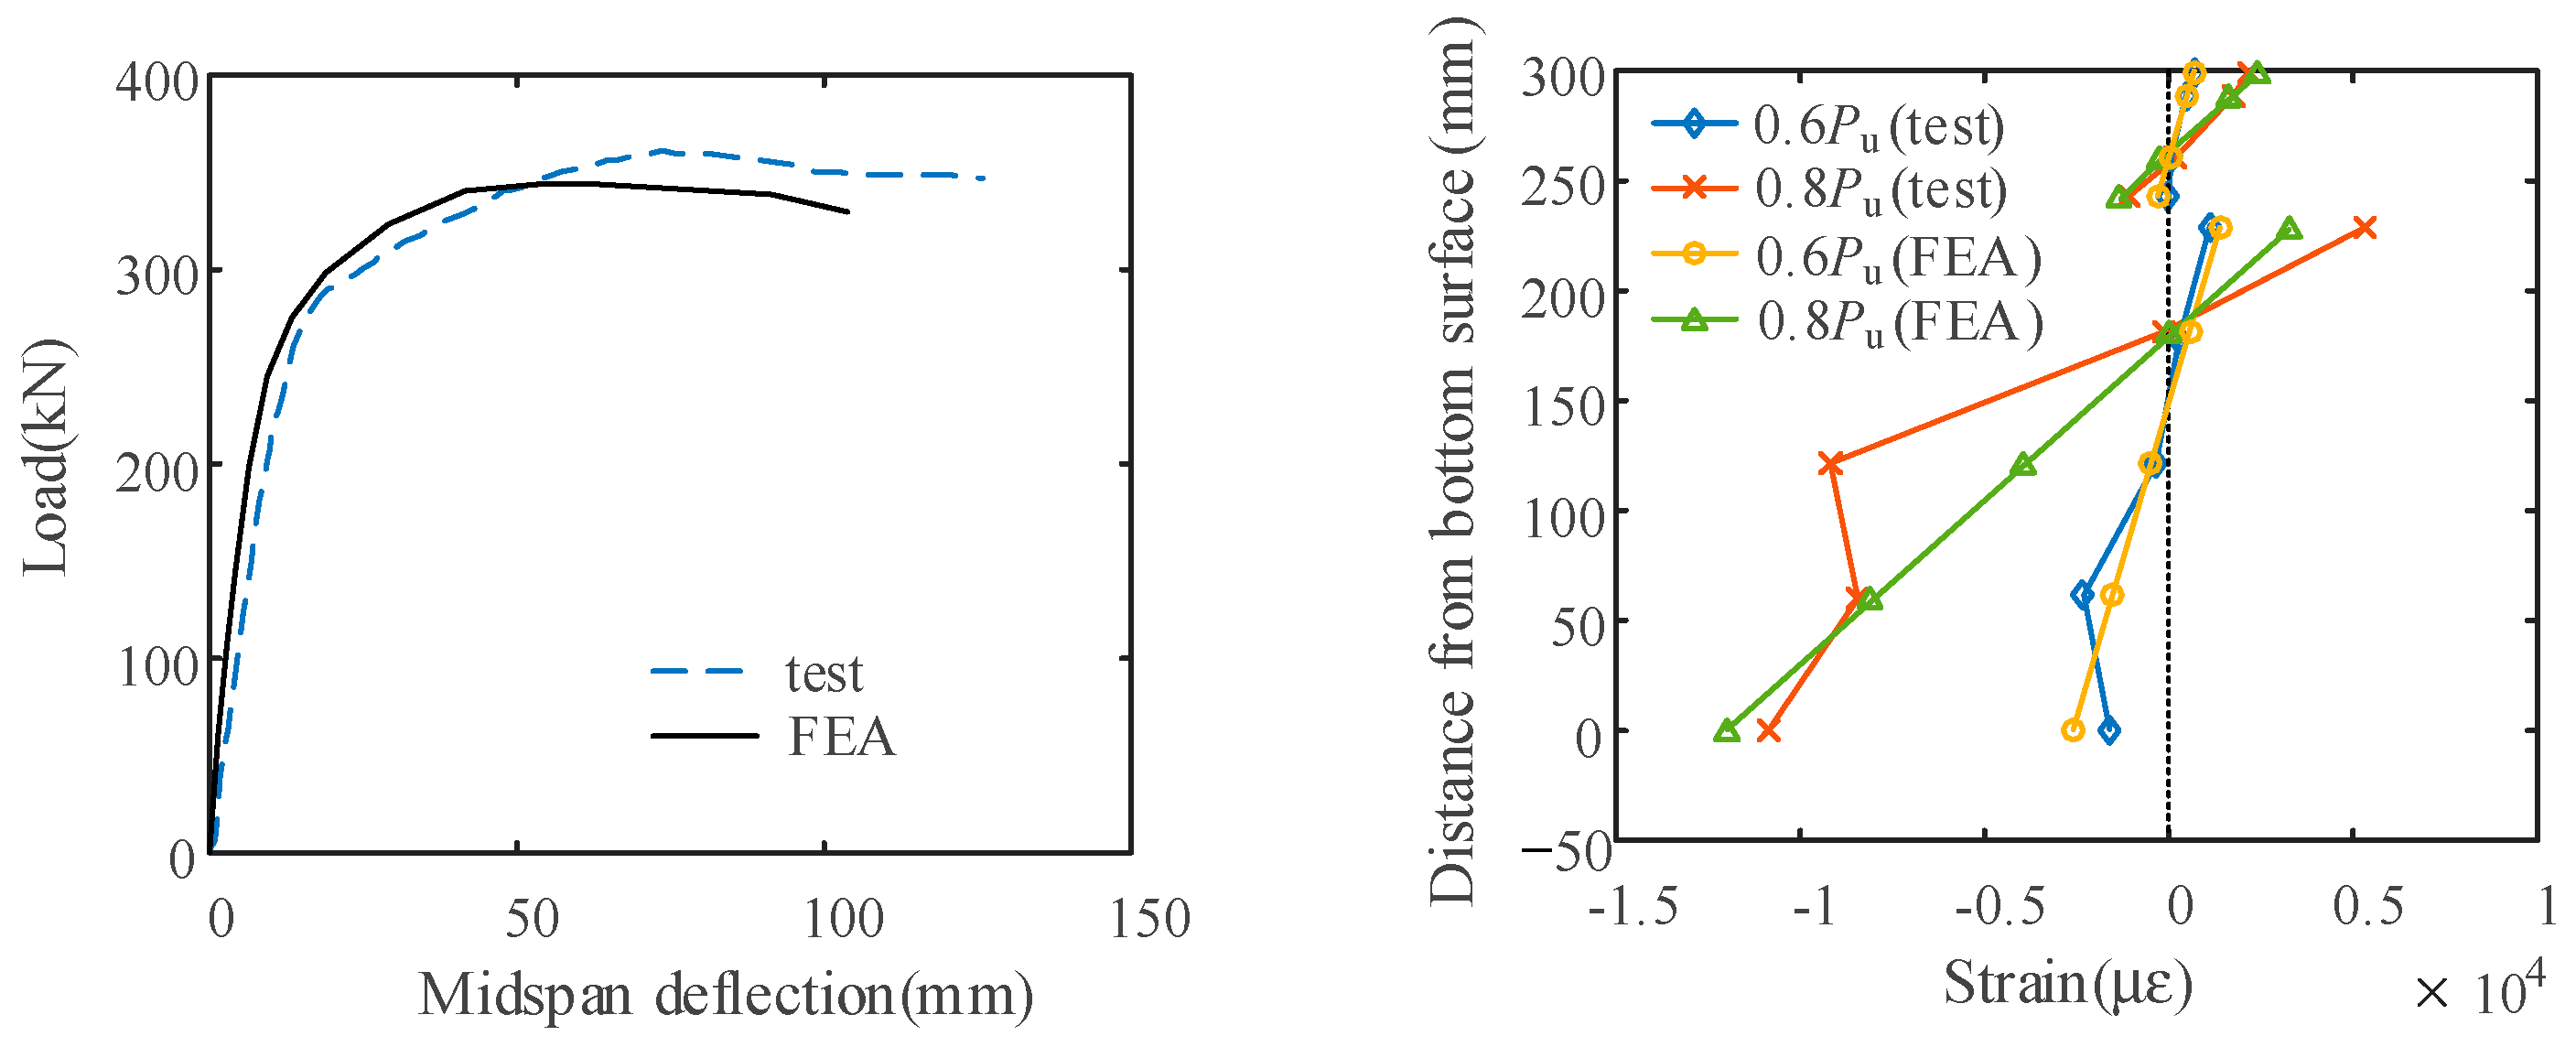
2.3. Validation of the FE Modeling

(1)
Prediction model for concrete shrinkage and creep
Numerous prediction models for concrete shrinkage and creep have been proposed in recent decades, among which, the commonly used models include that used in the CEB-FIP Model Code 90 [33] (the CEP90 model), that used in the CEB-FIP Model Code 2010 [34] (the CEP10 model), that adopted by the American Concrete Institute [35] (the ACI model), that proposed by Bazant et al. [36] (the B4s model), and that proposed by Gardner and Lockman [37] (the GL2000 model). To verify the modeling strategies, and shrinkage and creep prediction models for composite beams, long-term tests of composite beams were collected from the literature. The parameters of these specimens are shown in Table A1 in the Appendix A.
A comparison of the results obtained from the tests and FE analyses is shown in Figure 6. There are relatively few parameters required for CEP90, B4s, and GL2000, while the parameters of some specimens required by the ACI model have not been reported in the corresponding literature. It is worth noting that in Xue et al. [38], 90 days after the first loading (7.37 kN/m), a secondary loading of 5.23 kN/m was applied on the specimens. For specimen CB2 in the study of Al-deen et al. [39], an external load (13.4 kN/m) was applied at 29 days after the concrete pour. The corresponding finite element models also adopted two-stage loading. The following conclusions can be drawn: (1) The FE models can accurately simulate the behavior of the composite beams; (2) In different tests, the best prediction model was not the same; and (3) Within the duration of the experiment, each prediction model could provide acceptable predictions for the deflection. Based on comprehensive consideration of the complexity and accuracy of the model, the CEP90 model was adopted to predict the concrete creep and shrinkage effect for steel–concrete composite girder bridges in this study. According to the CEP90 model, the shrinkage strain of concrete can be calculated as follows:
ε cs ( t , t s ) = ε c s o · β s ( t t s )
ε cso = ε c s ( f c m ) · β R H
ε s ( f c m ) = 160 + 10 β s c ( 9 f c m / f c m o ) · 10 6
β R H = 1.55 1 ( R H / R H 0 ) 3
β s ( t t s ) = ( t t s ) / t 1 350 ( h / h 0 ) 2 + ( t t s ) / t 1 0.5
where ecs(t, ts) is the shrinkage strain at the age of t; ts is the age of concrete at the beginning of shrinkage (d), which is assumed to be 3 d; bBH denotes the coefficient related to the annual average relative humidity (applicable for 40% ≤ RH < 99%); RH is the annual average relative humidity of the environment (%); and RH0 = 100%. The meaning of other symbols can be found in the CEB-FIP Model Code 90 [33]. It can be observed that the lower the relative humidity of the environment, the greater the shrinkage strain of the concrete, and the humidity was set as 80% in the finite element model as a typical condition.
(2)
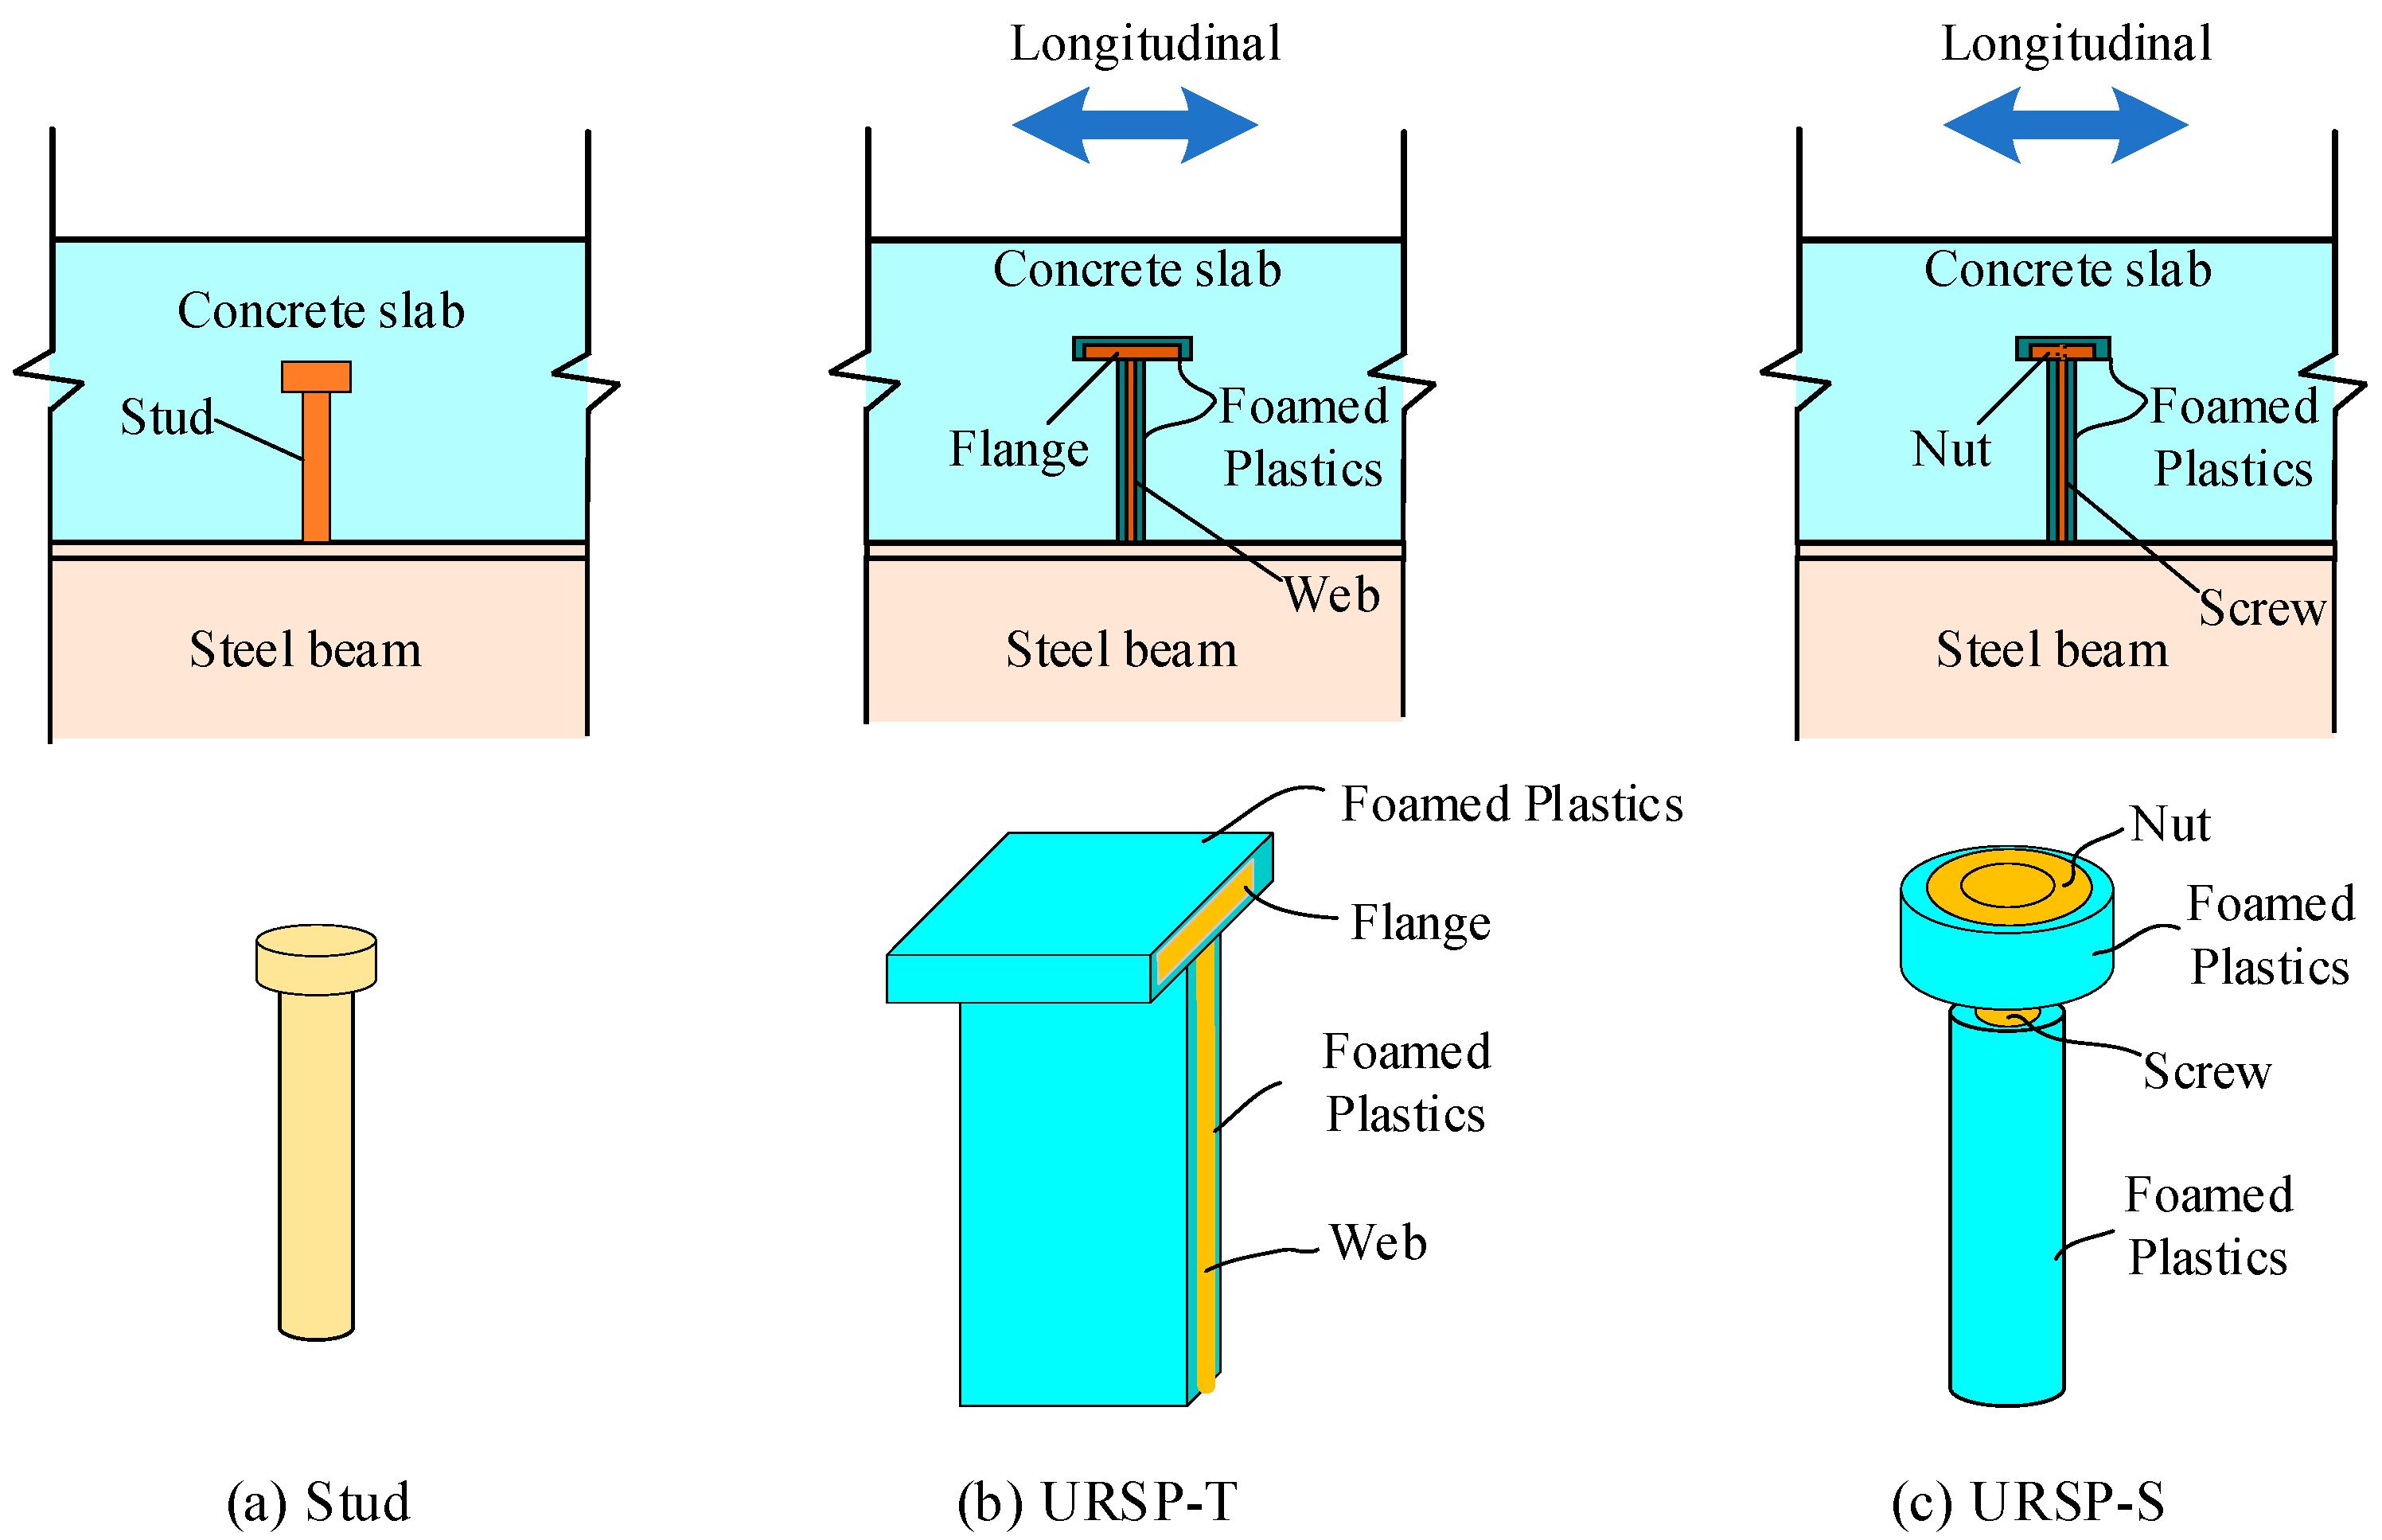
Simulation of URSP connecters
The effectiveness of the simulation of stud shear connectors has already been validated. To validate the simulation of URSP connectors in the FE models, the test results presented by Duan et al. [18] were used, in which the URSP-S connectors were applied in the hogging moment region of the continuous girder. The specimen is shown in Figure 7. The comparison of the load–deflection curve and the distribution of the section strain between the FE models and test results is shown in Figure 8. It can be seen that the FE analysis is able to provide accurate predictions.

3. Performance of Composite Girders with Differentiated Connectors in Construction Stages

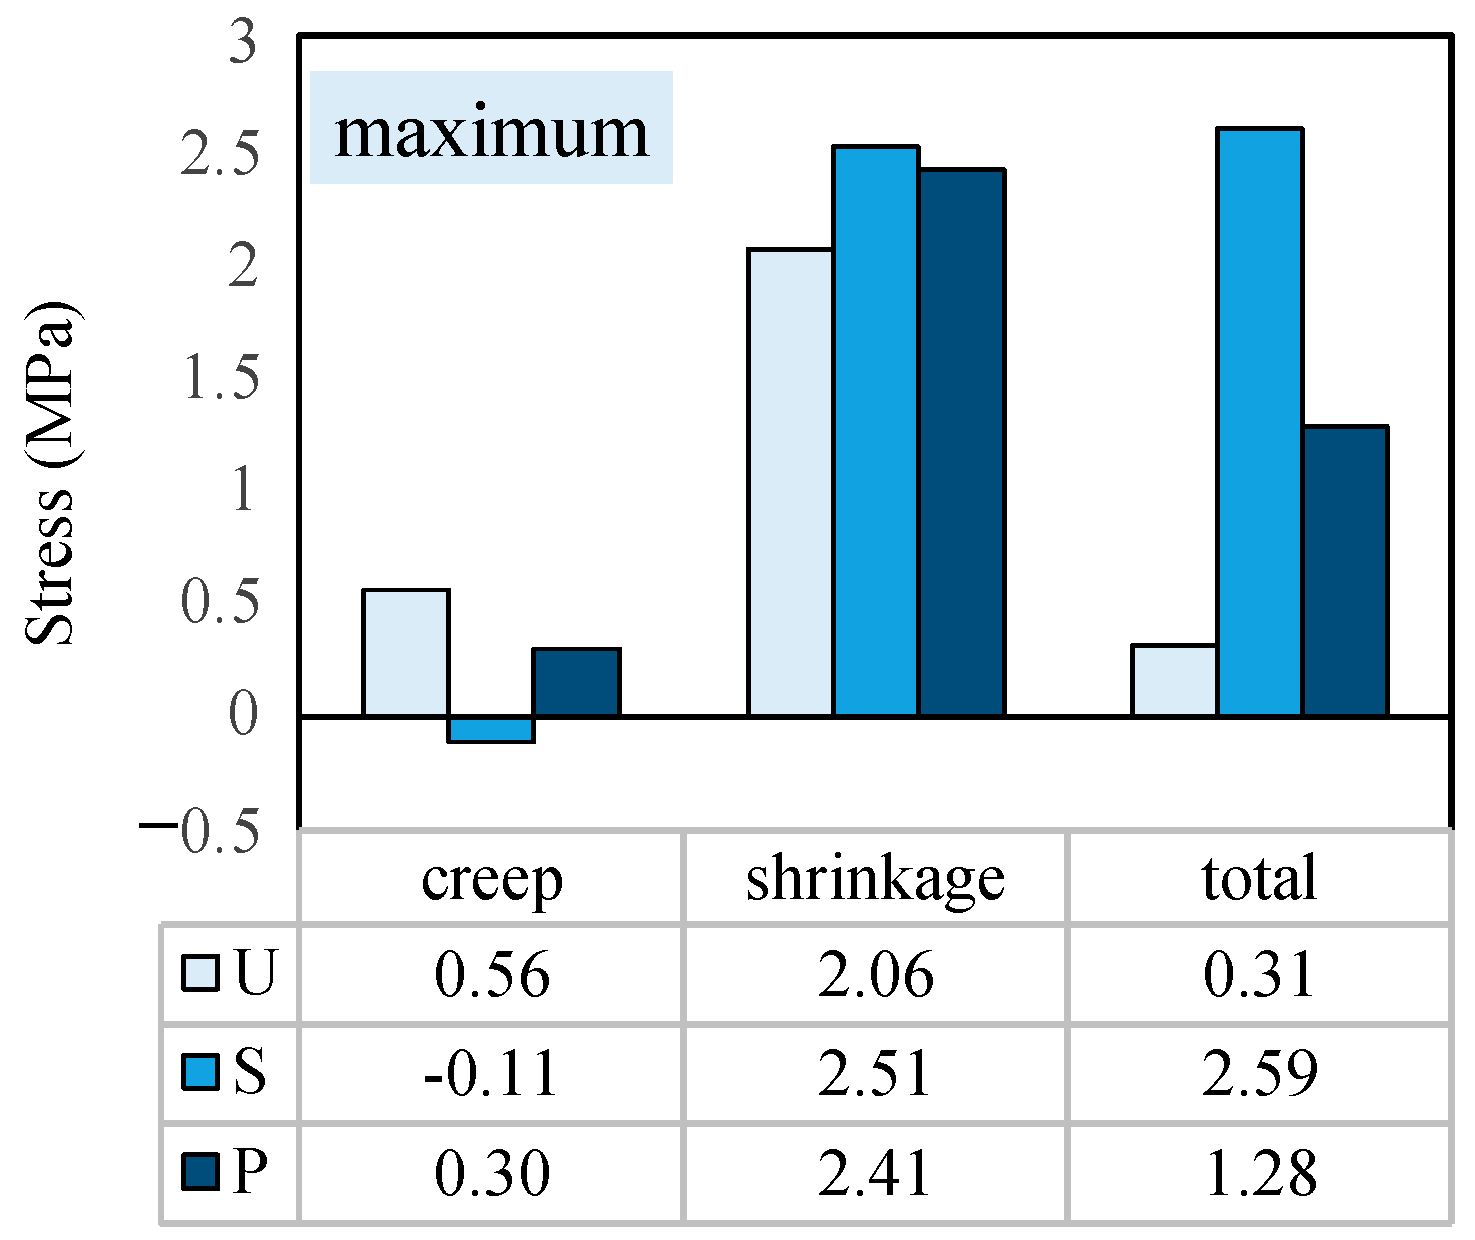
3.1. Concrete Stress

The envelope curves for the total stress of concrete in three major construction stages are shown in Figure 9. The concrete stresses in the sagging moment regions were quite close in the three schemes, while significant differences were observed in the hogging moment regions. After prestressing the tendons, it could be observed that approximately one-third of the total compressive prestress was transmitted to the steel girder instead of the concrete deck slab in Scheme S. In contrast, the compressive prestress was mostly used in Schemes U and P. The compressive stresses of the concrete in the hogging moment regions in Schemes U and P were essentially the same. After casting the construction joints, the concrete slabs in the hogging moments were also connected to the steel girder in Scheme P, which was consistent with the shear connection in Scheme S. Thus, the increment of the concrete stress in Scheme P was slightly larger than that in Scheme U. At this stage, the absolute value of the concrete compressive stress in the traditional Scheme S was only approximately 55% of that in Scheme U. At the stage of constructing the deck pavement, as the shear connection between the concrete slab and the steel girder was removed in Scheme U, the tensile stress increment of the concrete in the hogging moment region induced by the deck pavement loads was reduced compared with those in Scheme P and Scheme S. Therefore, the advantage of the URSP connection technique was further highlighted. As is shown in Figure 9, the advantage of Scheme U in improving the prestress level of the concrete slab can be clearly observed at the end of the construction phase. Due to the low effectiveness of prestressing, the large increment of the tensile stress under dead load, and the shrinkage and creep effects, the stress of the concrete in the hogging moment regions changed from compressive to tensile in Scheme S. The total stresses of the critical elements in Schemes U, S, and P were −2.31 MPa, 0.19 MPa, and −1.43 MPa, respectively.
To obtain further insights into the influences of the dead load, concrete creep, and shrinkage effect in the three schemes, the stress increments of the concrete slabs in the hogging moment regions due to these three effects were extracted from the FE analysis. The stress increment of the critical element in each construction step is shown in Figure 10, in which the critical element is defined as the concrete slab element with the maximum tensile stress (or minimum compressive stress) after ten years of service. As is shown in Figure 10, in the phase of curing the concrete in the hogging moment region, the tensile stress of the concrete hardly changed with the development of concrete creep and shrinkage in Scheme U and Scheme P due to the disconnection of the concrete from the steel girder. In contrast, the shrinkage of the concrete resulted in an obvious tensile stress in the concrete in Scheme S. After casting the construction joints, the dead loads led to identical stress increments in Scheme P and Scheme S. However, the total stress of the concrete in the hogging moment region was different in Scheme P and Scheme S; thus, the stress increments due to the concrete creep were not the same. Finally, the deck pavement was constructed, and the dead load in this phase brought about a significant increase in the tensile stress in both Scheme P and Scheme S. Nevertheless, the stress increment was much smaller in Scheme U due to the application of the URSP connection technique. Regarding the stress increment due to the concrete creep effect, the maximum increment occurred in Scheme U due to the highest level of compressive stress of the concrete. However, the stress increment due to the concrete shrinkage effect in Scheme U was much smaller than that in Scheme S.

3.2. Steel Girder Stress
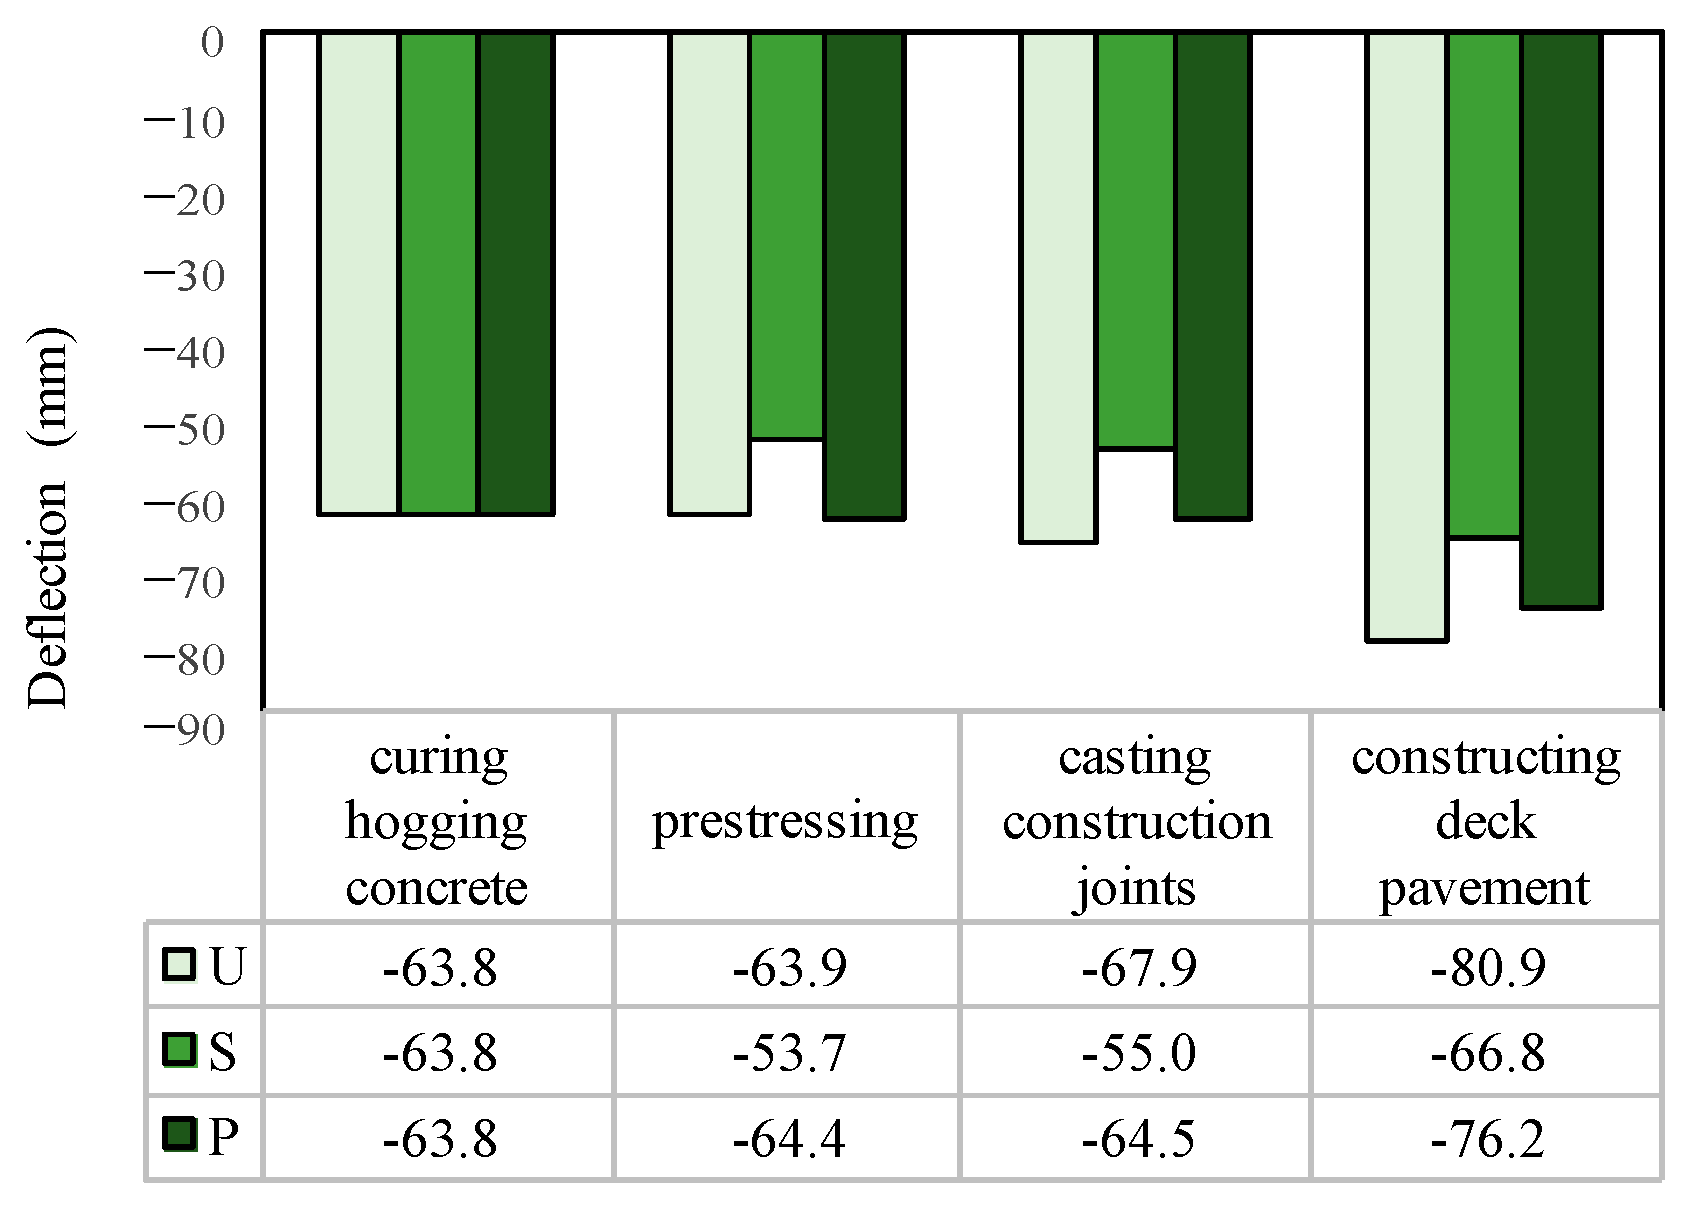
The maximum and minimum stresses of the steel top flange in each construction step are shown in Figure 11 and Figure 12. The steel stresses were identical in the three schemes until prestressing of the tendons occurred. A significant amount of compressive prestress was transmitted to the steel girder due to the shear connections between the steel girder and the concrete slab in Scheme S, leading to significant reductions in the tensile stresses of the top flange and bottom flange. In the phase of casting concrete in construction joints, the shear connection between the concrete slab and the steel girder was formed in Scheme P; thus, the increment of the stress in the steel girder was close to that in Scheme S. The absolute value of the total stress of the steel girder in Scheme P was larger than that in Scheme S. In contrast, a more significant increase in the stress in the steel girder could be observed in Scheme U due to the permission of the interfacial slips, and the total stress level of the steel girder in Scheme U was the highest among the three schemes. Similar conclusions can be obtained in the phase of constructing the deck pavement.

3.3. Deflection

The mid-span deflection of the girder in each step is shown in Figure 13. In the prestressing tendons phase, the prestressing force was transmitted to the steel girder through the shear connection; thus, the mid-span deflection was decreased in Scheme S. On the other hand, almost all the prestressing forces led to the concrete slabs in Scheme U and Scheme P; thus, the variation in the deflection in this phase was quite limited in these two schemes. After pouring the construction joints, the structural state of the composite girder in Scheme P was consistent with that in Scheme S. Therefore, the increment of the deflection in the phase of constructing the deck pavement was essentially identical between Scheme P and Scheme S. In contrast, the deflection increment in this phase was increased by approximately 10% in Scheme U due to the permission of the interfacial slips in the hogging moment regions.

4. Performance of Composite Girders with Differentiated Connectors in the Service Stage

Ten years after construction, the longitudinal distributions of the deflection, and stresses of the steel top and bottom flanges and the concrete slab are shown in Figure 14. As is shown in Figure 14a, the midspan deflections of the girders in Scheme S and Scheme P were 16% and 4% smaller than those in Scheme U, respectively. The stress of the steel bottom flange in the three schemes was essentially the same. In addition, in Scheme P and Scheme U, an obvious increase in the tensile stress of the top flange was observed only near the middle supports. It can be observed from Figure 14d that tensile stress occurred in the concrete slab in most of the regions due to the concrete shrinkage and creep effect. In Scheme S, the maximum tensile stress was 2.59 MPa, leading to a high risk of concrete cracking. Furthermore, it can be deduced that the cracking risk will continue to increase with time. The concrete prestressing level was merely improved in the phase of tendon prestressing in Scheme P, while Scheme U could also decrease the tensile stress of the concrete generated by the dead load and the shrinkage effect after casting the construction joints. Therefore, the comprehensive performance of Scheme U in preventing concrete cracking was the best of the three. After ten years of service, it was observed that the area of the concrete under tension in the hogging moment region in Scheme P was significantly larger than that in Scheme U. The maximum stresses of the concrete in Schemes U, S, and P were 0.31 MPa, 2.59 MPa, and 1.28 MPa, respectively.
The changes in the mid-span deflection and concrete stress in the hogging moment region due to the concrete shrinkage and creep effect are shown in Figure 15. The change in the deflection in Scheme U was the largest and that in Scheme S was the smallest, while the change in the concrete stress in Scheme P was the largest and that in Scheme S was the smallest. However, with increasing service duration, the differences between the deflection and concrete stress in the three schemes tended to be steady. Thus, it is reasonable to deduce that the advantage of Scheme U may be maintained in the long run.
The maximum stress increments due to the shrinkage and creep effects, and the total stress of the concrete in the hogging moment region in the service stage are shown in Figure 16. Regarding the concrete creep effect, the stress increments in Scheme U and Scheme P were larger than that in Scheme S. It can be seen from Figure 14 that most concrete slabs in the hogging moment region were under compression in Scheme U; thus, the creep effect induced compressive strain. However, the compressive strain was restrained by the adjacent slabs in the sagging moment region, inducing tensile stress in the hogging moment region. On the contrary, in Scheme S, the tensile stress in the hogging moment region tended to generate compressive stress under the creep effect. The performance of Scheme P fell in between that of the above two cases. On the other hand, the stress increment of the concrete in Scheme U due to the shrinkage effect was the smallest. This may have resulted from the release of the slip restraint between the concrete slab and the steel girder. In total, the application of the URSP connection technique led to a significant reduction in the concrete tensile stress in the hogging moment region, which could effectively improve the crack resistance of the concrete slab in continuous composite girders.
The transverse distribution of the longitudinal concrete stress in the concrete slab is shown in Figure 17, in which the origin of the z-axis was located at the middle support, and the origin of the x-axis was at the slab edge. It can be observed that the non-uniformity of the transverse distribution of the concrete stress was more significant after ten years of service. Meanwhile, the non-uniformity of the transverse distribution of the concrete stress and the effective width of the concrete slab varied along the longitudinal direction. At the middle support, the non-uniformity of the transverse distribution and the value of the concrete stress in Scheme U were the lowest at the beginning of service, and thus the effective width of the slab in this scheme was also the largest. After 10 years of service, the development of concrete creep and shrinkage effects triggered a reduction in the effective width of the slab in all three schemes. At the position of z = 5 m (1/12 of the middle span length), relatively uniform distributions of the concrete stress could be observed in all three schemes, where the value of the concrete stress in Scheme P was quite close to that in Scheme U. Additionally, the concrete shrinkage and creep effects increased the non-uniformity of the transverse distribution at this cross section. At z = 8 m, the lowest value of the concrete occurred at the mid-span of the slab in the beginning, and the stress level in Scheme U was slightly and significantly lower than that in Scheme P and Scheme S, respectively. Ten years after construction, the concrete shrinkage and creep effects brought about a significant stress redistribution in all three schemes, and the lowest value of concrete stress turns occurred at the slab-to-girder connections in Schemes U and P. Due to the complicated distribution and variation in concrete stress in the transverse and longitudinal directions, the elaborate FE model established in this study can provide more accurate results considering the concrete creep and shrinkage effects, when compared with the 1D FE model.
In addition, the performances of the composite girder under vehicle loads were also investigated. For each lane, a uniformly distributed load (10.5 kN/m) on the entire span and a movable concentrated load (360 kN) were applied on the composite girder. The performances of the composite girder under vehicle loads are shown in Figure 18. The increment of the concrete stress in the hogging moment region in Scheme U was approximately 32% lower than those in Schemes P and S, which could further reduce the cracking risk. Meanwhile, the mid-span deflection and the maximum steel stress increased by approximately 15% in Scheme U due to the presence of interfacial slips.
From the above comparisons, among the three schemes for prestressed steel–concrete composite continuous girder bridges, Scheme U (the scheme where the URSP connection technique was applied in the hogging moment region) is able to provide the best control of tensile stress in the concrete slabs. With an increasing service time, the concrete shrinkage effect will increase this advantage, while the creep effect will reduce this advantage. However, in general the application of the URSP connectors in the hogging moment region can lead to a significant improvement in the anti-cracking performance of the concrete slab in continuous composite girders when considering the effects of the construction process, concrete shrinkage and creep, dead loads, and vehicle loads. Meanwhile, the release of the slip restraint between the concrete slab and the steel girder may bring about a certain degree of increase in the deflection and the stress of the steel top flange near the middle supports; thus, attention should be paid to this when the design is controlled by the girder stiffness and the steel girder stress.

5. Parametric Analysis and Design Suggestions

Due to the complex construction process and the movable vehicle loads, it is difficult to explicitly determine the hogging moment regions in most practical cases. Therefore, a parametric study was conducted to investigate the effects of the arrangement length of the URSP connectors. The influences of the URSP length ratio on the maximum concrete stress in the hogging moment region when varying the span length ratio, the span–depth ratio, and the prestress level are shown in Figure 19 and Figure 20. The URSP length ratio (Lu/Lm) is defined as the ratio of the length applying the URSP connectors to the middle span length; the span length ratio (Ls/Lm) is defined as the side span length to the middle span length; the span–depth ratio (Lm/h) is the ratio of the middle span length to the girder depth; and σp is the compressive stress of the concrete after prestressing. The results indicated that with an increasing URSP length, the concrete stress decreased in all cases. The decrease rates of the concrete stress were essentially identical for different values of the span length ratio and prestress level, while the decrease was less significant when the span–depth ratio was small. When comparing the concrete stress before and after ten years of service, it could be deduced that the variations in the concrete stress due to the change in the span length ratio, span–depth ratio, and prestress level were decreased to some extent. This can be explained by the fact that when the compressive stress level is higher, the tensile stress generated by the concrete creep effect will be more significant.
The influences of the URSP length ratio on the mid-span deflection and the maximum stress of the steel top flanges are shown in Figure 21, respectively. The increase in the URSP length ratio brought about increases in the deflection and steel stress. It can also be observed that the effect of the URSP length ratio on the concrete stress is more significant than those on the deflection and steel stress. Based on the results of this parametric study, a value of 0.2 is recommended as the URSP length ratio.

6. Conclusions

In this paper, the performances of prestressed composite continuous girders were investigated by conducting elaborate FE analyses considering the concrete creep and shrinkage effects in the construction and service stages. To simulate the concrete creep and shrinkage effects, a UMAT subroutine in ABAQUS was developed, and an effective prediction model was selected. The following conclusions have been drawn according to the analysis results:
(1)
The commonly used shrinkage and creep prediction models are in different agreements with the long-term performance tests of composite beams in the literature, and the CEP90 model was adopted in this study. In addition, the short-term behaviors of the specimens with URSP connecters predicted by the FE models were in good agreement with the test data, indicating that the modeling strategy was reliable.
(2)
Scheme U, where the URSP connection technique is applied in the hogging moment region can effectively increase the prestressing efficiency and decrease the tensile stress of the concrete induced by dead loads and vehicle loads. With an increasing service time, the concrete shrinkage effect will enhance the advantage of Scheme U, while the creep effect will reduce this advantage. In general, it was deduced that Scheme U was the most superior scheme from the perspective of concrete crack resistance in the hogging moment region, among the three schemes considered in this study.
(3)
The concrete shrinkage and creep effects can generate significant concrete stress redistribution in the transverse direction, and non-uniformity of the transverse distribution of the concrete stress is more significant after ten years of service. Meanwhile, the effective width of the concrete slab also varies along the longitudinal direction.
(4)
Compared to the traditional scheme, the applications of the post-connected construction method and URSP connectors in the hogging moment regions may lead to approximately 12% and 18% increases in deflection, respectively. Therefore, attention should be paid to this when the design is controlled by girder stiffness. The steel girder stress was also increased in these two innovative schemes, but a significant increase only occurred in the top flange near the middle supports, which may be eliminated by local strengthening measures.
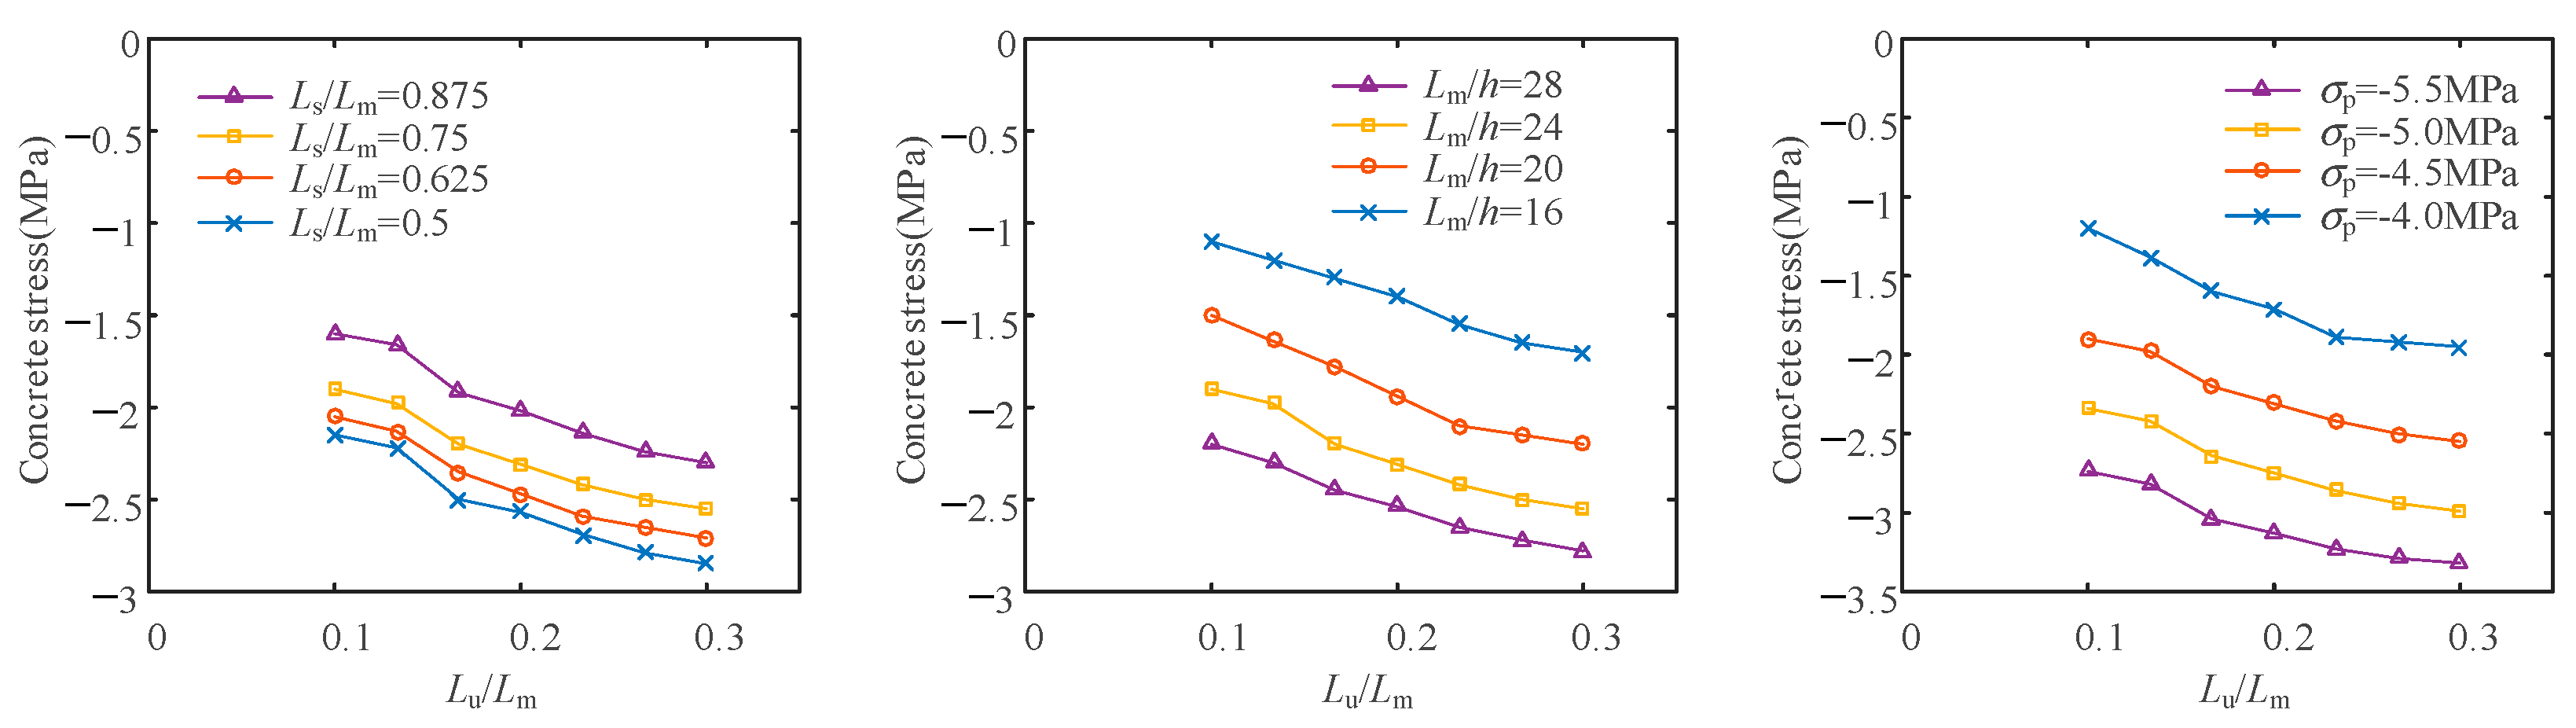
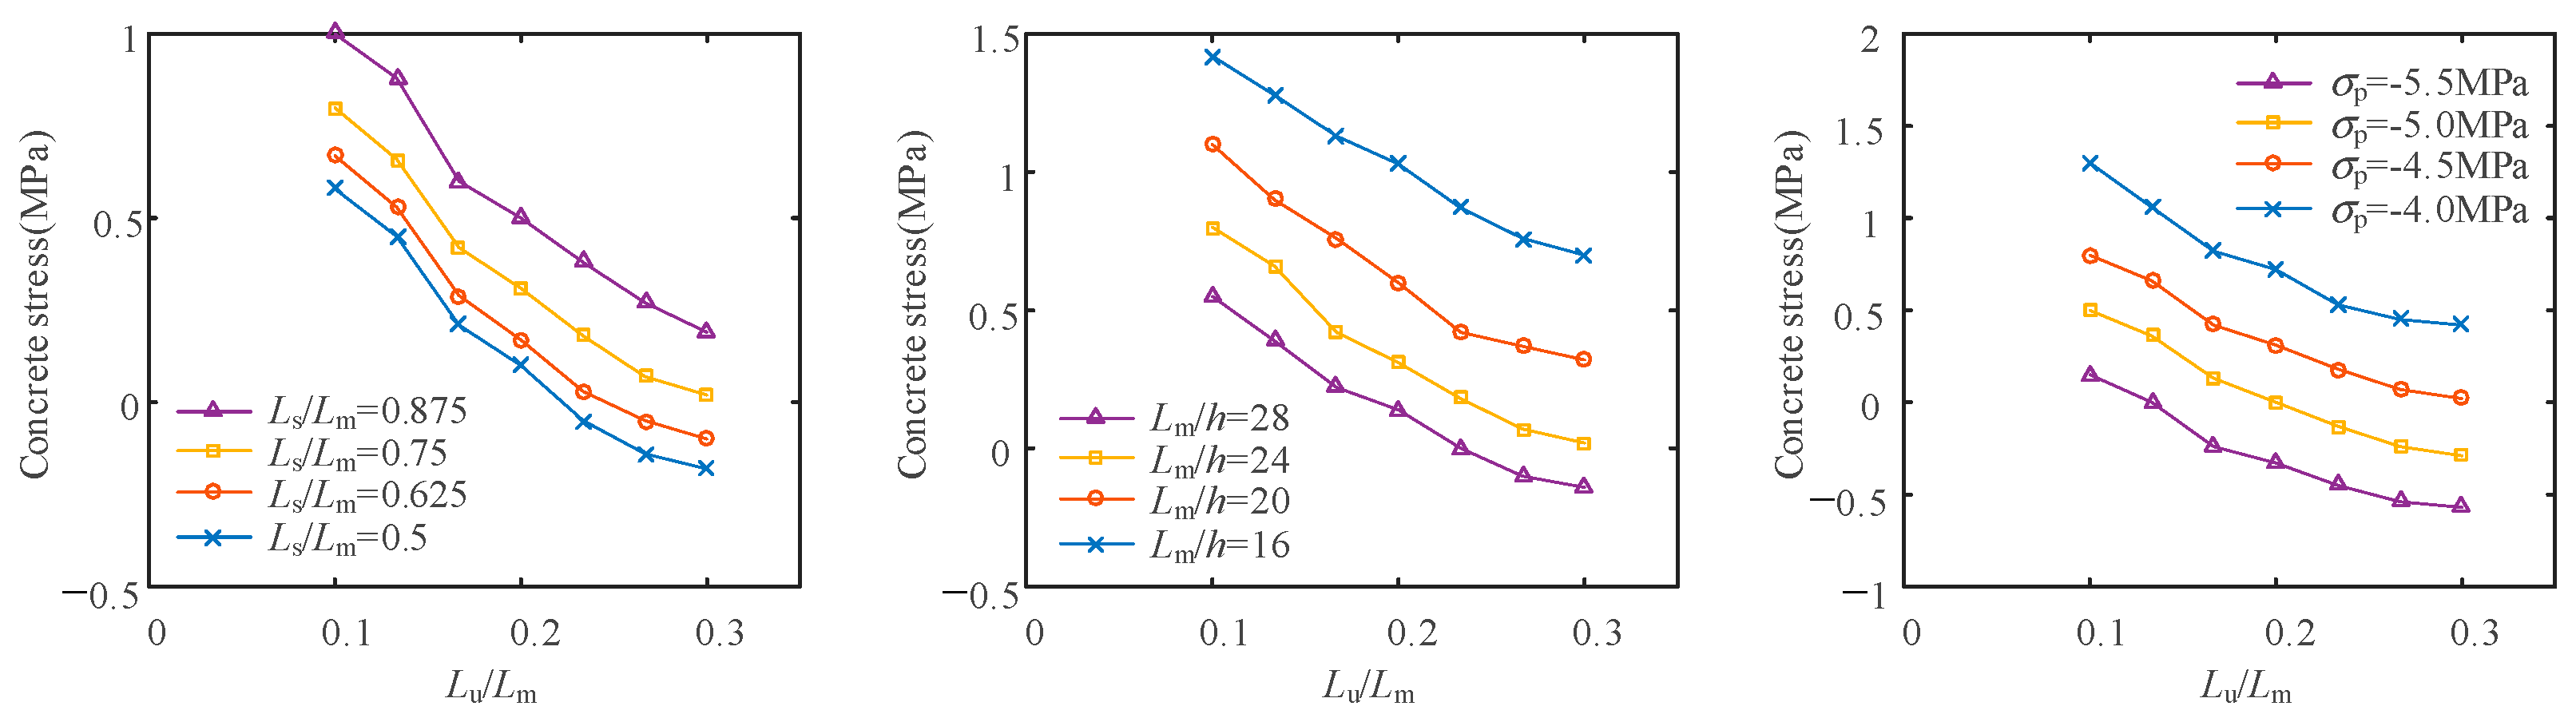
(5)
The results of the parametric analyses indicate that with an increasing URSP length, the concrete stress decreased under various span length ratios, span–depth ratios, and prestress levels. The tensile stress induced by the concrete creep effect can reduce the influence of these factors. The increase in the URSP length ratio brought about increases in the deflection and steel stress, but the effect of the URSP length ratio on the concrete stress was more significant. Overall, a value of 0.2 is recommended as the URSP length ratio.

Author Contributions

Conceptualization, Y.Z.; methodology, C.W., Z.L. and Y.Z.; software, C.L.; validation, Z.L. and Y.Z.; formal analysis, Y.Z.; investigation, Y.Z.; resources, C.W.; data curation, L.C.; writing—original draft preparation, Y.Z.; writing—review and editing, C.W.; visualization, L.C.; supervision, Y.Z.; project administration, Y.Z.; funding acquisition, Y.Z. All authors have read and agreed to the published version of the manuscript.

Funding

The writers gratefully acknowledge the financial support provided by the National Natural Science Foundation of China (NSFC, Grant No. 52108103), the R&D Program of Beijing Municipal Education Commission (Grant No. KM202210009007), and the Science and Technology Project of Department of Transportation of Hebei Province (Grant No. TH1-202010, Grant No. YC-201931).

Institutional Review Board Statement

Not applicable.

Informed Consent Statement

Not applicable.

Data Availability Statement

The data presented in this study are available on request from the corresponding author.

Acknowledgments

The authors express their thanks to the people who have provided assistance with this work, and acknowledge the valuable suggestions from peer reviewers.

Conflicts of Interest

The authors declare no conflict of interest.

Appendix A

Table A1. Parameters of the composite beam specimens in the literature.
STSize (mm)L (m)t0 (d)T (°C)Rh (%)fcu
28 d (MPa)
SRCM
(kg/m3)
WM (kg/m3)A/CLoad (kN/m)Ec
(GPa)
Es (GPa)Fy (MPa)F
(MPa)
Remarks
Fan et al. [27]LCB1S600 × 6047196732.3800/24002882361076/2887.29Ec (7) = 27.6206303.6--
LCB2S600 × 6047196744.7776/24003532121059/3537.29Ec (28) = 31.8206303.6--
Ec (7) = 30.0
Ec (28) = 34.7
Xue et al. [38]PCB1PS600 × 1004.8----684/24165201881024/5207.37 + 5.23-185371.5444.4Prestress: 783 MPa
PCB2PS600 × 1004.8----684/24165201881024/5207.37 + 5.23-185371.5444.4888 MPa
PCB3PS600 × 1004.8----684/24162601881024/2607.37 + 5.23-185371.5444.4798 MPa
CB-1S600 × 1004.8----684/24165201881024/52012.6-185371.5444.4-
Al-deen et al. [39]CB1S2000 × 1258-217027.7838/2318141175960/141-25.5-317.26517.47No Temporary support
CB2S2000 × 125829217027.7838/2318141175960/14113.425.5-317.26517.47No Temporary support
CB3S2000 × 125829217027.7838/2318141175960/141SW + 13.4 = 19.825.5-317.26517.47Temporary support
Note: ST, structure type; S, simply supported; PS, prestressed simply supported; T, the temperature; SR, sand rate; CM, cement mass (in 1 m3 of concrete); WM, water mass (in 1 m3 of concrete); A/C, weight ratio of aggregate–cement ratio (by weight); Ec, the elastic modulus of concrete; Es and Fy, the elastic modulus and yield stress of the steel plate, respectively; F, the ultimate strength of the stud.

References

  1. Zhu, Y.-J.; Yang, Y.; Wang, J.-J.; Xu, L.-Y. Novel design method for reinforced concrete decks in composite girders considering compressive membrane action. Eng. Struct. 2021, 229, 111558. [Google Scholar] [CrossRef]
  2. Zhao, G.-Y.; Liu, W.; Su, R.; Zhao, J.-C. A Beam Finite Element Model Considering the Slip, Shear Lag, and Time-Dependent Effects of Steel-Concrete Composite Box Beams. Buildings 2023, 13, 215. [Google Scholar] [CrossRef]
  3. Liang, H.-W.; Tan, K.; Deng, K.-L.; Zhang, Y.-M.; Zhao, C.-H.; Yang, T.-Y. Crack Resistance of Steel-Concrete Hybrid Joint between Concrete Girder and Steel-Concrete Composite Girder in Long-Span Cable-Stayed Bridge under Hogging Moment. J. Bridge Eng. 2023, 28, 05022013. [Google Scholar] [CrossRef]
  4. Zhu, Y.-J.; Zhu, J.-M. Distortion of steel tub-girder with top flange bracing considering warping restraint effect. J. Constr. Steel Res. 2021, 187, 106954. [Google Scholar] [CrossRef]
  5. Zhu, Y.-J.; Wang, J.-J.; Nie, X.; Pan, X.-B.; Fan, J.-S. Structural performance of slabs in composite box girder considering compressive membrane action. Eng. Struct. 2020, 212, 110457. [Google Scholar] [CrossRef]
  6. Zeng, Y.; Li, Y.-Q.; Yu, T.; Wei, J.-H. Analysis of Mechanical Performance of Steel-Concrete Composite Girder Bridge with V-Shaped Piers. Adv. Civ. Eng. 2022, 2022, 6489140. [Google Scholar] [CrossRef]
  7. Gao, C.; Zhu, L.; Han, B.; Tang, Q.-C.; Su, R. Dynamic Analysis of a Steel-Concrete Composite Box-Girder Bridge-Train Coupling System Considering Slip, Shear-Lag and Time-Dependent Effects. Buildings 2022, 12, 1389. [Google Scholar] [CrossRef]
  8. He, Z.-Q.; Ou, C.-X.; Tian, F.; Liu, Z. Experimental Behavior of Steel-Concrete Composite Girders with UHPC-Grout Strip Shear Connection. Buildings 2021, 11, 182. [Google Scholar] [CrossRef]
  9. Zhu, Y.-J.; Nie, X.; Wang, J.-J.; Tao, M.-X.; Fan, J.-S. Multi-index distortion control of steel-concrete composite tub-girders considering interior cross-frame deformation. Eng. Struct. 2020, 210, 110291. [Google Scholar] [CrossRef]
  10. Zhu, Y.-J.; Zhou, M.; Zhu, J.-M.; Nie, X. Analytical models for load capacities of variable thickness reinforced concrete slabs considering compressive membrane action and boundary effects. Eng. Struct. 2021, 246, 113067. [Google Scholar] [CrossRef]
  11. Men, P.-F.; Zhou, X.-H.; Ye, J.-T.; Di, J.; Qin, F.-J. Shear capacity investigation of steel-concrete composite girders in hogging moment regions. J. Constr. Steel Res. 2022, 194, 107341. [Google Scholar] [CrossRef]
  12. Alsharari, F.; El-Sisi, A.E.D.; Mutnbak, M.; Salim, H.; El-Zohairy, A. Effect of the Progressive Failure of Shear Connectors on the Behavior of Steel-Reinforced Concrete Composite Girders. Buildings 2022, 12, 596. [Google Scholar] [CrossRef]
  13. Men, P.F.; Zhou, X.H.; Zhang, Z.X.; Di, J.; Qin, F.J. Behaviour of steel-concrete composite girders under combined negative moment and shear. J. Constr. Steel Res. 2021, 179, 106508. [Google Scholar] [CrossRef]
  14. Nie, J. Application of steel-concrete composite structure in ocean engineering. Steel Constr. 2020, 35, 20–33. [Google Scholar]
  15. Nie, J.; Tao, M.; Nie, X.; Fan, J.; Zhang, Z.; Tang, H.; Zhu, L.; Li, Y. New technique and application of uplift-restricted and slip-permitted connection. China Civ. Eng. J. 2015, 48, 7–15. [Google Scholar]
  16. Nie, J.-G.; Li, Y.-X.; Tao, M.-X.; Nie, X. Uplift-restricted and slip-permitted T-shape connectors. J. Bridge Eng. 2015, 20, 04014073. [Google Scholar] [CrossRef]
  17. Nie, J.-G.; Ma, Y. The experimental study of the uplift performance of uplift-restricted and slip-permitted screw-type connectors. Spec. Struct. 2015, 32, 6–12. [Google Scholar]
  18. Duan, L.; Chen, H.; Nie, X.; Han, S. Experimental study on steel-concrete composite beams with Uplift-restricted and slip-permitted screw-type (URSP-S) connectors. Steel Compos. Struct. Int. J. 2020, 35, 261–278. [Google Scholar]
  19. Duan, L.; Nie, X.; Ding, R.; Zhuang, L. Research on application of uplift-restricted slip-permitted (URSP) connectors in steel-concrete composite frames. Appl. Sci. 2019, 9, 2235. [Google Scholar] [CrossRef]
  20. Al-deen, S.; Ranzi, G.; Vrcelj, Z. Full-scale long-term experiments of simply supported composite beams with solid slabs. J. Constr. Steel Res. 2011, 67, 308–321. [Google Scholar] [CrossRef]
  21. Cao, G.; Han, C.; Dai, Y.; Zhang, W. Long-term experimental study on prestressed steel–concrete composite continuous box beams. J. Bridge Eng. 2018, 23, 04018067. [Google Scholar] [CrossRef]
  22. Zhu, Y.-P.; Zhang, Y.; Hussein, H.-H.; Xu, Z.-B. Normal concrete and ultra-high-performance concrete shrinkage and creep models: Development and Application. Adv. Struct. Eng. 2022, 15, 13694332221097729. [Google Scholar] [CrossRef]
  23. Wang, Q.-H.; Yang, J.-S.; Zhang, Y.-Z.; Fang, Y.-F.; Ren, Q.-X. Analysis and design of long-term responses of simply-supported steel-concrete composite slabs. J. Build. Eng. 2022, 53, 104496. [Google Scholar] [CrossRef]
  24. Motlagh, H.-R.; Rahai, A. Long-Term Behavior of a Prestressed Concrete Bridge with Corrugated Steel Webs. J. Bridge Eng. 2022, 27, 05021016. [Google Scholar] [CrossRef]
  25. Zhu, L.; Su, R.-K.; Huo, J.-X.; Wang, G.-M. Test of the Long-Term Behavior of Curved Steel-Concrete Composite Box Beams: Case Study. J. Bridge Eng. 2021, 26, 05021009. [Google Scholar] [CrossRef]
  26. Xu, C.; Xiao, H.; Zhang, B.-Y.; Fu, J.; Masuya, H. Fatigue behavior of steel fiber reinforced concrete composite girder under high cycle negative bending action. Eng. Struct. 2021, 241, 112432. [Google Scholar] [CrossRef]
  27. Zhou, X.-H.; Men, P.-F.; Di, J.; Qin, F.-J. Experimental investigation of the vertical shear performance of steel-concrete composite girders under negative moment. Eng. Struct. 2021, 228, 111487. [Google Scholar] [CrossRef]
  28. Li, S.; Yang, Y.; Pu, Q.; Yang, D.; Sun, B.; Li, X. Three-dimensional nonlinear creep and shrinkage effects of a long-span prestressed concrete box girder bridge. Struct. Concr. 2019, 20, 638–649. [Google Scholar] [CrossRef]
  29. Fan, J.; Nie, J.; Li, Q.; Wang, H. Long-term behavior of composite beams under positive and negative bending. I: Experimental study. J. Struct. Eng. 2010, 136, 849–857. [Google Scholar] [CrossRef]
  30. Huang, D.; Wei, J.; Liu, X.; Du, Y.; Zhang, S. Experimental study on influence of post-pouring joint on long-term performance of steel-concrete composite beam. Eng. Struct. 2019, 186, 121–130. [Google Scholar] [CrossRef]
  31. Yu, Q.; Bazant, Z.P.; Wendner, R. Improved algorithm for efficient and realistic creep analysis of large creep-sensitive concrete structures. ACI Struct. J. 2012, 109, 665. [Google Scholar]
  32. Bazant, Z.P.; L’Hermite, R. Mathematical Modeling of Creep and Shrinkage of Concrete; John Wiley & Sons Ltd.: Chichester, UK, 1988; pp. 102–103. [Google Scholar]
  33. Béton, C.E.-I.d. CEB-FIP Model Code 1990: Design Code; Thomas Telford Publishing: London, UK, 1993. [Google Scholar]
  34. Comité Euro-International Du Béton (CEB). CEB-FIP Model Code 2010 for Concrete Structures; International Federation for Structural Concrete: Lausanne, Switzerland, 2010. [Google Scholar]
  35. ACI Committee 209. Prediction of Creep, Shrinkage, and Temperature Effects in Concrete Structures (ACI 209R-92); American Concrete Institute: Farmington Hills, MI, USA, 2008; Reapproved. [Google Scholar]
  36. Bažant, Z.P.; Jirasek, M.; Hubler, M.H.; Carol, I. RILEM draft recommendation: TC-242-MDC multi-decade creep and shrinkage of concrete: Material model and structural analysis* Model B4 for creep, drying shrinkage and autogenous shrinkage of normal and high-strength concretes with multi-decade applicability. Mater. Struct. 2015, 48, 753–770. [Google Scholar]
  37. Gardner, N.; Lockman, M. Design provisions for drying shrinkage and creep of normal-strength concrete. Mater. J. 2001, 98, 159–167. [Google Scholar]
  38. Xue, W.; Sun, T.; Liu, T. Experimental study on prestressed steel-concrete composite beams for urban light rails under sustained loads of two years. China Civ. Eng. J. 2013, 46, 110–118. [Google Scholar]
  39. Al-deen, S.; Ranzi, G.; Vrcelj, Z. Long-term Experiments of Composite Steel-Concrete Beams. Procedia Eng. 2011, 14, 2807–2814. [Google Scholar] [CrossRef]
Figure 1. Different types of connectors [17].
Buildings 13 01137 g001
Figure 2. Flow chart of the user subroutine for concrete creep and shrinkage.
Buildings 13 01137 g002
Figure 3. Dimensions of the three-span composite girder.
Buildings 13 01137 g003
Figure 4. Construction sequence and connectors in the three schemes.
Buildings 13 01137 g004
Figure 5. FE model in ABAQUS (one box).
Buildings 13 01137 g005
Figure 6. Comparison of deflections obtained from the tests and FE analyses. (1) Fan et al. [27] LCB1; (2) Fan et al. [27] LCB2; (3) Xue et al. [38] PCB1; (4) Xue et al. [38] PCB2; (5) Xue et al. [38] PCB3; (6) Xue et al. [38] CB; (7) Al-deen et al. [39] CB1; (8) Al-deen et al. [39] CB2; (9) Al-deen et al. [39] CB3.
Buildings 13 01137 g006
Figure 7. Test specimen with URSP-S connectors in the hogging moment region [18].
Buildings 13 01137 g007
Figure 8. Comparison of the load–deflection curve and the distribution of the section strain.
Buildings 13 01137 g008
Figure 9. Envelope curves for the total stress of concrete.
Buildings 13 01137 g009
Figure 10. Stress increment of the critical element in each construction step.
Buildings 13 01137 g010
Figure 11. Stress of the steel top flange in each step.
Buildings 13 01137 g011
Figure 12. Stress of the steel bottom flange in each step.
Buildings 13 01137 g012
Figure 13. Total mid-span deflection in each step.
Buildings 13 01137 g013
Figure 14. Performances of the composite girder after ten years. (a) Deflection; (b) Stress of steel top flange; (c) Stress of steel bottom flange; (d) Maximum concrete stress.
Buildings 13 01137 g014
Figure 15. Change in the mid-span deflection and concrete stress.
Buildings 13 01137 g015
Figure 16. Concrete stress in the hogging moment regions in the service stage.
Buildings 13 01137 g016
Figure 17. Transverse distribution of the longitudinal concrete stress in the slab.
Buildings 13 01137 g017
Figure 18. Performances of the composite girder under vehicle loads.
Buildings 13 01137 g018
Figure 19. Influence of the URSP length ratio on the maximum concrete stress in the hogging moment region (at the end of construction).
Buildings 13 01137 g019
Figure 20. Influence of the URSP length ratio on the maximum concrete stress in the hogging moment region (after ten years of service).
Buildings 13 01137 g020
Figure 21. Influence of the URSP length ratio on the mid-span deflection and the maximum steel stress (after ten years of service).
Buildings 13 01137 g021
Disclaimer/Publisher’s Note: The statements, opinions and data contained in all publications are solely those of the individual author(s) and contributor(s) and not of MDPI and/or the editor(s). MDPI and/or the editor(s) disclaim responsibility for any injury to people or property resulting from any ideas, methods, instructions or products referred to in the content.

