Abstract
This paper presents the results of static and dynamic tests of fiber-reinforced and unreinforced concrete samples under laboratory conditions. Concrete samples reinforced with steel and non steel fibers were tested. The dynamic tests were carried out on the stand by applying falling weight impacts on the concrete samples. The impact testing of samples included two stages of deformation: until the first defects appeared in the samples and until their complete destruction. The impact resistance of the samples was evaluated according to the energy input of the hammer with registration of the type, size and volume of the defects. It was revealed that the type of fibers has a different effect on the static and impact resistance of fiber concrete. Correlational dependencies used for predicting the strength and energy parameters of fiber concrete in their comparative evaluation have been obtained. It has been determined that the static strength and impact resistance of fiber concrete may not be identical, i.e., a high static strength in fiber concrete does not always provide a high impact resistance. The impact resistance of fiber concrete when tested before the first defects appear is always lower than when tested before complete failure.
1. Introduction
There is no doubt that one of the progressive types of concrete is fiber concrete. This type of concrete has been actively investigated by specialists and experimentally implemented in the construction industry of several countries [1,2]. The scientific and practical attraction of fiber concrete is due to its increased physical and mechanical properties. For instance, the compressive strength of fiber concrete is 20–50% higher, the modulus of elasticity is 30–40% higher, and the water permeability is 50% higher than conventional concrete. In addition, the high cracking resistance and significant resistance to impact loads positively characterize fiber-reinforced concrete [3,4,5,6].
Fibers in the composition of fiber-reinforced concrete are the steel elements (sections of wire, rope, cuts from steel sheet, elements in the form of steel needles, threads, etc.) [1,3,4,5,6,7], glass fibers [2,4,8,9], basalt fibers [9,10,11,12,13], carbon fibers [9,13], polymer elements (polypropylene fibers, capron threads, cellulose threads) [9,13,14] and other used methods.
The variety of species, shapes, sizes and properties of fibers and other components of fiber concrete predetermines the relevance of research assessing the possibility of its application in the production of various building structures and elements. Widely known papers on the prospect of the use of various modifications of fiber-reinforced concrete stress the manufacture of the following building structures and elements:
- -
- Window and door lintels of residential and civil buildings [6];
- -
- Floors of industrial buildings [14];
- -
- Beams of rectangular cross-sections [7];
- -
- Cladding layers of reinforced concrete dams [11];
- -
- Roadway coverings [4];
- -
- Arch structures of bridges [9].
Fiber reinforcement has also been used to reinforce expanding soils. In [15,16,17,18,19,20], the authors carried out soil-reinforcement studies with jute fibers to improve its strength parameters. As a result, for various forms of different fiber orientation distribution and volumetric fiber concentrations, an increase in the deviatory deformation characteristic and a decrease in the post peak loss of strength of the expanding soil were revealed.
In addition, there are investigations devoted to the special use of fiber-reinforced concrete for the repair of concrete and to reinforce concrete structures and irrigation and drainage structures [13], as well as for the production of driven-reinforced concrete structures [14,21,22,23,24,25,26].
Concerning studies on fiber concrete properties in relation to piles, it should be noted that they refer to prismatic and pyramidal piles, piles with a circular continuous cross-section and hollow circular piles. The following is a brief analysis of the results of these studies.
A study of the fiber-reinforced concrete sample resistance during impact load by the falling hammer is presented in [21]. The research was carried out for the manufacture of prismatic piles with a fiber-reinforced concrete pile head. The concrete samples were reinforced by profiled and smooth steel fibers of 0.5–1.6 mm in diameter with the ratio of the length of fibers l to their diameter d equal to 50 and 100. It has been established that the impact resistance of fiber concrete is influenced more by the length of fiber than by its diameter. The fibers with an l/d ratio less than 100 are the most optimal. It is recommended that, for piles driven under difficult soil conditions, the reinforcement factor (percentage of fiber in concrete) of fiber concrete should be 1.5–1.8%, and the length of fiber concrete pile head should be equal to 1.5 b (where b is the cross-sectional dimension of the pile). It is indicated that the impact resistance of piles with a steel fiber concrete pile head is 2–5 times higher than that of piles with traditional reinforcement. At the same time, the impact resistance of fiber concrete piles was estimated by the number of hammer blows required for the destruction of test samples.
The results of the experimental production of steel fiber concrete piles and their use in building construction are considered in [14,22]. Two types of prismatic and pyramidal piles were used: piles made entirely of steel-fiber-reinforced concrete and piles with a head and tip made of steel-fiber-reinforced concrete. To prepare the fiber concrete piles, 1.5–2.0 mm steel wire segments and sections from waste ropes were used. The length of the prismatic piles was 8–14 m, and their cross-section dimensions were 35 × 35 cm. The pyramidal piles were 6 m long with a cross-section size of 40 × 40 cm at the top and 20 × 20 cm at the bottom. In the tests, the piles were installed to the required levels without any defects. Moreover, the duration of pile-driving was reduced by up to 50%, which ensured the high productivity of pile-driving operations. The implementation of piles made of steel fiber concrete allowed for material costs to be reduced by up to 30%.
Paper [23] presents the results of testing the possibility of manufacturing piles from this material for earthquake-prone regions. Samples of fiber-reinforced concrete and conventional reinforced concrete were subjected to the action of a constant axial load and loads that cause variable cyclic and alternating bending. Double-cone and double-twisted steel fibers were used as fibers. The fiber consumption used to make these samples was 40–50 kg/m3. Steel fibers can replace traditional reinforcing in piles at the accepted loads. At bending loads on piles without the application of an axial load, the additional installation in the pile head of a simple carcass of reinforcing bars is revealed.
The better resistance of piles made of steel fiber concrete under the action of horizontal and vertical axial loads is indicated in [24]. The research was carried out using pile models in medium-density sands. The percentage of volumetric reinforcement of the models with fibers was 1.0%. Based on the research results, it was determined that the use of steel fibers to reinforce concrete piles will exclude the installation of transverse reinforcement.
Paper [25] shows that the use of steel fibers to manufacture piles with a circular continuous cross-section leads to an increase in their crack resistance under the action of axial load. Comparative tests were subjected to models of piles made of steel fiber concrete and conventional concrete without reinforcement, equipped with strain gauges to measure the compression deformation of their shaft. It was found that the deformation of piles significantly reduced when concrete is reinforced with steel fibers. However, this effect was more significant for pile models with diameters of 4.5 and 7 cm than for models with diameters of 8 cm.
The effect of the method of centrifugal molding on the distribution and orientation of steel fibers in the concrete mixture in the manufacture of circular hollow piles is noted in [26]. It was found that the shear strength of fiber concrete significantly increases as the steel fibers content in it increases. In addition, it is determined that the fiber concrete piles have no significant damage and have less brittle resistance under shear loads. It is assumed that fiber concrete piles can be made without transverse reinforcement, which, in turn, will simplify the process of their industrial production.
The results of numerical studies of fiber concrete to assess the possibility of its application in the manufacture of a pile foundation used as a compressed-air energy storage are presented in [27]. It was determined that the model of the pile foundation made of fiber concrete can withstand considerable tensile forces from high air pressure without the formation of cracks.
The static and impact resistance of fiber concrete made of steel and synthetic fibers for making prismatic piles up to 12 m long was studied in [28]. The maximum indicators of static strength and impact endurance for steel fiber concrete are characteristic at a reinforcement percentage of 1.5, and those for fiber concrete from synthetic fibers are characteristic at a reinforcement percentage of 1.0. At the same time, the impact endurance indices of steel fiber concrete and synthetic fiber concrete are 9 and 5 times higher, respectively, than those of unreinforced concrete. The piles with the head part made of the developed fiber concrete compositions were experimentally tested; the results confirmed their defect-free impact immersion.
Therefore, the results of the research indicate that, when applied to driven piles, experts have mainly studied the properties of fiber concrete, in which steel fibers of different shapes, sizes and contents were used. Studies of fiber concrete made of synthetic fibers [28] are somewhat limited; that is why a detailed and unambiguous comparison of different types of synthetic fibers according to the static and impact strength of fiber concrete at different stages of deformation is not possible. The relevance of such a comparative assessment is that it would allow for a differentiated assignment of the type of fiber concrete according to the stress–strain state of piles during driving. The latter would ensure the selection of optimal impact-resistant compositions of fiber concrete for the manufacture of driven piles, such as piles with shaft-widening and pyramidal–prismatic piles, which would have an increased carrying capacity [23,24,25,26]. This would ensure the selection of optimal impact-resistant compositions of fiber concrete for the manufacture of driven piles, such as piles with shaft-widening and pyramidal–prismatic piles, which have an increased carrying capacity [29,30,31,32].
In view of the presented arguments, the authors carried out experimental research devoted to the static and impact resistance of fiber concrete samples made with the use of different steel, polypropylene, fiberglass and basalt fibers. Special attention was paid to establishing their comparative efficiency and in the identification of regularities in their static and impact load resistance indicators, which change at two stages of sample deformation (until the first defects appear and until complete failure).
The list of fiber varieties we used was adopted due to their availability in Kazakhstan in the current period. The approach indicated in the research, consisting of the simultaneous assessment of the static and impact resistance of fiber concrete piles, was chosen the because the indicators of these properties may differ from each other depending on the type and parameters of fibers, which is undoubtedly important to consider when choosing the fibers.
2. Materials and Methods
The research was carried out in the geotechnical laboratory of the Taraz Regional University, named after M.Kh. Dulaty. The experiments involved concrete samples with dimensions of 10 × 10 × 10 cm, manufactured in accordance with the requirements of GOST 10180-2012 [33]. Two types of concrete were used: fiber-reinforced concrete and ordinary non-reinforced concrete.
2.1. Characteristics of Initial Materials
The test samples were created using fine granite sand (in compliance with GOST 8736-2014 [34]) as the concrete aggregate, along with crushed granite fractions of 5–20 mm (meeting the requirements of GOST 8267-93 [35]). The following indicators characterized concrete aggregates:
(1) Sand: modulus of grain size—2.2; bulk density—1480 kg/m3 (the density that the sand has immediately after filling, without any mechanical or moisture compaction); water absorption—6%; content of dust and clay particles—0.3%;
(2) Crushed stone: bulk density—1480 kg/m3; water absorption—0.17%; the content of grains of lamellar and acicular forms—12%;
(3) Portland cement M400 (meets the requirements of GOST 30515-2013 [30]), produced by “Jambyl Cement” LLP with the following characteristics: compressive strength at the age of 2 days—24.3 MPa; tensile strength on bending at the age of 2 days—4.6 MPa; specific surface according to Blaine—34 m2/kg; the period of initial setting—215 min; the normal density of cement dough—25.2%.
The following fibers were used as the reinforcing elements of concrete samples (Figure 1):
(1) DRAMIX 3D steel anchor fibers with factory-made curved edges (Figure 1a);
(2) Steel fibers cut from wire rope with a diameter of 1.05 mm and a length of 2, 4, and 6 cm (Figure 1b);
(3) Steel chip fibers, obtained from the waste of turning production, with the following dimensions: chip diameter 5 mm; length 6 cm; chip thickness 1.1 mm; width of the chip strip 2.5 mm (Figure 1c);
(4) Polypropylene fiber of FIBERQAZAQSTAN brand, (Figure 1d);
(5) Fiberglass fiber (Figure 1e);
(6) Basalt fiber (Figure 1f).
The basic physical and mechanical properties of fibers are presented in Table 1.

Table 1.
Basic physical and mechanical properties of fibers.


Figure 1.
Types of fibers: (a) DRAMIX 3D steel anchoring fiber; (b) steel wire rope fiber; (c) steel chip fiber; (d) FIBERQAZAQSTAN polypropylene fiber; (e) fiberglass fiber; (f) basalt fiber.
Figure 1.
Types of fibers: (a) DRAMIX 3D steel anchoring fiber; (b) steel wire rope fiber; (c) steel chip fiber; (d) FIBERQAZAQSTAN polypropylene fiber; (e) fiberglass fiber; (f) basalt fiber.


2.2. Composition and Consumption of Concrete Components
The experimental samples were subjected to two stages of tests. Each stage consisted of five series of tests with 3-times repeatability. For each test set, a separate batch of samples was produced. The total number of tested samples was 102 pieces.
The first batch consisted of samples made with different kinds of fibers (steel fibers of DRAMIX 3D mark, polypropylene, fiberglass and basalt fibers). The concrete class (B15) and percentage of reinforcement μ = 1% were assumed to be the same for all samples (percentage of reinforcement μ is the ratio of the volume of fibers to the volume of concrete).
The second batch comprised samples produced with DRAMIX 3D steel fibers but with varying percentages of reinforcement (μ = 0.5%, 1%, 2%), while maintaining the same concrete class (B15).
In the third batch, samples were made with steel DRAMIX 3D anchor fibers, but with different concrete classes (B12.5, B20, B25), while maintaining the same percentage of reinforcement (μ = 1%).
The fourth batch included specimens made with wire rope fibers of lengths 2 cm, 4 cm, and 6 cm. All the samples in this batch had the same concrete class (B15) and the same percentage of reinforcement (μ = 1%).
The fifth batch of samples consisted of specimens made with different types of steel fibers (DRAMIX 3D fibers, wire rope wires and chip fibers). The length of the fibers (6 cm), concrete class (B15) and percentage of reinforcement (μ = 1%) were the same for all samples.
Figure 2 illustrates fragments of the concrete components, the fiber concrete mixture, samples in molds, and finished samples. The consumption of fibers per 1 m3 of concrete for different percentages of reinforcement (μ) of 0.5, 1.0, and 2.0 is presented in Table 2. The consumption of concrete components is shown in Table 3.
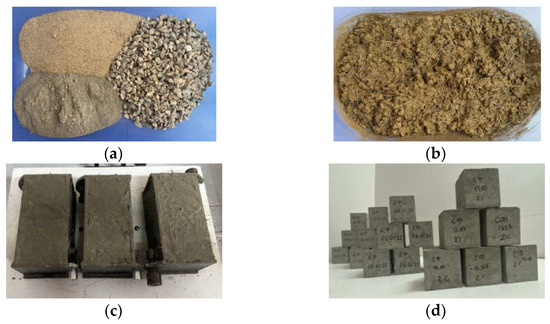
Figure 2.
Concrete components (a), fiber concrete mixture (b), samples in molds (c) and finished samples (d).
Table 2.
Consumption of fibers per 1 m3 of concrete.
Table 3.
Consumption of concrete components per 1 m3.
Fiber concrete and concrete samples after 28 days of drying in natural air-dry conditions were tested using laboratory equipment.
2.3. Equipment for Testing Samples
The modernized hydraulic press P-125 of Russian production was used for static tests of samples on the axial compressive load (Figure 3a).
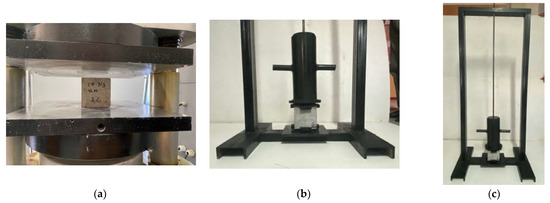
Figure 3.
Fragments of tests of fiber concrete samples: (a) for the action of axial static load; (b) for the action of axial impact load; (c) facility for impact tests of samples.
A specialized mechanical installation was developed to conduct tests on samples under repetitive dynamic (shock) loads, as depicted in Figure 3b,c. The main components of this device include:
(1) A metal frame in the shape of the letter “П (P)”, constructed from scraps of hollow square tube sections measuring 60 × 30 mm, interconnected by welded joints.
(2) The supporting part, consisting of two longitudinal beams and one transverse beam, which are scraps of channel bars with a wall thickness of 100 mm and a flange height of 40 mm. The frame struts are fixed to the longitudinal beams of the supporting part, the frame struts are fixed, and the platform with the dimensions in the plan 200 × 200 mm and thickness 10 mm is fixed to its transversal beam. A 5 mm high pin is located at the center of the platform, serving as a fastener for the removable lower-support plate placed on the platform. When the base plate is installed on the platform, the locking pin fits into a hole in the central part of the plate. The support plate features symmetrical tabs to secure the bottom of the sample when it is mounted on the plate.
(3) A guide rod made of a smooth steel bar with a diameter of 10 mm. The upper end of the guide rod is connected to the frame crossbar with a bolted joint. The lower end of the guide rod is inserted into a removable upper support plate that is 10 mm thick and placed on the upper end of the sample. The support plate has tabs to secure the upper part of the sample. A shock absorber made of 3 mm thick plywood is positioned between the upper support plate and the upper end of the sample.
(4) The hammer, weighing 15 kg, is constructed from a steel tube with a height of 30 cm and a diameter of 160 mm. The central part of the hammer features a through-hole with a diameter of 12 mm, allowing for it to move up and down on the guide rod. The hammer is manually elevated using two handles that are symmetrically placed on its side surface. The sample, which is placed between the upper and lower base plates of the device, is reset by dropping the hammer from a height of 1.0 m.
2.4. Test Methodology and Indicators for Comparative Evaluation of Results
The samples underwent static tests in accordance with the guidelines outlined in GOST 10180-2012 [29]. During the impact load tests, the total number of blows until complete destruction of the samples was recorded, along with the count of blows when the first defects appeared on the sample surface. Both initial and final defects of the specimens were recorded and described throughout the testing process. As a result, the impact testing process consisted of two stages: until the first defects appeared and until complete destruction. For a comparative quantitative assessment of the research results, the following indicators are adopted:
(1) In static tests:
- -
- For 1–5 series of tests: the coefficient of the relative strength efficiency of fiber concrete is defined as Kr = rf/rb (where rf—strength of fiber concrete sample, MPa; rb—strength of concrete sample (without fibers), MPa);
- -
- For the first series of tests: the coefficient of relative strength efficiency of non-steel fiber concrete is defined as Kir = rnf/rsf (where rnf is the strength of the non-steel fiber concrete sample, MPa; rsf is the strength of the steel fiber concrete sample, MPa);
(2) In impact tests:
- -
- For 1–5 series of tests: the coefficient of the relative efficiency of fiber concrete in terms of energy consumption appear as the first defects on the surface, defined as KEn = Efn/Ebn (where Efn—total potential energy of impacts spent on the formation of the first defects on the fiber concrete sample surface, kJ; Ebn—the same, on the surface of unreinforced concrete sample, kJ); coefficient of relative efficiency of fiber concrete on the energy expenditure for its complete destruction, defined as KEp = Efp/Ebp (where Efp is the total potential energy of impacts expended for the complete failure of the fiber concrete sample, kJ; Ebp is the same for the complete failure of the unreinforced concrete sample, kJ);
- -
- For the first series of tests: the coefficient of relative efficiency of non-steel fiber concrete in terms of energy consumption appear as the first defects on the surface, defined as KiEn = Enfn/Esfn (where Enfn—total potential energy of impacts spent on the formation of the first defects on the surface of the non-steel-fiber concrete sample, kJ; Esfn—the same, on the surface of the steel-fiber concrete sample, kJ). Coefficient of relative efficiency of non-steel-fiber concrete according to energy expenditure for its complete destruction, defined as KiEp = Enfp/Esfp (where Enfp is the total potential energy of impacts expended on the complete destruction of the non-steel fiber concrete sample, kJ; Esfp is the same, on the complete destruction of the steel fiber concrete sample, kJ).
In impact tests of fiber concrete, researchers use energy indicators as criteria to compare their impact co-resistance, strength and endurance. These include:
- -
- The number of impacts sustained by the test sample until failure [21,28];
- -
- The sum of potential energy of blows for the average length of cracks formed on the faces of the sample during testing [14].
- -
- Specific impact toughness, taken as the ratio of the total potential energy spent on the fracture of the sample to its volume [28].
Apparently, the above coefficients KEn, KEp, KiEn and KiEp, which were adopted by us for a comparative assessment of research results, are somewhat different from the mentioned indicators, and were established on the basis of the hammer’s energy costs for the formation of the first sample defects and the energy cost of their complete destruction. This approach is caused by the assumption of the possible non-identical nature of the dynamic resistance of different types of fiber concrete at different stages of deformation. On this basis, the following sample deformation criteria were adopted in the research:
- -
- Stage of the formation of the first defects: Individual surface hairline cracks with an opening width not exceeding 0.1 mm and a spreading length not exceeding 20 mm; chips in the upper part and corners of the samples, with a total area not exceeding 10%.
- -
- Stage of complete destruction: Mass oblique and/or vertical cracks with an opening width exceeding 2 mm; extensive chipping of the concrete specimen covering an area up to 60%; loosening of the concrete specimen and exposure of fibers; loss of integrity and stability of the sample.
The deformation criteria corresponding to the stage of formation of the first defects are taken from the requirements of regulatory documents [36,37], which establish the serviceability of driven reinforced concrete piles in production conditions.
3. Research Results
Test results of samples testing under the axial static load are presented in Table 4, Table 5, Table 6, Table 7, Table 8 and Table 9. The tables show the averaged strength values of the samples.
Table 4.
Results of one series of axial static tests.
Table 5.
Results of two series of static tests.
Table 6.
Results of three series of axial static tests.
Table 7.
Test results of unreinforced concrete samples.
Table 8.
Results of four series of static tests.
Table 9.
Results of series 5 static tests.
Table 4 shows that all types of fiber concrete relative to unreinforced concrete are effective (Kr > 1.0). Moreover, the most effective is fiber concrete with steel fibers (Kr = 1.2). Of the concretes with non-steel fibers, the highest efficiency is characteristic of concrete with basalt fibers (Kr = 1.15), and the lowest was obtained for concrete with polypropylene fibers (Kr = 1.02).
In terms of compressive strength, all types of non-steel fiber concretes are not effective compared to steel fiber concrete (KiR < 1.0). At the same time, the lowest index is characteristic of concrete with polypropylene fibers (Kir = 0.85). The Kr and Kir coefficients can provide a rough estimation of the strength of unreinforced concrete based on the known strength of unreinforced concrete and steel fiber concrete, respectively. Increasing the volumetric content of steel fibers in the concrete positively affects its compressive strength (Table 5) (Kr > 1.0). The greatest effect is achieved when the percentage of concrete reinforcement μ = 2% (Kr = 1.46). Therefore, increasing the percentage of reinforcement μ by 2 and 4 times leads to an enhancement of steel fiber concrete strength rsf by 11.3 and 37.5%, respectively. The dynamics of changes in the strength of steel fiber concrete rsf with an increase in the percentage of reinforcement μ slightly differ from the results of studies presented in [28]. In that study, the increase in the strength of steel fiber concrete rsf is observed when changing the percentage of reinforcement μ from 0.5 to 1.5%, while in our studies this occurred when changing the percentage of reinforcement from 0.5 to 2.0%, which indirectly confirms the research results in [21].
The dependency of Kr = f(μ), is described by a rectilinear function (Figure 4), yielding the following formula to predict the strength of steel fiber concrete based on the concrete strength and percentage of steel fiber reinforcement.
where a, b—coefficients equal to 0.277 and 0.89, respectively.
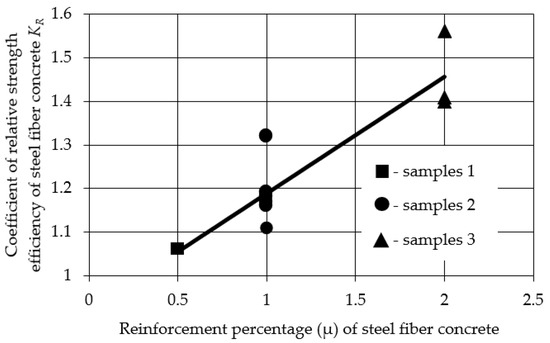
Figure 4.
Dependence of the Kr coefficient on the percentage of reinforcement μ.
The reliability value of the approximation of data by Formula (1) makes r2 = 0.998. When obtaining the correlation dependency Kr = f(μ), the results of tests of steel fiber concrete, presented in the first line of Table 4, were taken into account.
The strength in the concrete class is accompanied by an increase in the strength of steel fiber concrete (Table 6). The values of the Kr coefficient exceeded 1.0, and their dynamics of change testify to the effectiveness of the use of steel fibers for the reinforcement of concretes of higher classes. The increase in concrete class from B12.5 to B15, B20 and B25 led to an increase in steel fiber concrete strength by 31.3, 42.4 and 80.5%, respectively (Table 4, Table 5 and Table 6), whereas the strength of unreinforced concrete increased by 27.9, 31.07 and 61.88%, respectively, as its class increased (Table 7). The difference between these data for concrete classes B15, B20, and B25 was 3.36, 11.33, and 18.62%, respectively. The reason for this is probably the increase in the adhesion of steel fibers to the concrete mixture as the consumption of cement binder of concrete increases, which occurred with an increase in the concrete class.
The dependence of the Kr coefficient on the concrete class of steel fiber concrete is described by a logarithmic function (Figure 5), which gives the following formula for predicting the strength of steel fiber concrete depending on its concrete class:
where 𝑐, 𝑚—coefficients equal to 0.19 and 0.683, respectively; B—class of concrete by compressive strength (in numbers).
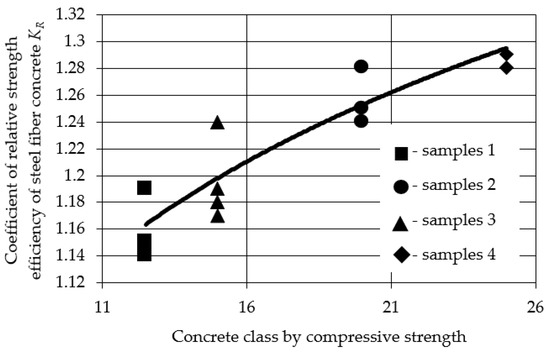
Figure 5.
Dependence of Kr coefficient on the compressive strength class of concrete.
The value of the reliability of the data approximation in Formula (2) is r2 = 0.990.
The test results presented in Table 8 show that the length of steel rope fibers has little effect on the strength of steel fiber concrete. The values of the Kr coefficient do not exceed 1.0. An increase in the length of rope fibers l by 2 and 3 times leads to an increase in the strength of rope steel fiber concrete r𝑡sf by 1.9 and 4.9%, respectively.
The dependence Kr = f(l) is described by a rectilinear function (Figure 6), which gives the following formula for predicting the strength of wire rope steel fiber concrete depending on the length of the fibers
where: p, 𝑡—coefficients equal 0.012 cm−1 and 1.003, respectively.
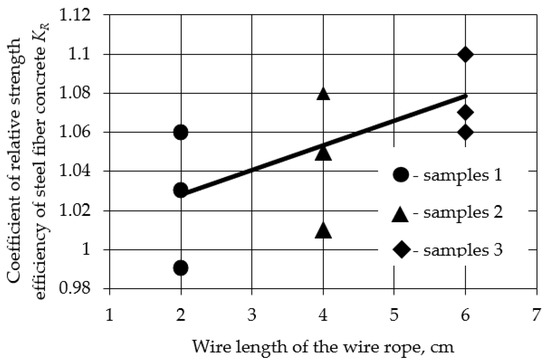
Figure 6.
Dependence of Kr coefficient on the length of wire rope fibers.
The value of the reliability of the approximation of the data by the Formula (3) is r2 = 0.986.
The compressive strength of steel fiber concrete is influenced by the type of steel fiber used. Table 9 shows that the greatest enhancement of the compressive strength is provided by the use of steel fibers of DRAMIX 3D brand for concrete reinforcement, and the smallest effect is provided by the reinforcement with wire rope fibers. The strength of DRAMIX 3D fibers rsf exceeds the strength of steel chip fibers r𝑐sf by 0.8% and the strength of wire rope fibers r𝑡sf by 11.2%.
Table 10, Table 11, Table 12, Table 13, Table 14 and Table 15 present the results of the testing samples under repeated impact loads, showing the average values of the total energy expended by the hammer.
Table 10.
Results of one series of impact tests.
Table 11.
Results of two series of impact tests.
Table 12.
Results of three series of impact tests.
Table 13.
Test results of unreinforced concrete samples.
Table 14.
Results of four series of impact tests.
Table 15.
Results of the fifth series of impact tests.
According to Table 10, all types of fiber-reinforced concrete exhibit significant effectiveness in terms of impact resistance when compared to unreinforced concrete (KEn and KEp > 1.0), especially when testing specimens until complete failure (KEp = 1.73–8.11). Prior to the emergence of any surface defects, fiber concrete with basalt fibers demonstrates the highest impact resistance (KEn = 2.05) and the lowest is demonstrated for fiber concrete with steel fibers (KEn = 1.28). Fiberglass and polypropylene fiber concrete samples occupy the second and third positions, respectively. However, the ranking of specimens in terms of impact resistance underwent significant changes when they reach complete failure. At this stage, fiber concrete with polypropylene fibers exhibits the greatest impact resistance (KEp = 8.11), while fiberglass fiber concrete demonstrates the lowest (KEp = 1.73). The samples of fiber concrete with basalt and steel fibers occupy the second and third positions, respectively.
All types of non-stabilized fiber concrete (KiEn > 1.0) are effective with respect to steel fiber concrete at the first stage of impact loading of the samples (before the appearance of the first defects). Specifically, fiber-reinforced concrete with basalt fibers demonstrates the highest effect (KiEn = 1.6), while fiber-reinforced concrete with polypropylene fibers shows the lowest effect (KiEn = 1.04). During the second stage of force loading on the specimens, fiber-reinforced concrete with polypropylene fibers proved to be the most effective (KiEp = 3.17) while fiber-reinforced concrete with basalt fibers was the least effective (KiEp = 1.17). Fiber concrete with fiberglass fibers is ineffective relative to steel fiber concrete (KiEp < 1.0).
As the percentage of reinforcement of steel fiber concrete increases, its resistance to impact load increases (Table 11). The greatest effect is achieved at a percentage of reinforcement μ = 2%. Increasing the percentage of reinforcement by 2 and 4 times leads to an increase in the energy expended by the striker for the formation of the first defects by 5.55% and 20.6%, respectively, and the energy required for complete failure of the specimens increases by 1.39 times and 2.7 times, respectively. The dynamics of changes in the energy expenditure Esfn and Esfp with an increase in the percentage of reinforcement μ are qualitatively close to the data presented in [21].
The dependences KEn = f(μ) and KEp = f(μ) are described by rectilinear functions (Figure 7 and Figure 8), which provide the following formulas for predicting the energy costs of the hammer Esfn and Esfp, taking into account the content of steel fibers in concrete
where: 𝑘′, 𝑞′—coefficients equal 0.175 and 1.165, respectively; 𝑘″, 𝑞″—coefficients equal 2.058 and 0.615, respectively.
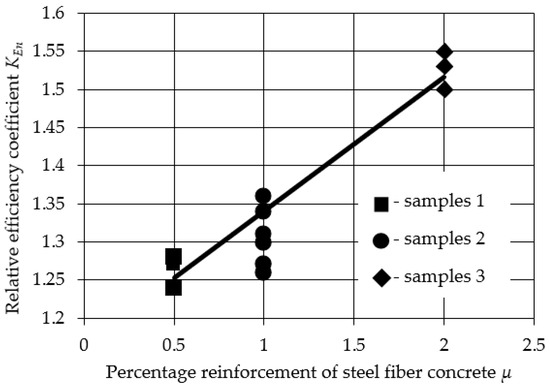
Figure 7.
Dependence of the KEn coefficient on the percentage of reinforcement μ.
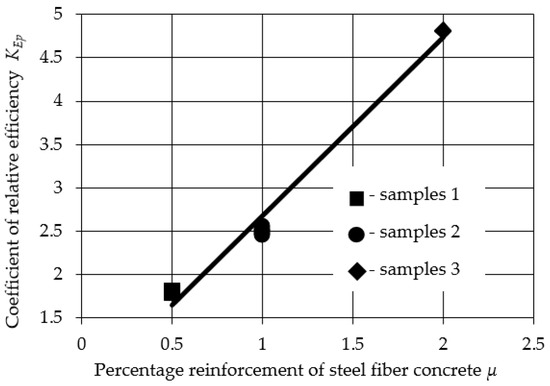
Figure 8.
Dependence of the KEp coefficient on the percentage of reinforcement μ.
The reliability values of the approximation of data by Formulas (4) and (5) are r2 = 0.995 and r2 = 0.987, respectively. When obtaining the correlation dependences KEn = f(μ), and KEp = f(μ), the test results of steel fiber concrete presented in the first line of Table 10 were taken into account.
Increasing the concrete class causes an increase in the impact resistance of steel fiber concrete. Thus, it follows from Table 12 that the values of coefficients KEn and KEp are greater than 1.0 and can reach 2.28 and 3.17, respectively.
Raising the concrete class from B12.5 to B15, B20 and B25 leads to an increase in energy costs of steel fiber concrete Esfn and Esfp, respectively, by 1.25–2.86 and 1.23–2.64 times (Table 10, Table 11 and Table 12). Similar energy costs, but related to unreinforced concrete, increase by 1.16–1.50 and 1.07–1.78 times, respectively, as the concrete class increases (Table 13). The difference between the data presented for concrete classes B15, B20, and B25 is 10.59–135.61% and 18.00–84.71%, respectively. These results indicate that the higher the class of concrete, the higher the effect of using steel fibers for its reinforcement.
The dependences of KEn and KEp on concrete class of steel fiber concrete are described by rectilinear functions (Figure 9 and Figure 10), which provide the following formulas for predicting the energy costs of hammer Esfn and Esfp with regard to the concrete class of compressive strength
where: 𝑤′, 𝑣′—are coefficients equal to 0.090 and 0.019, respectively; 𝑤″, 𝑣″—coefficients, respectively, are equal to 0.077 and 1.256; B—class of concrete for compressive strength (in numbers).
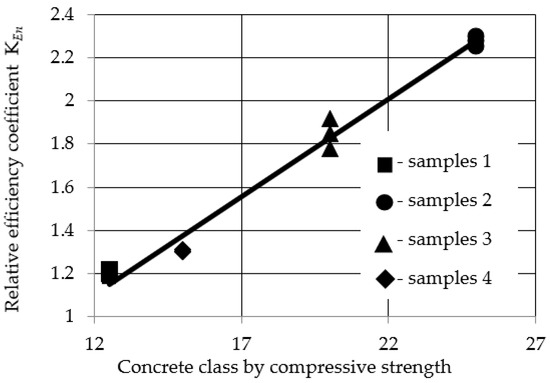
Figure 9.
Dependence of the coefficient KEn of the concrete class of compressive strength.
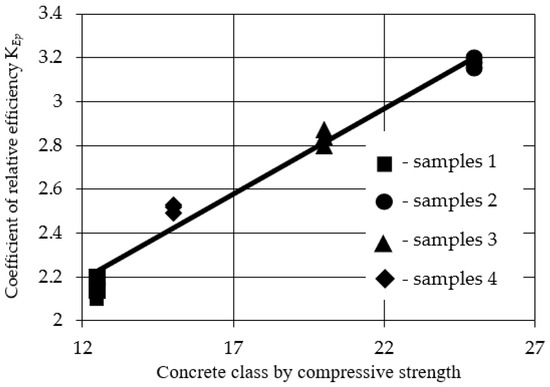
Figure 10.
Dependence of the coefficient KEp of the concrete class of compressive strength.
The reliability values of the approximation of data by Formulas (6) and (7), respectively, are r2 = 0.988 and r2 = 0.973. In obtaining the correlation relationships presented in Figure 10 and Figure 11, the results of steel fiber concrete tests, given in Table 10 (line 1) and in Table 11 (line 2), were taken into account.
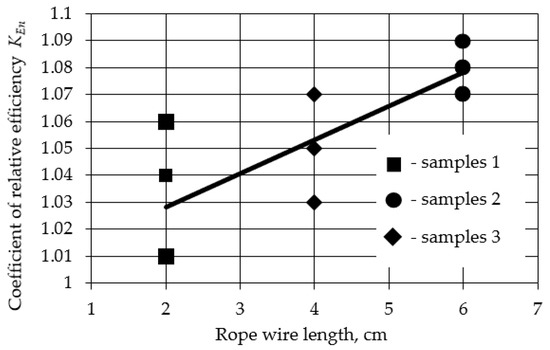
Figure 11.
KEn coefficient dependence on the length of wire rope fibers.
The test results presented in Table 14 indicate that, at the first stage of testing, the specimens (before the first defects appear) and the length of steel rope fibers has a small positive effect on the strength of steel-fiber concrete KEn = 1.03−1.08). At the second stage of the test samples (up to their complete destruction), this effect is more significant. Thus, at this stage of tests, the increase in the length of rope fibers l by 2 and 3 times leads to an increase in the energy cost of the hammer E𝑡sfp of 12.5 and 36.6%, respectively.
The dependences KEn = f(𝑙) and KEp = f(𝑙) are described by rectilinear functions (Figure 11 and Figure 12), which provide the following formulas for predicting the energy costs E𝑡sfn and E𝑡sfp depending on the fiber length
where: 𝑧′, 𝑗′—coefficients equal 0.012 cm−1 and 1.003, respectively; 𝑧″, 𝑗″—coefficients equal 0.11 cm−1 and 0.956, respectively.
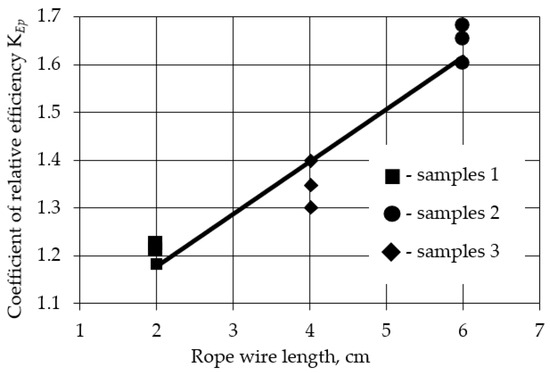
Figure 12.
KEp coefficient dependence of wire rope fibers length.
The reliability values of the approximation of data by Formulas (8) and (9), respectively, are r2 = 0.986 and r2 = 0.967.
The type of steel fiber also has a positive influence on the impact resistance of steel-fiber-reinforced concrete. Table 14 shows that the greatest effect is achieved when steel fibers of DRAMIX 3D brand are used to reinforce concrete, and the smallest effect is provided when wire rope fibers are used to reinforce concrete. During the initial stage of testing, the energy expended by the striker for DRAMIX 3D fiber-reinforced concrete exceeds the corresponding expenditure for steel filament fibers and wire rope fiber-reinforced concrete by 14.8% and 19.0%, respectively. During the second stage of testing, these differences increase to 38.1% and 55.8%, respectively. These findings indicate that the difference in impact resistance between the compared steel-fiber-reinforced concretes increases as defects develop.
4. Conclusions
The presented research results allow for us to draw the following conclusions:
(1) The type of fiber has a positive influence on the static compressive strength of fiber-reinforced concrete. The highest resistance is characteristic of fiber-reinforced concrete reinforced with DRAMIX 3D steel fibers. A slightly lower resistance is observed in fiber-reinforced concrete reinforced with basalt fibers.
(2) Static resistance of steel-fiber-reinforced concrete DRAMIX 3D increases with the volumetric content of the fibers and the compressive strength class of the concrete. The greatest effect is achieved with a percentage of reinforcement μ = 2%, and for concrete of class B25 in terms of compressive strength;
(3) Fiber concrete reinforced with chip and wire rope steel fibers is inferior to fiber concrete with a steel fiber brand DRAMIX 3D in terms of static resistance. Increasing the length of wire rope steel fibers by 2–3 times causes a slight increase in the strength of fiber-reinforced concrete.
(4) The impact resistance of fiber-reinforced concretes reinforced with basalt, glass, and polypropylene fibers is higher than that of fiber-reinforced concrete reinforced with DRAMIX 3D steel fibers. Specifically, before the appearance of initial defects, the best resistance is observed in fiber-reinforced concrete with basalt fibers, while at the point of complete failure, it is highest for fiber-reinforced concrete with polypropylene fibers.
(5) The impact resistance of fiber-reinforced concrete is higher with a higher volume fraction of DRAMIX 3D steel fibers and a higher concrete strength class. The effect of these factors is more significant than in the static loading of fiber-reinforced concrete.
(6) The impact resistance of fiber concrete reinforced with chip and wire rope steel fibers is lower than that of fiber concrete reinforced with DRAMIX 3D steel fibers. Increasing the length of wire rope steel fibers by 2–3 times has a negligible effect on the impact resistance of fiber-reinforced concrete before the appearance of initial defects, but this becomes more significant when approaching complete failure;
(7) The presented correlation dependencies have sufficient reliability, indicating their potential use for an approximate prediction of the strength and energy parameters of fiber-reinforced concretes in comparative assessments.
In conclusion, it can be noted that static compressive strength and impact resistance of fiber concrete may not be identical, i.e., the high static strength of fiber concrete does not always provide a high impact resistance. The impact resistance of fiber concrete when tested before the first defects appear is always lower than when it is tested before total failure. When choosing fiber-reinforced concrete for pile construction, it is advisable to consider impact resistance as the main criterion, ensuring that defects do not exceed the allowable level.
Author Contributions
Conceptualization, B.I. and S.N.; methodology, B.I. and S.N.; formal analysis, B.I., S.N. and A.Y.; writing—original draft, B.I., S.N. and A.Y. All authors have read and agreed to the published version of the manuscript.
Funding
This research has been funded by the Science Committee of the Ministry of Education and Science of the Republic of Kazakhstan (Grant No. AP13268763). Any opinions, findings, conclusions, or recommendations expressed in this material are those of the researchers and do not necessarily reflect the views of the Ministry of Education and Science of the Republic of Kazakhstan.
Data Availability Statement
Data will be made available on request.
Acknowledgments
The authors grateful to Science Committee of the Ministry of Education and Science of the Republic of Kazakhstan.
Conflicts of Interest
The authors declare no conflict of interest.
References
- Klyuyev, S.V. Fiber-reinforced concrete and products on its basis. Int. Res. J. 2015, 3, 70–73. Available online: https://research-journal.org/archive/3-34-2015-april/fibrobeton-i-izdeliya-na-ego-osnove (accessed on 28 April 2023).
- Klyuev, S.V.; Klyuev, A.V.; Vatin, N.I. Fiber concrete for the construction industry. Mag. Civ. Eng. 2018, 84, 41–47. [Google Scholar] [CrossRef]
- Pukharenko, Y.; Panteleev, D.; Zhavoronkov, M. Influence of fiber type and matrix composition on adhesive strength in fiber reinforced concreting. Russ. Automob. Highw. Ind. J. 2022, 19, 436–445. [Google Scholar] [CrossRef]
- Levkovich, T.I.; Mevlidinov, Z.A.; Fedin, N.A. Application of fibro concrete mixture at construction of bases and coatings automobile roads. Russ. J. Transp. Eng. 2020, 3, 45–56. [Google Scholar] [CrossRef]
- Nazhuev, M.P.; Khalyushev, A.K.; Tkach, P.S.; Efimov, I.I.; Sanin, I.S.; Kurbanov, N.S.; Orlov, M.G. Efficiency of using various types of fiber and coarse aggregate in vibro centrifuged concrete. Eurasian Sci. J. 2020, 2, 1–10. Available online: https://esj.today/PDF/45SAVN220.pdf (accessed on 2 May 2023).
- Ivlev, M.A.; Strugovets, I.B.; Nedoseko, I.V. Comparative assessment of the bearing capacity, crack resistance and deformability of lintels with standard and dispersed reinforcement. Izv. KGASU 2012, 22, 117–123. [Google Scholar]
- Travush, V.I.; Konin, D.V.; Krylov, A.S.; Kaprielov, S.S.; Chilin, I.A. Experimental study of composite structures for bending elements, Theory of engineering structures. Build. Constr. 2017, 4, 63–71. [Google Scholar]
- Klyuev, A.V.; Durachenko, A.V. The fiber-reinforced concrete for pavement repair on the basis of glass fiber. Int. J. Appl. Fundam. Res. 2017, 1, 207–210. [Google Scholar]
- Nakhaev, M.R. Manufacture of arches from fiber-reinforced concrete for a bridge. Bull. Dagestan State Tech. Univ. Tech. Sci. 2021, 48, 99–105. [Google Scholar] [CrossRef]
- Babaev, V.B.; Strokova, V.V.; Nelyubova, V.V. Basalt fiber as a component for micro-reinforcement of cement composites. Bull. BSTU Im. V.G. Shukhov 2012, 4, 58–61. [Google Scholar]
- Ibe, E.E.; Shugurova, A.V. Prospects for the use of fiber-reinforced concrete in the construction of hydraulic structures. Internet J. Naukoved. 2017, 9, 1–8. Available online: http://naukovedenie.ru/PDF/61TVN117.pdf (accessed on 18 April 2023).
- Nazhuev, M.P.; Samofalova, M.S.; El’shaeva, D.M.; Zherebtsov, Y.; Dotsenko, N.A.; Kurbanov, N.S.; Efimov, I.I. Influence of recipe factors on strengths characteristics of basalt fiber concrete. Bull. BSTU Named V.G. Shukhov 2021, 7, 24–32. [Google Scholar] [CrossRef]
- Talalaeva, V.F. The fiber-reinforced concrete application for irrigation and drainage facility structures repair. Ways Improv. Effic. Irrig. Agric. 2021, 3, 41–46. [Google Scholar]
- Morozov, V.I.; Pukharenko, Y.V. Efficiency of Fiber Reinforced Concrete Application in Structures Subjected to Dynamic Effects. Vestn. MGSU Proc. Mosc. State Univ. Civ. Eng. 2014, 3, 189–196. [Google Scholar]
- Wang, Y.-X.; Guo, P.-P.; Ren, W.-X.; Yuan, B.-X.; Yuan, H.-P.; Zhao, Y.-L.; Shan, S.-B.; Cao, P. Laboratory Investigation on Strength Characteristics of Expansive Soil Treated with Jute Fiber Reinforcement. Int. J. Geomech. 2017, 17, 04017101. [Google Scholar] [CrossRef]
- Wang, Y.; Guo, P.; Lin, H.; Li, X.; Zhao, Y.; Yuan, B.; Liu, Y.; Cao, P. Numerical Analysis of Fiber-Reinforced Soils Based on the Equivalent Additional Stress Concept. Int. J. Geomech. 2019, 19, 04019122. [Google Scholar] [CrossRef]
- Wang, Y.; Guo, P.; Dai, F.; Li, X.; Zhao, Y.; Liu, Y. Behavior and Modeling of Fiber-Reinforced Clay under Triaxial Compression by Combining the Superposition Method with the Energy-Based Homogenization Technique. Int. J. Geomech. 2018, 18, 04018172. [Google Scholar] [CrossRef]
- Wang, Y.; Guo, P.; Shan, S.; Yuan, H.; Yuan, B. Study on Strength Influence Mechanism of Fiber-Reinforced Expansive Soil Using Jute. Geotech. Geol. Eng. 2016, 34, 10. [Google Scholar] [CrossRef]
- Wang, Y.; Guo, P.; Li, X.; Lin, H.; Liu, Y.; Yuan, H. Behavior of Fiber-Reinforced and Lime-Stabilized Clayey Soil in Triaxial Tests. Appl. Sci. 2019, 9, 900. [Google Scholar] [CrossRef]
- Sokolova, V.F.; Kurbatov, L.G.; Borovskikh, I.N.; Rabinovich, F.N.; Sterin, V.S. On the effectiveness of the use of steel-fiber-reinforced concrete in reinforced concrete pile structures. Bases Found. Soil Mech. 1985, 6, 4–7. [Google Scholar]
- Voilokov, I.A. The use of fiber in the manufacture of piles. Eng. Constr. Mag. 2009, 8, 6–8. [Google Scholar]
- Buyle-Bodin, F.; Madhkhan, M. Seismic behaviour of steel fibre reinforced concrete piles. Mat. Struct 2002, 35, 402–407. [Google Scholar] [CrossRef]
- Akdag, C.; Ozden, G. Nonlinear behavior of reinforced concrete (RC) and steel fiber added RC (WS-SFRC) model piles in medium dense sand. Constr. Build. Mater. 2013, 48, 464–472. [Google Scholar] [CrossRef]
- Fang, O.; Jianjing, Z.; Xiaoning, D.; Jianwei, H.; Junwei, B.; Lin, D. Analysis of Load Capacity Behaviors of Steel Fiber Reinforced Concrete Piles Through Model Tests. J. Shanghai Jiao Tong Univ. 2016, 50, 364–369. [Google Scholar]
- Raju, R.A.; Akiyama, M.; Lim, S.; Kakegawa, T.; Hosono, Y. A novel casting procedure for SFRC piles without shear reinforcement using the centrifugal forming technique to manipulate the fiber orientation and distribution. Constr. Build. Mater. 2021, 303, 45–56. [Google Scholar] [CrossRef]
- Tulebekova, S.; Zhang, D.; Kim, J.; Lee, D.; Ju, H. Analytical Study of Using Fiber-Reinforced Concrete Pile Foundation for Renewable Energy Storage. In Proceedings of the 2018 Structures Congress (Structures18) Songdo Convensia, Incheon, Korea, 27–31 August 2018. [Google Scholar]
- Parfenov, A.V. Impact Endurance of Concretes Based on Steel and Synthetic Fibers: Specialty 05.23.05 “Building Materials and Products”. Dissertation for the Degree of Candidate of Technical Sciences. Ufa 2004. p. 178. Available online: https://tekhnosfera.com/udarnaya-vynoslivost-betonov-na-osnove-stalnoy-i-sinteticheskoy-fibry (accessed on 6 April 2023).
- Bekbasarov, I.; Nikitenko, M.; Shanshabayev, N.; Atenov, Y.; Moldamuratov, Z. Tapered-prismatic pile: Driving energy consumption and bearing capacity. News Natl. Acad. Sci. Repub. Kazakhstan Ser. Geol. Tech. Sci. 2021, 6, 53–63. [Google Scholar] [CrossRef]
- Bekbasarov, I.; Shanshabayev, N. Driving Features of Tapered-Prismatic Piles and Their Resistance to Static Loads. Acta Montan. Slovaca 2022, 4, 55–65. [Google Scholar] [CrossRef]
- Bekbasarov, I.; Atenov, Y. Equations Used to Calculate Vertical Bearing Capacity of Driven Piles with Shaft Broadenings. Period. Civ. Eng. 2020, 64, 1235–1243. [Google Scholar] [CrossRef]
- Bekbasarov, I.; Shanshabayev, N. Impact Dipping Pyramidal-Prismatic Piles and their Resistance to Pressure and Horizontal Load. Period. Polytech. Civ. Eng. 2021, 65, 909–917. [Google Scholar] [CrossRef]
- GOST 10180-2012; Concrete. Methods for Determining the Strength of Control Samples. Interstate Standard: Moscow, Russia, 2018; p. 36.
- GOST 8736-2014; Sand for Construction Work. Specifications. Interstate Standard: Moscow, Russia, 2019; p. 11.
- GOST 8267-93; Crushed Stone and Gravel from Dense Rocks for Construction Work. Specifications. Interstate Standard: Moscow, Russia, 2014; p. 21.
- GOST 30515-2013; Cements. General Specifications. Interstate Standard: Moscow, Russia, 2019; p. 42.
- GOST 5686-2012; Soils. Methods of Field Tests with Piles. Interstate Standard: Moscow, Russia, 2014; p. 42.
- SP RK 5.01-101-2013; Earthworks, Foundations and Foundations. Code of Rules of the Republic of Kazakhstan. JSC KazNIISA: Astana, Kazakhstan, 2015; p. 221.


Disclaimer/Publisher’s Note: The statements, opinions and data contained in all publications are solely those of the individual author(s) and contributor(s) and not of MDPI and/or the editor(s). MDPI and/or the editor(s) disclaim responsibility for any injury to people or property resulting from any ideas, methods, instructions or products referred to in the content. |
© 2023 by the authors. Licensee MDPI, Basel, Switzerland. This article is an open access article distributed under the terms and conditions of the Creative Commons Attribution (CC BY) license (https://creativecommons.org/licenses/by/4.0/).