Article

Accuracy of Non-Destructive Estimation of Length of Soil Nails

1
School of Civil Engineering, Qingdao University of Technology, Qingdao 266520, China
2
Qingdao Yegao Construction Engineering Co., Ltd., Qingdao 266520, China
3
Sichuan Lutong Detection Technology Co., Ltd., Chengdu 610097, China
4
China Southwest Geotechnical Investigation & Design Institute Co., Ltd., Chengdu 610052, China
5
School of Civil Engineering, Sun Yat-Sen University, Zhuhai 519082, China
*
Author to whom correspondence should be addressed.
Buildings 2023, 13(7), 1699; https://doi.org/10.3390/buildings13071699
Submission received: 7 June 2023 / Revised: 27 June 2023 / Accepted: 29 June 2023 / Published: 3 July 2023
(This article belongs to the Collection Innovation of Materials and Technologies in Civil Construction)

Abstract

:
The effective length of soil nails is one of the critical parameters ensuring the reinforcing effect, and its accurate estimation is of great significance for the safety of the slope and deep foundation pit supporting projects. Traditional quality insurance methods, such as nail pullout tests, suffer from a series of drawbacks including being destructive, high cost, and time-consuming. In contrast, non-destructive testing (NDT) has been increasingly applied in various engineering fields in the past decades given its advantages of not damaging the material and easy operation. However, the current application of NDT in soil nail length measurement is relatively limited, and its accuracy and reliability are yet to be quantitatively evaluated. This paper introduces three methods for estimating soil nail length based on guided wave theory and collects 116 sets of NDT data for nail length. The accuracy of the NDT in soil nail prediction is statistically analyzed using the model bias method. The results show that those methods can accurately predict the nail length with an average error of less than 3% and a low dispersion of 12%. The accuracy of the NDT methods is not affected by the hammer type or estimation method. Furthermore, this paper proposes a model calibration to the original NDT method, which improves the model’s average accuracy by 3% and reduces dispersion by 4% without increasing computational complexity. Finally, the probability distributions of the model biases are characterized. This study can provide practical tools for fast estimation of in situ nail length, which is of high significance to supporting slopes and deep foundation pits.

1. Introduction

Soil nails, steel bars encapsulated by cement columns, are widely used to reinforce soil or rocks to enhance the stability and bearing capacity of the mass. The applications include tunnels [1,2], underground mines [3], bridges [4], dams [5], slopes [6], and others. This method uses soil nails as a metal-tensioned system [7]. Consequently, the effective length of a soil nail is a critical parameter that directly affects its tensile strength and shearing capacity, thus the stability and safety of the supported structures. For this reason, the accurate measurement and monitoring of soil nail length are essential for ensuring the design integrity and performance of the soil nail system. Conventional methods of measuring soil nail length, such as pull-out tests, are often destructive, time-consuming, and expensive and may not apply to specific soil or rock formations. The traditional method for quality testing of soil nails is the pull test, which is time-consuming and destructive. More importantly, it is difficult to comprehensively reflect the effective length and compactness of a soil nail.
More sophisticated and complex soil nail systems have been designed and constructed, and as the demand for safety and quality assurance increases, non-destructive testing (NDT) techniques for soil nail length measurement has become increasingly important in recent years, being considered as a powerful supplement to the pullout tests for the assessment of nail length. Therefore, developing and validating accurate and reliable NDT models for soil nail length measurement is crucial for ensuring the safety and efficiency of geotechnical construction projects. There exist various kinds of non-destructive testing (NDT) techniques applied in real projects, such as ultrasonic testing [8,9], impact echo [10], acoustic emission [11], and electromagnetic wave [8,12] techniques. These methods can also apply to soil nailing inspection. However, their accuracy and reliability can be affected by their inherent drawbacks or external biases, such as material anisotropy, temperature, stress, equipment frequency, noise, or interference, etc. In order to address these challenges and improve the performance of soil nailing length measurement, researchers have been exploring the use of elastic wave NDT techniques, such as guided waves [13,14,15] and Lamb waves [16,17]. The development of advanced signal processing algorithms [18,19] and modeling techniques [14,20,21] has also facilitated the analysis and interpretation of elastic wave signals to provide information on the length, shape, and condition of soil nails.
Although elastic wave NDT techniques have been widely used, the accuracy of this technique in predicting soil nail length must be evaluated as the site condition is typically highly complicated. The wave reflection and refraction in in situ nails are usually different from those obtained in labs. The wave shape, attenuation, mode, etc., are all influenced by workmanship, soil condition, and construction quality. Engineers who lack of experience may fail to estimate the length of in situ nails, leading to the misjudgment of nail bearing capacity, as well as fulfillment of the design requirements. Therefore, the main work of this study is to first introduce three methods for determining the nail length from NDT elastic wave signals and then conduct a statistical evaluation and calibration of the accuracy of methods. Model accuracy is quantified using model bias, defined as the ratio of the true nail length to the NDT-predicted nail length.

2. NDT Methods for Estimating Nail Length

A guided wave is a type of ultrasonic wave, which is an elastic wave formed by the interference of longitudinal or transverse waves traveling simultaneously in an interfacial object, such as a nail, in the reflection or transformation mode [22]. The propagation of guided waves in soil nails depends on the steel bar, the grout column, and the surrounding soil or rock properties. Figure 1 shows the layered structure of a soil nail. The propagation speed and attenuation of waves with different frequencies and modes in the soil nails vary [23,24]. By taking advantage of the propagation characteristics of guided waves in solid media and analyzing the propagation signals, the length of the soil nail can be determined. The basic steps for the guided wave method to estimate the quality of soil nails are as follows. First, select the appropriate sensor and transmitter for generating and receiving guided wave signals. It is then arranged on the soil nail to ensure that the guided wave can propagate along the axial direction of the soil nail. Characteristics include the time to receive and record the pilot signal and its corresponding amplitude and frequency. Finally, the length of the soil nail and the possible defects are estimated according to these characteristics. It is clarified that this paper focuses merely upon the determination of nail length.
Figure 2 illustrates three methods to process and analyze the signals of guided waves, namely, slope attenuation, end reflection, and frequency change of the end reflection. These methods are used to determine the effective length of a soil nail. Specifically, slope attenuation refers to the decrease in energy of a wave signal as it propagates through the steel rod medium, resulting in a continuous reduction in amplitude. This gradual decrease in amplitude is caused by biases such as distance, scattering, or absorption. Different media, propagation conditions, and waveforms have varying attenuation patterns, which can be categorized into diffraction attenuation, scattering attenuation, and absorption attenuation. In particular, at the bottom of the steel rod, where it meets the boundary with the rock mass, the energy reflected into the steel rod is minimal. As shown in Figure 2a, the crossing point at which the energy is significantly weakened or reaches the end of its attenuation is defined as the bottom signal, and the corresponding distance represents the effective length of the steel rod.
The second estimation method involves the recurrence of reflection signals at the bottom of the steel rod. Both longitudinal and shear waves propagate within the rod body. Due to the cylindrical shape, there is a small part of energy leaking into the grout column, very little is radiating into the surrounding geomaterials. The wave attenuation is not significant, and thus, when it meets the end of the steel rod, it bounces back ‘strongly’, forming a clear peak in the wave signals. As shown in Figure 2b, this signal has distinct characteristics that can be differentiated from other signals.
The third estimation method is based on slight frequency changes at the bottom signal position. At the bottom of the steel rod, the mechanical impedance difference between the two media is significant, causing a frequency difference between adjacent peaks. Therefore, when the frequency of a point on the waveform record changes from high to low, i.e., λ 1 < λ 2 (see Figure 2c), it is determined that this point is the bottom signal.
According to the waveform characteristics, different methods are selected, and Equation (1) is used to estimate the effective length of the steel rod.
L = v × t 2
Here, L represents the length of soil nail, v represents the wave propagation speed, and t represents the propagation time.

3. Database of Measured and Predicted Nail Length

This section presents a broad database of soil nail length, including measured length and NDT-predicted length data. The soil nail data were from various retaining wall projects in Qingdao, a city in Shandong Province, China. Table 1 summarizes the project information, including wall geometry, soil strength properties, and nail arrangement. The soil strength properties were determined by direct shear tests on soil samples in the laboratory. The walls ranged from 6 m to 32 m with very steep facings and flattened back slopes. They were built in a wide range of soils, e.g., silty clay, sand, silt. The soil properties are all within typical ranges. The nails are spaced at a spacing of about 1.2–1.5 m vertically and horizontally. There is a hybrid wall with a height of 32 m; the slope is reinforced with soil nails and prestressed cables. In this wall, i.e., W4, the nail length is over 31 m, which is not very common in practice. Nevertheless, this is a desirable case for testing the ability of the NDT method when applied for long nails.
A total of 116 sets of non-destructive testing (NDT) data for soil nails were collected following the testing procedure: (1) attach the sensor/transducer at a location 2 cm from the nail head through a circular connector that fits the shape of the nail tendon tightly; (2) hit the nail head (tendon) with a small or a large hammer, where small hammer excites waves with low frequencies and large hammer excites waves with high frequencies; (3) record the wave signal received by the sensor through a digital oscilloscope, which is then connected to a laptop for data storage. Table 2 summarizes the information of the database, including hammer types, estimation methods, measured lengths, and NDT-predicted lengths of these soil nails. By developing this database, the errors of the three NDT methods in predicting nail length can be statistically evaluated and calibrated.
Hammers that are used to strike the head of soil nails to generate acoustic signals are specified into two types, i.e., large and small. Both types of hammers are in a cylindrical shape. The large hammer has a diameter of 40 mm, while the small hammer has a diameter of 10 mm. The waves excited from small diameter hammers have higher frequencies and are theoretically more suitable for shorter nails; meanwhile, large hammers excite waves with lower frequencies and are more suitable for longer nails.
The data show that using large and small hammers each account for 50% of the collected soil nail NDT projects. The NDT estimation methods of frequency change of end reflection, slope attenuation, and end reflection take up 48.3%, 41.4%, and 10.3%, respectively. Figure 3 displays the histogram and cumulative percentage of the true (measured) lengths of soil nails. The x-axis is the measured nail length L m ; the y-axis on the left is the relative frequency, defined as the ratio of the value of L m in a certain interval to the total number of data; the y-axis on the right is the cumulative distribution, defined as the percentage of L m data below a certain value. According to the data, the minimum true nail length is 3.00 m, the maximum is 31.60 m, and the average is 12.86 m; 50% of lengths are less than 9.0 m, and over 80% of the lengths are within 21.00 m. Figure 4 illustrates the tests carried out on site. Following the testing procedure described above, the wave signals are acquired on site and then analyzed according to the three methods introduced in Section 2 to determine the nail length. Overall, the database contains good information for the evaluation of model accuracy of the NDT methods on the length of soil nails.

4. Results of Accuracy Assessment

In this section, the model bias λ is used to quantify the accuracy of the NDT methods for nail length. The model bias λ is defined as the ratio of the true nail length to the NDT-predicted nail length. The model bias λ is treated as a random variable, with its mean representing the average accuracy of the model and its coefficient of variation (COV) characterizing the deviation between predicted and actual values. This section firstly evaluates the NDT methods using all collected data as one group; then, the data are further divided into several subsets according to hammer type and estimation method in order to discuss the impact of these factors on the estimation accuracy. In addition, this section also characterizes the probability density functions for the model biases.
Figure 5 shows the comparison between the true (measured) nail length and the NDT-predicted nail length. Visually, the measured and predicted nail lengths from all ranges are in good agreement with each other, following around the 1:1 corresponding line. By computing the bias data, it is found that the mean and COV of the bias are 1.03 and 0.12, respectively. This means that, on average, the NDT-predicted nail length is nearly accurate, i.e., just 3% shorter than the true length, and the dispersion in prediction accuracy is very low, i.e., just 12%. According to the ranking scheme proposed by Phoon and Tang [25], the accuracy of the proposed NDT methods can be considered as high. Therefore, the three NDT methods can satisfactorily predict the nail length.
Figure 6 plots the model biases, λ , against the NDT predicted nail length. The model bias λ appears to decrease from about 1.5 to 1.0 as the predicted length L n increases from about 2 m to 5 m. After that, there appears to be no apparent trend between λ and L n . A Spearman rank correlation test was conducted on the dataset, and the results showed that the Spearman correlation coefficient ρ between L n and λ is −0.65 and the p-value is 0 (less than 0.05), suggesting a statistically significant negative correlation between λ and L n at a significance level of 0.05. This is undesirable, as the model accuracy statistically depends upon the predicted value.
To further investigate the influence of hammer type and NDT estimation method on prediction accuracy, the bias data were divided into subsets, for example, λ based on small or large hammers and λ based on the frequency change of the end reflection method, the end reflection method, and the slope attenuation method. The cumulative distributions of these bias data subsets are plotted in Figure 7a,b. Visually, the distributions appears to have similar trends, suggesting no significant differences among the subsets. The bias means are 1.02 and 1.04 for the data subsets from the large and small hammers, respectively, and the bias COVs are 0.104 and 0.126, respectively. The differences between the means and the COVs are actually small. This suggests that these two subsets could be from the same population. Similar observations can be made for the method-based subset cases.
The Mann–Whitney test was applied to the two subsets based on hammer type, and the Kruskal–Wallis test was applied to those based on NDT methods. The test results were summarized in Table 3. The p-value from the Mann–Whitney test was 0.219, which is greater than 0.05, quantitatively confirming that the two bias data subsets can be considered from the same population at the 0.05 significance level. In other words, selecting either a small or big hammer has no significant effect on the accuracy of the NDT method in predicting the effective length of soil nails. The Kruskal–Wallis test results showed that the p-values were 1.000, 0.162, and 0.125; all again exceeded 0.05. Therefore, it can be concluded that the selection of hammer type and estimation method has no significant impact on the accuracy of the NDT method for soil nail length.

5. Model Calibration

While the prediction accuracy of the NDT methods is small, i.e., the average error is between 1% and 6%, as shown in Table 2, it is still desirable to make improvements given that no computational complexity is added. This section attempts to complete this improvement task. Figure 6 shows that the model bias of the original method decreases as the predicted value increases; the Spearman’s correlation coefficient is ρ = −0.65, and the p-value is 0.00, showing statistical correlation at the 0.05 significance level. Therefore, an empirical correction term can be introduced to the predicted value to improve accuracy. To be practical, the expression of the correction term should be kept simple. As a result, this section uses the simple linear function, logarithmic function, exponential function, and power function to fit the model bias against the predicted value, i.e., λ vs. L n . The power function outperformed other fittings, and the deterministic coefficient reaches R 2 = 0.44; the fitting expression M is as follows:
M = α L n β + η
where α , β , and η are empirical constants to be optimally determined based on the database. With the introduction of M , the new NDT-predicted nail length L n e w can be calculated as:
L n e w = M L n = α L n β + η L n
Accordingly, the new model bias can be calculated as = L m / L n e w . The empirical constants α , β , and η are optimally obtained by solving for the minimum value of the coefficient of variation (COV) of the new model bias while keeping the mean value of the new model bias at 1. The optimal values of α , β , and η are α = 2.56, β = −2.18, and η = 0.97 (see Table 4). The corrected model, i.e., Equation (3), has a bias mean of 1.00 and a bias COV of 0.08. This represents a 3% enhancement in the average model accuracy and a 4% decrease in the accuracy dispersion after a simple calibration. The Spearman’s rank correlation test showed no statistical correlation between the new model biases and the new NDT-predicted values.

6. Probability Distribution of λ

This section characterizes the probability distributions of the model biases for both the original and improved NDT methods. Figure 8 shows the cumulative distribution of all original and improved model biases. The (modified) Kolmogorov–Smirnov (K-S) tests were applied to the data and the results showed that the biases do not follow Normal, Log-normal, Gamma, or Weibull distributions. For cases where bias does not follow common distributions, multi-order Gaussian functions can be used to track the trend of the bias data. The effectiveness of this method in approximating highly non-linear distributions has been proven by, e.g., Yuan and Lin [26] and Lin et al. [27]. Table 5 summarizes the mathematical expressions and parameters of the second-order Gaussian model and cubic polynomial model, corresponding to the biases for the original and improved models. The coefficients of determination for both cases are all close to 1.00; thus, the fittings appear satisfactory in capturing data trends.

7. Conclusions

This study first collected 116 sets of nail length data from real soil nail wall projects and then conducted a quantitative evaluation of the accuracy of non-destructive testing (NDT) methods for predicting nail length based on statistical theory. The main conclusions are as follows:
(1)
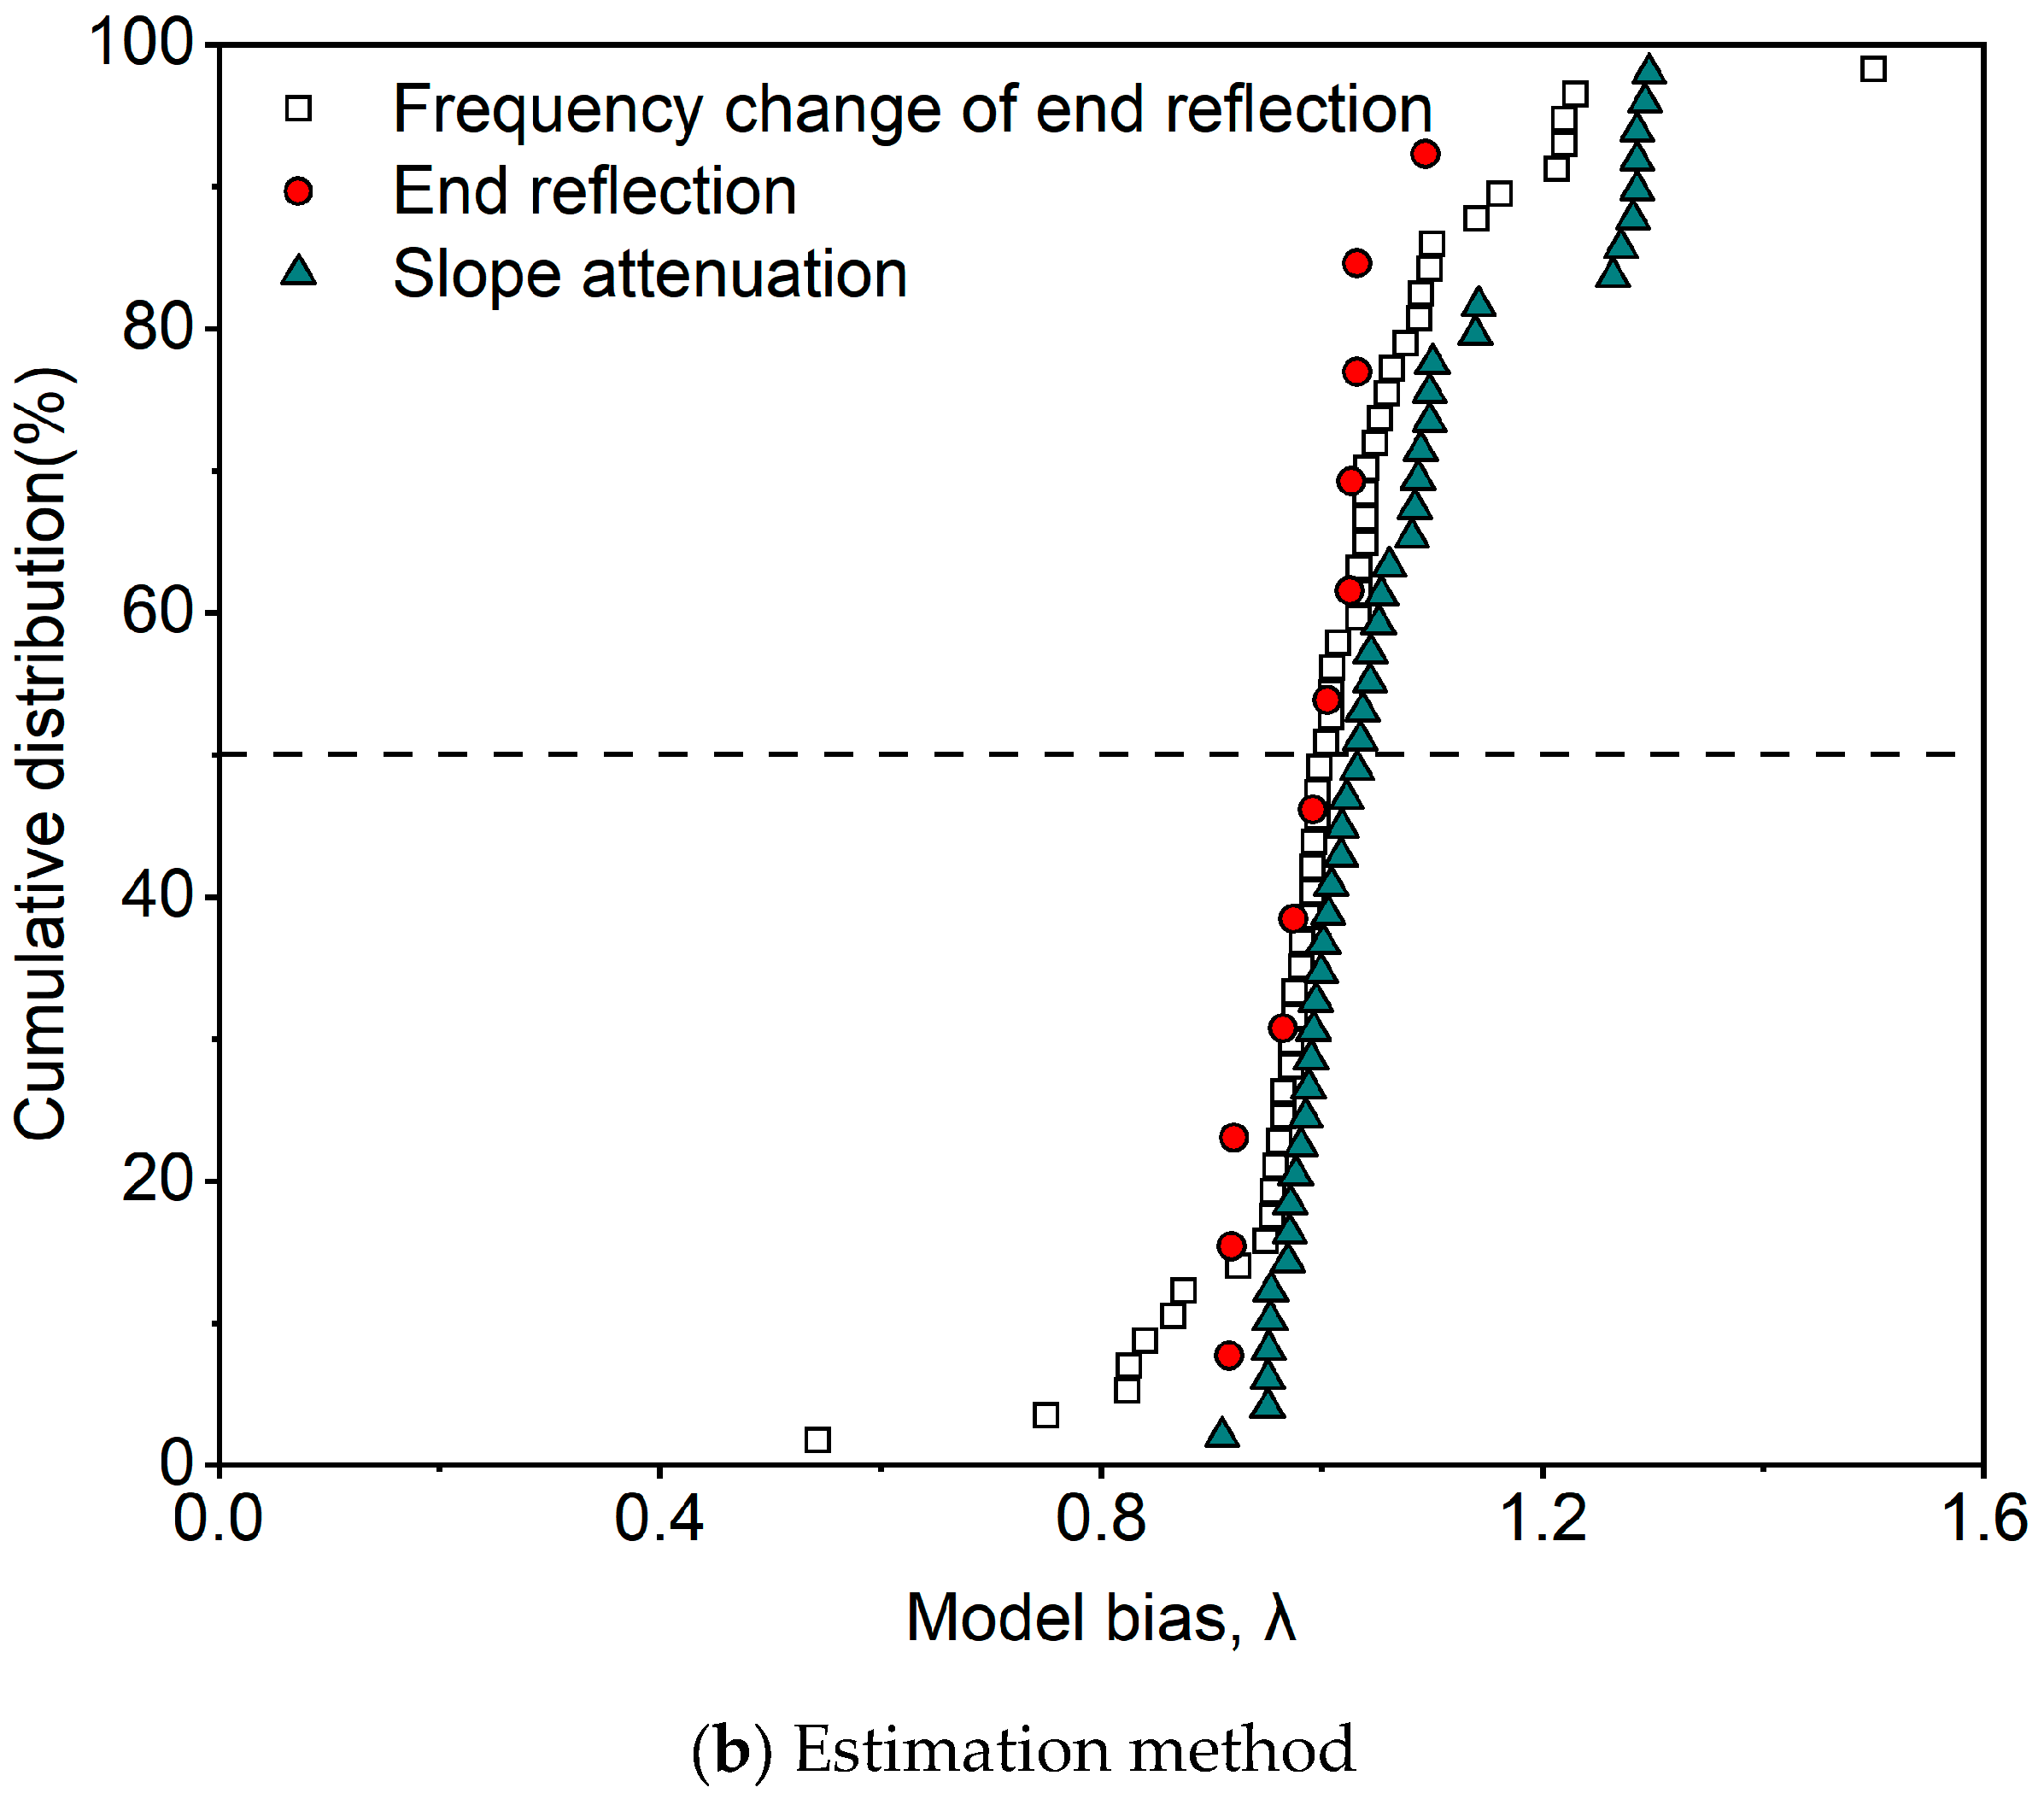
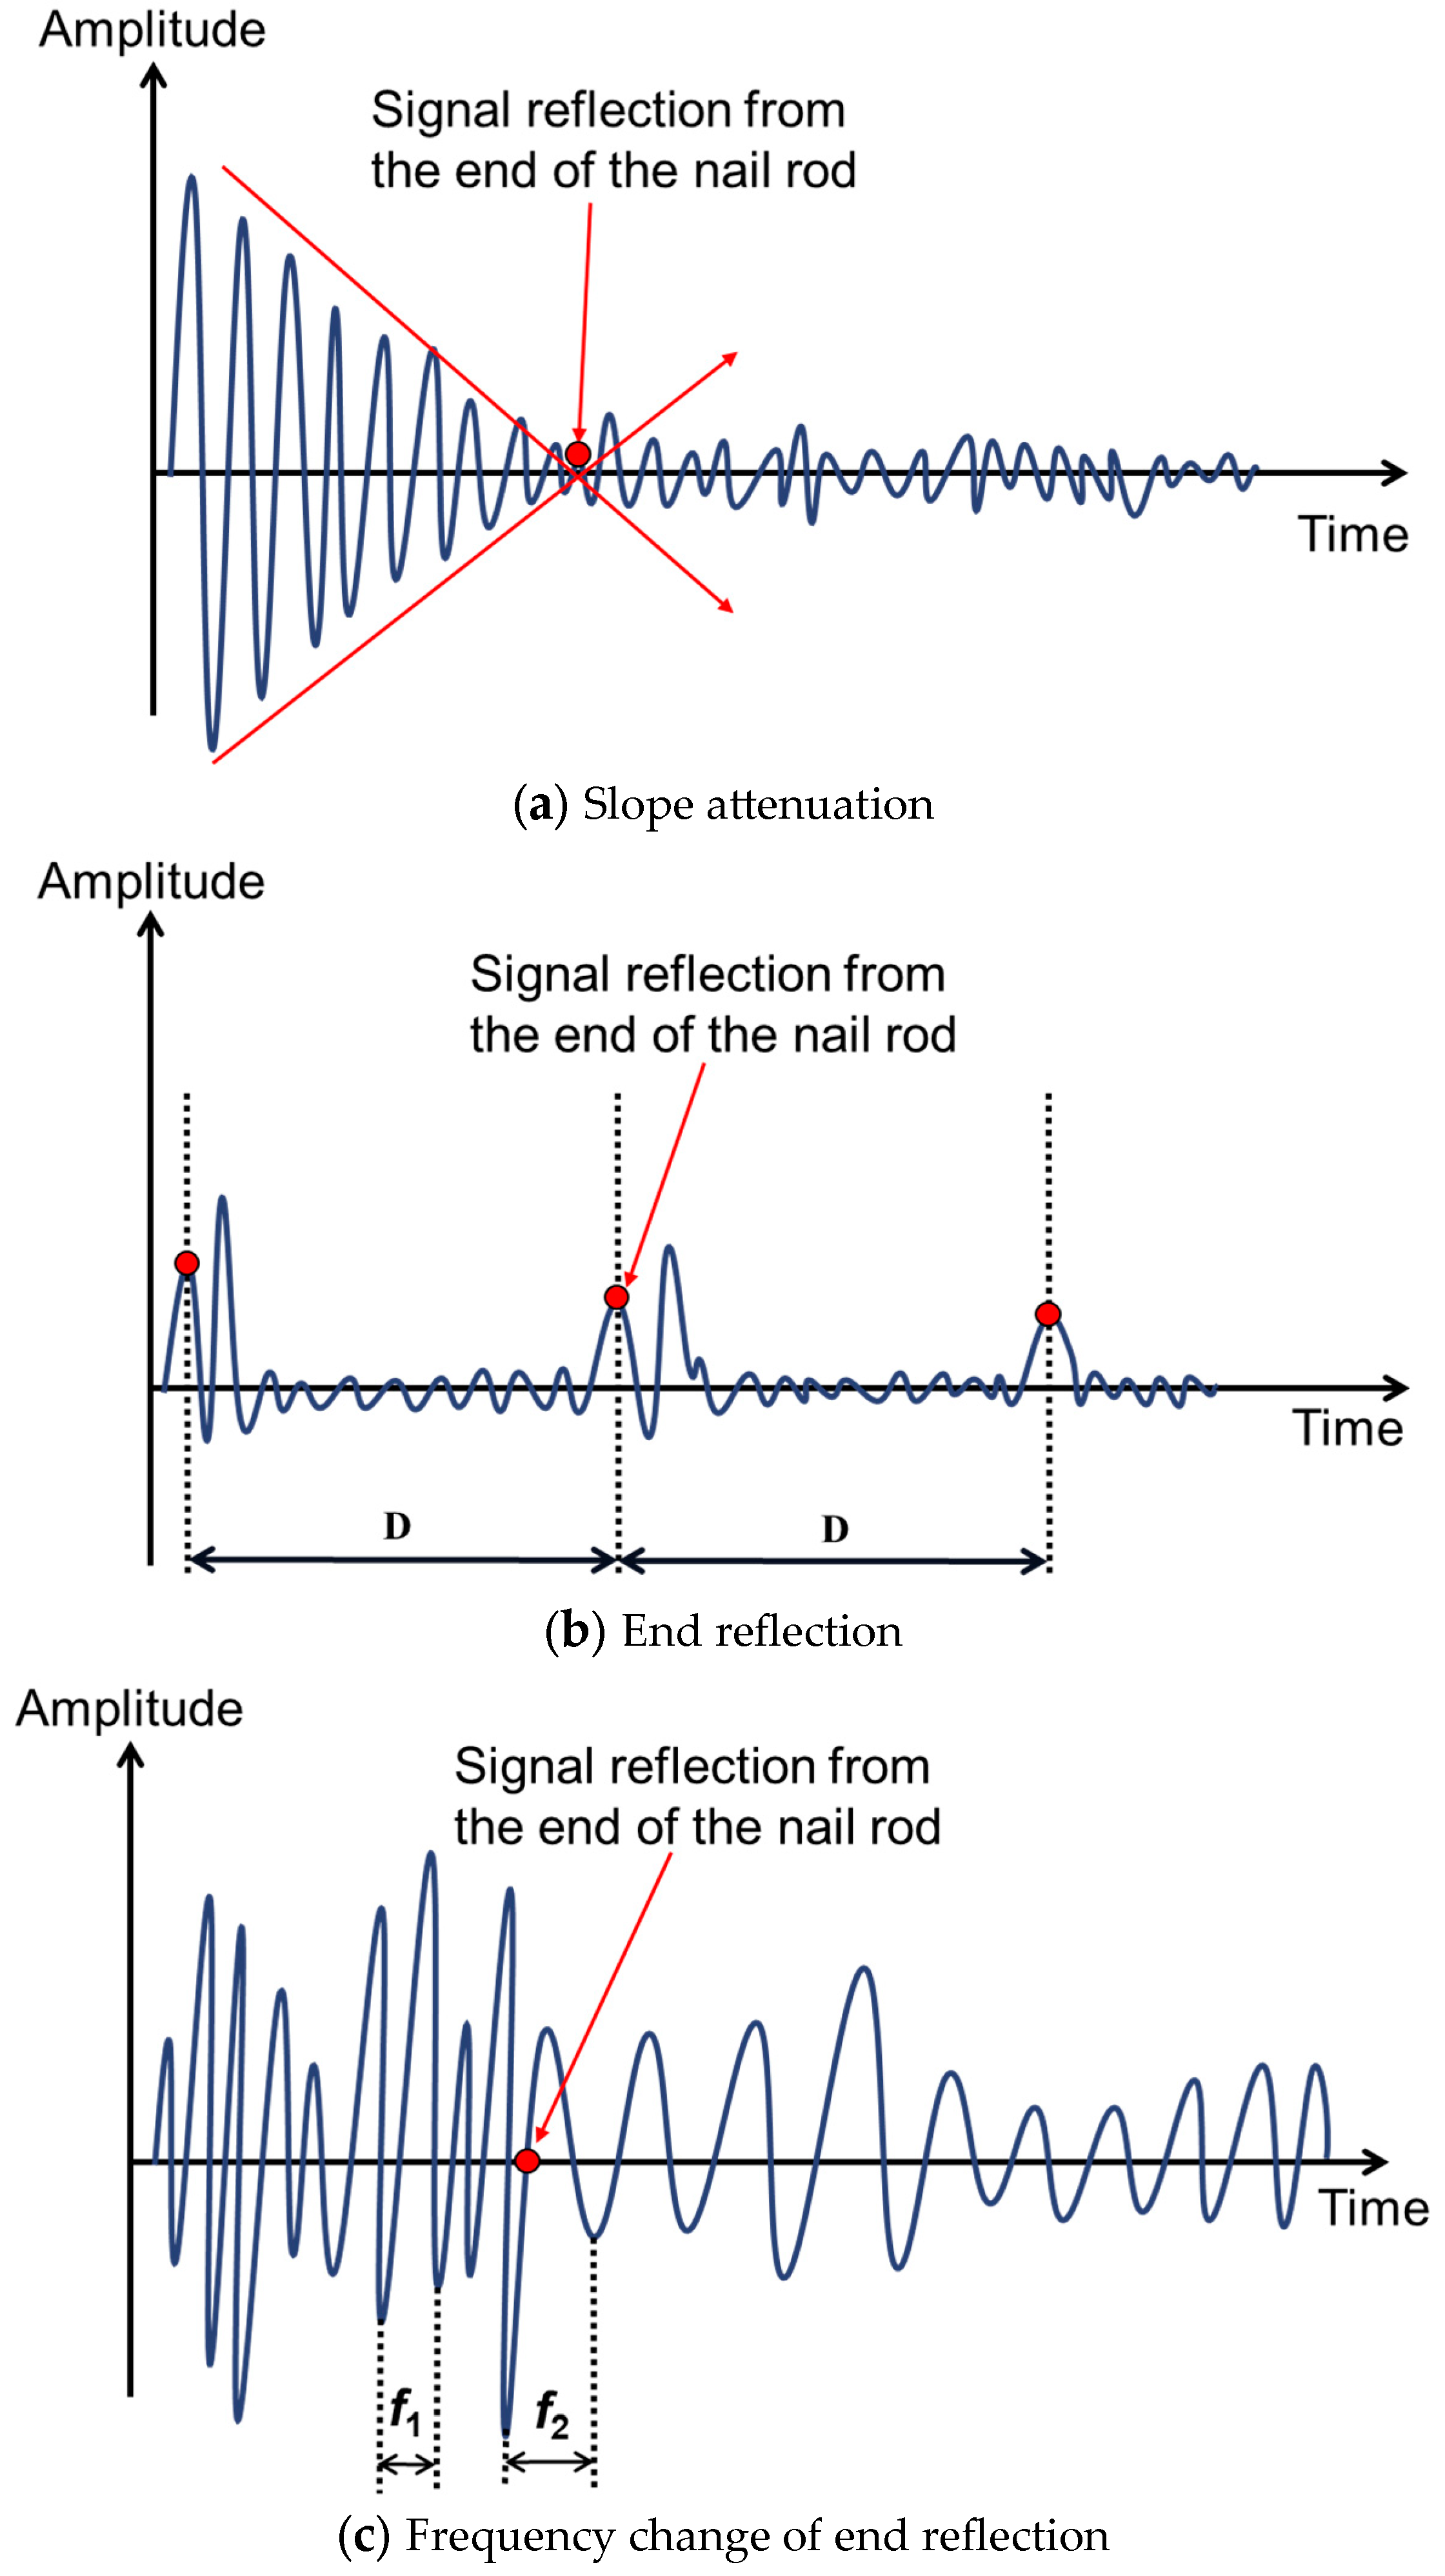
Three NDT methods for estimating soil nail length are developed. They are slope attenuation, end reflection, and the frequency change of the end reflection. On average, these NDT methods can accurately predict soil length with an error of 3%. The dispersion of prediction accuracy is low, i.e., only about 12%.
(2)
The three NDT methods have good stability in predicting soil nail length; their accuracies do not depend upon the hammer types and the method types at a level of significance of 0.05.
(3)
By introducing a simple power function to the prediction of the original NDT methods, the on-average accuracy increases by 3% and the dispersion decreases by 4%, without additional computational complexity.
(4)
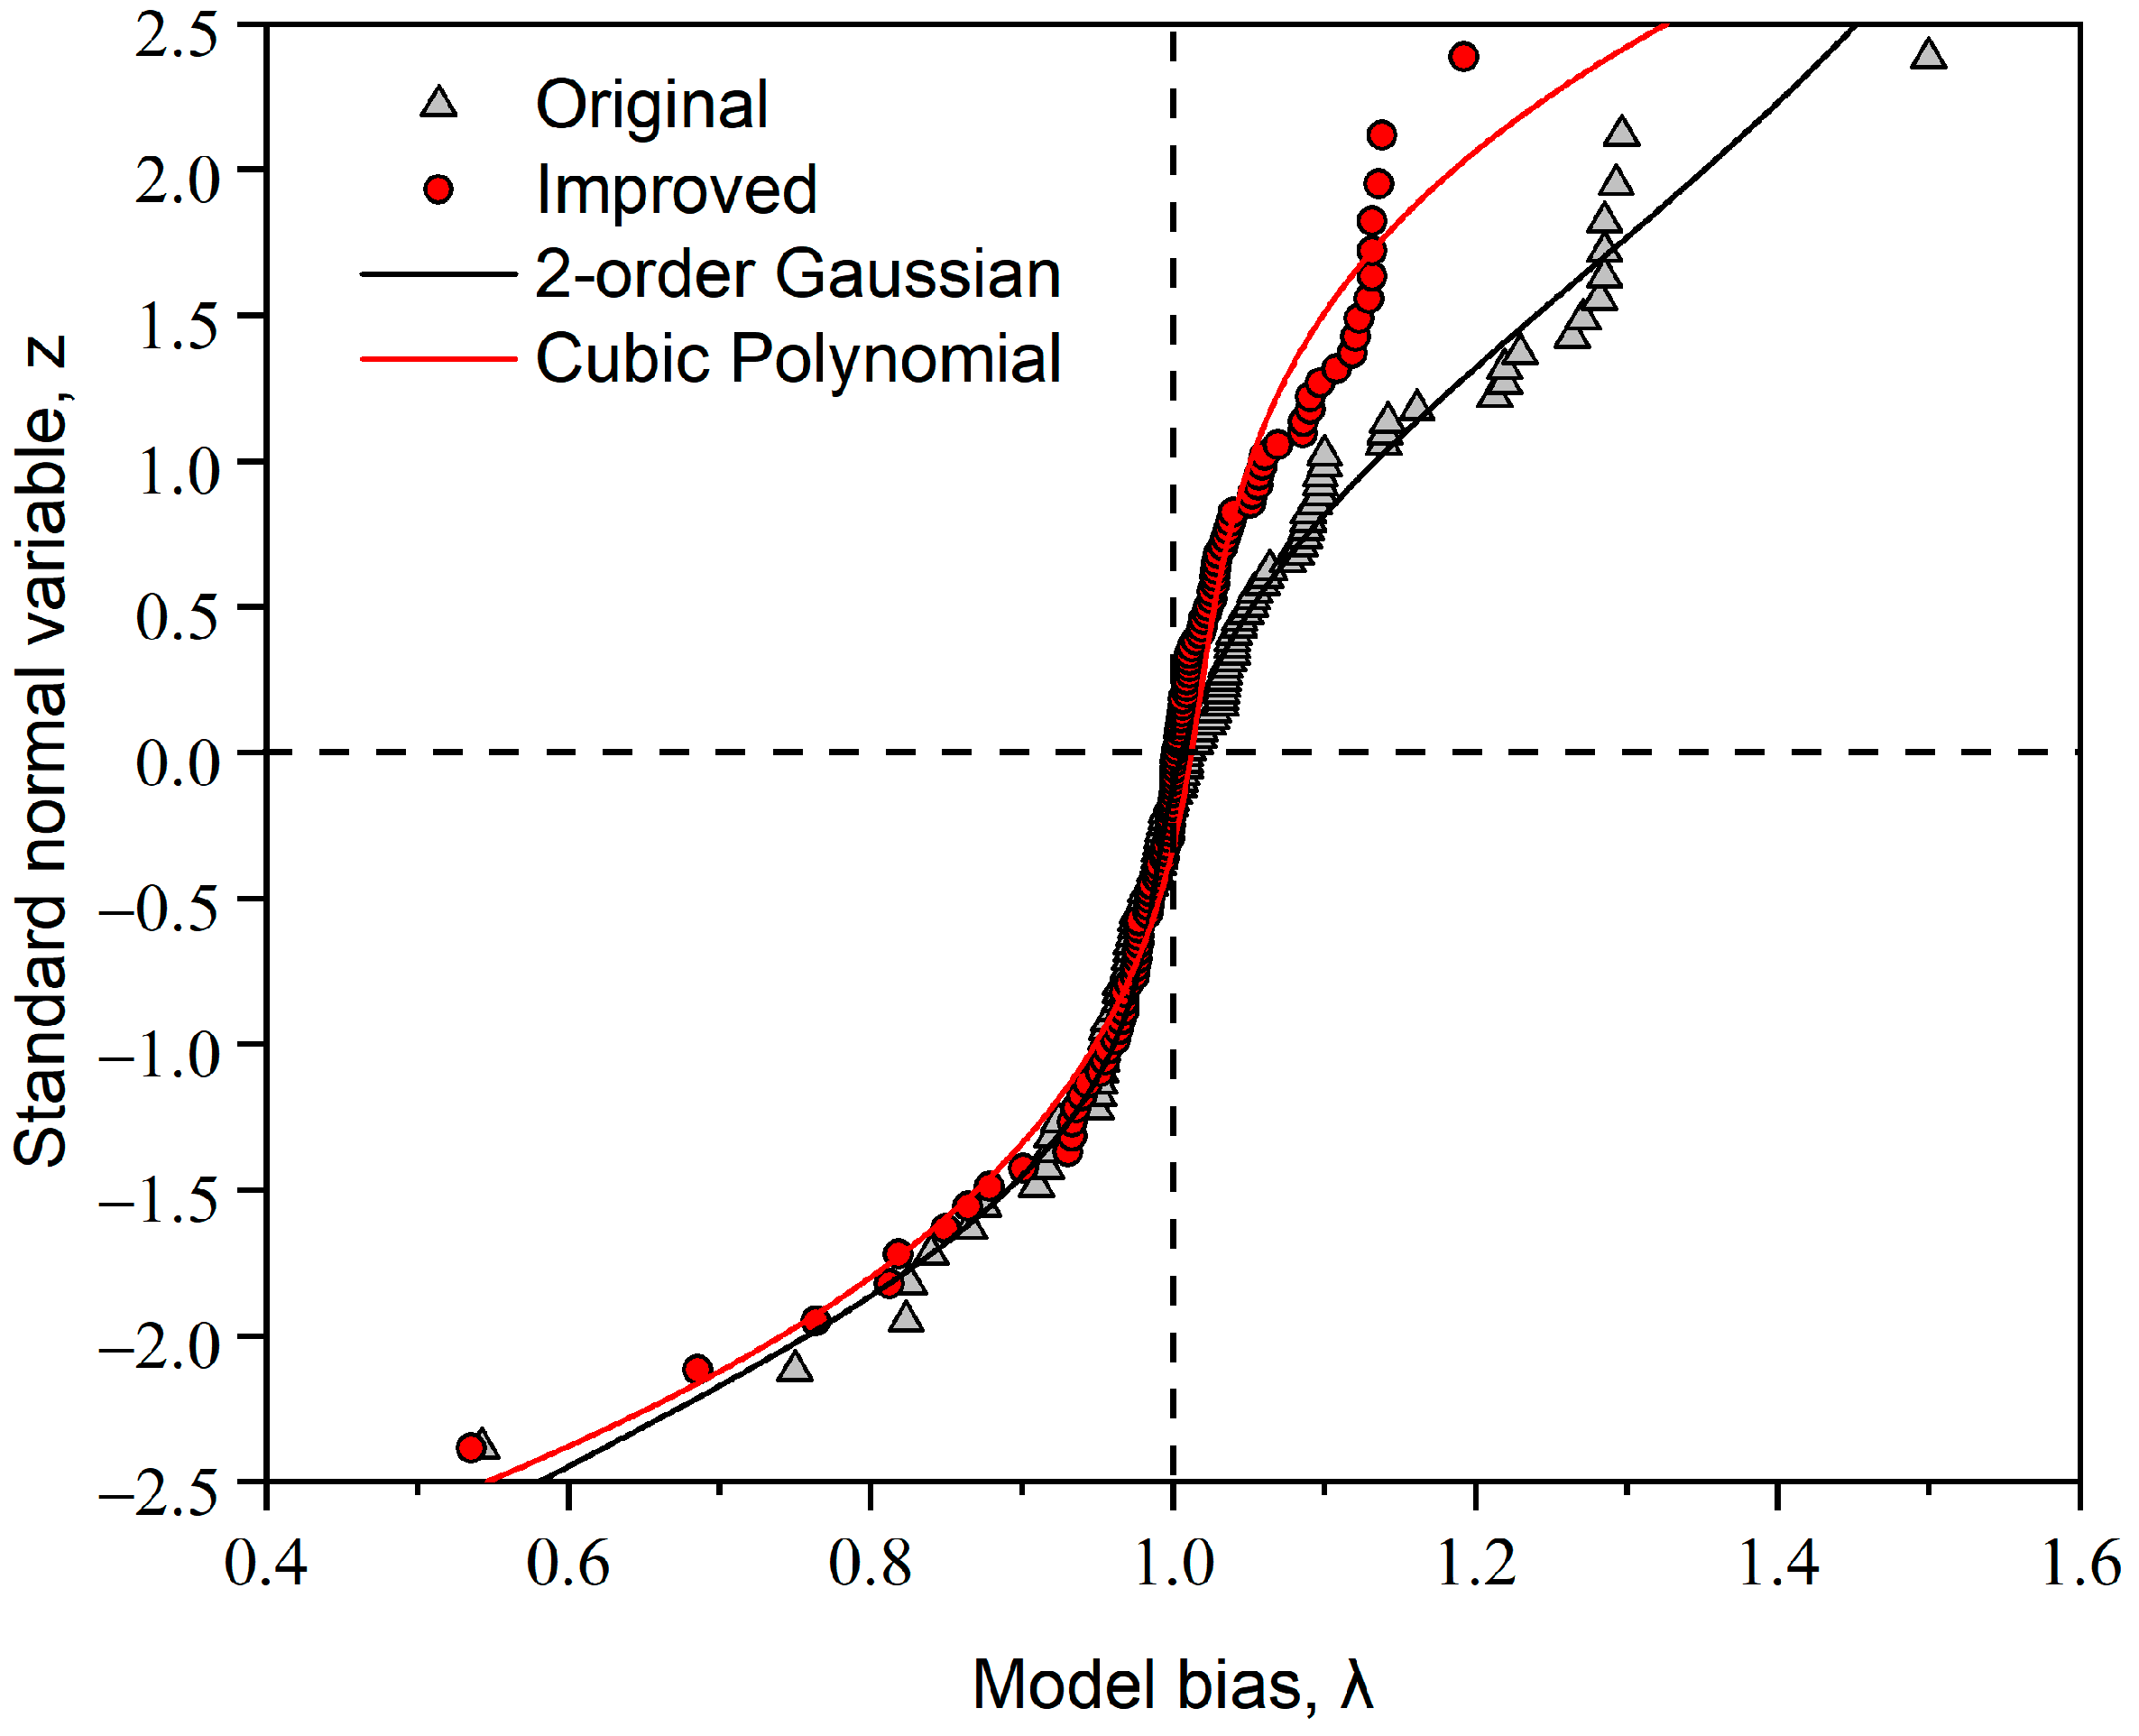
The probability distributions of the biases for the original and improved NDT methods can be approximated using second-order Gaussian and cubic polynomial functions, respectively.

Author Contributions

Methodology, Q.Z., X.L. and P.L.; Validation, J.J. and X.W.; Formal analysis, Q.Z.; Investigation, M.Z.; Resources, M.Z.; Writing—original draft, Y.W.; Writing—review & editing, J.J., X.L., X.W. and P.L.; Funding acquisition, P.L. All authors have read and agreed to the published version of the manuscript.

Funding

This research was funded by the Natural Science Foundation of Shandong Province of China (grant number: ZR2022ME143) and the National Natural Science Foundation of China (grant number: 52008408). The APC was funded by the Natural Science Foundation of Shandong Province of China (grant number: ZR2022ME143).

Data Availability Statement

Not applicable.

Conflicts of Interest

The authors declare no conflict of interest.

References

  1. Sterpi, D.; Rizzo, F.; Renda, D.; Aguglia, F.; Zenti, C.L. Soil nailing at the tunnel face in difficult conditions: A case study. Tunn. Undergr. Space Technol. 2013, 38, 129–139. [Google Scholar] [CrossRef]
  2. Seo, D.; Lee, T.; Kim, D.; Shin, J. Pre-nailing support for shallow soft-ground tunneling. Tunn. Undergr. Space Technol. 2014, 42, 216–226. [Google Scholar] [CrossRef]
  3. Bridges, C.; Gudgin, J. A soil-nailed excavation for the Brisbane Airport Link project, Australia. Proc. Inst. Civ. Eng.-Geotech. Eng. 2014, 167, 205–216. [Google Scholar] [CrossRef]
  4. Yadegari, S.; Yazdandoust, M.; Momeniyan, M. Performance of helical soil-nailed walls under bridge abutment. Transp. Geotech. 2023, 38, 100788. [Google Scholar] [CrossRef]
  5. Wang, Y.; Han, M.; Li, B.; Wan, Y. Stability evaluation of earth-rock dam reinforcement with new permeable polymer based on reliability method. Constr. Build. Mater. 2022, 320, 126294. [Google Scholar] [CrossRef]
  6. Fan, C.-C.; Luo, J.-H. Numerical study on the optimum layout of soil–nailed slopes. Comput. Geotech. 2008, 35, 585–599. [Google Scholar] [CrossRef]
  7. Liao, S.-T.; Huang, C.-K.; Wang, C.-Y. Sonic echo and impulse response tests for length evaluation of soil nails in various bonding mediums. Can. Geotech. J. 2008, 45, 1025–1035. [Google Scholar] [CrossRef]
  8. Lama, B.; Momayez, M. Review of Non-Destructive Methods for Rock Bolts Condition Evaluation. Mining 2023, 3, 106–120. [Google Scholar] [CrossRef]
  9. Shoji, M.; Hirata, A. Ultrasonic guided wave testing of anchor rods embedded in soil. In Proceedings of the 2016 IEEE International Ultrasonics Symposium (IUS), Tours, France, 18–21 September 2016; pp. 1–4. [Google Scholar]
  10. Qiao, L.; Cui, M.; Cai, Q.C. Nondestructive testing for support quality of tunnel. In Applied Mechanics and Materials; Trans Tech Publications Ltd.: Bäch, Switzerland, 2014; pp. 1815–1819. [Google Scholar]
  11. Wang, G.; Zhang, Y.; Jiang, Y.; Liu, P.; Guo, Y.; Liu, J.; Ma, M.; Wang, K.; Wang, S. Shear behaviour and acoustic emission characteristics of bolted rock joints with different roughnesses. Rock Mech. Rock Eng. 2018, 51, 1885–1906. [Google Scholar] [CrossRef]
  12. Civera, M.; Surace, C. Non-destructive techniques for the condition and structural health monitoring of wind turbines: A literature review of the last 20 years. Sensors 2022, 22, 1627. [Google Scholar] [CrossRef]
  13. Xu, M.H.; Lan, Q.Q.; Jin, W.J. Method to Detect Bolting Devices Based on Ultrasonic Guided Wave. In Applied Mechanics and Materials; Trans Tech Publications Ltd.: Bäch, Switzerland, 2012; pp. 1906–1909. [Google Scholar]
  14. Stepinski, T. Novel instrument for inspecting rock bolt integrity using ultrasonic guided waves. Measurement 2021, 177, 109271. [Google Scholar] [CrossRef]
  15. Zou, D.; Cui, Y.; Madenga, V.; Zhang, C. Effects of frequency and grouted length on the behavior of guided ultrasonic waves in rock bolts. Int. J. Rock Mech. Min. Sci. 2007, 44, 813–819. [Google Scholar] [CrossRef]
  16. Chen, X.; Xu, K. Propagation characteristic of ultrasonic Lamb wave. In Applied Mechanics and Materials; Trans Tech Publications Ltd.: Bäch, Switzerland, 2012; pp. 987–990. [Google Scholar]
  17. Ramalho, G.; Lopes, A.M.; Silva, L. Structural health monitoring of adhesive joints using Lamb waves: A review. Struct. Control Health Monit. 2021, 29, e2849. [Google Scholar] [CrossRef]
  18. Nakamura, K.; Kobayashi, Y.; Oda, K.; Shigemura, S. Classification of Elastic Wave for Non-Destructive Inspections Based on Self-Organizing Map. Sustainability 2023, 15, 4846. [Google Scholar] [CrossRef]
  19. Ostachowicz, W.; Radzieński, M.; Kudela, P. 50th anniversary article: Comparison studies of full wavefield signal processing for crack detection. Strain 2014, 50, 275–291. [Google Scholar] [CrossRef]
  20. Langenberg, K.; Mayer, K.; Marklein, R. Nondestructive testing of concrete with electromagnetic and elastic waves: Modeling and imaging. Cem. Concr. Compos. 2006, 28, 370–383. [Google Scholar] [CrossRef]
  21. Ziaja, D.; Nazarko, P. SHM system for anomaly detection of bolted joints in engineering structures. In Structures; Elsevier: Amsterdam, The Netherlands, 2021; pp. 3877–3884. [Google Scholar]
  22. Yang, Z.; Yang, H.; Tian, T.; Deng, D.; Hu, M.; Ma, J.; Gao, D.; Zhang, J.; Ma, S.; Yang, L. A review in guided-ultrasonic-wave-based structural health monitoring: From fundamental theory to machine learning techniques. Ultrasonics 2023, 133, 107014. [Google Scholar] [CrossRef]
  23. Beard, M.D. Guided Wave Inspection of Embedded Cylindrical Structures. Ph.D. Thesis, Department of Mechanical Engineering, Imperial College, London, UK, 2002. [Google Scholar]
  24. Madenga, V.; Zou, D.; Zhang, C. Effects of curing time and frequency on ultrasonic wave velocity in grouted rock bolts. J. Appl. Geophys. 2005, 59, 79–87. [Google Scholar] [CrossRef]
  25. Phoon, K.-K.; Tang, C. Characterisation of geotechnical model uncertainty. Georisk Assess. Manag. Risk Eng. Syst. Geohazards 2019, 13, 101–130. [Google Scholar] [CrossRef]
  26. Yuan, J.; Lin, P. Reliability analysis of soil nail internal limit states using default FHWA load and resistance models. Mar. Georesources Geotechnol. 2018, 37, 783–800. [Google Scholar] [CrossRef]
  27. Lin, P.; Chen, X.; Jiang, M.; Song, X.; Xu, M.; Huang, S. Mapping shear strength and compressibility of soft soils with artificial neural networks. Eng. Geol. 2022, 300, 106585. [Google Scholar] [CrossRef]
Figure 1. Simplifying a soil nail into a two-layer cylindrical column.
Buildings 13 01699 g001
Figure 2. Schematic diagram of NDT methods for determining NDT-predicted nail length.
Buildings 13 01699 g002
Figure 3. Histograms and cumulative distributions of measured nail length.
Buildings 13 01699 g003
Figure 4. Illustration of the non-destructive tests on soil nails on site.
Buildings 13 01699 g004
Figure 5. Plots of measured versus NDT-predicted nail length.
Buildings 13 01699 g005
Figure 6. Plots of original and improved values λ for the NDT model against its predicted values.
Buildings 13 01699 g006
Figure 7. Probability cumulative distribution of model bias for the hammer type and estimation method.
Buildings 13 01699 g007aBuildings 13 01699 g007b
Figure 8. Second-order Gaussian and Cubic polynomial fittings to the cumulative distribution of model biases.
Buildings 13 01699 g008
Table 1. Summary of wall geometry, soil properties, and nail arrangement for soil nail walls.
WallSoil TypeWall GeometrySoil Strength PropertiesNail
H (m) α (°) β (°) ϕ (°) c (kPa) γ (kN/m3) S h (m) S v (m) i (°) d (mm)
W1Silty clay8.1100221618.21.21.22022
W2Silty clay1605172217.91.21.21525
W3Silty clay with gravel2220202110191.351.351030
W4Clay, medium sand3240623–3110–16201.51.51036
W5Silty clay, sand6.2002418191.41.41022
W6Silty sand, clay6–1215527–31.90–1719.1–20.21.41.41025
W7Silty clay, coarse sand8–106012.31620.81.21.21525
W8Silty clay1710518.92619.21.51.51025
W9Sandy silt, fine sand20.511.3–22020–400–2019.21.51.5830
Note:  H = wall height; α = face batter angle; β = back slope angle; ϕ = soil friction angle; c = soil cohesion; γ = soil unit weight; S h = horizontal nail spacing; S v = vertical nail spacing; i = nail inclination angle; and d = nail bar diameter.
Table 2. Summary of soil nail parameter of NDT method.
No.True Length (m)Hammer TypeEstimation Method aNDT Nail Length (m)No.True Length (m)Hammer TypeEstimation Method aNDT Nail Length (m)
19.0SmallSA9.11594.5LargeFC4.33
29.0SmallSA9.09604.5LargeFC4.33
39.0LargeFC9.08614.5SmallSA4.13
49.0LargeFC9.08624.5SmallFC4.10
59.0SmallFC9.04634.5LargeFC4.13
69.0SmallSA9.05644.5LargeFC4.09
79.0LargeSA8.99654.5SmallSA4.36
89.0LargeFC8.87664.5SmallFC4.33
915.2SmallSA16.71674.5LargeSA4.14
1015.2SmallSA15.94684.5LargeSA4.10
1115.2LargeER16.52694.5SmallSA3.48
1215.2LargeER16.59704.5SmallSA3.50
1315.6SmallSA16.40714.5LargeSA3.47
1415.6SmallFC15.89724.5LargeSA3.50
1515.6LargeFC15.47734.5SmallFC3.71
1615.6LargeFC15.71744.5SmallFC3.69
1715.6SmallSA16.37754.5LargeFC3.69
1815.6SmallSA16.41764.5LargeFC3.66
1915.6LargeFC15.09774.5SmallSA3.56
2015.6LargeFC16.00784.5SmallSA3.50
2115.6SmallSA15.98794.5LargeSA3.54
2215.6SmallSA16.07804.5LargeSA3.51
2315.6LargeFC15.90815.0SmallSA4.79
2415.6LargeSA16.39825.0SmallFC4.72
2515.6SmallER15.52835.0LargeFC4.77
2615.6SmallFC15.45845.0LargeFC4.75
2715.6LargeER16.178512.0SmallSA12.01
2815.6LargeFC16.168612.0SmallSA11.80
2931.6SmallFC32.408712.0LargeSA11.93
3031.6SmallFC32.58812.0LargeSA11.90
3131.2SmallSA32.28912.0SmallER11.63
3231.2SmallER30.429012.0SmallFC11.62
3331.2LargeSA32.139112.0LargeFC12.16
3431.2LargeFC32.089212.0LargeFC11.90
3531.6SmallSA29.989321.0SmallER21.17
3631.6SmallFC29.049420.5SmallFC17.65
3731.6LargeSA31.849520.6LargeFC19.80
3831.6LargeSA32.219620.8LargeFC25.20
3931.6SmallFC31.669721.0SmallER20.35
4031.6SmallFC29.379821.0SmallFC25.00
4131.6LargeFC32.749924.5LargeFC28.00
4231.6LargeFC33.0810028.2LargeFC29.50
4331.6LargeFC31.741013.5SmallER3.20
4431.6LargeSA32.071023.5SmallFC3.07
454.5SmallSA4.281036.2LargeFC6.00
464.5SmallSA4.421049.0LargeFC9.74
474.5LargeSA4.091059.0SmallER9.80
484.5LargeSA4.151069.0SmallFC10.40
494.5SmallSA3.9510726.1LargeFC27.50
504.5SmallSA3.9410826.1LargeFC27.25
514.5LargeSA4.1010923.1SmallER22.50
524.5LargeSA4.161103.5SmallFC6.45
534.5SmallSA4.351113.5LargeFC4.25
544.5SmallSA4.3111215.56LargeFC15.50
554.5LargeSA4.401133.0SmallER3.08
564.5LargeSA4.241143.0SmallFC2.00
574.5SmallFC4.231153.0LargeFC4.00
584.5SmallSA4.341163.0LargeFC3.12
Note: a SA = Slope attenuation; FC = Frequency change of end reflection; ER = End reflection.
Table 3. Summary of statistics of model biases and Mann–Whitney or Kruskal–Wallis test results for different data cases.
Data Group Model   Bias ,   λ Mann–Whitney
or Kruskal–Wallis
p-Value
MeanCOV
All data, n = 1161.030.116Not applicable
Large hammer, n = 581.020.1040.219
Small hammer, n = 581.040.126>0.05
Frequency change of end reflection, n = 561.010.1291.000
End reflection, n = 120.990.053>0.05
End reflection, n = 120.990.0530.162
Slope attenuation, n = 481.060.103>0.05
Slope attenuation, n = 481.060.1030.125
Frequency change of end reflection, n = 561.010.129>0.05
Table 4. Summary of statistics of model biases for the original and improved NDT methods for nail length.
ModelCorrection Bias Model   Bias ,   λ
α β η μ COV Correlation   with   L n Distribution
Original1101.030.12NegativeSecond-order Gaussian
Improved2.56−2.180.971.000.08UncorrelatedCubic Polynomial
Table 5. Formulations and parameters for the multi-order Gaussian and polynomial fittings.
ModelFitting ModelExpressionParameterValue R 2
OriginalSecond-order Gaussian λ = k = 1 k = 2 a k e x p z b k c k 2 a 1 1.5930.975
b 1 3.962
c 1 4.777
a 2 0.460
b 2 −1.510
c 2 1.681
ImprovedCubic Polynomial λ = p 1 z 3 + p 2 z 2 + p 3 z + p 4 p 1 0.0200.965
p 2 −0.012
p 3 0.031
p 4 1.012
Disclaimer/Publisher’s Note: The statements, opinions and data contained in all publications are solely those of the individual author(s) and contributor(s) and not of MDPI and/or the editor(s). MDPI and/or the editor(s) disclaim responsibility for any injury to people or property resulting from any ideas, methods, instructions or products referred to in the content.

