Article

Investigation of the Critical Factors Influencing Multi-Stakeholders’ Participation in Design Optimization of EPC Projects

1
College of Management and Economics, Tianjin University, Tianjin 300072, China
2
School of Electrical and Information Engineering, Tianjin University, Tianjin 300072, China
3
China Railway Design Corporation, Tianjin 300308, China
*
Author to whom correspondence should be addressed.
Buildings 2023, 13(7), 1654; https://doi.org/10.3390/buildings13071654
Submission received: 9 May 2023 / Revised: 19 June 2023 / Accepted: 27 June 2023 / Published: 28 June 2023

Abstract

:
Design optimization can influence the achievement of management goals and the sustainable development of EPC (engineering–procurement–construction) projects. Current research regarding engineering design optimization mainly focuses on the technology aspect, while lacking extensive attention regarding the factors influencing stakeholders’ participation in design optimization of EPC projects. Based on the existing literature and expert opinions, this study identifies 33 critical influencing factors and adopts the DEMATEL (decision-making trial and evaluation laboratory) and ISM (interpretive structural model) method to analyze the hierarchical structure and interrelationships among these factors. The results show that the factors, including subcontractors’ participation during the design, design management level, performance evaluation mechanism, technological development, owners’ attitude towards disputes, and sensitivity to project cost growth, play critical roles in multi-stakeholders’ participation in design optimization of EPC projects. All these factors can be divided into causal factors (13) and result factors (20) and a hierarchical structure model is developed for the whole system, composed of three types of influencing factors, that is, the surface direct factor, intermediate indirect factor, and deep-rooted factor. The findings of this study can help managers to have a better understanding of design optimization of EPC projects from the stakeholder perspective and help managers to take effective measures to improve the status quo as well as facilitate the sustainable development of this kind of project.

1. Introduction

The project delivery system determines the roles and responsibilities of project participants and formulates an execution framework regarding the sequencing of design, procurement, and construction [1]. The selection of the project delivery system could have a significant influence on the goal achievement of project management and the improvement of project performance [2,3]. The traditional design–bid–build (DBB) method as the primary delivery mode has been commonly used in the construction industry, but also triggers a series of issues such as frequent project changes and claims, low efficiency of the project schedule control, limited project margins, and a large percentage of project overhead costs [4,5]. By contrast, the engineering–procurement–construction (EPC) delivery system usually assigns an EPC general contractor responsible for coordinating all works of the three primary stages during the whole project, which can effectively improve project productivity, reduce conflicts among parties, and enhance potential profitability of the general contractor [4,5,6]. As such, the EPC, as a popular delivery mode, has been widely adopted by many public and private organizations [7]. By the end of 2032, the EPC market worldwide is projected to expand at a CAGR (compound annual growth rate) of 5.7% to reach USD 13,800 billion.
The critical advantage of EPC modes is to make full use of the leading role of design in engineering construction and thus promote the continuous optimization of design schemes of a project. Meanwhile, due to the features of EPC projects (e.g., comprehensive, systematic, and integrated), design optimization has also been treated as a significant factor that influences the quality, schedule, cost, risk, and safety control for this kind of project and is regarded as an effective means to improve its management level, which plays a crucial role in the sustainable development of EPC projects [8]. The values of design optimization in EPC modes are primarily reflected from two aspects [7,9]: (a) saving cost on the preconditions of satisfying each performance requirement of this project and (b) greatly improving part of project performance within a reasonable cost. Therefore, design optimization, as an important component of design management, has attracted extensive attention from academia and industry.
Currently, some shortcomings in the application of EPC modes still exist, such as the inadequate capability of the EPC and resource integration management, insufficient awareness of design optimization, design changes directly affecting project schedule and cost [10], etc. For instance, some railway EPC projects in Shanxi province, China, had a project delay of over one year and the corresponding project cost increased greatly. To a large extent, these issues can be attributed to the lack of initiative to participate in project design optimization. In fact, the performance of design optimization in EPC projects is not only determined by the designer but is also connected with other stakeholders. For instance, the subcontractors’ experience will be beneficial for the improvement of design efficiency and quality [11]; the designer taking part in the construction stage can guarantee that the project construction follows the intention of design optimization [12]; and the low-level design provided by the owner could lead to more design innovation and fewer design modifications [13]. However, existing research tends to focus on the exploration of factors influencing the designer’s participation in project design optimization, while ignoring the factors affecting the motivation of other stakeholders [12,14,15], which further results in these stakeholders not being able to participate in design optimization under EPC modes effectively.
The design optimization of EPC projects in this study refers to the activities of design optimization occurring after the EPC contractor signs the contract with the owner, especially for detailed engineering. To address the above research gaps, the objectives of this study are (a) to identify the primary factors influencing each stakeholder of EPC projects in active involvement of design optimization; (b) to analyze the hierarchical structure and interrelationship of these influencing factors; and (c) to provide some suggestions for all stakeholders’ participation in project design optimization to improve its performance under EPC modes. This study can enrich the theoretical research into design optimization for EPC projects and facilitate the sustainable development of this kind of project.
The structure of the remainder of this paper is as follows. Section 2 presents a literature review regarding engineering project design optimization and its influencing factors. Section 3 introduces the methods used to achieve the above research objectives. Result analysis and discussion are conducted in Section 4. The final section summarizes the conclusions based on the findings of this study.

2. Literature Review

2.1. Design Optimization of Engineering Projects

Existing studies regarding design optimization of engineering projects are conducted from both technical and management aspects. For the former, extensive research primarily focused on technically improving the performance of a certain part of the project or the whole engineering system through design optimization. For instance, Li et al. [16] presented a method for clash-free rebar design optimization integrating graph neural networks and exploratory genetic algorithms, which can automatically identify optimal design in compliance with code-stipulated requirements while reducing 75–90% of the computation time. Cai and Aref [17] optimized the distribution of carbon fiber-reinforced polymers and steel in large-span cable-stayed bridges based on genetic algorithms, thereby improving the aerodynamic performance of cable systems. Baghdadi et al. [18] used artificial intelligence algorithms to optimize the design of prefabricated wall–floor building systems, which greatly simplified the manufacturing process while satisfying the architectural parameters. Wang et al. [19] combined hydrological models with intelligent algorithms to optimize the design of an integrated drainage system, providing decision-makers with technical scientific support. Wang et al. [20] adopted a multi-objective robust optimization model to obtain the optimal structure of urban drainage systems in consideration of system uncertainty.
By contrast, only a few studies have explored design optimization of engineering projects from the management aspect, where case study or data collection was selected as the primary approach. For instance, Zhang et al. [13] found that behaviors of the owner and contractor could have an influence on design performance by means of questionnaires and hierarchical regression analysis. Berard and Karlshoej [21] demonstrated that BIM-based management information systems for the design process can help reduce design time and errors. Zhang et al. [22] used the data of CSCEC (China Construction Engineering Corporation) to verify that the alliance of contractors and designers in EPC projects can improve design performance. Liu et al. [23] collected data on large-scale EPC hydropower projects and proved that cooperation between different participants can directly promote design capabilities and design management. Gunduz et al. [24] used a structural equation model to explore the relationship between value engineering factors and design management performance. In summary, current research into design optimization of engineering projects emphasized more on technology over management. Specifically, technical innovation is treated as the primary tool to achieve design optimization goals, while ignoring other critical research issues in design optimization management, such as how to motivate stakeholders to actively participate in the design optimization of EPC projects.

2.2. Factors Influencing Design Optimization of Engineering Projects

Currently, some research studies have investigated the factors affecting different stakeholders’ participation in the design optimization of engineering projects. Gransberg and Windel [11] analyzed the content of 75 DB (design and build) proposal requests from 35 states in the United States, which stated that the experience of construction units can help improve design efficiency and quality. Fredrickson [12] demonstrated that the designer’s participation during the construction of DBB projects can ensure the construction is carried out according to the design intent. Zhang et al. [13] demonstrated that when the owner provides less design information, qualified contractors will make the final design scheme more innovative. Grau et al. [14] found that cooperating with designers can be regarded as key to solving complex technical problems in engineering projects, especially for handling design changes, adopting optimization design schemes, and improving constructability. Wang et al. [15] stated that additional information provided by the cooperation between contractors and designers may contribute insight into the project and thus greatly promote design optimization. Liu et al. [23] established and validated conceptual models based on data collected from large-scale EPC hydropower projects and found that insufficient design capability may lead to issues such as design rework and poor constructability. Walker and Walker [25] argued that contractors’ early involvement can be a critical factor in resolving design-related risks before the commencement of building construction since they have rich experiences in on-site design-related problems. Wang and Liu [26] developed a tripartite evolutionary game model of a government–owner–construction company in EPC projects and found that the general contractor’s awareness and attitude towards innovation as well as effective coordination of project complexity and innovation will affect the performance of design optimization. It can be seen that existing research focused more on exploring factors influencing design optimization of engineering projects only from the designer’s perspective, while few studies took into account the factors affecting other stakeholders’ participation in design optimization. In addition, there is a lack of systematic research into the identification of influencing factors of design optimization considering multi-stakeholders in EPC projects and the comprehensive analysis of these factors.

3. Research Methods

First, the influencing factor system of multi-stakeholders’ participation in project design optimization of EPC projects is established based on a literature review and questionnaires. Then, expert opinions and data analysis approaches, that is, DEMATEL (decision-making trial and evaluation laboratory) and ISM (interpretive structural model), are adopted to analyze the hierarchical structure and interrelationship of these influencing factors. The detailed introduction for the above two primary steps can be found in the following subsections.

3.1. Establishment of the Influencing Factor System

The influencing factors can be initially obtained based on the relevant literature screened from the database Web of Science, where keywords such as “EPC”, “design optimization”, “design management”, or “design incentives” are used. According to the literature review, expert opinions, and the features of EPC projects, this study establishes the influencing factor system of multi-stakeholders’ participation in project design optimization under EPC modes. The stakeholders in this influencing factor system primarily include the designer, subcontractor, EPC contractor, and owner, who play a significant role in the design optimization of EPC projects and are also emphasized in FIDIC Silver Book [27] as well as government documents in some countries including China. Considering the research objectives, this influencing factor system is divided into six subsystems and the corresponding influencing factors (see Table 1). For instance, the design subsystem consists of factors only affecting the designer’s participation in design optimization, while the subsystem (designer and subcontractor) includes the factors that have an influence on the two parties.
Designer subsystem. The subcontractor’s participation during design ( S 1 ) can help designers to improve design efficiency and quality [11]. The strong design capacity of designers ( S 2 ) is a prerequisite for achieving design optimization of a project [23] and the design management level ( S 3 ) can influence design managers to conduct comprehensive evaluations for drawings and propose detailed requirements for design optimization [6]. The cost control awareness of designers ( S 4 ) will prompt them to carry out design optimization [28]; the rationality of design schemes ( S 5 ) can avoid the occurrence of many design changes so that the designers have more time spent on design optimization [29]. The lower level of design provided by the owner can lead to higher design quality, so appropriate initial design quantities ( S 6 ) will motivate the designer to take part in design optimization [13]. The smoothness of information communication ( S 7 ) between the designer and the owner will affect the enthusiasm of the designer to participate in design optimization [15]. The level of detail in design drawings ( S 8 ) determines the workload of specifications that the designer needs to provide, so the lower level of detail can allow the designer to spare more time for design optimization [12]. Multi-stakeholders’ information coordination ( S 9 ) is beneficial for the designer to formulate targeted design optimization based on feedback from others [30].
Subcontractor subsystem. The designer’s participation during construction ( S 10 ) can ensure that project construction proceeds following the intention of design optimization intention [12]. Design schedule control ( S 11 ) can avoid the impacts on the latter construction schedule due to the untimely delivery of design documents and provide opportunities for the subcontractor to identify optimization points in the design [31]. The frequency of changes ( S 12 ) will influence the efficiency of design optimization and the enthusiasm of the subcontractor to participate in this activity [32]. Engineering insurance ( S 13 ) can help mitigate the subcontractor’s concerns as to whether design optimization during construction can be implemented successfully [33]. Constructability assessment ( S 14 ) can improve the quality and efficiency of design optimization, which can be treated as a factor influencing the subcontractor’s participation [34]. The long-term operation mode (i.e., construction depending on the drawings) has limited personal initiative ( S 15 ) of the subcontractors, thereby resulting in their unwillingness to participate in project design optimization [35]. The price fluctuation of the engineering market ( S 16 ) will directly impact the prices of construction resources including materials and equipment [36], which may bring difficulties for subcontractors to execute the scheme derived from design optimization.
Designer and subcontractor subsystem. The effective performance evaluation mechanism ( S 17 ) established by the EPC contractor will stimulate the efforts of designers and subcontractors in design optimization to enhance the benefits of multi-stakeholders [26]. Policies and regulations ( S 18 ) [30], technological development ( S 19 ) [29], and the risk management ability of EPC contractors ( S 20 ) [37] will, to some extent, affect the participation of designers and subcontractors in design optimization.
EPC contractor subsystem. Since the owner usually doubts whether the optimized design can satisfy technical standards, his/her trust ( S 21 ) will have an impact on the enthusiasm of EPC contractors to participate in design optimization [38]. The innovative awareness of the EPC contractor ( S 22 ) and the owner’s attitudes towards disputes ( S 23 ) will affect the contractor’s enthusiasm for participation in design optimization [29]. The degree of the owner’s involvement in the design management of the EPC contractor ( S 24 ) may lead to the contractor’s unwillingness to carry out design optimization [39]. Project document reviews ( S 25 ) can enable EPC contractors to identify problems with documents including cost reports, drawings, and specifications in time and better coordinate with the implementation of design optimization [40]. Errors in the materials provided by the owner ( S 26 ) [41] and the approval efficiency of design documents ( S 27 ) [40] may affect the implementation of design optimization.
Owner subsystem. To some extent, design optimization may delay the project schedule ( S 28 ), so the owner will not accept the design optimization request from the EPC contractor [26]. Owners who are too sensitive to project cost growth ( S 29 ) may not accept design changes or the design optimization of engineering projects before EPC project bidding [40]. EPC contractors with strong innovation capabilities can better execute design optimization especially when the information provided by the owner is less, so the selection of EPC contractors ( S 30 ) will affect the owner’s participation in design optimization [13]. The expertise level of the owner ( S 31 ) could have an influence on the implementation of design optimization in EPC projects [42].
EPC contractor and owner subsystem. Reasonable contract formulation ( S 32 ) can enable good communication between EPC contractors and the owner, which will be beneficial for the later design optimization of engineering projects [29]. The EPC contractor and owner may not conduct design optimization during the project to protect their interests due to the uncertainty brought by the external environment ( S 33 ) [43].

3.2. DEMATEL–ISM Method

The DEMATEL method uses a weighted directed graph to evaluate the dynamic relationships between influencing factors, excavate their causal relationships, and then identify the critical ones [44]. The ISM method is widely used to establish a hierarchical structure that can describe the interactions between different factors [45]. The integration of the two methods (i.e., DEMATEL–ISM) can not only investigate the hierarchical relationships and logical structures among various factors within the system, but also comprehensively identify the causal and consequence factors that affect the whole system. Currently, this integrated approach has been applied to many research studies, such as obstacle analysis of applying blockchain technology in power data trading [46], the identification of factors affecting fuel consumption of vehicles on superhighway [47], and the determination of factors influencing the use of artificial intelligence in elderly care service resources [48]. Therefore, this study will adopt the DEMATEL–ISM method to explore the hierarchical structure and interrelationships among influencing factors of multi-stakeholders’ participation in EPC project design optimization. The primary steps for executing the DEMATEL method are first displayed as follows [44]:
Step 1. Determine the set of influencing factors, which is represented by S = { S 1 , S 2 , , S n } .
Step 2. Establish the direct influence matrix X ( X = [ x i j ] n × n ) by using a Likert five-point scale (0–5) to describe interrelationships between these factors, where x i j indicates the degree of direct influence of factor i on factor j : 0 (none), 1 (weak), 2 (general), 3 (strong), and 4 (very strong).
Step 3. Obtain the normalized direct influence matrix G by means of Equation (1).
G = 1 max j = 1 n x i j X , ( i = 1 , 2 , , n )
Step 4. Calculate the comprehensive influence matrix T = G ( I G ) 1 , where I is the unit matrix.
Step 5. Calculate the two indexes of each influencing factor ( E i and F i ) using Equations (2)–(3) according to the results of the comprehensive influence matrix T .
E i = i = 1 n x i j , ( i = 1 , 2 , , n )
F i = i = 1 n x j i , ( i = 1 , 2 , , n )
where E i ( F i ) is the extent to which factor i affects (is affected by) other factors.
Step 6. Calculate the degree of centrality M i and the degree of causality N i in terms of each influencing factor following Equations (4) and (5).
M i = E i + F i , ( i = 1 , 2 , , n )
N i = E i F i , ( i = 1 , 2 , , n )
The degree of centrality M i reflects the importance of factor i in the system; the larger its value, the greater the importance of this factor. The degree of causality N i indicates the direction in which factor i affects or is affected by other factors and the larger absolute value reflects the degree of influence. If the value is greater than 0, this factor is regarded as a causal element; otherwise, this factor is treated as a result element.
The primary steps for executing the ISM method are displayed as follows [45]:
Step 1. Calculate the comprehensive influence matrix of the whole system, i.e., H = T + I , where T is obtained from the DEMATEL method and I is the unit matrix.
Step 2. Obtain the reachability matrix K following the conversion rule (see Equation (6)):
k i j = 1 h i j λ 0 h i j < λ
where λ is a threshold value to eliminate factors with less impact.
Step 3. Determine the reachability sets and the antecedent sets according to the final reachability matrix K . For example, the reachable set R i and the antecedent sets P i of influencing factor S i can be calculated using Equations (7) and (8), respectively.
R i = s j s j S , k i j 0 ,   ( i = 1 , , n )
P i = s j s j S , k j i 0 ,   ( i = 1 , , n )
Step 4. Verify whether the following hypothesis (Equation (9)) is true. If it is true, this indicates that the influencing factor s i belongs to the bottom level. Then, divide row i and column i in the reachability matrix K .
R i = R i P i ,   ( i = 1 , , n )
Step 5. Repeat Steps 3 and 4 of the ISM method until all influencing factors have been crossed out.
Step 6. Establish a hierarchical structure of influencing factors in the order as they are removed.

4. Result Analysis and Discussion

4.1. Data Collection

The values that describe the relationship between these influencing factors are derived from experts’ opinions in the use of the DEMATEL–ISM method. In this study, a total of 20 experts were finally invited to discuss these factors and their detailed description can be seen in Figure 1.

4.2. Relationship Analysis of Influencing Factors

4.2.1. Comprehensive Analysis of Influencing Factors

The critical influencing factors in Table 1 are not isolated but there exists a relationship between each other in design optimization of EPC projects. As such, the direct influence matrix was first established by using pairwise comparison among these factors with a Likert five-point scale (see Appendix A Table A1). Then, the results of influencing factor analysis using the DEMATEL method can be obtained following the steps illustrated in Section 3.2. Specifically, the influence degree ( E i ), influenced degree ( F i ), centrality degree ( M i ), and causality degree ( N i ) among these influencing factors are shown in Table 2.
In terms of the centrality degree, the influencing factors of participation in design optimization of EPC projects with the six highest values include S 20 (risk management ability of EPC contractor), S 9 (information coordination between multi-stakeholders), S 30 (selection of EPC contractor), S 24 (degree of involvement in design management), S 33 (uncertainty brought by external environments), and S 22 (innovation awareness); denoting these factors plays more prominent roles in the whole system. However, the corresponding causality degree of the above factors tends to be negative, which means they are influenced by other factors to some extent. The three lowest factors are S 31 (level of expertise), S 16 (engineering market), and S 18 (policies and regulations), so there exists a weak relationship between these factors and others. By contrast, their causality degree is larger than zero, indicating that these factors will have an influence on others in the system.
According to the values of the causality degree, these factors can be classified into causal and result ones. There are 13 factors with a positive degree, where the top five factors, that is, S 19 (technological development), S 18 (policies and regulations), S 16 (engineering market), S 17 (performance evaluation mechanism), and S 31 (level of expertise) are more likely to affect other factors. The remaining factors with causality degrees of less than zero are influenced by others, among which, S 28 (project schedule), S 11 (design schedule control), S 12 (frequency of changes), and S 5 (rationality of design schemes) have the values below −1.5.
Through the above analysis, we can find that such factors as S 9 , S 17 , S 20 , S 22 , S 24 , S 30 , and S 31 are significant in the whole system, all of which are mainly related to the EPC contractor. In other words, the EPC contractor has the greatest influence on design optimization of EPC projects among these stakeholders.

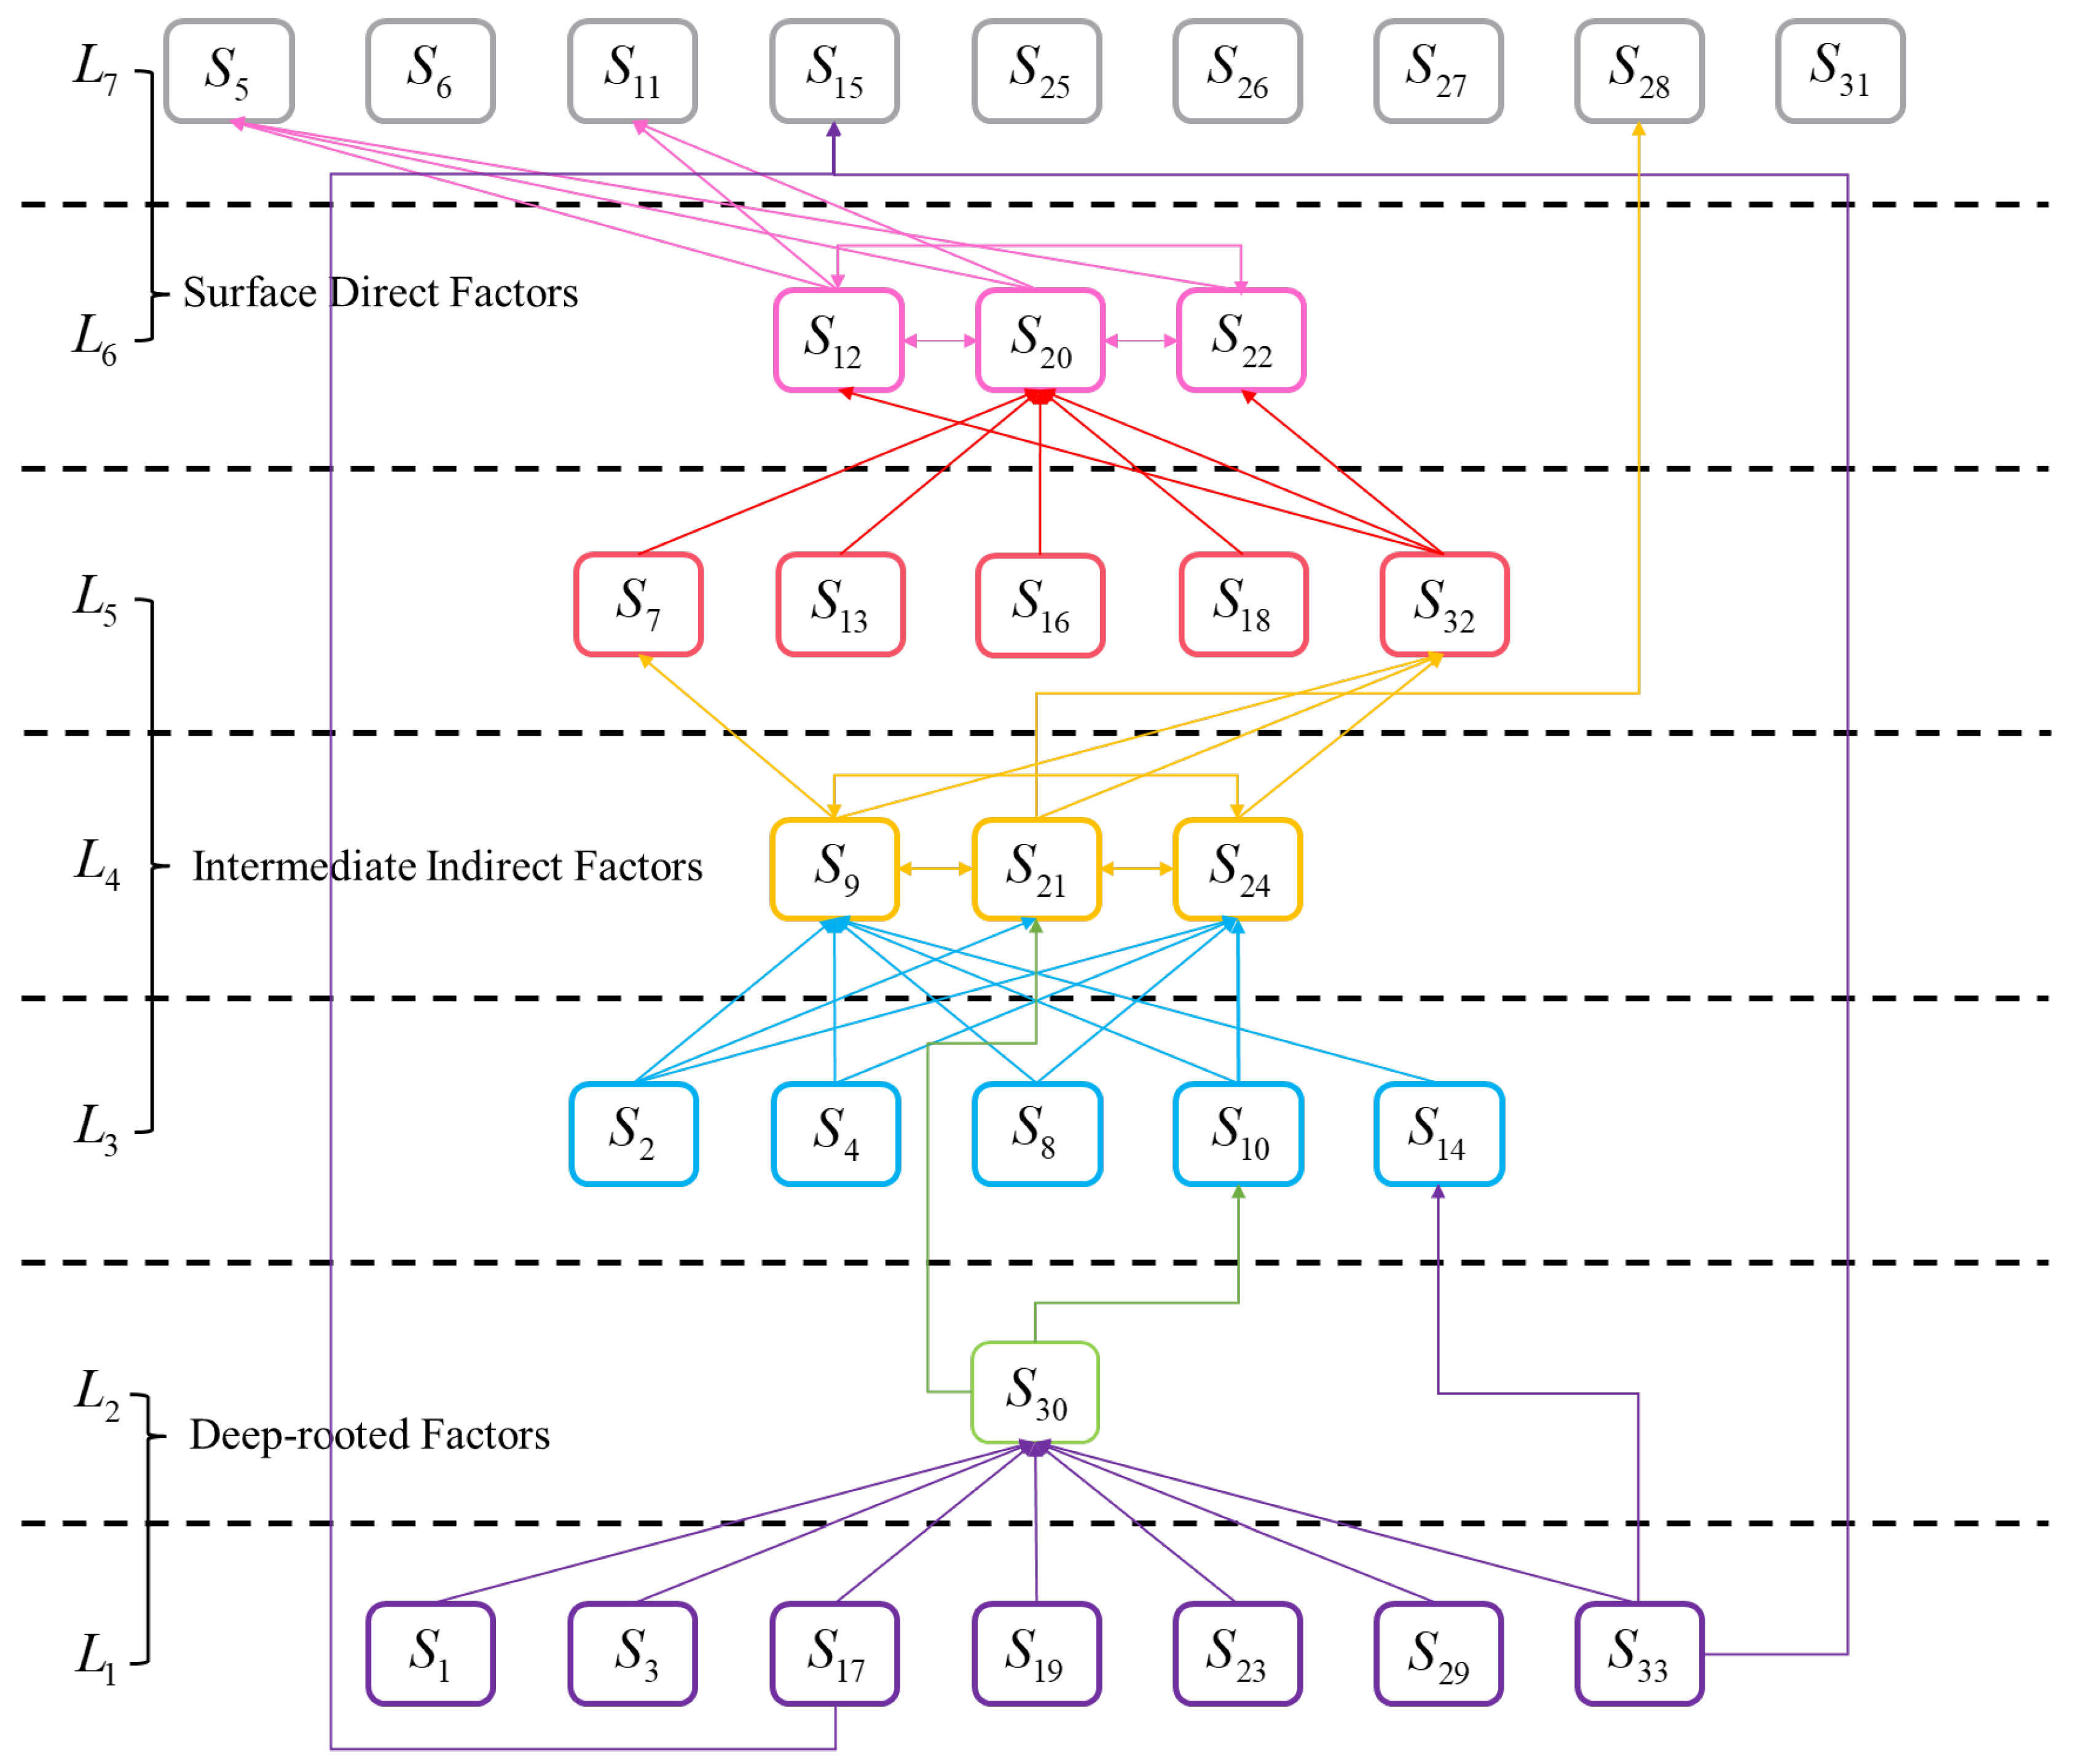
4.2.2. Development of a Hierarchical Structure Model

Before using the ISM method for explanatory structural analysis of influencing factors, it is significant to examine logical connections between components that influence or imply each other. In Section 3.2, this method requires the input of thresholds λ when converting the overall influence matrix into the reachability matrix. Since the threshold values will directly affect the composition of the reachability matrix and the structure division of the whole system, it requires multiple experiments to obtain the optimal threshold and thus generate the optimal hierarchical structure model. In this study, the reachability matrix within 33 factors is determined by assigning 0.16 to the threshold. Accordingly, the results of the reachability matrix can be seen in Appendix A Table A2.
Then, the reachable set and the antecedent sets of each influencing factor can be calculated based on the reachability matrix, and a total of seven levels are divided according to the principle (i.e., R i = R i P i ). As such, the hierarchical structure model for the factors influencing multi-stakeholders’ participation in design optimization of EPC projects is developed as Figure 2, which consists of three types of influencing factors, that is, surface direct factor, intermediate indirect factor, and deep-rooted factor.

4.2.3. Analysis of the Causal Relationship between Influencing Factors

The causal relationship between these influencing factors can be found in the hierarchical structure displayed as Figure 2. Deep-rooted factors are composed of the factors at levels one and two, where S 1 (subcontractor’s participation during design), S 3 (design management level), S 17 (performance evaluation mechanism), S 19 (technological development), S 23 (owners’ attitude towards disputes), S 29 (sensitivity to project cost growth), and S 33 (uncertainty brought by external environments) belong to L 1 . These seven factors are highly independent of each other and are not influenced by other factors; meanwhile, they can have a significant effect on multi-stakeholders’ participation in design optimization of EPC projects, all of which will affect the factor S 30 (selection of EPC contractor) at L 2 . This indicates that the EPC contractor selected by the owner can not only be influenced by some factors derived from the designer, subcontractor, and EPC contractor, but can also be affected by factors from the owner, such as a negative attitude towards changes and more sensitivity to project cost growth and uncertainty, which makes it difficult to choose the EPC contractor with a strong capacity in design optimization to some degree. In addition, the factor S 33 also has an effect on S 14 (constructability assessment) at L 3 , denoting that uncertainty brought by external environments could facilitate the subcontractor to conduct a constructability assessment for this project. The factor S 15 (personal initiative) at L 7 is influenced by S 17 and S 33 , which is consistent with the reality. Due to the unfair performance evaluation mechanism and uncertainty in EPC projects, subcontractors’ conservative attitudes lead to unwillingness to proceed with design optimization. The factor S 30 at L 2 will affect S 10 (designer’s participation during construction) at L 3 and S 21 (trust of the owner) at L 4 . This indicates that qualified EPC contractors should require designers to participate in project construction and in turn receive the trust of the owner, which could promote the implementation of design optimization of EPC projects. This finding is consistent with the study of Fredrickson [12].
Intermediate indirect factors consisting of factors at three levels ( L 3 , L 4 , and L 5 ) will transfer the influences of deep-rooted factors on surface direct factors and indirectly affect stakeholders’ participation in the design optimization of EPC projects. The factors including S 2 (design capacity), S 4 (cost control awareness), and S 8 (level of detail in design drawings) at L 3 have a high degree of independence and only S 10 and S 14 will be influenced by factors ( S 30 and S 33 ) at other levels. The factors at L 4 composed of S 9 (information coordination between multi-stakeholders), S 21 , and S 24 (degree of involvement in design management) have a mutual influence between each other and are greatly affected by the factors at L 3 . Furthermore, S 28 (project schedule) at L 7 is influenced by S 21 since the owner’s trust of the EPC contractor can mitigate worries about potential project delays resulting from design optimization. S 7 (information communication), S 13 (engineering insurance), S 16 (engineering market), S 18 (policies and regulations), and S 32 (contract formulation) located at L 5 are isolated, while S 7 and S 32 are affected by the factors from L 4 . On the one hand, information coordination between parties enhances the communication between the designer and owner. On the other hand, the information coordination, owner’s trust, and involvement in design management could have an influence on the contract formulation of EPC projects.
Surface direct factors include the elements at L 6 and L 7 , where S 12 (frequency of changes), S 20 (risk management ability of EPC contractor), and S 22 (innovation awareness) at L 6 are greatly affected by the factors from L 5 . This means these factors could influence the risk management of EPC contractors and ineffective information communication will result in the increase in project changes and lower innovation awareness of EPC contractors, which is consistent with the finding stated in the study of Rahman and Kumaraswamy [49]. Furthermore, the factors at this level also have an impact on each other. For instance, a higher frequency of changes will lead to difficulties in the risk management of EPC contractors and more focus on risk management will lower their awareness to achieve project innovation, which further reduces willingness to carry out design optimization. The reminder of factors belong to L 7 , including S 5 (rationality of design schemes), S 6 (appropriate initial design quantities), S 11 (design schedule control), S 15 , S 25 (project document reviews), S 26 (errors of materials provided by the owner), S 27 (approval efficiency of design documents), S 28 , and S 31 (level of expertise). There is no mutual relationship between these factors, and S 5 along with S 11 is influenced by all factors from L 6 . In practice, design changes, risk management, and innovation awareness could enhance the reasonability of design schemes. The increase in changes or unreasonable risk management will also significantly influence the design schedule.

4.3. Recommendations

Based on the relationship analysis of influencing factors, some recommendations are provided to promote the participation in the design optimization of EPC projects, in terms of different stakeholders.
As for the designer, it is significantly important to improve their own design management capabilities and promptly grasp the use of new building materials, advanced technics, and information technology [29]. The designer should improve the individual design capacity [23] and cost control awareness to help actively carry out design optimization. Furthermore, participating during the construction is beneficial to accelerate the implementation of design optimization [12].
As for subcontractors, taking part in design optimization during the design phase is of great importance [11] and it is also necessary to be familiar with advanced construction materials and technics as well as construction informatics. Constructability assessment should be conducted to address the issues between design optimization and practical engineering.
As for the EPC contractor, developing a reasonable performance evaluation mechanism is the most crucial element of design optimization of EPC projects, which could consider the demand from the designer and subcontractor to some extent and greatly enhance their personal initiative. The level of detail of the design drawings should be clarified in advance [12] so the designer can have sufficient time spent on optimizing project design optimization. EPC contractors should purchase appropriate engineering insurance and promptly respond to changes in the engineering market, policies and regulations that will have an influence on project design optimization. In addition, EPC contractors should conduct timely project document reviews [40] to avoid project document errors and improve the approval efficiency of design documents.
For owners, it is suggested that they positively face the uncertainty brought by design optimization [43] and give more trust to the designer. Also, it is helpful to improve the level of individual expertise and provide the designer with an appropriate initial design quantity to facilitate the proceeding of project design optimization.

5. Conclusions

From the stakeholder perspective, this study investigates the critical factors influencing multi-stakeholders’ participation in the design optimization of EPC projects and analyzes the mutual relationship between these factors. First, 33 influencing factors are identified based on the relevant literature, expert opinions, and the features of EPC projects, which can be classified into six subsystems according to the different stakeholders involved in project design optimization. Then, the DEMATEL–ISM method is adopted to explore the hierarchical structure and interrelationships among these influencing factors. The research results show that the factors including S 9 (information coordination between multi-stakeholders), S 20 (risk management ability of EPC contractor), S 22 (innovation awareness), S 24 (degree of involvement in design management), S 30 (selection of EPC contractor), and S 33 (uncertainty brought by external environments) have higher values of centrality degree, which play more prominent roles in the whole system of project design optimization and are influenced by other factors to some extent according to the negative values of causality degree. Also, all these factors can be divided into causal factors (13), including S 16 (engineering market), S 17 (performance evaluation mechanism), S 18 (policies and regulations), S 19 (technological development), and S 31 (level of expertise), and result factors, (20) including S 5 (rationality of design scheme), S 11 (design schedule control), S 12 (frequency of changes), and S 28 (project schedule). Among these stakeholders, the EPC contractor has a greater influence on the design optimization of EPC projects. A hierarchical structure model is developed for the factors influencing stakeholders’ participation in the design optimization of EPC projects, which consists of three types of influencing factors, that is, surface direct factor ( S 5 , S 6 , S 11 , S 12 , S 15 , S 20 , S 22 , S 25 , S 26 , S 27 , S 28 , and S 31 ), intermediate indirect factor ( S 2 , S 4 , S 7 , S 8 , S 9 , S 10 , S 13 , S 14 , S 16 , S 18 , S 21 , S 24 , and S 32 ), and deep-rooted factor ( S 1 , S 3 , S 17 , S 19 , S 23 , S 29 , S 30 , and S 33 ). Based on the research findings, some recommendations are provided for each stakeholder to help promote participation in design optimization of EPC projects.
In summary, an integrated method is proposed in this study to explore the mutual relationship between these factors affecting the design optimization of EPC projects, which strengthens the theoretical basis of influencing factor analysis and extends to the research regarding the design optimization of engineering projects from technical analysis to factor relationship investigation considering multiple stakeholders in a quantitative manner. The research results of this study can also have great practical guiding importance for project design optimization management, help formulate effective measures to promote multi-stakeholders’ participation, and further facilitate the sustainable development of EPC projects.
There are still some limitations in this study. The internal influencing mechanism of these factors is not explored completely by means of the proposed method. Future studies can consider the identification of factors affecting stakeholders’ participation in design optimization of EPC projects at different stagess. Also, systematical simulation can be adopted to quantitatively analyze the influence of each factor on the whole system of design optimization.

Author Contributions

Conceptualization, funding acquisition, methodology, writing—review and editing, Y.C.; methodology, data curation, writing—original draft preparation, Z.R.; data curation, formal analysis, B.H.; project administration, funding acquisition, formal analysis, H.Z. All authors have read and agreed to the published version of the manuscript.

Funding

This research was funded by the National Natural Science Foundation of China, grant numbers 72271170 and 72002152.

Data Availability Statement

The data presented in this study are available on request from the corresponding author.

Conflicts of Interest

The authors declare no conflict of interest.

Appendix A

Table A1. Direct influence matrix.
S i 123456789101112131415161718192021222324252627282930313233
102.62.40.63.4222.62.42.52.4302.60.10.1000.42.42.42.502.200.22.42.80.12.80.62.20
22.602.412.82.622.722.22.82.42.20.40.20.2000.42.42.52.20.22.300.32.42.72.32.20.21.82.6
32.62.802.22.82.42.82.52.82.42.82.60.20.31.60.2000.22.42.42.422.20.10.22.42.32.52.50.22.12.6
42.52.62.202.612.62.52.22.22.52.42.62.40.20000.22.42.52.20.22.40.10.30.30.62.42.40.41.92.5
50.20.20.20.200.52.30.22.521.22.602.22.30.1000.22.322.52.22.40.10.32.60.52.62.20.22.40.2
61.80.20.30.62.502.602.122.22.602.40.20.2000.42.622.30.22.200.30.40.42.320.421.8
72.20.60.50.82.32.102.42.22.62.92.200.42.30.1000.32.922.22.42.400.42.72.402.20.22.32.2
82.52.822.42.42.62.402.62.22.62.300200.200.22.61.32.40.32.60.20.42.720.22.20.31.82.5
92.60.32.10.82.52.42.82.402.52.82.200.42.10.22.4002.82.722.22.42.222.82.72.310.422.6
102.22.61.80.72.52.21.12.62.102.82.402.6200.2002.422.422.50.30.12.42.42.61.80.422.2
110.20.20.222.62.22.60.62.32.602.500.62.10.10002.22.42.22.22.60.202.22.72.22.40.42.60.2
120.20.30.22.12.40.60.42.72.42.32.602.42.62.20.20.1002.82.42.52.22.8200.12.42.32.40.220.2
130.221.82.32.42.10.10.210.32.52.402.22.40.11.8002.62.12.31.82.20.400.22.42.420.22.70.2
142.20.20.31.82.62.40.12.22.832.42.40.202.400.2002.32.12.622.42.2002.42.22.20.42.22.2
150.20.40.22.11.20.60.20.42.82.80.22.30.22.600.20002.82.22.422.32.2002.62.62.60.420.2
161.70.20.41.81.80.620.22.40.40.22.22.42.12.300002.42.22.52.22.40.22.12.22.42.320.32.11.7
172.51.92.42.62.30.52.72.62.42.62.62.502.32.70.200.202.42.52.32.62.60.20.60.22.32.22.40.41.82.5
181.80.60.70.62.50.40.62.12.42.22.62.20.20.61.802.2002.62.22.40.32.20.20.20.42.22.22.20.22.42.1
192.42.32.42.42.20.62.22.22.222.72.402.220.20.2002.31.82.90.32.32.21.62.42.22.32.22.62.21.6
202.40.4222.11.82.42.32.22.22.22.22.32.42.30.2200022.22.22.42.20.421.82.22.50.22.22
210.62.21.72.22.41.82.52.22.80.32.12222.70.20.2002.6022.82.30.22.62.62.22.22.40.32.42.1
221.82.21.82.12.60.60.42.42.12.20.22.42.12.61.90.11.8002.22022.320.22.22.42.22.30.21.62.1
230.51.61.82.41.81.82.40.231.62.42.42.72.32.300002.62.42.202.42.42.42.32.12.220.22.21.9
241.72.32.31.92.222.622.21.82.822.22.22.20.20.1002.22.62.20.402.22.42.62.20.32.60.32.21.8
251.71.622.12.21.40.61.90.51.62.42.202.41.60.20.1002.22.220.20.400.40.222.12.10.21.51.8
261.61.820.81.82.21.22.212.22.72.30.21.41.70.10.2002.21.22.20.40.22.401.32.40.720.41.72
271.90.420.32.41.120.92.42.22.82.50.211.40.20.2002.21.22.20.60.60.40.402.60.82.40.221.8
281.80.20.50.21.82.22.40.62.31.82.82.40.21.62.40.10.2002.422.42.22.20.40.52.600.820.22.12
292.20.40.62.72.50.82.20.82.22.32.42.72.12.22.200.2002.52.42.522.60.60.42.42.402.40.32.21.8
301.72.52.12.81.90.92.422.62.22.82.62.22.22.20.21.8002.32.92.11.92.40.222.222.400.222
310.50.80.80.62.62.12.22.41.90.40.21.22.20.80.600.4001.422.41.92.40.21.72.42.42.82.20.22.41.7
320.8222.22.82.22.40.42.50.62.42.52.22.41.800.2002.51.92.60.92.50.52.22.710.51.20.202
332.21.822.622.52.222.32.12.42.22.62.22.52.42.5002.72.12.42.12.62.2222.41.120.22.60
Table A2. Reachability matrix.
S i 123456789101112131415161718192021222324252627282930313233
1100010001011000000010100000001000
2010010001011000000011101000000000
3001010101111000000011101000101010
4000110001011000000010101000000000
5000010000000000000000000000000000
6000001000000000000000000000000000
7000000100010000000010000000000000
8000010011011000000010001000000000
9000010101111000000011101000100010
10000010001111000000010101000000000
11000000000010000000000000000000000
12000010001011000000010101000000000
13000000000000100000010000000000000
14000010001001010000010100000000000
15000000000000001000000000000000000
16000000000000000100010000000000000
17000010101111001010011101000101010
18000000000000000001010000000000000
19000010001111000000111101000101010
20000010001011000000011101000001010
21000010001011000000011101000101010
22000010001001000000010101000001000
23000010001011000000011111000001010
24000010001011000000011101000001010
25000000000000000000000000100000000
26000000000000000000000000010000000
27000000000000000000000000001000000
28000000000000000000000000000100000
29000010001011000000011101000011000
30000010001111000000011101000101010
31000000000000000000000000000000100
32000010001001000000010100000000010
33000010101111011000011101000101011

References

  1. Oyetunji, A.A.; Anderson, S.D. Relative effectiveness of project delivery and contract strategies. J. Constr. Eng. Manag. 2006, 132, 3–13. [Google Scholar] [CrossRef]
  2. Liu, B.; Huo, T.; Meng, J.; Gong, J.; Shen, Q.; Sun, T. Identification of key contractor characteristic factors that affect project success under different project delivery systems: Empirical analysis based on a group of data from China. J. Manag. Eng. 2016, 32, 05015003. [Google Scholar] [CrossRef]
  3. Liu, B.; Xue, B.; Huo, T.; Shen, G.; Fu, M. Project external environmental factors affecting project delivery systems selection. J. Civ. Eng. Manag. 2019, 25, 276–286. [Google Scholar] [CrossRef]
  4. Chen, Y.Q.; Liu, J.Y.; Li, B.G.; Lin, B.S. Project delivery system selection of construction projects in China. Expert. Syst. Appl. 2011, 38, 5456–5462. [Google Scholar] [CrossRef]
  5. Liu, B.; Huo, T.; Shen, Q.; Yang, Z.; Meng, J.; Xue, B. Which owner characteristics are key factors affecting project delivery system decision making? Empirical analysis based on the rough set theory. J. Manag. Eng. 2015, 31, 05014018. [Google Scholar] [CrossRef]
  6. Galloway, P. Design-build/EPC contractor’s heightened risk-Changes in a changing world. J. Leg. Aff. Dispute Resolut. Eng. Constr. 2009, 1, 7–15. [Google Scholar] [CrossRef]
  7. Hale, D.R.; Shrestha, P.P.; Gibson, G.E., Jr.; Migliaccio, G.C. Empirical comparison of design/build and design/bid/build project delivery methods. J. Constr. Eng. Manag. 2009, 135, 579–587. [Google Scholar] [CrossRef] [Green Version]
  8. Habibi, M.; Kermanshachi, S.; Rouhanizadeh, B. Identifying and measuring engineering, procurement, and construction (EPC) key performance indicators and management strategies. Infrastructures 2019, 4, 14. [Google Scholar] [CrossRef] [Green Version]
  9. Soibelman, L.; Liu, L.; Kirby, J.; East, E.; Caldas, C.; Lin, K. Design review checking system with corporate lessons learned. J. Constr. Eng. Manag. 2003, 129, 475–484. [Google Scholar] [CrossRef]
  10. Love, P.; Lopez, R.; Kim, J.T.; Kim, M.J. Influence of organizational and project practices on design errors costs. J. Perform. Constr. Fac. 2014, 28, 303–310. [Google Scholar] [CrossRef]
  11. Gransberg, D.D.; Windel, E. Communicating design quality requirements for public sector design/build projects. J. Manag. Eng. 2008, 24, 105–110. [Google Scholar] [CrossRef]
  12. Fredrickson, K. Design guidelines for design-build projects. J. Manag. Eng. 1998, 14, 77–80. [Google Scholar] [CrossRef]
  13. Zhang, S.B.; Liu, X.Y.; Gao, Y.; Ma, P. Effect of level of owner-provided design on contractor’s design quality in DB/EPC projects. J. Constr. Eng. Manag. 2019, 145, 04018121. [Google Scholar] [CrossRef]
  14. Grau, D.; Back, W.; Prince, J. Benefits of on-site design to project performance measures. J. Manag. Eng. 2012, 28, 232–242. [Google Scholar] [CrossRef]
  15. Wang, T.; Tang, W.; Qi, D. Enhancing Design Management by Partnering in Delivery of International EPC Projects: Evidence from Chinese Construction. J. Constr. Eng. Manag. 2015, 142, 04015099. [Google Scholar] [CrossRef]
  16. Li, M.K.; Lie, Y.H.; Wong, B.C.L.; Gan, V.J.L.; Cheng, J.C.P. Automated structural design optimization of steel reinforcement using graph neural network and exploratory genetic algorithms. Automat. Constr. 2023, 146, 104677. [Google Scholar] [CrossRef]
  17. Cai, H.W.; Aref, A.J. On the design and optimization of hybrid carbon fiber reinforced polymer-steel cable system for cable-stayed bridges. Compos. Part. B-Eng. 2015, 68, 146–152. [Google Scholar] [CrossRef]
  18. Baghdadi, A.; Heristchian, M.; Kloft, H. Design of prefabricated wall-floor building systems using meta-heuristic optimization algorithms. Automat. Constr. 2020, 114, 103156. [Google Scholar] [CrossRef]
  19. Wang, J.; Liu, J.; Mei, C.; Wang, H.; Lu, J.H. A multi-objective optimization model for synergistic effect analysis of integrated green-gray-blue drainage system in urban inundation control. J. Hydrol. 2022, 609, 127725. [Google Scholar] [CrossRef]
  20. Wang, Y.M.; Zhang, X.D.; Zhang, D.Z. The structure design of integrated urban drainage systems: A view of robust optimization. J. Environ. Manag. 2022, 322, 116050. [Google Scholar] [CrossRef]
  21. Berard, O.; Karlshoej, J. Information delivery manuals to integrate building product information into design. In Proceedings of the 28th International Conference of CIB W78, Sophia Antipolis, France, 26–28 October 2011. [Google Scholar]
  22. Zhang, Q.Z.; Tang, W.Z.; Liu, J. Improving Design Performance by Alliance between Contractors and Designers in International Hydropower EPC Projects from the Perspective of Chinese Construction Companies. Sustainability 2018, 10, 1171. [Google Scholar] [CrossRef] [Green Version]
  23. Liu, Y.; Tang, W.Z.; Colin, F. Improving Design by Partnering in Engineering–Procurement–Construction (EPC) Hydropower Projects: A Case Study of a Large-Scale Hydropower Project in China. Water 2021, 13, 3410. [Google Scholar] [CrossRef]
  24. Gunduz, M.; Aly, A.A.; Mekkawy, T.E. Value Engineering Factors with an Impact on Design Management Performance of Construction Projects. J. Manag. Eng. 2022, 38, 04022012. [Google Scholar] [CrossRef]
  25. Walker, D.H.T.; Walker, B.L. Understanding early contractor involvement (ECI) procurement forms. In Proceedings of the 28th Annual ARCOM Conference, Edinburgh, UK, 3–5 September 2012; pp. 877–887. [Google Scholar]
  26. Wang, S.; Liu, X. Development of EPC model in Chinese public projects: Evolutionary game among stakeholders. J. Asian. Archit. Build. 2022, 21, 2095–2113. [Google Scholar] [CrossRef]
  27. FIDIC (International Federation of Consulting Engineers). Conditions of Contract for EPC/Turnkey Projects; FIDIC: Geneva, Switzerland, 2017. [Google Scholar]
  28. Mostafavi, A.; Karamouz, M. Selecting appropriate project delivery system: Fuzzy approach with risk analysis. J. Constr. Eng. M. 2010, 136, 923–930. [Google Scholar] [CrossRef]
  29. Li, L. The analysis on influencing factor of cost control of EPC project based on the DEMATEL-ISM. Civ. Eng. J. 2022, 31, 66–84. [Google Scholar] [CrossRef]
  30. Chua, D.K.H.; Kog, Y.C.; Loh, P.K. Critical success factors for different project objectives. J. Constr. Eng. M. 2016, 142, 142–150. [Google Scholar] [CrossRef]
  31. Fan, S.L.; Chong, H.Y.; Hung, T.W.; Wang, Y.C. Cost-based scheduling method using object-oriented approach. Automat. Constr. 2016, 65, 65–77. [Google Scholar] [CrossRef] [Green Version]
  32. Hanna, A.S.; Camlic, R.; Peterson, P.A.; Lee, M.J. Cumulative Effect of Project Changes for Electrical and Mechanical Construction. J. Constr. Eng. Manag. 2004, 130, 762–771. [Google Scholar] [CrossRef]
  33. Song, X.Y.; Pena-Mora, F.; Menassa, C.C.; Arboleda, C.A. Insurance as a risk management Tool for ADR implementation in construction disputes. J. Constr. Eng. M. 2012, 138, 14–21. [Google Scholar] [CrossRef]
  34. Zolfagharian, S.; Irizarry, J. Constructability assessment model for commercial building designs in the United States. J. Constr. Eng. Manag. 2017, 143, 04017031. [Google Scholar] [CrossRef]
  35. Yin, Y.L.; Qiao, L. Research on constructability of EPC mode in design phase. In Proceedings of the International Conference on Engineering and Business Management (EBM2010), ChengDu, China, 25–27 March 2010; pp. 1705–1709. [Google Scholar]
  36. Zhu, J.W.; Zhou, L.N.; Li, L.; Ali, W. Decision simulation of construction project delivery system under the sustainable construction project management. Sustainability 2022, 12, 12062202. [Google Scholar] [CrossRef] [Green Version]
  37. Wang, T.F.; Tang, W.Z.; Du, L.; Duffield, C.F.; Wei, Y.P. Relationships among Risk Management, Partnering and Contractor Capability in International EPC Project Delivery. J. Manag. Eng. 2016, 32, 04016017. [Google Scholar] [CrossRef]
  38. Cheng, E.W.L.; Li, H. Construction partnering process and associated critical success factors: Quantitative investigation. J. Manag. Eng. 2002, 18, 194–202. [Google Scholar] [CrossRef]
  39. Shi, Z.Y. Discussion on design optimization of EPC general contract project. Water Resour. Hydropower Eng. 2013, 44, 87–88. [Google Scholar]
  40. Ling, Y.Y.; Lau, B. A case study on the management of the development of a large-scale power plant project in East Asia based on design-build arrangement. Int. J. Proj. Manag. 2002, 20, 413–423. [Google Scholar] [CrossRef]
  41. Whang, S.W.; Flanagan, R.; Kim, S.; Kim, S. Contractor-Led Critical Design Management Factors in High-Rise Building Projects Involving Multinational Design Teams. J. Constr. Eng. Manag. 2017, 143, 06016009. [Google Scholar] [CrossRef]
  42. Demetracopoulou, V.; O’Brien, W.J.; Khwaja, N. 2020 Lessons learned from selection of project delivery methods in highway projects: The Texas experience. J. Leg. Aff. Dispute Resolut. Eng. Constr. 2020, 12, 4519040. [Google Scholar] [CrossRef]
  43. You, J.Y.; Chen, Y.Q.; Wang, W.Q.; Shi, C.X. Uncertainty, opportunistic behavior, and governance in construction projects: The efficacy of contracts. Int. J. Proj. Manag. 2018, 36, 795–807. [Google Scholar] [CrossRef]
  44. Si, S.L.; You, X.Y.; Liu, H.C.; Zhang, P. DEMATEL Technique: A systematic review of the state-of-the-art literature on methodologies and applications. Math. Probl. Eng. 2018, 2018, 3696457. [Google Scholar] [CrossRef] [Green Version]
  45. Shen, J.; Li, F.; Shi, D.; Li, H.; Yu, X. Factors affecting the economics of distributed natural gas-combined cooling, heating and power systems in China: A systematic analysis based on the integrated decision making trial and evaluation laboratory-interpretative structural modeling (DEMATEL-ISM) Technique. Energies 2018, 11, 2318. [Google Scholar]
  46. Chen, P.; Cai, B.; Wu, M.; Zhao, Y. Obstacle analysis of application of blockchain technology in power data trading based on improved DEMATEL–ISM method under fuzzy environment. Energy Rep. 2022, 8, 4589–4607. [Google Scholar] [CrossRef]
  47. He, Y.; Kang, J.; Pei, Y.; Ran, B.; Song, Y. Research on influencing factors of fuel consumption on superhighway based on DEMATEL-ISM model. Energy Policy 2021, 158, 112545. [Google Scholar] [CrossRef]
  48. Yang, J.; Luo, B.; Zhao, C.; Zhang, H. Artificial intelligence healthcare service resources adoption by medical institutions based on TOE framework. Digit. Health 2022, 8, 20552076221126034. [Google Scholar] [CrossRef] [PubMed]
  49. Rahman, M.; Kumaraswamy, M. Relational contracting and teambuilding: Assessing potential contractual and noncontractual incentives. J. Manag. Eng. 2008, 24, 48–63. [Google Scholar] [CrossRef] [Green Version]
Figure 1. The demographics of the respondents. (a) Affiliation. (b) Number of EPC projects participated. (c) Working experience in EPC projects (year).
Buildings 13 01654 g001
Figure 2. The hierarchical structure model for influencing factors.
Buildings 13 01654 g002
Table 1. Critical factors influencing participation in design optimization of EPC projects.
SubsystemInfluencing Factor
DesignerSubcontractor’s participation during design ( S 1 )
Design capacity ( S 2 )
Design management level ( S 3 )
Cost control awareness ( S 4 )
Rationality of design schemes ( S 5 )
Appropriate initial design quantities ( S 6 )
Information communication ( S 7 )
Level of detail in design drawings ( S 8 )
Information coordination between multi-stakeholders ( S 9 )
SubcontractorDesigner’s participation during construction ( S 10 )
Design schedule control ( S 11 )
Frequency of changes ( S 12 )
Engineering insurance ( S 13 )
Constructability assessment ( S 14 )
Personal initiative ( S 15 )
Engineering market ( S 16 )
Designer and subcontractorPerformance evaluation mechanism ( S 17 )
Policies and regulations ( S 18 )
Technological development ( S 19 )
Risk management ability of EPC contractor ( S 20 )
EPC contractorTrust of the owner ( S 21 )
Innovation awareness ( S 22 )
Owners’ attitude towards disputes ( S 23 )
Degree of involvement in design management ( S 24 )
Project document reviews ( S 25 )
Errors of materials provided by the owner ( S 26 )
Approval efficiency of design documents ( S 27 )
OwnerProject schedule ( S 28 )
Sensitivity to project cost growth ( S 29 )
Selection of EPC contractor ( S 30 )
Level of expertise ( S 31 )
EPC contractor and ownerContract formulation ( S 32 )
Uncertainty brought by external environments ( S 33 )
Table 2. Comprehensive analysis results based on DEMATEL.
Influencing Factor E i   F i   M i   N i  
Subcontractor’s participation during design ( S 1 )3.743.677.410.07
Design   capacity   ( S 2 ) 3.823.066.880.76
Design   management   level   ( S 3 ) 4.153.297.440.86
Cos t   control   awareness   ( S 4 ) 3.743.777.51−0.03
Rationality   of   design   schemes   ( S 5 ) 3.055.378.42−2.32
Appropriate   initial   design   quantities   ( S 6 ) 2.893.846.73−0.95
Information   communication   ( S 7 ) 3.504.367.86−0.86
Level   of   detail   in   design   drawings   ( S 8 ) 3.623.807.42−0.18
Information   coordination   between   multi stakeholders   ( S 9 ) 4.175.259.42−1.08
Designer s   participation   during   construction   ( S 10 ) 3.854.638.48−0.78
Design   schedule   control   ( S 11 ) 3.445.208.64−1.76
Frequency   of   changes   ( S 12 ) 3.635.439.06−1.8
Engineering   insurance   ( S 13 ) 3.452.586.030.87
Constructability   assessment   ( S 14 ) 3.644.197.83−0.55
Personal   initiative   ( S 15 ) 3.184.347.52−1.16
Engineering   market   ( S 16 ) 3.490.483.973.01
Performance   evaluation   mechanism   ( S 17 ) 4.221.305.522.92
Policies   and   regulations   ( S 18 ) 3.350.013.363.34
Technological   development   ( S 19 ) 4.290.174.464.12
Risk   management   ability   of   EPC   contractor   ( S 20 ) 4.185.609.78−1.42
Trust   of   the   owner   ( S 21 ) 4.084.969.04−0.88
Innovation   awareness   ( S 22 ) 3.875.299.16−1.42
Owners’ attitude towards disputes ( S 23 ) 4.063.637.690.43
Degree   of   involvement   in   design   management   ( S 24 ) 4.065.179.23−1.11
Project   document   reviews   ( S 25 ) 3.052.225.270.83
Errors   of   materials   provided   by   the   owner   ( S 26 ) 3.201.915.111.29
Approval   efficiency   of   design   documents   ( S 27 ) 3.024.267.28−1.24
Project   schedule   ( S 28 ) 3.294.838.12−1.54
Sensitivity   to   project   cos t   growth   ( S 29 ) 3.854.087.93−0.23
Selection   of   EPC   contractor   ( S 30 ) 4.344.999.33−0.65
Level   of   expertise   ( S 31 ) 3.310.724.032.59
Contract   formulation   ( S 32 ) 3.614.868.47−1.25
Uncertainty   brought   by   external   environments   ( S 33 ) 4.664.519.170.15
Disclaimer/Publisher’s Note: The statements, opinions and data contained in all publications are solely those of the individual author(s) and contributor(s) and not of MDPI and/or the editor(s). MDPI and/or the editor(s) disclaim responsibility for any injury to people or property resulting from any ideas, methods, instructions or products referred to in the content.

