Abstract
Loose-fill thermal insulations in timber-frame structures are designed to provide efficient thermal protection with the ability to fill intricate details. In a previous study, we detected several air cavities formed in timber-framed wall samples filled with loose-fill mineral fiber insulation. This discovery led us to retrofit the walls by adding appropriate insulation, thus enabling us to evaluate the importance of proper amendment. This paper focuses on a wall fragment with an 80 mm high air gap at the top and a 30 mm high cavity in the middle of the wall height. The following paper compares data collected before the discovery and after the replenishment (refill of air gaps with additional insulation), evaluating potential thermal performance improvement. We were able to quantify the impact of these defects on the external wall exposed to realistic conditions. Based on temperature and relative humidity measurements, the results show significant advancement in the middle of wall thickness with an 8 °C and 45% difference. The results show that although this defect did not directly affect the energy balance of the building, it significantly increases the risk of mold growth due to thermal bridging.
1. Introduction
Society increasingly investigates possibilities to develop sustainable environments. The building industry, an essential aspect of our lives, provides ample space for improvement. Several studies point out improvements in carbon footprint reduction in the application of cement-based concrete structures [1,2]. However, our interest is to contribute to the research on lightweight wood-frame envelopes, which are currently in progressive development in our region. Natural materials, such as wood, show many benefits in the context of sustainability [3] while also respecting legislative requirements [4]. The impact of incorporating wooden structures into housing solutions is substantial, both environmentally and economically [5].
According to [6], timber-structured houses can provide sufficient thermal protection, even in severely cold climates. Fulfilling current requirements, timber-framed structures are outstanding not only in terms of thermal and acoustic performance but also in low weight and relatively small thickness compared to traditional masonry walls [7,8].
The space between load-bearing timber studs is filled with either rigid or fibrous thermal insulation. This non-homogenous layer is supplemented by additional thermal insulation, most commonly from the exterior side, to eliminate thermal bridging. These layers also provide a wind barrier necessary to eliminate heat loss, ultimately caused by air filtration.
Among the fibrous materials, the loose-fill thermal insulations gained popularity through their capability to fill intricate details of buildings. Their undefined geometry and adaptability uplift the sustainable development of buildings, where fibrous blown-in materials can easily be reused after fulfilling their primary function.
In order to minimize the risk of material settlement, the insulation needs to be blown in according to technological instructions. The approach depends foremost on the type of the structure—whether it is vertical or horizontal installation—and, at the same time, on the blown-in material itself. Moreover, the density is crucial not only to prevent air gapping [9] but also to provide desired thermal resistance, which is dependent on the material density [10].
This paper references long-term research on a timber-frame wall in Slovakia, containing three samples equipped with loose-fill mineral fiber insulation.
In this case, the used insulation—glass fiber—is intended for machine processing with a blow-in density of 35 kg/m3. The producer claims the insulation to be harmless in terms of ecology and hygiene while also being resistant to molds, fungi, pests, rodents, and insects [11]. At the same time, the fibers are hydrophobized over their entire surface.
The inorganic nature of the mineral fiber, although associated with higher primary energy demands, shows its benefits in several areas [12]. Firstly, the hydrophobic nature of mineral wool makes it less prone to an increase in humidity [13]. Additionally, it also stands out in terms of thermal, acoustic, and fire-retardant properties [14,15,16].
Prior to this experiment, there was a thorough inspection of the current state and quality of the samples [17]. During the investigation, we discovered several issues, one of the most significant being an excessive loose-fill insulation settlement, which caused the creation of an air gap in the wall head. Moreover, in the middle was found an additional air gap, created due to necessary wiring.
Naturally, this raised interest regarding the impact of these cavities, which are expected to cause significant thermal bridging. To execute the evaluation, we have refilled the air cavities to create a representative sample. Therefore, we are able to present collected data on the temperature and relative humidity, both with and without undesirable air cavities.
The non-intentional settlement of loose-fill insulation material is a known phenomenon. The same applies to air cavities in building design, such as a Trombe wall or forming a double-skin façade, created to decrease energy demands [18]. The crucial inquiry is thereby to correctly estimate the properties of created microclimate and predict or evaluate its impact [19]. However, current research lacks actual in situ measurements and detailed data on how unintentional air gaping due to material settlement influences the hygro-thermal performance of highly insulated walls. Whether the impact is limited only to a small local area or, on the contrary, it decreases the quality of the whole wall. Does the inevitable thermal bridging cause higher relative humidity and lead to a higher risk of material degradation? This article serves to assess the importance of the correct execution of the thermal insulation layer with respect to the measured influence of subsequent retrofitting.
2. Materials and Methods
The whole pavilion research consists of two experimental timber-framed walls (Figure 1a), differing in orientation. One is facing east (with a 15 °C inclination towards the south). Figure 1b depicts selected sample E5, which is later further described. The other wall faces the south (with a 15 °C inclination towards the west). Each contains five different wall samples, shown in Figure 2, divided by identical wooden load-bearing studs. The samples vary in orientation, insulation materials, and order.
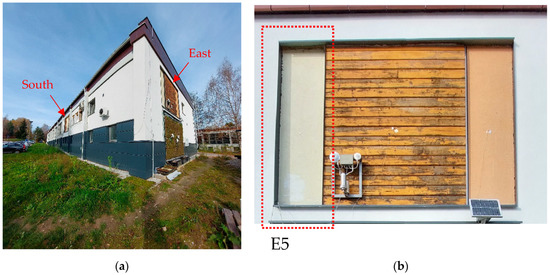
Figure 1.
Experimental timber-framed walls: (a) Placement within the research center of UNIZA in Žilina; (b) East view of selected fragment E5.
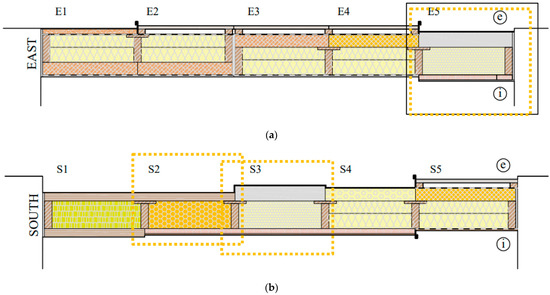
Figure 2.
Experimental timber-framed walls oriented towards (a) East with selected wall sample; (b) South.
The research locality [17] is in Slovakia, in a continental climate [20]. It is bound to monitor temperature and relative humidity within those ten samples and thus evaluate and compare the thermal performance of each assembly. A monitored setup provides extensive data outcomes, leaving room for thorough and complex analyses. The walls are under long-term exposure to the natural exterior climatic conditions, while the interior climate is conditioned to provide a comparable environment. Both are documented by a weather station on a laboratory roof or internal temperature and relative humidity sensors.
As previously mentioned, this research contains three samples incorporating loose-fill insulation (E5, S2, and S3), marked by a yellow dotted rectangle in Figure 2. Among them is one particular sample where the most significant cavity was detected. This fragment, indicated as E5, is highlighted in Figure 2a. Due to the scale of measured settlement, it will most appropriately demonstrate the potential influence of these air gaps on thermal performance and will be further discussed.
Sample E5 is a diffuse open structure without any additional vapor retardant. E5 stands for the east orientation, and number 5 describes its location within the eastern wall. The materials and their combination in our research laboratory are not typical in the Slovak region. On the contrary, several fragments are built intentionally atypical to serve as research objects—to observe the thermal performance (temperature, relative humidity, thermal flow) within each structure and to determine their feasibility. However, this does not influence the objective of this paper—the impact of air cavities formed in the loose-fill insulation layer.
The main characteristics of the materials are in Table 1. The framing consists of solid structural timber 60 mm × 220 mm and is filled with glass fiber blown-in insulation. The outer layers are formed by silicon and adhesive render with mesh fabric on top of a layered TI (basalt fiber 80 mm and grey EPS 40 mm). The inner layers are rigid phenolic foam board and OSB (Figure 3). The loose-fill mineral insulation consists of thoroughly hydrophobized glass fibers, resistant to mold, fungus, and insects. The heat transfer coefficient, calculated according to European standards for inhomogeneous structures [21], is U = 0.1 W/(m2.K).

Table 1.
Materials and their main physical properties.

Figure 3.
Selected wall sample with material order.
2.1. Temperature and Relative Humidity
The primary purpose of the experimental walls is to monitor their hygro-thermal performance. In order to analyze them, each sample contains built-in temperature and relative humidity sensors between thermal insulation layers. Unfortunately, these also create obstructions for loose-fill insulation. Furthermore, the sensors are distributed at three different elevations. Figure 4a shows their vertical positioning, while Figure 4b depicts the exact placement within the wall layers in three cross-sections. The temperature sensors are NTC (Negative Temperature Coefficient) thermistors with an accuracy of ±0.2 °C. At the same time, the relative humidity is monitored by capacity probes with an accuracy of ±2%.
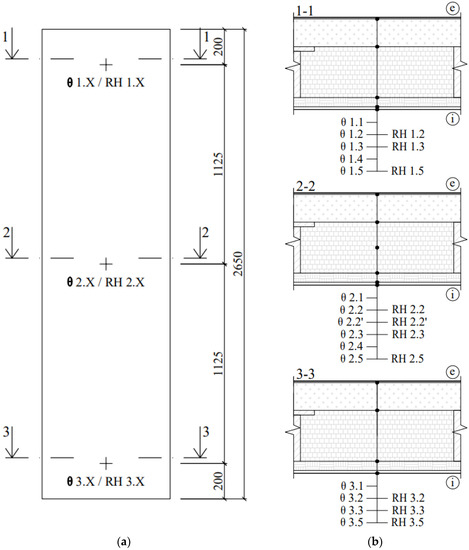
Figure 4.
Wall sample E5: (a) interior view on wall segment E5 with vertical sensors positioning, where X stands for cross-section position; (b) wall cross-sections with probes placement.
For better representation, Figure 5a shows the positioning of the critical air gaps. The primary air cavity, reaching 80 mm throughout the whole wall thickness, was discovered on top of the wall sample, presumably due to material settlement (Figure 5b).
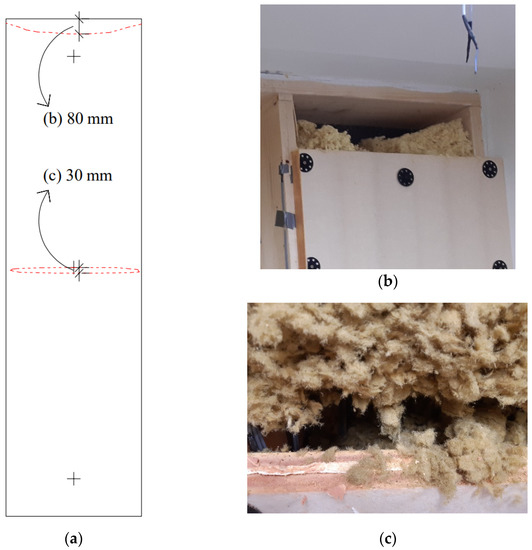
Figure 5.
Detected air cavities: (a) positions of the cavities in wall E5; (b) on top of the wall; (c) in the middle of the wall height.
The placement of sensors 2.2′ required an additional wire to ensure their position in the middle of the loose-fill insulation, creating the grounds for the second air cavity of a maximal 30 mm, where the wire used for sensors prevented the correct filling of blown-in insulation (Figure 5c). This error, however, enabled us to measure the temperature and relative humidity within the air cavity.
The next step in the process was to fill the air cavities created on top and in the middle of the wall using thermal insulation with equivalent material characteristics. Continuous temperature and relative humidity measurements made it possible to compare and evaluate the difference before and after the amendment. The years 2019 and 2022 were vastly diverse in terms of outside winter temperature. The minimal temperature was 2019 −17.2 °C in 2019 and −9.8 °C in 2022.
For illustration, Figure 6 represents both years’ temperature and relative humidity. Therefore, selecting an appropriate period for performance comparison was somewhat intricate. Eventually, we selected the coldest week from 20 January to 26 January in both years (Figure 7).

Figure 6.
Annual exterior relative humidity and temperature of years 2019 and 2022.
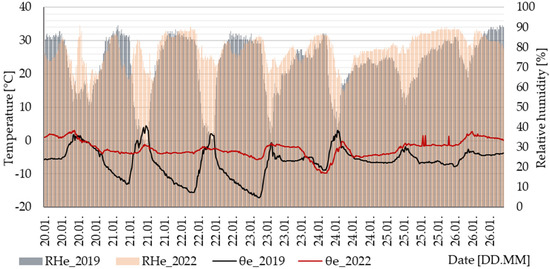
Figure 7.
Exterior relative humidity and temperature during the coldest week of 2019 and 2022.
The figures show the relative humidity in histogram graphics and temperature as line curves. Both parameters were fairly overlapping and presented in a partially see-through view.
2.2. Impact on Building Thermal Performance
The created thermal bridges would have the greatest impact on the heat losses in the winter period, thus on the heating demand in the annual energy balance. In order to verify the hypothesis of increased demand, we have made a calculation corresponding to the requirements of our region on the basis of binding decree No. 364/2012 [22].
For the purpose of the calculation, we have created a two-storey model house with basic floor plan dimensions of 8.00 m × 10.35 m. Figure 8a,b shows the floor plans of both floors.
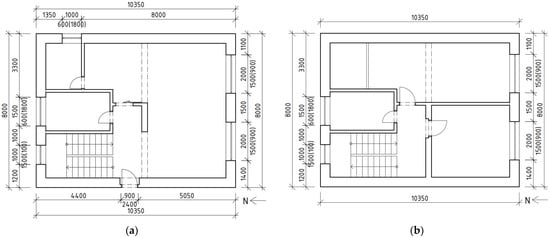
Figure 8.
Floor plans of the model building: (a) 1st floor; (b) 2nd floor.
The ground floor, roof, and opening compositions were chosen generically according to the requirements for each structure in STN EN 730540-2+Z1+Z2:2019 [23] and remained unchanged during the calculation. The only variable was the heat transfer coefficient of the wall structure, affected by the thermal bridges formed, which resulted in two variants.
In both variants, the heat transfer coefficient was calculated according to the current legislation [21] for inhomogeneous structures. In the first variant, the calculation takes into account the size and location of thermal bridges created by the resulting air cavities, with a heat transfer coefficient value of U = 0.0959 W/(m2.K). The second variant considers an ideal structure without the formation of additional defects, achieving a value of U = 0.094 W/(m2.K).
3. Results
The results contain the temperature and relative humidity within the selected wall before and after the amendment. The following data are related to sensor placement, previously shown in Figure 4.
3.1. Temperature
The coldest week of both years was from 20 January to 26 January, although the minimum air temperature differed: in 2019, −17.2 °C and −9.8 °C in 2022. Figure 9 shows the correlation between both years in the middle of walls height, extended to θe for the exterior and θi for the interior air temperature.

Figure 9.
Temperature development within the selected wall during the coldest week.
The significant difference is in layers 2.2 and 2.2′, which are highly influenced by the exterior air temperature and solar radiation. However, this influence generally decreases towards the interior, while interior boundary conditions influence the other layers.
To represent the consequences of air gapping, we need to select the most dangerous moment, which is the minimal exterior temperature, accompanied inevitably by maximal relative humidity. This phenomenon is tricky to establish because of the fact that the minimum temperature in 2022 was 7.4 °C, lower than three years prior. Therefore, the selected moment was established on January 24th. The outside temperature in both years reached −9.8 °C, while the relative humidity was 87%.
Figure 10 depicts the temperature development through the wall cross-section for the various vertical positioning—yellow for the upper post (1), grey in the middle (2), and blue on the bottom level (3). The X-axis represents different probe placements according to Figure 4, illustrated by the see-through cross-section.
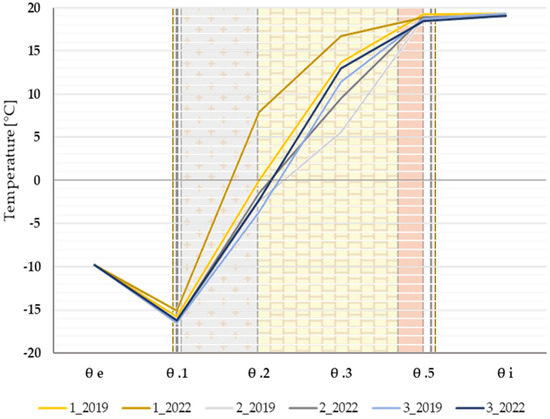
Figure 10.
Temperature development through wall depth.
The exterior and interior air temperature is identical in both cases. The most significant discrepancy is in the highest position, the monitoring position nearest to the upper air cavity.
According to the graph, the temperature discrepancy caused by air gapping was 8 °C in the highest position (1_2019/1_2022 in placement θ .2) and 4 °C in the middle (2_2019/2_2022 in placement θ .3). The transition between the negative and positive temperature values in the structure was in its original state at the beginning of the blown-in thermal insulation. After the refurbishment, this zone was pushed towards the exterior in all three height levels. However, it was most pronounced in the top position, which was the outer layer of grey polystyrene.
Nevertheless, the sensor placement is not identical at all three levels. For example, at the highest position are sensors from 1.1 to 1.5. Conversely, the lowest position lacks the placement between the phenolic board and OSB (position 3.4). Furthermore, the middle position is the most equipped, with an additional sensor in the middle of loose-fill insulation (placement 2.2′). A detailed comparison of the temperature at each measurement location is summarized in Table 2, where the largest deviations are highlighted in red.

Table 2.
Temperature comparison.
Due to the selected exterior and interior boundary conditions, the temperature near the wall surface was very similar both in the exterior and interior. At the highest level was the maximal difference in position 1.2, reaching almost 8 °C, which is the location of the largest cavity. However, already in the following position was the discrepancy of 3 °C, while ultimately eliminated at 1.4. That supports the hypothesis that the temperature within the remaining layers is, while varying, influenced solemnly by the air gapping.
The variation in the middle level occurred slightly at 2.2 (1 °C), then gained on its merit, peaking at 2.3, with the difference being 4 °C. As per the upper level, also in the middle was the difference eliminated already in layer interface 2.4. Minor diversities were also discovered in the bottom part of the wall structure, at least influenced by the above air cavities, reaching a maximum of 1.5 °C.
3.2. Relative Humidity
The relative humidity is measured by capacity probes placed within the samples identical to the temperature sensors (Figure 4b).
The development of relative humidity during the week from 20 January to 26 January is depicted in Figure 11, containing the values within the wall, enhanced by the values of exterior air.
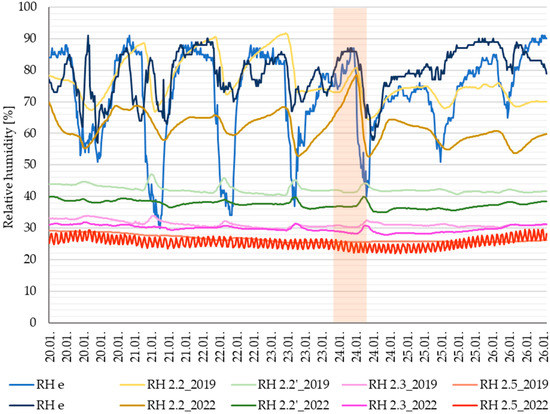
Figure 11.
Relative humidity development within the selected wall during the coldest week.
Although the maximal exterior Rh was mainly similar in both years, the minimum Rh values differed by 30%. However, this difference was gradually eliminated towards the internal layers. The interior relative humidity was relatively low and almost identical in both years.
As per temperature, selecting the right moment to represent the most undesirable conditions was necessary, leading us to elect 24 January again. The values of exterior Rh collided on the highest 87% position while also greatly coinciding with the first monitored position, 3.2.
Figure 12 shows relative humidity development through the wall cross-section during identical exterior conditions. A different color distinguishes each vertical level: yellow for the highest level, grey in the middle, and blue just above the ground, while values in 2019 use lighter color shades compared to 2022.
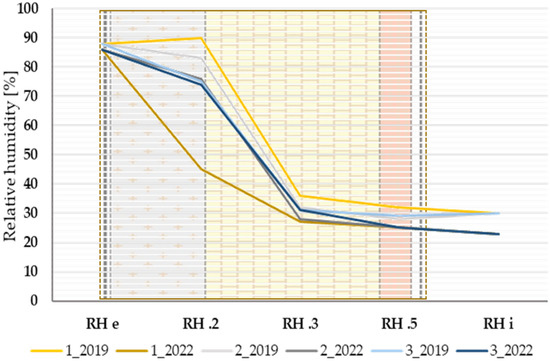
Figure 12.
Relative humidity development through wall depth.
In correlation to the temperature, the relative humidity also showed the greatest discrepancy in the upper position. Table 3 shows the contrast in each level to exceed the measured values’ comparison.

Table 3.
Relative humidity comparison.
The results are comparable in both years for most measurements, differing by a maximum of 7%. The main discrepancy is, however, occurring in the highest position as a consequence of the larger air cavity. The difference is 45%. However, the next position reported a comparatively minimalized difference of 9%. These results show the potential for a significant reduction in relative humidity by applying additional thermal insulation in the cavities.
3.3. Thermal Performance
The calculation of the specific heating demand was carried out in accordance with regional legislation [22]. Detailed tables for both options can be found in Appendix A.
The evaluation procedure is based on the resulting value of the specific heat demand for heating. The results of both options are then converted into financial costs (Table 4) according to current regional pricing for gas [24] and electricity [25].

Table 4.
Specific heating demand.
As the calculation showed, despite the assumptions, the thermal bridges created did not have a significant impact on the specific heating demand. When converted into percentages, the increase in heat demand is 0.78%. This would mean an increase in the annual price of EUR 1.43 for heating with gas and EUR 3.40 for heating with electricity at the current price list for fuel in Slovakia.
4. Discussion
The data collected by the weather station indicate a significant temperature difference between the years 2019 and 2022. While the minimal exterior temperature was in 2019 −17.2 °C, it reached only −9.8 °C in 2022, creating a discrepancy of 7.4 °C in three years. That means different boundary conditions and, thus, a difficult comparison. However, timber-based buildings are known for their low heat accumulation capability [6,26], which is primarily an undesirable feature. However, it enabled us to proceed with the research.
Several studies address loose-fill insulation settlement [27,28,29]. However, there is a lack of information regarding performance evaluation after creating undesired cavities. Data presented within this paper was accumulated thanks to the experimental nature of the research.
The results point out the significance of proper loose-fill material installations. The change in exterior boundary conditions indeed caused minor differences. However, the discrepancies found within the data undeniably indicate the impact of voids caused by either material settlement or inappropriate filling technique by the additional wiring.
Detailed analysis in this paper concentrates on timber-frame wall samples equipped with relative humidity and temperature sensors in three cross-section levels. In 2019, we found two air cavities, one in the upper level of 80 mm height and the other in the middle, with a maximum height of 30 mm. The lowest position provided control measurements while also representing the potential influence of the above voids.
According to the premise, the predominant impact was at the highest level with the larger cavity. The temperature difference reached nearly 8 °C in position 1.2, gradually decreasing to the next position reaching only 3 °C, and subsequently vanishing completely. In addition, the relative humidity here reached the maximal discrepancy of 45%. However, analogously to the temperature, the values differentiating only by 9% were already in the following position.
As we proceed further from the upper air cavity, the discrepancies decrease. The middle position with the 30 mm air gap showed a temperature difference of 2–4 °C, while the relative humidity was almost identical (varying by 5%).
The bottom position reflects only the potential influence of upper cavities, as there was no additional issue found. The temperature difference reaches a maximum of 1 °C, while the relative humidity is in the middle identical.
To conclude, the most significant discrepancies occur in the top position, specifically in the middle of the blown-in layer, due to the additional thermal insulation both from the exterior and interior sides. At the same time, they do not substantially influence internal surface temperature (position 1.5). Moreover, according to the data, the increased relative humidity in vertical position 1 did not affect the underlying space. As previously said, mineral fiber insulation is not extensively sensitive to relative humidity [17]. This phenomenon, combined with the walls’ capability to balance the relative humidity increase already in one layer, prevented the increased Rh from causing material deterioration.
The final step in this study was to verify the hypothesis that these cavities can have a significant impact on the building’s energy balance. For this assessment, we have chosen to calculate the specific heat demand for heating in accordance with current legislation. However, the resulting values of specific heat demand with subsequent conversion to financial costs showed a minimal impact. However, in this case, it is a multi-layered construction. It should be stressed that this impact would be more significant in the cases when only blown-in insulation is used.
In this case, the thermal bridging did not cause any damage to the construction, including both load-bearing timber profiles and thermal insulation layers. The obtained data should widen the knowledge regarding loose-fill thermal insulations and their performance in case of accidental defects. Such thermal bridges, whether caused by material settlement or unavoidable penetrations, have a high potential to affect the energy balance of the building negatively. This article, therefore, emphasizes the importance of addressing the repair and refurbishment of buildings.
5. Conclusions
The most important conclusions of this work are summarized as follows:
- Due to the relatively low heat storage capacity of the studied structures, it is possible to compare measurements even in years where the minimum air temperature differs by 7.4 °C;
- The largest measured difference in temperature and relative humidity was at the upper location, where the most pronounced air cavity was previously discovered. This difference represented an 8 °C change in temperature and 45% relative humidity;
- The difference decreased rapidly as one progressed into the interior without affecting the internal surface temperature of the structure;
- The creation of this thermal bridge at the synchronous increase in relative humidity leads to an increased risk of mold formation and growth;
- An additional layer of thermal insulation on the interior side ensured constant conditions on the inner surface of the wall;
- The significant difference in temperature and relative humidity in the upper position did not affect the conditions in the lower two positions;
- The middle air cavity did not cause a difference in relative humidity. However, it did affect the temperature by 4 °C;
- The measured parameters in the lowest position were not affected by any of the upper defects;
- Despite the initial hypothesis, it turned out that these local thermal bridges did not have a significant impact on the specific heating demand during the winter season;
- In our case, the defects increased the risk of mold growth in the structure itself. In the case of using only blown-in thermal insulation, these defects could cause mold growth on the internal surface, as well as significantly increase the specific heat demand for heating and thus affect the energy balance.
Author Contributions
Conceptualization, D.M.; methodology, D.M.; software, D.M. and P.Ď.; validation, D.M.; formal analysis, D.M.; investigation, D.M.; resources, P.Ď.; data curation, D.M.; writing—original draft preparation, D.M.; writing—review and editing D.M. and P.Ď.; supervision P.Ď. All authors have read and agreed to the published version of the manuscript.
Funding
This article was funded with the support of the Internal Grant of UNIZA Theoretical and experimental analysis of heat flow, water and air filtration, and heat accumulation in light-weight wooden envelope structures and VEGA grant Nr. 1/0673/20: Theoretical and experimental analysis of energy-effective and environmentally friendly building envelopes.
Institutional Review Board Statement
Not applicable.
Informed Consent Statement
Not applicable.
Data Availability Statement
Not applicable.
Conflicts of Interest
The authors declare no conflict of interest.
Appendix A
Table A1 provides the calculation of the first variant—with air cavities.

Table A1.
Specific heating demand calculation—variant 1.
Table A1.
Specific heating demand calculation—variant 1.
| Nr. | GENERAL INFORMATION | ||||||||
| 1 | Building name: | Single-family house | |||||||
| 2 | Location: | Žilina, Slovakia | |||||||
| Calculation of heating demand | |||||||||
| INPUT DATA | |||||||||
| 3 | Building | Building category (single use) | Building for living | ||||||
| 4 | Year of approval | 2023 | |||||||
| 5 | Year of last thermal protection change | 2023 | |||||||
| 6 | Type, construction system, building system (apartment buildings) | Wood-frame | |||||||
| 7 | Building width | 10.35 m | |||||||
| 8 | Building length | 8.0 m | |||||||
| 9 | Building height | 7.1 m | |||||||
| 10 | Number of floors | 2 | |||||||
| 11 | Building volume | 587.88 m3 | |||||||
| 12 | Total floor area | 130.9 m2 | |||||||
| 13 | Total heat exchange surface | 397.6 m2 | |||||||
| 14 | Average construction height | 3 | |||||||
| 15 | Form factor | 0.75 | |||||||
| 16 | Calc. | Calculation method | seasonal | ||||||
| 17 | Number of daily degrees | 3422 K.day | |||||||
| Heat loss | Description/name of the building envelope | Heat transfer coefficient of the structure Ui [W/m2K] | Heat exchange surface Ai [m2] | Temperature reduction factor b [−] | |||||
| Envelope structure: | |||||||||
| 18 | 1 | Exterior wall | 0.0959 | 220.28 | 1 | ||||
| Roof: | |||||||||
| 19 | 2 | Green roof | 0.1 | 80 | 1 | ||||
| Floor: | |||||||||
| 20 | 1 | Terrain floor | 0.096 | 80 | 1 | ||||
| Openings: | |||||||||
| 21 | 1 | Window 1000 × 1500, 2 pcs | 0.661 | 3 | 1 | ||||
| 22 | 2 | Window 2000 × 1500, 4 pcs | 0.62 | 12 | 1 | ||||
| 23 | 3 | Window 1500 × 600, 2 pcs | 0.721 | 1.8 | 1 | ||||
| 24 | 4 | Window 1000 × 600, 1 pcs | 0.74 | 0.6 | 1 | ||||
| 25 | 5 | Doors | 1.92 | 1 | |||||
| 26 | Average heat transfer coefficient Um | 0.121 | W/m2K | ||||||
| 27 | Thermal conductivity (transmittance) of the floor and walls in a heated basement | - | W/K | ||||||
| 28 | Impact of thermal bridges ∆U | 0.05 | W/m2K | ||||||
| 29 | Increase in heat loss due to thermal bridges ∆HTM | 19.88 | W/K | ||||||
| Heat loss | Description of the openings | Total length of joints of openings l [m] | Air permeability coefficient of window openings i.104 [m2/(s.Pa0.67)] | ||||||
| 30 | 1 | Window 1000 × 1500, 2 pcs | 8.88 | 0.00005 | |||||
| 31 | 2 | Window 2000 × 1500, 4 pcs | 25.76 | 0.00005 | |||||
| 32 | 3 | Window 1500 × 600, 2 pcs | 2.62 | 0.00005 | |||||
| 33 | 4 | Window 1000 × 600, 1 pcs | 5.28 | 0.00005 | |||||
| 34 | Building characteristic number B (if used for air change calculation) | - | Pa0.67 | ||||||
| 35 | Average air exchange rate calculated n | 0.091 | l/h | ||||||
| 36 | Measured airtightness n50 | - | l/h | ||||||
| 37 | Considered average air exchange rate n | 0.5 | l/h | ||||||
| 38 | Heat recovery unit | - | |||||||
| 39 | Efficiency of the heat recovery unit | - | % | ||||||
| 40 | Proportion of air passing through the unit | - | m3 | ||||||
| 41 | Heat gain | Thermal output of the indoor source q | 6 | W/m2 | |||||
| 42 | Internal heat gains Qi | 3927 | kWh/a | ||||||
| Orientation | Solar radiation intensity Isj [kWh/m2] | Solar transmittance g [−] | Shading factor [−] | Area of glazed opening structures A [m2] | Effective collection area, full sections A [m2] (cooling) | ||||
| 43 | 1 | North | 100 | - | - | 4.8 | 4.8 | ||
| 44 | 2 | South | 320 | - | - | 12 | 12 | ||
| 45 | 3 | East | 200 | - | - | 0.6 | 0.6 | ||
| 46 | Solar heat gains | 4440 | kWh/a | ||||||
| Heating demand | Seasonal method | ||||||||
| 47 | Specific heat loss through transition Ht | 67.85 | W/K | ||||||
| 48 | Specific heat loss through ventilation Hv | 82.303 | W/K | ||||||
| 49 | Heat gain recovery factor | 0.95 | |||||||
| 50 | Specific heating demand—seasonal method | 33.45 | kWh/(m2a) | ||||||

Table A2.
Specific heating demand calculation—variant 2.
Table A2.
Specific heating demand calculation—variant 2.
| Nr. | GENERAL INFORMATION | ||||||||
| 1 | Building name: | Single-family house | |||||||
| 2 | Location: | Žilina, Slovakia | |||||||
| Calculation of heating demand | |||||||||
| INPUT DATA | |||||||||
| 3 | Building | Building category (single use) | Building for living | ||||||
| 4 | Year of approval | 2023 | |||||||
| 5 | Year of last thermal protection change | 2023 | |||||||
| 6 | Type, construction system, building system (apartment buildings) | Wood-frame | |||||||
| 7 | Building width | 10.35 m | |||||||
| 8 | Building length | 8.0 m | |||||||
| 9 | Building height | 7.1 m | |||||||
| 10 | Number of floors | 2 | |||||||
| 11 | Building volume | 587.88 m3 | |||||||
| 12 | Total floor area | 130.9 m2 | |||||||
| 13 | Total heat exchange surface | 397.6 m2 | |||||||
| 14 | Average construction height | 3 | |||||||
| 15 | Form factor | 0.75 | |||||||
| 16 | Calc. | Calculation method | seasonal | ||||||
| 17 | Number of daily degrees | 3422 K.day | |||||||
| Heat loss | Description/name of the building envelope | Heat transfer coefficient of the structure Ui [W/m2K] | Heat exchange surface Ai [m2] | Temperature reduction factor b [−] | |||||
| Envelope structure: | |||||||||
| 18 | 1 | Exterior wall | 0.0940 | 220.28 | 1 | ||||
| Roof: | |||||||||
| 19 | 2 | Green roof | 0.1 | 80 | 1 | ||||
| Floor: | |||||||||
| 20 | 1 | Terrain floor | 0.096 | 80 | 1 | ||||
| Openings: | |||||||||
| 21 | 1 | Window 1000 × 1500, 2 pcs | 0.661 | 3 | 1 | ||||
| 22 | 2 | Window 2000 × 1500, 4 pcs | 0.62 | 12 | 1 | ||||
| 23 | 3 | Window 1500 × 600, 2 pcs | 0.721 | 1.8 | 1 | ||||
| 24 | 4 | Window 1000 × 600, 1 pcs | 0.74 | 0.6 | 1 | ||||
| 25 | 5 | Doors | 1.92 | 1 | |||||
| 26 | Average heat transfer coefficient Um | 0.121 | W/m2K | ||||||
| 27 | Thermal conductivity (transmittance) of the floor and walls in a heated basement | - | W/K | ||||||
| 28 | Impact of thermal bridges ∆U | 0.05 | W/m2K | ||||||
| 29 | Increase in heat loss due to thermal bridges ∆HTM | 19.88 | W/K | ||||||
| Heat loss | Description of the openings | Total length of joints of openings l [m] | Air permeability coefficient of window openings i.104 [m2/(s.Pa0.67)] | ||||||
| 30 | 1 | Window 1000 × 1500, 2 pcs | 8.88 | 0.00005 | |||||
| 31 | 2 | Window 2000 × 1500, 4 pcs | 25.76 | 0.00005 | |||||
| 32 | 3 | Window 1500 × 600, 2 pcs | 2.62 | 0.00005 | |||||
| 33 | 4 | Window 1000 × 600, 1 pcs | 5.28 | 0.00005 | |||||
| 34 | Building characteristic number B (if used for air change calculation) | - | Pa0.67 | ||||||
| 35 | Average air exchange rate calculated n | 0.091 | l/h | ||||||
| 36 | Measured airtightness n50 | - | l/h | ||||||
| 37 | Considered average air exchange rate n | 0.5 | l/h | ||||||
| 38 | Heat recovery unit | - | |||||||
| 39 | Efficiency of the heat recovery unit | - | % | ||||||
| 40 | Proportion of air passing through the unit | - | m3 | ||||||
| 41 | Heat gain | Thermal output of the indoor source q | 6 | W/m2 | |||||
| 42 | Internal heat gains Qi | 3927 | kWh/a | ||||||
| Orientation | Solar radiation intensity Isj [kWh/m2] | Solar transmittance g [−] | Shading factor [−] | Area of glazed opening structures A [m2] | Effective collection area, full sections A [m2] (cooling) | ||||
| 43 | 1 | North | 100 | - | - | 4.8 | 4.8 | ||
| 44 | 2 | South | 320 | - | - | 12 | 12 | ||
| 45 | 3 | East | 200 | - | - | 0.6 | 0.6 | ||
| 46 | Solar heat gains | 4440 | kWh/a | ||||||
| Heating demand | Seasonal method | ||||||||
| 47 | Specific heat loss through transition Ht | 67.531 | W/K | ||||||
| 48 | Specific heat loss through ventilation Hv | 82.303 | W/K | ||||||
| 49 | Heat gain recovery factor | 0.95 | |||||||
| 50 | Specific heating demand—seasonal method | 33.19 | kWh/(m2a) | ||||||
References
- Cui, K.; Liang, K.; Chang, J.; Lau, D. Investigation of the macro performance, mechanism, and durability of multiscale steel fiber reinforced low-carbon ecological UHPC. Constr. Build. Mater. 2022, 327, 126921. [Google Scholar] [CrossRef]
- Cui, K.; Chang, J. Hydration, reinforcing mechanism, and macro performance of multi-layer graphene-modified cement composites. J. Build. Eng. 2022, 57, 104880. [Google Scholar] [CrossRef]
- Lancashire, R. Achieving ‘thermal comfort’ in timber frame buildings. Struct. Eng. 2010, 88, 19–21. Available online: https://www.researchgate.net/publication/295295960_Achieving_’thermal_comfort’_in_timber_frame_buildings (accessed on 7 March 2023).
- Decree 625 MVaRRSR. Implementing Act No. 555/2005 Coll. on the Energy Performance of Buildings and on the Amendment of Certain Laws (in Slovak Original); Slovak Ministry of Justice: Bratislava, Slovakia, 2005. [Google Scholar]
- Švajlenka, J.; Kozlovská, M. Houses Based on Wood as an Ecological and Sustainable Housing Alternative—Case Study. Sustainability 2018, 10, 1502. [Google Scholar] [CrossRef]
- Zhen, M.; Zhang, B. Energy Performance of a Light Wood-Timber Structured House in the Severely Cold Region of China. Sustainability 2018, 10, 1501. [Google Scholar] [CrossRef]
- Steeman, M.; Himpe, E.; Vanroelen, M.; Roeck, M. Environmental impact of timber frame walls. IOP Conf. Ser. Earth Environ. Sci. 2019, 323, 012141. [Google Scholar] [CrossRef]
- Hens, L.; Hugo, S. Timber-Framed Construction. In Performance Based Building Design 2: From Timber-Framed Construction to Partition Walls; Ernst & Sohn: Berlin, Germany, 2012; Volume 1, pp. 7–30. [Google Scholar]
- Rasmussen, T. Prediction of Density for Prevention of Settling of Hygroscopic and Nonhygroscopic Loose-fill Insulation in Walls. J. Build. Phys. 2005, 28, 245–267. [Google Scholar] [CrossRef]
- Bomberg, M. Blown Mineral Fiber Insulation; Special Publication NRC Canada: Ottawa, ON, Canada, 1980. [Google Scholar]
- Isover Insulfit. Available online: https://www.isover.sk/produkty/isover-insulfit (accessed on 28 December 2015).
- Nicolajsen, A. Thermal transmittance of a cellulose loose-fill insulation material. Build. Environ. 2005, 40, 907–914. [Google Scholar] [CrossRef]
- Kosiński, P.; Brzyski, P.; Duliasz, B. Moisture and wetting properties of thermal insulation materials based on hemp fiber, cellulose and mineral wool in a loose state. J. Nat. Fib. 2020, 17, 199–213. [Google Scholar] [CrossRef]
- Niziurska, M.; Wieczorek, M.; Borkowicz, K. Fire Safety of External Thermal Insulation Systems (ETICS) in the Aspect of Sustainable Use of Natural Resources. Sustainability 2022, 14, 1224. [Google Scholar] [CrossRef]
- Iringová, A. Design of envelopes for timber buildings in terms of sustainable development in the low-energy construction. IOP Conf. Ser. Mater. Sci. Eng. 2018, 415, 012010. [Google Scholar] [CrossRef]
- Michalak, J.; Czernik, S.; Marcinek, M.; Michałowski, B. Environmental burdens of External Thermal Insulation Systems. Expanded Polystyrene vs. Mineral Wool: Case Study from Poland. Sustainability 2020, 12, 4532. [Google Scholar] [CrossRef]
- Michálková, D.; Ďurica, P. Experimental Verification of Thermal Insulation in Timber Framed Walls. Materials 2022, 15, 2040. [Google Scholar] [CrossRef] [PubMed]
- Vasileva, I.L.; Nemova, D.V.; Vatin, N.I.; Fediuk, R.S.; Karelina, M.I. Climate-Adaptive Façades with an Air Chamber. Buildings 2022, 12, 366. [Google Scholar] [CrossRef]
- Ingebretsen, S.B.; Andenæs, E.; Kvande, T. Microclimate of Air Cavities in Ventilated Roof and Façade Systems in Nordic Climates. Buildings 2022, 12, 683. [Google Scholar] [CrossRef]
- Beck, H.E.; Zimmermann, N.E.; McVicar, T.R.; Vergopolan, N.; Berg, A.; Wood, E.F. Present and future Köppen-Geiger climate classification maps at 1-km resolution. Sci. Data 2018, 5, 180214. [Google Scholar] [CrossRef] [PubMed]
- STN EN ISO 6946; Building Components and Building Elements. Thermal Resistance and Thermal Transmittance. Calculation Methods (In Slovak Original). Slovak Office of Standards, Metrology, and Testing: Bratislava, Slovakia, 2001.
- Decree No. 364/2012 Coll; Decree of the Ministry of Transport, Construction and Regional Development of the Slovak Republic implementing Act No. 555/2005 Coll. on the Energy Performance of Buildings and on Amendments and Additions to Certain Acts, as amended (in Slovak Original). Slovak Ministry of Justice: Bratislava, Slovakia, 2012.
- STN EN 73 0540-2+Z1+Z2; Thermal Protection of Buildings. Thermal Performance of Buildings and Components. Part 2: Functional Requirements (In Slovak Original). Slovak Office of Standards, Metrology, and Testing: Bratislava, Slovakia, 2019.
- Gas Prices from the Slovak Gas Industry. Available online: https://www.spp.sk/domacnosti/plyn/tarify-a-cenniky-plynu/ (accessed on 15 April 2013).
- Price List for Electricity Supply to Households from Central Slovak Power Plants. Available online: https://www.sse.sk/domacnosti/elektrina/sadzby?page_id=5521 (accessed on 1 January 2023).
- Slee, B.; Hyde, R. Using Thermal Mass in Timber-framed Buildings: Effective use of thermal mass for increased comfort and energy efficiency. Wood Solut. 2015. Available online: https://www.researchgate.net/publication/281348414_Using_Thermal_Mass_in_Timber-framed_Buildings_Effective_use_of_thermal_mass_for_increased_comfort_and_energy_efficiency (accessed on 7 March 2023).
- Rasmussen, T. Modelling Settling of Loose-Fill Insulation in Walls. Part I. J. Build. Phys. 2001, 25, 129–141. [Google Scholar] [CrossRef]
- Yarbrough, D.; Wright, J.H.; McElroy, D.L.; Scanlan, T.F. Settling of loose-fill insulations due to vibration. In Thermal Insulation, Materials, and Systems for Energy Conservation in the ’80s; American Society for Testing: Conshohocken, PA, USA, 1983. [Google Scholar]
- Svennerstedt, B. A Model for the Settling of Attic Loose-Fill Insulations. In Proceedings of the Insulation Materials: Testing and Applications, Quebec City, QC, Canada, 15–17 May 1997; Volume 3, pp. 259–269. [Google Scholar]
Disclaimer/Publisher’s Note: The statements, opinions and data contained in all publications are solely those of the individual author(s) and contributor(s) and not of MDPI and/or the editor(s). MDPI and/or the editor(s) disclaim responsibility for any injury to people or property resulting from any ideas, methods, instructions or products referred to in the content. |
© 2023 by the authors. Licensee MDPI, Basel, Switzerland. This article is an open access article distributed under the terms and conditions of the Creative Commons Attribution (CC BY) license (https://creativecommons.org/licenses/by/4.0/).