Article

Enhanced Ductility and Toughness of Desert Sand Engineered Cementitious Composites

1
School of Civil and Hydraulic Engineering, Ningxia University, Yinchuan 750021, China
2
School of Civil Engineering, Xi’an University of Architecture and Technology, Xi’an 710055, China
3
Department of Civil Engineering, College of Engineering, Universiti Malaysia Pahang, Gambang 26300, Pahang, Malaysia
*
Author to whom correspondence should be addressed.
Buildings 2023, 13(6), 1538; https://doi.org/10.3390/buildings13061538
Submission received: 20 May 2023 / Revised: 8 June 2023 / Accepted: 13 June 2023 / Published: 16 June 2023
(This article belongs to the Section Building Materials, and Repair & Renovation)

Abstract

:
Economical desert sand engineered cementitious composites (DS-ECCs) using a mixture of cement, fly ash, local desert sand, water, low-cost PVA fibers, and chemical additives were developed, aiming for a further enhancement in ductility and toughness. The mechanical behavior of DS-ECCs for two sand samples (from Mu Us and Tengger deserts, China) was determined using uniaxial tension/compression tests and three-/four-point bending tests. The results showed that desert sand-based ECCs with the designed mix ratios had better mechanical properties than the river sand-based ones. Compared with the river sand-based ECCs at 28 and 56 day, the DS-ECCs presented superior ultimate tensile and comparable compression strengths. The excellent ductility was characterized by ultimate tensile and compression strains of 3–7% and over 1%, respectively. Meanwhile, the DS-ECCs showed improved flexural properties with outstanding fracture and bending strengths (4–9 kN and 21–30 kN) and toughness. The findings of this study will further strengthen the mechanical performance of DS-ECCs and broaden their engineering applicability.

1. Introduction

Engineered cementitious composite (ECC) is a type of ultra-high ductile fiber-reinforced cementitious composite, which is designed by considering the interface properties between fiber and other matrices and the fracture mechanics theory. ECC is mainly composed of cement, high-volume fly ash, fine quartz sand, superplasticizer, and polymeric fiber, with a volume fraction of no more than 2.5%. Meanwhile, micromechanics plays an important role in tailoring and optimizing its constituent ingredients and material properties [1,2]. Initially, it was developed for the high-volume, low-cost building industry [3], characterized by some excellent mechanical properties, such as ultra-high tensile (compression) ductility [4,5], fracture toughness [6], shearing resistance and energy dissipation performance. The ultimate tensile and compression strains of ECC can reach 3% and 1%, respectively. In recent years, ECC is no longer exclusive to academic research laboratories and has undergone both material development as well as structural applications [3]. Strengthening and toughening structures subjected to severe mechanical or harsh environmental loading are the intended applications of ECC due to the above mentioned high performance. Investigations on concrete and reinforced masonry structures retrofitted and enhanced by ECC exhibited improved structural performance, especially in terms of flexural (shearing) resistance and seismic resistance [7,8,9].
Usually, aggregates play an essential role in enhancing ECC properties. Sand as an economical filler not only has a significant impact on strength and ductility but also saves costs. Considering the exorbitant cost of fine quartz sand, there is an urgent need to find appropriate substitutes for fine aggregates for developing economical and high-performance ECCs. Currently, huge quantities of desert sands have drawn our attention and are considered the most potential and important source of fine aggregates in preparing ECCs due to their fine particle size distribution and abundant reserves [10,11]. The use of desert sand is also beneficial for protecting the environment and alleviating river sand scarcity. Too much attention has been paid to research on desert sand mortar (DSM) or desert sand concrete (DSC), which is mainly made by replacing part of fine aggregates with desert sands [11,12,13,14,15,16]. Liu et al. [11] found that DSC that was made using a desert sand replacement ratio of 20% had the optimal workability and compression strengths, while excessive desert sand could absorb more water and then reduce the matrix fluidity. Luo et al. [13] revealed that desert sand with a fine particle size under 175 μm could modify the mechanical properties of DSC through propelling the heterogeneous nucleation effect and improving the hydration process of the cementitious matrix. Liu et al. [14,15] indicated that DSC that was characterized by a desert sand replacement ratio of 40% possessed excellent compression strengths and dynamic mechanical behaviors despite suffering from a high temperature environment. In addition, Kaufmann et al. [16] prepared DSC with acceptable performance using a combination of desert sand and other well-graded aggregates. Notably, the low-level utilization rate of desert sand in DSM and DSC is still observed because of the inappropriate particle size distribution of desert sand.
Producing desert sand engineered cementitious composites (DS-ECCs) is an effective measure to increase the utilization rate of desert sand, which has the same particle size distribution as fine silica sand in ordinary ECCs. For example, Khan [17] and Meng [18] produced DS-ECCs with tensile strains of about 2–4% using desert sand from Arabian or Australia (average particle size about 200–300 μm). Che et al. [19,20,21,22] also prepared DS-ECCs with desert sand from Ningxia, which exhibited good workability, ductility, and durability. Meanwhile, the tension and compression strains were about 3% and 1%, respectively. However, only limited works referred to the tensile and compression performance of DS-ECCs, and humble ductility and toughness were still observed in previous studies. It is necessary to enhance the ductility and toughness of DS-ECCs further and synthetically evaluate their fracture and bending behaviors. Like conventional ECCs [23], low-cost domestic PVA fibers could be introduced to produce economical DS-ECCs with no apparent sacrifice of material performances.
Another concern is the effect of desert sand on the hydration process of cementitious materials. As mentioned above, existing studies only revealed the influence of desert sand on the macroscopic mechanical behavior of DSCs or DSECCs, while their micromechanics was under limited consideration. Related research has concluded that the time-dependent dissolution of cement grains can substantially affect the hydration process and the viscoelasticity (viscoplasticity) mechanism of cement paste [24]. Meanwhile, microsilica additives also have an active impact on the hardening process and microstructure evolution of cementitious materials [25]. Desert sand behaves differently from ordinary river sand because of its unique apparent morphology and particle size distribution. It has similar properties to cementitious materials or microsilica, which possibly affects the hydration process of DS-ECC and leads to unpredictable mechanical behavior. All the above concerns require further validation due to limited available study, which will provide a valuable reference for the future design and application of DS-ECCs.
This work aimed to prepare economical DS-ECCs with excellent ductility and toughness based on desert sand (from Mu Us or Tengger desert of Ningxia, China) and low-cost PVA fibers. Two types of DS-ECCs were investigated to reveal the validity of the research results. To further evaluate the mechanical properties of DS-ECCs at 28 and 56 days, a series of experimental tests were carried out, including uniaxial tensile (compression tests) and three (four)-point bending tests. Furthermore, a comparison of the mechanical properties of the designed DS-ECCs, river sand ECC, and cementitious matrix with the desert sand, was conducted to demonstrate the improved mechanical performance of the designed DS-ECCs in this study. The flow chart for this research is plotted in Figure 1.

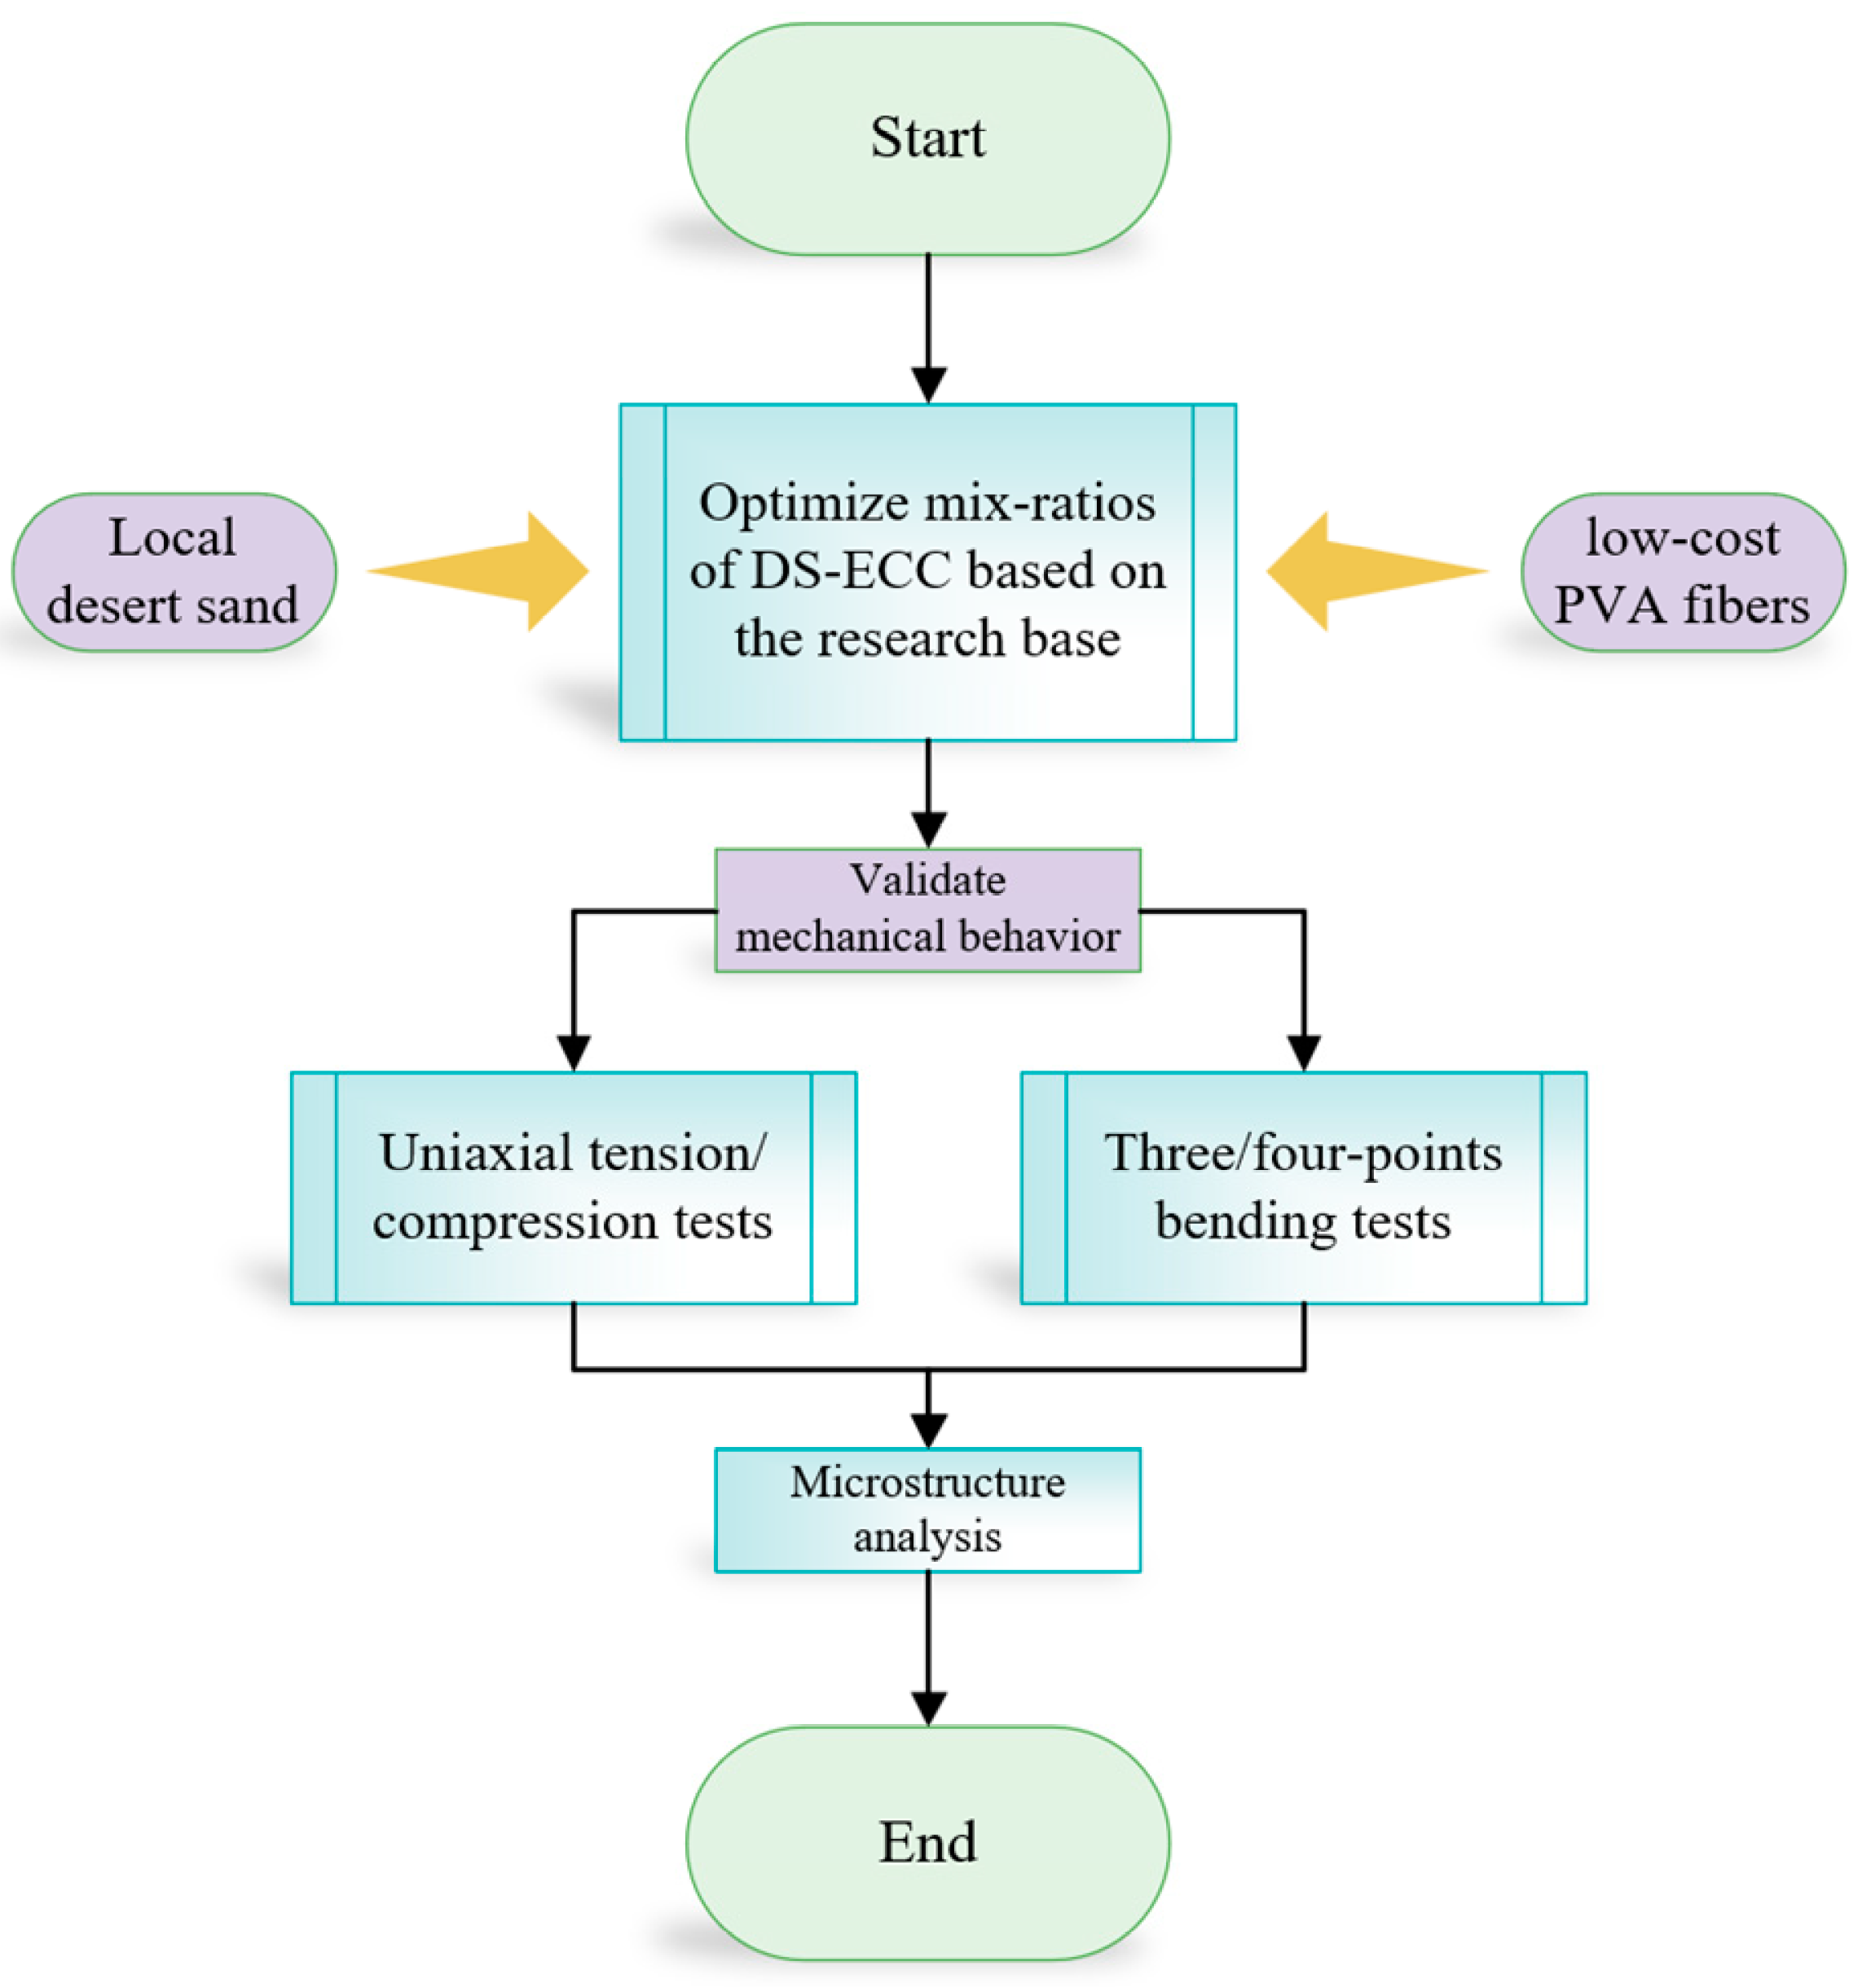
2. Experimental Program

2.1. Materials

The primary materials used in this study included ordinary Portland cement (P.O 42.5 R), fly ash (F.A., Class I), washed and sieved river sand (R.S.), Mu Us desert sand (Mu Us), Tengger desert sand (Tengger), polyvinyl alcohol (PVA) fiber, superplasticizer (S.P.), and water (W). The source of cementitious materials and fine aggregates was Ningxia. The chemical compositions and particle size distribution of the raw materials are shown in Table 1 and Figure 2, respectively. The physical properties of PVA fibers from Fujian province are listed in Table 2.
River sand has the characteristics of dust-color appearance, an apparent density of 2700 kg/m³, a bulk density of 1640 kg/m³, and a maximum particle size of 1180 μm. Mu Us desert sand has a reddish-brown appearance, an apparent density of 2646 kg/m³, a bulk density of 1580 kg/m³, a fineness modulus of 0.72, and a maximum particle size of 546 μm. Tengger desert sand has a tawny appearance, with an apparent density of 2646 kg/m³, a bulk density of 1580 kg/m³, a fineness modulus of 0.30, and a maximum particle size of 376 μm. The particle size distribution of different sands is illustrated in Figure 2.

2.2. Mixing and Curing Procedure

The mix ratio of the DS-ECCs was determined and optimized according to the method proposed by Yu et al. [26]. The key parameters were changed to obtain different performance goals. The mixture proportions for all specimens are presented in Table 3, including the primary groups (M1, M2, and M3 for Mu Us DS-ECC and T4 for Tengger DS-ECC) and control groups (M5 for ordinary matrix and R6 for river sand ECC). Two curing ages (28 d and 56 d) were selected.
The casting processes of the specimens were as follows: Firstly, a Hobart HL30 mixer was used to mix the cementitious materials and fine sands (2–3 min). Next, half of the S.P. was added into the mixture to improve fluidity (3–5 min). Eventually, pre-dispersed fibers were added to the mixture, followed by residual S.P. A complete mixing process was achieved when evenly dispersed fibers were observed. The specimens were cast in prefabricated steel molds and formed at room temperature (after 24 h). All specimens were cured for up to 7, 28, and 56 days in a fog room at a temperature of 20 ± 2 °C and a relative humidity of 95%.

2.3. Specimens and Test Procedures

2.3.1. Uniaxial Tensile/Compression Test

The uniaxial tensile test of the designed DS-ECCs was determined according to JSCE [27], with a dumbbell specimen size of 330 mm × 60 mm × 13 mm (cross section: 30 mm × 13 mm). The uniaxial compression test of the DS-ECCs was performed in accordance with ASTM C39 [28], with a cylindrical specimen size of Φ75 mm × 150 mm. Six uniaxial tensile specimens and three uniaxial compression specimens were investigated per mix ratio at each curing age. The test results were averaged from the designed specimens, among which the discrete and error data were excluded.
A 30 kN servo-hydraulic SHT4106 testing system was used for the uniaxial tensile and compression tests of the DS-ECCs. Regarding the uniaxial tensile tests, dumbbell specimens were fixed in wedge-shaped splints with geometric alignment. A constant rate of 0.5 mm/min was applied for two tests. The tensile loads were obtained from SHT4106’s load sensors. The tensile strains were measured using two external electronic extensometers attached to the middle part of the specimens over a gauge length of 80 mm.
Regarding the uniaxial compression tests, cylinder specimens were placed on the compression plates with geometric alignment. The load collection system was similar to that of uniaxial tensile tests. Two linear variable displacement transducers (LVDT) were attached to the symmetrical side of the specimens, while a static strain collecting system, DH3820, was used to measure the compression strains. The set-up and schematic diagrams of the uniaxial tensile and compression tests are shown in Figure 3.

2.3.2. Three-/Four-Point Bending Tests

Three (four)-point bending tests were carried out using a 10 kN servo-hydraulic SHT4106 testing machine. Prisms with the size of 100 mm × 100 mm × 400 mm and a span of 300 mm are suitable for three-/four-point bending tests. The specimens for the four-point bending tests were unbroken, but the three-point bending tests were notched with notch width and depth of 3–4 mm and 40 mm, respectively. It should be noted that pre-placed plastic pieces made the notch. At each curing age (28 d and 56 d), three complete and three notched prisms were used per mix ratio. The results were averaged from the investigated prisms, similar to the uniaxial tests.
The loading rate of the three (four)-point bending tests was similar to that of the uniaxial tests, with a displacement-controlled rate of 0.5 mm/min. In this work, the testing procedure was divided into two stages, which included pre-loading and formal loading. Firstly, pre-loading was conducted twice, up to 0.2 kN, to ensure complete contact between the loading rollers and specimens. Then, standard loading was performed, in which the loading rate was 0.2 mm/min until the load was 50% of the post-peak ultimate bending load. The tests were completed when a constant load of 1 kN with an increasing deflection was recorded.
The bending loads for the three (four)-point bending tests were recorded using SHT4106’s load sensors. The crack mouth opening displacement (CMOD) was measured using an external electronic extensometer attached to the notch bottom with a gauge length of 2 mm. The deflection of the prismatic specimens was recorded using an LVDT attached to the mid-span. Strain gauges and DH3820 were used to record the initial cracking load. The schematic diagrams of the three-/four-point bending tests are shown in Figure 4.

2.3.3. Workability Test

The fluidity tests assessed the workability of the DS-ECCs according to GB/T50080. The average flow diameter in the vertical directions was the primary evaluation index.

3. Results and Discussion

3.1. Workability

This work considers a flow diameter from 50 mm to 70 mm as ideal liquidity. The test results are listed in Table 3. The results show that desert sand has a strong adsorption effect on water due to a large surface area, which results in less fluidity. Thus, all DS-ECCs have a significant demand for S.P. However, the DS-ECCs present good workability caused by the rational slurry coating thickness of desert sand and fibers.

3.2. Mechanical Properties of DS-ECCs

The mechanical properties of the DS-ECCs, river sand ECC, and ordinary matrix at different curing ages were compared. The details are presented below.

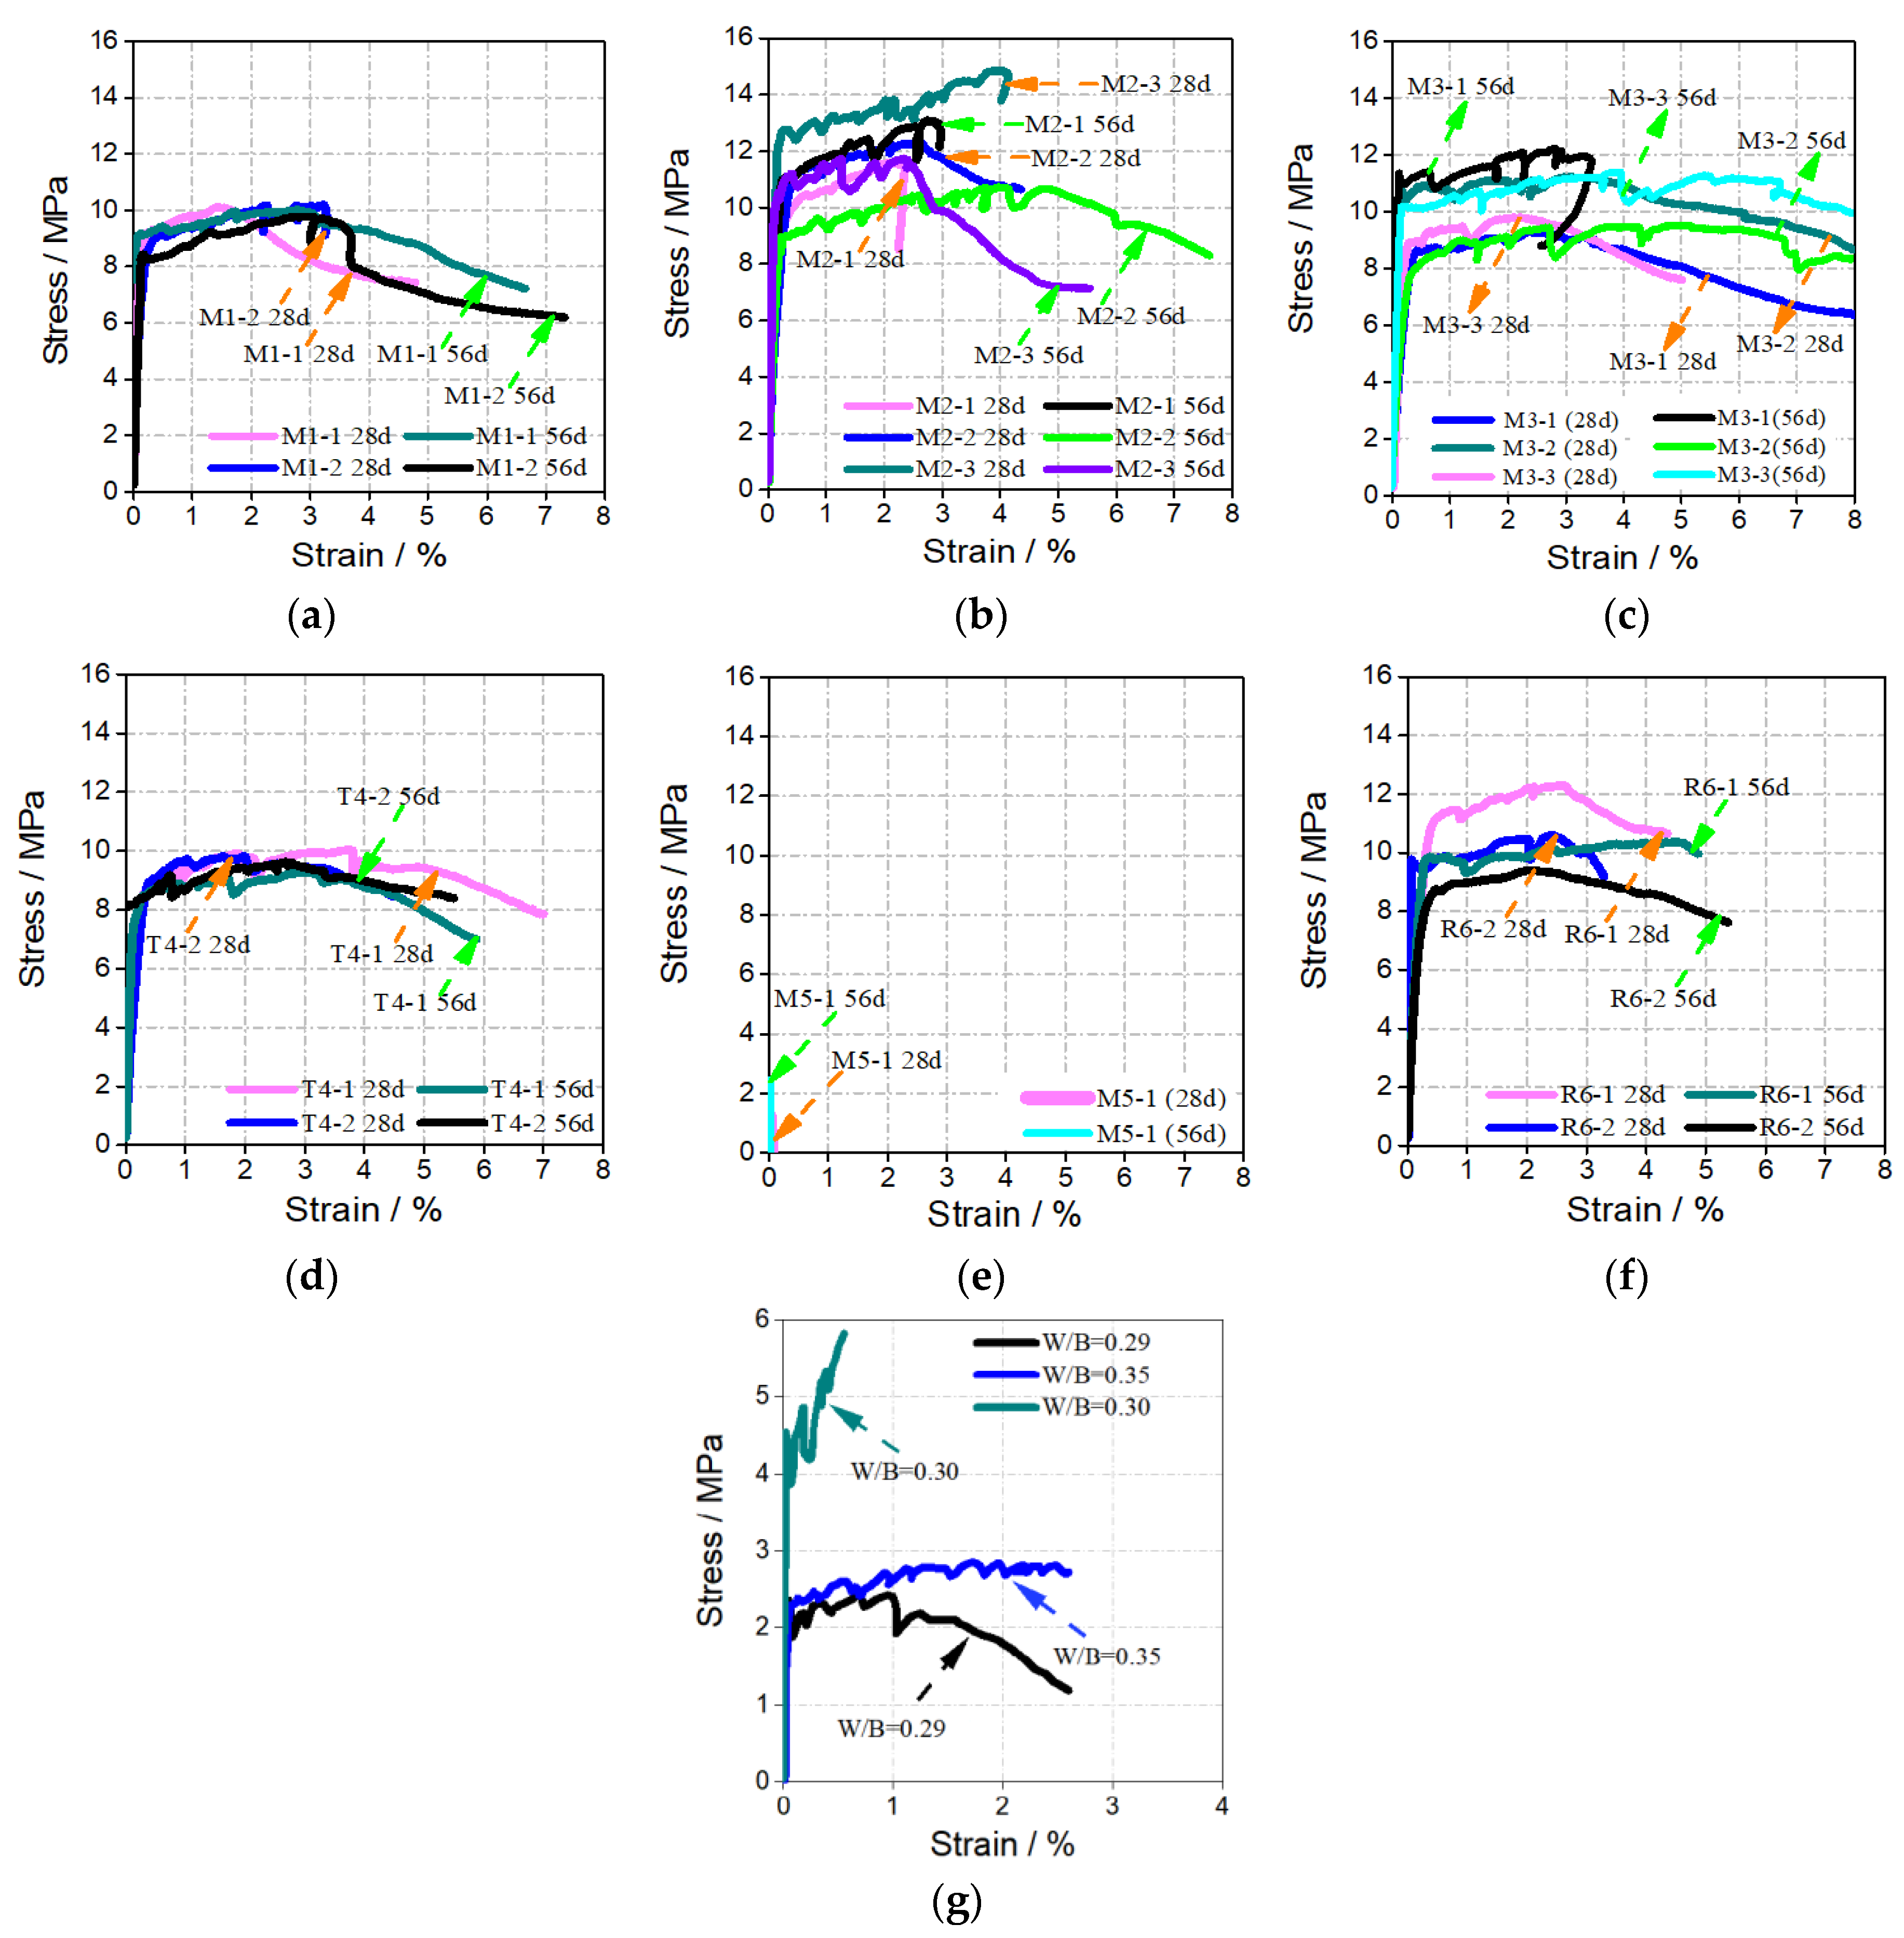
3.2.1. Uniaxial Tensile Properties

The uniaxial tensile stress–strain curves of different specimens at the age of 28 d and 56 d are shown in Figure 5, referring to the Mu Us DS-ECCs (Figure 5a–c), Tengger DS-ECC (Figure 5d), river sand ECC (Figure 5f), ordinary matrix (Figure 5e), and comparison results (Figure 5g) in the literature [17,18]. All DS-ECCs at 28 d and 56 d exhibit superior tensile properties with apparent strain hardening, outperforming the river sand ECC (degraded tensile ductility) and ordinary matrix (brittleness). The test results about the ultimate tensile strength (strain) and the tensile fracture energy are presented in Table 4. The tensile fracture energy was calculated based on the recommendation by Deng et al. [29], while the parameters were adjusted considering the characteristics of the actual tensile stress–strain curves.
As illustrated in Table 4, the DS-ECCs have comparable tensile strengths to river sand ECC but superior tensile ductility. At the age of 28 d, the ultimate tensile strengths, strains, and tensile fracture energy of the Mu Us (Tengger) DS-ECCs are about 10–14 MPa, 3–4%, and 22–24 N/mm, respectively, while those of the river sand ECC are approximately 12.27 MPa, 2.64%, and 12.66 N/mm, respectively. With increasing curing ages (56 d), all DS-ECCs experience a negligible change in ultimate tensile strengths but still have excellent ductility, leading to enhanced tensile fracture energy. In particular, the Mu Us DS-ECCs have an ultimate tensile strain of over 4.82%, which exceeds that of the river sand ECC. A possible enhancing mechanism is the volcanic ash effect of desert sand in the hydration process. Ultra-fine desert sand with active SiO2 will increasingly react with Ca(OH)2 and accelerate the hydration process with increased curing ages [30,31,32]. Furthermore, the improved tensile fracture energy of the river sand ECC at 56 d is observed due to enhanced tensile strengths. Due to fibers’ strengthening and toughening effect, all DS-ECCs show extraordinary tensile properties far from the ordinary matrix. High-strength and high-ductility DS-ECCs could also be obtained by changing W/B or the volume of F.A. When W/B is reduced to 0.29, the ultimate tensile strength, strain, and tensile fracture energy of the DS-ECCs are about 10.18 MPa, 3.23%, and 16.76 N/mm, respectively. When the volume of F.A. changes from 50% to 70%, the DS-ECCs exhibit ultra-high tensile ductility while maintaining satisfied tensile strengths (12.17 MPa). This can be explained by the reduced fracture toughness of DS-ECC’s matrix caused by the unique appearance (cenospheres) and filling effect of fine F.A. [33].
It should be noted that, under similar mix ratios, all DS-ECCs investigated in this study exhibit superior uniaxial tensile strength and ductility, outperforming the ones in previous research [17,18]. As shown in Figure 5g, the ultimate tensile strength and strain of the control groups are approximately 0.5–2.7 MPa and 0.5–2.5%, and increasing the W/B ratio has a limited impact on further enhancing their tensile properties. In particular, some DS-ECCs in the literature [18] perform significantly worse than the ordinary ECC, with the ultimate tensile strength and strain of 0.56 MPa and 0.58%, indicating that the fiber-bridging effect is not thoroughly utilized. This observation could be related to the various qualities of desert sands from different regions and the unsuitable mix ratios of DS-ECCs. Based on the above findings, this study achieves the goal of further enhancing the ductility and toughness of DS-ECCs at a low cost.
The unique particle gradation and appearance of desert sand play an important role in improving the tensile properties of DS-ECCs. Usually, aggregates with a smaller particle size distribution easily match the cementitious matrix and build the fiber-bridging effect, leading to DS-ECCs’ enhanced ductility and toughness. Increasing the particle size of aggregates will result in fiber agglomeration, weaken the fiber-bridging effect, and decrease the fracture toughness of DS-ECCs [21,34]. Desert sand with a high volume of ultra-fine particles has great potential to improve the compactness of the cementitious matrix and the interface transition zone (ITZ) between fibers and the cementitious matrix, thus facilitating the fiber distribution, slippage, and bridging effect [21]. Besides, desert sand, as aeolian sand, has more smooth and larger surface, which could provide more nucleation spots to accelerate the hydration process [13]. All the above reasons lead to the improved fiber-bridging ability of the matrix and enhance the tensile strain-hardening properties of DS-ECCs.

3.2.2. Uniaxial Compression Properties

The compression toughness of the DS-ECCs was evaluated according to Deng et al. [35]. The equivalent compression strength and equivalent compression toughness index were calculated, and the size effect of cylinders was considered. The equations are shown in Equations (1) and (2):
f e - u = F A = Ω u δ u A
W u = f e × δ u h ' = Ω u A h '
In the above equations, Ω u denotes the integral area corresponding to the post-peak of 0.85   f u , 0.5   f u (note: f u is the ultimate compression) according to the compression load–deformation curves, respectively. F , A , h ' denote the ultimate compression strength, the cross-sectional area, and the height of cylinders, respectively. f e u denotes the equivalent compression strength corresponding to 0.85   f u , 0.5   f u . δ u / h indicates the deformation rate, referring to the effect of deformation on the compression toughness of the DS-ECCs. W u means an equal compression toughness index.
The uniaxial compression stress–strain curves of the different specimens are shown in Figure 6. The test results on ultimate compression strengths, strains, and compression toughness indexes ( f e u and W u ) are outlined in Table 4. Only f e 0 . 5 and W u = 0 . 5 were taken to assess the compression deformation properties of the different specimens, considering the similar change trend of other toughness indexes.
As clearly shown, the Mu Us and Tengger DS-ECCs at 28 d have comparable ultimate compression strains (about 1%) to the river sand ECC but decreased ultimate compression strengths (34.31 MPa). The Tengger DS-ECC at 28 d exhibits the optimal compression ductility, with a maximum compression strain of 1.74% and an equivalent compression toughness index W u = 0 . 5 of 0.046, followed by the Mu Us DS-ECCs ( W u = 0 . 5 of 0.022) and the river sand ECC ( W u = 0 . 5 of 0.028). A nearly negligible compression performance ( W u = 0 . 5 of 0.001) for the ordinary matrix is revealed due to the apparent failure form of the brittle split. Increasing curing ages leads to enhanced compression strengths while slightly reduces compression ductility for all DS-ECCs. Meanwhile, the Tengger DS-ECC still has ultra-high compression ductility with an ultimate compression strain of 1.68%. The DS-ECCs with W/B of 0.29 show high strength and high ductility, and those equipped with F.A. of 70% present ultra-high compression ductility W u = 0 . 5 of 0.031.
The reason for the slightly degenerated compression strength of the DS-ECCs is that both Mu Us and Tengger desert sands have a lower CaO/SiO2 ratio than river sand. This has also been verified in previous research [33]. However, the refining effect of desert sand significantly improves the compactness of the DS-ECCs, which is beneficial to build the fiber-bridging effect and compensate for the negative influence of CaO/SiO2. Thus, an exemplary compression behavior of all DS-ECCs is still observed.

3.2.3. Fracture Properties under the Three-Point Bending Test

The load–CMOD curves of different specimens under the three-point bending test are presented in Figure 7. The ultimate fracture strength, the ultimate CMOD, and the two fracture parameters, K IC ini and K IC un , were still used to evaluate the fracture properties of the DS-ECCs because the main crack caused the final fracture besides the notch. The unstable critical fracture toughness K IC un was calculated according to the stress intensity factor for a post-peak ultimate fracture load of 95%, considering the apparent strain-hardening platform of the load–CMOD curves of DS-ECCs [36]. The equations for calculating K IC ini and K IC un are shown in Equations (3)–(6):
K IC ini   /   un = 1.5 × ( F ini / 0.95 F cri ) + m g 2 × 10 2 ) × 10 3 S a ini   /   cri t h 2 f 1 / 2 ( α )
a ini   /   cri = π 2 ( h + h 0 ) arctan E t C M O D ini   /   cri 32.6 F ini   /   max 0.1135 h 0
f 1 / 2 ( α ) = 1.99 α × ( 1 α ) × ( 2.15 3.99 α + 2.7 α 2 ) ( 1 + 2 α ) × ( 1 α ) 3 2     ,       α = a ini   /   cri + h 0 h + h 0
E = k 0 t [ 3.70 + 32.60 tan 2 ( π 2 a 0 + h 0 h + h 0 ) ]
In the above equations, k 0 denotes the rising slope of the load–CMOD curves. t , h denote the width and the height of the notched prismatic specimens, respectively. h 0 denotes the knife-edged width of the extensometer, with h 0   = 0 . 002   m . a 0 denotes the notch depth, with a 0 = 0.04   m . a ini , a cri (m) denote the initial cracking length and the critical cracking length, respectively. C M O D ini , C M O D cri (m) denote the crack mouth opening displacement (CMOD, m) corresponding to the initial cracking load and the post-peak 0.95 F max (note: F max is the ultimate fracture load). S is the span between two supports, with S = 0.3   m . α (m) denotes the relatively effective elastic crack length, where α = ( a + h 0 ) / ( h + h 0 ) . f ( α ) denotes the geometric impact factor. E (GPa) denotes the elastic modulus. F ini , F cri (kN) denote the cracking load and the unstable critical load, respectively. K IC ini , K IC un (MPa·m(1/2)) denote the initial fracture toughness and the unstable fracture toughness, respectively.
The fracture properties of the different specimens under the three-point bending test are presented in Table 5. The results show that all DS-ECCs at 28 d exhibit superior fracture properties, outperforming the river sand ECC and ordinary matrix (brittle fracture). The ultimate fracture loads of the Mu Us DS-ECCs (5.57 kN) are higher than that of the Tengger DS-ECC (4.37 kN), while the latter has an ultra-high fracture ductility with an ultimate fracture deflection of 3.03 mm, a C M O D ini of 0.22 mm, and a C M O D max 3.95 mm. The fracture ductility of the Tengger DS-ECC is about two times higher than that of the Mu Us DS-ECCs and exceeds that of the river sand ECC even further. However, the DS-ECCs have a slightly lower ultimate fracture load than the river sand ECC.
Moreover, the K IC ini and K IC un for the Mu Us DS-ECCs are about 0.63 and 3.87, respectively, and the values for the Tengger DS-ECC are about 0.74 and 3.8, respectively. Possible mechanisms involved in the improved fracture toughness of the DS-ECCs are related to the round appearance of wind-erosion desert sand and its fine particle distribution [21,22]. Usually, the fracture risk of a matrix increases with a larger aggregate size. In this study, the maximum particle size of river sand is 1180 μm, which is approximately 2–3 higher than that of desert sand (315 μm), thus resulting in the slightly degraded fracture ductility and toughness of the river sand ECC.
Enhanced ultimate fracture load but decreased fracture ductility for different specimens at 56 d (except for the Mu Us DS-ECCs) are observed, which leads to reduced fracture toughness indexes. When the W/B changes from 0.35 to 0.29, a minor change in K IC un is observed. When F.A. varies from 50% to 70%, modest fracture strengths but dramatically improved fracture ductility of the DS-ECCs are observed.

3.2.4. Bending Properties under the Four-Point Bending Test

The bending load–deflection curves of the different specimens under the four-point bending tests are plotted in Figure 8. Both Mu Us DS-ECCs and Tengger DS-ECC exhibit a better bending ductility and toughness with a prominent displacement-hardening platform in the load–deflection curves, which values are superior to the river sand ECC (degraded bending ductility) and the ordinary matrix (brittleness). The ultimate bending strengths, the mid-span deflection, and the bending toughness indexes evaluated based on the ASTM [37] serve as the leading indicators to assess the bending properties of the composites. The results are summarized in Table 6. Regarding the ASTM C1018, the bending toughness index I n and the residual strength R are considered. The calculation methods are shown in Equations (7) and (8):
I n   / ( n = 5 ,   9 ,   19 ,   29 ,   39 ,   ) = A n δ 0 ( n = 3 , 5 , 10 , 15 , 20 ) A δ 0 ,     I 2 u 1 = A δ u A δ 0
R m , n = 100 m - n ( I m I n )
In the above equations, A n δ 0 ( n = 1 , 3 , 5 , 10 , 15 , 20 ) and A δ u denote the critical areas corresponding to the deflection of n δ 0 ( n = 1 , 3 , 5 , 10 , 15 , 20 ) and δ u in the load–deflection curves. I n , R m , n denote the bending toughness index and the residual strength index (note: R = 100 refers to ideal elastoplastic materials), respectively.
The Mu Us DS-ECCs show ultra-high bending toughness indexes I 5 , I 9 , and I 2 u 1 of 5.87, 12.0, and 15.8, respectively. It is noted that all above I x are over x ( I x > x ), which meets the requirement of ultra-high ductility. Similarly, the Tengger DS-ECC possesses desirable bending toughness with excellent toughness indexes I x , outperforming the Mu Us DS-ECCs and others. The river sand ECC has improved bending strengths but slightly poor ductility, leading to four-level bending toughness indexes I 2 u 1 of 9.96, 21.16, 53.92, and 75.36, respectively. The different levels of R m , n of all the DS-ECCs are over 100, thus meeting the definition of high toughness. Degenerated I x and R m , n with different degrees are observed for all composites as the curing age increases, which agrees with the changing trend of bending strength and ductility. Reducing W/B weakens the I x of DS-ECC, while enhancing the volume of FA Strengthens its I x with an ultra-high ductility.

3.2.5. Failure Forms of DS-ECCs

The DS-ECCs exhibit the characteristic of ductile failures, such as fine multi-cracks under the uniaxial tensile test (see Figure 9a) and the four-point bending test (see Figure 9c, in the pure-bending part) and olive-shaped multi-cracks under the three-point bending test (see Figure 9b, near the notch). The destruction of the DS-ECCs differs from that of the river sand ECC, which shows only the main crack. For some DS-ECCs, the multi-crack distribution within the gauge is inconsistent (less saturated and parallel fine cracks), demonstrating an inadequate bridging effect of fibers.

4. Conclusions

This study investigated the potential use of local desert sand (Mu Us or Tengger) as acceptable aggregate substitutes for producing DS-ECCs with enhanced ductility and toughness. Experiments at the curing ages of 28 d and 56 d, referring to using uniaxial tests and bending tests, were conducted to reveal the mechanical properties of the designed DS-ECCs and to further evaluate their ductility and toughness. Furthermore, the performance differences and the applicability of the DS-ECCs were illustrated based on a comparison with river sand ECC and cementitious matrix with the desert sand. Based on the obtained results, the following conclusions can be drawn:
(1)
Desert sands, as the favorable aggregate substitutes, satisfy the ingredient selection for ECCs due to their ultra-fine particle distribution, which can refine the microstructures of cement matrices containing different desert sands, affect the fiber-bridging capability for enhancing the matrices, and then tailor the mechanical behaviors of DS-ECCs. Both Mu Us DS-ECCs and Tengger DS-ECC possess excellent strength, ductility, and toughness using a reasonable mix ratio.
(2)
At the curing ages of 28 d and 56 d, all designed DS-ECCs exhibit superior mechanical properties compared to river sand-based ECC and DS-ECC with an ordinary matrix. The ultimate tensile strengths and strains of the DS-ECCs are about 10–14 MPa and 3–7%, respectively. The DS-ECCs have an ultimate compression strength of 30–50 MPa, which is comparable to that of the river sand-based ECC, while the former has excellent compression ductility of over 1%. Moreover, the DS-ECCs have desirable ultimate bending (fracture) strengths (4–9 kN and 21–30 kN) and toughness, outperforming the river sand-based ECC.
(3)
The DS-ECCs show apparent ductile damage, followed by fine multi-cracks under uniaxial tensile and pure-bending loads and olive-shaped multi-cracks under fracture loads. They behave differently from the river sand-based ECC, which shows only a main crack under the ultimate loads.

Author Contributions

Conceptualization, Funding Acquisition, Writing—Review and Editing, and Supervision, J.C.; Investigation, Formal Analysis, Visualization, and Writing—Original Draft Preparation, D.W.; Conceptualization, Supervision, and Writing—Review and Editing, H.L.; Conceptualization, Writing—Review and Editing, and Supervision, S.C.C. All authors have read and agreed to the published version of the manuscript.

Funding

This study received financial supports from the National Natural Science Foundation of China (Grant No. 52068060) and the First-class Discipline Construction (Water Conservancy Engineering Discipline) Project of Higher Education Institution in Ningxia China (Grant No. NXYLXK2021A03).

Data Availability Statement

The data presented in this study are available from the corresponding author upon request.

Conflicts of Interest

The authors declare no conflict of interest.

Nomenclature

W/Bwater-to-binder ratioh′height of cylinder
S/Bsand-to-binder ratiohheight of notched prismatic specimen
a ini initial cracking length h 0 knife-edged width of extensometer
a cri critical cracking length I n bending toughness index
a 0 notch depth k 0 rising slope of load–CMOD curves
Across-sectional area of cylinder K IC ini initial fracture toughness
A n δ critical areas corresponding to load–deflection curves K IC cri unstable fracture toughness
CMOD ini initial crack mouth displacement P u maximum bending load
CMOD cri crack mouth displacement for 0.95 F max R m , n residual strength indexes
E elastic modulus of DS-ECC S span of two supports of prismatic specimen
f e - u equivalent compression strengthtnotch-width of prismatic specimen
f u ultimate compression strength W u equivalent compression toughness index
Fultimate compression strength α relatively effective elastic crack length
f ( α ) geometric impact factor σ ut ultimate tensile strength
F max peak fracture load σ uc ultimate compression strength
F u ultimate fracture load ε ut ultimate tensile strain
F ini cracking load of prismatic specimen ε uc ultimate compression strain
F cri unstable critical load of prismatic specimen Ω u integral area corresponding to n fu
G f tensile fracture energy δ u compression deformation

References

  1. Li, V.C. Performance Driven Design of Fiber Reinforced Cementitious Composites. In Proceedings of 4th RILEM International Symposium on Fiber Reinforced Concrete; E&FN Spon: London, UK, 1992; pp. 12–30. ISBN 0419 18130 X. [Google Scholar]
  2. Li, V.C.; Wu, C.; Wang, S.X.; Ogawa, A.; Saito, T. Interface Tailoring for Strain-hardening PVA-ECC. ACI Mater. J. 2002, 99, 463–472. [Google Scholar]
  3. Li, V.C. On Engineered Cementitious Composites (ECC) A Review of the Material and Its Applications. J. Adv. Concr. Technol. 2003, 1, 215–230. [Google Scholar] [CrossRef] [Green Version]
  4. Ranade, R.; Li, V.C.; Stults, M.D.; Heard, W.F.; Rushing, T.S. Composite Properties of High-Strength, High-Ductility Concrete. ACI Mater. J. 2013, 110, 413–422. [Google Scholar]
  5. Ma, H.; Qian, S.Z.; Zhang, Z.G.; Lin, Z.; Li, V.C. Tailoring Engineered Cementitious Composites with local ingredients. Constr. Build. Mater. 2015, 101, 584–595. [Google Scholar] [CrossRef]
  6. Liu, W.; Xu, S.L.; Li, Q.H. Experimental study on fracture performance of ultra-high toughness cementitious composites with J-integral. Eng. Fract. Mech. 2012, 96, 656–666. [Google Scholar] [CrossRef]
  7. Chen, Y.X.; Yu, J.; Leung, C.K.Y. Use of high strength Strain-Hardening Cementitious Composites for flexural repair of concrete structures with significant steel corrosion. Constr. Build. Mater. 2018, 167, 325–337. [Google Scholar] [CrossRef]
  8. Jin, Q.X.; Li, V.C. Development of lightweight engineered cementitious composite for durability enhancement of tall concrete wind towers. Cem. Concr. Compos. 2019, 96, 87–94. [Google Scholar] [CrossRef]
  9. Niasar, A.N.; Alaee, F.J.; Zamani, S.M. Experimental investigation on the performance of unreinforced masonry wall, retrofitted using engineered cementitious composites. Constr. Build. Mater. 2020, 239, 117788. [Google Scholar] [CrossRef]
  10. Zhang, G.X.; Song, J.X.; Yang, J.S.; Liu, X.Y. Performance of mortar and concrete made with a fine aggregate of desert sand. Build. Environ. 2006, 41, 1478–1481. [Google Scholar] [CrossRef]
  11. Liu, Y.H.; Li, Y.Q.; Jiang, G.H. Orthogonal experiment on performance of mortar made with dune sand. Constr. Build. Mater. 2020, 264, 120254. [Google Scholar] [CrossRef]
  12. Abu Seif1, E.S.S.; Sonbul, A.R.; Hakami, B.A.H.; El-Sawy, E.K. Experimental study on the utilization of dune sands as a construction material in the area between Jeddah and Mecca, Western Saudi Arabia. Bull. Eng. Geol. Environ. 2016, 75, 1007–1022. [Google Scholar] [CrossRef]
  13. Luo, F.J.; He, L.; Pan, Z.; Duan, W.H.; Zhao, X.L.; Collins, F. Collins, Effect of very fine particles on Workability and strength of concrete made with dune sand. Constr. Build. Mater. 2013, 47, 131–137. [Google Scholar] [CrossRef]
  14. Liu, H.F.; Ma, J.R.; Wang, Y.Y.; Ning, J.G. Influence of desert sand on the mechanical properties of concrete subjected to impact loading. Acta Mech. Solida Sin. 2017, 30, 583–595. [Google Scholar] [CrossRef]
  15. Zhang, M.H.; Liu, H.F.; Sun, J.X.; Chen, X.L.; Doh, S.I. Dynamic Mechanical Behaviors of Desert Sand Concrete (DSC) after Different Temperatures. Appl. Sci. 2019, 9, 4151. [Google Scholar] [CrossRef] [Green Version]
  16. Kaufmann, J. Evaluation of the combination of desert sand and calcium sulfoaluminate cement for the production of concrete. Constr. Build. Mater. 2020, 243, 118281. [Google Scholar] [CrossRef]
  17. Khan, M.I.; Fares, G.; Mourad, S. Optimized Fresh and Hardened Properties of Strain Hardening Cementitious Composites: Effect of Mineral Admixtures, Cementitious Composition, Size, and Type of Aggregates. J. Mater. Civ. Eng. 2017, 29, 1–16. [Google Scholar] [CrossRef]
  18. Meng, D.; Huang, T.; Zhang, Y.X.; Lee, C.K. Mechanical behaviour of a polyvinyl alcohol fiber reinforced engineered cementitious composite (PVA-ECC) using local ingredients. Constr. Build. Mater. 2017, 141, 259–270. [Google Scholar] [CrossRef]
  19. Che, J.L.; Li, Q.W.; Lee, M.G.; Dan, W. Experimental research on mechanical properties of desert sand steel-PVA fiber engineered cementitious composites. Funct. Mater. 2017, 24, 584–592. [Google Scholar]
  20. Han, G.S.; Che, J.L.; Li, Q.W.; Ma, C.X.; Liu, H.F. Experimental research on mechanical properties of desert sand PVA-ECC materials. Constr. Technol. 2018, 47, 27–31. (In Chinese) [Google Scholar]
  21. Che, J.L.; Wang, D.; Liu, H.F.; Zhang, Y.X. Mechanical Properties of Desert Sand-Based Fiber Reinforced Concrete (DS-FRC). Appl. Sci. 2019, 9, 1857. [Google Scholar] [CrossRef] [Green Version]
  22. An, X.; Che, J.L.; Liu, H.F. Study on freeze-thaw resistance with NaCl of desert sand engineering cement composites. Phys. Chem. Earth Parts A/B/C 2020, 121, 102954. [Google Scholar] [CrossRef]
  23. Kan, L.L.; Zhang, Z.; Zhang, L.; Liu, W.D. Effect of low-cost PVA fibers on the mechanical properties of Engineered Cementitious Composites. Eng. Mech. 2019, 36, 121–129. (In Chinese) [Google Scholar]
  24. Li, X.; Grasley, Z.C.; Garboczi, E.J.; Bullard, J.W. Modeling the apparent and intrinsic viscoelastic relaxation of hydrating cement paste. Cem. Concr. Compos. 2015, 55, 322–330. [Google Scholar] [CrossRef]
  25. Slusarek, J.; Nowoswiat, A.; Olechowska, M. Logistic Model of Phase Transformation of Hardening Concrete. Materials 2022, 15, 4403. [Google Scholar] [CrossRef]
  26. Yu, J.; Lei, S.M.; Liang, X.W.; Liu, X.J.; Li, L. Design method for mixture proportioning of a new hybrid steel fiber self-compacting concrete. J. Build. Mater. 2017, 20, 611–615+629. (In Chinese) [Google Scholar]
  27. JSCE. Recommendations for Design and Construction of High Performance Fiber Reinforced Cement Composites with Multiple Fine Cracks; Japan Society of Civil Engineers: Tokyo, Japan, 2008. [Google Scholar]
  28. ASTM C39; Standard Test Method for Compressive Strength of Cylindrical Concrete Specimens. ASTM: West Conshohocken, PA, USA, 2001.
  29. Deng, Z.C. High-Performance Synthetic Fiber Concrete; Science Press: Beijing, China, 2003; pp. 25–27. (In Chinese) [Google Scholar]
  30. Guettala, S.; Mezghiche, B. Compressive strength and hydration with age of cement pastes containing dune sand powder. Constr. Build. Mater. 2011, 25, 1263–1269. [Google Scholar] [CrossRef]
  31. Alhozaimy, A.; Jaafar, M.S.; Al-Negheimish, A.; Abdullah, A.; Taufiq-Yap, Y.H.; Noorzaei, J.; Alawad, O.A. Properties of high strength concrete using white and dune sands under normal and autoclaved curing. Constr. Build. Mater. 2012, 27, 218–222. [Google Scholar] [CrossRef]
  32. Alawad, O.A.; Alhozaimy, A.; Jaafar, M.S.; Aziz, F.N.A.; Al-Negheimish, A. Effect of Autoclave Curing on the Microstructure of Blended Cement Mixture Incorporating Ground Dune Sand and Ground Granulated Blast Furnace Slag. Int. J. Concr. Struct. Mater. 2015, 9, 381–390. [Google Scholar] [CrossRef] [Green Version]
  33. Ahmed, S.F.U.; Mihashi, H. Strain hardening behavior of lightweight hybrid polyvinyl alcohol (PVA) fiber reinforced cement composites. Mater. Struct. 2010, 44, 1179–1191. [Google Scholar] [CrossRef]
  34. Sahmaran, M.; Yücel, H.E.; Demirhan, S.; Arık, M.T.; Li, V.C. Combined effect of aggregate and mineral admixtures on tensile ductility of engineered cementitious composites. ACI Mater. J. 2012, 109, 627. [Google Scholar]
  35. Deng, M.K.; Han, J.; Liu, H.B.; Qin, M.; Liang, X.W. Analysis of Compressive Toughness and Deformability of High Ductile Fiber Reinforced Concrete. Adv. Mater. Sci. Eng. 2015, 2015, 384902. [Google Scholar] [CrossRef] [Green Version]
  36. Xu, S.L.; Lyu, Y.; Xu, S.J.; Li, Q.H. Enhancing the initial cracking fracture toughness of steel-polyvinyl alcohol hybrid fibers ultra high toughness cementitious composites by incorporating multi-walled carbon nanotubes. Constr. Build. Mater. 2019, 195, 269–282. [Google Scholar] [CrossRef]
  37. ASTM C 1018-98; Standard Test Method for Flexural Toughness and First Crack Strength of Fiber Reinforced Concrete. Book of ASTM Standard, Part 04.02. ASTM: West Conshohocken, PA, USA, 1991; pp. 507–513.
Figure 1. Simplified flow chart for this research.
Buildings 13 01538 g001
Figure 2. Particle size distribution of the raw materials.
Buildings 13 01538 g002
Figure 3. Schematic diagram of uniaxial tests: (a) uniaxial tensile test and (b) uniaxial compression test.
Buildings 13 01538 g003
Figure 4. Set-up and schematic diagrams of bending tests: (a) three-point bending test and (b) four-point bending test.
Buildings 13 01538 g004
Figure 5. Tensile stress–strain curves of different specimens: (a) Mu Us DS-ECC, W/B = 0.29; (b) Mu Us DS-ECC, basic mix ratio; (c) Mu Us DS-ECC, FA = 70%; (d) Tengger DS-ECC, basic mix ratio; (e) Cementitious matrix with the desert sand; (f) river sand ECC; and (g) W/B = 0.29, W/B = 0.35: Khan, et al., 2017 [17], W/B = 0.30: Meng, et al., 2017 [18].
Buildings 13 01538 g005
Figure 6. Stress–strain curves of different specimens under the uniaxial compression test: (a) the effect of W/B and F.A.; (b) performance comparison at 28 d; and (c)performance comparison at 56 d.
Buildings 13 01538 g006
Figure 7. Load–CMOD curves of different specimens: (a) the effect of W/B and F.A.; (b) performance comparison at 28 d; and (c) performance comparison at 56 d.
Buildings 13 01538 g007
Figure 8. Load–deflection curves of different specimens: (a) the effect of W/B and FA; (b) performance comparison at 28 d; and (c)performance comparison at 56 d.
Buildings 13 01538 g008
Figure 9. Failure forms of DS-ECCs: (a) uniaxial tensile test; (b) three-point bending test; and (c) four-point bending test.
Buildings 13 01538 g009
Table 1. Chemical properties of the raw materials.
ComponentAl2O3Na2OCaOSiO2P2O5SO3Fe2O3K2OTiO2ClMgO
Cement5.050.7360.2421.22/2.673.260.50//0.97
Fly ash23.613.26.1238.51.062.137.491.84/0.263.66
River sand11.816.06.8745.21.010.586.334.650.860.33/
Mu Us desert sand12.3/4.8374.20.800.503.692.620.490.41/
Tengger desert sand13.10/3.5770.801.721.034.623.630.62//
Table 2. Performance parameters of PVA fiber.
FiberLength
(mm)
Diameter
(μm)
Density (kg/m3)Ultimate Tensile Strength
(MPa)
Elastic Modulus
(GPa)
PVA12391300160040
Table 3. Mixture proportions of different specimens at 28 d and 56 d.
Mix. NOW/BS/BW/(C + FA)S/(C + FA)FA RatioSP RatioPVA RatioFlow
Diameter
by Weightby Volumemm
Basic groupsM10.290.460.29DS0.4650%0.1%2%61
M20.350.3550%2%65
M30.350.3570%2%67
T40.350.3550%2%65
Control groupsM50.350.3550%072
R60.350.35RS50%2%65
Note: the binders are composed of cement and fly ash; C is cement, FA is fly ash, S is desert sand (DS) or river sand (RS), W is water, PVA is polyvinyl alcohol fiber, and SP is superplasticizer; W/B is the water-to-binder ratio, which is equal to W/(C + FA); S/B is the sand-to-binder ratio, which is equal to S/(C + FA); FA ratio refers to FA/(C + FA); SP ratio refers to SP/(C + FA); and PVA ratio is the volume ratio of PVA to total mixture.
Table 4. Test results of different specimens under uniaxial tests.
Mix. No. σ ut
(MPa)
ε ut
(%)
G f
(N/mm)
σ uc
(MPa)
ε uc
(%)
f e u / ( MPa ) W u
u   =   0.85 u   =   0.5 u   =   0.85 u   =   0.5
M128 d10.183.2316.7651.340.9227.5228.900.0260.029
56 d9.713.1916.0057.660.8832.3432.150.0300.034
M228 d14.844.0624.6034.310.9718.9319.20.0210.022
56 d10.674.8229.0952.980.8429.9330.740.0280.033
M328 d12.175.3815.4823.851.1912.7413.260.0170.031
56 d11.076.6817.1025.771.6713.4414.480.030.048
T428 d10.033.7622.7436.501.7421.7521.750.0430.046
56 d9.552.7424.8446.271.6828.3728.760.0540.090
M528 d1.270.100.004228.010.730.0030.0040.0010.001
56 d1.210.090.006431.080.510.0040.0040.0020.002
R628 d12.272.6412.6641.321.0121.9222.430.0230.028
56 d11.444.5820.9151.941.6331.510.0320.0610.096
[17]W/B (0.29)1.182.59-
W/B (0.35)2.722.59-
[18]W/B (0.30)0.560.58-
Note: σ ut is the ultimate tensile strength, ε ut is the ultimate tensile strain, G f is the tensile fracture energy, σ uc is the ultimate compression strength, ε uc is the ultimate compression strain, f e u is the equivalent compression strength, and W u is the equivalent compression toughness index.
Table 5. Test results of different specimens under three-/four-point bending tests.
Mix. No. F ini / kN F u / kN K IC ini / MPa m 1 2 K IC un / MPa m 1 2 P u / kN δ u / mm
M128 d6.138.250.224.2223.880.86
56 d6.639.030.164.7730.722.58
M228 d3.645.570.633.8721.101.47
56 d6.788.700.205.5224.400.93
M328 d2.714.350.334.1415.452.07
56 d2.354.750.53.2819.182.75
T428 d2.564.370.743.823.033.03
56 d3.666.050.323.0227.631.57
M528 d1.421.420.120.391.610.08
56 d1.941.940.170.172.670.08
R628 d3.085.340.541.0415.531.45
56 d4.217.450.373.3420.841.02
Note: F ini is the initial cracking fracture load, F u is the ultimate fracture load, K IC ini is the initial cracking fracture toughness, K IC un is the unstable fracture toughness, P u is the maximum bending load, and δ u is the top bending deflection.
Table 6. Bending toughness indexes based on the ASTM C1018.
Mix Ratio I 5 I 9 I 19 I 29 I 39 I 2 u 1 R 9 , 5 R 19 , 9 R 29 , 19 R 39 , 29 R 2 u 1 , 39
M128 d5.806.11
56 d8.116.235.1203.8236.3
M228 d5.912.015.8153.3190
56 d8.317.319.7224.8120
M328 d7.31539.366.896.1100.3193.3242.7275293.5209
56 d6.312.630.936.4159.5182.4137.5
T428 d7.615.237.061.989.490.5190.3217.9248.5275.6/
56 d5.39.822.824.2112.8130.268.5
M528 d1
56 d1
R628 d9.921.253.975.4280327.6358.0
56 d7.515.519.5200.3199.5
Note: when I x > x , the DS-ECCs are ultra-high-toughness cementitious composites.
Disclaimer/Publisher’s Note: The statements, opinions and data contained in all publications are solely those of the individual author(s) and contributor(s) and not of MDPI and/or the editor(s). MDPI and/or the editor(s) disclaim responsibility for any injury to people or property resulting from any ideas, methods, instructions or products referred to in the content.

