1. Introduction
Building information modelling (BIM) has been recognised as an essential tool for enhancing the productivity of the construction sector, which has been characterised as segmented and inefficient [
1]. BIM is not an option; it is the new standard for architectural and building engineering consultants [
2,
3]. The construction industry cannot afford to ignore BIM adoption, so it is critical to determine the best time for a transitional shift to BIM [
4,
5]. A rising number of sustainable building projects are being undertaken globally due to the construction industry’s rapid growth, with significant ramifications for global and local economic development [
6]. BIM may function as a central database that helps in every step of managing the building lifecycle by making digital representations of the physical and functional information of sustainable projects accessible to all stakeholders [
7].
BIM is currently considered the construction industry’s most innovative technology. At its core, BIM offers an intelligent digital representation of buildings to support diverse tasks throughout a project’s lifecycle, yielding a variety of advantages for different stages of the delivery process [
8,
9]. According to the literature, the BIM adoption rate in North America is 67% for engineers, 70% for architects and 74% for contractors. In Australia, approximately 49% of architects and 75% of engineers and contractors use BIM. As per a BIM survey conducted in the United Kingdom, 39% of respondents have used BIM [
10,
11]. Likewise in Malaysia, the concept of BIM is gaining popularity among construction industry stakeholders [
7,
12]; however, its adoption rate remains low, and a report published by the Construction Industry Board of Malaysia (CIDB) in 2016 appears to validate the trend in low adoption of BIM in Malaysia, which is considered extremely low at 17% [
13].
Researchers reported that many factors contribute to the slow adoption of BIM. Few studies identified the clients/owners as the major driver of BIM in Malaysia to overcome the issue of low adoption [
14,
15]. Meanwhile, studies also identified the main reason as a lack of demand by the client towards BIM adoption [
16,
17], which is not surprising because the client plays an important role in stimulating the construction industry [
18]. The lack of demand might be due to the perception that BIM has a high initial cost of adoption, such as the cost of software being too expensive [
19]. In Malaysia, the private sector has been the main force behind BIM implementation since 2009 [
12]. Certain property development and construction companies in Malaysia continue to hold the opinion that “BIM is essentially a private endeavour driven by the major property developers and contractors” despite government initiatives to use BIM for the construction industry. The Malaysian government development sector departments have played an important role in the promotion of BIM among construction industry stakeholders. BIM was first introduced by the Director of the Public Works Department (PWD) in 2007, and PWD adopted BIM in Malaysia as a result of its potential to enhance project delivery and facilities management. A BIM committee was established that same year to choose the most effective BIM deployment platforms. The group suggests that Autodesk tools, such as Revit Architectural, Revit Structural, Revit MEP, Navisworks and BIM 360, serve as the platform [
20,
21]. The National Cancer Institute (NCI) in Putrajaya, Malaysia, also employed BIM for the first time in 2010 as a government initiative. Furthermore, the Malaysian government has declared that by 2016, BIM will be employed in all public projects [
12].
Intangible benefits are subjective attitudes and perceptions about a company that cannot be expressed in monetary terms on a balance sheet, despite the fact that they may increase the company’s value as a business [
22,
23]. In order to identify reported and perceived intangible benefits of BIM, this study focuses on an extensive literature search where articles, primarily, and books were screened for documented benefits of BIM from the sources of surveys and case studies. The reported benefits from surveys indicated a lack of organization in terms of understanding the distribution of the benefits across the stakeholders. The benefits were sorted according to the scope of projects and purpose, which can be general or specific to particular projects. Sarvari et al. [
24] suggested that current methods of identifying benefits do not create a generic list, which makes it difficult not only for clients but also for stakeholders and researchers to evaluate the justification according to their respective classes. Generally, construction practices focus on three main aspects of objectives: firstly, to construct designs as per client(s) requirements, align the design to quality, schedule and budget limits; secondly, to reduce cost by increasing productivity; and finally, to improve quality and safety by better and enforced inspection [
25]. Therefore, the reported benefits of BIM can be suggested to be categorized into objectives of quality, time cost, safety and legal, which are related to the capabilities of BIM.
Several BIM tools are being utilized in the Malaysian construction sector to enhance the productivity of the projects [
26]. Musarat et al. [
27] evaluated the applications of BIM in the operation and maintenance phase in the Malaysian construction sector, where it was explored that the utilization of BIM boosts project efficiency. In another study by Alaloul et al. [
27], it was observed that BIM also addressed health and safety concerns of the Malaysian construction sector through project integration. The Malaysian government recognize the role of BIM; however, early adoption is required [
27]. Regardless of the abovementioned efforts by the Malaysian government, more awareness is still required regarding BIM adoption in construction projects by stakeholders. Steps taken by the Malaysian government have been less effective and the industry has given less attention to the intangible benefits of BIM’s potential due to the industry’s lack of procedures or formal methodology to measure its value [
28]. Furthermore, the industry lacks consistent, cost–benefit benchmarking associated with BIM process innovations [
29], and one of the identified reasons for this is that many clients are unable to justify information technology infrastructure services (ITIS) adoption with intangible benefits [
30]. As a result of the preceding discussion, it is not surprising that determining the intangible benefits derived from information system implementation has been an elusive goal for academics and practitioners alike. Thus, this research aims to develop a BIM intangible-benefits-quality framework in the construction project that is required for the justification of BIM adoption in the construction industry. The identification of intangible BIM benefits in the construction sector will also help convince owners to adopt BIM for a better assessment of BIM investment value [
31,
32,
33].
2. Methodology
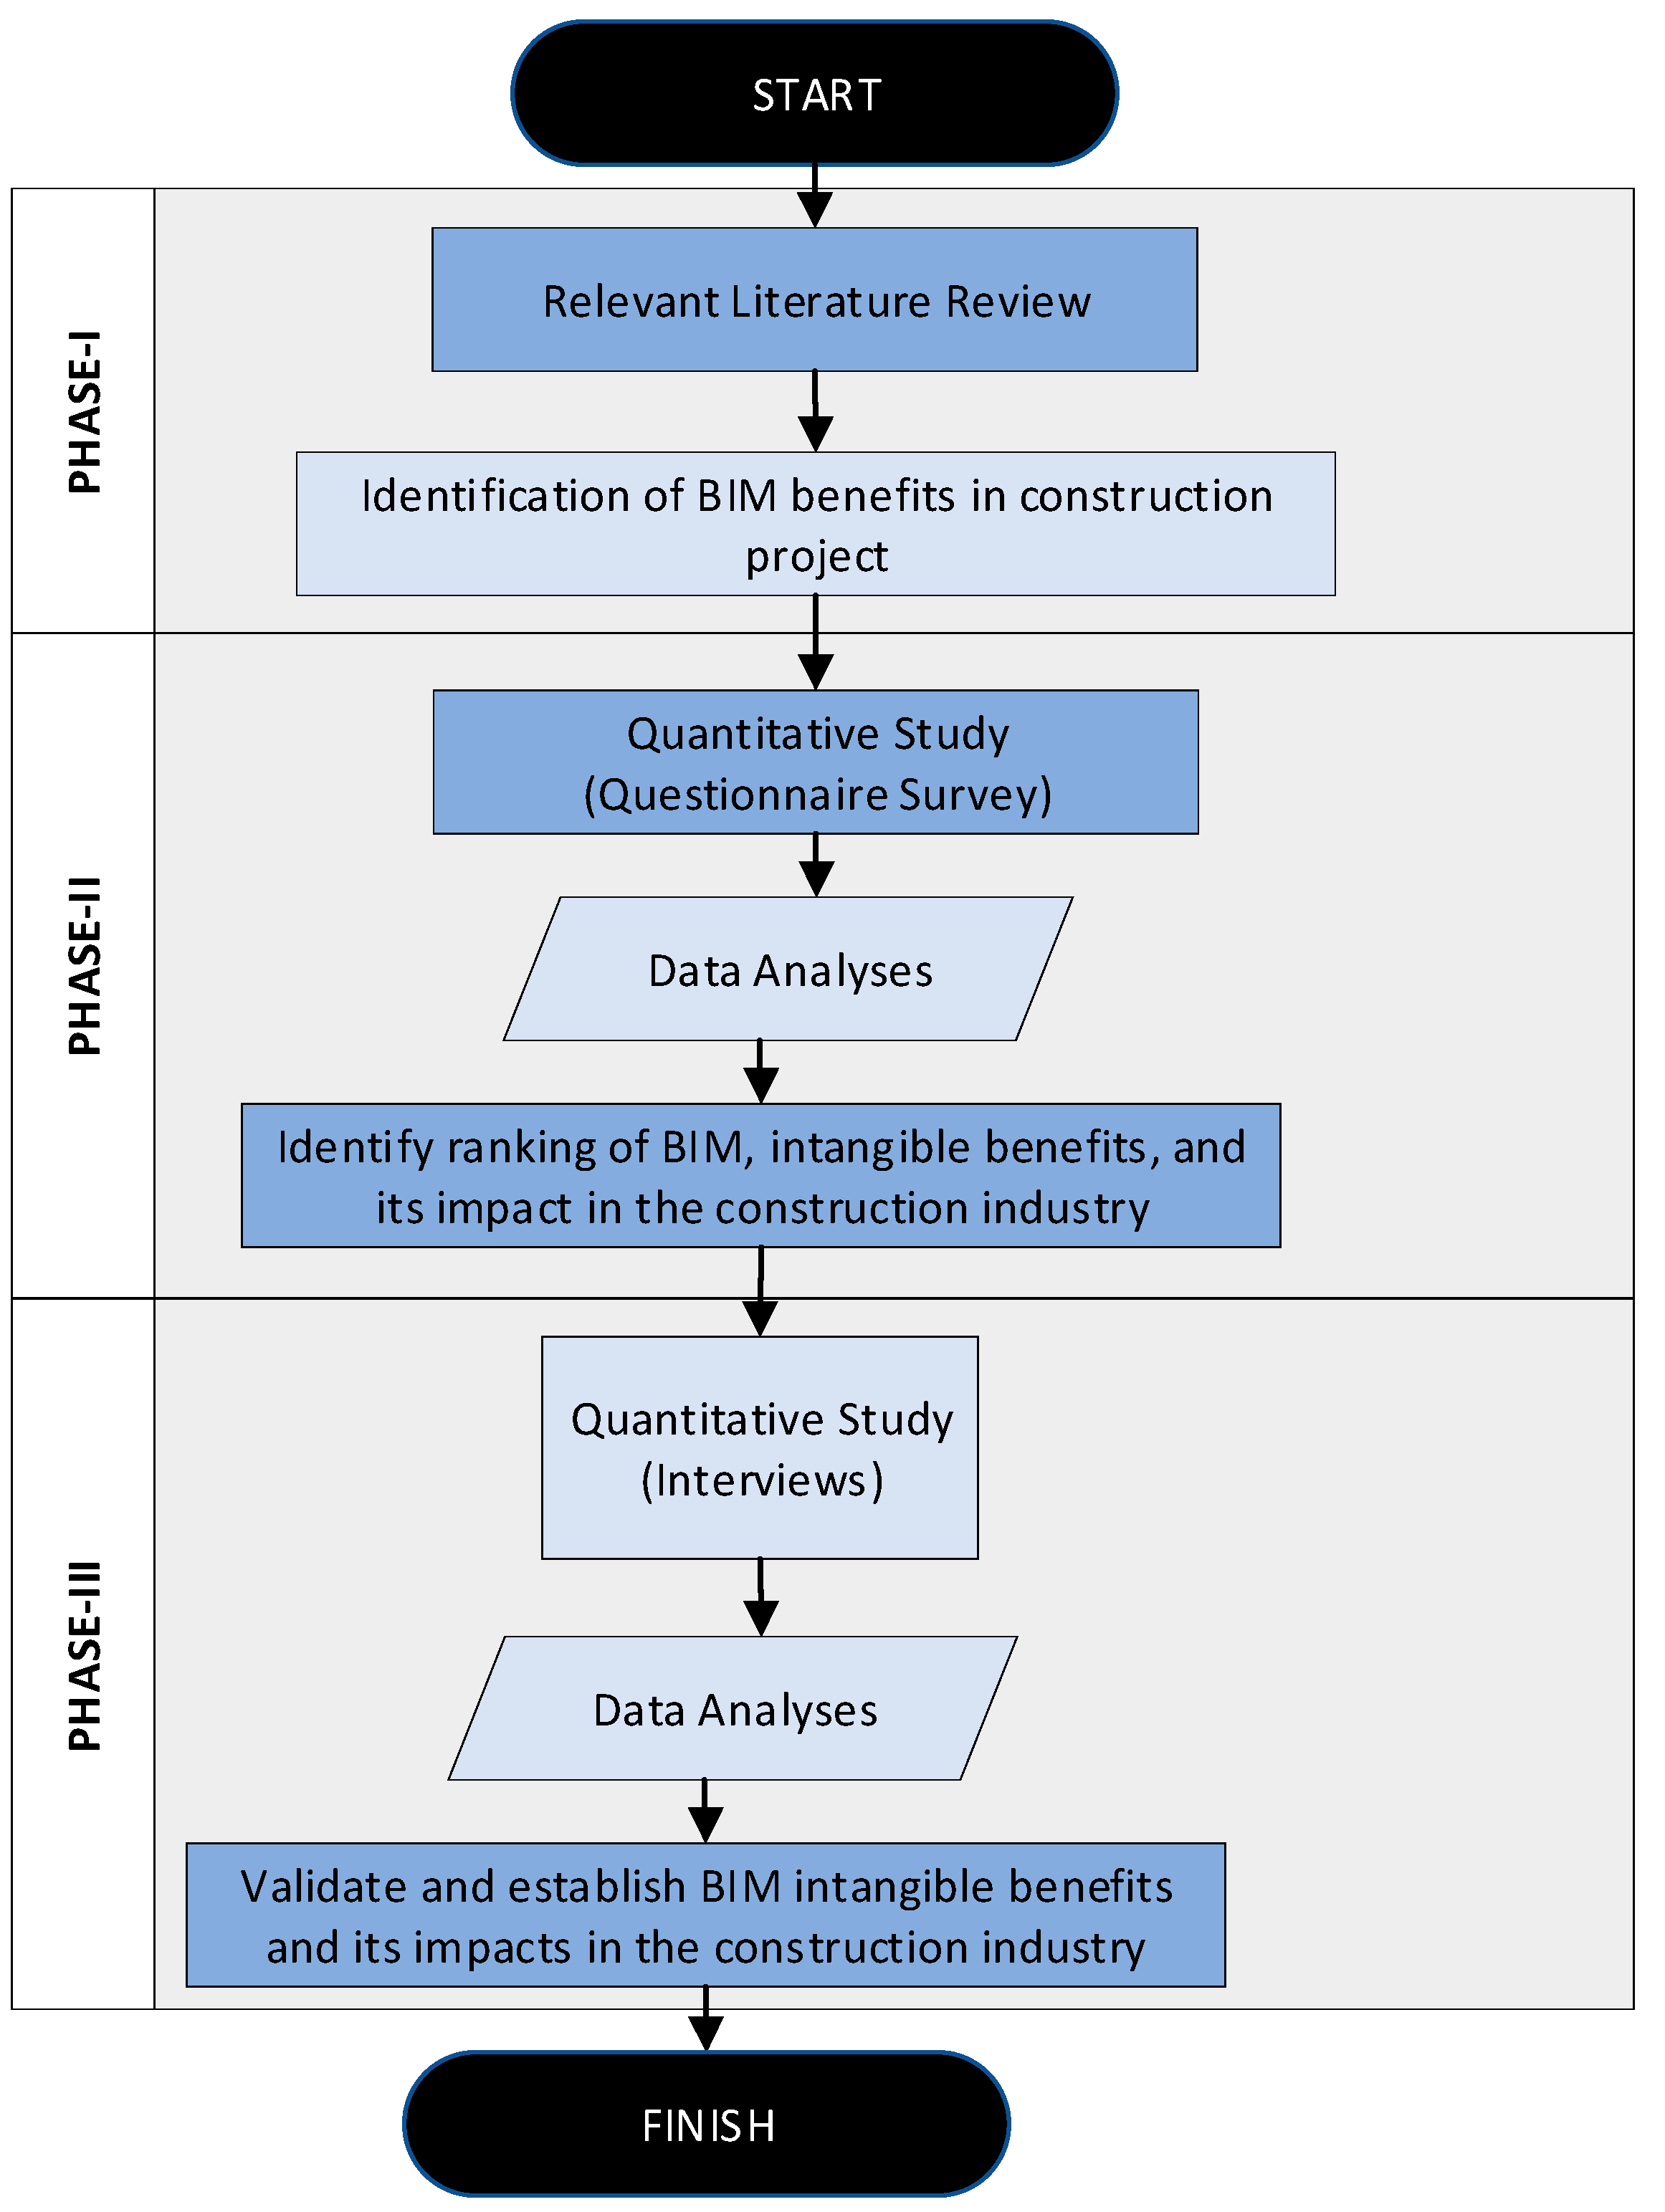
This study aims to establish the intangible benefits of BIM in the construction project (independent variable) and its impacts on the construction processes (dependent variables). Therefore, this study used a mixed method, i.e., quantitative analysis and qualitative analysis, as this can provide stronger evidence for a conclusion because the methods may validate each other. Moreover, the strength of one method can be used to overcome the weakness of the other method. Data collected and analysed for this study went through a three-phase research design. Every phase had its procedure and justification before the next phase began. This phase was important as a guide for the research method.
Figure 1 summarises the three-phase procedure involved in this research.
2.1. Phase 1: Literature Review
A literature review is the first stage of the research, which is crucial as a secondary source to the body of knowledge of the current theoretical and methodological study [
34,
35]. This stage enabled a broad understanding of previous research and an understanding of the benefits of BIM in construction projects. Sources of the literature in this research were books, journals, articles, dissertations, conference papers and reports. As a result, 18 intangible benefits of BIM were identified, associated with the construction project. The findings from the literature review were validated in order to establish the quality framework required for the proper justification of BIM adoption in the construction industry.
2.2. Phase 2: Quantitative Analysis
During this phase, a questionnaire was created based on the literature review and distributed to construction industry participants. The survey aimed to examine the importance of the intangible benefits of BIM in the construction industry in Malaysia. The questionnaire survey was used as a primary data collection source to achieve the objectives of the study.
Researchers have highlighted various advantages of a questionnaire to collect data as follows: (i) it is practical; (ii) the results of the questionnaire can be quickly and easily quantified; and (iii) data can be used to create new theories and/or test existing hypotheses [
36,
37]. Each respondent received an identical set of intangible benefits, and the respondents were free to rank the benefits according to their relevance at the responder’s own pace. The responders were asked to rank intangible benefits using a Likert-type scale from 1 to 5 (where 5 is “Extremely important” and 1 is “Not important”).
The questionnaire was distributed among Malaysian construction industry professionals linked with BIM via a web-based service called Google Form. Out of 150 surveys sent to potential respondents, only 80 respondents completed the survey, yielding a 40 % response rate. This sample size of 80 represents the entire population eligible to participate in this study who are most experienced in the implementation of BIM. Although the results may not be considered statistically significant, they are sufficient to draw meaningful conclusions. This study adopted a self-administered online questionnaire without the intervention of the researcher. Thus, the questionnaire was designed carefully to ensure clarity.
Data obtained from the questionnaires were analysed using Statistical Package for the Social Science (SPSS) 23. Methods used in this study include frequency distribution, ranking and reliability tests. A statistical approach of exploratory analysis (EFA) was adopted to determine the correlation among the variables in the dataset. Thus, principal component analysis was applied in order to understand the relationship between “attitude” and “behaviour”, to identify redundant questions in the questionnaire and to summarize the data. Hence, the application of communalities, total variance explained and rotated component matrix was presented, and for the appropriateness of data, the tests used was the Kaiser–Meyer–Olkin (KMO) statistics and Barlett’s test.
2.3. Phase 3: Qualitative Analysis
Interviews were conducted in order to validate the ranking and the correlation from the questionnaire result. The findings of the interview results were achieved to identify the critical intangible benefits that may have significant impacts on the Malaysian construction industry. The interview questions were developed based on the ranking analysis of the intangible benefits of BIM in the quantitative analysis. Thus, the interviews were conducted to validate and confirm the questionnaire analysis result.
3. Results and Discussion
The collected data were analysed for the details of respondents regarding their profession, working experiences, objectives of BIM adoption, who encourages them to adopt BIM and their perception of whom experiences the most value of BIM.
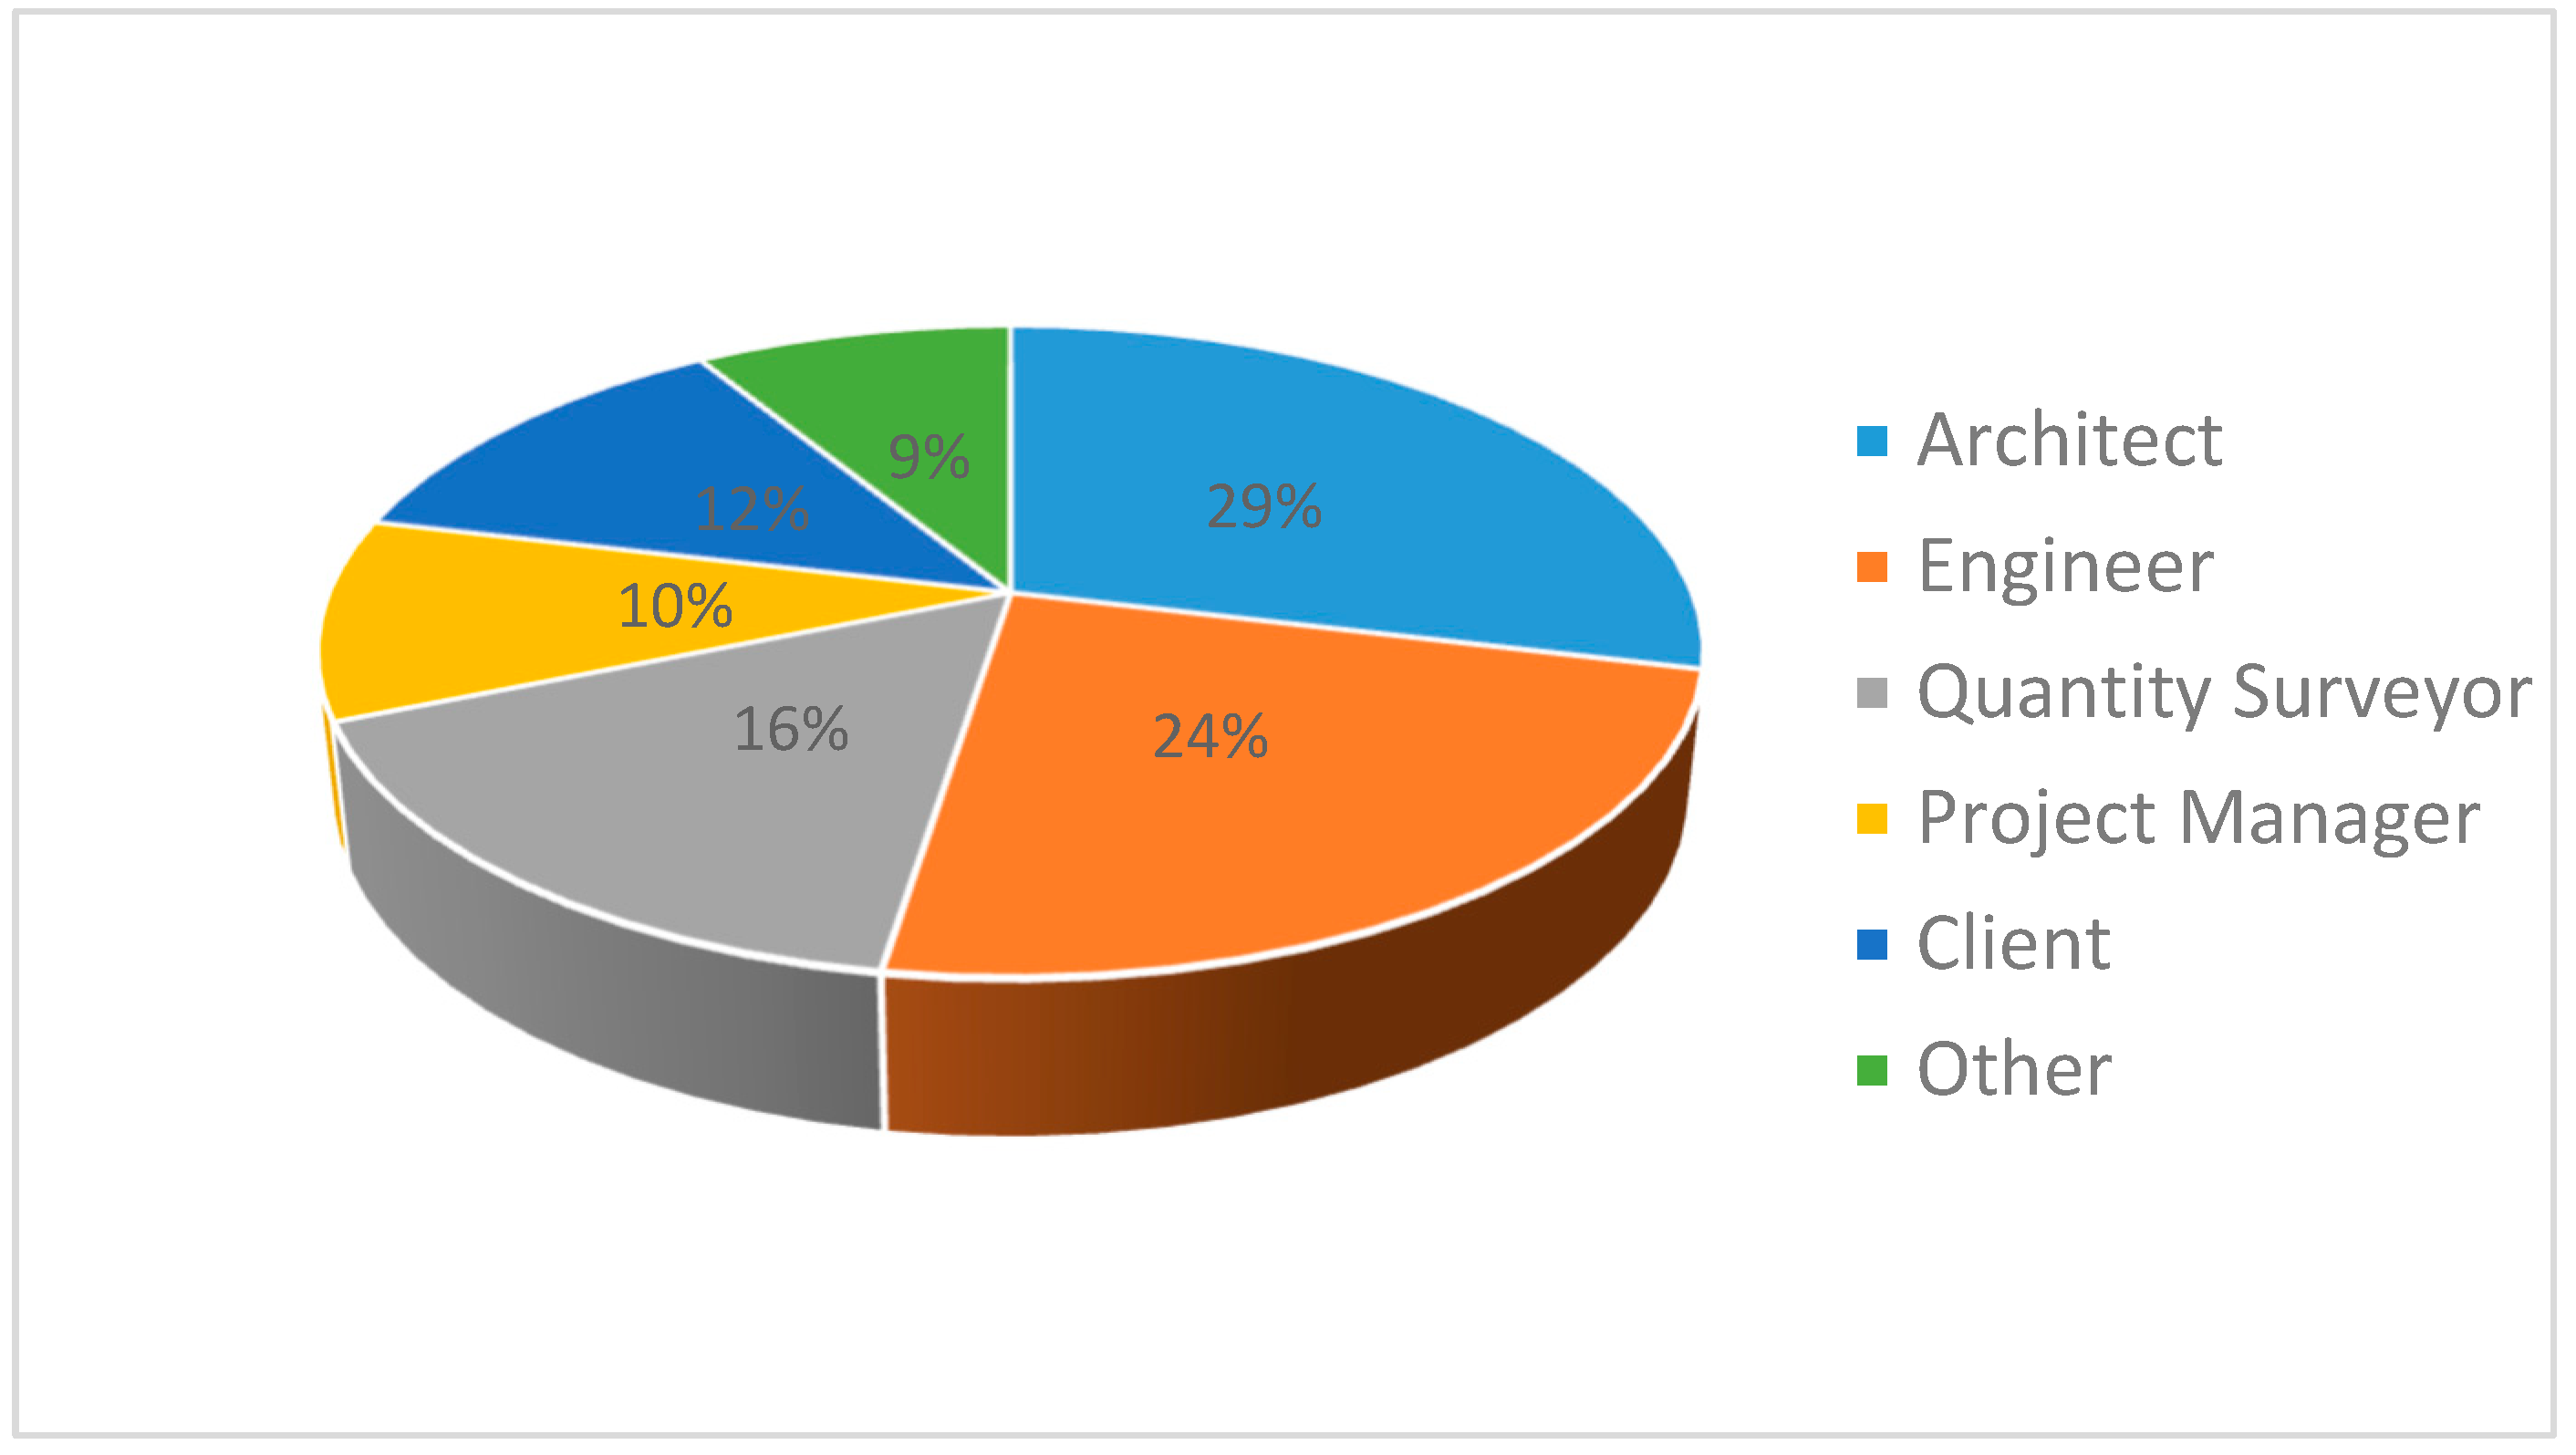
Figure 2 and
Figure 3 summarize the graphical representation of respondents against their job roles and years of experience. Most of the questionnaires were answered by architects (28.8%), as indicated in
Figure 2, and the majority of respondents had 10–14 years of experience, as illustrated in
Figure 3. However, some of the respondents selected the “others” category, who were academicians and IT managers.
Data regarding BIM encouragements and objectives are summarized in
Table 1, which shows that most respondents agreed that justification is important (98.8%) for BIM adoption, but slightly more than half of the respondents justify their BIM adoption (53.8%). Most of the respondents indicated that the stage of adoption is not applicable as they do not measure BIM adoption at a particular stage; this was followed by during the adoption (42.5%) of BIM and it is significant that BIM adoption is not measured at the before and after the adoption.
Following this, the KMO and Barlett’s test was performed on the collected data. The KMO approach was used to evaluate the strength of the relationship among variables, i.e., a measure of sampling adequacy and Bartlett’s test of sphericity were used to prove whether factor analysis was appropriate for analysis. These two tests evaluated the data together [
38,
39].
Table 2 presents the KMO and Barlett’s test outcomes. It can be observed that the result of KMO was achieved at 0.603; in general, above 0.5 is acceptable. However, above 0.6 is preferred, and it was shown that the sampling of respondents (N = 80) was adequate for each variable. Moreover, at least some correlations among the variables and coherent factors can be identified [
40]. The Barlett’s test results significantly indicate that factor analysis is possible with the data.
Moreover, Cronbach’s alpha test was also performed, which reports the measure of the reliability of collected data by describing the internal consistency [
41]. The questionnaire covered 18 intangible benefits, which are shown in
Table 3. Reliability was carried out to establish the internal consistency reliability of the collected data. The result can be accepted if only Cronbach’s alpha coefficient is greater than or equal to 0.70 [
42]. The results in
Table 3 show that all the intangible benefits are consistent and reliable.
Reliability for the 18 intangible benefits for 80 respondents is 0.73. This confirmed that the results of the questionnaire can be accepted.
3.1. Ranking of Intangible Benefits of BIM
Ranking of the intangible benefits of BIM was performed and is shown in
Table 4 by simply evaluating the mean and standard deviation of the collected data for each item. The descriptive analysis identified that the most critical intangible benefits identified are “Better understanding of design” (4.83), followed by “Improve communication through visualization” (4.75), “Reduce design error” (4.54), “Improved accuracy of documents” (4.50) and “Better information received and given” (4.48). The least critical intangible benefits are “Less staff required” (3.03).
A “communality” describes the extent a variable correlates with all other variables, where higher communalities are better. Low values in the “Extraction” column indicate candidates for removal after examining the pattern matrix [
59]. A communality in
Table 5 describes the extent to which a variable correlates with all other variables. The high value of each variable in the Extraction column shows that extraction communalities are acceptable. They are no particularly low values in the extraction column, which indicates that the variables correlate well.
3.2. Extraction Method: PCA
Principal component analysis (PCA) is a multivariate technique for analysing a data table in which observations are described by several inter-correlated quantitative-dependent variables [
60]. Following this, the total variance explained in
Table 6 indicates that there were 5 new components/factors from the 18 variables of the Likert scale presented to the respondents in the research with a cumulative percentage of 62.69%. These five components were more than the value of 1 for Eigenvalues. Thus, these newly identified components made it easier to model in Anova because it reduces a large number of variables into a smaller set of factors. Each factor explains a percent total of variance. Factors that do not explain much variance are not included in the final model.
Exploratory principal component factor analysis was performed on the intangible benefits scale to specify components in order to check the scale’s integrity. Exploratory factor analysis is a multivariate technique that investigates the possibility of a few latent variables accounting for a large number of individual variables [
61]. The factors of loading more than 0.50 were selected [
62] and are shown in
Table 7 in order to develop the new domain.
Finally, in
Table 7, five principal components from the identified intangible benefits corresponding to communication, documentation, quality, risk and cost are apparent from the loadings. The five principal components define the identified intangible benefits gained from the implementation of BIM in the construction industry. The corresponding components were identified based on the following: (1) (Loading 1) Communication: Better understanding of design leads to improved clash detection and accuracy of documents which resulting better information received and given; (2) (Loading 2) Documentation: Time savings due to less design error and time to produce drawings, schedules, etc.; (3) (Loading 3) Quality: More time designing will improve built and design quality; (4) (Loading 4) Risk: Less insurance claims due to fewer schedule overruns, whereas the project is on time and the possibility of insurance claim is less. A timely request for information also helps to avoid possible problems that might cause insurance to be claimed; and (5) (Loading 5) Cost: Less interruption and resolved design ensure that the final estimation can be improved because the design can be confirmed earlier and fewer staff are required to cater to the interruption and amendments of the design.
Table 8 lists the final principal component variables in the questionnaire that are relevant to this study. This procedure was deemed necessary in order to establish evidence for the intangible benefits framework’s convergent and discriminant validity.
The principal component factor analyses of intangible benefits are also used to create summated scales rather than factor scores. As a result, the primary components were identified and used as replacement variables in the regression analysis. The summated scale includes only the variables that load heavily on the factor, and factor scores are difficult to interpret because all variables contribute through loadings [
63]. In general, the standard deviation is low. As a result, there was some agreement among construction industry participants about the intangible benefits of BIM. Moreover, for one of the items in the questionnaire, i.e., “Do you adopt Building Information Modelling in your projects?”, compared mean methodology was adopted for analysis. The summary and outcomes for the compared mean analysis are shown in
Table 9.
From the analysis in
Table 9, it is seen that the
p-value of all factors is more than 0.05; thus, there is no significant relationship between factors and the adoption of building information modelling. Moreover, Pearson correlation was also performed, which is a measure of linear correlation between two sets of data [
64].
Table 10 summarizes the outcomes via Pearson correlation.
Table 10 shows that at a significance level of 0.05, communication and documentation had a significant correlation relationship. (r = 0.329,
p = 0.003), as did quality and documentation. (r = 0.345,
p = 0.002). Lastly, cost and risk had a significant relationship. (r = 0.360,
p = 0.001).
3.3. Validation Phase
In the final phase, the interview questions were developed using the findings of the ranking analysis of the questionnaire survey. Five interviews were carried out with BIM consultants from the public and private sectors who are currently involved in BIM construction projects. The details of the interviewees are shown in
Table 11. The anonymity of the interviewees was preserved by assigning each of them an identification tag.
The interview questions focused on the top five of the critical intangible benefits of BIM. The interviewees were asked about their opinions on these critical benefits and why they think it is important. The result summary of the findings is shown in
Table 12.
4. Discussion
The lack of demand by clients has been identified as the main reason for the slow adoption of BIM in the construction industry, and researchers have identified clients/owners are the major drivers for BIM adoption in Malaysia. This is not surprising because clients play a major role in stimulating the construction industry. The high initial cost of BIM adoption, such as the cost of software, has been identified as the main concern of clients [
65]. Furthermore, clients have not been convinced of the rate of return of their investment in BIM. Thus, many researchers have argued that the current methods of measuring BIM benefits do not consider the intangible benefits of BIM; thus, the true value of BIM is not properly presented to clients [
66,
67]. Furthermore, a lack of understanding of BIM capabilities has resulted in a lack of confidence among clients to adopt BIM. The literature review revealed that uncertainty in any technology investment is considered common [
68,
69]. Thus, four areas of uncertainty for the aspects of technical, organizational, market and resource have been recognised. In addition, the relationship between the uncertainty and lack of adoption of clients has been established and justified the need for proper justification. The aim of this research is to develop a BIM intangible-benefits-quality framework in the construction project that is required for the justification of BIM adoption in the construction industry.
Therefore, in order to identify intangible benefits for proper justification, a sequential exploratory method of a quantitative questionnaire survey and a qualitative interview approach was conducted to meet the research aim and objectives. A literature review was conducted in the first phase to identify BIM benefits in construction projects. From the literature review, 18 intangible benefits were identified from BIM adoption that benefited all stakeholders in the construction industry. Consequently, the questionnaire survey was developed based on the literature review and distributed to industry players that have been involved in BIM adoption. Sampling was limited due to a limited number of people’s knowledge of BIM. The questionnaire survey was distributed to 150 potential respondents and a total of 80 responses were received with a response rate of 53.3%. SPSS software version 21 was used to perform several tests. A rotated component matrix was performed on the identified benefits in order to categorise them into different categories or components. There are five categorizations or components that were established. Finally, a correlation between the identified categorization or components of the intangible benefits was established using the Pearson correlation. The results indicated that intangible benefits in the components of time and quality had the highest strength of significant correlation relationship.
Afterwards, interviews were carried out in order to validate and confirm the questionnaire analysis in terms of ranking and correlation. Five construction professionals who adopted BIM were interviewed. Each interviewee was asked about their experience with the intangible benefits of BIM and how it helps them in the construction project. A detailed discussion was also carried out on critical intangible benefits that have been identified by questionnaire analysis in order to validate the impact of these benefits. Thus, the findings from the interviews were compared with the quantitative results for validation. The results of the interviews indicated that the identified critical intangibles were valid and had a great impact on the construction industry. Hence, it is paramount that the intangible benefits of BIM are included in the justification of BIM due to its impact on BIM adoption. A clear picture of BIM benefits promote better adoption of BIM. This study leads to the following outcomes, discussed as follows, under the study theme.
4.1. A Better Understanding of Design
All interviewees confirmed that a “Better Understanding of Design” is the most critical intangible benefit of BIM in the construction industry. Most of the interviewees agreed that the model helps them to understand design, especially the design intent of the architects. Thus, optimization of design can be achieved without compromising the needs of the clients. Interviewee 3 mentioned that with the use of the BIM model, most clients are generally excited to be involved in the design process because they tend to understand the design better. Thus, clients are more satisfied with the outcome of the design. According to interviewee 5, it is easier to quantify using the BIM model and generate schedules from the model.
4.2. Improve Communication through Visualization
All interviewees agreed that with BIM, communication with team members greatly improved because the building model can contextualize the complexity of a project. The model, which is an interactive, information-rich representation, facilitates understandings of how each component is related, which makes it easier for the team member to communicate and identify potential risks.
4.3. Reduce Design Error
For most of the interviewees highlighted with BIM, rectification works especially on-site were greatly reduced. Interviewees 1 and 2 mentioned that it is important that design coordination and clash detections are finalized before tender or construction drawings are issued to the contractors to ensure integrity and error-free drawings. Thus, better planning, coordination and monitoring can be implemented on-site which can improve cost savings for the construction due to less hacking, less double handling of tasks, etc.
4.4. Improved Accuracy of Documents
All interviewees agreed that the accuracy of documents greatly improved. They experienced fewer or no mistakes in the construction drawings. It also helped to increase coordination with other stakeholders and improve the reliability of their design.
4.5. Better Information Received and Given
BIM helps designers to understand how an entire building is put together by having the concept of a holistic design approach. Thus, it helps to reduce the number of design changes and fewer requests for information during construction. Furthermore, the clients can use the information derived from BIM for comprehensive facilities and asset management for smarter building operations.
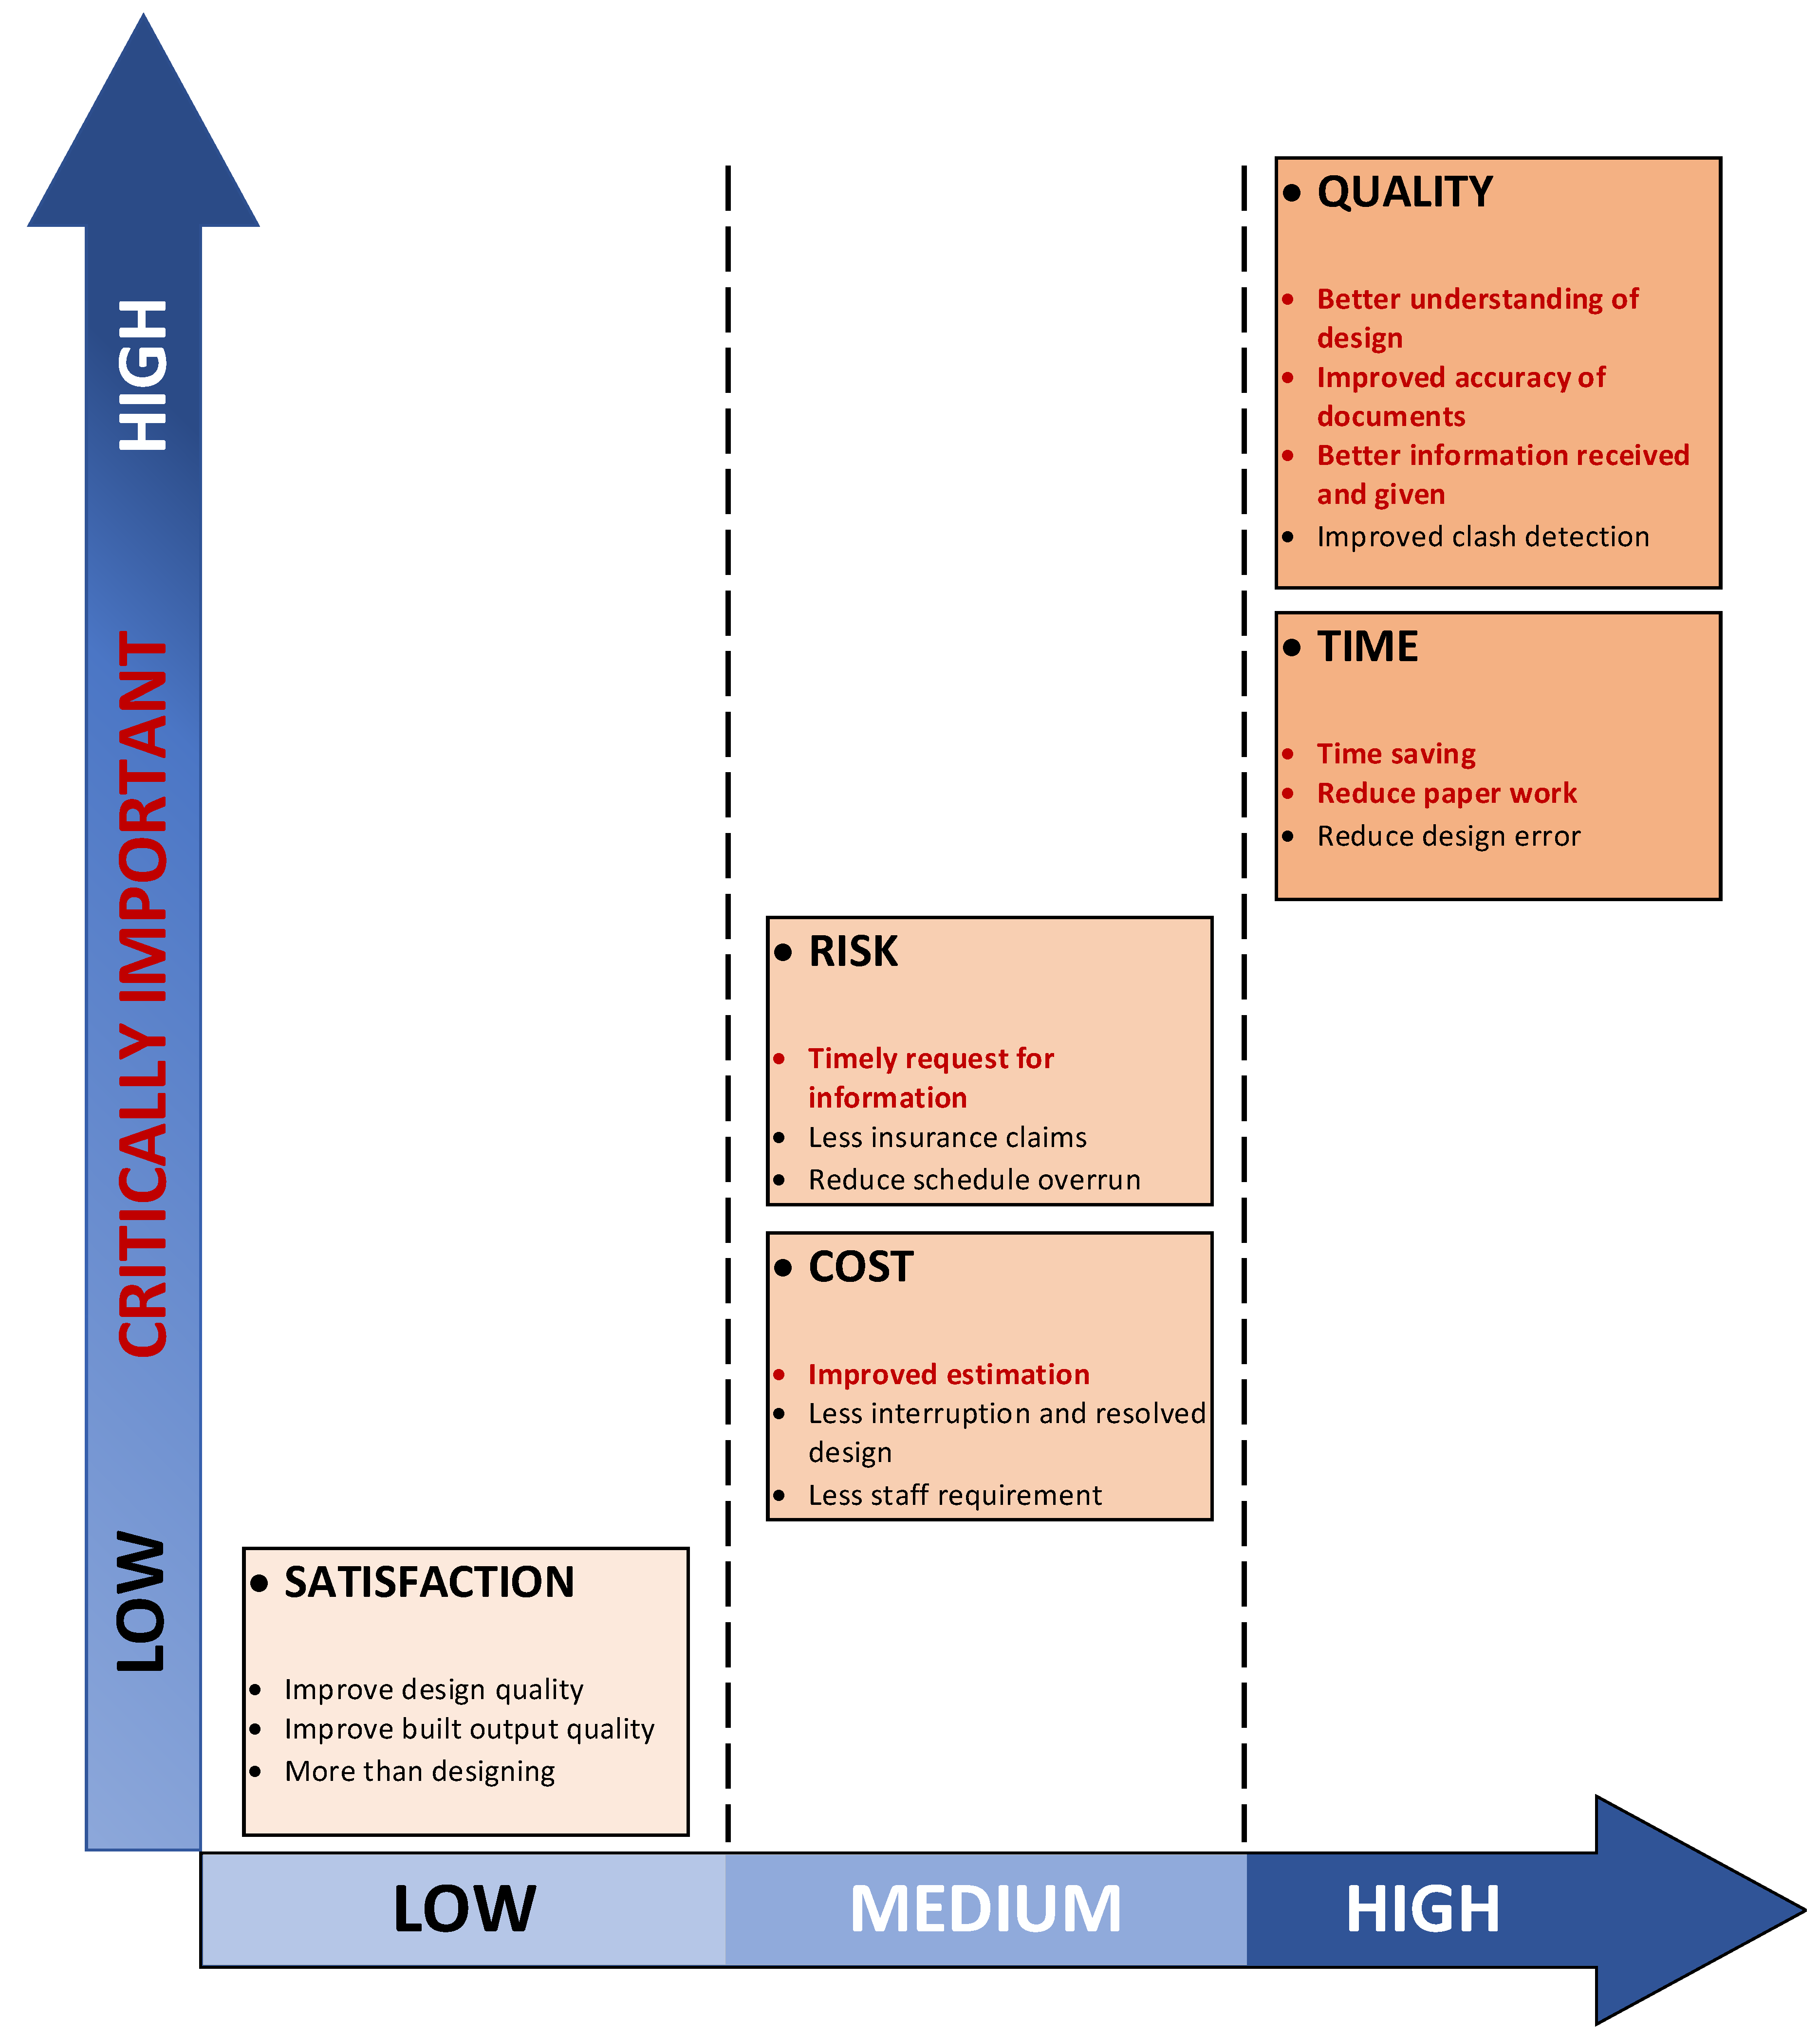
Based on the above discussion, a theoretical framework was developed, which ranks the groups of intangible benefits from low to high according to factor loading. Each intangible benefit was ranked in the group based on the results of the interview. In the quality group, three factors were identified by the interviewees to be most important. These factors provide a better understanding of design, improved accuracy of documents and better information received and given. In the time group, only two factors were considered important by the interviewees. The two factors are time savings and reduced paperwork. In the third group, which is a risk, only one factor was identified as critical by the interviewees, which is a timely request for information. In the cost group, the interviewees also identified only one critical factor, which is improved estimation. For the last group, the interviewees did not select any factors that can be considered critical.
The framework in
Figure 4 reflects the 16 factors obtained from the quantitative analysis, which was then used in an interview with 5 experts in BIM implementation. The interviews were carried out to validate the 16 critical BIM intangible benefits obtained from the questionnaire survey. According to the interviewees, they gained critical benefits and considered them to be the most important benefits during BIM adoption. The results from the interviews were then used to develop a critical BIM intangible benefits framework.


 ,
, 


