1. Introduction
In highly crowded places, tall structures provide much-needed space for habitation and employment. Nonetheless, inherent dangers are associated with huge constructions, and accidents in towering buildings may have catastrophic results [
1,
2]. Several high-profile mishaps in tall structures have occurred in recent years, including fires, collapses, and falls. Management of safety in tall structures is essential for avoiding such tragedies and guaranteeing the safety of residents, tourists, and neighboring communities [
3]. Appropriate safety measures, such as routine inspections, training, and emergency preparation plans, may decrease the likelihood of accidents and lessen their severity if they occur [
3]. In addition to safeguarding people, safety management in tall structures is essential for conserving property and assets [
1,
2]. A catastrophic accident in a tall structure may result in substantial property damage and financial losses, which can have long-term repercussions for building owners, renters, and insurance [
4]. The implementation of RPA has the potential to greatly improve safety monitoring within the construction sector. This can be achieved through the automation of repetitive tasks, provision of instantaneous data analysis, and mitigation of potential human errors [
5,
6]. The implementation of this technology has the potential to enhance safety performance, optimize efficiency, and reduce the probability of accidents and injuries, rendering it an indispensable instrument for enterprises functioning in hazardous settings.
Robotic process automation (RPA) has developed as a potent instrument for expediting various industrial operations, such as the safety monitoring of tall structures. RPA may automate regular activities, therefore minimizing human error and saving time, hence improving productivity [
7]. Robotic process automation (RPA) is a technological approach that involves the utilization of software robots to automate routine and monotonous activities in organizational workflows [
8]. The robots possess the ability to imitate human actions and engage with digital systems in order to execute a variety of tasks, including but not limited to data entry, processing, and communication [
9,
10]. Nonetheless, despite the potential advantages of RPA, its adoption in tall building safety management is not without barriers. This paper evaluates the obstacles encountered in deploying RPA in tall building safety management, including technical difficulty, cost, and opposition to change [
11]. This research provides insights that assist businesses in overcoming the hurdles to RPA adoption and enhancing the safety management of tall buildings by examining these difficulties and proposing alternative solutions [
9].
While RPA can potentially improve safety management in tall buildings, several barriers must be overcome to guarantee its effective deployment. The intricacy of safety management operations in tall structures is one of the primary barriers [
10]. It is necessary to determine which operations may be efficiently automated without jeopardizing safety while ensuring that key tasks requiring human judgment and knowledge are not mechanized. Integration of RPA with current safety management systems is another barrier. It is necessary to ensure that RPA complements current safety management systems rather than replacing them and the integration process is smooth [
8].
The purpose of the research is to identify the most significant barriers associated with applying RPA in the safety management of tall buildings and propose solutions for addressing them. The study will also explore the advantages of robotic process automation (RPA) in the safety management of tall buildings and emphasize the significance of cooperation among diverse stakeholders for effective deployment. Conducting an investigation into the benefits of RPA in the context of safety monitoring has the potential to enhance risk management in the construction sector, thereby augmenting worker safety and mitigating the probability of mishaps. Furthermore, collaborative efforts between regulatory bodies and industry participants can facilitate adherence to regulations and encourage the conscientious implementation of robotic process automation (RPA) within the construction industry.
The potential applications of RPA are diverse and encompass various fields, including project monitoring. However, this study aims to concentrate on the possible utilization of RPA in safety management in tall buildings. The implementation of RPA can enhance safety management in construction projects by optimizing processes and minimizing the likelihood of human error, ultimately leading to improved safety outcomes. Moreover, skyscrapers frequently entail iterative tasks, rendering them suitable contenders for RPA implementation.
This research uses in-depth structural equation modeling to examine the barriers to RPA adoption in tall building safety management. This is the first research to apply structural equation modeling to analyze the complicated interactions between many parameters linked to RPA deployment in tall building safety management. Structural equation modeling is used to conduct a full investigation of the interdependent elements that influence the effective application of RPA in safety management. This study’s results will help to identify the factors that impact the adoption of RPA in safety management and will inform future research on this subject.
2. Current Safety Status in Tall Buildings
According to research by the National Fire Protection Association, between 2014 and 2018, there were an estimated 14,500 structural fires in high-rise buildings yearly in the United States, resulting in an average of 50 fatalities, 400 injuries, and
$257 million in property damage every year [
5,
12]. According to the Council on Tall Buildings and Urban Habitat, there are 157 structures higher than 300 m around the globe as of 2021, with many more under construction or in the planning phases [
6,
13]. The Occupational Safety and Health Administration (OSHA) reports that falls are the top cause of death in the construction business, with 320 of the 1008 construction deaths in the United States in 2018 attributable to falls from heights [
14]. According to research published in the International Journal of High-Rise Structures, most high-rise accidents are attributable to human errors, such as building, maintenance, and operating errors. The National Institute for Occupational Safety and Health (NIOSH) stresses the significance of safety management in reducing accidents and injuries in high-rise structures and offers recommendations and tools for implementing effective safety measures [
15,
16]. Effective safety management may minimize the frequency and severity of accidents, according to research published in the Journal of Construction Engineering and Management. According to the American Association of Safety Professionals, falls from heights result in an average of 287,000 nonfatal injuries and 849 deaths every year across all sectors, including those outside of construction, in the United States [
17,
18]. According to Fire Protection Research Foundation research, automated sprinkler systems in high-rise buildings greatly lower the chance of fire-related deaths and property loss. According to the National Safety Council, safety culture is a crucial element of successful safety management in any business, and firms with strong safety cultures tend to have lower accident and injury rates [
19,
20]. The International Code Council (ICC) creates and publishes building safety codes and standards, especially those about tall structures, and offers training and certification programs to assist construction professionals in efficiently implementing these codes [
21]. Overall, these numbers demonstrate the necessity for rigorous safety management measures in tall structures to avoid accidents, protect people and property, and foster a safety culture.
Although there exists literature on the advantages and obstacles associated with the utilization of RPAs in the management of safety in construction, a dearth of comprehensive research exists that scrutinizes the determinants which influence the implementation of RPAs in the milieu of skyscrapers. Furthermore, prior research has not employed SEM as a means of examining the interrelationships among the various factors that impact the adoption of RPA. The present study endeavors to address this deficiency by examining the interrelationship between these limitations and furnishing valuable perspectives for professionals and scholars to surmount these hindrances.
3. Robotic Process Automation Implementation
RPA may be used to automate repetitive safety procedures like inspections and maintenance checks. By automating these operations, firms may decrease the risk of human mistakes and guarantee the constant use of safety measures [
22,
23]. RPA may be used to construct automated emergency response plans to assist building managers in responding swiftly and efficiently to fires and natural catastrophes [
24,
25]. By automating these procedures, businesses may increase reaction times and lessen the danger of bodily harm or property damage [
26]. RPA may be used to evaluate safety data and identify possible risks or improvement opportunities [
27,
28]. Businesses may swiftly detect and fix safety concerns by assessing data in real-time, minimizing the likelihood of accidents and injuries. RPA can enhance communication and cooperation between diverse teams engaged in safety management, such as building managers, maintenance personnel, and emergency responders [
29,
30]. By automating communication procedures, companies may reduce reaction times and guarantee everyone access to the necessary information to respond effectively to crises. Overall, RPA may aid in maintaining safety management in tall buildings by automating mundane jobs, boosting emergency response, enhancing data analysis, and promoting communication and cooperation [
31,
32]. By adopting RPA, enterprises may improve safety management operations and guarantee that tall buildings remain safe and secure for all occupants.
4. Method
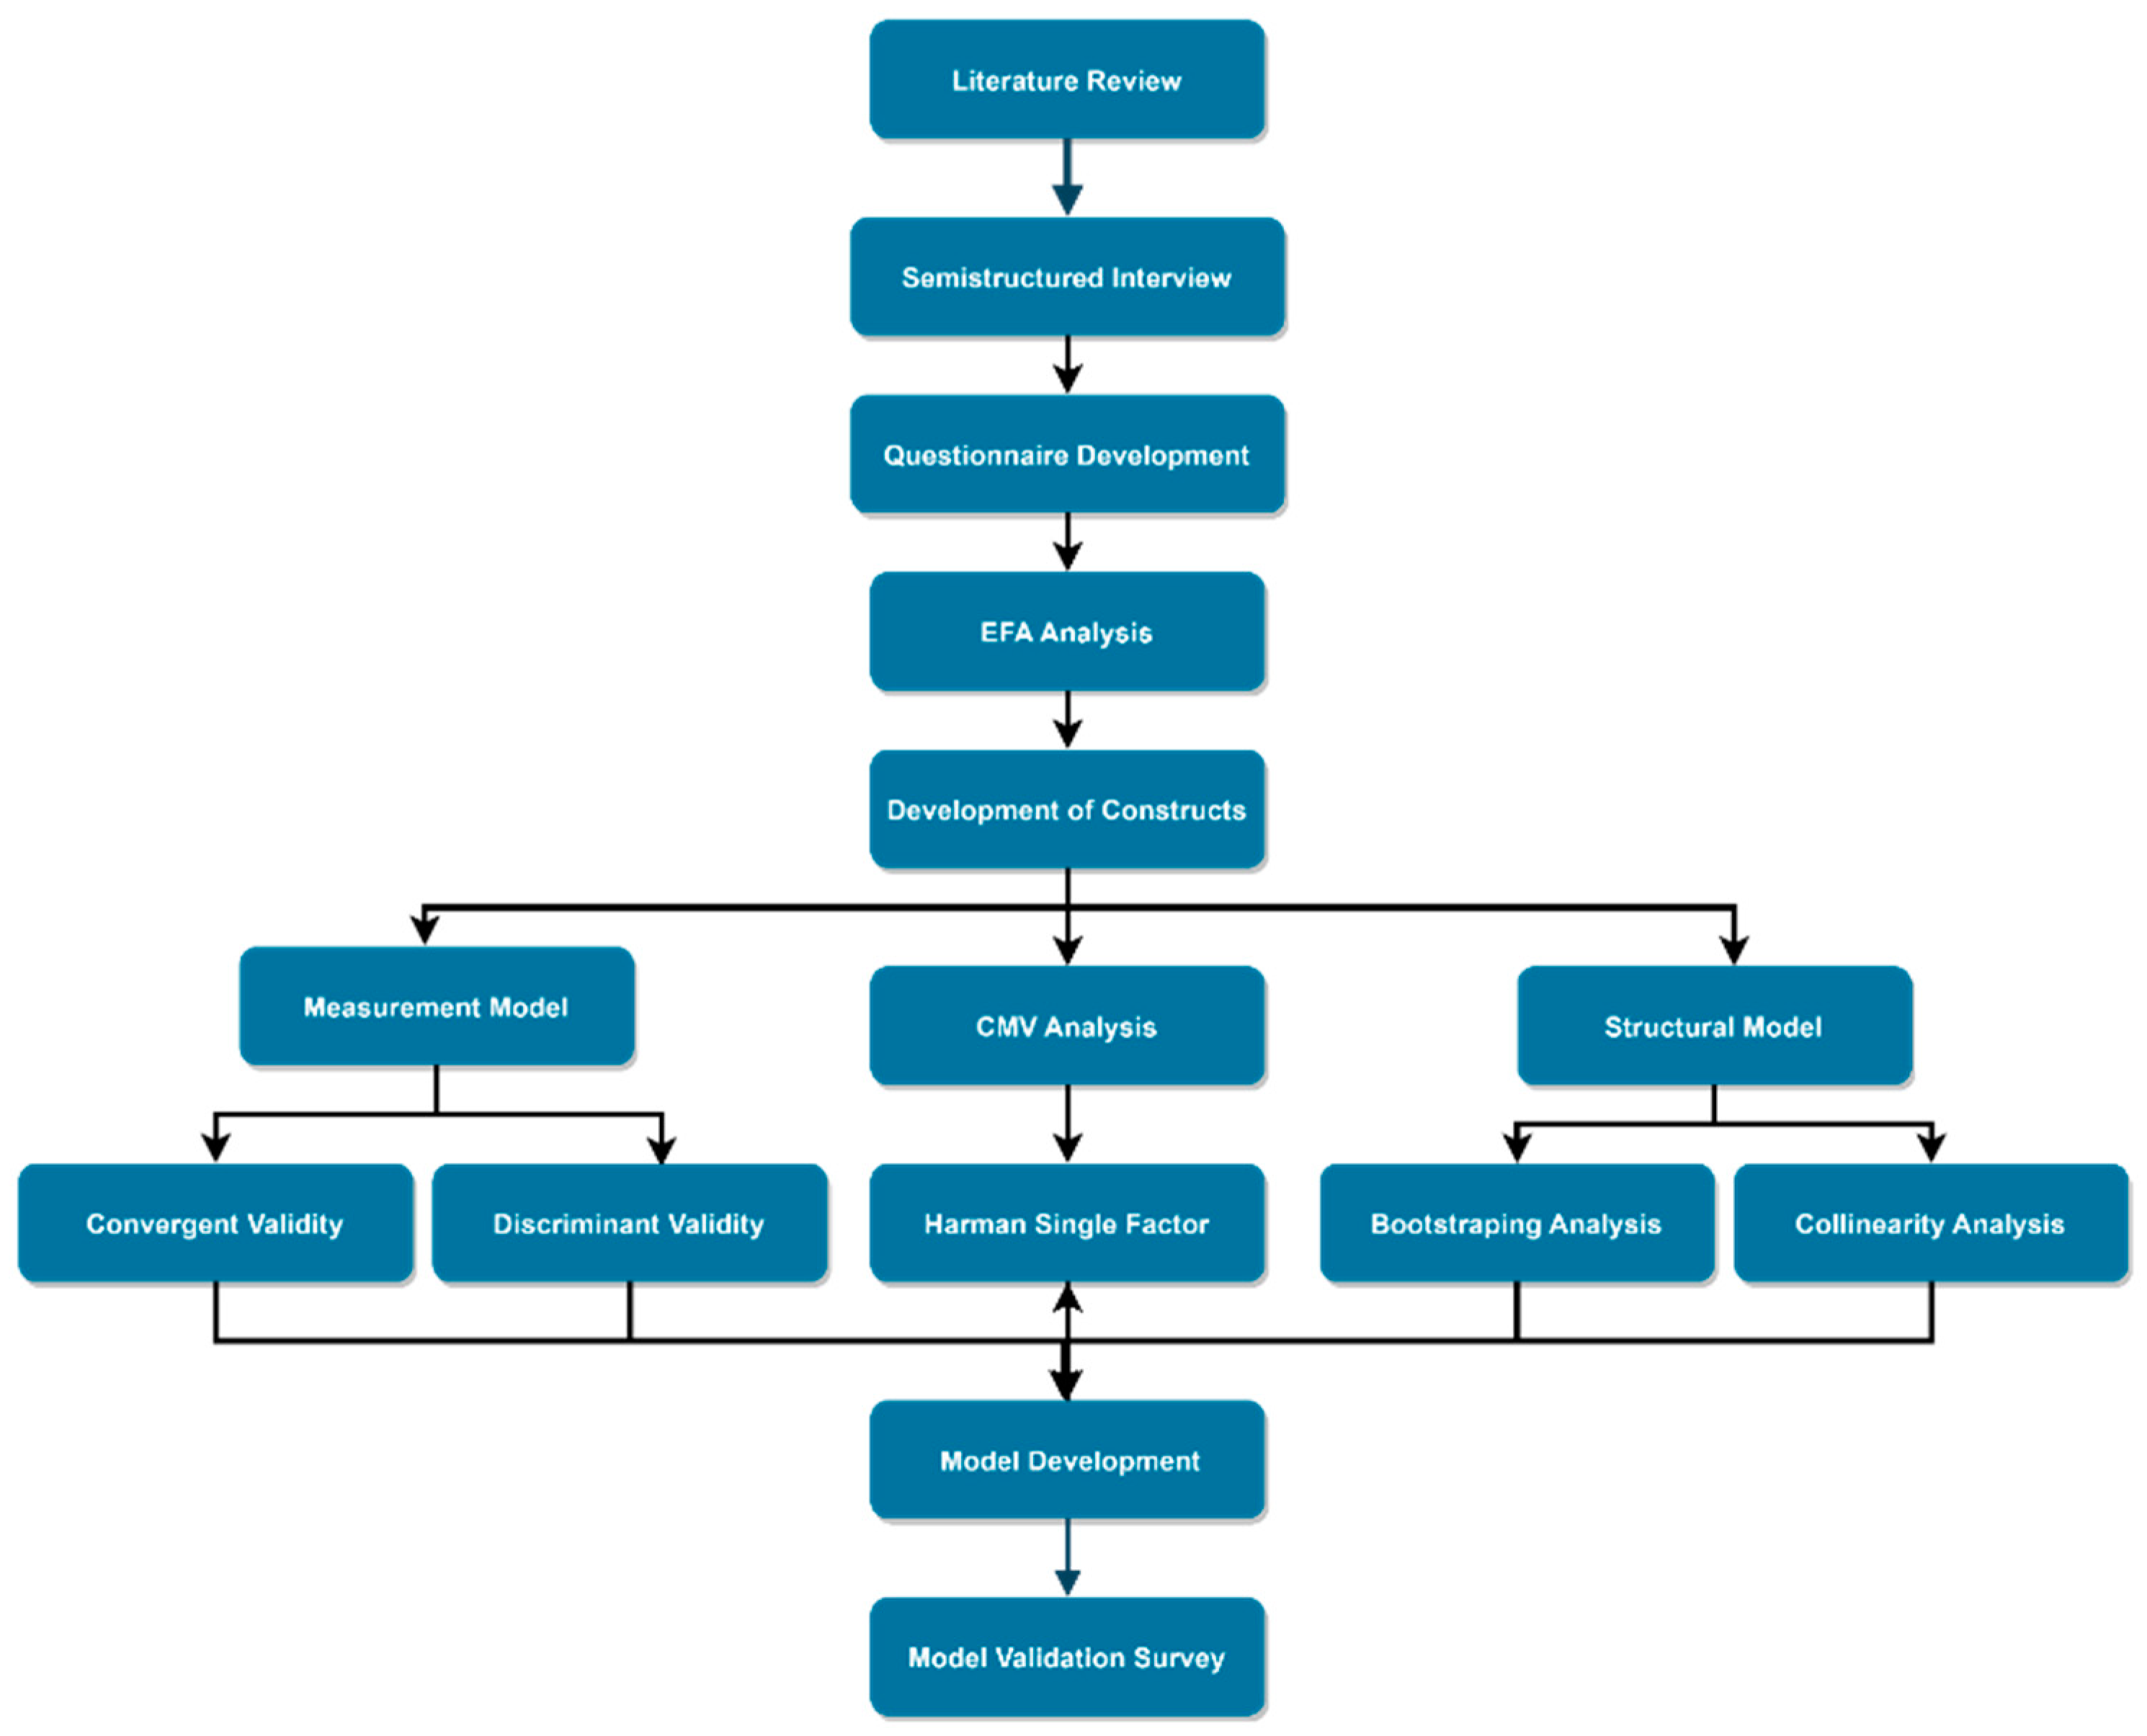
Overall, this study used a mixed-method research approach to identify and analyze the barriers to RPA implementation in the safety management of tall buildings, as indicated in
Figure 1. This approach included a literature review, semi-structured interviews, a pilot and main survey questionnaire, and SEM data analysis. The reason for using a mixed methodology study design is because of the research objective, which was focused on the assessment of barriers of implementing RPA in safety management of tall buildings. Because of the significant number of factors and SEM analysis approach involved, it was important to validate each stage till the most critical barriers are evaluated. That’s why expert interviews, a literature review, and questionnaires were involved. This research shed light on the difficulties and barriers that must be overcome before RPA may be used effectively in the safety management of tall structures. A detailed description of the tests conducted is presented in the following sections.
RPA barriers were evaluated from the literature and then investigated for significant barriers by pilot survey. EFA was used on pilot survey findings and then outcomes were used to develop the model by the main survey questionnaire and SEM. To begin, we did a thorough literature analysis to locate prior studies that examined the use of RPAs to manage tall building safety. Electronic databases, relevant journals, and conference proceedings were scoured for inclusion in the review [
33,
34]. Robotics process automation, safety management, high-rises, and barriers were some keywords people used to find this article [
35,
36].
Experts in the field were interviewed using semi-structured questions to help pinpoint the barriers. Experts in the area, especially those with expertise in the administration of tall building safety, were sought for the positions [
37,
38]. These experts possessed a deep understanding of RPA technologies, particularly in the context of safety management and tall buildings. Their practical experience in implementing RPA solutions in complex environments, specifically within the construction or facilities management industry, justified their inclusion in the research. This expertise allowed them to provide valuable insights into the challenges and opportunities associated with implementing RPA in the safety management of tall buildings. Moreover, their familiarity with relevant safety regulations and standards related to tall buildings enabled them to analyze the compliance requirements and identify potential barriers to RPA adoption [
39,
40]. Their expertise in risk management, process optimization, and change management further strengthened their ability to assess the barriers and propose effective solutions. Thus, their multidisciplinary perspective, combining technical knowledge, industry experience, and a comprehensive understanding of safety management practices in tall buildings, made them the ideal experts to contribute to the research on RPA implementation barriers.
A set of closed-ended questions served as the basis for the interviews. Based on content analysis of the interview replies, we found 21 barriers to adopting RPA for the safety monitoring of tall structures [
41,
42].
The identified 21 barriers were used to create a preliminary survey questionnaire. One hundred sixty-one people in Malaysia’s high-rise construction industry completed the survey. The people who took part in the study were chosen using a process of convenience sampling. The pilot survey ensured that the questionnaire was reliable and valid [
43]. Exploratory factor analysis (EFA) was used to assess the data from the pilot survey, with tests for reliability, normalcy, and mean score analysis. EFA was used to identify the underlying factors or dimensions among the barriers to RPA adoption identified from the literature review and expert interviews. It helps in reducing the number of variables and grouping them into meaningful factors for further analysis. The pilot survey’s findings were the basis for the final survey’s question [
44,
45]. The 21 barriers found in the research literature and semi-structured interviews were among the 35 questions on the survey [
46,
47]. Two hundred thirty-one people in Malaysia’s high-rise construction industry completed the study. Using a method of random stratification, the participants were chosen. The primary survey questionnaire data was examined employing structural equation modelling (SEM) [
48,
49]. A quick validity poll gathered experts’ opinions on the model’s accuracy [
50,
51]. Barriers to RPA deployment in tall building safety management were identified using SEM findings and incorporated into a final framework [
52,
53]. The most important obstacles to RPA deployment in the safety management of tall buildings were identified using the framework, which might aid in creating efficient methods for overcoming these barriers.
The identification of experts was conducted through a rigorous process that took into account their professional backgrounds and extensive experience in the field of safety management specifically pertaining to tall buildings. Semi-structured interviews were conducted with the participants, and these interviews were recorded in audio format and transcribed verbatim. The data obtained from the interviews underwent content analysis, wherein the information was coded to recognize and classify the hindrances to the adoption of RPA. The study conducted a comparative analysis of the barriers identified in the literature review and expert interviews, highlighting their similarities and differences. The utilization of a mixed-methods approach facilitated the triangulation of data, thereby enabling a more comprehensive comprehension of the impediments to the adoption of RPA for safety management in high-rise structures.
5. Identification of Challenges
Two methodologies were used to determine the barriers to robotics process automation (RPA) application in the safety management of tall structures. First, a comprehensive literature search was undertaken utilizing academic databases such as Springer, WoS, ASCE, ScienceDirect, Scopus, and Google Scholar, whose summary is indicated in
Table 1. The study uncovered several barriers associated with deploying RPA in the safety management of tall structures, including the complexity of safety management in tall buildings. Lack of rules and regulations, absence of data and personal information security safeguards, issues about legal liability, and safety management personnel, who are responsible for the safety of the workers, needing greater technical assistance in order to employ the appropriate equipment have been expressed. In the construction industry, technology that does not correspond to the already recognized safety requirements is unacceptable, due to a lack of online security management resources, lack of leadership, and unwillingness to assume responsibility; affecting cost, time, and quality negatively. Emerging sectors of innovation face issues with technical growth and a dearth of knowledge, the refusal of customers to pay more for safety insurance as a result of technology advancements, and existing technologies suffering from inefficiency. An ageing workforce hinders the capacity to adjust to novel circumstances, and robotic process automation and its associated complexity, as does inadequate education, and virtual learning. The cost involved with implementing new technology, unwillingness to change, the purpose of the procedure is safety. To be feasible, staff training would need to be cost-effective. Insufficient government assistance is another barrier, while the market’s competitive forces restrict the possibility for profit. The market’s competitive forces curtail the potential for gain, as do cybersecurity threats, and the lack of human judgement and knowledge.
Secondly, semi-structured interviews with stakeholders, including safety managers, building managers, and RPA specialists, were undertaken. The interviews gave more insight into the barriers to using RPA in the safety management of tall structures and underlined the need for stakeholder participation. The discussions also indicated the necessity of overcoming cultural hurdles to adoption, and the need for effective training and instruction on RPA technology [
40,
54]. Literature analysis and semi-structured interviews offered a full grasp of the issues and barriers to RPA deployment in tall building safety management. The final identified challenges are presented in
Table 2.
5.1. Exploratory Factor Analysis
5.1.1. Reliability and Normality Analysis
The reliability and consistency of a scale or test may be determined by calculating its Cronbach’s alpha. This metric measures how well items on a scale or test assess the same concept or feature. Cronbach’s alpha may take on a value between 0 and 1, with higher values suggesting more consistent results. Research acceptability often begins at a score of 0.7 or above.
On the other hand, the Shapiro-Wilk Normality test is a statistical method for checking whether data in a given sample follows a normal distribution [
49,
65]. The assumption that the data is regularly distributed is put to the test. If the
p-value is larger than 0.05, there is insufficient evidence to reject the null hypothesis (that the data follows a normal distribution). However, when the
p-value is less than 0.05, the data is not normally distributed, and the null hypothesis may be rejected [
39,
54]. Important statistical analyses in the field of research include Cronbach’s alpha and the Shapiro-Wilk Normality test. Data reliability and consistency may be checked using Cronbach’s alpha, and normality can be matched with the Shapiro-Wilk Normality test, both presuppositions of many statistical studies.
5.1.2. Mean Score Analysis and Kruskal Wallis Analysis
The results of a survey or questionnaire may be analyzed statistically using a procedure called mean score analysis. Finding the average answer to each study or questionnaire requires a similar calculation [
66,
67]. The participants’ results on various items may be summarized and compared using mean score analysis. It may also be used to prioritize questions in a questionnaire or survey. Kruskal-Wallis is the test to employ if there is a need to compare the medians of three or more different groups [
68,
69]. Parametric ANOVA assumes that the data follows a normal distribution as an alternative to non-parametric ANOVA. Kruskal-Wallis analysis is more reliable than ANOVA when the data is not normally distributed or includes outliers since it makes no such assumptions [
70,
71]. Kruskal-Wallis analysis is performed in the case of an ordinal or continuous dependent variable and a categorical independent variable with more than two levels. The test looks for statistically significant differences by comparing the median positions of the groups. No statistically significant difference exists between the groups’ median rankings; this is the null hypothesis [
72,
73]. Statistical approaches like mean score analysis and Kruskal-Wallis testing are crucial in scientific investigations. Kruskal-Wallis analysis compares the median values of two or more separate groups, whereas mean score analysis summarizes and compares participants’ replies to various items in a survey or questionnaire [
74]. Kruskal-Wallis is non-parametric and makes no assumptions about the data distribution, whereas mean score analysis is parametric and assumes a normal data distribution.
5.1.3. KMO and Bartlett’s Test
Common statistical tests used to determine whether data is suitable for factor analysis include the Kaiser-Meyer-Olkin (KMO) and Bartlett’s tests. Bartlett’s test determines whether the correlation matrix of variables is an identity matrix, whereas the KMO test examines the sampling adequacy of variables in the dataset. The factorability of the data from the pilot survey was analyzed here using the KMO and Bartlett’s tests [
64]. For the factor analysis to be valid, the KMO test statistic must be more than 0.6, and a
p-value of less than 0.05 in Bartlett’s test must be reached to reject the null hypothesis. These checks bolstered the data’s suitability for factor analysis and revealed the significance of the factors.
5.1.4. Component Matrix Formation
Factors in a dataset may be discovered using exploratory factor analysis (EFA), a statistical technique. This data reduction method aims to find the fewest possible variables that account for the most variation in the data. Being an experimental technique, EFA does not assume anything is happening [
63]. The findings of the pilot poll were used to run EFA with a Varimax rotation. The Varimax orthogonal rotation approach is often used to optimize the factor loadings variation. It aids understanding by making issues clearer and less intertwined. Each variable’s factor loading indicates how strongly it is correlated with that factor [
61,
62]. Indicators of an element are variables that have strong factor loadings on that factor. An eigenvalue larger than 1 criterion and the scree plot are used to decide how many original elements to keep [
59,
60]. The number of factors, how to interpret them, and which variables load on each aspect are all shown in the EFA findings. Based on the findings, a trustworthy instrument for gauging the challenges of implementing robotics process automation (RPA) in Tall Buildings’ Safety Management may be constructed.
5.2. Structure Equation Modeling
Structural equation modeling (SEM) aims to empirically test and verify theoretical models that account for the interrelationships of many variables. This research examined the connection between barriers and RPA implementation in the safety management of tall buildings using the primary questionnaire responses. There were two components to the SEM analysis: the measurement model and the structural model. The validity and trustworthiness of the measurements were evaluated using the measurement model [
57,
58]. Average variance extracted (AVE) and composite reliability (CR) criteria were used to examine convergent and discriminant validity. The internal consistency of the constructs was evaluated using the Cronbach alpha reliability test. The discriminant validity was assessed using the Fornell-Larcker criteria [
55,
56]. To examine the discriminant validity of the constructs, an HTMT (Heterotrait-Monotrait) analysis was used. To be discriminantly valid, the HTMT ratio has to be under 0.90.
The postulated connections between the barriers and RPA deployment were tested using the structural model. Using structural path analysis, we calculated predicted route coefficients and confidence intervals [
62,
74]. Based on the findings, a conceptualization of the challenges associated with using RPA for safety management in tall buildings was created. Structural equation modeling (SEM) provides a robust statistical method for evaluating sophisticated theoretical models. To examine the hypothesized connections between the barriers and RPA implementation, this research used the measurement and structural models to assess the measurements’ reliability and validity [
57,
58]. The findings demonstrated that the barriers significantly hampered RPA deployment. This research may be utilized better to apply RPA for the safety management of tall structures and overcome the obstacles that have been identified. The model was validated by a short survey involving 13 experts, and only the 5 following questions was asked. The measurement scale was from 1 to 5, with 5 being the highest satisfaction.
Rate the validity and accuracy of the method adopted in the analysis to form the framework.
Rate the accuracy of the presented significance of constructs with the latent variable.
Rate the validity of the hypothesis according to your experience in the construction industry.
Rate the validity of each barrier included in the framework.
Rate the validity of future significance of this framework in tall building construction.
6. Results and Analysis
6.1. Reliability and Normality of Data
Cronbach’s alpha and the Shapiro-Wilk normality tests were run on the data from the pilot survey, and their results are shown in
Table 3. Cronbach’s alpha ratings for the questionnaire questions varied from 0.856 to 0.876, demonstrating strong internal consistency and reliability. All test variables exhibited
p-values significantly lower than 0.05 when tested using the Shapiro-Wilk normality test, suggesting that the data were not normally distributed [
55,
56]. The findings as a whole imply that the pilot survey data is trustworthy for further study, and this may need the use of non-parametric statistical tests.
6.2. Mean Score Ranking of Barriers
The findings of the mean score analysis for each survey question are shown in
Table 4. Each code’s average, median, rank, and standard deviation are shown in the table. Kruskal-Wallis test
p-values, which were used to compare the replies of several groups based on education, experience, and occupation, are also included. The mean score is an item’s average rating from all responses [
60,
61]. The median score indicates the midpoint, while the rank reveals where each code falls concerning the mean. The dispersion of the answers is represented by the standard deviation [
63,
74]. Whether there are statistically significant variations in the replies of various groups for each question is shown by the
p-values for the Kruskal-Wallis tests. The greater the significance of a difference, the smaller the
p-value.
Table 4 is helpful since it offers the variation in answers among groups and the overall distribution for each question.
6.3. Exploratory Factor Analysis (EFA)
Kaiser-Meyer-Olkin (KMO) and Bartlett’s sphericity test results are shown in
Table 5. The KMO score of 0.858 exceeds the minimum threshold of 0.6 required for factor analysis. There is a statistically significant correlation between the variables in the dataset, as shown by the chi-square value of 1559.139 for Bartlett’s test of sphericity, with 212 degrees of freedom and a significance level of 0.000. This proves that factors that explain the relationship between the variables may be isolated using factor analysis. These findings are consistent with the data suitable for factor analysis.
Factor analysis was performed on the survey data, and the rotated component matrix is shown in
Table 6. The study was conducted to determine which variables account for the observed differences in answers across the 21 questions (items C1–C21). The matrix displays the loadings of the questionnaire items onto the five components that were determined to best describe the data. We rotated the components to make the structure more understandable [
60,
62]. Most items in the questionnaire were found to have significant loadings on a single component, suggesting that they were all related to the same underlying issue. The first component has a high loading for the items C11, C14, C4, C9, and C5, which may be read as ’Project Planning and Scheduling.’ High loadings on the aforementioned ‘Cost Management and Budgeting’ component are also seen in codes C3, C7, C13, and C2. If given items do not load strongly on any of the five elements, it is probably not very relevant to deciphering the underlying causes. For instance, every component experiences heavy demand while processing the C8, C20, C12, or C16. C6 and C17, on the other hand, place heavy emphasis on the fifth factor. Overall the elements that explain the differences in respondents’ answers may be summed up in a few words using the rotated component matrix [
59,
61]. The matrix may be used as a roadmap for creating a questionnaire that probes these areas of concern or pinpointing weak spots in current project management methods.
The EFA identified five distinct barriers, given descriptive names in
Table 7. Technology, economy, legislation, privacy, and resources describe these elements.
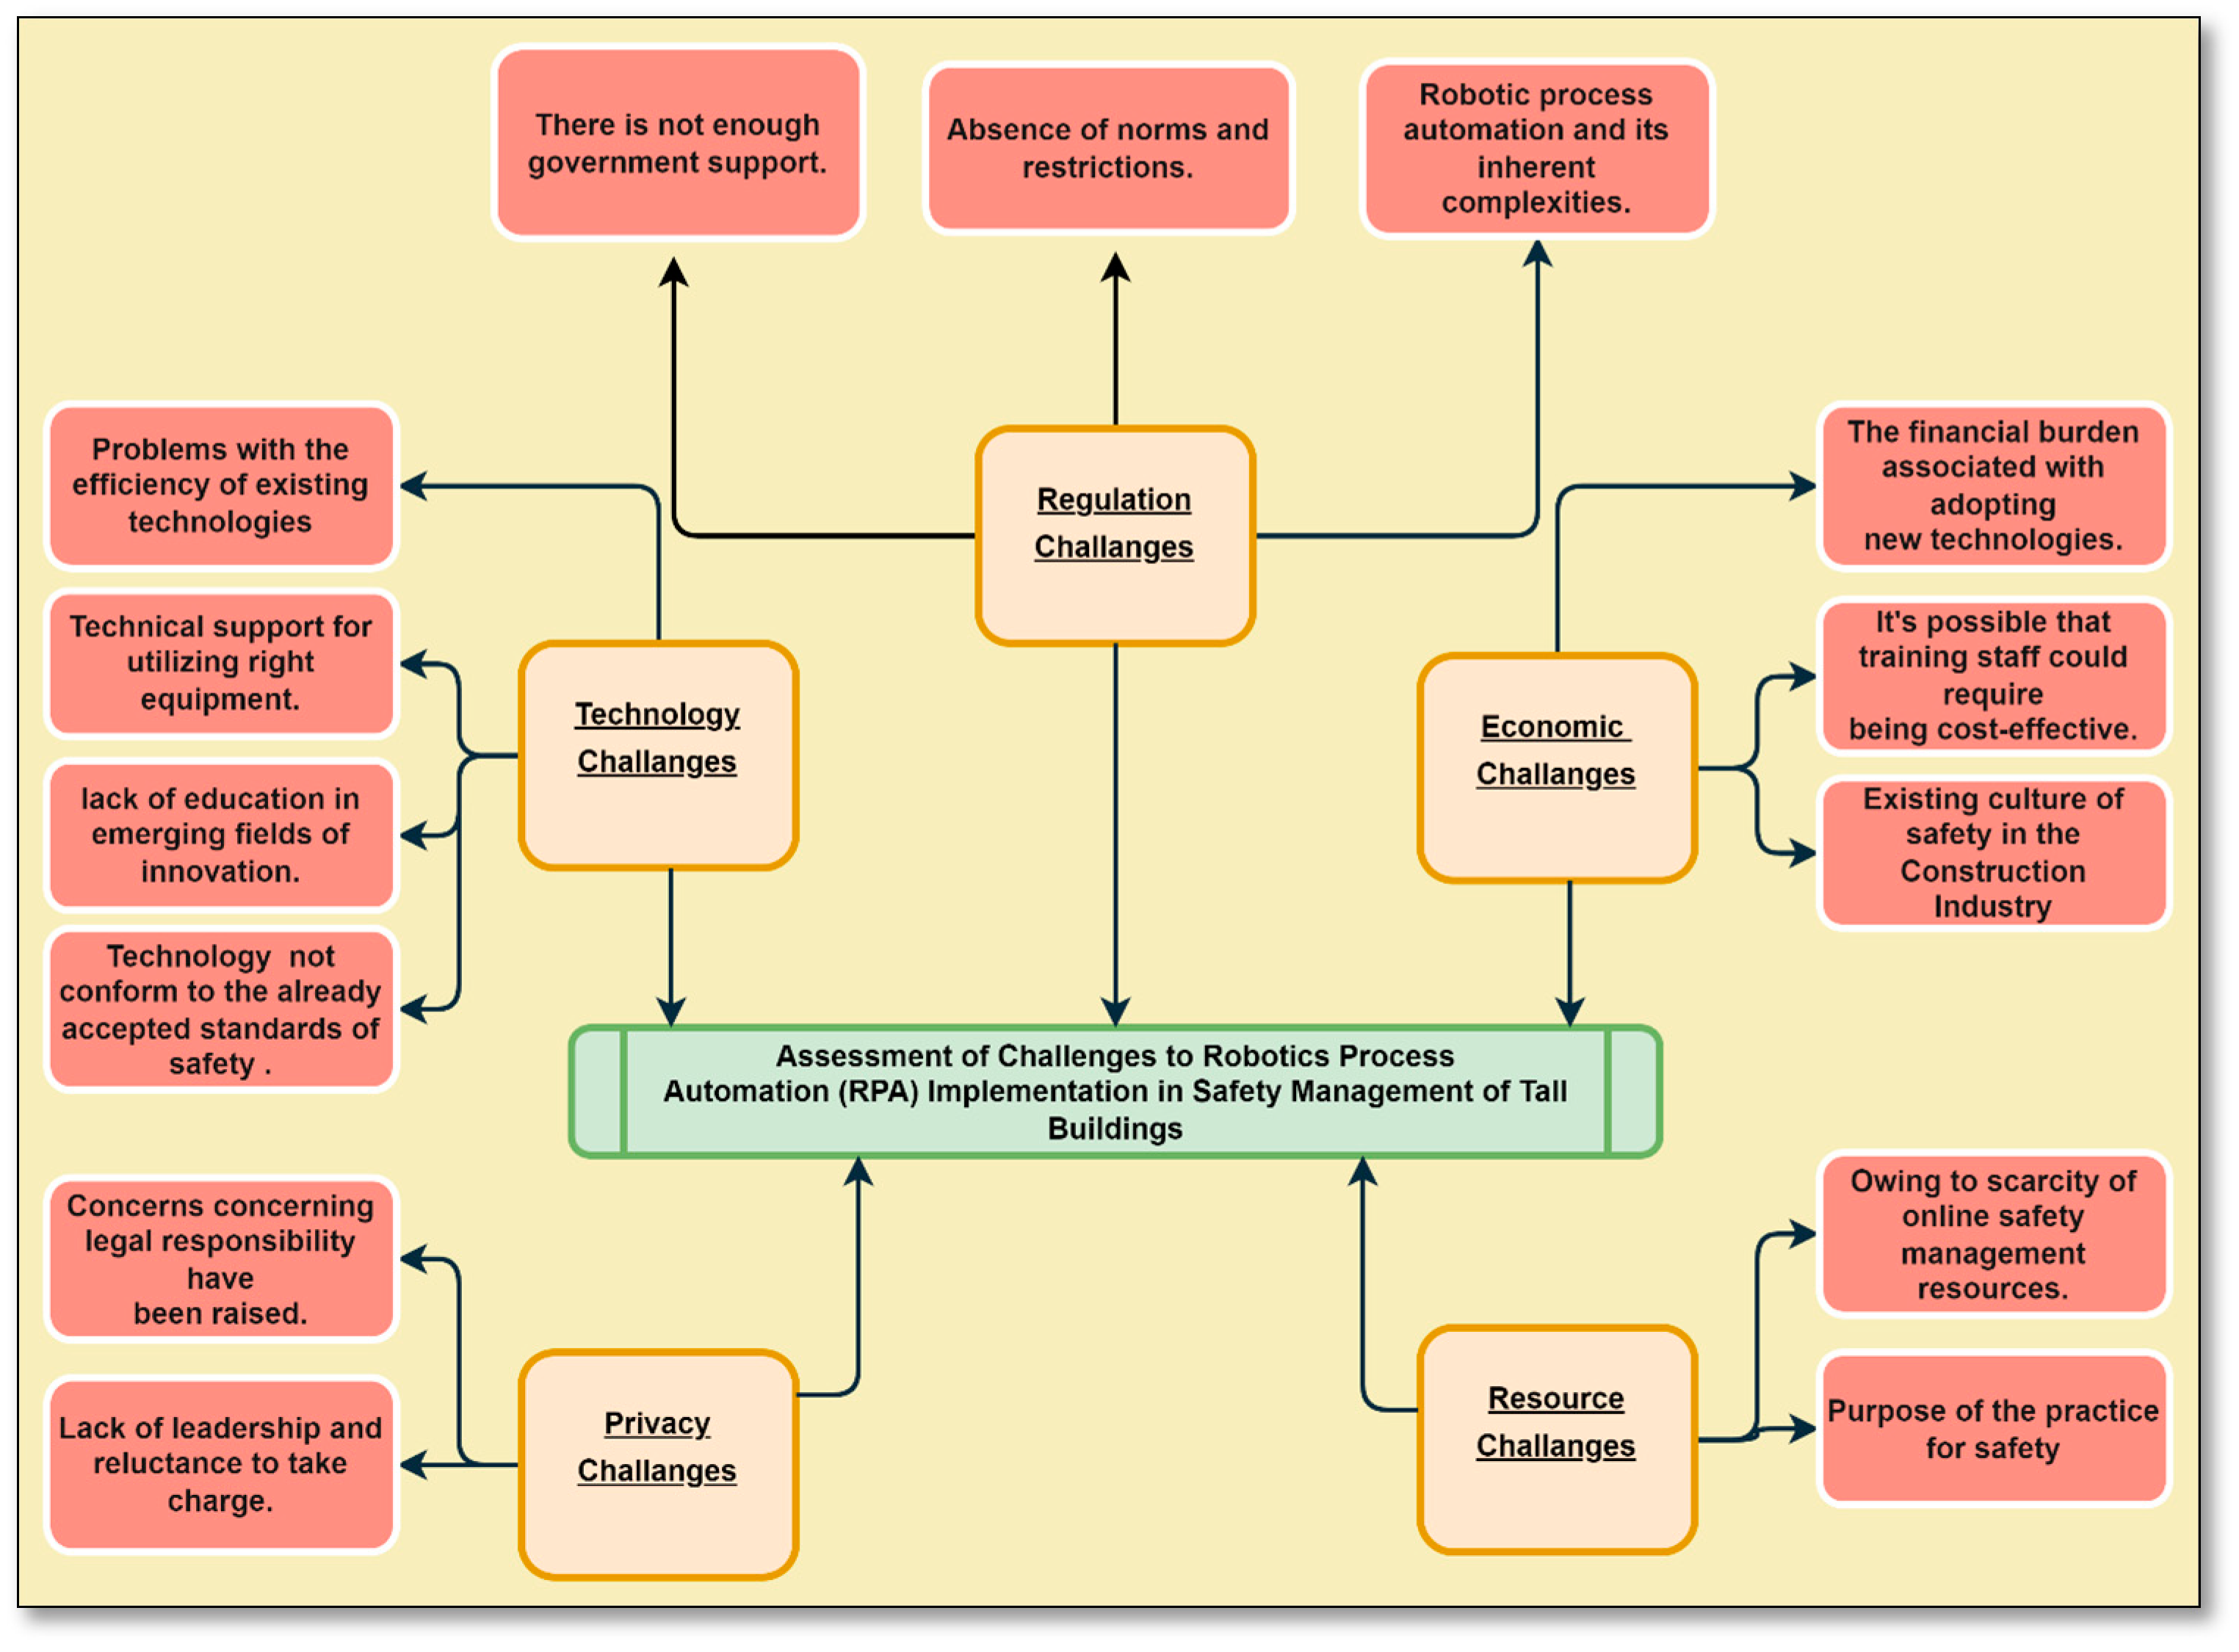
Inadequate knowledge and virtual education, the need for greater technical assistance for safety management employees, challenges with technological progress, and nonconformity to established safety standards all fall under the Technology construct (Subgroup Mean = 3.18, Subgroup Rank = 3).
Costs associated with adopting new technologies, customers’ reluctance to pay more for safety insurance as a result of technological advancements, the efficiency with which staff can be trained, and the preexisting safety culture in the construction industry are all factors in the Economic construct (Subgroup Mean = 3.21, Subgroup Rank = 2).
The complexity of robotic process automation, the lack of established standards and regulations, and the absence of government assistance all contribute to the Regulation construct (Subgroup Mean = 3.35, Subgroup Rank = 1).
Concerns about legal liability, a lack of leadership, and an unwillingness to act contribute to the Privacy construct (Subgroup Mean = 2.76, Subgroup Rank = 5), as do insufficient guarantees of data and personal information protection.
The resources framework factors in issues like a lack of online safety management resources and the need for the practice to improve security (Subgroup Mean = 3.16, Subgroup Rank = 4).
In sum, the EFA-derived constructs illuminate the most significant challenges to advancing the use of new technologies in the building sector. They will help pinpoint actionable methods to push for adopting innovative technology in the construction sector that improves safety.
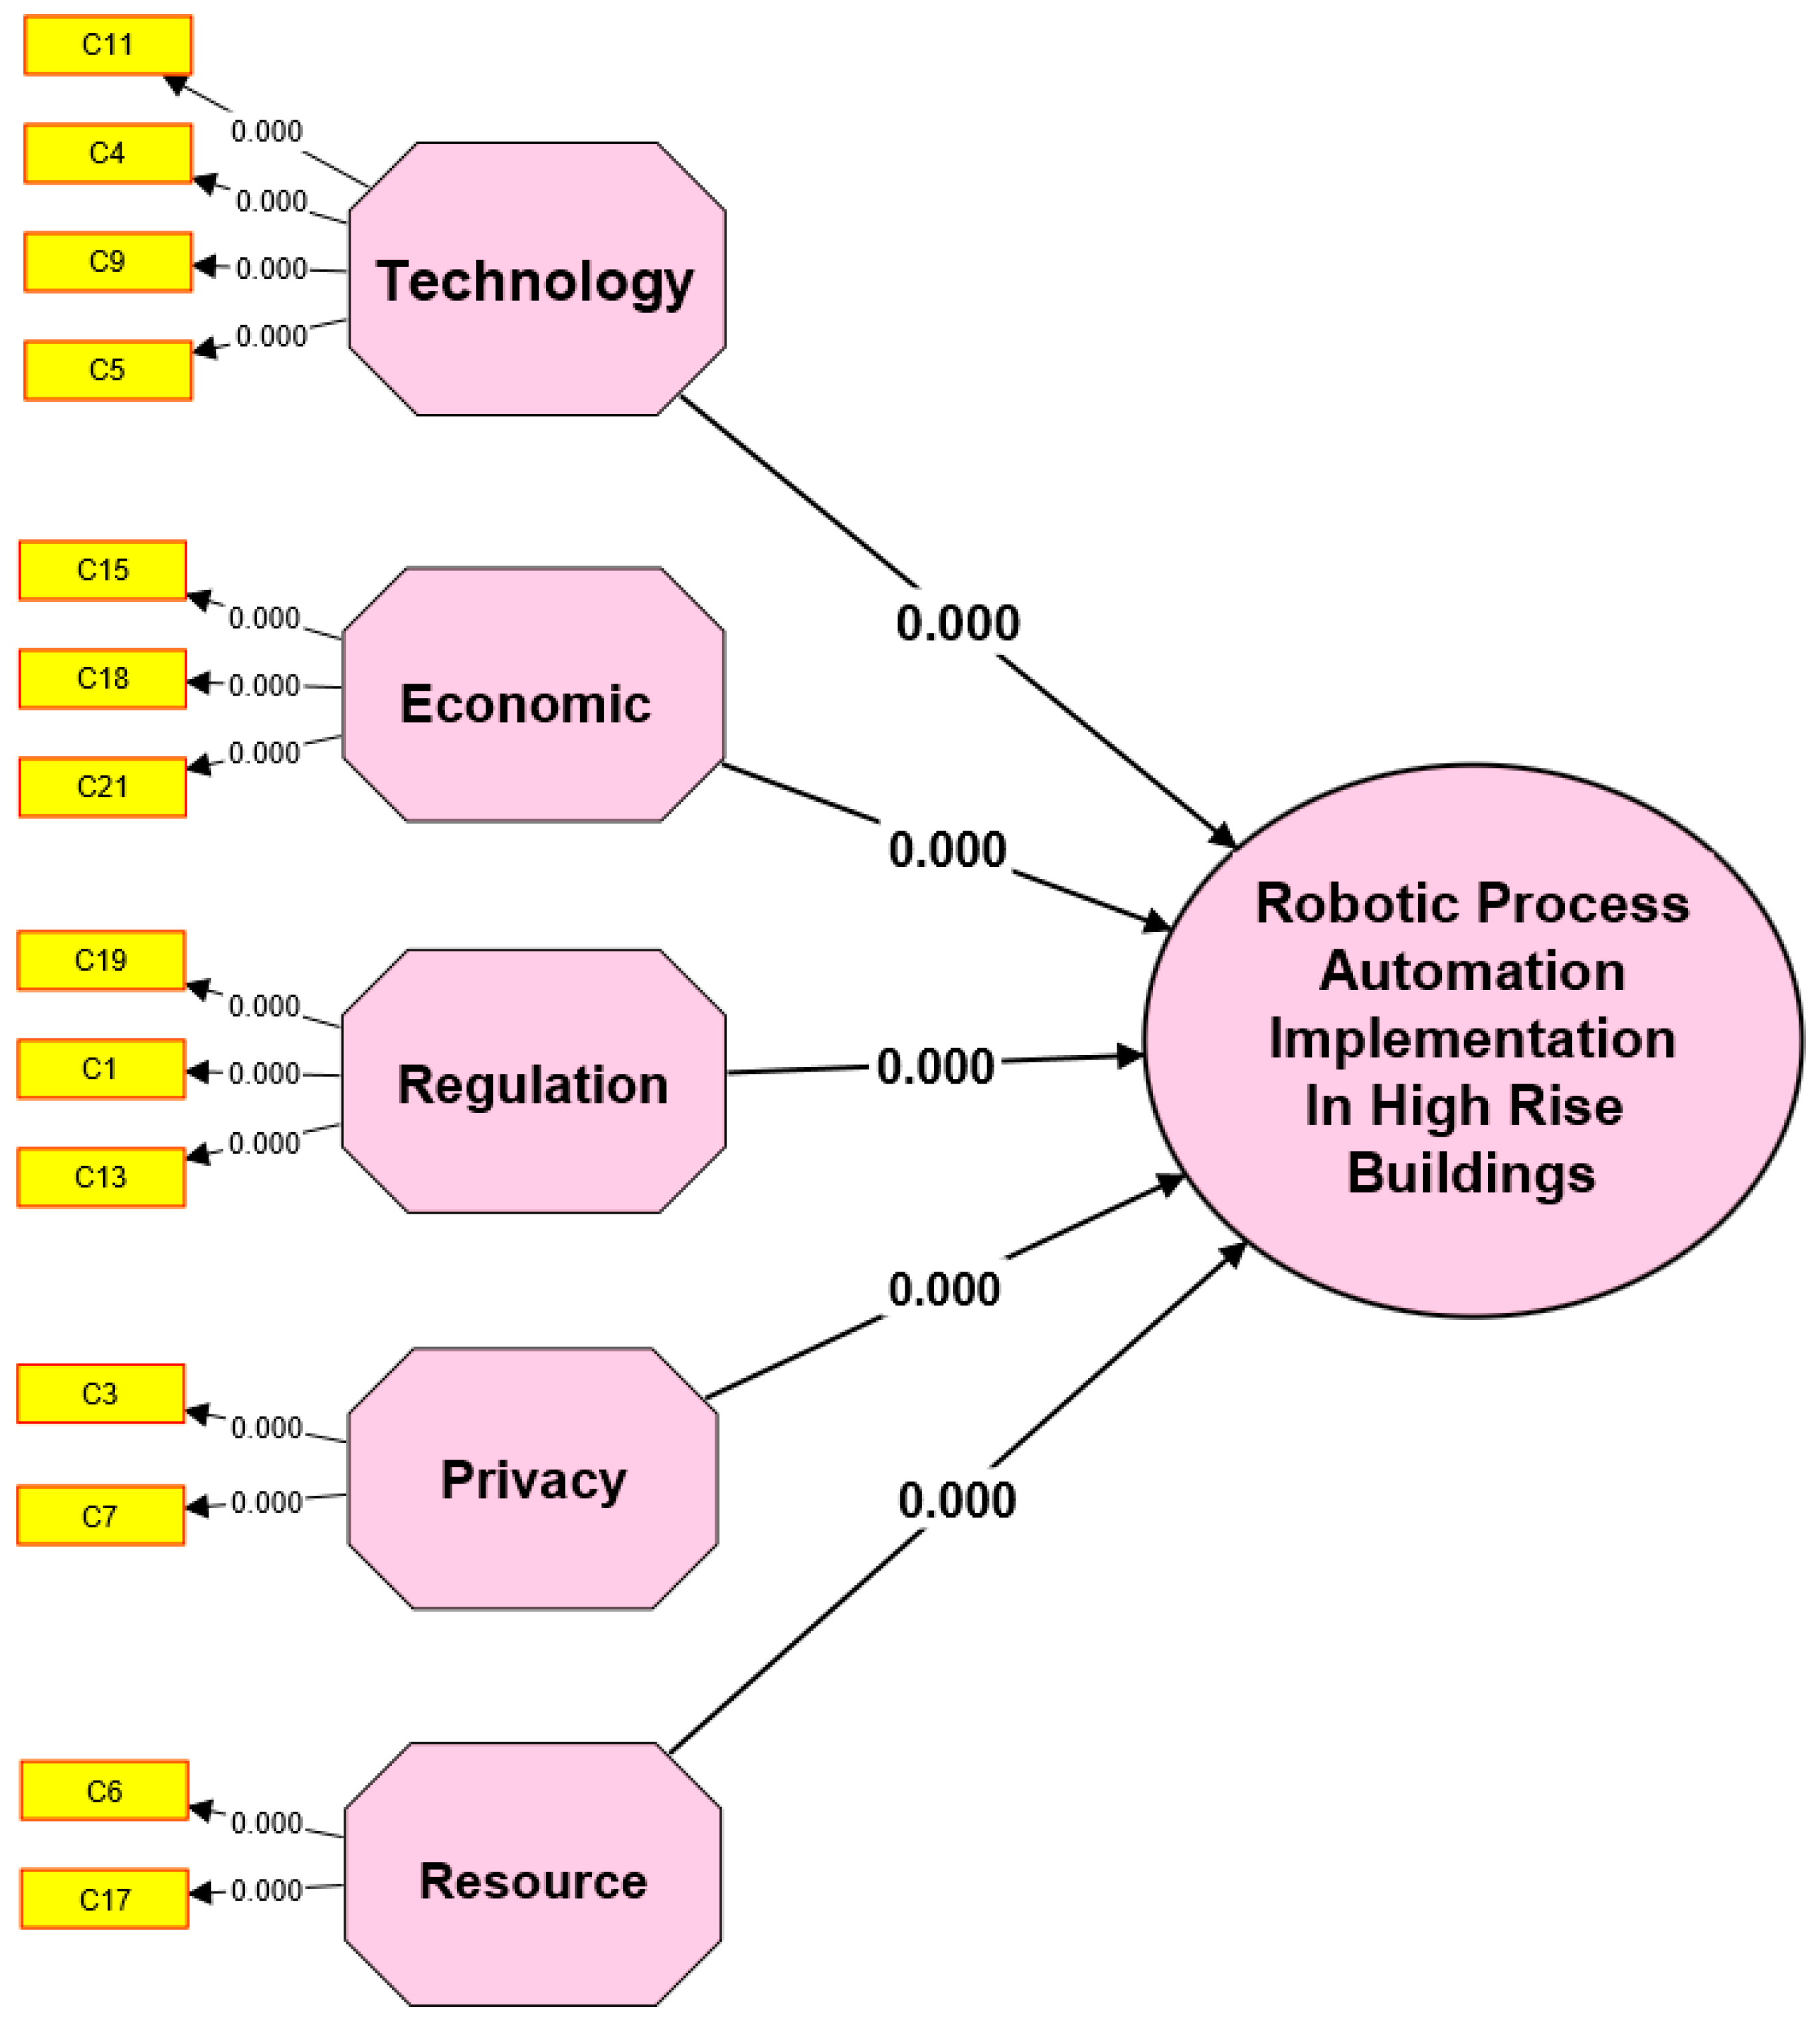
The following hypotheses were formulated based on EFA results, and the hypothesized framework is indicated in
Figure 2.
H1: Technology-related barriers strongly impact RPA implementation for safety management in tall buildings.
H2: Economic-related barriers strongly impact RPA implementation for safety management in tall buildings.
H3: Regulation-related barriers strongly impact RPA implementation for safety management in tall buildings.
H4: Privacy-related barriers strongly impact RPA implementation for safety management in tall buildings.
H5: Resource-related barriers strongly impact RPA implementation for safety management in tall buildings.
6.4. Demographics
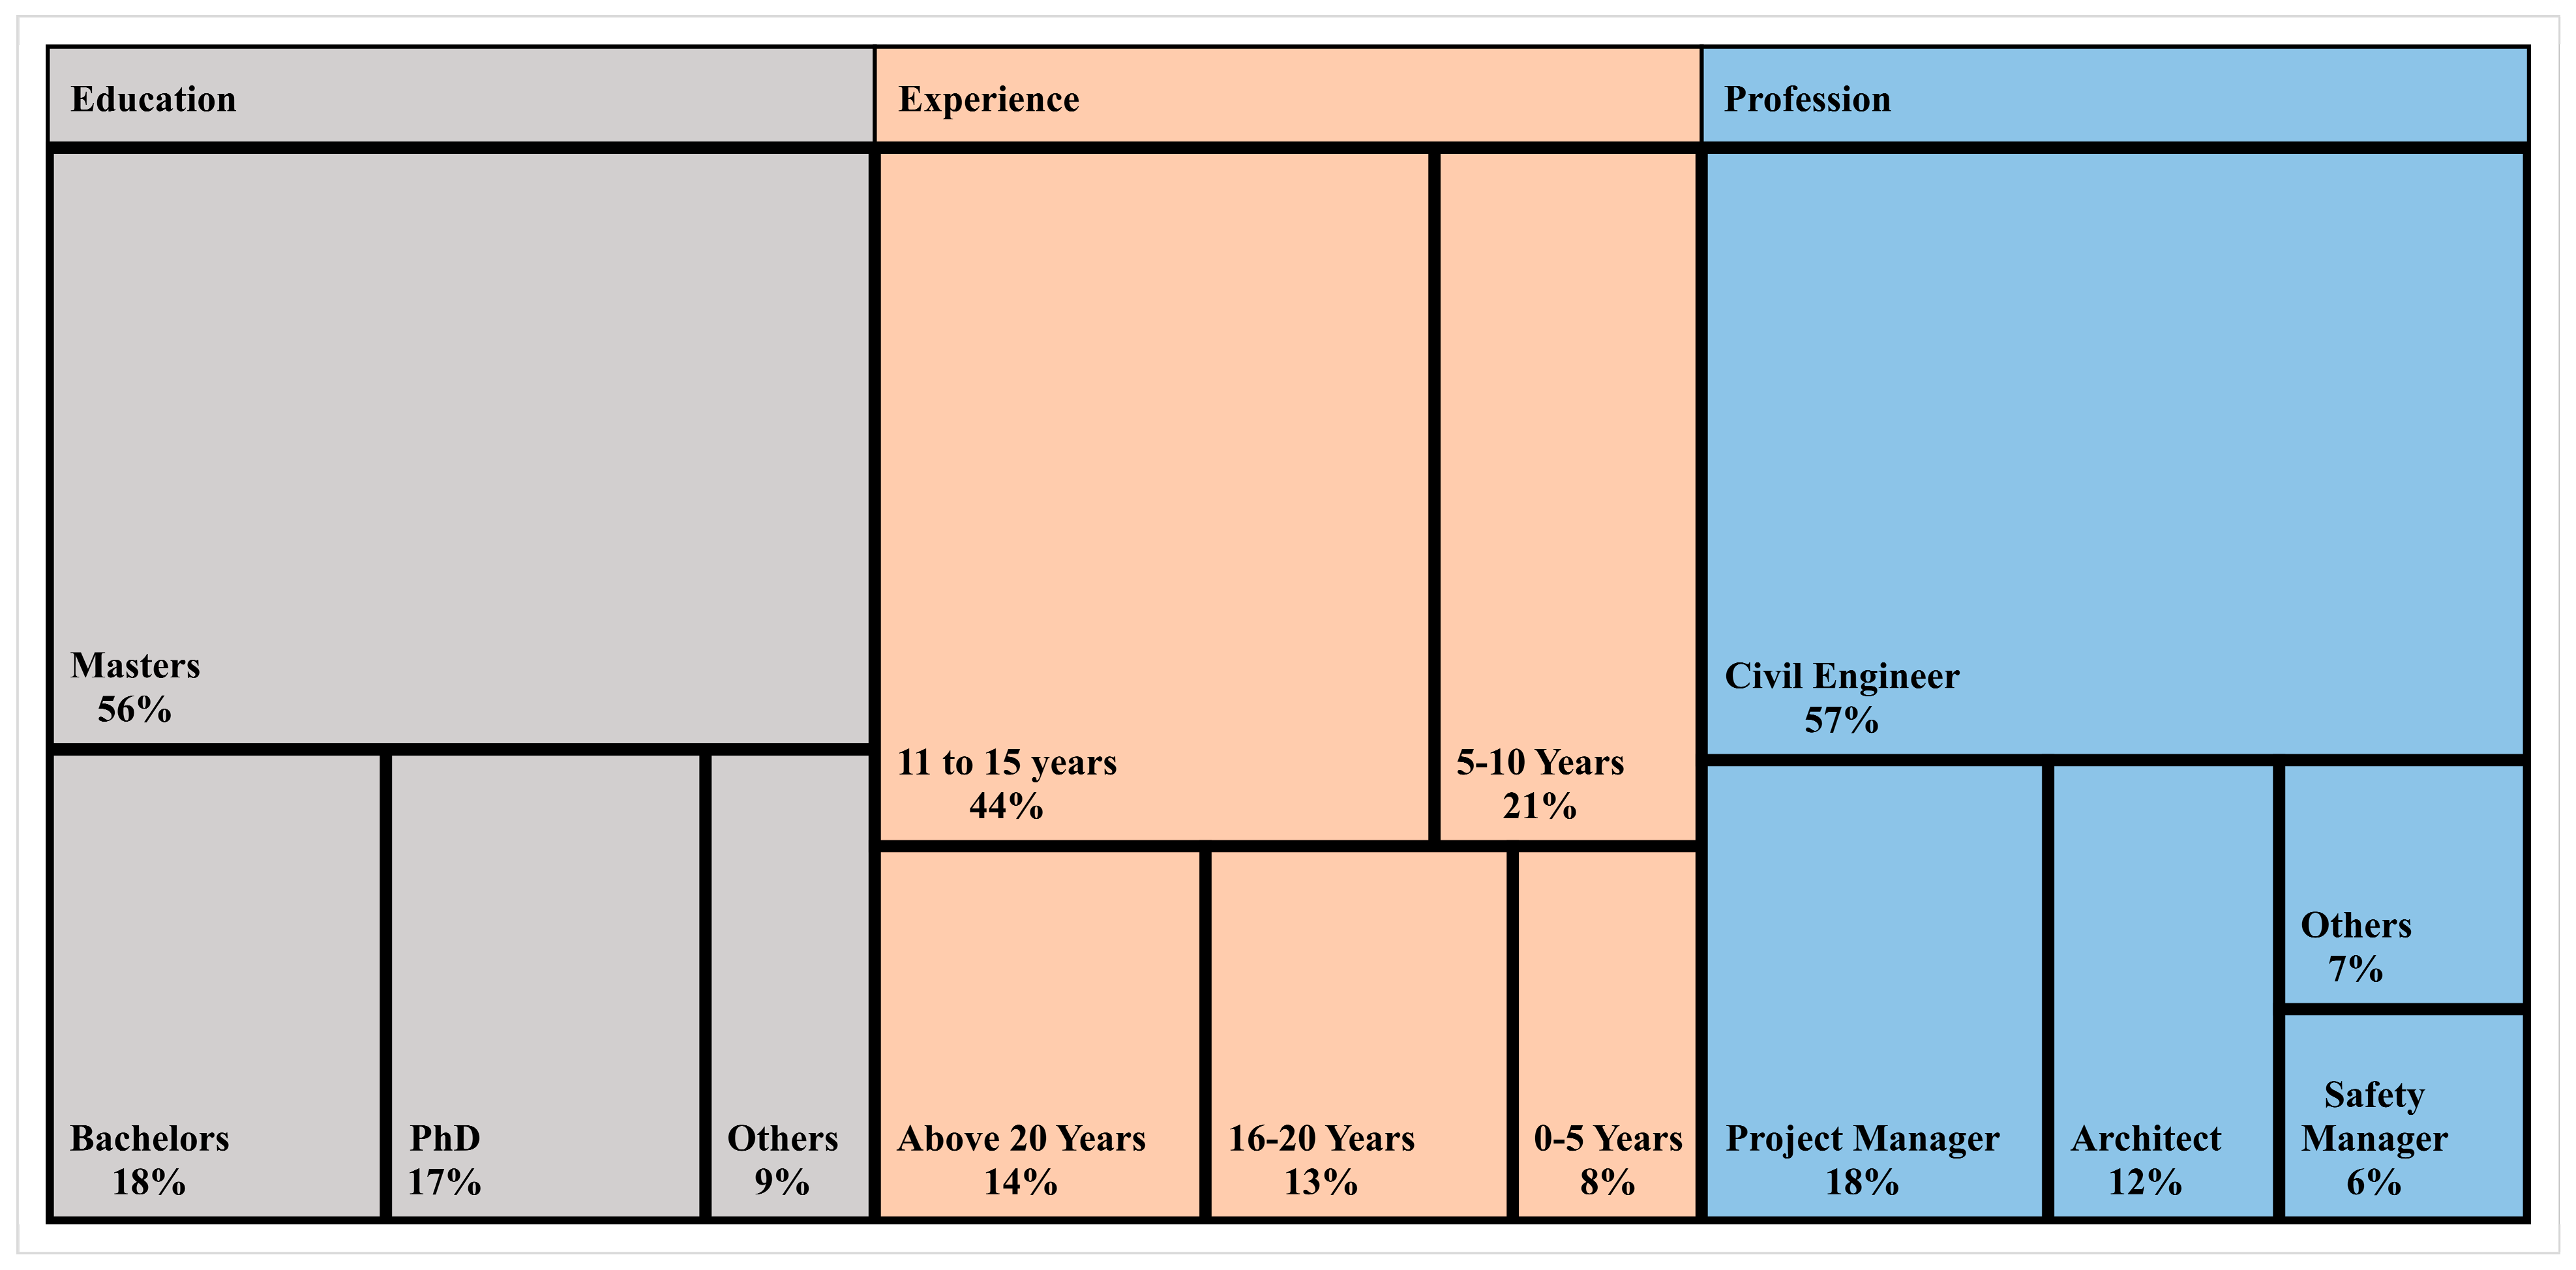
According to the demographic data from the primary survey questionnaire in
Figure 3, 56% of respondents had earned a master’s degree, while 17% had earned a doctorate. Most respondents (44%) had between 11 and 15 years of experience, while the next biggest group (21%) had between 5 and 10 years of experience. Most responders (57%) identified as civil engineers, followed by project managers (18%). Understanding the survey’s findings in the context of the intended audience is facilitated by these demographic findings about the respondents.
6.5. Structure Equation Modeling (SEM)
6.5.1. Measurement Model
Statistics on the reliability and validity of the model are shown in
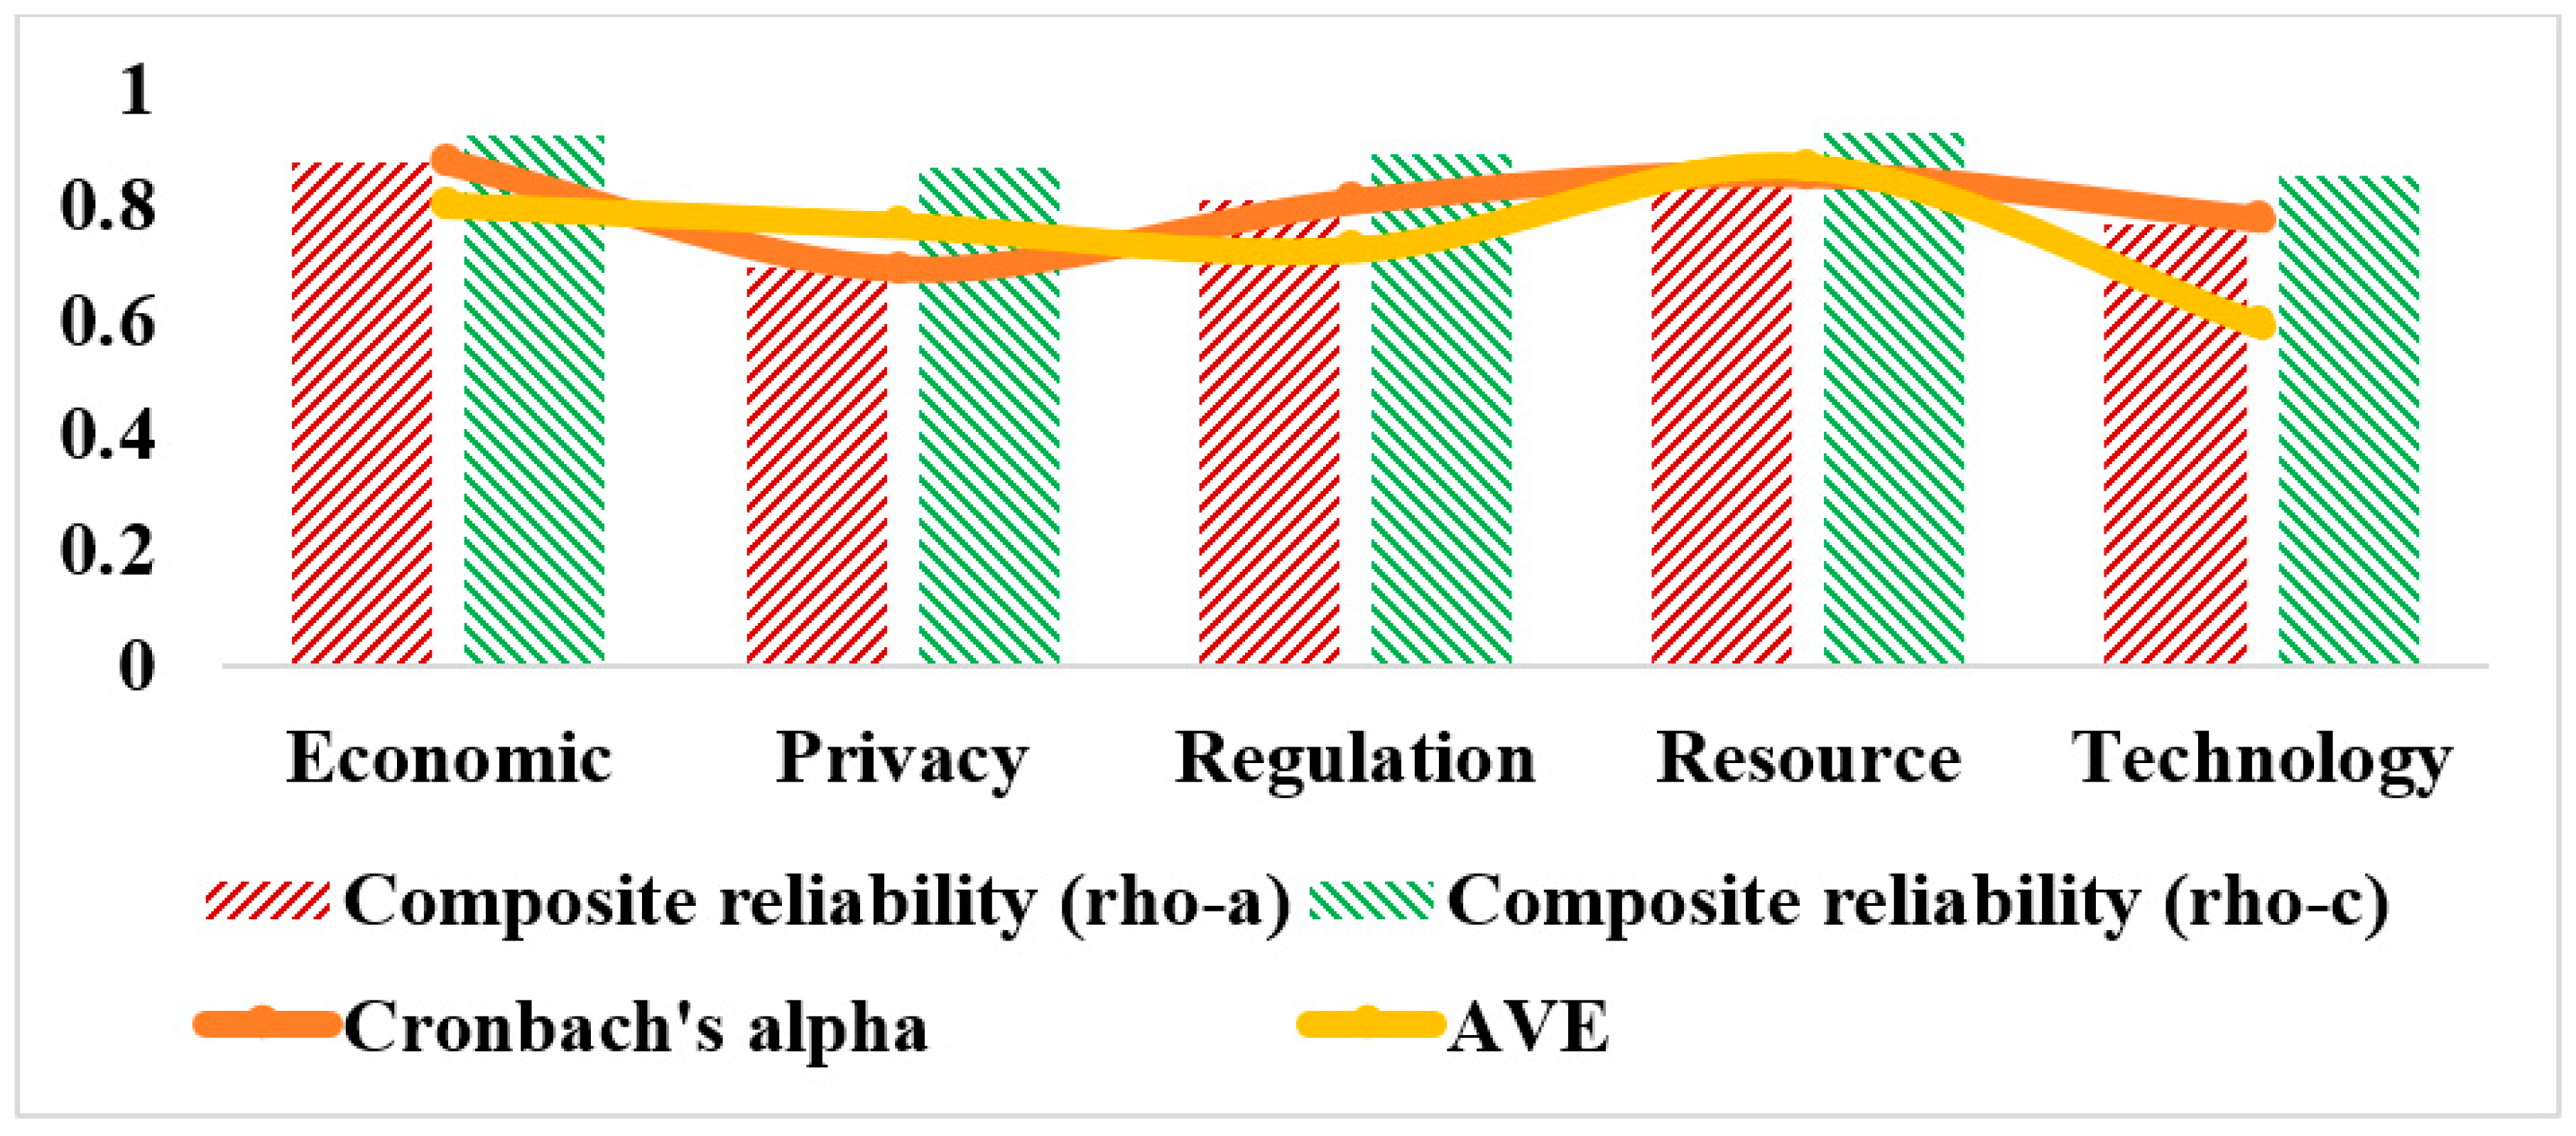
Table 8 for the five components measured in this research. Cronbach’s alpha for each construct ranges from 0.767 to 0.873, suggesting that the items are trustworthy measures of the constructions for which they were designed [
41]. Values for internal consistency of the constructs themselves, as measured by composite reliability (rho-a) and composite reliability (rho-c), fall in the range of 0.719 to 0.922 and 0.851 to 0.927, respectively. These numbers point to the fact that each construct has items that measure the same underlying construct, suggesting that the constructs are consistent with themselves. The AVE values vary from 0.588 to 0.865, reflecting the proportion of measurement error captured by each construct. Each concept shows strong convergent validity since these values exceed the required cutoff of 0.5. The variation in reliability and validity statistics is presented in
Figure 4. The statistics for the model’s reliability and validity suggest that the constructs are valid and trustworthy indicators of the measured concepts [
42]. These findings support the hypothesis testing using these constructs about the challenges of deploying RPA for safety management in tall buildings.
On the diagonal of
Table 9, the square root of AVE is presented, and in the off-diagonal columns, we see the correlation coefficients between the various constructs. Values on the diagonal indicate the average variance retrieved from all measurements for a given concept. Correlations between constructs are shown by values that are outside the normal distribution. Discriminant validity is supported by the fact that the diagonal values in this table are larger than the correlation coefficients between the various constructs. For instance, the Economic concept has excellent discriminant validity since its AVE is 0.798, and its correlations with other constructs are low (between 0.147 and 0.251).
Similarly, the correlation between the Resource and Technology constructs is just 0.179, but the AVE for both is 0.588, suggesting considerable overlap [
43,
46]. The overall discriminant validity is satisfactory, however, since the diagonal value for technology is still greater than the correlation with resources. The study’s constructs have strong discriminant validity, according to the Fornell-Larcker criterion.
The HTMT ratios may be seen in
Table 10 for the various types of constructs. The HTMT ratio evaluates the extent to which a given pair of constructs are correlated more strongly than each of the individual constructs is correlated with any other construct. If the value is lower than 0.9, then the discriminant validity may be assumed to be true. Any HTMT values below 0.9 indicate discriminant validity for the constructs in this table. It follows that the measures used in this research have sufficient discriminant validity and that the constructs differ [
47,
48]. This is crucial because it ensures that the findings acquired from the measures are not contaminated by overlap across constructs and the measurements can capture distinctive features.
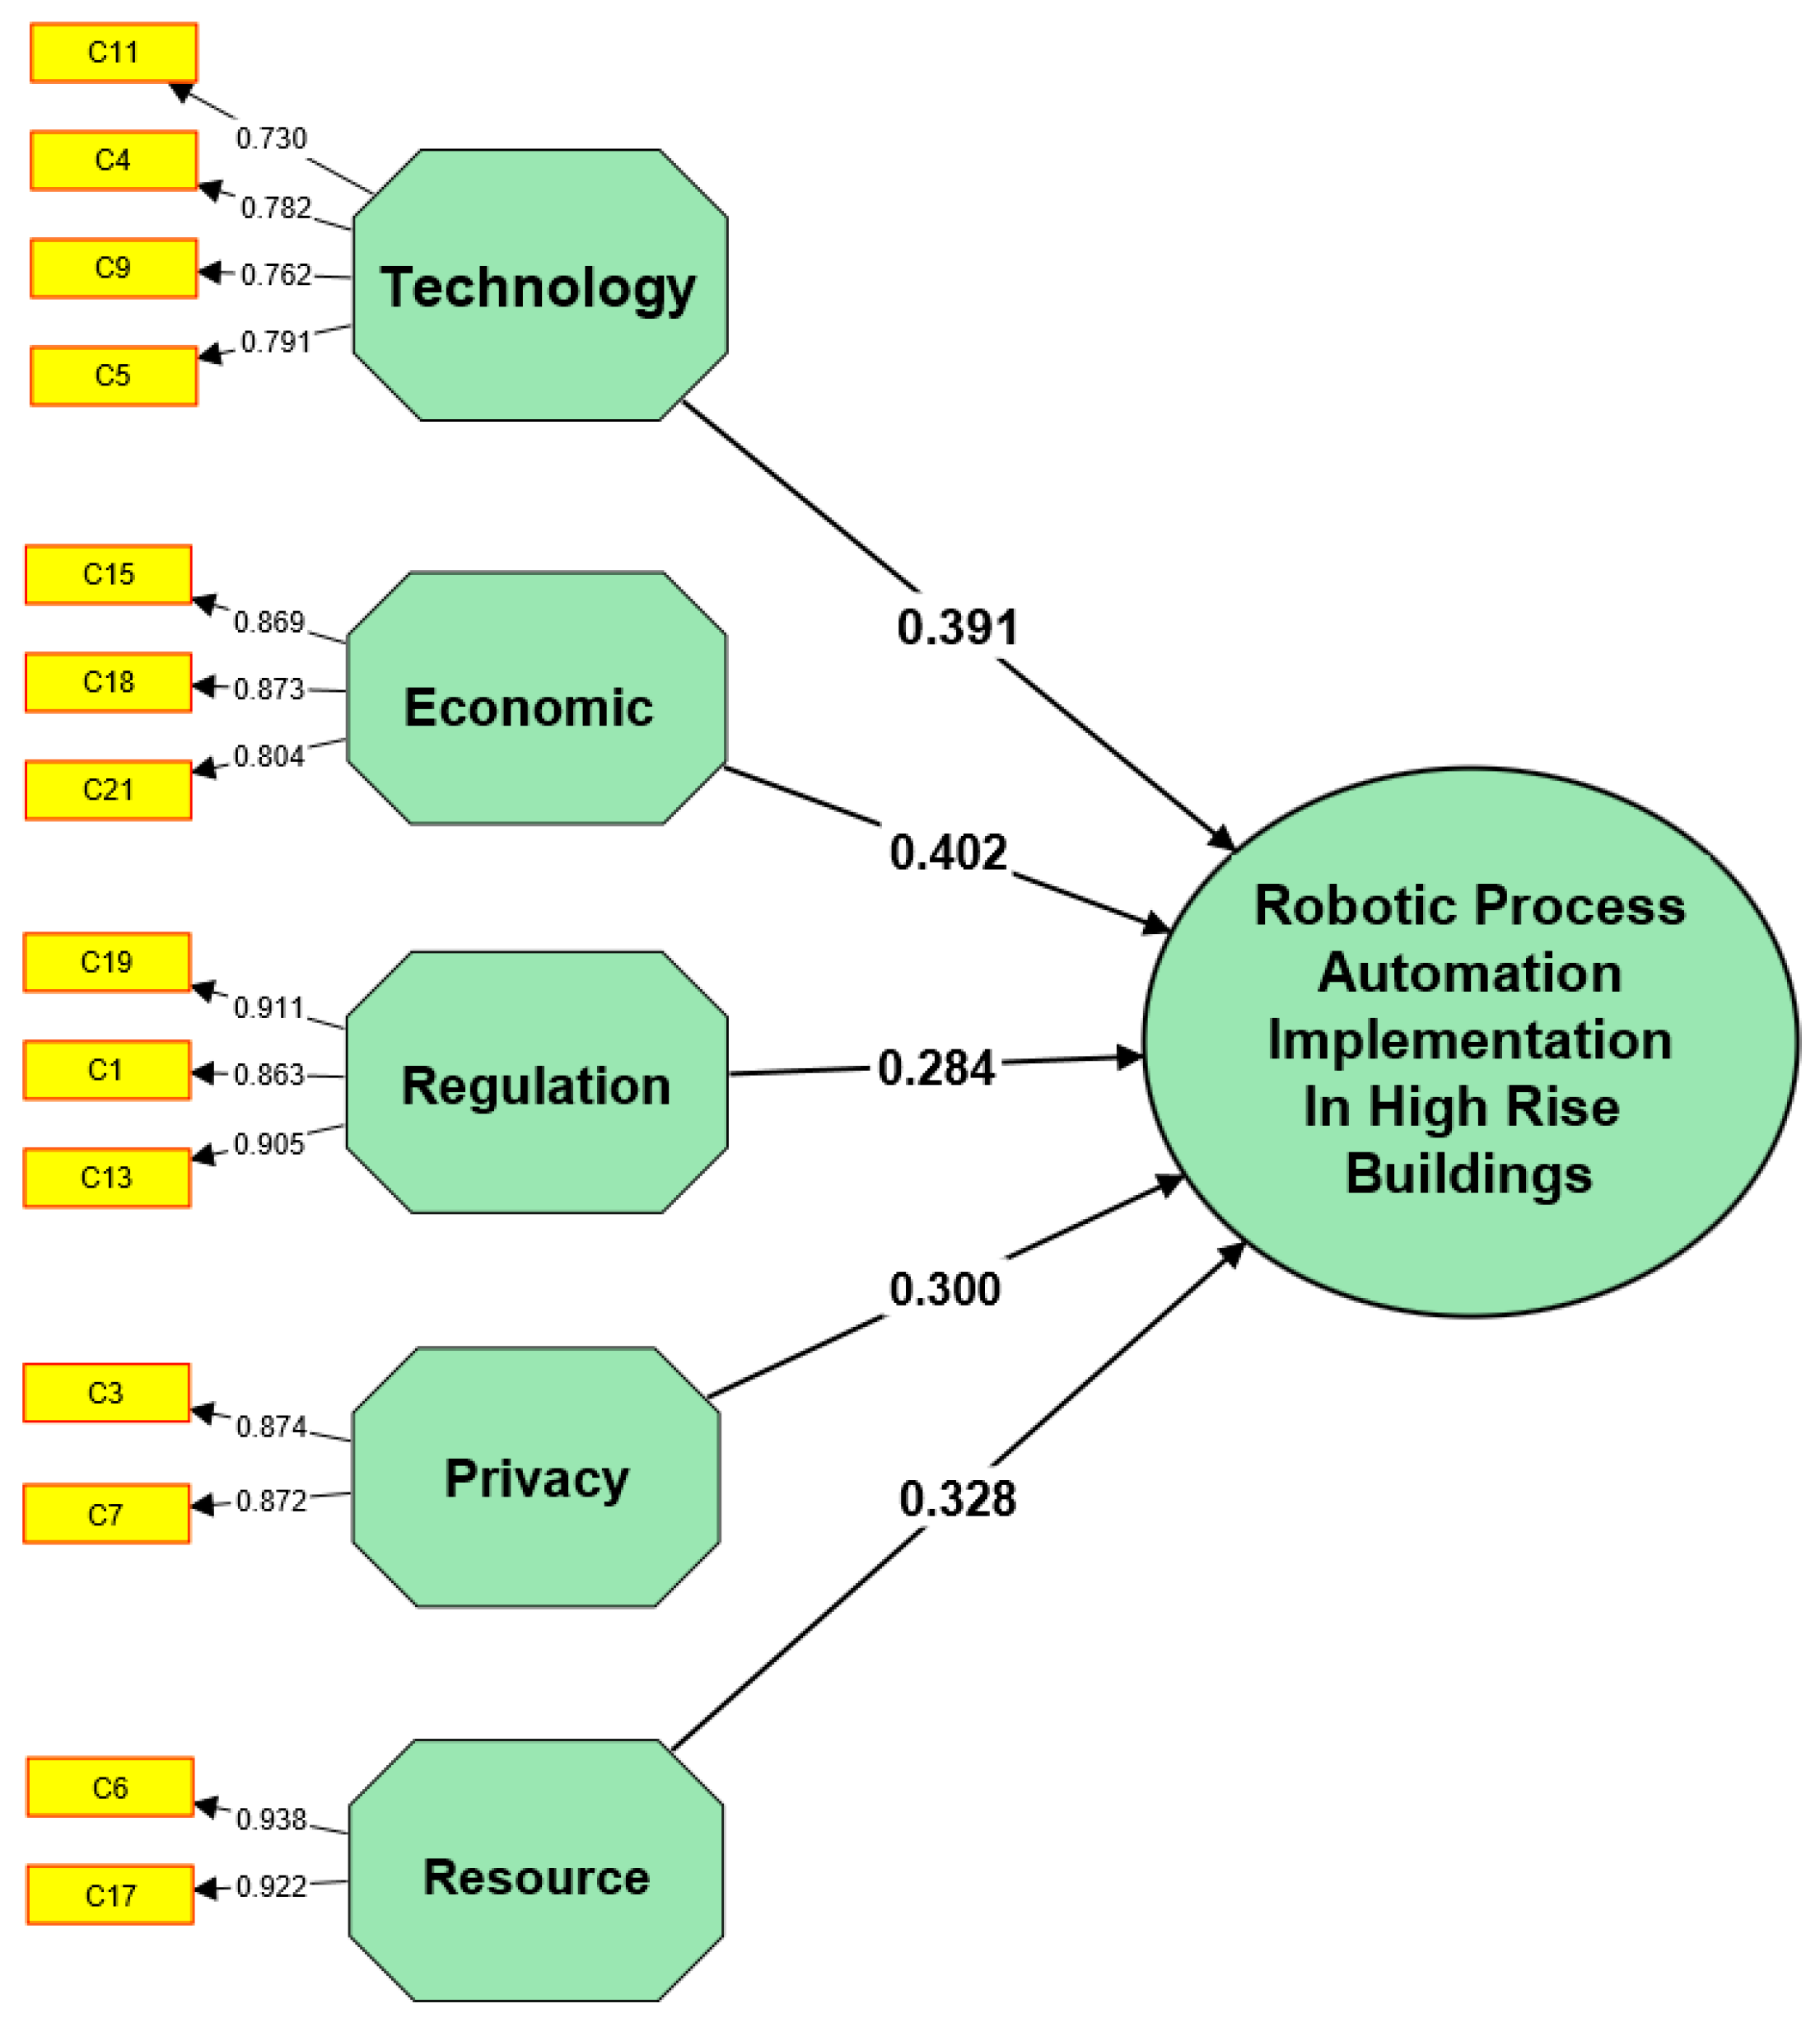
The relative importance of each variable on the various constructs is shown in
Table 11. A greater value for one built close to the others indicates a stronger relationship between the variable and that construct. The findings show that each variable loads much more on its target construct than on any other construct. For instance, the Economic construct is substantially correlated with the C15, C18, and C21 variables (with values of 0.911, 0.863, and 0.905, respectively). The Privacy construct is also highly loaded by the variables C3 and C7, with values of 0.874 and 0.872, respectively. Most variables indeed have low loadings on other constructs, but there are a few outliers. For instance, variable C5 has a high loading (0.25 on the Regulation construct) and a low loading (0.177 on the Privacy construct), suggesting that it may capture both constructs [
40,
49]. This indicates that the items used in the research have strong discriminant validity since they can assess the targeted characteristics without overlapping considerably with other factors. The developed structure model is indicated in
Figure 5, showing the structure model with path coefficients.
Based on their VIF, loadings, and construct groupings, the variables are ranked in
Table 12 for their collective influence. The order shows how significantly different variables affect their respective constructs. The most influential concept is the one that correlates most strongly with the other factors. The largest loadings and VIFs in the Economic construct are found for the variables C15, C21, and C1, suggesting that these three factors are the most consequential to this construct. In contrast, variables C17 and C6 have considerable effects on the Resource framework, while variables C11, C4, and C5 substantially affect the Technological framework. The biggest loadings and VIFs in the Privacy and Regulatory frameworks are for variables C3, C7, C13, and C19. The group impact rank may be used to see which factors contribute the most to explaining the variation of their respective constructs [
54,
65]. With this knowledge, efforts may be prioritized to remove the barriers blocking the use of RPA for managing safety in high-rises. According to the findings, economic hurdles are the most pressing to overcome, followed by those involving technology and resources.
Excluded variables (C8, C12, C14, C16, C20, and C10) are described in full in
Table 13. Both the exploratory factor analysis (EFA) and structural equation modeling (SEM) parts of the research kept these factors out. In factor analysis research, it is usual to omit variables that do not fulfill particular inclusion requirements, such as low factor loadings, poor model fit, or cross-loadings on several factors, albeit the reasons for removal are not included in the table. Removing potential points of error and making the remaining elements more transparent and easily interpretable, excluding variables, improve a model’s validity and reliability.
6.5.2. Structure Path Analysis
The study’s route analysis findings are shown in
Table 14. Path analysis is a statistical method for verifying a model’s hypothesized connections between constituent parts. The data show a positive and statistically significant relationship between the dependent variable and each independent factor (regulatory, privacy, economic, resource, and technology) (sustainable development). The magnitude and direction of the association between the independent and dependent variables are represented by the beta coefficients (B). The economic aspect was found to have the highest coefficient (0.402), suggesting the greatest impact on sustainable development [
46,
47]. The next most influential aspect was resources (0.328), then regulation (0.284), then privacy (0.291), and finally technology (0.300). The accuracy of the coefficients is quantified by the SE, with lower SE signifying more precision. We have high confidence in the findings since all t-values were significant at the
p 0.001 level.
Since all VIF values were at most 1.2, multicollinearity was not a major problem with the model. According to the path analysis, all of the independent variables benefit sustainable development, although the aspects related to economics and technology have the most weight [
39,
66]. The outcomes of bootstrapping analysis provided the significance values, which are indicated in
Figure 6. While
Figure 7 presents the t-stat of the constructs in the model. These results are helpful for governments and groups who are working to promote sustainable development since they highlight the most critical aspects to focus on.
The study’s five components and their relative performance and relevance ratings are shown in
Table 15. Each construct was given a performance score that shows how well it predicted the dependent variable and a significance score reflecting its importance to the model. Based on the findings, Privacy performs the best (63.038), followed by Regulation (56.881) and Economics (63.03). (55.840). Resource, on the other hand, scores a dismal 39.348 in terms of performance. Technology ranks first because it has a 0.468 correlation coefficient with the dependent variable, suggesting its significance [
40,
48]. With a score of 0.259, privacy comes in at number two, behind only economical (0.343), regulatory (0.377), and resource considerations (0.246). These findings indicate that Technology is the most critical variable in the model, followed by Privacy and Regulation.
Model predictive relevance (MPR), an essential measure of the model’s capacity to foretell future occurrences, is shown in
Table 16. There are values for SSO, SSE, and Q2. The model accounts for 432,000,000 in SSO, whereas 336,000,000 in SSE remain unaccounted for. The model’s predictive power, as shown by Q2, is 0.221. Predictive ability increases as Q2 rises. Thus, a Q2 score of 0.221 indicates that the model’s predictive power is modest but might be enhanced [
49]. The model offers a good fit to the data and is adequately predictive, according to the MPR findings.
6.6. Model Validation and Final Framework
The model’s validity may be determined from the mean values in
Table 17 of validation findings. With mean values ranging from 4.23 to 4.85 across the board, respondents thought the model did a good job measuring the variables of interest. In particular, Q2 has a comparatively high mean value of 4.62, indicating that the model has significant predictive potential in anticipating future occurrences. Q1, Q3, and Q5 all had high mean values, suggesting that respondents judged the model credible, helpful, and timely. In general, the mean values indicate that the model performed well in assessing the targeted characteristics and may serve as a reliable resource for related studies in the future. The final validated framework is presented in
Figure 8.
7. Discussion
The technology construct includes C11, “Problems with the efficiency of existing technologies”, C4, “The safety management staff who are responsible for the safety of the workforce need more technical support so that they can utilize the right equipment”, C9, “Problems with technological development and a lack of education in emerging fields of innovation”, and C5 “Technology that does not conform to the already accepted standards of safety in the construction business”. The hypothesis “H1: Technology-related barriers have a strong impact on RPA implementation for safety management in tall buildings” is fully validated. Path analysis findings reported in
Table 14 lend credence to the verified premise that the technological framework has a salutary effect on using RPAs for managing safety in high-rises. In particular, technical constraints might greatly impede using RPAs in the safety management of tall structures; the t-value for technology is 15.146, with a standard error of 0.031. The inefficiency of current technologies, the requirement for technical assistance, and issues linked to new technologies and safety norms in the construction sector are all part of the technological construct that impacts RPA deployment [
54]. These considerations indicate the need for a strong technical foundation and ongoing assistance to use RPAs for safety management. With a VIF of 1.138, the technological architecture is not severely impacted by multicollinearity, making route analysis findings more trustworthy. The overall significance of overcoming technical hurdles in using RPAs to guarantee safe and efficient construction practices is validated by the route analysis findings, demonstrating the need to use RPAs for safety management in tall structures.
The economic construct includes C15, “The financial burden associated with adopting new technologies”, C18, “It’s possible that training staff could require being cost-effective”, and C21, “Existing culture of safety in the Construction Industry”. The hypothesis “H2: Economic-related barriers strongly impact RPA implementation for safety management in tall buildings” is fully validated. According to the examination of causal relationships, the economic construct positively and substantially affects using RPA to manage safety in high-rise structures. For the economic concept in question, the significance level of the correlation is rather high: the
p-value is less than 0.001. The financial framework considers things like the expense of implementing new technology, value of educating employees, and standard of safety in the construction sector as it now stands. Based on the tests conducted, there is a significant correlation between the economic hurdles and slow rate of RPA deployment for safety management in tall buildings [
39,
65]. This result suggests that financial considerations are critical to the effective use of RPAs for safety management in high-rise structures. Significant impediments to using RPAs include the financial burden of adopting new technology and cost-effectiveness of training people.
The regulation construct includes C19, “There is not enough government support”, C1, “Absence of norms and restrictions”, and C13, “Robotic process automation and its inherent complexities”. The hypothesis “H1: Regulation-related barriers strongly impact RPA implementation for safety management in tall buildings” is fully validated. With a path coefficient of 0.284, the regulatory construct is also very significant in examining causality between the independent variables involved in the success or failure of RPA deployment for safety management. These findings point to the necessity for proactive measures by politicians and regulatory organizations to establish clear standards, regulations, and support for RPA deployment in the construction sector. Addressing the challenges of RPA and providing the requisite training and instruction are also crucial for a successful rollout. In conclusion, the need for regulatory support and clear instructions for the effective adoption of RPA for safety management in tall buildings was validated by analyzing the influence of the regulation construct [
33,
66].
The privacy construct includes C3, “Concerns concerning legal responsibility have been raised” and C7, “Lack of leadership and reluctance to take charge”. The hypothesis “H1: Privacy-related barriers have a strong impact on RPA implementation for safety management in tall buildings” is fully validated. Validated theory is supported by components C3 and C7 that privacy-related constraints significantly affects RPA deployment for safety management in tall buildings. C3 emphasizes worries about legal liability, whereas C7 emphasizes a failure to take initiative and a lack of leadership. These barriers might significantly impact the spread of RPA technology in the construction sector, where security and confidentiality are paramount. With a path coefficient of 0.300 and a
p-value of less than 0.001, the privacy concept was shown to have a statistically significant positive influence on RPA adoption. This suggests that removing barriers associated with data privacy might enhance the results of RPA adoption, which in turn can improve safety management in skyscrapers [
69,
70]. The results indicate that the construction sector has to consider privacy-related restrictions when deploying RPA technology and take the necessary steps to resolve these concerns to guarantee effective deployment and acceptance.
The resource construct included C6, “Owing to the scarcity of online safety management resources” and C17, “Purpose of the practice is for safety”. The hypothesis “H1: Resource-related barriers have a strong impact on RPA implementation for safety management in tall buildings” is fully validated. This study’s resource construct alludes to the limited nature and ultimately protective goal of current approaches to online safety management. According to the findings of the route analysis, this concept significantly influenced the use of robotic process automation (RPA) in the management of safety in high-rises. This suggests substantial barriers to adopting RPA for safety management in tall buildings due to needing more resources and a defined purpose for safety activities. The resource construct had the lowest mean score of all of the validation survey’s constructs, at 39.348. This suggests that participants were worried about needing more resources, underscoring the need for sufficient resources to effectively apply RPA in safety management [
72,
73]. To overcome these challenges and effectively deploy RPA in safety management in tall buildings, enterprises need to give appropriate resources and identify the aim of safety measures. Doing so may boost an organization’s safety management standards and make the workplace safer for everyone.
The results of our study regarding the obstacles that impede the adoption of RPA in safety monitoring carry noteworthy ramifications for both scholarly inquiry and practical application. The study makes a valuable contribution to the existing body of literature by shedding light on the obstacles to implementing RPA in the realm of safety monitoring. In this particular context, we have identified distinct barriers that contribute to the current understanding of impediments to the implementation of RPA.
The results are in line with prior studies regarding obstacles to the adoption of RPA in various domains, including but not limited to the financial and healthcare sectors. Furthermore, it enhances comprehension of obstacles to the implementation of RPA in the context of safety monitoring and presents pragmatic suggestions for entities to overcome these hindrances. Subsequent investigations may expand on our discoveries by examining the influence of these hindrances on the triumph of RPA implementation and ascertaining efficacious approaches to surmount them.
7.1. Empirical and Theoretical Contributions
This research provides important theoretical and empirical insights into using RPA in tall-building safety management. The findings of this research give practical insights into the issues construction firms and regulatory authorities may encounter when employing RPA for safety management in tall structures. Several technological, monetary, regulatory, privacy, and resource-related challenges to RPA application for safety management in tall buildings are also identified. The research also verifies the validity of the suggested model and demonstrates that it can foresee the use of RPA in the management of safety in high-rises. The theoretical contribution of this study lies in the development of a unified model that takes into account the many factors (such as cost, regulation, privacy concerns, and availability of resources) that impede the use of robotic process automation (RPA) in the context of safety management in tall buildings. By verifying the model and displaying its value in forecasting RPA deployment for safety management in tall buildings, the research contributes to the current literature by expanding on it. The study also shows how several barriers to RPA adoption are interconnected and may influence one another. The research gives a complete model that may advise construction businesses and regulatory agencies about the issues they may encounter when using RPA, as well as significant insights into the hurdles to RPA deployment for safety management in tall buildings. In addition to confirming the suggested model, the research adds to the literature by emphasizing the significance of evaluating different barriers to RPA deployment.
7.2. Managerial Suggestions
Many managerial recommendations may be made to further the effective application of RPA for safety management in tall buildings based on the results of this research.
Initially, it is suggested that the industry focuses on removing economic, regulatory, privacy, technological, and resource constraints. This may be achieved by creating all-encompassing plans that account for the unique challenges faced by the company. If, for instance, a business needs help financially, it may look into grants from the government or try to create training programs that don’t break the bank.
Second, construction firms should work to foster a culture of safety that values and encourages the use of RPA tools. This may be done by giving workers a voice in RPA decisions, educating them on the advantages of the technology, and incentivizing their adoption.
Businesses should look into partnering with other groups to pool resources and expertise. Collaboration with schools, trade groups, and IT companies is all possible.
The next piece of advice for improving tall building safety management is for businesses to set concrete objectives and performance indicators for RPA adoption. One example is keeping tabs on the time and money saved from using RPA. Another is keeping tabs on the number of safety incidents that have been avoided or decreased.
Last but not least, it is suggested that building businesses conduct continual learning and improvement to keep up with the latest developments and best practices in RPA technology. One way to do this is to network by participating in training programs, conferences, or joint ventures with other businesses.
7.3. Limitations and Future Implications
This research only applies to the high-rise construction sector. Thus, its findings may need to be more generalizable. As a second caveat, the data were gathered via a cross-sectional survey, which might make it harder to draw conclusions about cause and effect. Longitudinal designs and exploring RPA application in more sectors and building types are ways that future research might overcome these restrictions. This study’s results have various implications for further investigation. To begin, more research may look at ways to remove the barriers to RPA adoption, especially as they pertain to the high-rise building sector. Second, the advantages of RPA adoption for safety management in the construction sector might be investigated in future research. Finally, more research may look at how company culture affects RPA deployment. Lastly, alternative research approaches, such as case studies or experiments, might be used in future studies to learn more about the challenges and opportunities associated with using RPA in the construction sector for tall structures.
8. Conclusions
In conclusion, this research aimed to examine the economic, technological, regulatory, privacy, and resource constraints that prevent RPA from being used for safety management in tall buildings. The research concluded that all factors, except resources, significantly affected RPA adoption. According to the findings of the path analysis, legislation was shown to be the most influential factor, followed by concerns about privacy, technological advancements, and economic factors. This research adds to the existing literature by demonstrating the challenges of using RPA for safety management in high-rise structures. Understanding the interplay of regulatory, privacy, technological, economic, and resource constructs is a major theoretical contribution to RPA deployment for safety monitoring in tall buildings. This study’s managerial implications include that, when deploying RPA for safety management in tall buildings, enterprises should prioritize government rules and support, privacy issues, technology improvements, and fiscal restraints. Regulatory organizations may be partnered with to guarantee compliance, privacy protection measures can be invested in, staff can be trained, and cost-effective technology can be explored as possible solutions. To get a fuller picture of RPA’s potential, future studies might investigate the highlighted barriers in other contexts and sectors. Research into the future may also look at ways to overcome these barriers and make RPA more accessible for use in the management of safety in tall structures.
The prevalence of tall structures is on the rise, which in turn poses an elevated likelihood of incidents and safety perils. Hence, it is imperative to investigate novel approaches such as RPA to enhance safety management in such edifices. The present study’s results provide insight into the possible hindrances to the implementation of RPA for safety management in high-rise structures. This information can assist stakeholders within the construction sector in making well-informed choices regarding the adoption of RPA. In general, the present study makes a scholarly contribution to the development of construction safety management theory and underscores the significance of taking into account technological innovations such as RPA to enhance safety management in hazardous sectors.
Despite the study’s useful contributions, there are certain caveats to keep in mind. Safety managers were the only participants in the research; workers and building owners were not surveyed. Also, the study was limited to a single place, thus extrapolating the results to other areas would not be prudent. Future research should consider including diverse views and boosting the sample size to increase the generalizability of the results. The findings of this research are invaluable for businesses considering using RPA for safety management in skyscrapers.


 ,
, 


