Abstract
Free-form architecture is a prominent trend in contemporary architecture where streamlined geometric buildings are constructed. The main problem in free-form architecture is rationalization, which involves realizing free-form surfaces at a reasonable cost while meeting design requirements. Balancing the design intents and construction costs simultaneously is essential for successful rationalization. This study proposes parametric and generative program flows to balance both requirements efficiently. The suggested parametric program flow, which is based on a mathematical algorithm, classifies a free-form surface into multiple areas, which are favorable to flat, single-curved, and double-curved panels. The proposed generative program flow optimizes the double-curved panels’ area through the integration of Multi-Objective Optimization and Pareto optimality. Designers can select the best design option that fits their design objectives through trade-offs using the results of the program flows. Eventually, more efficient and mindful decisions can be made in the early design process by using the results of this study for successful free-form architecture.
1. Introduction
Recently, free-form architecture, which is streamlined geometric buildings, has been one of the most striking trends emerging from the development of Computer-Aided Design (CAD). Many landmark buildings in the world have been built by adapting geometrically complex free-form surfaces and structures. The new trends have resulted in bringing innovations and many challenges to the realization of such buildings [1].
The essential problem of free-form architecture is rationalization, which is a process in order to realize free-form surfaces at a reasonable cost while respecting the design intents [2]. A good rationalization requires balancing the design intents and construction costs simultaneously, because both aspects are used to judge how well free-form buildings were constructed [3]. While meeting the design and construction requirements, the best way of rationalization is dividing a free-form surface into as many same sized flat panels (FP) as possible, a lesser number of single-curved panels (SP), and a few double-curved panels (DP) in conformance. Using only one type of panel could not meet the design intent, and using many curved elements results in high costs.
As the computational power increases over time, the design process of free-form architecture becomes more advanced and complex, which increases the project cost and time of free-form buildings and requires designers’ efforts in computer programming languages with steep learning curves [4]. This presents additional challenges in the design process. Therefore, it is also important to create user-friendly interfaces to incorporate advanced logic and digital tools into the rationalization of free-form architecture.
Most studies regarding rationalization of free-form architecture have been focused on the optimization of free-form surfaces in terms of daylight, energy use, and life cycle assessment (LCA). These studies were performed not from an architectural perspective but an engineering perspective. The creativity of architects could be limited by just focusing on the engineering aspects. The rationalization process should be performed considering both aspects together. Hence, the goal of this research is to suggest parametric and generative program flows in an efficient and user-friendly way for the free-form architecture balancing between the design intents and construction costs.
2. Literature Reviews
2.1. Paneling for Free-Form Surface
The early research in free-form architecture was conducted by Gehry Technologies [5], an AEC technology company, which focused mainly on surfaces that were nearly developable [6]. Gehry Technologies provides web-based 3D project collaboration, building information modeling, and advanced project delivery services. This company also designed many representative atypical buildings in the world. This was a result of the specific design process that involved creating digital models based on materials that assumed (nearly) developable shapes. The Smart Geometry group [7] is an organization focusing on the use of the computer as an intelligent design aid in Architecture, Engineering, and Construction (AEC). The Smart Geometry group, on the other hand, promotes research on free-form architecture and has mostly concentrated on parametric design tools that have built-in panel properties. While these tools can be useful for shape generation, it can be challenging to achieve desired shapes and satisfactory paneling solutions for highly complex geometries using this approach. This organization encourages collaboration between practicing AEC professionals, academics, and students using computational and parametric software tools.
Previous research on paneling has mainly focused on planar panels, and the initial work in this area focused on specific types of surfaces [8]. Covering free-form surfaces with planar quad panels required the use of methods from discrete differential geometry, which led to new ways of supporting beam layout and computing multi-layer structures [9,10,11]. More recently, researchers have extended this approach to cover free-form surfaces with SP arranged along surface strips [12]. Some researchers have also explored optimizing for repeated elements by changing the vertex positions of a given mesh, with the goal of creating reusable prefabricated tiles. For example, Fu et al. [13] explored this idea in the context of quad meshes, while Singh and Schaefer explored it in the context of triangle meshes [14].
The method we are using to approximate a surface with simple geometric shapes is similar to variational methods [15]. This method was originally used by [16] for surface approximation with planes, but extensions have been proposed for other surface types such as spheres, cylinders, quadrics, and developable surfaces [17]. Recently, an optimization method has been proposed to divide the input surface and determine the type and number of shape proxies required to reduce the approximation error [18]. Our approach optimizes position and tangential continuity at the panel boundaries, allowing systematic deviation from the reference surface while improving paneling quality and reducing cost. Our approach is substantially different from other methods because we need to enable mold reuse and aesthetic control, which are important for architectural rationalization. State-of-the-art methods in surface fitting and local registration are integral to our system but are insufficient to solve large-scale freeform paneling problems [19,20].
In the field of shape analysis, symmetry detection and regularity detection problems involve identifying and extracting repeated elements, both exact and approximate, from 3D geometry [21]. Once these repetitions are detected, the underlying meshing structure can be modified to make them exact using techniques such as summarization. However, these methods are not effective for handling architectural designs with large non-repetitive sections. Our optimization approach has a similar effect to summarization by enabling trade-offs between approximation error and mold reuse, resulting in significant cost savings during manufacturing.
2.2. Computational Architectural Rationalization
During the 1990s, Gehry Partners’ [22], which is a full-service firm established by an architect Frank Gehry, innovative and complex designs played a significant role in introducing computer-aided 3D modeling and manufacturing to traditional architecture. This period is also noted for its emphasis on rationalization, which is often attributed to discussions surrounding Gehry’s work at that time. The term “rationalization” was first used in an architectural context by [8], who described it as the process of transforming Gehry’s intricate designs into constructible geometry. This process involved the introduction of mathematical “rules of constructability” to make these designs feasible [6]. Shelden [6] described Gehry Partners’ rationalization process in his Ph.D. thesis, which entailed translating handmade physical models into digital representations that were gradually refined based on the results of analytical simulations. Two years after Lindsey and Shelden’s works, [21], an architect in Gehry Partners, defined rationalization as a process where physical models are transformed into digital models with programmed geometric constraints that guarantee their constructability. He credited this approach to the development of CATIA V5 [23], which is a 3D CAD software used to design aircraft in the aerospace industry, and predicted that advanced form-finding methods could be based on this process. Meanwhile, Fischer [24] discussed how rationalization is used in Foster + Partners [25], a British architectural, engineering, and integrated design studio founded by architect Norman Foster, to introduce fabrication logic into a design. He distinguished between projects that were first designed with free-form surfaces and then transformed into easy-to-construct arc-based geometry and those deliberately designed with constructible geometry such as torus patches or ruled surfaces. Whitehead [26] also differentiated between pre-rationalization and post-rationalization methods, based on when they are applied in the design process. Gehry Partners uses CATIA to perform the AEC project. The main project that this organization pursues is, similar to Gary Technology, unstructured architecture.
The author of the text advocates using pre-rationalized approaches in design as they can solve many issues related to production and design. Fischer, a scholar, defined rationalization as a process of approximating a shape using a generative algorithm, and he introduced the temporal division of rationalization strategies [25]. According to Hesselgren in 2007, pre-rationalization involves incorporating constraints into the geometry of a design using basic shapes, which he considered a better approach due to its ability to produce superior results [27]. Attar argued that in pre-rationalization, the final shape of a building is determined by geometric constraints by providing the example of the Sage Gateshead center designed by Foster + Partners to illustrate this point [28]. Pottmann used the term “construction-aware design” to describe pre-rationalization and referred to post-rationalization as “design optimization” [29]. Dritsas highlighted that post-rationalization requires extensive computational optimization, and he cited the Walt Disney Concert Hall as an instance of this process [30].
In 2012, Fischer [31] wrote a review of rationalization in architecture, which focused on the early 2000s and provided a historical perspective on the subject. However, Fischer’s review did not cover more recent projects, digital fabrication, or general rationalization methods [32]. Therefore, our review aims to fill in these gaps.
In 2015, Pottmann et al. wrote an article about rationalization in architecture from a mathematical perspective [33]. They argued that fields such as differential geometry, discrete mathematics, numeric optimization, and computer graphics processing are highly relevant to the discourse and collectively form a field of research called “architectural geometry” [34,35]. Their article categorizes algorithms according to the type of geometry being rationalized (developable, double curved, etc.) or the goal of the rationalization (structure, paneling, repetition, etc.). Although their review covers many contemporary built examples of each category, it does not critically examine the position of rationalization in the design process or the relationship between digital fabrication and rationalization. Our review is concerned with this relationship, which we believe is a crucial issue in the discourse [35,36].
Most of the paneling and rationalization-related studies reviewed focused on the design aspect [10,11,12]. Although several studies are considering various aspects along with the design aspect [2,3,13], these studies are inefficient and not user-friendly to present several design alternatives. Therefore, it is required to develop an efficient methodology that can consider various aspects and present many design alternatives.
3. Research Methods
Figure 1 shows the overall research process. This study mainly focuses on classifying a free-form surface through parametric designs in the Dynamo-Revit interface and optimizing the designs through generative designs in Project Refinery developed by AutodeskTM by integrating with two optimization methods.
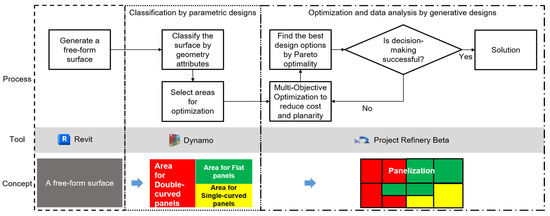
Figure 1.
The overall research scope and process.
One method is Multi-Objective Optimization (MOO) [37]. MOO is a field of study that deals with mathematical optimization problems where more than one objective function needs to be optimized simultaneously. This type of vector optimization has been applied in various fields of science, including economics, logistics, and engineering, where optimal decisions need to be made despite trade-offs between two or more conflicting objectives. The other method is Pareto optimality [38], which is one way to find good solutions to multi-objective problems. The best solution can be chosen by finding Pareto front or optimal through Pareto improvement (more mathematically elegant definitions of Pareto optimality exist in the literature).
As a basic platform, AutodeskTM Dynamo 2.0.2 was used for this research, which acts as a plug-in to Revit. Dynamo is a parametric design tool and visual programming language specifically developed for designers exploring and customizing various RevitTM building information workflows. The designers are allowed to create a variety of strategies beyond the traditional design methods with its algorithmic capabilities. In this tool, ‘program flow’ can be developed using ‘nodes’ without the need for learning computer programming languages. While this program flow is being developed, various add-ons, which serve different purposes, can be easily included in the ‘library’ as preprogrammed nodes [39]. For example, the Clockwork add-on [40] was developed for list management, mathematical operations, string operations, geometric operations, and paneling. Generative form making, paneling, rationalization, and interoperability are handled with the Lunchbox add-on [41]. Machine learning can be applied by the Lunchbox Machine Learning (ML) add-on [41].
3.1. Classification of a Free-Form Surface by Using Principal, Mean, and Gaussian Curvatures (CPMGC)
Curvature of a curve is a measurement describing how much a curve deviates from a straight line. At a given point p of a surface s, numerous curves c in s exist touching p; for all curves c, the principal curvatures, denoted as k1 and k2, are the maximum and minimum ones (Figure 2).

Figure 2.
Principal curvatures (adapted from Gauthier et al. [42]).
Gaussian curvature (GC) is defined as the product K = k1·k2 of two principal curvatures [43]. There are four conditions based on the combination of the curvatures, k1 and k2 [44]:
- Condition 1: If k1 and k2 have the same sign and are not 0 at one point, it results in a positive GC and is called an elliptic surface point.
- Condition 2: If k1 and k2 have opposite signs at one point, it results in a negative GC and is called a hyperbolic surface point.
- Condition 3: If either k1 or k2 vanishes and is equal to 0 at one point, while the other one is not equal to 0, it results in a vanishing GC to and is called a parabolic surface point.
- Condition 4: If k1 and k2 both vanish and are equal to 0 at one point, it results in a vanishing GC similar to that in condition three and is called a flat point.
Developable surfaces which can be unrolled into a plane without any stretching, tearing, or distortion can be determined, if all points on a surface meet Conditions 3 and 4 and the GC equals zero. Thus, even if the GC of ruled surfaces is not always zero, developable surfaces are part of the ruled surface, since it is not ensured that the straight lines carried in ruled surfaces have the same direction with any principal curvatures [2].
Because the GC cannot distinguish any one of Condition 3 and 4 of surface points from the other one, mean curvature (MC), H = (k1 + k2)/2, is introduced. This curvature is the arithmetic mean of two principal curvatures [45].
Table 1 shows the combination of GC and MC to divide surface points. Generally, feature-curves are located where curvature reaches its minimum or maximum. By changing the value threshold closely to its extreme, feature-curves shall be detected. Thereby, the logic of Table 1 was translated into Dynamo nodes, and it was tested on the base surface design.

Table 1.
Feature-curve detection (adapted from He [46]).
Parametric designs can be applied to solve free-form design problems. The freedom of adapting to the particular needs of the user is offered through algorithmic modeling. A reasonable connection between design intents and responses is defined, established, and clarified by parameters and objective functions [47]. Parameters, which are linked to geometry, are selected by designers and modified gradually through trial and error in order to improve the design [48].
The number of UV grids was used as parametric values and inputs. The maximum panel size was limited to 76 sqft (7.06 m2) based on previous research and multiple literature reviews [49]. In order to panelize a free-form surface with a panel size smaller than 76 sqft, the UV grid ranged from 20 to 40 (u grid) and from 35 to 50 (v grid); the maximum value can be changed. The imported surface was divided by the UV grids and classified into multiple paneling areas through the proposed program flow, CPMGC (see Figure 3).

Figure 3.
A parametric program flow of CPMGC in Dynamo.
The CPMGC process involved 6 steps:
- Step 1: A free-form surface was designed in Revit and imported into Dynamo by a node, ‘Select Face’. The surface was divided using a UV grid into quadrilateral panels through ‘Panel.PanelQuad’. The principal curvatures of each divided panel were calculated by using ‘Surface.PrincipalCurvatureAtParameter’, and then k1, the maximum curvatures, and k2, the minimum curvatures, were taken by ‘List.MaximumItem’ and ‘List.MinimumItem’. The node, ‘List.Flatten’, was used to take a nested list and flatten levels of the list by combining the first levels into a single level.
- Step 2: The signs of k1 and k2 were identified through ‘Python Script’ because Dynamo 2.0.2 cannot recognize the number in the sixth decimal place.
- Step 3: Four nodes were used, which were the Less Than operator, ‘<’, the Equal To operator, ‘==’, the Greater Than operator, ‘>’, and the multiplication operator, ‘*’, to calculate the GC by multiplying k1 and k2, and the signs of GC were identified.
- Step 4: The MC was calculated through the node, ‘Math.Average’, and three cases of MC were analyzed.
- Step 5: The feature-curve areas were detected by the combinations as described in Table 1. For example, flat surface area was classified as both GC and MC are equal to 0. The convex feature-curve area was detected as k1 is larger than 0, k2 is smaller than 0, the absolute value of k2 is larger than the absolute value of k1, and both MC and GC are negative. ‘Math.Abs’ was used to calculate the absolute values of k1 and k2, and two Boolean values were taken by ‘&&’, the And operator, and returned true if both values were true. The Or operator, ‘||’, took two Boolean values and returned true if one or both values were true. Other areas were also detected based on each requirement by the algorithm.
- Step 6: Through the parametric program flow, CPMGC, seven areas were classified and colored by the nodes as shown in the ‘Visualization’ box in Figure 3.
3.2. A Generative Program Flow by Applying MOO
Generative design is an algorithmic process based on objective functions and algorithms, along with parameters such as performance or spatial requirements, materials, manufacturing methods, and multiple constraints. Various potential permutations of a solution can quickly be generated and automatically explored by these rules. Architects can utilize many optimization methods for the maximum possible performance of a given model based on concrete objectives and can select the promising options for further analysis and review [50]. Recently, as the boundary between the definitions of parametric design and generative design has been blurred, both parametric and generative designs are used together or in the same sense.
In order to find better solutions, clear objective functions are essential for the process of generative designs, because it is difficult to determine better design options for a computer. Hence, it is required to take such architectural and practical factors into consideration during the design stage for clear design objectives. In addition, input parameters can be controlled and tuned intelligently by the algorithms used for generative designs. These algorithms are called Multi-Objective Genetic Algorithms (MOGA), which are the most promising algorithms [51]. In this paper, a generative program flow applying MOGA, which is based on MOO, Pareto optimality, and Genetic Algorithm (GA), was suggested.
MOO is one of several solutions for most real problems that have multiple objectives. Because these multi-objectives conflict with each other and obstruct concurrent optimization of each objective, it is difficult to solve these practical multi-objective problems compared to single scalar objective problems. Two different approaches, such as classical methods and non-traditional methods, are applied in MOO [52]. Classical methods combine multi-objective functions using mathematical principles into a single scalar objective problem by integrating a user-provided weight for each objective (e.g., the weighted sum methods) [53]. In the nontraditional methods, a set of Pareto-optimal solutions that are non-dominated with respect to each other is determined by stochastic rules. Pareto efficient or optimal, the set of choices, is called a Pareto frontier set or front that corresponds to the boundary of the feasible objective function space. The final solution represents a set of good trade-offs between two or more conflicting objectives. The methods address a large search space compared to the classical methods [3].
GAs are popular meta-heuristic algorithms. In the GA approach, a designer defines various inputs and plugs them into a MOO so that the algorithm is widely integrated with generative and parametric designs. If a multi-objective function for a specific problem was not satisfied, the next population of agent points is generated by the GA, and geometry is altered by using the agent points in the hierarchical agent system. The simulation is repeated with the changed geometry until the multi-objective function is satisfied or the maximum iteration will be reached.
A clear design goal for the balance between design and cost requirements has to initially be established. The set of output values is formed by the design objective, and then it is used to evaluate the performance of each design option generated automatically and to discover more efficient designs.
For the rationalization of free-form surfaces, the easiest paneling or panelization is using flat panels, which are composed of triangular, Planar Quadrilateral (PQ), and/or Planar Hexagonal (PH) meshes. The free-form surfaces can be represented closer to the original curvedness by utilizing developable panels, which are one type of single-curved panels, if the given original surface has one low principal curvature. According to the definition of a single-curved panel, the panel can be unfolded into a plane without any stretching, tearing, or distortion. All developable surfaces in three dimensions are ruled surfaces, but not in four dimensions. One of principal curvatures of ruled surface equals zero [46].
Because of these features, planarity is one of the important factors for flat and single-curved panels. Many variables, such as angle and distance, are used for the measurement of planarity. If the sum of four angles in a rectangular surface is equal to 2π, this surface is planar. Planarity is also defined by the distance between two surfaces in space [43]. The least-square methods as applied for determining the planarity of flat and single-curved panels as described by Equation (1). The planarity constraint was proposed for a N-polygon, ; a plane, ( is the unit normal of p) is first identified to fit f in the least-square sense. If the distance between every vertex of f and the fitted plane p is zero, the planarity of f could be determined. is established by adapting the least-square methods as described by Equation (2).
As mentioned previously, it is most important to take the requirements of design intent and construction cost into consideration for free-form surface modeling. Closeness and smoothness have been applied for design requirements in other studies [11,43,54,55,56]. However, the cost requirement was not adequately considered. Angle differences between panels are mostly used for smoothness. Eigensatz et al. [2] developed two algorithms to compare panels for surface smoothness as a parameter by applying a divergence threshold (a spatial gap between adjacent panels) of 6 mm (0.24 in.). For planarity or closeness, the distances between generated and original surfaces were measured, and the distance threshold was assigned as a form-finding method.
where is the initial surface of and is the distance between and .
is the sum of each double-curved panel’s area. It is minimized to maximize the use of FP and SP. is not essential because it is connected to . It is required to show the result. is the sum of all panels’ cost. Panel costs per square meter USD 701 for a flat panel, USD 766 for a single-curved panel, and USD 1518 for a double-curved panel) are assigned based on the research [57]. Thus, the objective function is defined to minimize the paneling cost, DP area, and distance between the original and rationalized surface (Equation (3)). In Project Refinery, the optimization method, such as ‘maximize’, ‘minimize’, and ‘ignore’, can be selected.
The suggested Multi-Objective Generative Design (MOGD) divide a free-form surface into two areas as shown in Figure 4 (the SP area is represented by FP according to the definition of single-curved panel so that the cost of a single-curved panel is not used). One area is favorable to FP and SP (colored by green), and the other area is advantageous to DP (colored by red).

Figure 4.
A generative program flow of MOGD.
Through the parametric program flows of CPMGC, a free-form surface was classified into multiple areas. Areas favorable to FP or SP did not need optimization, as the cost of FP and SP is around half of the cost of DP. By minimizing the DP area, more cost could be saved. The MOGD was developed by adopting a distance threshold, 3 mm (0.12 in.), as shown in the ‘Planarity’ in Figure 4 and Figure 5. The identified factors, including the number of UV grids, size, and cost of panels, were set as parameters. The objective functions defined in Equation (3) were applied with the distance threshold so that areas that deviated from the original design by less than the threshold were optimized by panelizing with FP instead of DP.
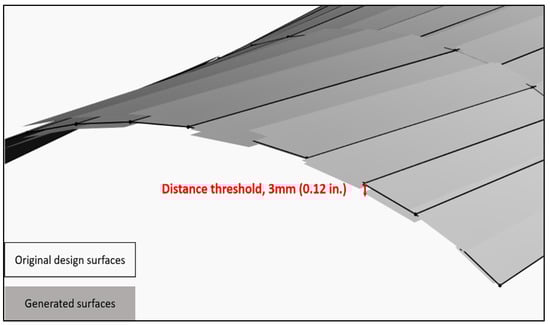
Figure 5.
Example of distance threshold.
Figure 6 shows the result of classifying some of the free-form surface of Dongdaemun Design Plaza (DDP), divided by the UV grid of 37 × 49 panels. The surface was categorized into three areas: concave, convex feature areas favorable to DP, and flat surface favorable to FP. Thus, it is necessary to optimize the entire surface (except for the 2 FP areas).
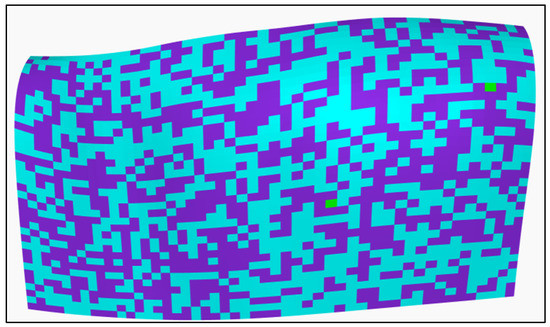
Figure 6.
The result of CPMGC in Dynamo.
4. Validation and Case Study
4.1. Validation
For the validation of the suggested program flow, CPMGC, multiple case studies were performed. The algorithm in Table 1 was mathematically proven through several studies [46,58,59]. Due to the definition of single-curved surfaces, which can be unrolled into a plane without any stretching, tearing, or distortion because they have zero Gaussian curvature at every point [43], developable surfaces can be represented as flat surfaces (see Figure 7).
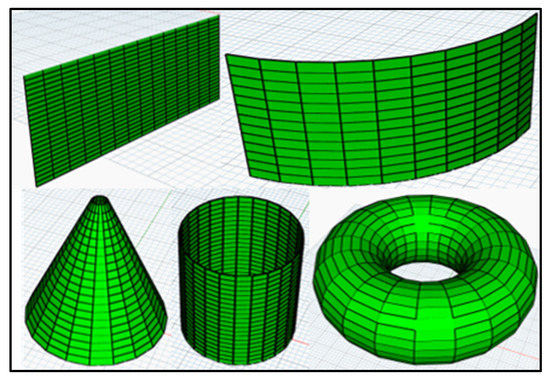
Figure 7.
The classified results of typical flat and developable surfaces.
One example of double-curved surfaces [59], a hyperbolic paraboloid, was classified into two areas with both concave and convex feature-curve areas through the program flow, CPMGC (see Figure 8).
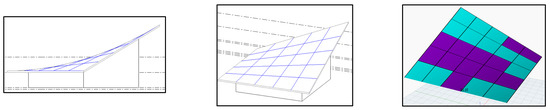
Figure 8.
A hyperbolic paraboloid surface and the classified areas.
The algorithm in Table 1 was converted into Excel and compared to the result of CPMGC in Dynamo. The numbers in Excel range from 0 to 24 and match the areas from the right-bottom side to the left-top side of the picture on the right side of Figure 8. The Excel result in Figure 9 shows the same classifications as the result in Figure 8, demonstrating that the program flow works properly.
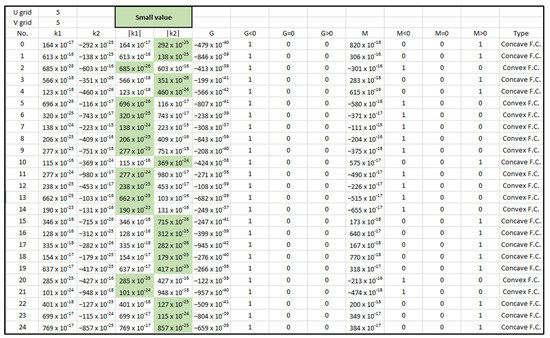
Figure 9.
The Excel result.
To validate the case of single-curved surfaces, the k1s of two areas, Nos. 2 and 5 in Figure 10, were forcibly changed to 0. The k2s of the two areas are less than 0, and the k1s of the two areas are equal to 0; the two areas must be classified as ruled-surfaces. As shown in Figure 10, two classified results are the same and are ruled-surfaces.
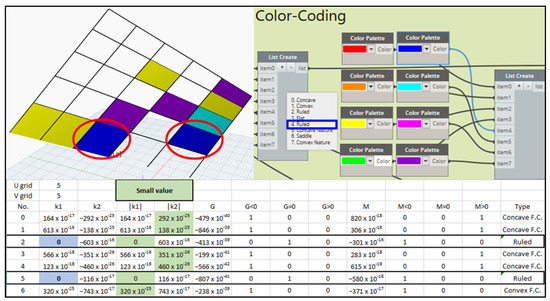
Figure 10.
The results of CPMGC and Excel.
4.2. DDP Case Study
Figure 11 shows the entire process of the DDP case study. The surface in Figure 6 was optimized by using the proposed generative program flow, MOGD, and the results are shown in Figure 12. Inputs, the number of UV grids ranged from 20 to 40 (u grid) and 35 to 50 (v grid) to make each panel smaller than 1.92 m2, the size limitation, considering multiple factors [49]. The objective function was set to minimize Total Cost, Total Planarity, and DP Area. The selected surface has 1812 areas, and some of those areas (709 areas) have threshold distances within 3 mm (0.12 in.), so these areas are panelized by FP.
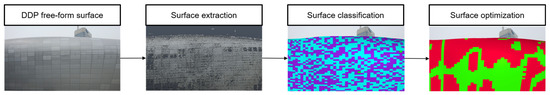
Figure 11.
The DDP Case Study.
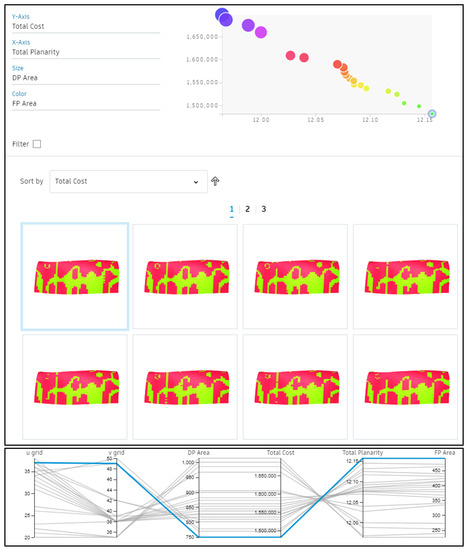
Figure 12.
MOGD results showing design alternatives in Project Refinery.
In order to choose the best design solution, Pareto optimality was applied along with two conflicting objective functions: Total Planarity and Total Cost. As shown in Figure 13, the blue line in the upper graph included seven points that formed the Pareto optimality or front. The big purple circle on the top-left side in the bottom graph is the closest design option to the original design (the bigger circle has a larger DP area). The small sky-blue circle on the bottom-right side in the bottom graph has the lowest total cost. The other pareto fronts represent other possible trade-offs. As shown in Table 2, design option No. 20 has the minimum total planarity with the maximum cost for the 1013.7 m2 (10,911.4 sqft) of DP and 226.2 m2 (2434.8 sqft) of FP. Compared to design option No. 1, which has the minimum total cost and the maximum total planarity, there are differences of 0.193 m (0.63 ft) in total planarity and USD 215,822 in total cost.
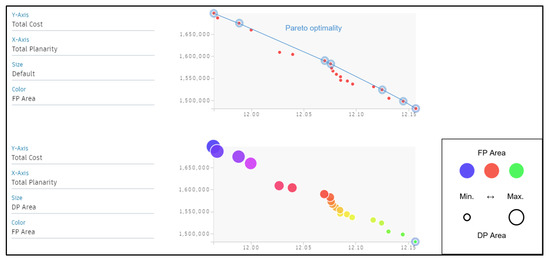
Figure 13.
MOGD results including Pareto fronts in Project Refinery.
Table 2.
The MOGD analysis results.
5. Conclusions
This study proposes parametric and generative program flows for the rationalization of free-form architecture with a user-friendly interface that balances design intent and construction costs. When a free-form surface was designed in Revit TM and imported into Dynamo, the proposed parametric program flow, CPMGC, classified the surface into multiple areas. In AutodeskTM Project Refinery, the classified area for double-curved panels was optimized through the generative program flow, MOGD, by integrating MOO and Pareto optimality. Two conflicting objectives, design intent and construction cost, were applied to the MOO through the generative designs, and the best solutions were chosen by integrating the distance threshold with Pareto optimization. The DDP case study, as shown in Table 2 and Figure 11 and Figure 12, demonstrates overall promising results, with seven design solutions for Pareto optimality. Depending on the areas of DP and FP, each different solution has a different total planarity and total cost. Design solution 1 has the minimum cost and maximum planarity, while design solution 20 has the minimum planarity and maximum cost. From a design perspective, solution 20 is the most appropriate alternative as it is closest to the original design. In terms of construction, solution 1 is the most appropriate alternative. Among the best solutions on Pareto optimality, designers can select the design option that best fits their design objectives through trade-offs. Designers can use the results of this study to make more efficient and informed decisions in the early design process, considering both design and constructional aspects for good free-form architecture.
However, this study has some limitations that need to be addressed in future research:
- This study focuses on the design and cost aspects, which are the most important design factors in free-form architecture. However, other factors, including support structures, statics, repetition, patterns, and shading and other functional aspects, should also be considered.
- Dynamo has fewer available optimization nodes than Grasshopper, another parametric design tool. Future research should develop more nodes to enable further analysis with more advanced algorithms.
Future research should aim to improve the proposed program flows by considering additional variables and design factors.
Author Contributions
Conceptualization, C.L. and S.S.; methodology, C.L.; software, C.L. and S.S.; validation, C.L. and R.R.I.; formal analysis, C.L. and R.R.I.; investigation, C.L.; writing—original draft preparation, C.L.; writing—review & editing, S.S. and R.R.I.; visualization, C.L. and S.S.; supervision, R.R.I.; project administration, C.L.; funding acquisition, S.S. All authors have read and agreed to the published version of the manuscript.
Funding
This research was funded by the National Research Foundation of Korea, grant number “NRF-2022R1F1A1073308” and supported by the Bisa Research Grant of Keimyung University in “20230187”.
Data Availability Statement
The data presented in this study are available on request from the first and corresponding authors. The data are not publicly available due to the policy of the data provider.
Conflicts of Interest
The authors declare no conflict of interest. The sponsors had no role in the design, execution, interpretation, or writing of the study.
References
- Agirbas, A. Façade form-finding with swarm intelligence. Autom. Constr. 2019, 99, 140–151. [Google Scholar] [CrossRef]
- Eigensatz, M.; Kilian, M.; Schiftner, A.; Mitra, N.J.; Pottmann, H.; Pauly, M. Paneling architectural freeform surfaces. In Proceedings of the ACM SIGGRAPH 2010, Los Angeles, CA, USA, 26–30 July 2010. [Google Scholar]
- Yi, Y.K. Building façade multi-objective optimization for daylight and aesthetical perception. Build. Environ. 2019, 156, 178–190. [Google Scholar] [CrossRef]
- Welle, B.; Haymaker, J.; Rogers, Z. ThermalOpt: A methodology for automated BIM-based multidisciplinary thermal simulation for use in optimization environments. Build. Simul. 2011, 4, 293–313. [Google Scholar] [CrossRef]
- Gehry Technologies. Available online: https://trimbleconsulting.com/ (accessed on 3 May 2023).
- Shelden, D. Digital Surface Representation and the Constructability of Gehry’s Architecture. Ph.D. Thesis, Massachusetts Institute of Technology, Cambridge, MA, USA, 2002. Available online: https://dspace.mit.edu/handle.1721.1/16899 (accessed on 15 March 2023).
- Smart Geometry Group. Available online: https://www.smartgeometry.org/ (accessed on 3 May 2023).
- Glymph, J.; Shelden, D.; Ceccato, C.; Mussel, J.; Schober, H. A parametric strategy for free-form glass structures using quadrilateral planar facets. Autom. Constr. 2004, 13, 187–202. [Google Scholar] [CrossRef]
- Bobenko, A.I.; Suris, Y.B. Discrete Differential Geometry: Integrable Structure; Graduate Studies in Math; AMS: Providence, RI, USA, 2009. [Google Scholar]
- Liu, Y.; Pottmann, H.; Wallner, J.; Yang, Y.L.; Wang, W. Geometric modeling with conical meshes and developable surfaces. In ACM SIGGRAPH 2006 Papers; Association for Computing Machinery: New York, NY, USA, 2006; pp. 681–689. [Google Scholar]
- Pottmann, H.; Liu, Y.; Wallner, J.; Bobenko, A.; Wang, W. Geometry of multi-layer freeform structures for architecture. In ACM SIGGRAPH 2007 Papers; Association for Computing Machinery: New York, NY, USA, 2007; pp. 65-1–65-11. [Google Scholar]
- Pottmann, H.; Schiftner, A.; Bo, P.; Schmiedhofer, H.; Wang, W.; Baldassini, N.; Wallner, J. Freeform surfaces from single curved panels. ACM Trans. Graph. 2008, 27, 1–10. [Google Scholar] [CrossRef]
- Fu, C.W.; Lai, C.F.; He, Y.; Cohen-Or, D. K-set Tilable Surface. ACM Trans. Graph. 2010, 29, 1–6. [Google Scholar] [CrossRef]
- Singh, M.; Schaefer, S. Triangle surfaces with discrete equivalence classes. In ACM SIGGRAPH 2010 Papers; Association for Computing Machinery: New York, NY, USA, 2010; pp. 1–10. [Google Scholar]
- Cohen-Steiner, D.; Alliez, P.; Desbrun, M. Variational shape approximation. In ACM SIGGRAPH 2004 Papers; Association for Computing Machinery: New York, NY, USA, 2004; pp. 905–914. [Google Scholar]
- Julius, D.; Kraevoy, V.; Sheffer, A. D-charts: Quasi-developable mesh segmentation. In Computer Graphics Forum; North Holland: Amsterdam, The Netherlands, 2005; Volume 24, pp. 581–590. [Google Scholar]
- Li, B.; Schnabel, R.; Jin, S.; Klein, R. Variational surface approximation and model selection. In Computer Graphics Forum; Blackwell Publishing Ltd.: Oxford, UK, 2009; Volume 28, pp. 1985–1994. [Google Scholar]
- Varady, T.; Martin, R. Reverse engineering. In Handbook of Computer Aided Geometric Design; North Holland: Amsterdam, The Netherlands, 2002; pp. 651–681. [Google Scholar]
- Shamir, A. A survey on mesh segmentation techniques. In Computer Graphics Forum; Blackwell Publishing Ltd.: Oxford, UK, 2008; Volume 27, pp. 1539–1556. [Google Scholar]
- Pauly, M.; Mitra, N.J.; Wallner, J.; Pottmann, H.; Guibas, L.J. Discovering structural regularity in 3D geometry. In ACM SIGGRAPH 2008 Papers; Association for Computing Machinery: New York, NY, USA, 2008; pp. 1–11. [Google Scholar]
- Lindsey, B. Digital Gehry, 1st ed.; Birkhäuser: Basel, Switzerland, 2001; ISBN 3-7643-6562-5. [Google Scholar]
- Gehry Partners. Available online: https://foga.com/ (accessed on 3 May 2023).
- Dassault Systemes. Available online: https://www.3ds.com/products-services/catia/ (accessed on 3 May 2023).
- Fischer, T. Rationalising bubble trusses for batch production. Autom. Constr. 2007, 16, 45–53. [Google Scholar] [CrossRef]
- Foster + Partners. Available online: https://www.fosterandpartners.com/ (accessed on 3 May 2023).
- Whitehead, H. Laws of form. In Architecture in the Digital Age: Design and Manufacturing; Kolarevic, B., Ed.; Taylor & Francis: New York, NY, USA, 2005; ISBN 978-0-415-38141-3. [Google Scholar]
- Hesselgren, L.; Charitou, R.; Dritsas, S. The Bishopsgate Tower case study. Int. J. Arch. Comput. 2007, 5, 61–81. [Google Scholar] [CrossRef]
- Attar, R.; Aish, R.; Stam, J.; Brinsmead, D.; Tessier, A.; Glueck, M.; Khan, A. Embedded rationality: A unified simulation framework for interactive form finding. Int. J. Arch. Comput. 2010, 8, 399–418. [Google Scholar] [CrossRef]
- Pottmann, H. Architectural geometry as design knowledge. Arch. Des. 2010, 80, 72–77. [Google Scholar] [CrossRef]
- Dritsas, S. Design-built rationalization strategies and applications. Int. J. Arch. Comput. 2012, 10, 575–594. [Google Scholar] [CrossRef]
- Fischer, T. Geometry rationalization for non-standard architecture. Arch. Sci. 2012, 5, 25–47. [Google Scholar]
- Pottmann, H.; Eigensatz, M.; Vaxman, A.; Wallner, J. Architectural geometry. Comput. Graph. 2015, 47, 145–164. [Google Scholar] [CrossRef]
- Baldassini, N.; Pottmann, H.; Raynaud, J.; Schiftner, A. New strategies and developments in transparent free-form design: From facetted to nearly smooth envelopes. Int. J. Space Struct. 2010, 25, 185–197. [Google Scholar] [CrossRef]
- Kilian, A. Design innovation through constraint modeling. Int. J. Arch. Comput. 2006, 4, 87–105. [Google Scholar] [CrossRef]
- Pottmann, H.; Asperl, A.; Hofer, M.; Kilian, A. Architectural Geometry, 1st ed.; Bentley Institute Press: Exton, PA, USA, 2007; ISBN 978-1-934493-04-5. [Google Scholar]
- Kolarevic, B. Digital production. In Architecture in the Digital Age: Design and Manufacturing; Kolarevic, B., Ed.; Taylor & Francis: New York, NY, USA, 2005; pp. 30–54. ISBN 978-0-415-38141-3. [Google Scholar]
- Deb, K. Multi-Objective Optimisation Using Evolutionary Algorithms: An Introduction; Springer: London, UK, 2011; pp. 3–34. [Google Scholar]
- Pareto Optimality. Available online: https://web.stanford.edu/group/sisl/k12/optimization/MO-unit5-pdfs/5.8Pareto.pdf (accessed on 3 May 2023).
- The Dynamo Primer Homepage. Available online: https://primer.dynamobim.org/03_Anatomy-of-a-Dynamo-Definition/3-3_dynamo_libraries.html (accessed on 15 March 2023).
- Dynamo Nodes. Available online: https://dynamonodes.com/category/clockwork/ (accessed on 3 May 2023).
- Proving Ground. Available online: https://provingground.io/2018/08/09/lunchbox-for-dynamo-has-a-new-home/ (accessed on 3 May 2023).
- Gauthier, S.; Puech, W.; Bénière, R.; Subsol, G. Digitized 3D mesh segmentation based on curvature analysis. J. Electron. Imaging 2017, 6, 33–38. [Google Scholar] [CrossRef]
- Pottmann, H.; Schiftner, A.; Wallner, J. Geometry of architectural freeform structures. In Proceedings of the 2008 ACM Symposium on Solid and Physical Modeling, Stony Brook, NY, USA, 2–4 June 2008. [Google Scholar]
- Gray, A. The Gaussian and Mean Curvatures. In Modern Differential Geometry of Curves and Surfaces, 2nd ed.; CRC Press: Boca Raton, FL, USA, 1993; pp. 279–285. [Google Scholar]
- Zadravec, M.; Schiftner, A.; Wallner, J. Designing quad-dominant meshes with planar faces. Comput. Graph. Forum 2010, 29, 1671–1679. [Google Scholar] [CrossRef]
- He, Y. Implementing Customized Metal Panels in Architectural Freeform Surfaces. Semantic Scholar. Available online: https://www.semanticscholar.org/paper/Implementing-Customized-Metal-Panels-in-Freeform-He/f27c753386957C2da4da197d4d71b834a3b2bd25 (accessed on 15 March 2023).
- Jabi, W. Parametric spatial models for energy analysis in the early design stages. In Proceedings of the 2014 ACM Symposium on Simulation for Architecture and Urban Design, Tampa, FL, USA, 13–16 April 2014. [Google Scholar]
- Touloupaki, E.; Theodosiou, T. Performance simulation integrated in parametric 3D modeling as a method for early stage design optimization—A review. Energies 2017, 10, 637. [Google Scholar] [CrossRef]
- Lee, C.; Issa, R.R. Factors affecting sizes of paneling for generative design. In Proceedings of the 17th International Conference on Computing in Civil and Building Engineering, Tampere, Finland, 5 June 2018. [Google Scholar]
- Marler, R.T.; Arora, J.S. Survey of multi-objective optimization methods for engineering. Struct. Multidiscip. Optim. 2004, 26, 369–395. [Google Scholar] [CrossRef]
- Konak, A.; Coit, D.W.; Smith, A.E. Multi-objective optimization using genetic algorithms: A tutorial. Reliab. Eng. Syst. Saf. 2006, 91, 992–1007. [Google Scholar] [CrossRef]
- Emmerich, M.T.; Deutz, A.H. A tutorial on multiobjective optimization: Fundamentals and evolutionary methods. Nat. Comput. 2018, 17, 585–609. [Google Scholar] [CrossRef] [PubMed]
- Marler, R.T.; Arora, J.S. The weighted sum method for multi-objective optimization: New insights. Struct. Multidiscip. Optim. 2010, 41, 853–862. [Google Scholar] [CrossRef]
- Bouaziz, S.; Deuss, M.; Schwartzburg, Y.; Weise, T.; Pauly, M. Shape-up: Shaping discrete geometry with projections. Comput. Graph. Forum 2012, 31, 1657–1667. [Google Scholar] [CrossRef]
- Li, Y.; Liu, Y.; Wang, W. Planar hexagonal meshing for architecture. IEEE Tans. Vis. Comput. Graph. 2014, 21, 95–106. [Google Scholar] [CrossRef] [PubMed]
- Liu, Y.; Xu, W.; Wang, J.; Zhu, L.; Guo, B.; Chen, F.; Wang, G. General planar quadrilateral mesh design using conjugate direction field. ACM Trans. Graph. (TOG) 2011, 30, 1–10. [Google Scholar]
- Lim, J.S.; Ock, J.H. Development of the preliminary cost estimate method for the free-form building façade trade in conjunction with the panel optimization algorithm process. Korean J. Constr. Eng. Manag. 2014, 15, 95–106. [Google Scholar] [CrossRef]
- Jia, Y.B. Gaussian and mean curvatures. Com S 2020, 477, 1–7. [Google Scholar]
- Weisstein, E.W. Gaussian Curvature. Available online: https://mathworld.wolfram.com (accessed on 15 March 2023).


Disclaimer/Publisher’s Note: The statements, opinions and data contained in all publications are solely those of the individual author(s) and contributor(s) and not of MDPI and/or the editor(s). MDPI and/or the editor(s) disclaim responsibility for any injury to people or property resulting from any ideas, methods, instructions or products referred to in the content. |
© 2023 by the authors. Licensee MDPI, Basel, Switzerland. This article is an open access article distributed under the terms and conditions of the Creative Commons Attribution (CC BY) license (https://creativecommons.org/licenses/by/4.0/).