Abstract
The determination of the bearing capacity prediction model of concrete-filled steel tubular columns is a key issue in the structural design of prefabricated buildings, which directly relates to the stability and safety of prefabricated buildings. The purpose of this paper is to study the bearing capacity model of concrete-filled steel tubular columns, and propose an explicit formula based on the Gaussian process regression algorithm to calculate the bearing capacity. In order to solve the problem of low accuracy of the traditional empirical bearing capacity model, this paper first proposes a more accurate bearing capacity prediction model based on Gaussian process regression algorithm to automatically learn and capture the characteristics of 122 groups of test data; the paper then determines the function of high sensitivity parameters and section influence parameters through the established bearing capacity prediction model, and this process gives the display formula. Compared with the implicit formula given by a machine learning model, the explicit formula proposed in this paper is more suitable for practical engineering design. In order to verify the validity of the formula, we generated the bearing capacity data through the proposed formula based on the test data and used the descriptive statistical method to verify. The results show that the proposed formula is superior to other existing methods, the error between the data generated by the proposed formula and the test data is smaller, and its accuracy reaches 93.73%, which is more suitable for calculating the bearing capacity of concrete-filled steel tubes with different cross sections.
1. Introduction
Concrete-filled steel tubular columns are the key components in prefabricated buildings and are related to their stability and safety. The reason why concrete-filled steel tubular columns have high bearing capacity is that they make full use of the advantages of steel and concrete [1,2,3]. Concrete has a higher compressive strength and better deformation capacity due to the three-dimensional constraint of steel pipes [4,5]. For steel pipes, because most of them are thin-walled members, which are prone to out-of-plane instability failure under pressure, their material strength cannot be fully developed [6,7,8,9], but when filled with concrete, the lateral stiffness of the pipe wall is greatly increased so that their compression potential can be fully developed [10,11]. Therefore, concrete-filled steel tubular columns have better bearing capacity than single concrete columns or steel tubular columns [12,13,14,15,16].
Research on bearing capacity models of concrete-filled steel tubular columns has attracted much attention. At present, the empirical models used to calculate the bearing capacity of concrete-filled steel tubular columns are obtained by linear or nonlinear regression methods [17,18,19]. Developing these models using linear regression or nonlinear regression requires a large amount of test data, but tests are often limited by funding and the test data obtained are limited [20,21,22,23]. Shen [24] noted that the data samples obtained by traditional test methods are small, so the accuracy of the calculation model derived by linear regression is not high. Nikbin’s [25] research shows that nonlinear regression is greatly affected by test parameters and is prone to overfitting. Le [20] noted that under the condition of a small sample size, the accuracy of the prediction model obtained by using nonlinear regression or linear regression is not high.
In recent years, machine learning methods have demonstrated prominent advantages in predicting the bearing capacity of structural members [26,27,28,29]. The results obtained by researchers in concrete strength prediction [30,31], concrete fatigue strength prediction [32], flexural strength prediction of reinforced concrete beams [33], maximum bearing capacity prediction [34], and bearing capacity prediction of reinforced concrete beams and columns [26] using machine learning show that it can be used to predict the bearing capacity of structural members. As the key component of prefabricated structures, concrete-filled steel tubular columns are directly related to the safety of the structure. Therefore, using machine learning to quickly determine the appropriate model to predict its bearing capacity is conducive to structural design, evaluation, and other engineering purposes. Gao [35] obtained a bearing capacity calculation model of square steel tube columns based on a neural network. Cakiroglu [36] proposed using the support vector machine method to predict the bearing capacity of concrete-filled rectangular steel tubular columns. Ahmadi et al. [37] applied an artificial neural network to predict the bearing capacity of circular concrete-filled steel tubular short columns. Hou [38] noted that using a Gaussian regression process model to predict the bearing capacity of circular concrete-filled steel tubular columns has higher accuracy. In addition, Liu [39] proposed a calculation model for the bearing capacity of concrete-filled steel tubular columns with elliptical sections. However, the formulas given by the machine learning method are all implicit formulas [15,40,41], which is not conducive to design and use by engineers in projects. In addition, the above models do not consider the influence of the section shape of the model on the bearing capacity, resulting in the low accuracy of the results of the model when calculating the bearing capacity of concrete-filled steel tubular columns with different sections [25,42].
To solve the problems mentioned above, this paper proposes a bearing capacity prediction model suitable for concrete-filled steel tubular columns with different cross sections based on Gaussian process regression and provides a display formula to meet the design requirements of concrete-filled steel tubular columns in practical production projects. In this paper, we propose a bearing capacity prediction model. By considering the section shape parameters, we use the Gaussian process regression algorithm to grasp the inherent law of the test data and give the display formula. The rest of this paper is summarised as follows.
Section 2 describes the Gaussian process regression algorithm in detail. Section 3 describes the proposed bearing capacity prediction model and its verification method. Section 4 explains the results and validation of the traditional model and the proposed prediction model. Section 5 discusses the advantages and disadvantages of the bearing capacity prediction model as well as prospects for future work. The last section summarises the full text.
2. Background: GPR
The traditional experimental method is too expensive to produce enough samples for the basic data of the prediction model. Moreover, in recent years, the accuracy of the finite element analysis method and traditional test method analysis in the prediction model has shown problems [20,24,33]. Therefore, this paper applies the machine learning method to structural engineering. BP neural networks [26], support vector machines [20], Gaussian process regression [43], random forests [44], radial basis function neural networks [45] and other methods in the application of concrete strength prediction [46], beam shear strength prediction [47], column bearing capacity prediction [48], bridge damage detection [49], and frame structure damage prediction [50] all show that machine learning can not only predict the damage of the structure in the macro-aspect but also predict the bearing capacity of structural components.
Among many machine learning algorithms, the Gaussian process regression method has advantages in dealing with regression problems such as small sample size, multiple influencing factors, and nonlinearity [51,52,53]. Compared with other machine learning algorithms, such as artificial neural networks and support vector machines, Gaussian process regression is easy to implement, with fewer parameters and strong model interpretability [54,55,56,57,58]. Therefore, this paper uses the Gaussian process regression algorithm to establish a bearing capacity prediction model of concrete-filled steel tubular columns with different sections.
The basic idea of Gaussian process regression is to learn the mapping relationship between independent variables and dependent variables in the dataset and use this mapping relationship to predict a new independent variable and the corresponding value of the dependent variable . To achieve this goal, the following four covariance matrices are established:
In the Gaussian process regression model, each sample y can be expressed as:
where .
The superparameters in the kernel function control the specific shape of the implicit function, such as whether the function changes rapidly or is relatively stable [57]. At present, the most commonly used kernel function is the square exponential kernel function. Therefore, this paper also uses this kernel function to construct the Gaussian process regression model. The square exponential kernel function formula is as follows [56,58]:
where is the signal variance of the covariance function, D is the given training sample set, and is called correlation measurement hyperparameter, which measures the relationship between sample input and correlation of output.
Since the regression model of Gaussian algorithm is used in this paper, the likelihood function surface can be calculated from Formula (5) is shown in Formula (7):
When training the model, the preset training set D is generally used to solve the optimal hyperparameter by maximizing the logarithmic marginal likelihood function , where is covariance of kernel function and is the variance of the residuals. The function is as follows:
At this point, we can obtain the hyperparameter by training the model . Given input parameter , the Gaussian algorithm can obtain the average value of its predicted output value and its variance formula:
where is the unit matrix of the response scale, is covariance of database data.
When using the Gaussian regression process to build a model, the following steps are involved, which are also shown in Figure 1:
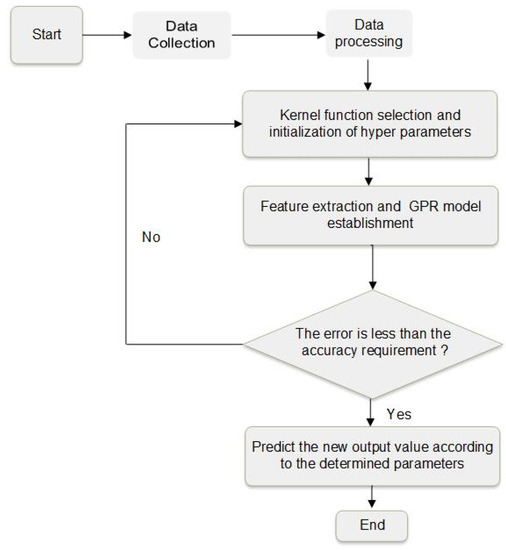
Figure 1.
Regression structure of the Gaussian process.
- (1)
- Collect data and build datasets.
- (2)
- Determine input and output values. Set the input data matrix X = [x1, x2, …, xn] and output matrix Y = [y1, y2, …, yn] based on the dataset, and treat them as the input and output values of the model.
- (3)
- Select the kernel function. An appropriate kernel function transforms the vector inner product operation in high-dimensional space into function calculation in the original low-dimensional space, thus greatly reducing the calculation amount.
- (4)
- A Gaussian process regression model is constructed. Based on the input value, the output value is calculated by Gaussian process regression.
- (5)
- Judge whether the calculated output value meets the requirements. The calculated output value is compared with the output value in the dataset, and if the error is less than 5%, it meets the requirements. Otherwise, return to the kernel function and choose to reconstruct the Gaussian process regression model.
3. Materials and Methods
3.1. Overview
In this section, we propose a prediction model based on the Gaussian process regression algorithm considering section shape parameters. The proposed bearing capacity prediction model uses a Gaussian process regression algorithm to learn the probability distribution of the test data of concrete-filled steel tubular columns with different sections and automatically captures the internal law of the test data. The construction of the bearing capacity prediction model has three main steps, as shown in Figure 2 and summarized as follows:
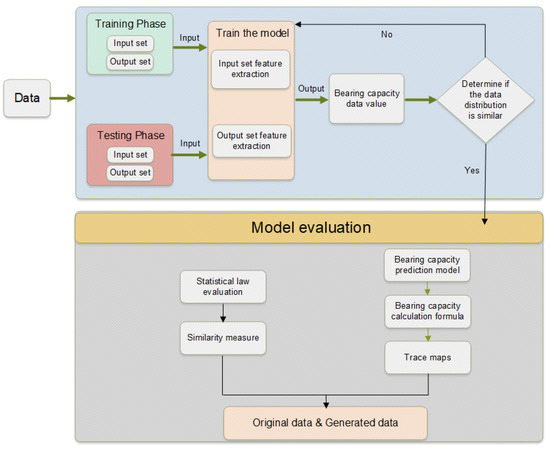
Figure 2.
Flow chart of the bearing capacity prediction model.
- (1)
- Collect data and randomly divide the data into training and test sets. The training set is used to learn and train the model and the test set is used to evaluate the performance of the model. We set 80% of the whole experimental data as the training set and the remaining 20% as the test set.
- (2)
- Use the training set to train and build the model.
- (3)
- Use the test set to verify the generated model.
3.2. Step 1: Data Collection
- (1)
- Main section form of the concrete-filled steel tube column
The section shape of the steel tube affects the restraint of the steel tube on the concrete, thus affecting the bearing capacity of the concrete-filled steel tube. At present, the most studied section forms of concrete-filled steel tubes at home and abroad are mainly circular, rectangular, and elliptical, as shown in Figure 3. The slenderness ratio of concrete-filled steel tubular columns is generally between 1.5 and 8.0.

Figure 3.
Common section forms of concrete-filled steel tube columns. (a) Rectangular section. (b) Circular section. (c) Elliptical section.
- (2)
- Data description
This paper collects 122 groups of test data of the bearing capacity of concrete-filled steel tubes at home and abroad [59,60,61,62,63,64,65,66]. The tests carried out in the relevant documents are all axial compression of the concrete-filled steel tube by a hydraulic press to obtain the bearing capacity data of the concrete-filled steel tube. Before the test load, the concrete-filled steel tube column is guaranteed not to be subjected to eccentric pressure by fixing the column base. After sorting out the test data in the above documents, the factors affecting the bearing capacity of three types of concrete-filled steel tubular columns are obtained as follows: 1. The section area of the steel tubular columns (A); 2. section length (a0) and width (b0) of rectangular steel tube column; 3. section diameter of the circular steel pipe column (D); 4. the major axis (a1) and minor axis (b0) of the section of the elliptical steel tube column; 5. height of the steel pipe column (l); 6. wall thickness of the steel pipe column (t); 7. concrete cube strength (fc); and 8. steel strength (fy). Table 1, Table 2 and Table 3 list the minimum, maximum, average, and standard deviation of the bearing capacity test data of concrete-filled steel tubes with different sections.

Table 1.
Test parameters of the rectangular concrete-filled steel tube column.

Table 2.
Test parameters of the circular concrete-filled steel tube column.

Table 3.
Test parameters of the elliptical concrete-filled steel tube column.
- (3)
- Sensitivity analysis
To confirm the impact of the influencing factors on the bearing capacity, sensitivity analysis of these parameters is needed. By analysing the sensitivity of these parameters, we can reduce the number of parameters to simplify the model and improve the calculation speed. At present, the cosine amplitude method [51,52] is commonly used to analyse the radial sensitivity of influencing factors. Therefore, this paper also uses the relationship strength formula in the cosine amplitude method to calculate the sensitivity value of each influencing factor. The relationship strength formula is as follows:
In Formula (11), , . The letter i represents the number of vectors, and n represents the length of the vectors.
The above test data summarise 8 factors affecting the bearing capacity. To simplify the model, the ratio method is adopted to reduce the number of influencing factors of the model to five, which are as follows:: 1. the section area of the steel tube column (A), 2. the width–thickness ratio (b/t), 3. the slenderness ratio (l/d), 4. concrete strength (fc), and 5. steel strength (fy).
The r value between each influencing factor and the bearing capacity is shown in Figure 4. The figure shows that l/d has the greatest impact on output parameters, followed by b/t. A ranks third, followed by fy and fc.
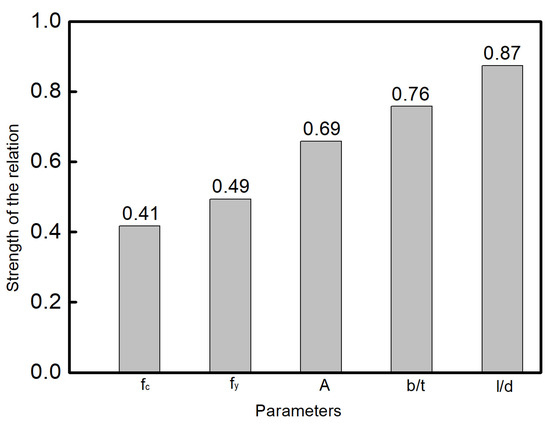
Figure 4.
Sensitivity analysis of influencing factors.
3.3. Step 2: Model Construction
- (1)
- Bearing capacity prediction model
To calculate the bearing capacity of concrete-filled steel tubular columns, researchers from different countries have proposed different calculation formulas. Among them, the formulas proposed by the Chinese code [67], the American ACI code [68], the European code EC4 [69], and the Japanese AIJ code [70] are the most widely used.
The formula proposed by the Chinese code is as follows:
In the above formula, and refer to the influencing factors affecting the bearing capacity value, whose specific value is referred to in [65]. is the concrete strength value, is the concrete section area, is the steel strength value, and is the cross-sectional area of the steel pipe.
The formula proposed by the American ACI specification is as follows:
where represents the compressive strength of the concrete cylinder.
The formula proposed by European Regulation EC4 is as follows:
In the above formula, is the material partial coefficient of concrete, which is 1.1, and is the material partial coefficient of steel, which is 1.5.
The formula proposed by the Japanese AIJ specification is as follows:
where is the reduction coefficient of the compressive strength of the concrete cylinder, taken as 0.85, and represents the steel pipe strength improvement coefficient, taken as 0.27.
Relevant research [24,36,62] show that the accuracy of the bearing capacity prediction model derived using the Gaussian regression process algorithm is significantly improved. Among them, Le [20] and Nikbin [26] further pointed out that, through the analysis and control of highly sensitive parameters, the predicted value of the model is closer to the test value of concrete-filled steel tubular columns. Therefore, to accurately calculate the bearing capacity of concrete-filled steel tubular columns, we characterise the two most sensitive parameters, l/d and b/t, in the sensitivity analysis in Section 3.3 as the influence parameters and , and propose the following formula based on the Chinese standard formula:
where is the shape correction parameter. When the section shape of the concrete-filled steel tube column is rectangular, is 1.
- (2)
- Parameter determination
To determine the influence coefficients and of Formula (17), based on the rectangular concrete-filled steel tube column, we obtained Formula (18) and confirmed the influence coefficients and through the Gaussian process regression algorithm.
To confirm the combination of two functions that affect the parameters, we adopted 10-layer cross-validation [37,44]. That is, for each combination, we repeated the training ten times in the Gaussian process regression model. In each iteration, a subset is selected as the validation set to evaluate the model trained by the remaining nine subsets. Then, we output the average accuracy of the ten prediction results. Finally, through grid search [45,52], the combination with the highest average accuracy is selected as the function of the influence parameters, as shown below:
The literature [57,58] shows that the bearing capacity of concrete-filled steel tubular columns is most affected by the short side of its section, so we define the ratio of the length of the elliptical short axis (b1) to the width of the rectangle (b0) under the same cross-sectional area as . The ratio of circular diameter (D) to rectangular width (b0) is .The section shape correction coefficients of the elliptical section () and the coefficients of circular section () obtained by fitting the least square method [39,42] are, respectively, given in Formulas (21) and (22):
3.4. Step 3: Effectiveness Evaluation
To evaluate the accuracy of the model, the following three indicators [25,39] are used to evaluate the performance of each model: (1) coefficient of determination (R2), (2) root mean square error (RMSE), and (3) mean absolute error (MAE). The mathematical formulas are as follows:
where and represent the predicted value and experimental value, respectively. m represents the total number of data points, and is the average of the test values. Theoretically, the lower the RMSE and MAE are, the more accurate the evaluation. The R2 value is between 0 and 1. When the model is close to 1, the prediction ability is better, and when it is close to 0, the prediction performance is worse. These performance indicators are good measures of overall prediction accuracy.
4. Results and Analysis
To obtain the bearing capacity model of concrete-filled steel tubular columns with various cross sections, this paper uses the Gaussian process regression algorithm to study the 122 groups of data collected, captures the characteristics of the data, and proposes a prediction model for the bearing capacity of concrete-filled steel tubular columns with different cross sections.
4.1. Results of the Traditional Model
The traditional empirical model uses 122 sets of test data collected in this paper as samples, calculates parameters after determining their respective probability distribution, and then generates data. To reflect the distribution characteristics of the test data and the data generated by the traditional empirical model, the two groups of data distribution characteristics are compared. In this paper, a box diagram of the bearing capacity of the test data and the traditional empirical model is drawn. The Y-axis shows the values obtained from the data, as shown in Figure 5. Figure 5 shows that the median, maximum, and data dispersion calculated by the traditional empirical model are close to those of the test data.
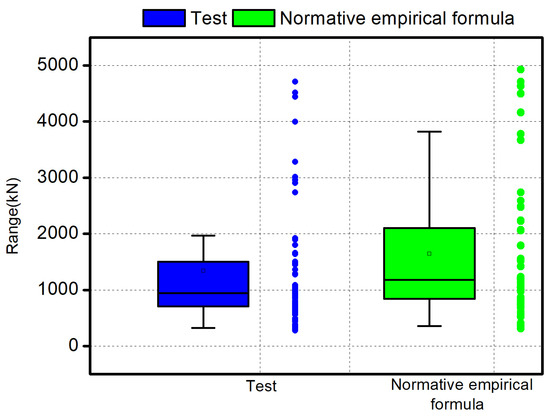
Figure 5.
Box plots of bearing capacity calculated by Chinese empirical formula compared with test data.
To compare the overall distribution of the two groups of data, the cumulative distribution function curve of the bearing capacity of the test data and the data generated by the traditional empirical model is drawn in Figure 6. The parameter value is displayed on the horizontal axis and the cumulative probability is displayed on the vertical axis. As shown in Figure 6, the 122 cumulative distribution function curves of the data generated by the traditional empirical model are not consistent with the 122 original data curves.
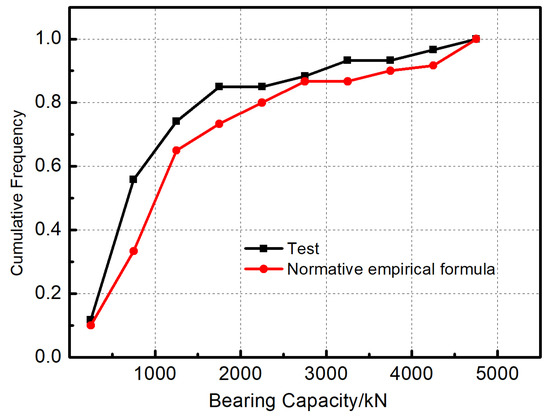
Figure 6.
Cumulative distribution function curve of the bearing capacity calculated by the Chinese empirical formula compared with the test data.
4.2. Results of the Bearing Capacity Prediction Model
The proposed bearing capacity prediction model also uses the generated prediction value of the test data. Figure 7 shows the results compared with the 122 original data points, where the Y-axis shows the values obtained from the data. The results of the bearing capacity prediction model are very close to those of the original data.
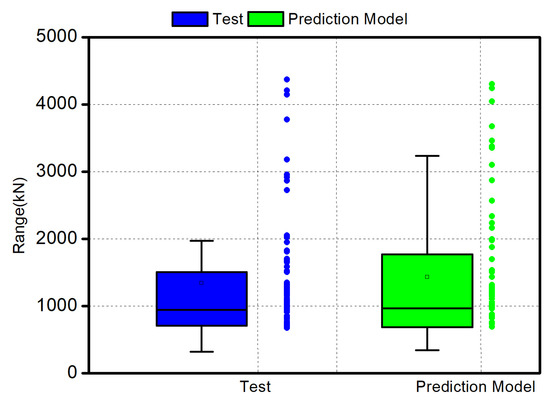
Figure 7.
Box plots for calculating the bearing capacity of the modified formula compared with the test data.
Figure 8 shows the cumulative distribution function curve of the bearing capacity of the bearing capacity prediction model compared with the original data. The parameter value is displayed on the horizontal axis, while the cumulative probability is displayed on the vertical axis. As shown in Figure 8, the cumulative 122 distribution function curves of the data generated by the bearing capacity prediction model are basically consistent with the 122 original data curves.
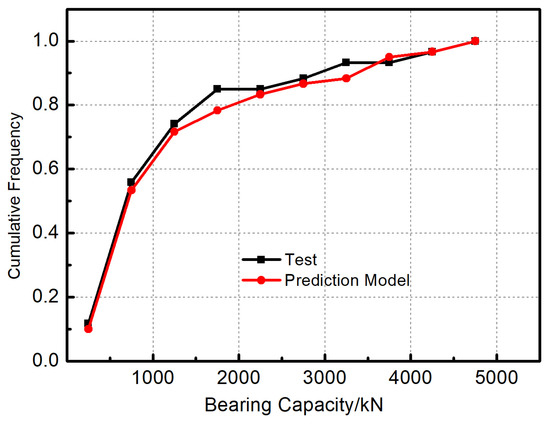
Figure 8.
Cumulative distribution function curve of the bearing capacity calculated by the modified formula compared with the test data.
4.3. Comparison of Results and Analysis
To visually observe the accuracy of the proposed bearing capacity prediction model and the traditional empirical model, Figure 9 and Figure 10 show the regression diagrams of the calculated values and test values of different models. Figure 9 and Figure 10 show that the data value calculated by the proposed bearing capacity prediction model is the most consistent with the experimental value. In other words, the data points of the ratio of the calculated value to the actual value are all located around the line y = x, and the error is controlled within ±10%.
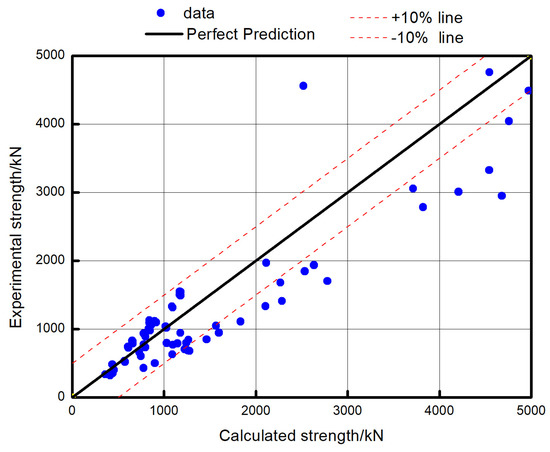
Figure 9.
Regression between the calculated value and actual value of the traditional model.
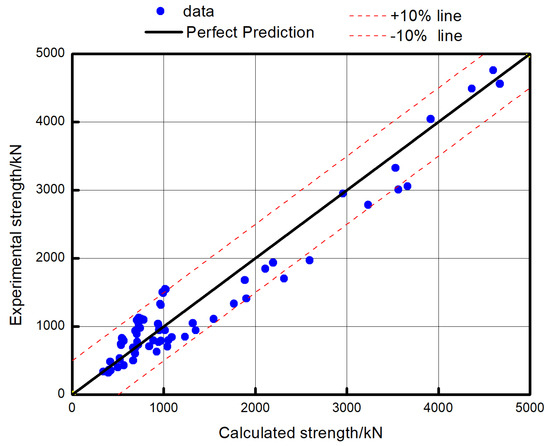
Figure 10.
Regression diagram of the calculated value and actual value of the bearing capacity prediction model.
The evaluation coefficient of the model is shown in Table 4. The determination coefficient R2 of the bearing capacity prediction model is greater than that calculated by the traditional empirical model. The average absolute error value and the root mean square error value of the bearing capacity prediction model are smaller than the error value calculated by the traditional empirical model. Therefore, compared with the traditional empirical model, the bearing capacity prediction model is more suitable for calculating the bearing capacity of concrete-filled steel tubular columns with different sections.

Table 4.
Evaluation index results of the bearing capacity prediction model and traditional model.
5. Discussion
In this paper, based on the Gaussian process regression algorithm, we propose a bearing capacity prediction model considering shape parameters. This section analyses the advantages and disadvantages of the model and prospects for future work in this field.
The advantage of the bearing capacity prediction model is that it uses the Gaussian process regression algorithm to learn the law under the condition of small sample size, automatically discover the internal relationship of the data, and determine the relevant parameters of the model. The traditional empirical model does not consider the influence of different section forms on the bearing capacity of concrete-filled steel tubular columns. Therefore, in the proposed bearing capacity prediction model, we characterised the above effects as shape parameters and determined them. Based on the results in Section 3, the accuracy and regularity of the data generated by the proposed bearing capacity prediction model have been verified by the box diagram and cumulative distribution function.
It can be seen from the results in Figure 11 that the data points calculated by the proposed bearing capacity prediction model are concentrated within the error line of ±10%, while the errors calculated by different empirical formulas around the world are significantly larger, which is reflected in the discrete data points, and the data points are essentially distributed to the left and right of the error line of ±20%. Therefore, the accuracy of the bearing capacity prediction model based on the Gaussian process regression algorithm in this paper is better than that of the traditional empirical formula.
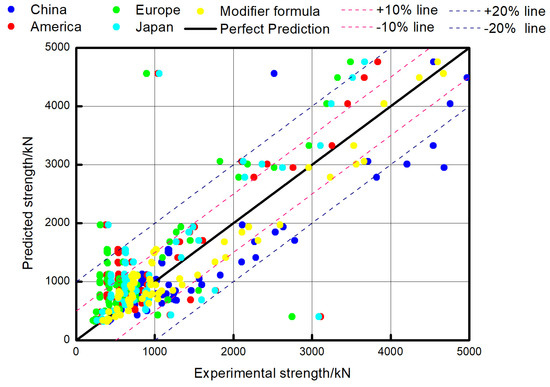
Figure 11.
Regression chart of calculated value and actual value of formulas and revised formulas in different countries.
In order to verify that the proposed bearing capacity model can predict data outside the database, this article collected an additional 60 sets of data [71,72,73,74] as test sets to verify the accuracy of the formula. From the results in Figure 12, it can be seen that the data points calculated by the proposed calculation formula are concentrated within an error line of ±10%, with an accuracy of 93.73%. Therefore, the proposed formula can be used to calculate the bearing capacity of concrete filled steel tubular columns with different cross sections.
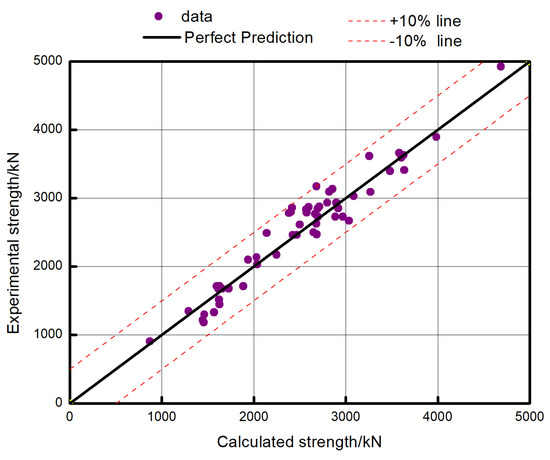
Figure 12.
Regression diagram of calculated value and actual value verified by modified formula.
The advantages of the bearing capacity model proposed in this paper are three-fold: (1) The bearing capacity prediction model based on the Gaussian process regression algorithm does not require a complex mechanical or theoretical derivation but uses Gaussian process regression to give a displayed formula, which is used by structural engineers and researchers. (2) Different from the empirical models of other countries, which are usually only applicable to single section calculations, the bearing capacity prediction model considers the influence of section shape on the bearing capacity and obtains a more accurate calculation formula. (3) The accuracy of the bearing capacity prediction model based on the Gaussian process regression algorithm is higher than that of the traditional empirical model.
The main problem of the bearing capacity model proposed in this paper is the quality of data, which is also the key to the accuracy of the model. The validity of the model depends on the quality of the data to a large extent, and invalid data will greatly reduce the accuracy of the model output. If the experimental data are too few, it is difficult to train the model and verify the accuracy of the model. At the same time, if the collected data of concrete-filled steel tubular columns with different cross sections are not uniform, it is difficult to ensure the reliability of the model in predicting the bearing capacity of concrete-filled steel tubular columns with different cross sections.
In the future, we will use numerical simulation to generate new data and test data to form composite data, which will go to improve data quality, a limitation of the current study due to insufficient training samples of the model. In addition, we will also consider using more advanced machine learning algorithms to capture data rules to further improve the accuracy of the prediction model and to better guide the actual project.
6. Conclusions
The Gaussian process regression algorithm can accurately grasp the characteristics of data by learning the rules of test data from small sample sizes. Therefore, based on the Gaussian process regression algorithm, we propose a more accurate bearing capacity prediction model and give a display formula to calculate the bearing capacity of concrete-filled steel tubular columns. The bearing capacity prediction model proposed in this paper considers the influence of the section form of concrete-filled steel tubular columns on the bearing capacity, characterises the above influence as a unified shape parameter, and gives a determination method for the shape parameters. For concrete-filled steel tubular columns with different sections, the determination coefficient, average absolute error, and root mean square error are used as evaluation indices to compare the traditional empirical model with the proposed bearing capacity prediction model.
Based on the comparative analysis results, we can draw the following conclusions: (1) The proposed bearing capacity prediction model can use the Gaussian process regression algorithm to learn the probability distributions of the test parameters of concrete-filled steel tubular columns. According to the box diagram and cumulative distribution function diagram, the data generated by the proposed bearing capacity prediction model are very similar to the 122 groups of actual data of the test. (2) Compared with the traditional empirical model, the bearing capacity prediction model proposed in this paper fully considers the impact of different section forms on the bearing capacity of concrete-filled steel tubular columns, uses shape parameters to characterise the impact of section forms on the bearing capacity, determines the shape parameters, and gives the display formula. (3) The error between the data generated by the proposed bearing capacity prediction model and the test value is within 10%, which is smaller than the error between the data generated by the traditional empirical model and the test data. Therefore, the proposed bearing capacity prediction model is more suitable for calculating the bearing capacity of concrete-filled steel tubular columns with different sections.
Author Contributions
W.D.: Data Curation, Writing of Manuscript, and Validation; S.J.: Reviewing and Editing. All authors have read and agreed to the published version of the manuscript.
Funding
This research was funded by the financial support of National Natural Science Foundation of China (grant number 51508009).
Institutional Review Board Statement
Not applicable.
Data Availability Statement
The data is presented in the article.
Conflicts of Interest
The authors declare no conflict of interest.
References
- Chen, J.; Lu, Y.; Li, S. Theoretical analysis of steel fiber reinforced high strength concrete filled steel tube under axial compression. Eng. Mech. 2011, 28, 115–121. (In Chinese) [Google Scholar]
- Chen, M.; Liu, J.; Huang, H. Study on circle recycled aggregate concrete-filled steel tube under axial compression. Concrete 2014, 8, 43–48. (In Chinese) [Google Scholar]
- Xu, Y.; Zhang, Y.; Cui, L.; Asme. Experimental Study on T-shaped Concrete-Filled Steel Tube Core Columns Subjected to Axial-Compression. In Proceedings of the International Conference on Technology Management and Innovation, Wuhan, China, 18–19 July 2010. [Google Scholar]
- Chen, Y.; Cao, G.; Chen, Z.; Hu, J. Research on mechanical performance and bearing capacity calculation method of expansive concrete filled steel tube columns under axial compression. Build. Struct. 2014, 44, 36–40. (In Chinese) [Google Scholar]
- Guo, L.; Liu, Y.; Fu, F.; Huang, H. Behavior of axially loaded circular stainless steel tube confined concrete stub columns. Thin-Walled Struct. 2019, 139, 66–76. [Google Scholar] [CrossRef]
- Gu, W.; Zhao, Y. Experimental study on concrete filled CFRP-steel tube columns with axial compression. China Civ. Eng. J. 2007, 40, 23–28. (In Chinese) [Google Scholar]
- Huang, X.; Jiang, J.; Sun, T.; Jiang, W. Axial compression behavior of round-shaped concrete-filled steel tube short columns. Build. Struct. 2022, 52, 100–105. (In Chinese) [Google Scholar]
- Li, G.C.; Li, S.J.; Wang, Q.; Wang, Y.S.; Zhang, C.Y. Nonlinear finite element analysis on short columns of high strength concrete filled square steel tube with inner cfrp circular tube. In Proceedings of the 7th International Conference on Steel and Aluminium Structures (ICSAS), Kuching, Malaysia, 13–15 July 2011. [Google Scholar]
- Wang, Y.; Bi, L. Research on seismic behavior of new multiple concrete filled steel tube column-beam joints. Build. Struct. 2019, 49, 42–47. [Google Scholar]
- Wei, G.; Yinghua, Z.; Yongxin, J. Research on bearing capacity of long concrete-filled cfrp-steel tubular columns with axial compression. Eng. Mech. 2008, 25, 147–152. (In Chinese) [Google Scholar]
- Wang, L.; Jiang, X. Calculation of load capacities for short concrete-filled steel-tube columns with rectangular section. J. Guilin Inst. Technol. 2003, 23, 441–444. [Google Scholar]
- Zhang, X.; Chen, Z.; Xue, J. Analysis of seismic failure mechanism and damage for recycled aggregate concrete filled steel tube column. World Earthq. Eng. 2017, 33, 174–182. (In Chinese) [Google Scholar]
- Jie, L.; Zhengzhong, W. Research on bearing capacity of steel concrete axially compressed short column reinforced with high strength concrete filled steel tube. J. Northwest Sci.-Tech. Univ. Agric. For. 2005, 33, 130–134. (In Chinese) [Google Scholar]
- Jung, H.-S.; Choi, C.-s. An Experimental Study on the Behavior of Square Concrete-Filled High Strength Steel Tube Columns. J. Iron Steel Res. Int. 2011, 18, 878–882. [Google Scholar]
- Li, G.-C.; Ma, L. Experimental study on short columns of high-strength concrete filled square steel tube with inner cfrp circular tube under axially compressive load. In Proceedings of the International Symposium on Innovation and Sustainability of Structures in Civil Engineering, Guangzhou, China, 28–30 November 2009. [Google Scholar]
- Yao, G.; Li, Y.; Liao, F. Behavior of concrete-filled steel tube reinforced concrete columns subjected to axial compression. J. Build. Struct. 2013, 34, 114–121. (In Chinese) [Google Scholar]
- Tokgoz, S.; Dundar, C. Experimental study on steel tubular columns in-filled with plain and steel fiber reinforced concrete. Thin-Walled Struct. 2010, 48, 414–422. [Google Scholar] [CrossRef]
- Tran, V.-L.; Thai, D.-K.; Kim, S.-E. Application of ANN in predicting ACC of SCFST column. Compos. Struct. 2019, 228, 111332. [Google Scholar] [CrossRef]
- Moon, J.; Kim, J.J.; Lee, T.-H.; Lee, H.-E. Prediction of axial load capacity of stub circular concrete-filled steel tube using fuzzy logic. J. Constr. Steel Res. 2014, 101, 184–191. [Google Scholar] [CrossRef]
- Le, T.-T. Practical Hybrid Machine Learning Approach for Estimation of Ultimate Load of Elliptical Concrete-Filled Steel Tubular Columns under Axial Loading. Adv. Civ. Eng. 2020, 2020, 8832522. [Google Scholar] [CrossRef]
- Hua, W.; Wang, H.-J.; Hasegawa, A. Experimental study on reinforced concrete filled circular steel tubular columns. Steel Compos. Struct. 2014, 17, 517–533. [Google Scholar] [CrossRef]
- Jung, H.-S.; Yun, H.-J.; Ha, T.-H.; Choi, C.-S. Experimental study on the behavior of slender square concrete-filled high strength steel tube columns under axial loads. In Proceedings of the Fib Symposium PRAGUE 2011 on Concrete Engineering for Excellence and Efficiency, Praha, Czech Republic, 8–10 June 2011. [Google Scholar]
- Wei, H.; Wang, H.J.; Sun, H.X. Comparison between the behaviours of reinforced concrete filled circular and square steel tubular short columns. In Proceedings of the International Symposium on Innovation and Sustainability of Structures in Civil Engineering, Tongji University, Shanghai, China, 28–30 November 2008. [Google Scholar]
- Shen, Q.H.; Wang, J.F.; Wang, W.; Wang, J. Axial compressive behavior and bearing capacity calculation of ECFST columns based on numerical analysis. Prog. Steel Build. Struct. 2015, 6, 68–78. [Google Scholar]
- Nikbin, I.M.; Rahimi, S.; Allahyari, H. A new empirical formula for prediction of fracture energy of concrete based on the artificial neural network. Eng. Fract. Mech. 2017, 186, 466–482. [Google Scholar] [CrossRef]
- Mundher, Z.; Deo, R.C.; Hilal, A.; Abd, A.M.; Cornejo, L.; Salcedo-Sanz, S.; Nehdi, M.L. Predicting compressive strength of lightweight foamed concrete using extreme learning machine model. Adv. Eng. Softw. 2018, 115, 112–125. [Google Scholar] [CrossRef]
- Zhang, B.; Phillips, D.V.; Wu, K. Effects of loading frequency and stress reversal on fatigue life of plain concrete. Mag. Concr. Res. 1996, 48, 361–375. [Google Scholar] [CrossRef]
- Chou, J.S.; Tsai, C.F. Concrete compressive strength analysis using a combined classification and regression technique. Autom. Constr. 2012, 24, 52–60. [Google Scholar] [CrossRef]
- Devaney, R.J.; O’Donoghue, P.E.; Leen, S.B. Global and local fatigue analysis of X100 and X60 steel catenary riser girth welds. J. Struct. Integr. Maint. 2017, 2, 181–189. [Google Scholar] [CrossRef]
- Namyong, J.; Sangchun, Y.; Hongbum, C. Prediction of compressive strength ofin-situ concrete based on mixture proportions. J. Asian Archit. Build. Eng. 2004, 3, 9–16. [Google Scholar] [CrossRef]
- Ben Chaabene, W.; Flah, M.; Nehdi, M.L. Machine learning prediction of mechanical properties of concrete: Critical review. Constr. Build. Mater. 2020, 260, 119889. [Google Scholar] [CrossRef]
- Zhang, W.; Lee, D.; Lee, J.; Lee, C. Residual strength of concrete subjected to fatigue based on machine learning technique. Struct. Concr. 2022, 23, 2274–2287. [Google Scholar] [CrossRef]
- Solhmirzaei, R.; Salehi, H.; Kodur, V. Predicting Flexural Capacity of Ultrahigh-Performance Concrete Beams: Machine Learning-Based Approach. J. Struct. Eng. 2022, 148, 04022031. [Google Scholar] [CrossRef]
- Thirumalaiselvi, A.; Verma, M.; Anandavalli, N.; Rajasankar, J. Response prediction of laced steel-concrete composite beams using machine learning algorithms. Struct. Eng. Mech. 2018, 66, 399–409. [Google Scholar] [CrossRef]
- Gao, H. Calculation of Load-carrying Capacity of Square Concrete Filled Tube Columns Based on Neural Network. In Proceedings of the International Conference on Green Building, Materials and Civil Engineering (GBMCE 2011), Shangri-La, China, 22–23 August 2011. [Google Scholar]
- Cakiroglu, C.; Islam, K.; Bekdas, G.; Kim, S.; Geem, Z.W. Interpretable Machine Learning Algorithms to Predict the Axial Capacity of FRP-Reinforced Concrete Columns. Materials 2022, 15, 2742. [Google Scholar] [CrossRef]
- Ahmadi, M.; Naderpour, H.; Kheyroddin, A. Utilization of artificial neural networks to prediction of the capacity of CCFT short columns subject to short term axial load. Arch. Civ. Mech. Eng. 2014, 14, 510–517. [Google Scholar] [CrossRef]
- Hou, C.; Zhou, X.-G. Strength prediction of circular CFST columns through advanced machine learning methods. J. Build. Eng. 2022, 51, 104289. [Google Scholar] [CrossRef]
- Liu, X.C.; Zha, X.X. Study on behavior of elliptical concrete filled steel tube members I: Stub and long columns under axial compression. Prog. Steel Build. Struct. 2011, 1, 8–14. [Google Scholar]
- Xie, Z.; Liang, S.; Luan, T. Instability warning model of open-pit mine slope based on BP neural network. In Proceedings of the 3rd International Conference on Civil Engineering and Urban Planning (CEUP), Wuhan, China, 20–22 June 2014. [Google Scholar]
- Yuan, S.; Luo, D.; Wang, F.; Jiang, X. Research on processing method of mechanical design data based on BP artificial neural network. In Proceedings of the Xian International Conference on Architecture and Technology, Xi’an, China, 23–25 September 2006. [Google Scholar]
- Lachowicz, J.; Rucka, M. Diagnostics of pillars in St. Mary’s Church (Gdańsk, Poland) using the GPR method. Int. J. Archit. Herit. 2019, 13, 1223–1233. [Google Scholar] [CrossRef]
- Li, J.; Zhang, C.; Zhao, Y.; Qiu, W.; Chen, Q.; Zhang, X. Federated learning-based short-term building energy consumption prediction method for solving the data silos problem. Build. Simul. 2022, 15, 1145–1159. [Google Scholar] [CrossRef]
- Zhao, P.; Yan, H. Risk warning model based on radial basis function neural network. In Proceedings of the Xian International Conference on Architecture and Technology, Xi’an, China, 23–25 September 2006. [Google Scholar]
- Dai, B.; Gu, C.; Zhao, E.; Zhu, K.; Cao, W.; Qin, X. Improved online sequential extreme learning machine for identifying crack behavior in concrete dam. Adv. Struct. Eng. 2019, 22, 402–412. [Google Scholar] [CrossRef]
- Shi, X.; Liu, Q.; Lv, X. Application of SVM in predicting the strength of cement stabilized soil. In Proceedings of the 2nd International Conference on Intelligent Structure and Vibration Control (ISVC 2012), Chongqing, China, 16–18 March 2012. [Google Scholar]
- Lazaridis, P.C.; Kavvadias, I.E.; Demertzis, K.; Iliadis, L.; Vasiliadis, L.K. Structural Damage Prediction of a Reinforced Concrete Frame under Single and Multiple Seismic Events Using Machine Learning Algorithms. Appl. Sci. 2022, 12, 3845. [Google Scholar] [CrossRef]
- Chen, L.; Zhan, C.; Li, G.; Zhang, A. An artificial neural network identification method for thermal resistance of exterior walls of buildings based on numerical experiments. Build. Simul. 2019, 12, 425–440. [Google Scholar] [CrossRef]
- Ke, S.; Chu, J.; Chen, J.; Qu, Z. Prediction on Wind Effects of Large Cooling Towers Based on Grey-Neural Network Joint Model. J. Nanjing Univ. Aeronaut. Astronaut. 2014, 46, 652–658. (In Chinese) [Google Scholar]
- Li, D.; Ai, Y. Study on fault diagnosis of elevator based on neural network information fusion technology. Comput. Eng. Appl. 2010, 46, 231–234. (In Chinese) [Google Scholar]
- Peng, Z.; Feng, K.; Xiao, M.; He, C.; Jiang, C.; Chen, H. Reasonable overlying thickness of subaqueous tunnels based on pressure arch theory. Rock Soil Mech. 2018, 39, 2609–2616. (In Chinese) [Google Scholar]
- Bradecki, T.; Swoboda, J.; Nowak, K.; Dziechciarz, K. Models for Experimental High Density Housing. In Proceedings of the World Multidisciplinary Civil Engineering-Architecture-Urban Planning Symposium (WMCAUS), Prague, Czech Republic, 12–16 June 2017. [Google Scholar]
- Potocnik, P.; Vidrih, B.; Kitanovski, A.; Govekar, E. Neural network, ARX, and extreme learning machine models for the short-term prediction of temperature in buildings. Build. Simul. 2019, 12, 1077–1093. [Google Scholar] [CrossRef]
- Wu, X.; Xing, Q.; Chen, M.; Cheng, J.; Yang, C. Power quality disturbance detection method using improved complementary ensemble empirical mode decomposition. J. Zhejiang Univ. Eng. Sci. 2017, 51, 1834–1843. [Google Scholar]
- Samui, P.; Jagan, J. Determination of effective stress parameter of unsaturated soils: A Gaussian process regression approach. Front. Struct. Civ. Eng. 2013, 7, 133–136. [Google Scholar] [CrossRef]
- Hamrouche, R.; Klysz, G.; Balayssac, J.-P.; Rhazi, J.; Ballivy, G. Numerical simulations and laboratory tests to explore the potential of ground-penetrating radar (gpr) in detecting unfilled joints in brick masonry structures. Int. J. Archit. Herit. 2012, 6, 648–664. [Google Scholar] [CrossRef]
- Alimoradi, A.; Beck, J.L. Machine-Learning Methods for Earthquake Ground Motion Analysis and Simulation. J. Eng. Mech. 2015, 141, 04014147. [Google Scholar] [CrossRef]
- Dias, P.P.; Jayasinghe, L.B.; Waldmann, D. Machine learning in mix design of Miscanthus lightweight concrete. Constr. Build. Mater. 2021, 302, 124191. [Google Scholar] [CrossRef]
- Cai, J.; Zheng, X.; Chen, Q.; Zuo, Z.; Yang, C.; Zheng, J. Experimental study on axial compression behavior of stiffened square section CFST short columns. J. Build. Struct. 2014, 35, 178–185. (In Chinese) [Google Scholar]
- Yang, Y.; Wu, C.; Liu, Z.; Qin, Y.; Wang, W. Comparative study on square and rectangular UHPFRC-Filled steel tubular (CFST) columns under axial compression. Structures 2021, 34, 2054–2068. [Google Scholar] [CrossRef]
- Zhang, C.; Yin, Y.; Zhou, Y. Experimental study on seismic behaviors of high strength concrete filled steel tube columns. Earthq. Eng. Eng. Vib. 2004, 24, 86–89. (In Chinese) [Google Scholar]
- Zhou, C.; Chen, W.; Ruan, X.; Tang, X. Experimental Study on Axial Compression Behavior and Bearing Capacity Analysis of High Titanium Slag CFST Columns. Appl. Sci. 2019, 9, 2021. [Google Scholar] [CrossRef]
- Han, L.H. Tests on stub columns of concrete-filled RHS sections. J. Constr. Steel Res. 2002, 58, 353–372. [Google Scholar] [CrossRef]
- Yang, Y.; Han, L. Influence of concrete compaction on the behavior of concrete-filled steel rhs(rectangular hollow section) stub columns. Ind. Constr. 2004, 34, 62–65. (In Chinese) [Google Scholar]
- Han, L.H.; Yao, G.H.; Zhao, X.L. Tests and calculations for hollow structural steel(HSS) stub columns filled with self-consolidating concrete (SCC). J. Constr. Steel Res. 2005, 61, 1241–1269. [Google Scholar] [CrossRef]
- Nhat-Duc, H.; Anh-Duc, P.; Quoc-Lam, N.; Quang-Nhat, P. Estimating Compressive Strength of High Performance Concrete with Gaussian Process Regression Model. Adv. Civ. Eng. 2016, 2016, 2861380. [Google Scholar] [CrossRef]
- CECS 28-1990; Specification for Design and Construction of Cnocrete-Filled Steel Tybular Structures. China Association for Engineering Construction Standardization: Beijing, China, 1991.
- ANSI/AISC 360-16; Specification for Structural Steel Buildings. American Institute of Steel Construction: Chicago, IL, USA, 2016.
- BS EN 1994-1-1; Eurocode 4: Design of Composite Steel and Concrete Structures: Part 1-1: General Rules and Rules for Buildings. British Standards Institution: London, UK, 2004.
- AIJ (Architectural Institute of Japan). Recommendations for Design and Construction of Concrete Filled Steel Tubular Structures; Architectural Institute of Japan: Tokyo, Japan, 2008. [Google Scholar]
- Li, K.; Long, Y.; Wang, H.; Wang, Y.-F. Modeling and Sensitivity Analysis of Concrete Creep with Machine Learning Methods. J. Mater. Civ. Eng. 2021, 33, 04021206. [Google Scholar] [CrossRef]
- Zhang, L.; Yang, S.-L.; Fu, B.; Tong, G.-S.; Tong, J.-Z.; Jing, T. Behavior and design of concrete-filled narrow rectangular steel tubular (CFNRST) stub columns under axial compression. J. Build. Eng. 2021, 37, 102166. [Google Scholar] [CrossRef]
- Gan, D.; Li, Z.; Zhang, T.; Zhou, X.; Chung, K.F. Axial compressive behaviour of circular concrete-filled steel tubular stubcolumns with an inner bamboo culm. J. Struct. Eng. Struct. 2020, 26, 156–168. [Google Scholar] [CrossRef]
- Wang, J.; Shen, Q.; Jiang, H.; Pan, X. Analysis and Design of Elliptical Concrete-Filled Thin-Walled Steel Stub Columns Under Axial Compression. Int. J. Steel Struct. 2018, 18, 365–380. [Google Scholar] [CrossRef]
Disclaimer/Publisher’s Note: The statements, opinions and data contained in all publications are solely those of the individual author(s) and contributor(s) and not of MDPI and/or the editor(s). MDPI and/or the editor(s) disclaim responsibility for any injury to people or property resulting from any ideas, methods, instructions or products referred to in the content. |
© 2023 by the authors. Licensee MDPI, Basel, Switzerland. This article is an open access article distributed under the terms and conditions of the Creative Commons Attribution (CC BY) license (https://creativecommons.org/licenses/by/4.0/).