Author Contributions
Conceptualization, S.M.A., R.H., S.S., H.M.N. and M.M.S.S.; Methodology, S.M.A., R.H. and S.A.; Software, S.A., H.M.N. and M.M.S.S.; Formal analysis, S.S. and H.M.N.; Investigation, R.H.; Resources, S.S.; Data curation, S.S.; Writing—original draft, S.M.A., R.H. and S.A.; Writing—review & editing, S.M.A., S.S., H.M.N. and M.M.S.S.; Visualization, H.M.N. and M.M.S.S.; Supervision, M.M.S.S.; Project administration and S.A.; Funding acquisition, M.M.S.S. All authors have read and agreed to the published version of the manuscript.
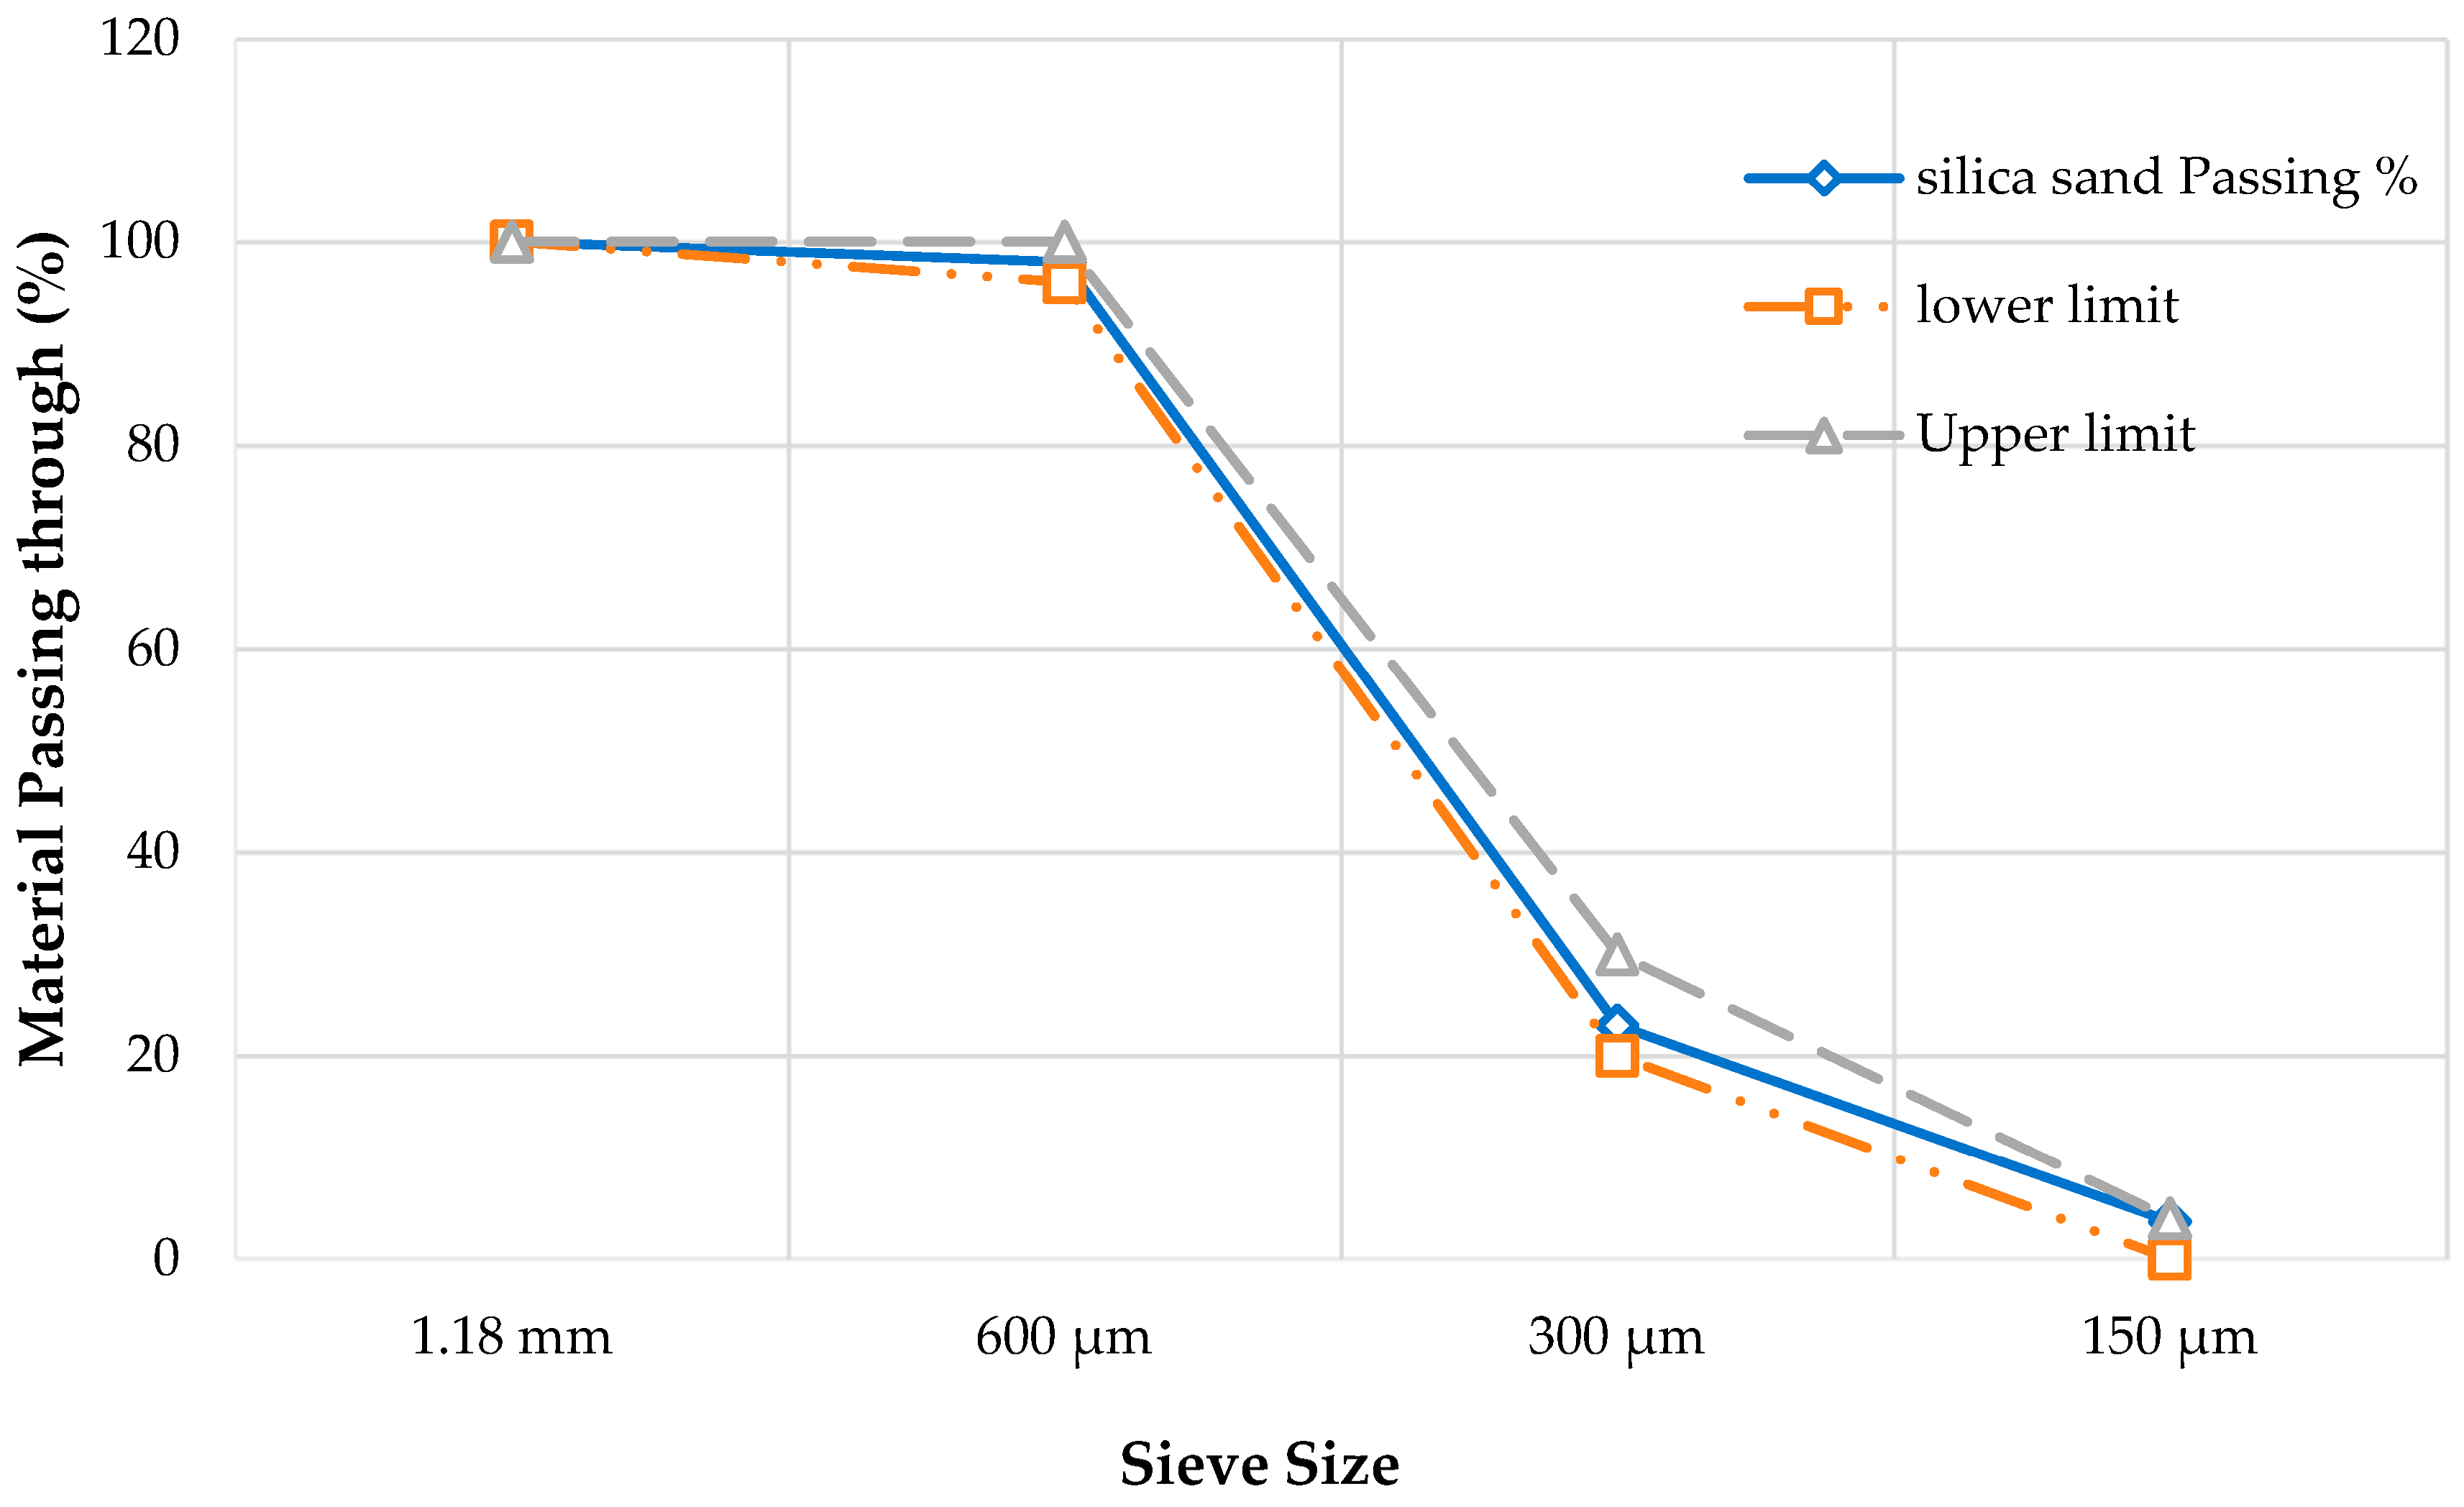
Figure 1.
Grading of fine silica sand.
Figure 1.
Grading of fine silica sand.
Figure 2.
Preparation of mix.
Figure 2.
Preparation of mix.
Figure 3.
Prepared molds for casting the cube specimens.
Figure 3.
Prepared molds for casting the cube specimens.
Figure 4.
The unbonded lengths covered with plastic hollow tube.
Figure 4.
The unbonded lengths covered with plastic hollow tube.
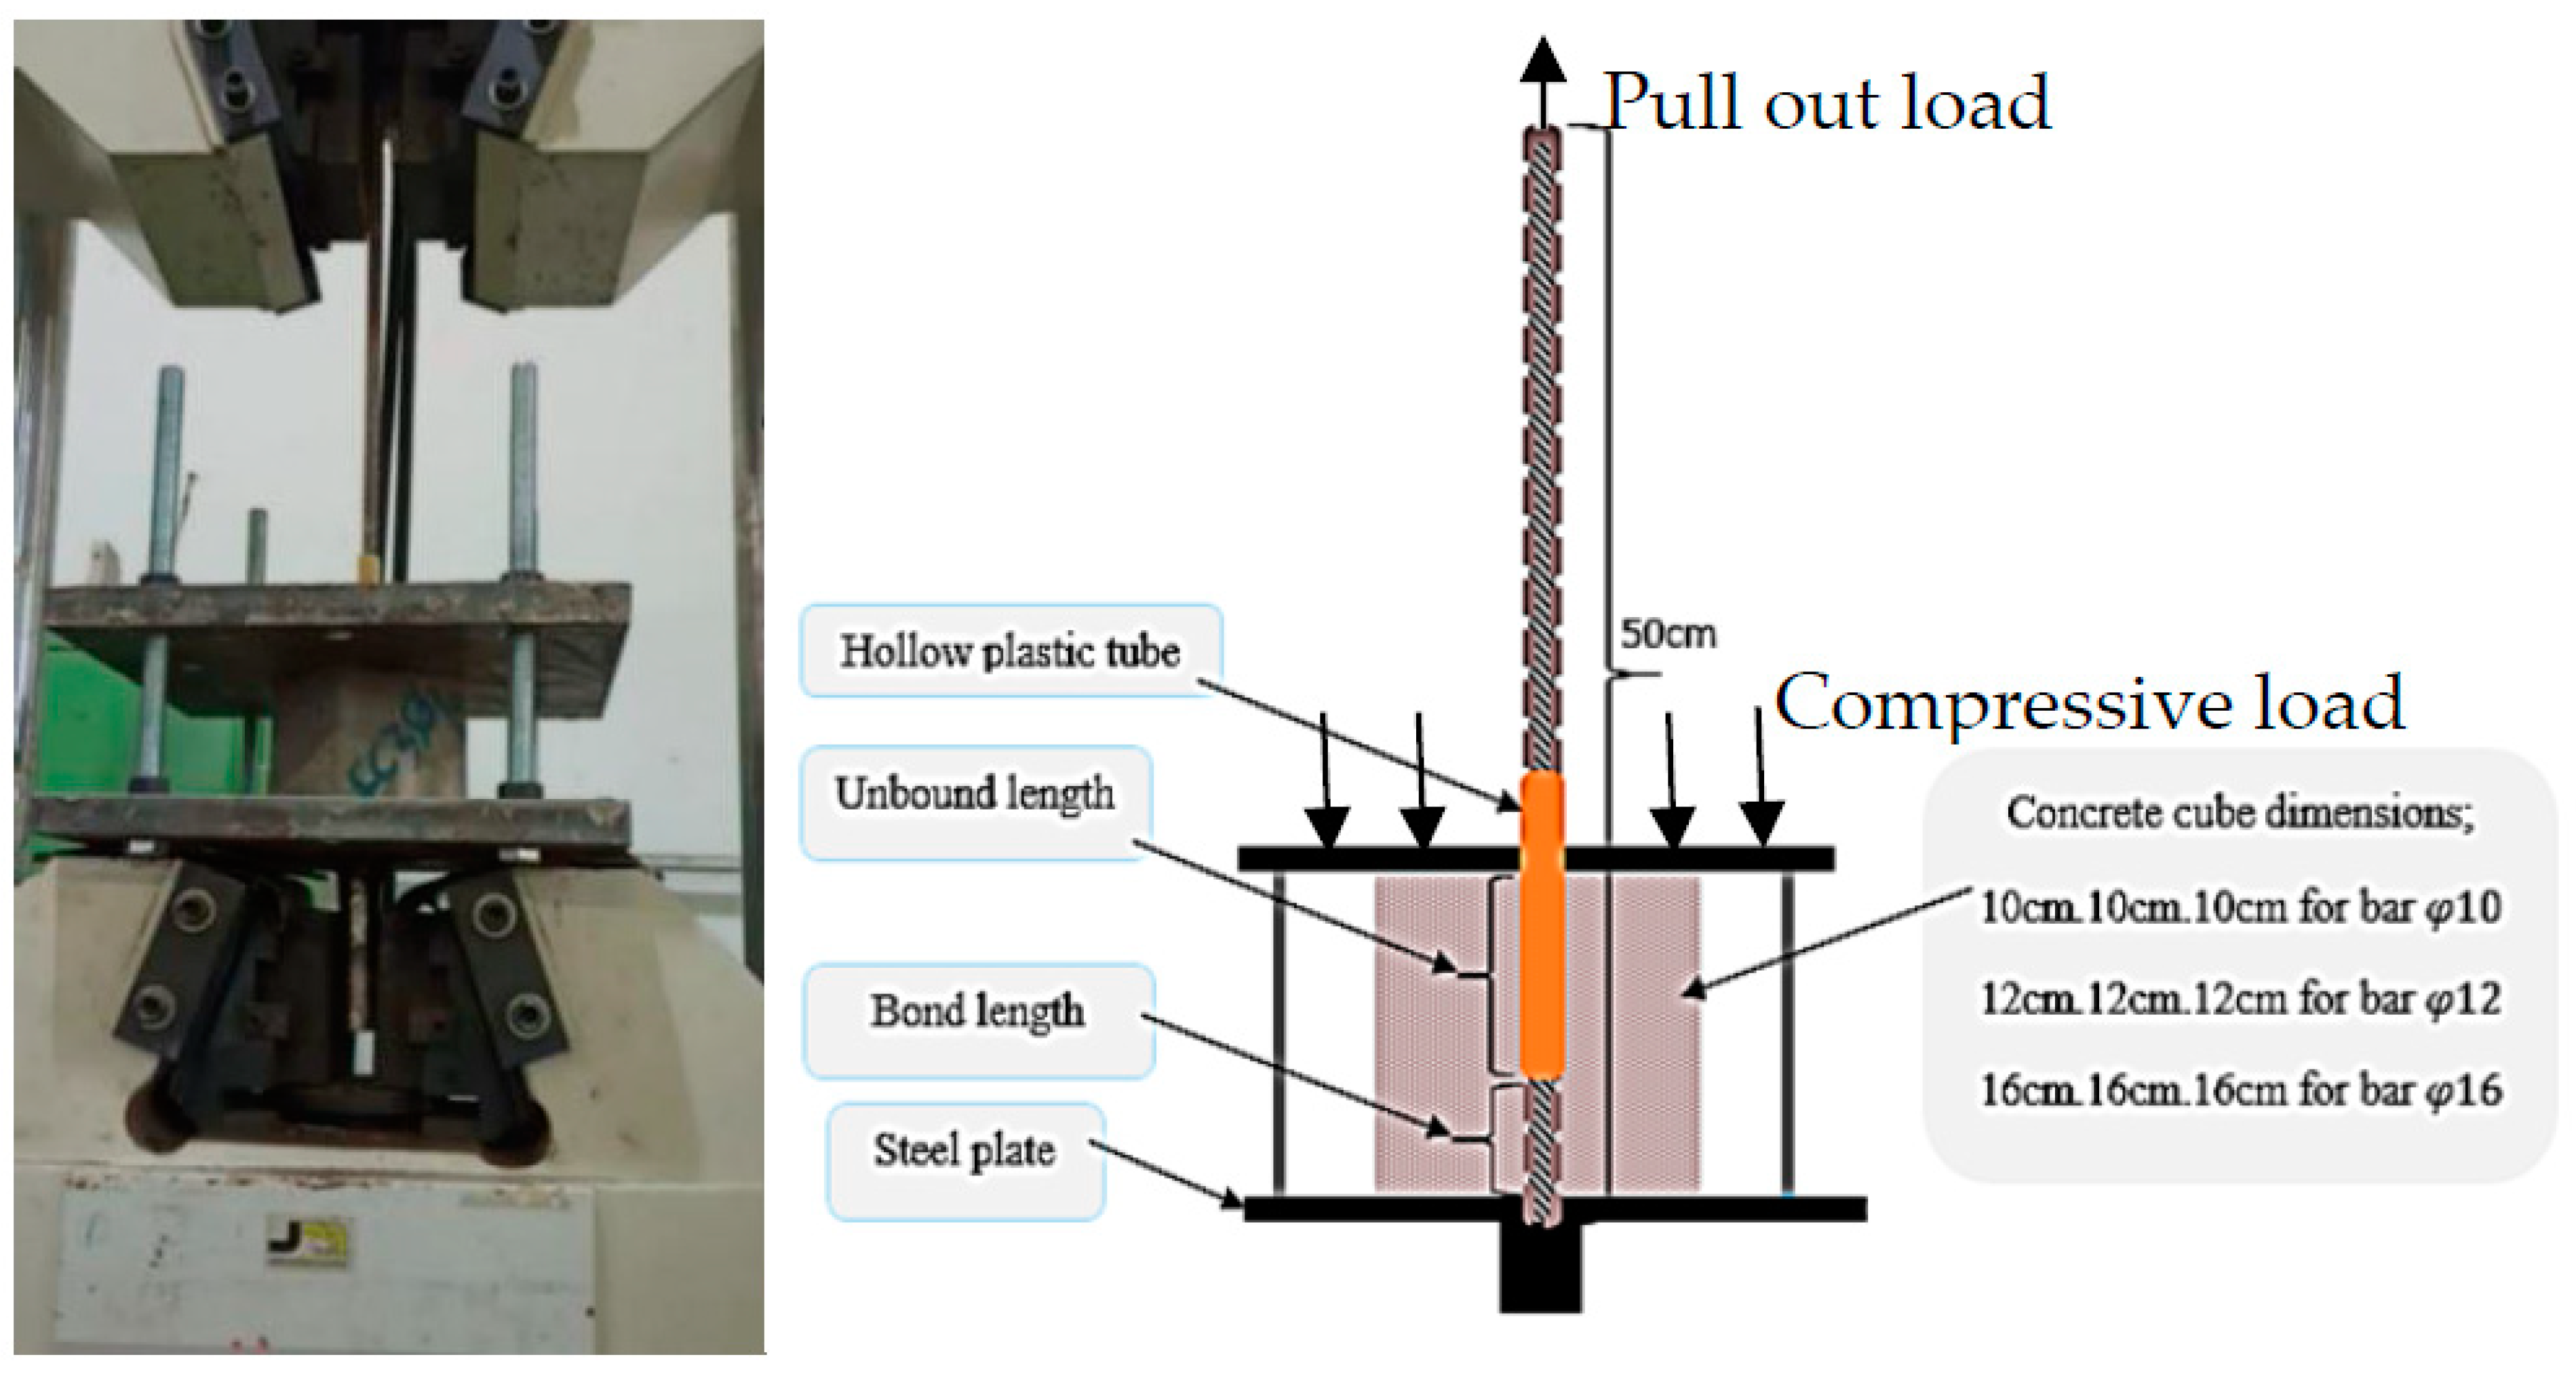
Figure 5.
Schematic diagram of the pull-out test (left) and laboratory test setup on tensile testing machine (right).
Figure 5.
Schematic diagram of the pull-out test (left) and laboratory test setup on tensile testing machine (right).
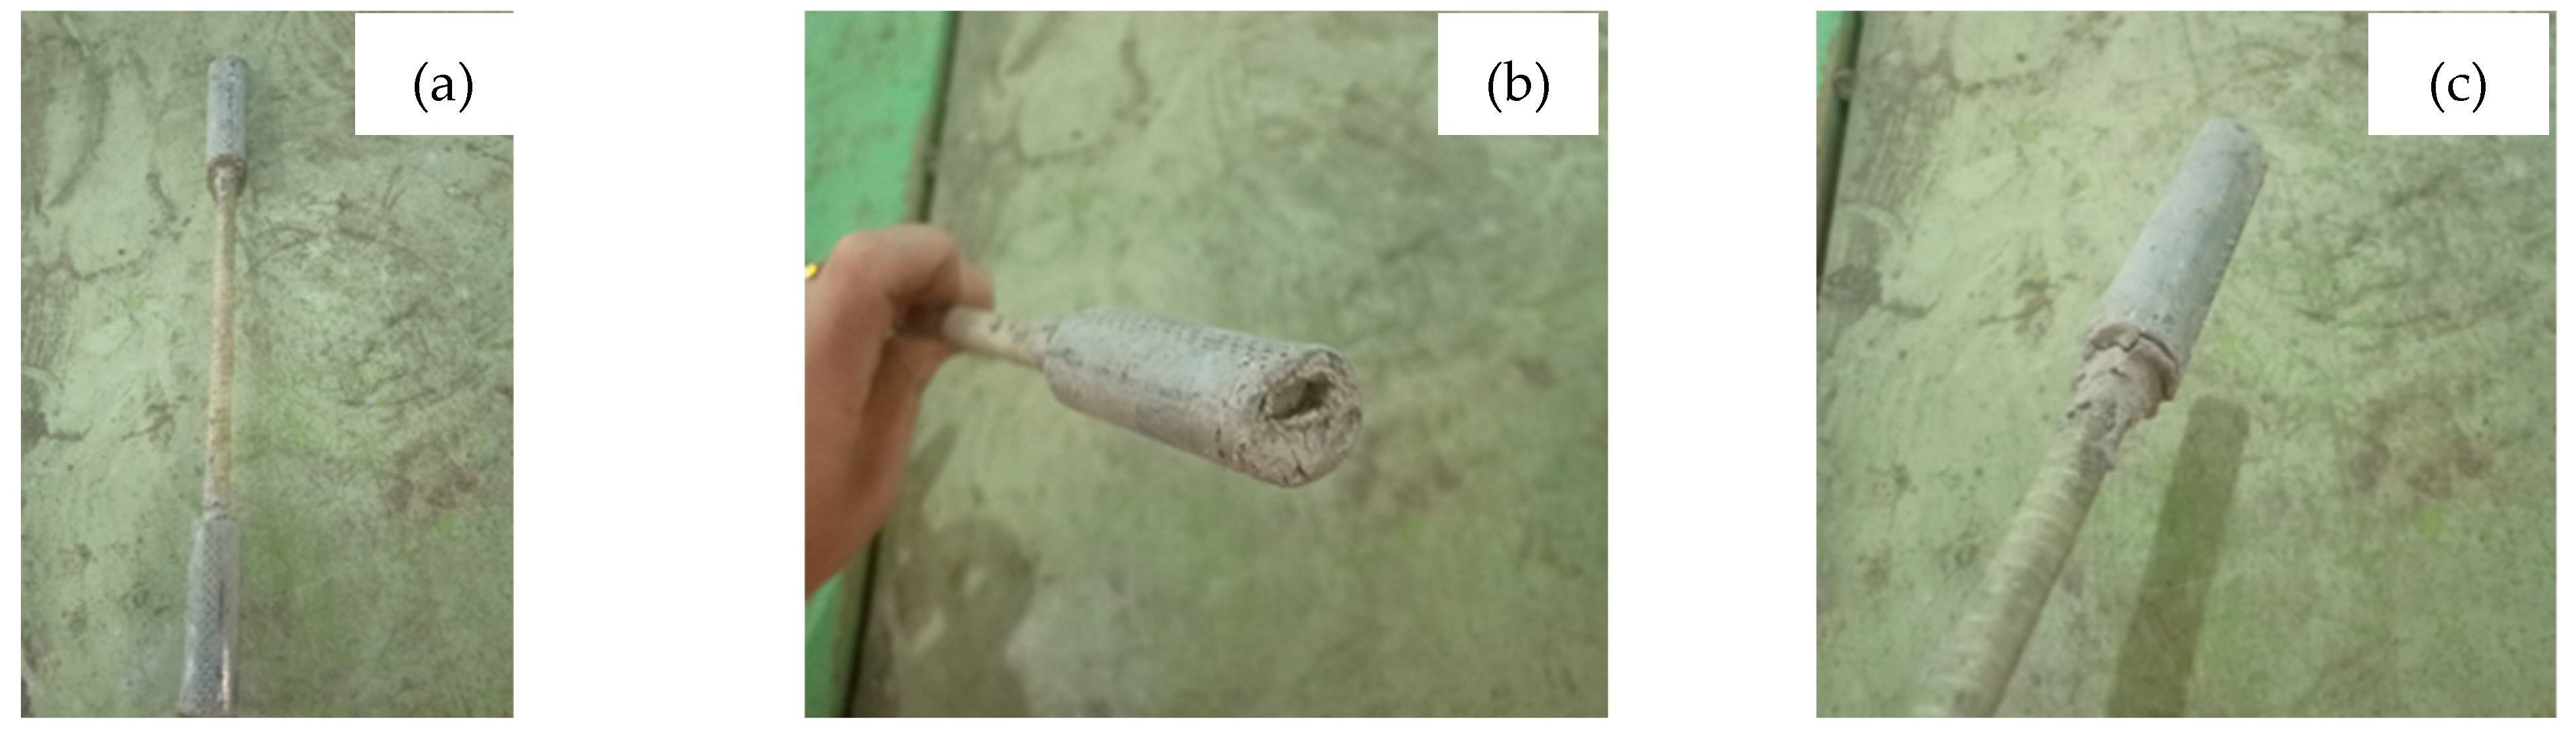
Figure 6.
(a) Protected GFRP bar prepared for testing; (b–d) Failure of GFRP bar due to the bar slipping out of the sleeve tube (outside the scope of the study); (e,f) Yield failure of GFRP bar itself without any failure in the area of connection between the bars and the sleeve tube.
Figure 6.
(a) Protected GFRP bar prepared for testing; (b–d) Failure of GFRP bar due to the bar slipping out of the sleeve tube (outside the scope of the study); (e,f) Yield failure of GFRP bar itself without any failure in the area of connection between the bars and the sleeve tube.
Figure 7.
Foamed concrete specimen under (a) Compression test (b) Split tensile test (c) Flexural test (d) Modulus of elasticity test.
Figure 7.
Foamed concrete specimen under (a) Compression test (b) Split tensile test (c) Flexural test (d) Modulus of elasticity test.
Figure 8.
Splitting failure of FC.
Figure 8.
Splitting failure of FC.
Figure 9.
FC specimen after flexural test.
Figure 9.
FC specimen after flexural test.
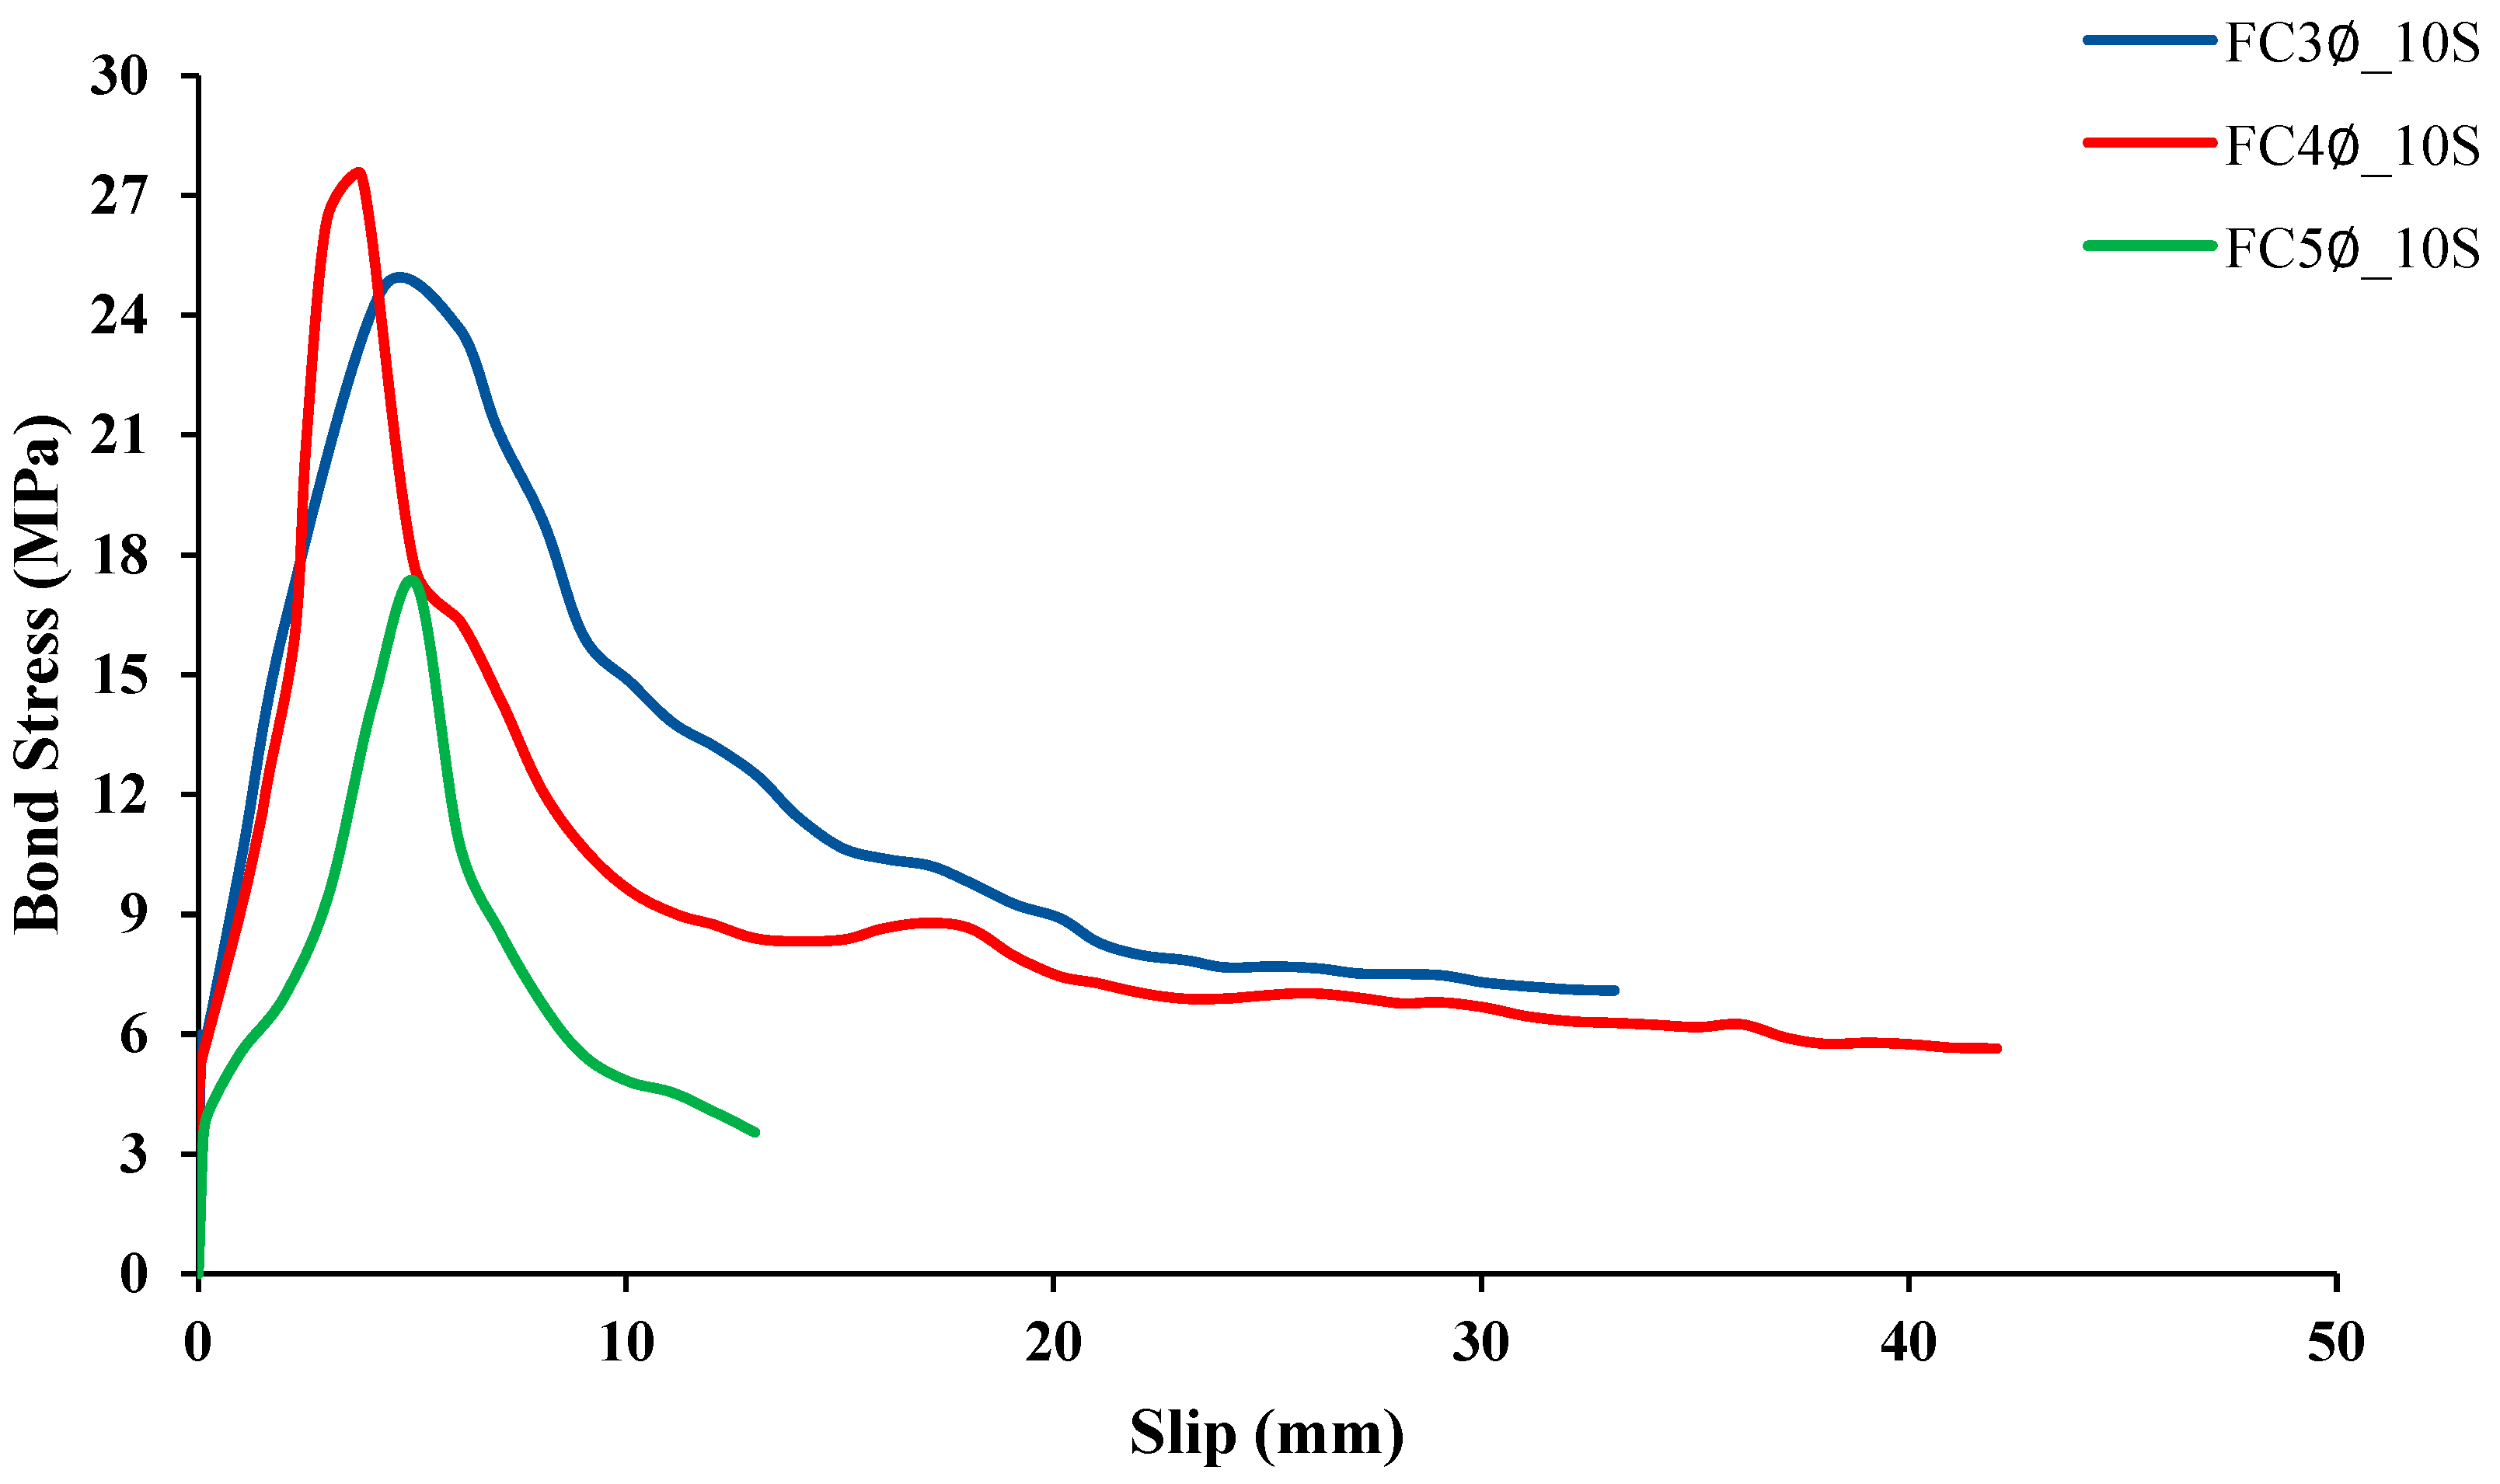
Figure 10.
Effect of variation in bonded length for the 10 mm diameter steel bar.
Figure 10.
Effect of variation in bonded length for the 10 mm diameter steel bar.
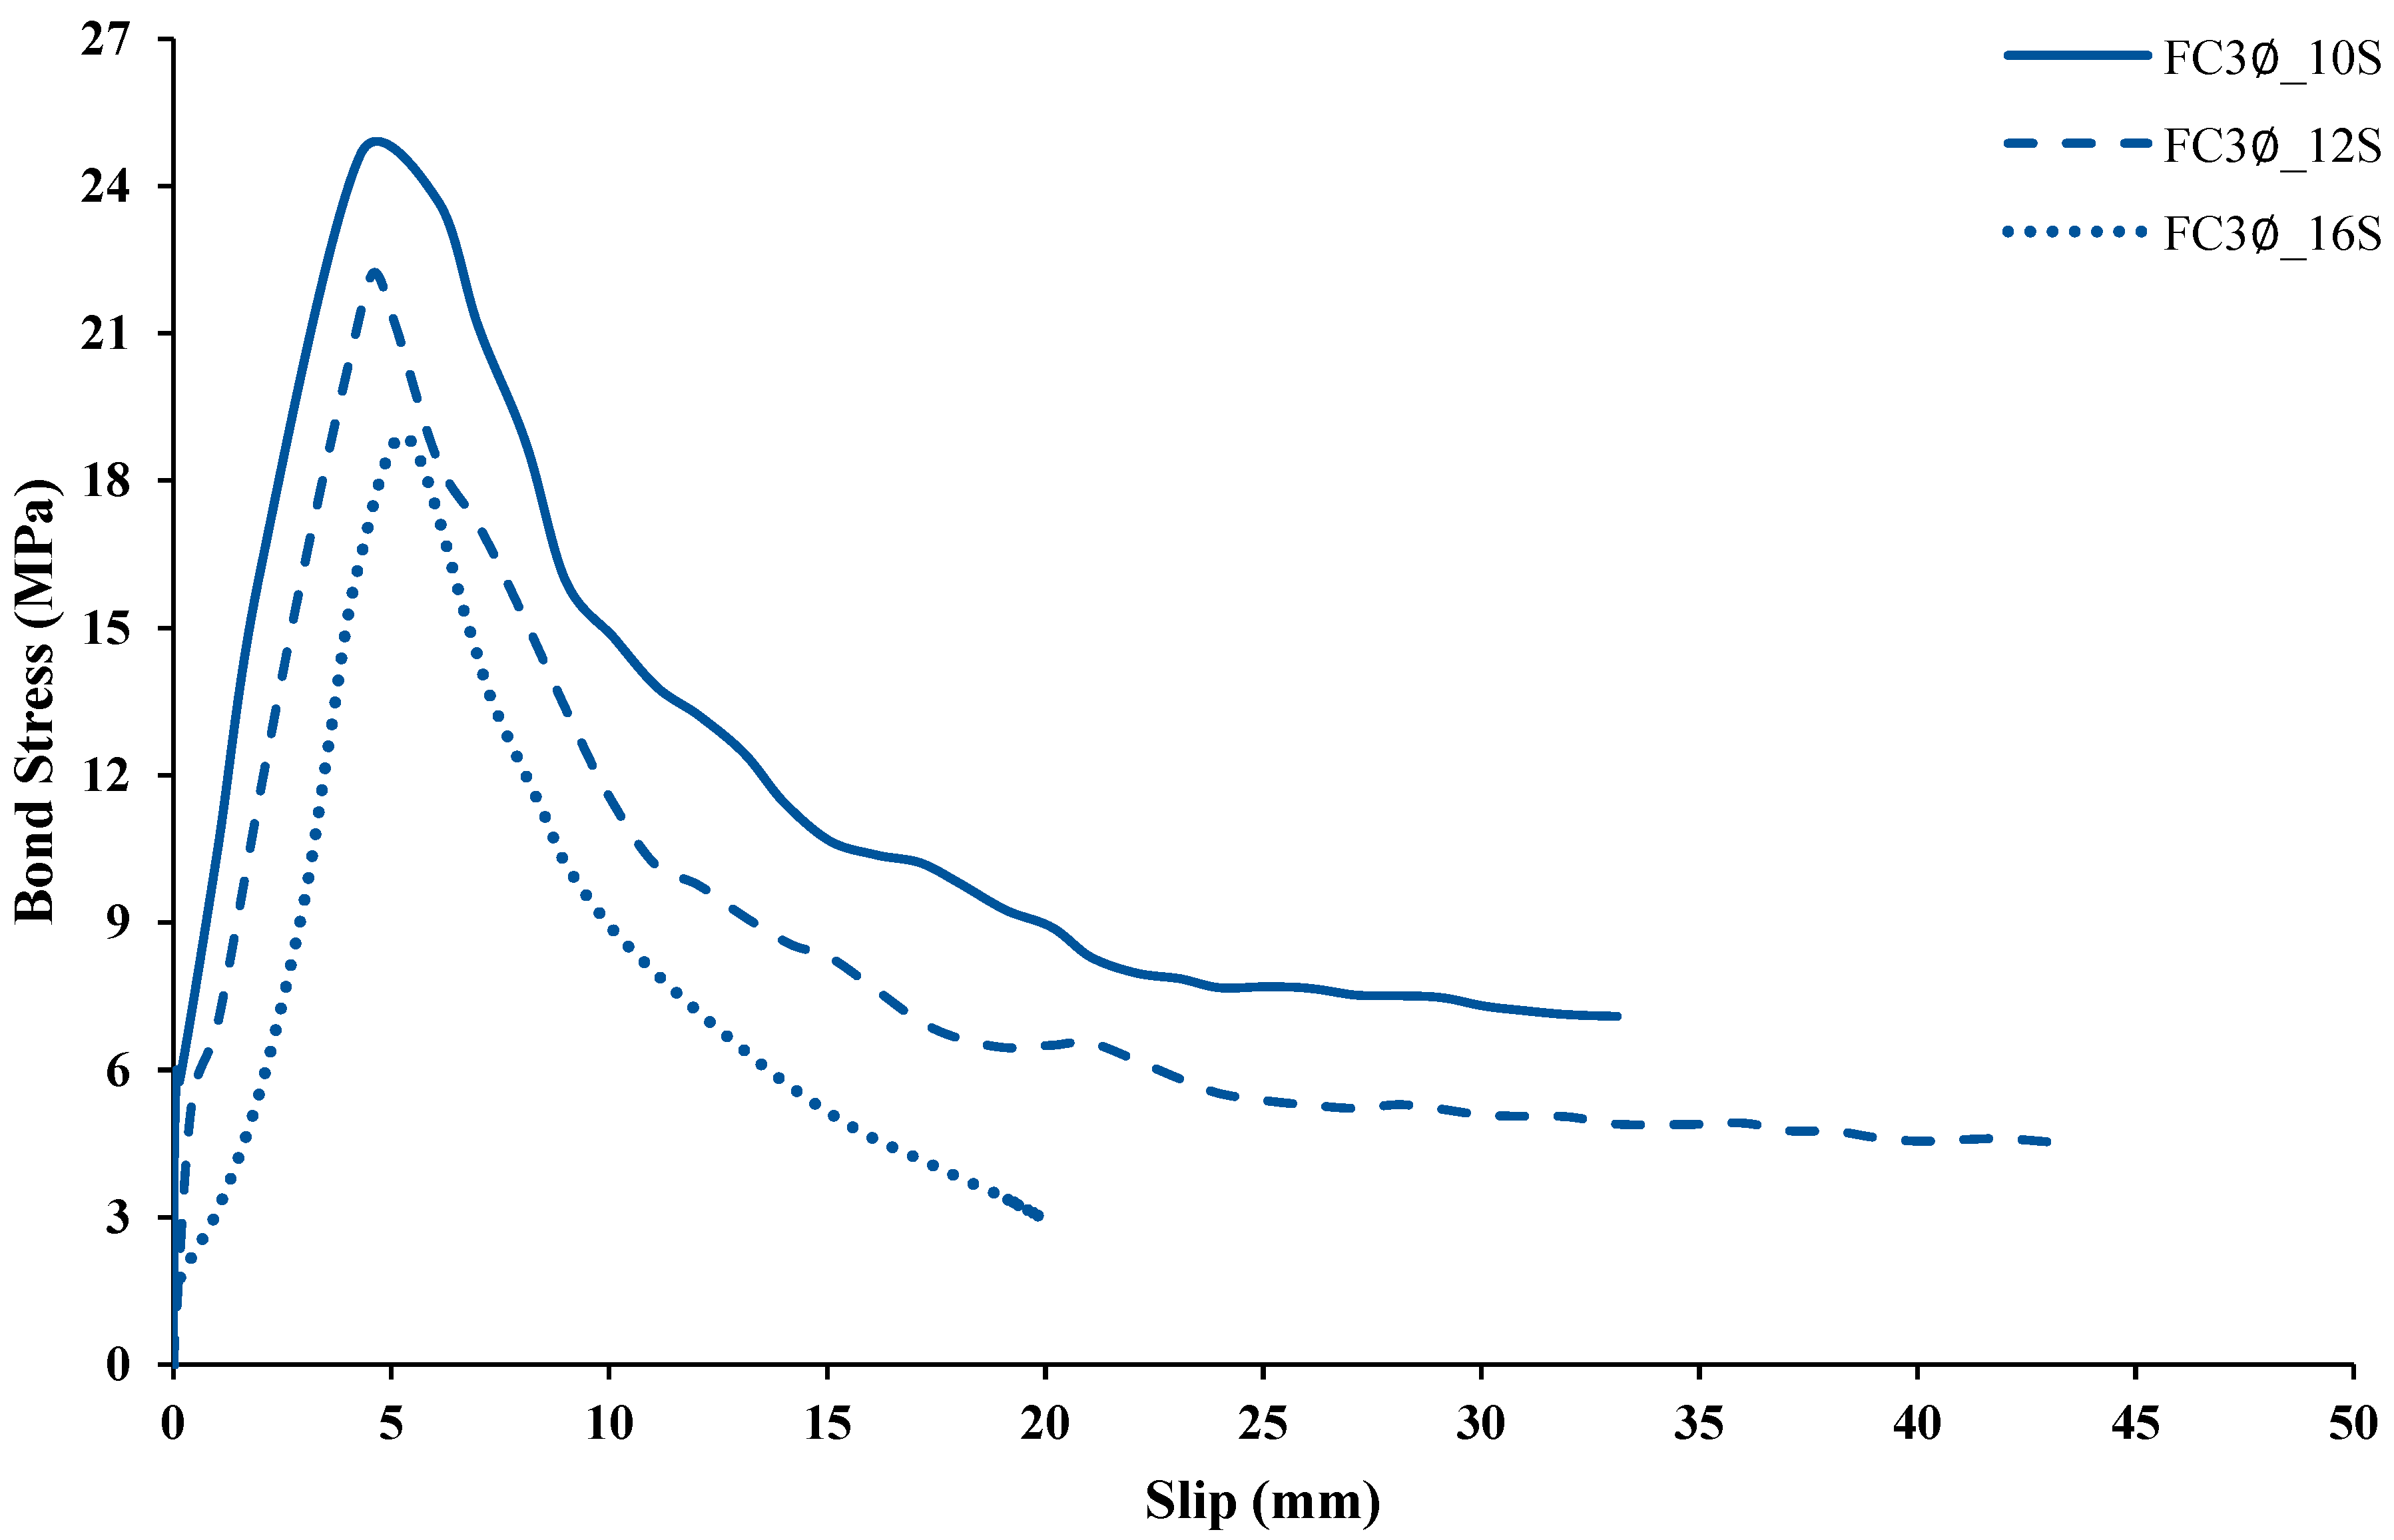
Figure 11.
Effect of variation in bonded length for the 12 mm diameter steel bar.
Figure 11.
Effect of variation in bonded length for the 12 mm diameter steel bar.
Figure 12.
Effect of variation in bonded length for 16 mm diameter steel bar.
Figure 12.
Effect of variation in bonded length for 16 mm diameter steel bar.
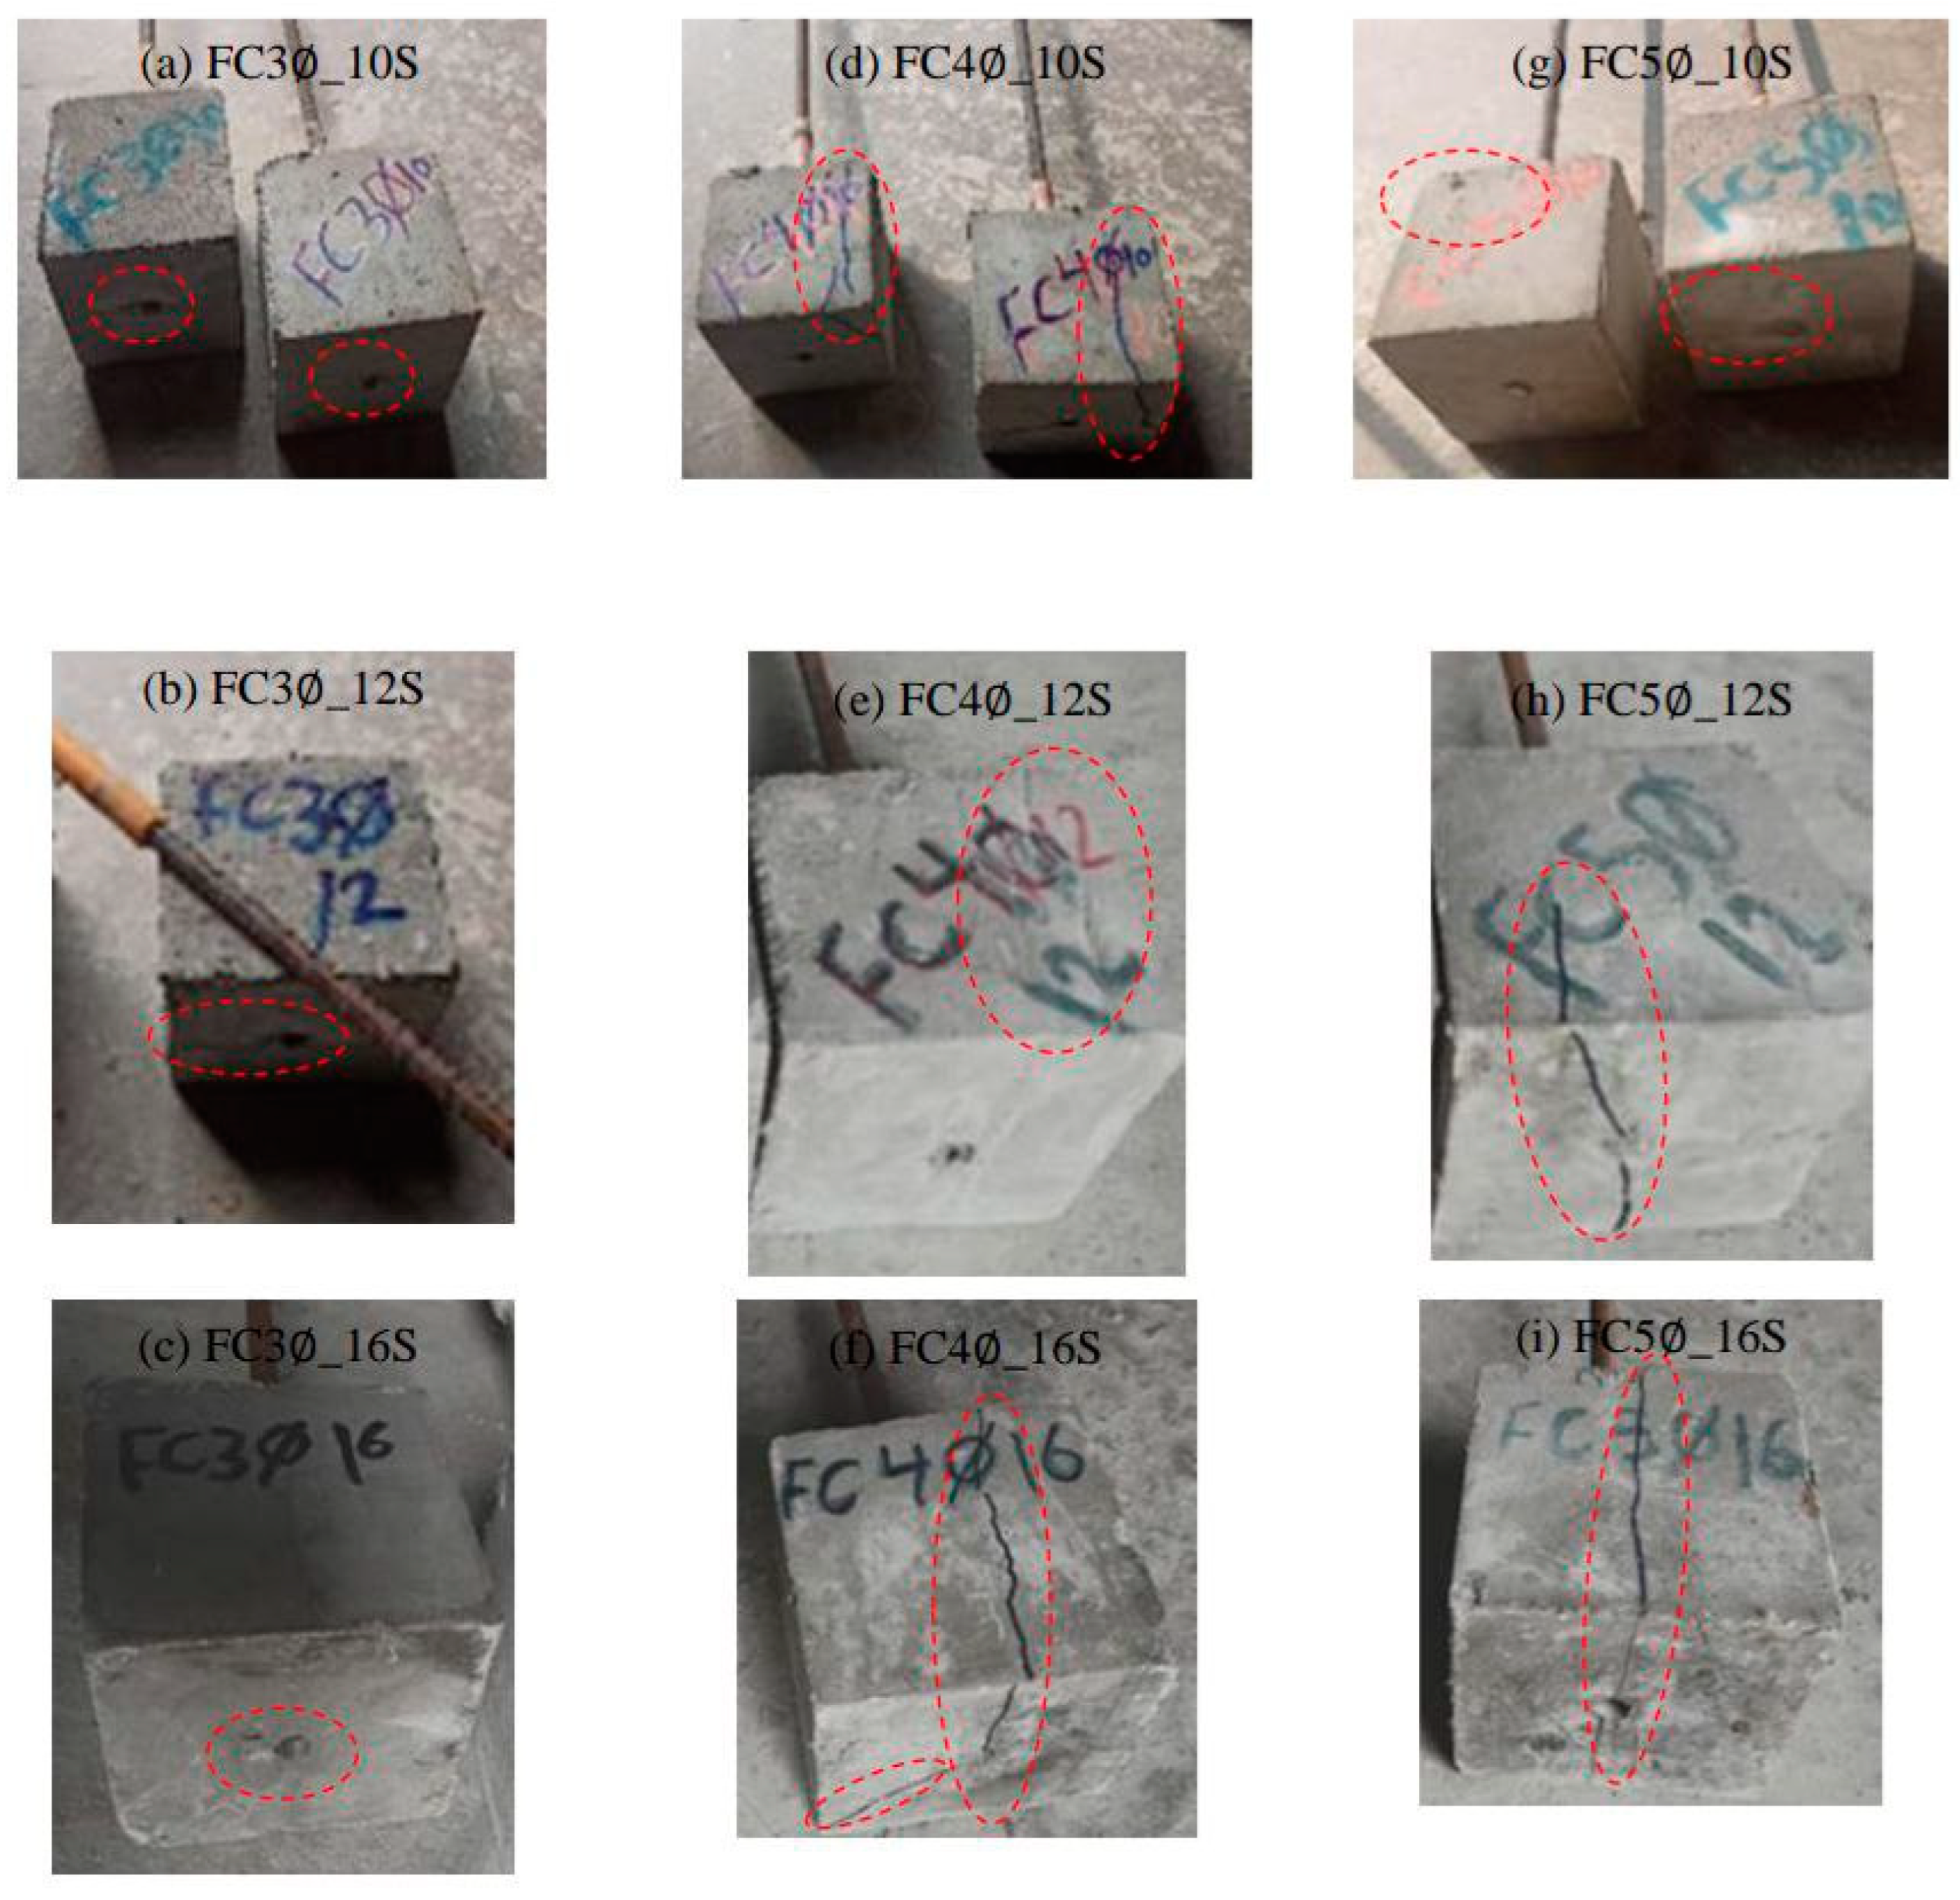
Figure 13.
Failure patterns of FC reinforced with ribbed steel bars.
Figure 13.
Failure patterns of FC reinforced with ribbed steel bars.
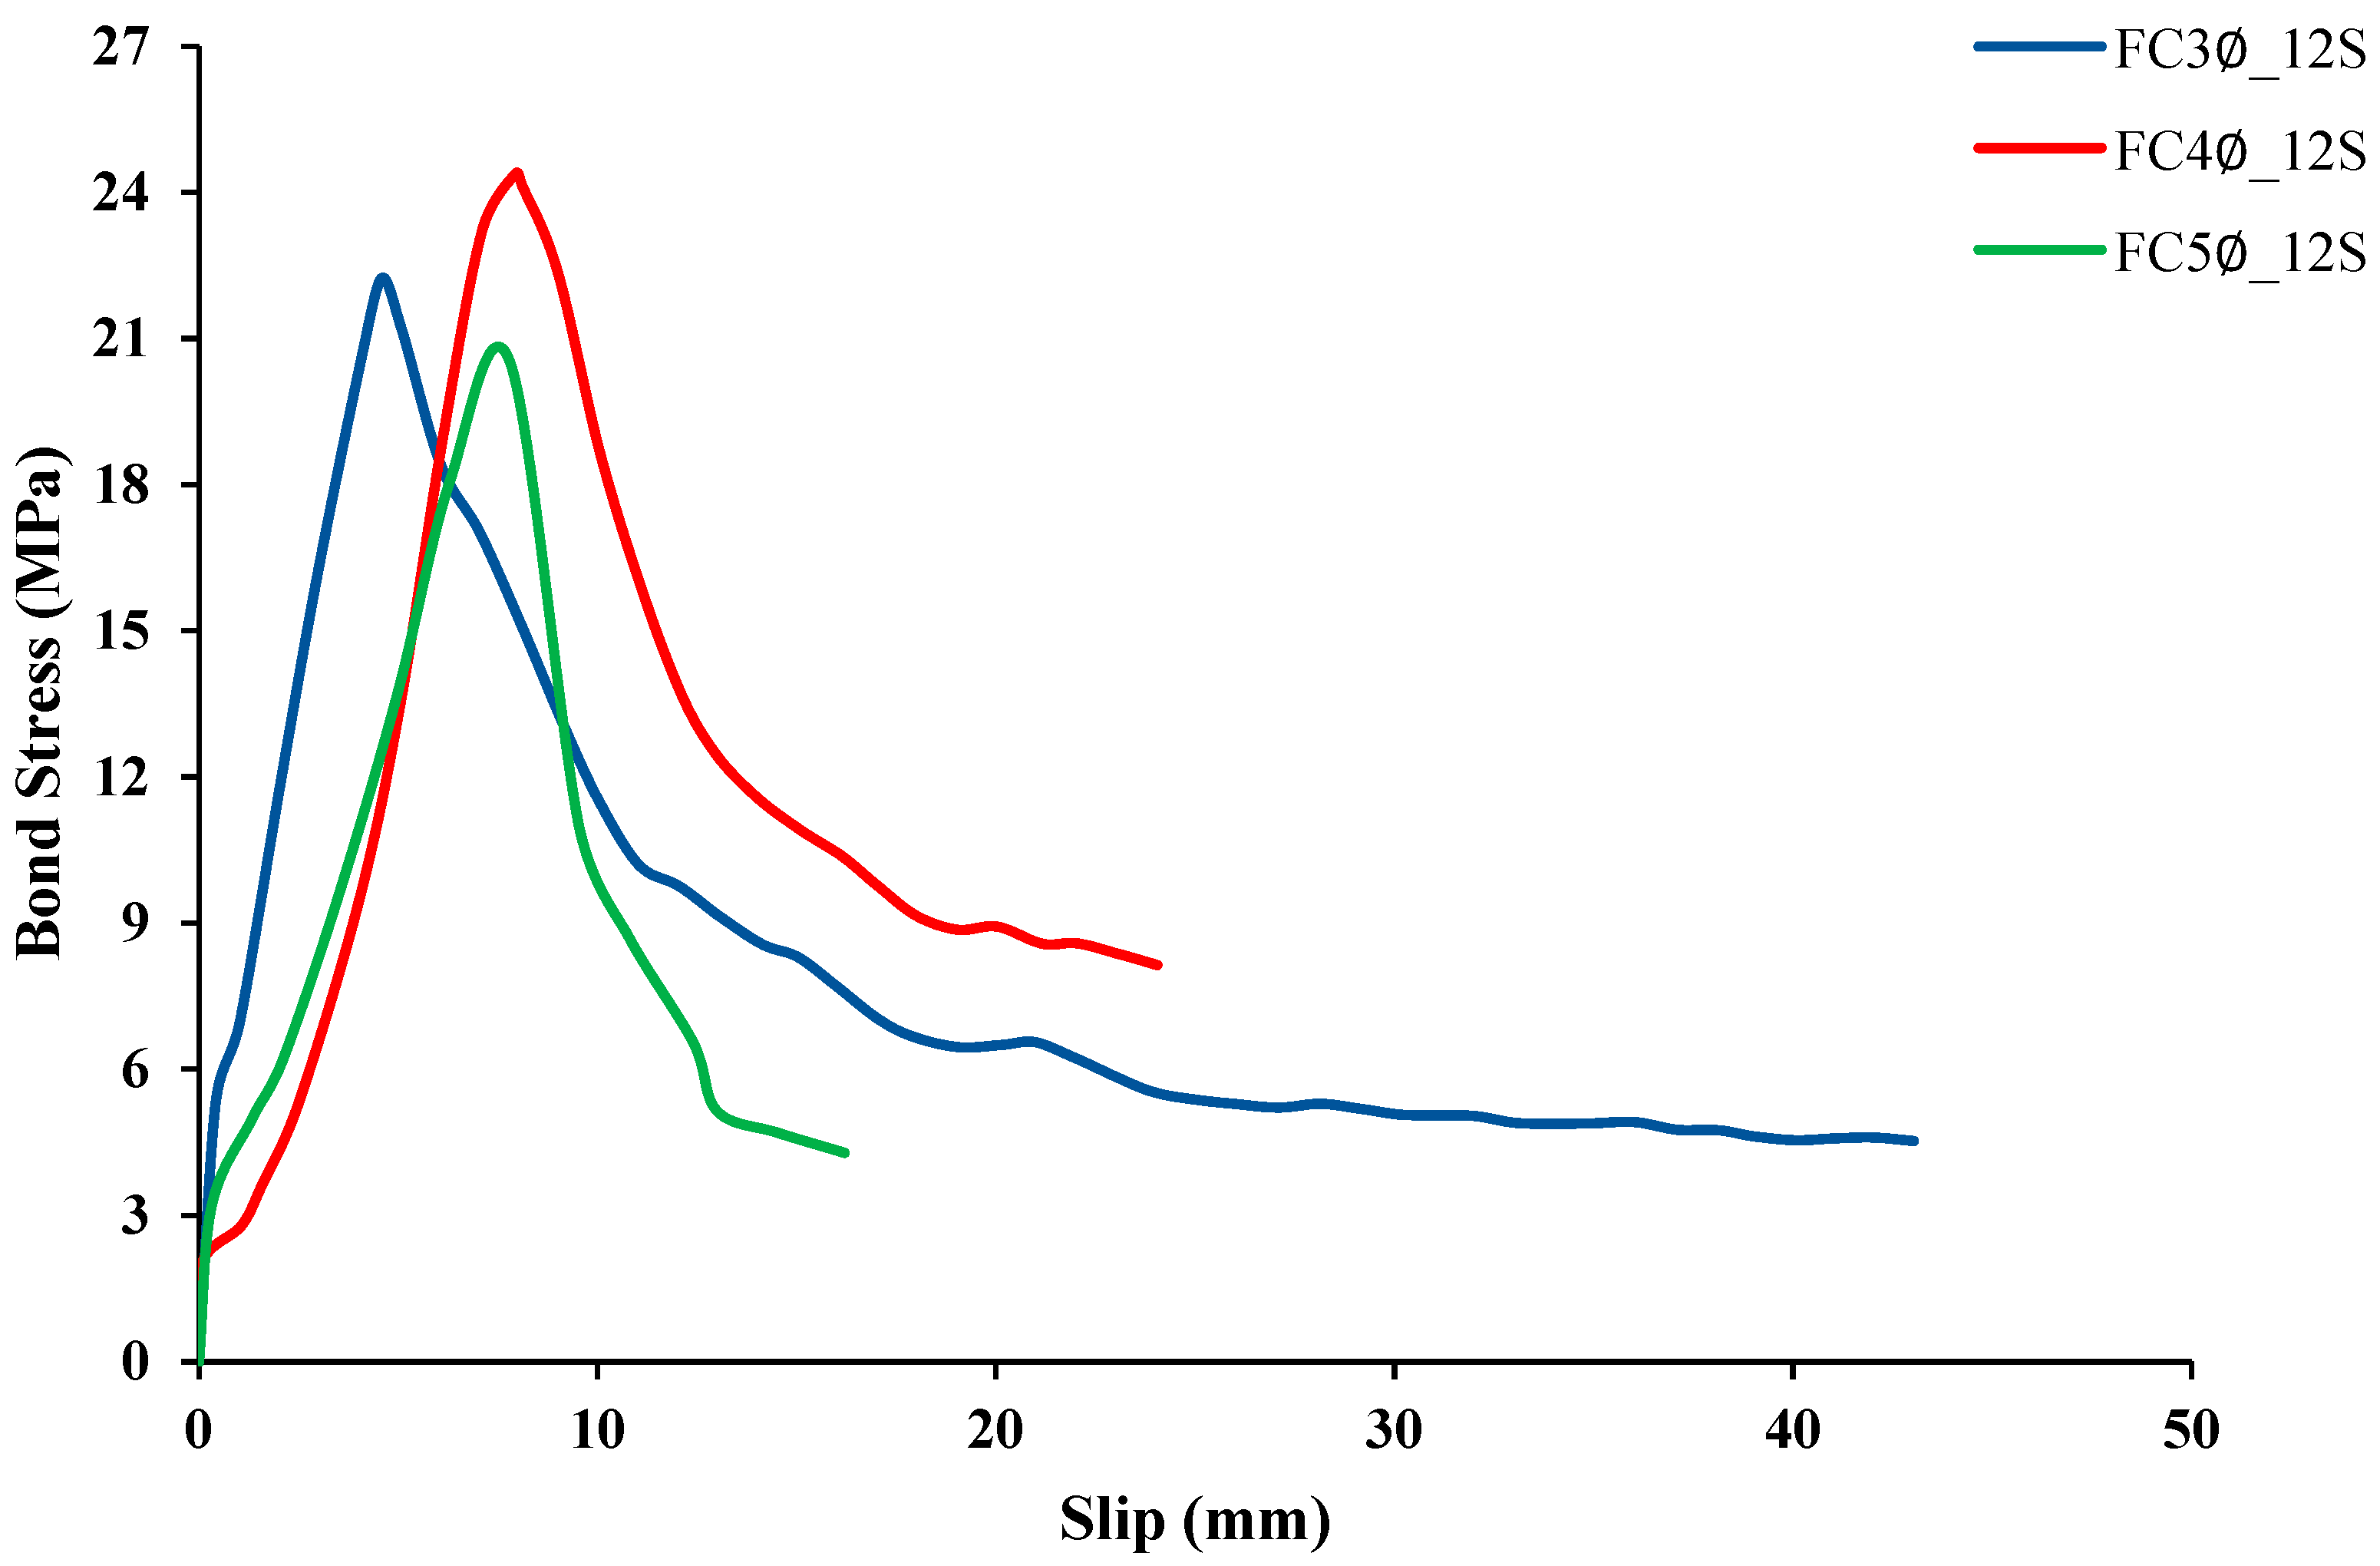
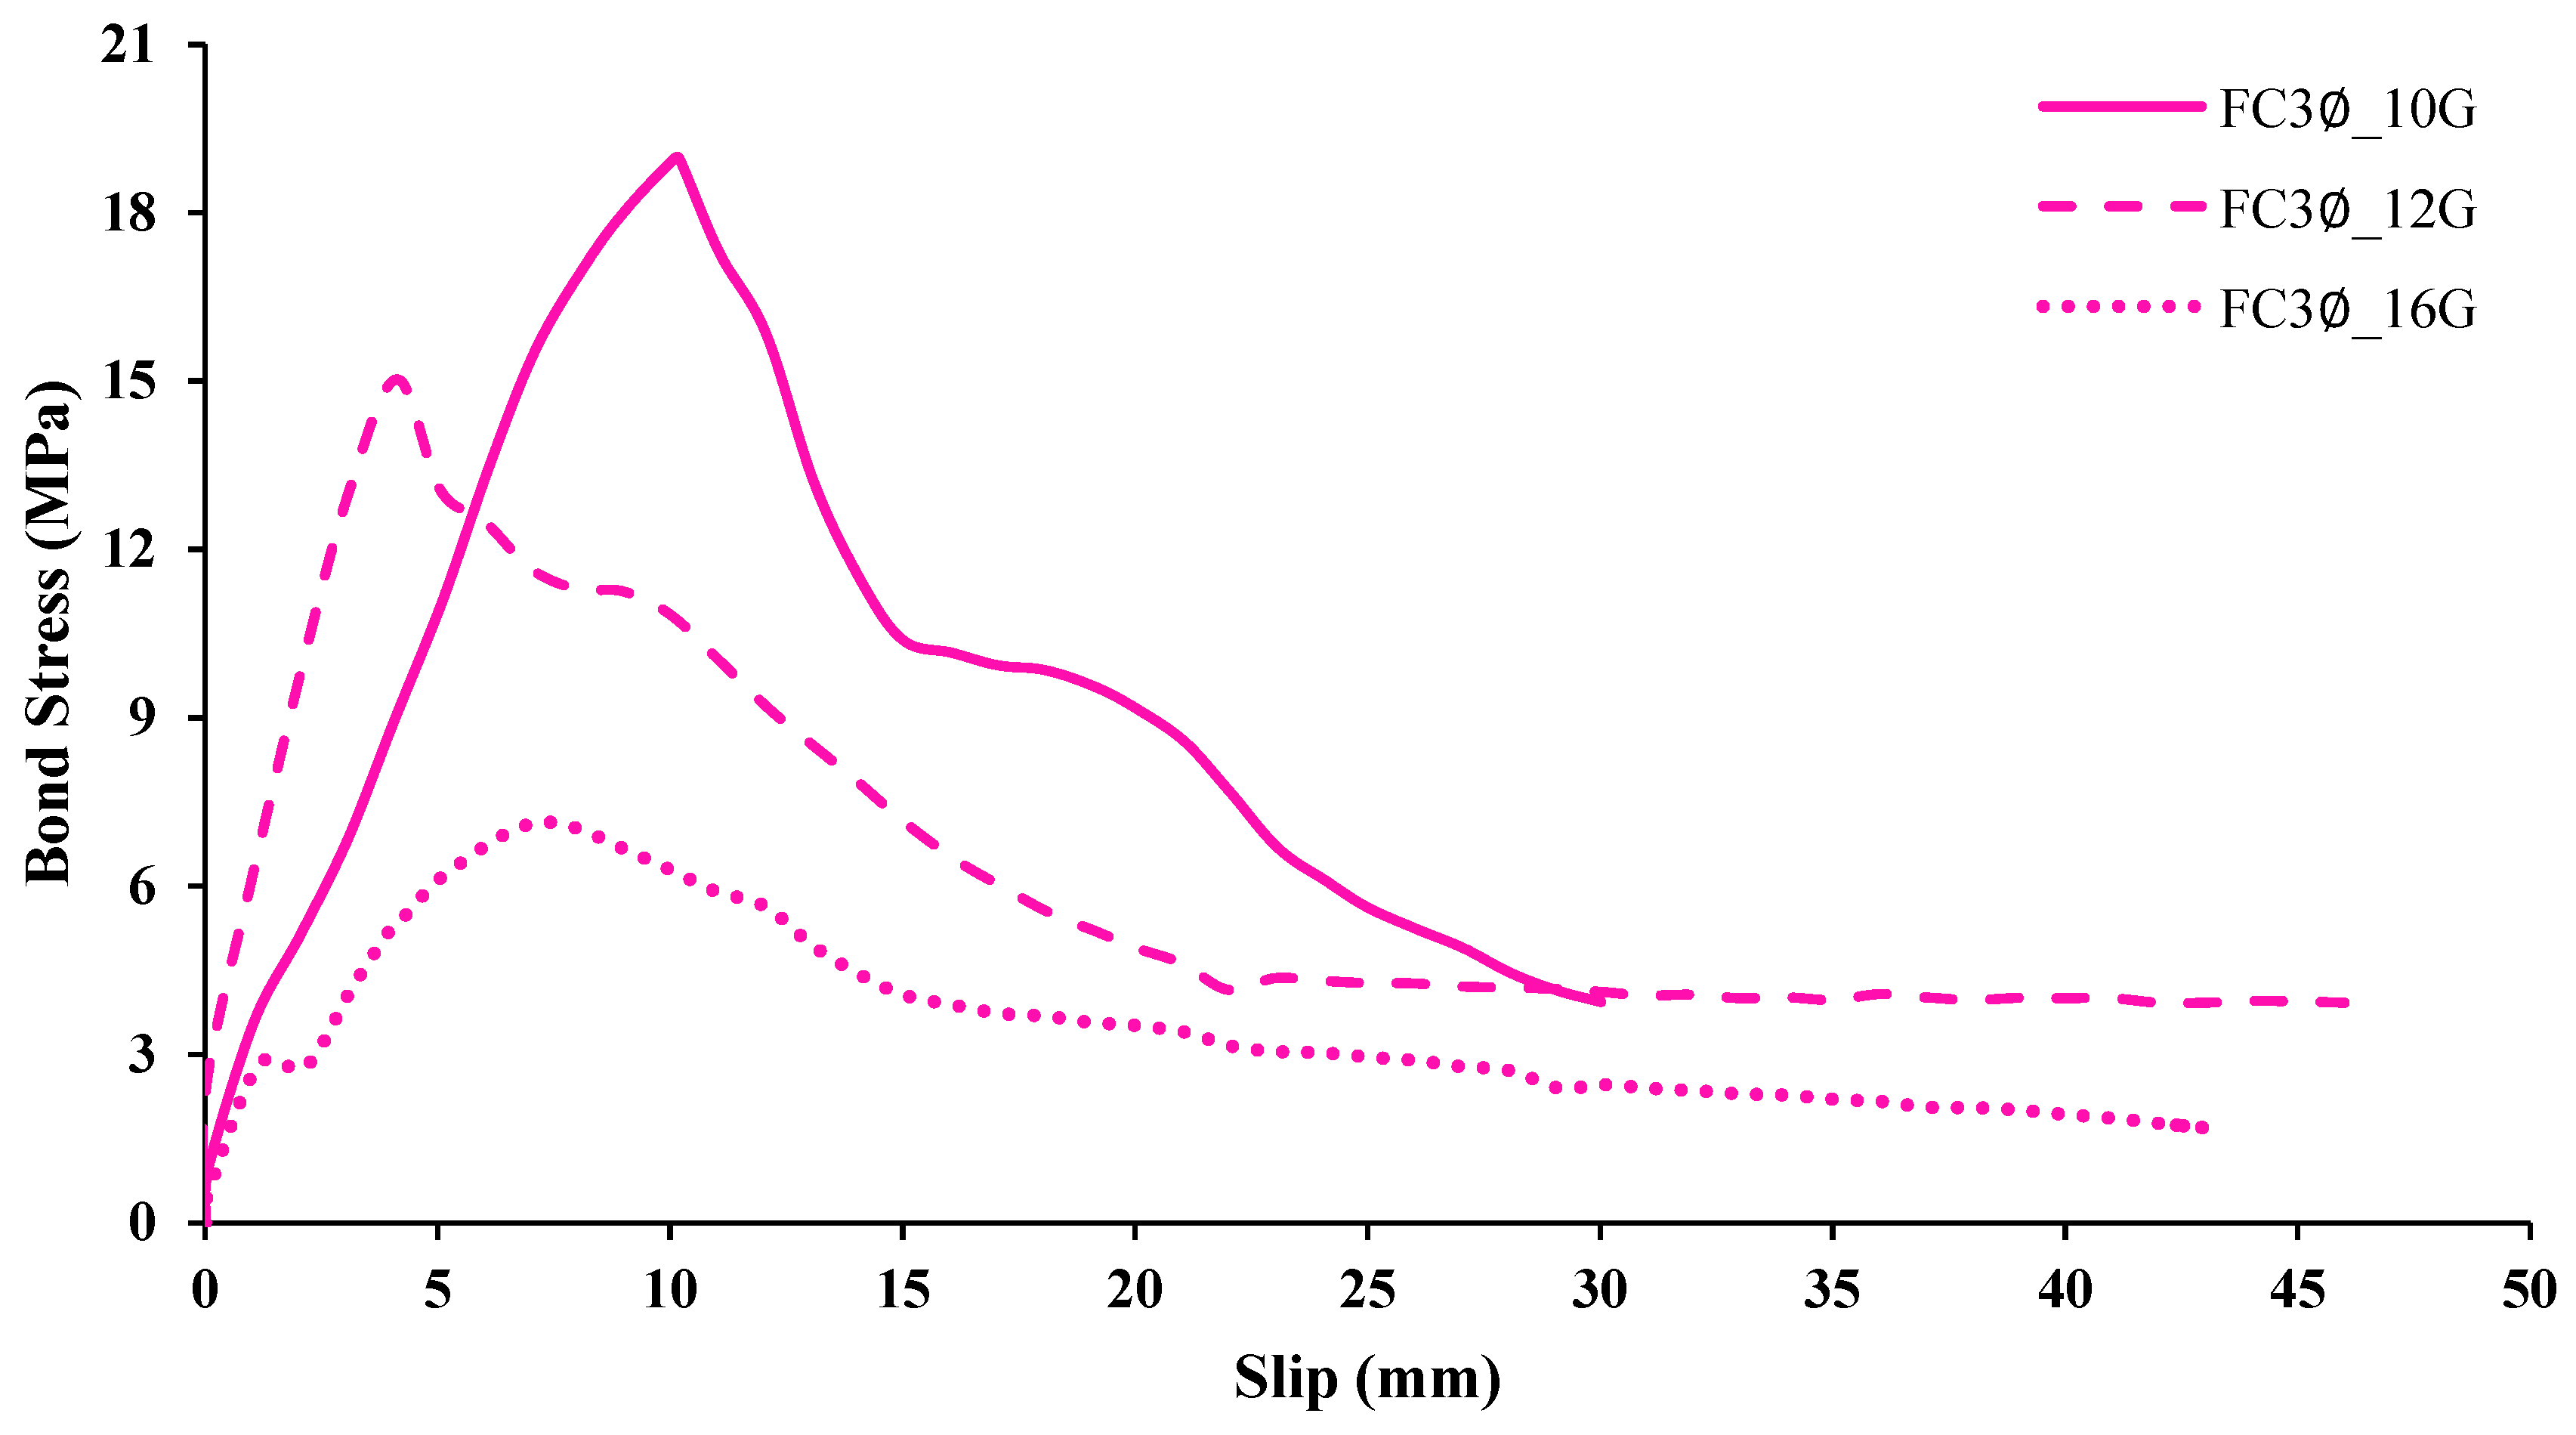
Figure 14.
Effect of variation in steel bar diameter for bonded length 3∅.
Figure 14.
Effect of variation in steel bar diameter for bonded length 3∅.
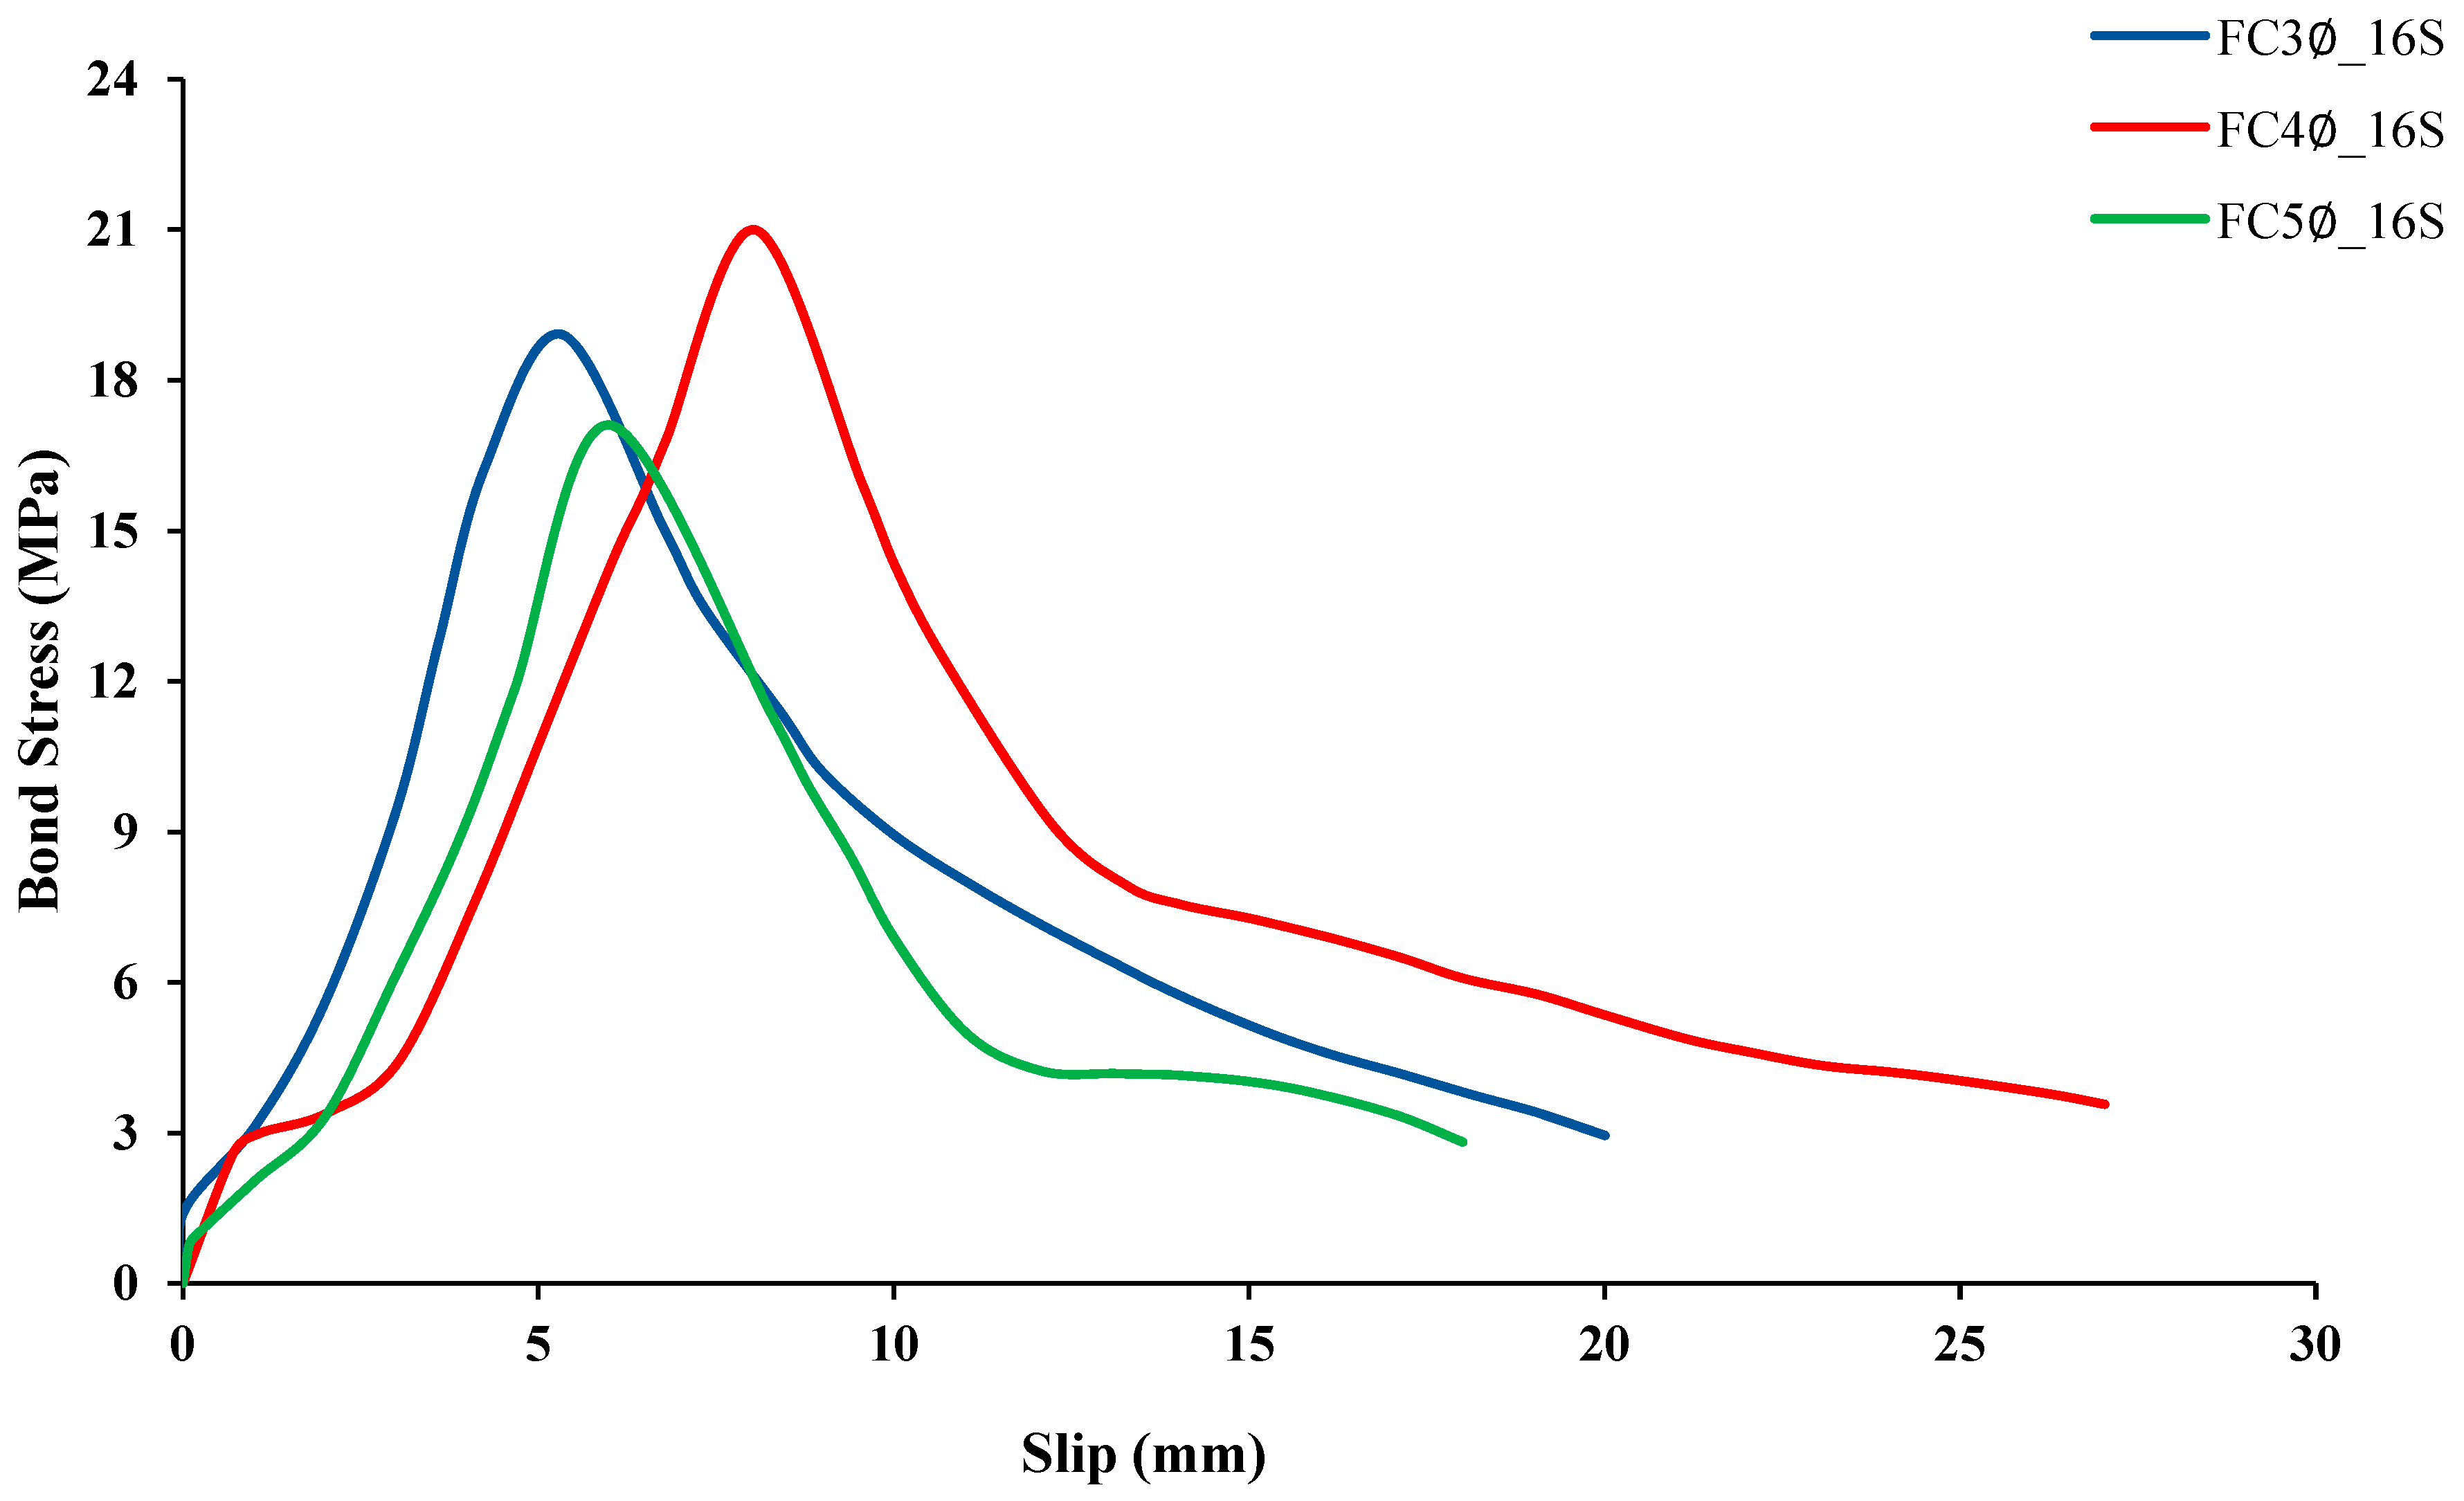
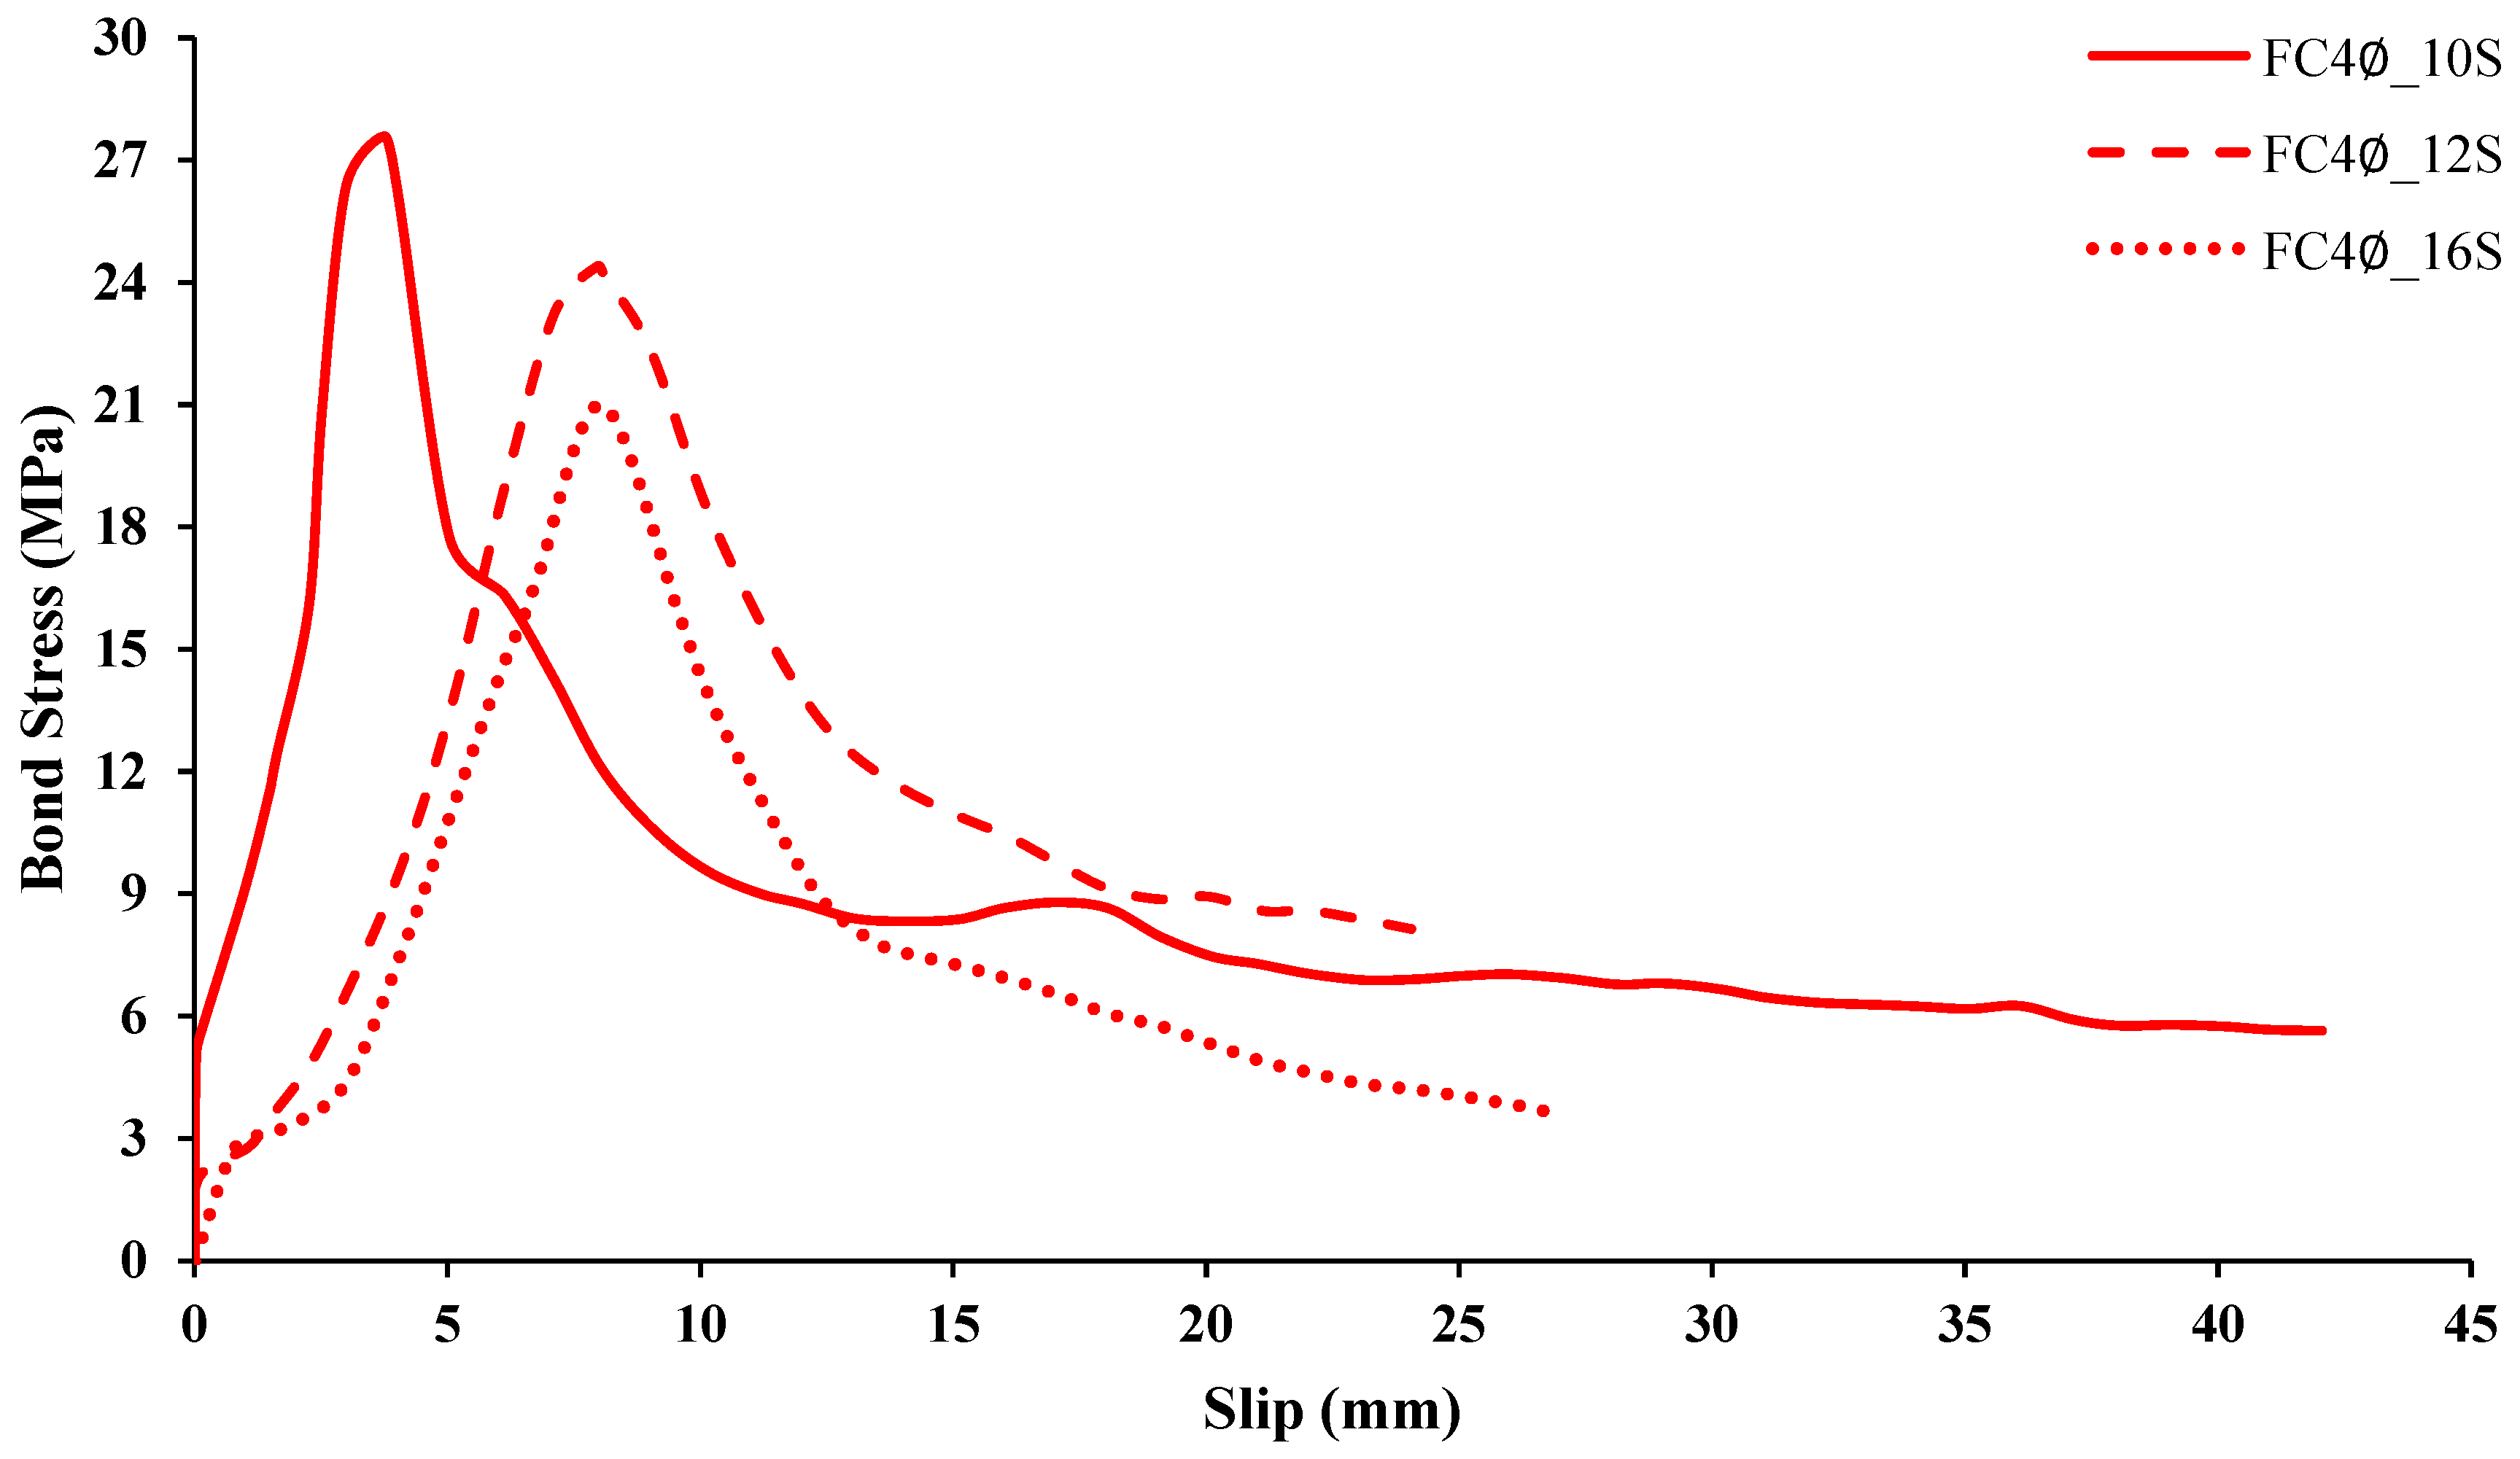
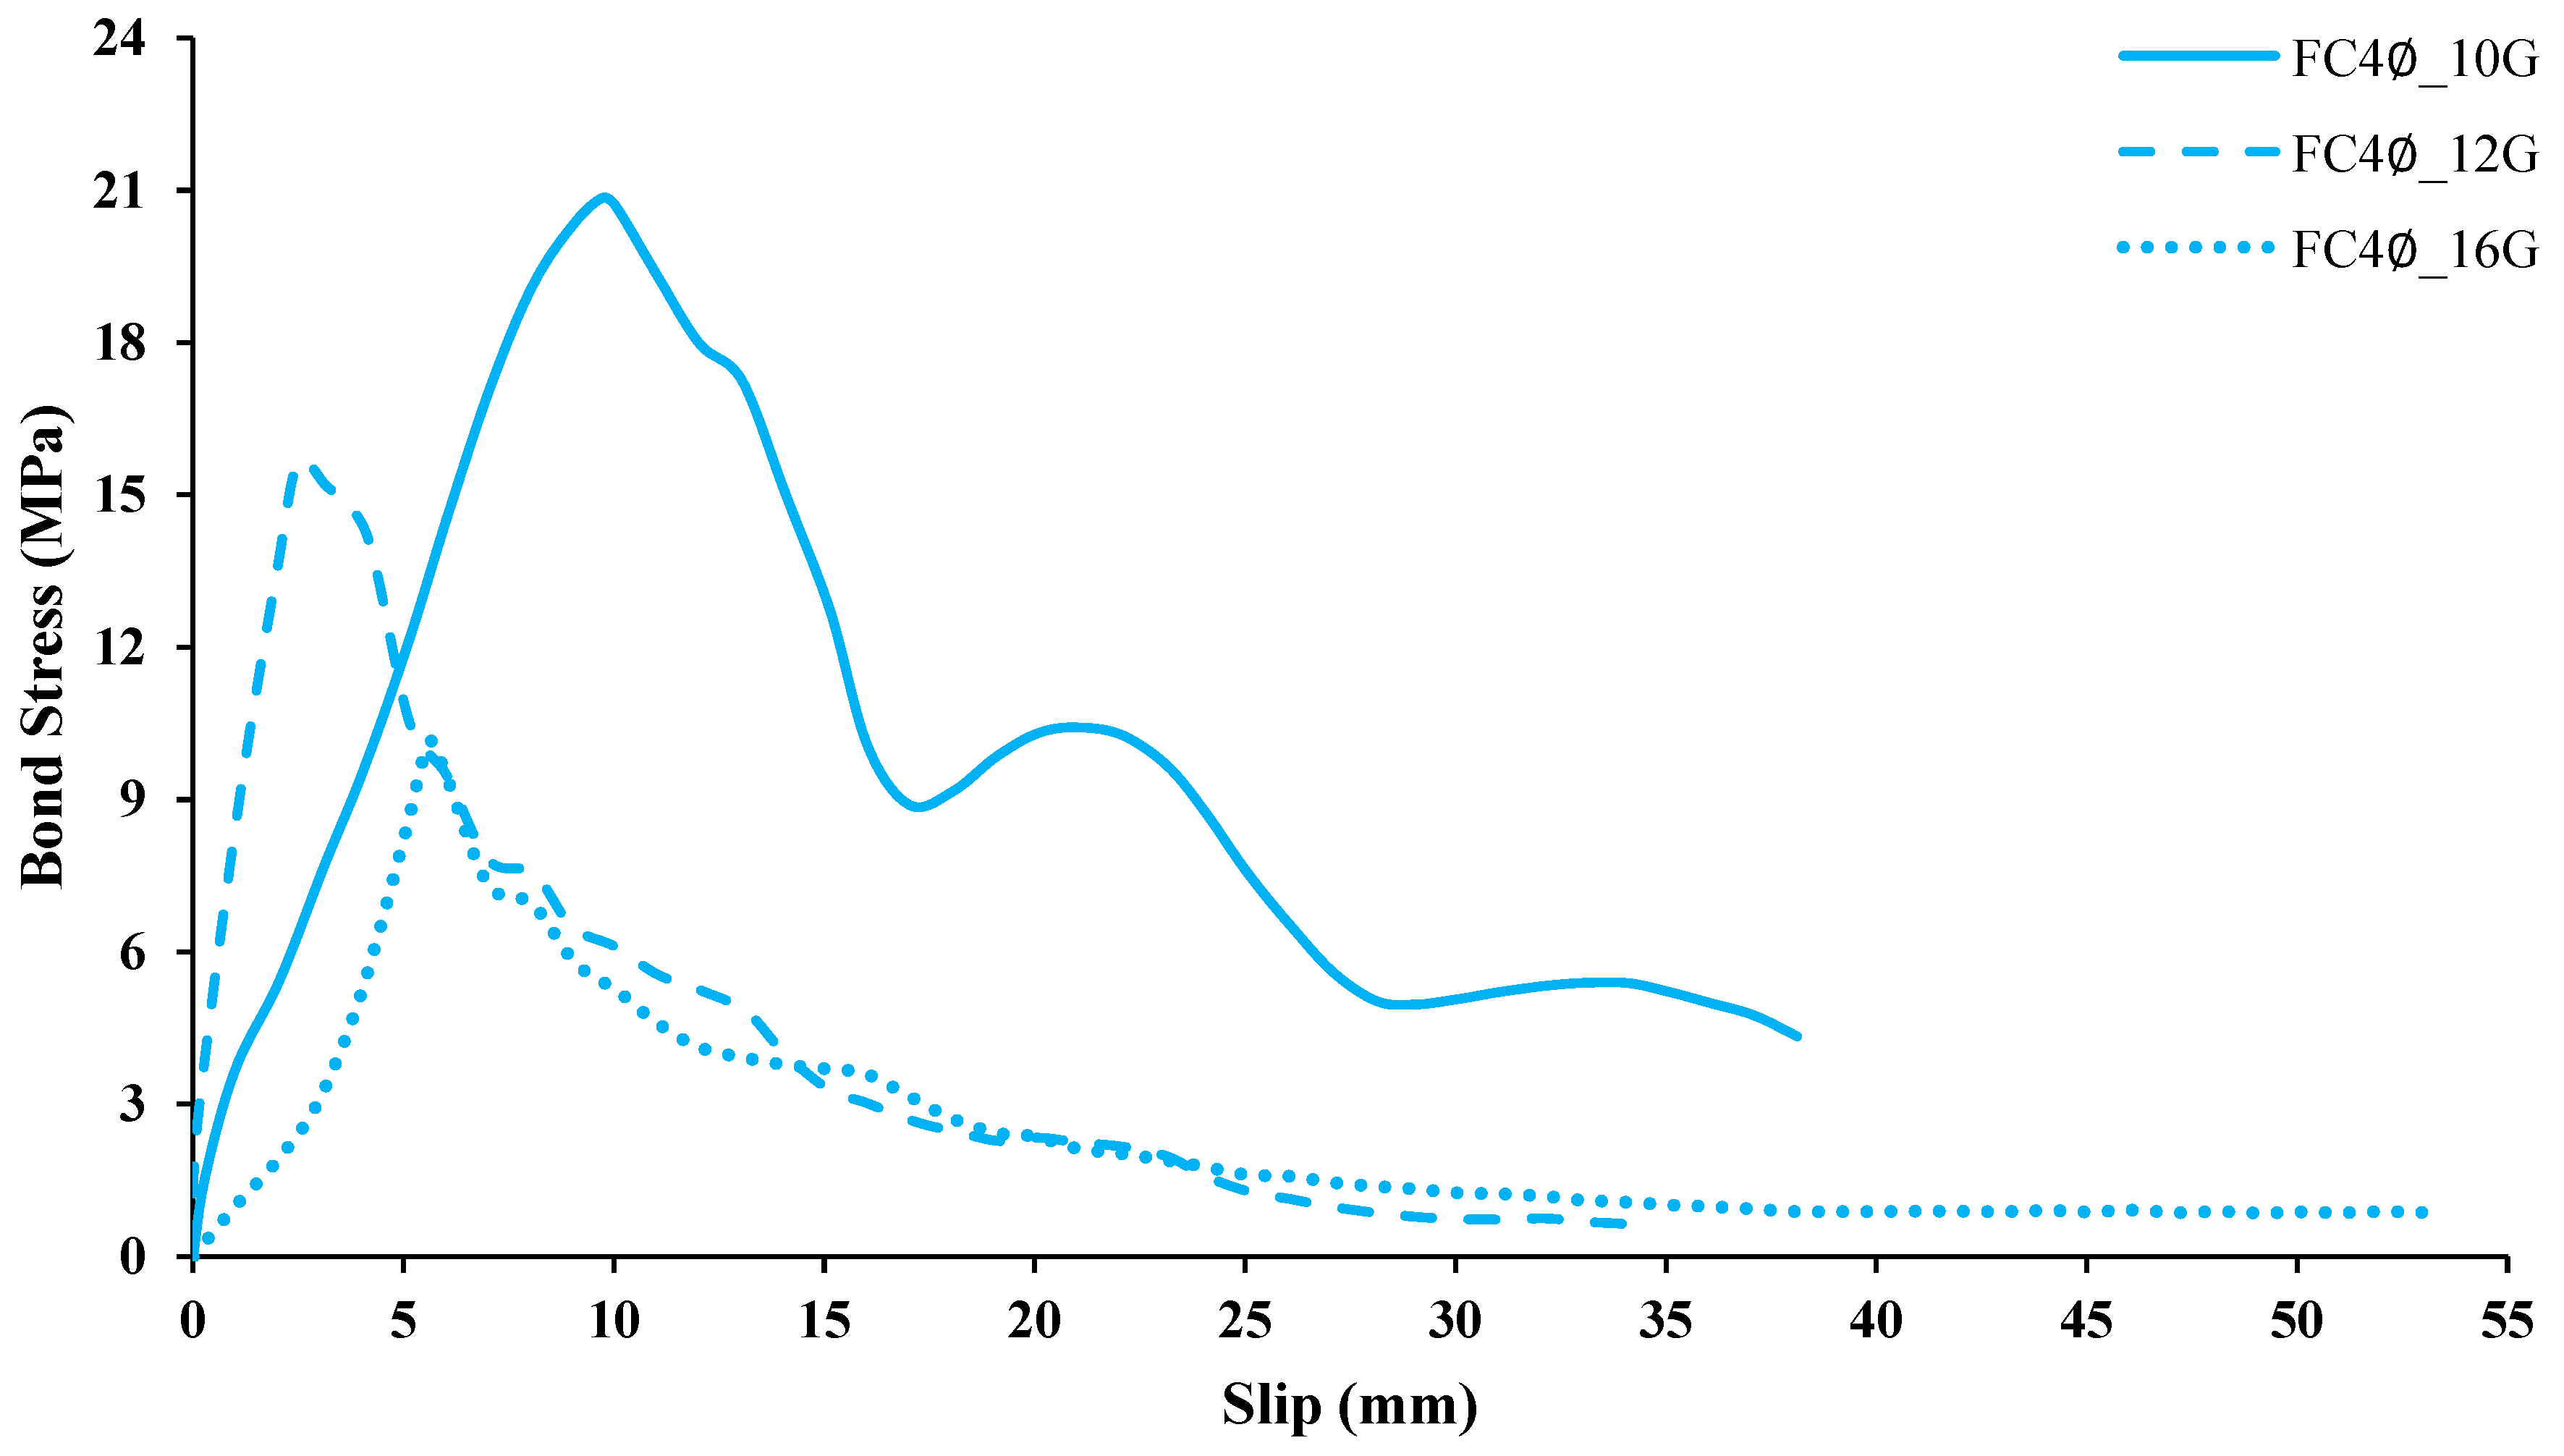
Figure 15.
Effect of variation in steel bar diameter for bonded length 4∅.
Figure 15.
Effect of variation in steel bar diameter for bonded length 4∅.
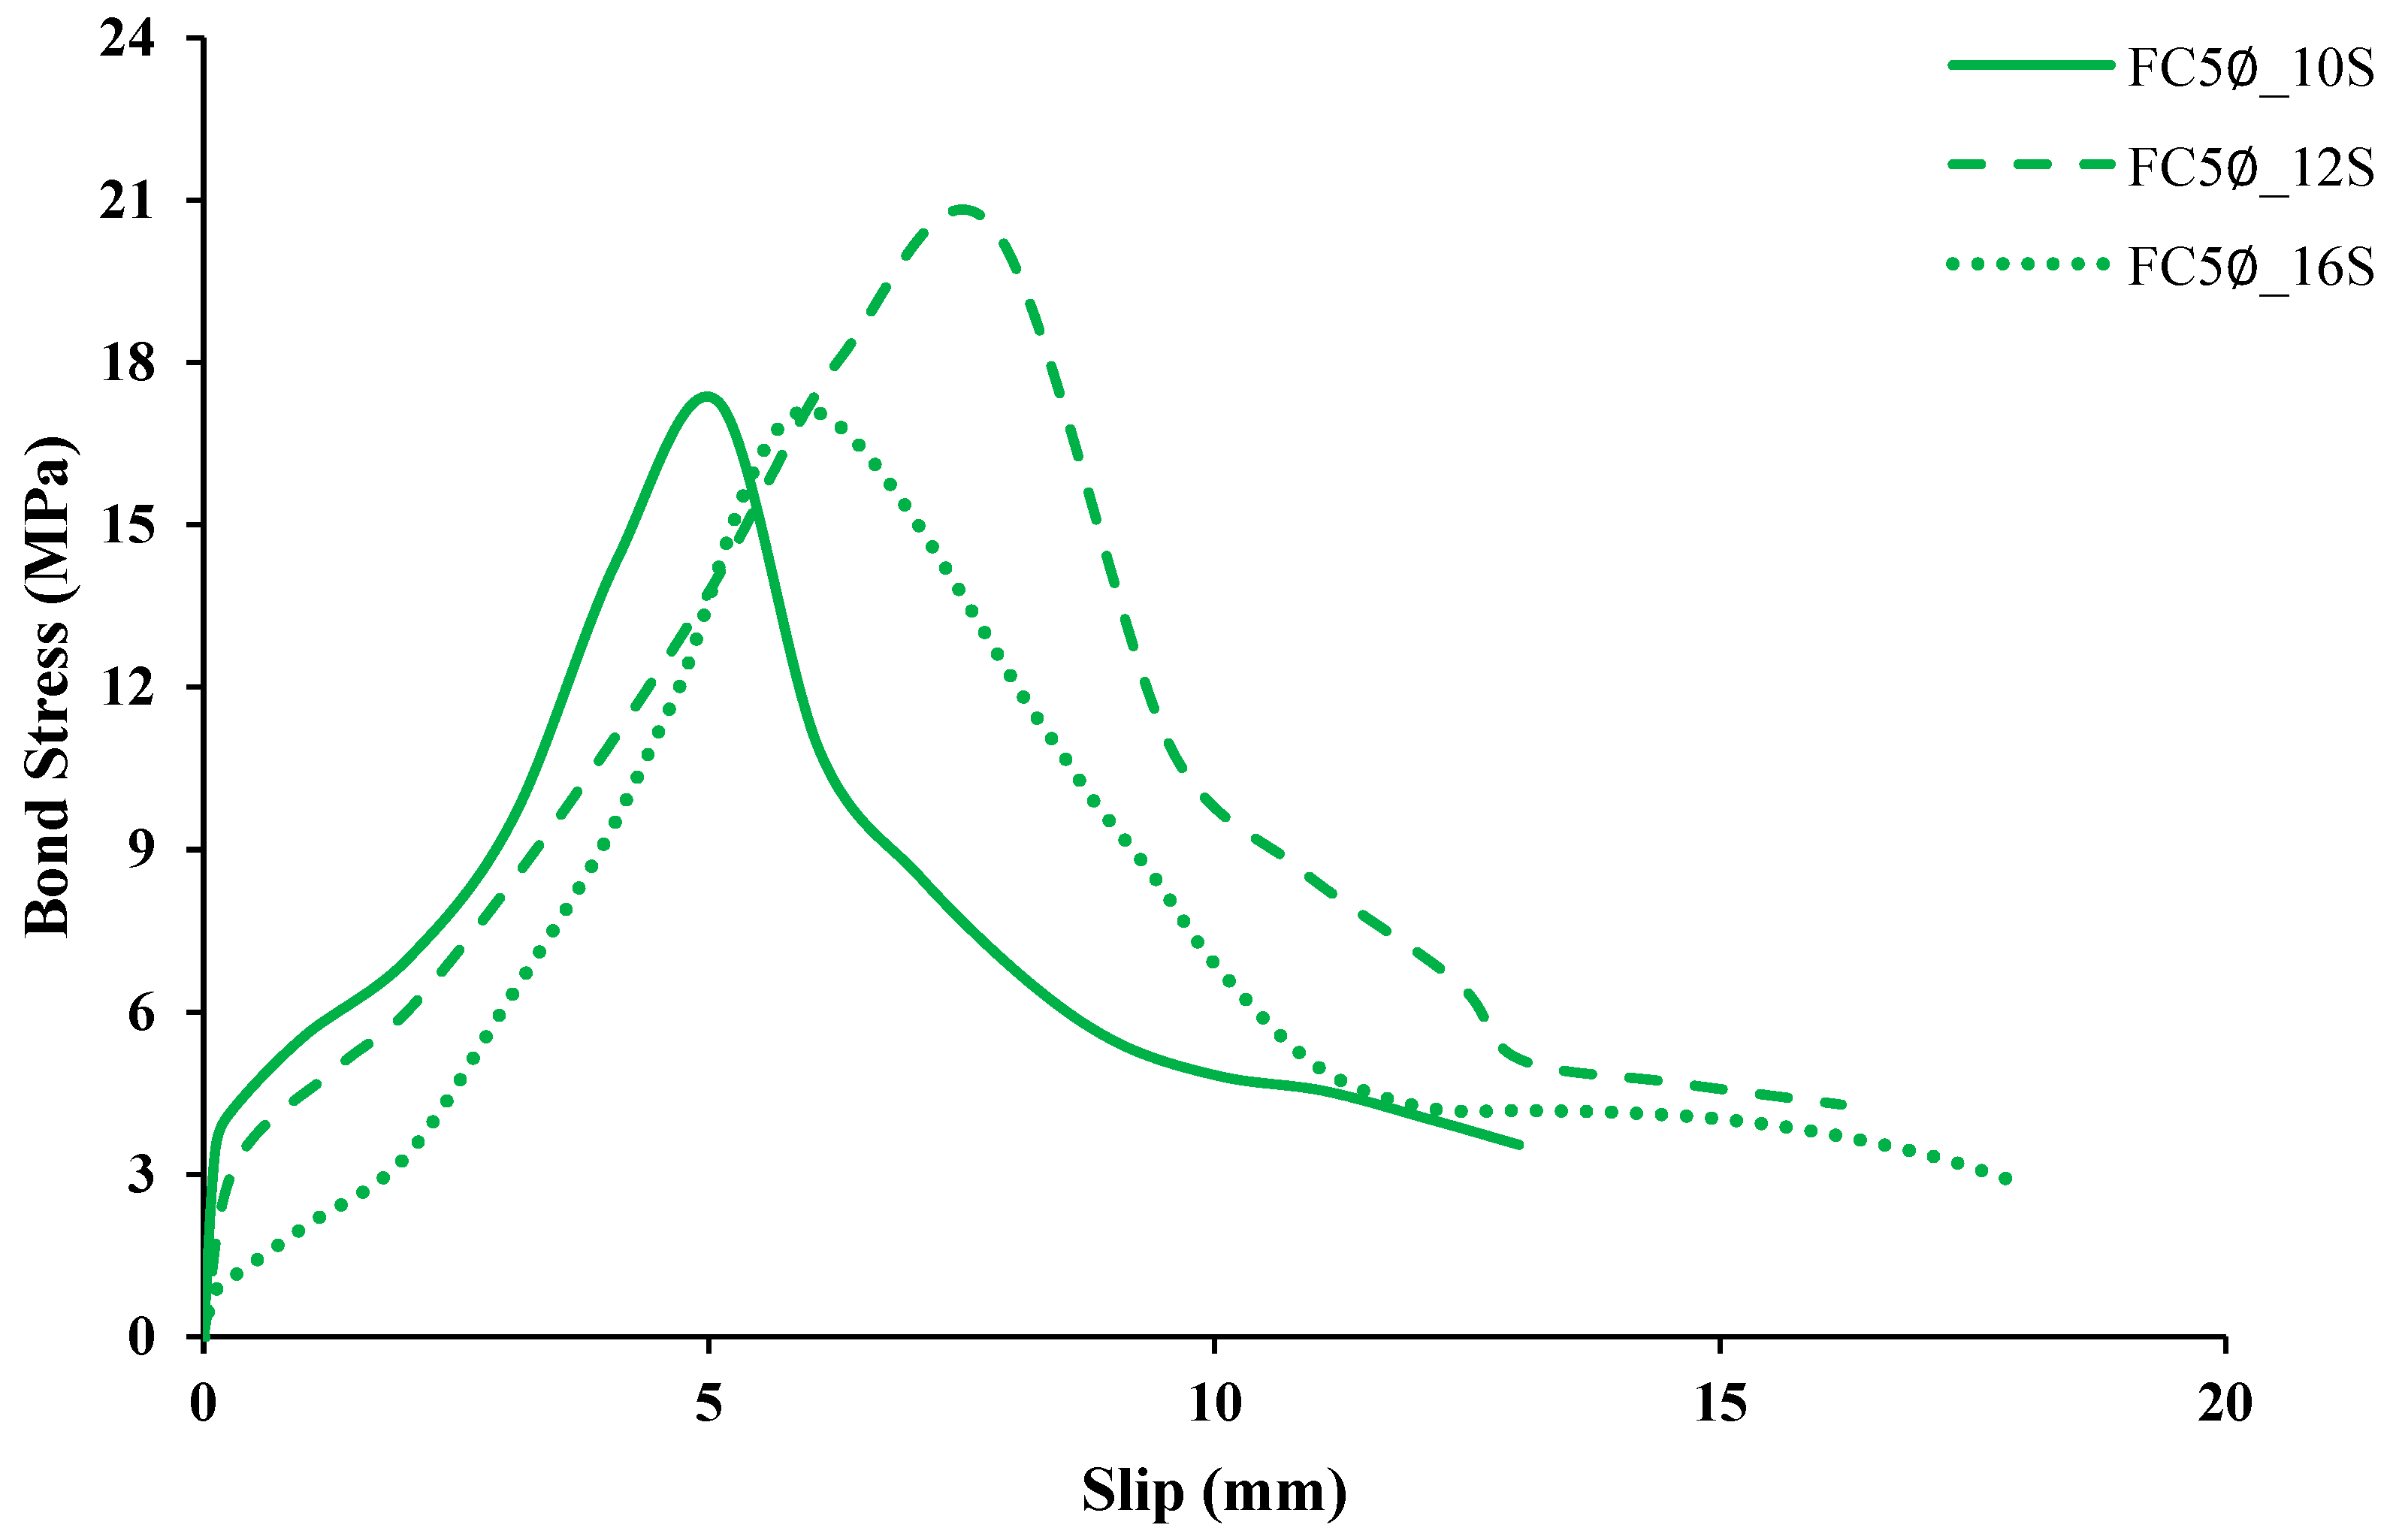
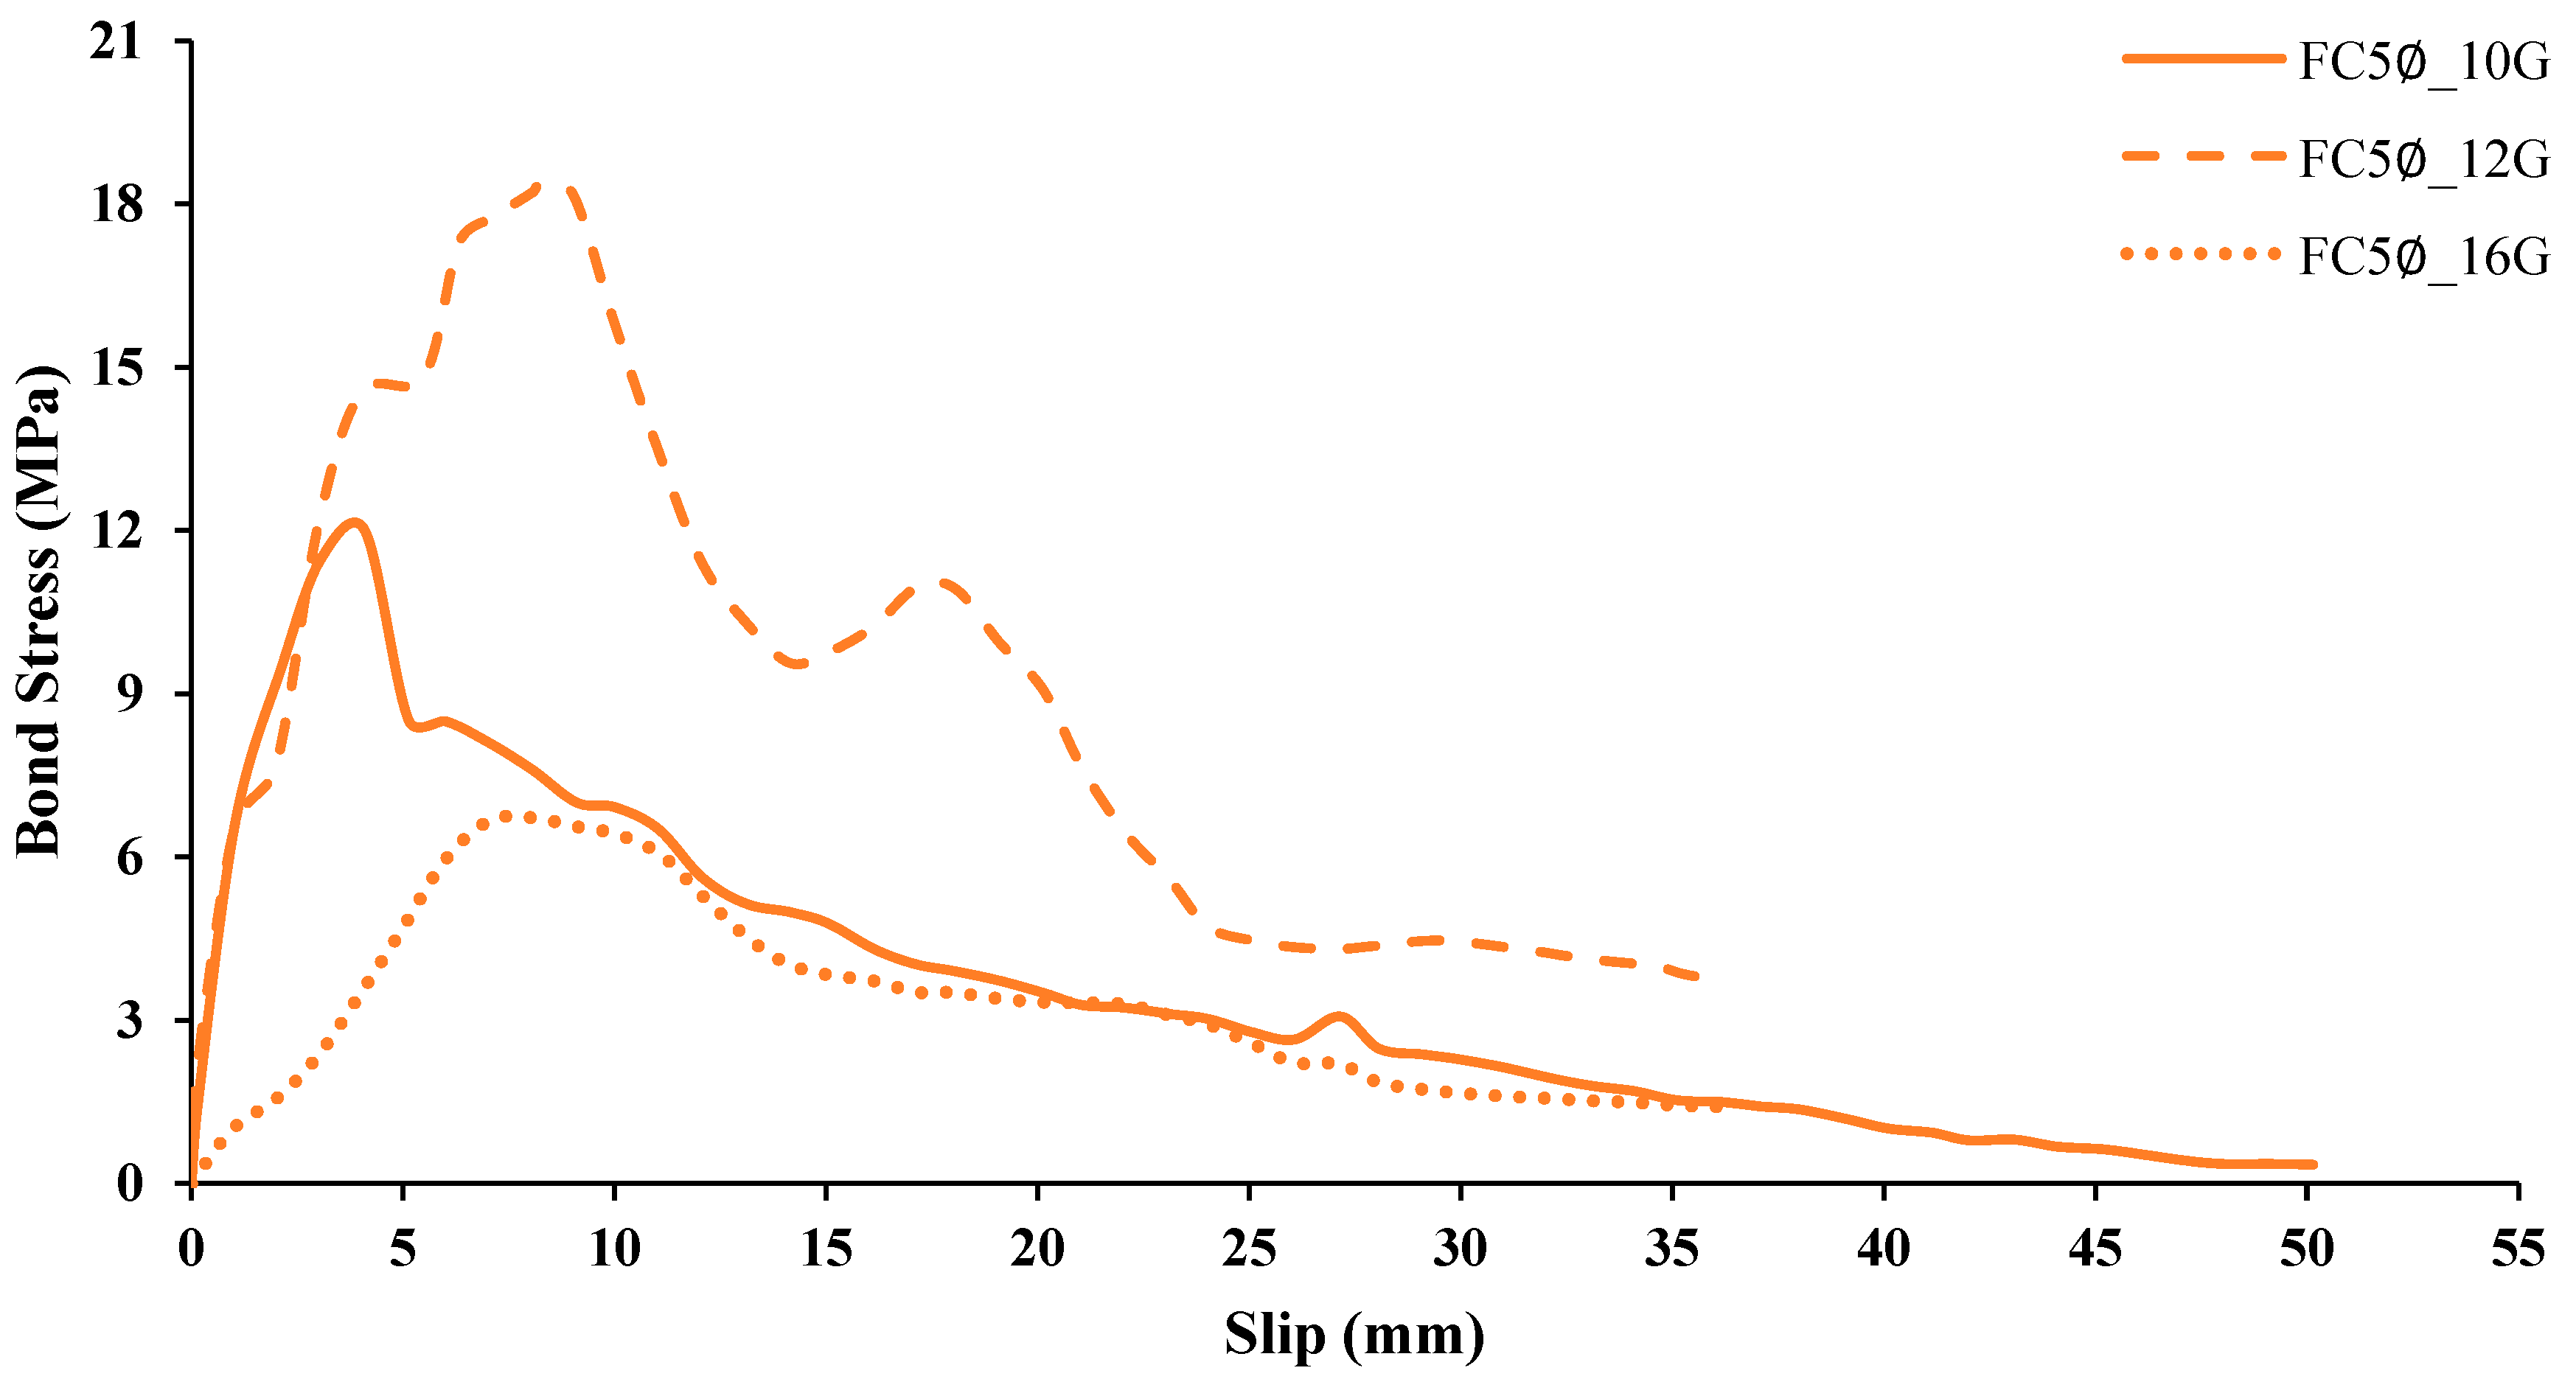
Figure 16.
Effect of variation in steel bar diameter for bonded length 5∅.
Figure 16.
Effect of variation in steel bar diameter for bonded length 5∅.
Figure 17.
Effect of variation in bonded length for the 10 mm diameter sand-coated GFRP bar.
Figure 17.
Effect of variation in bonded length for the 10 mm diameter sand-coated GFRP bar.
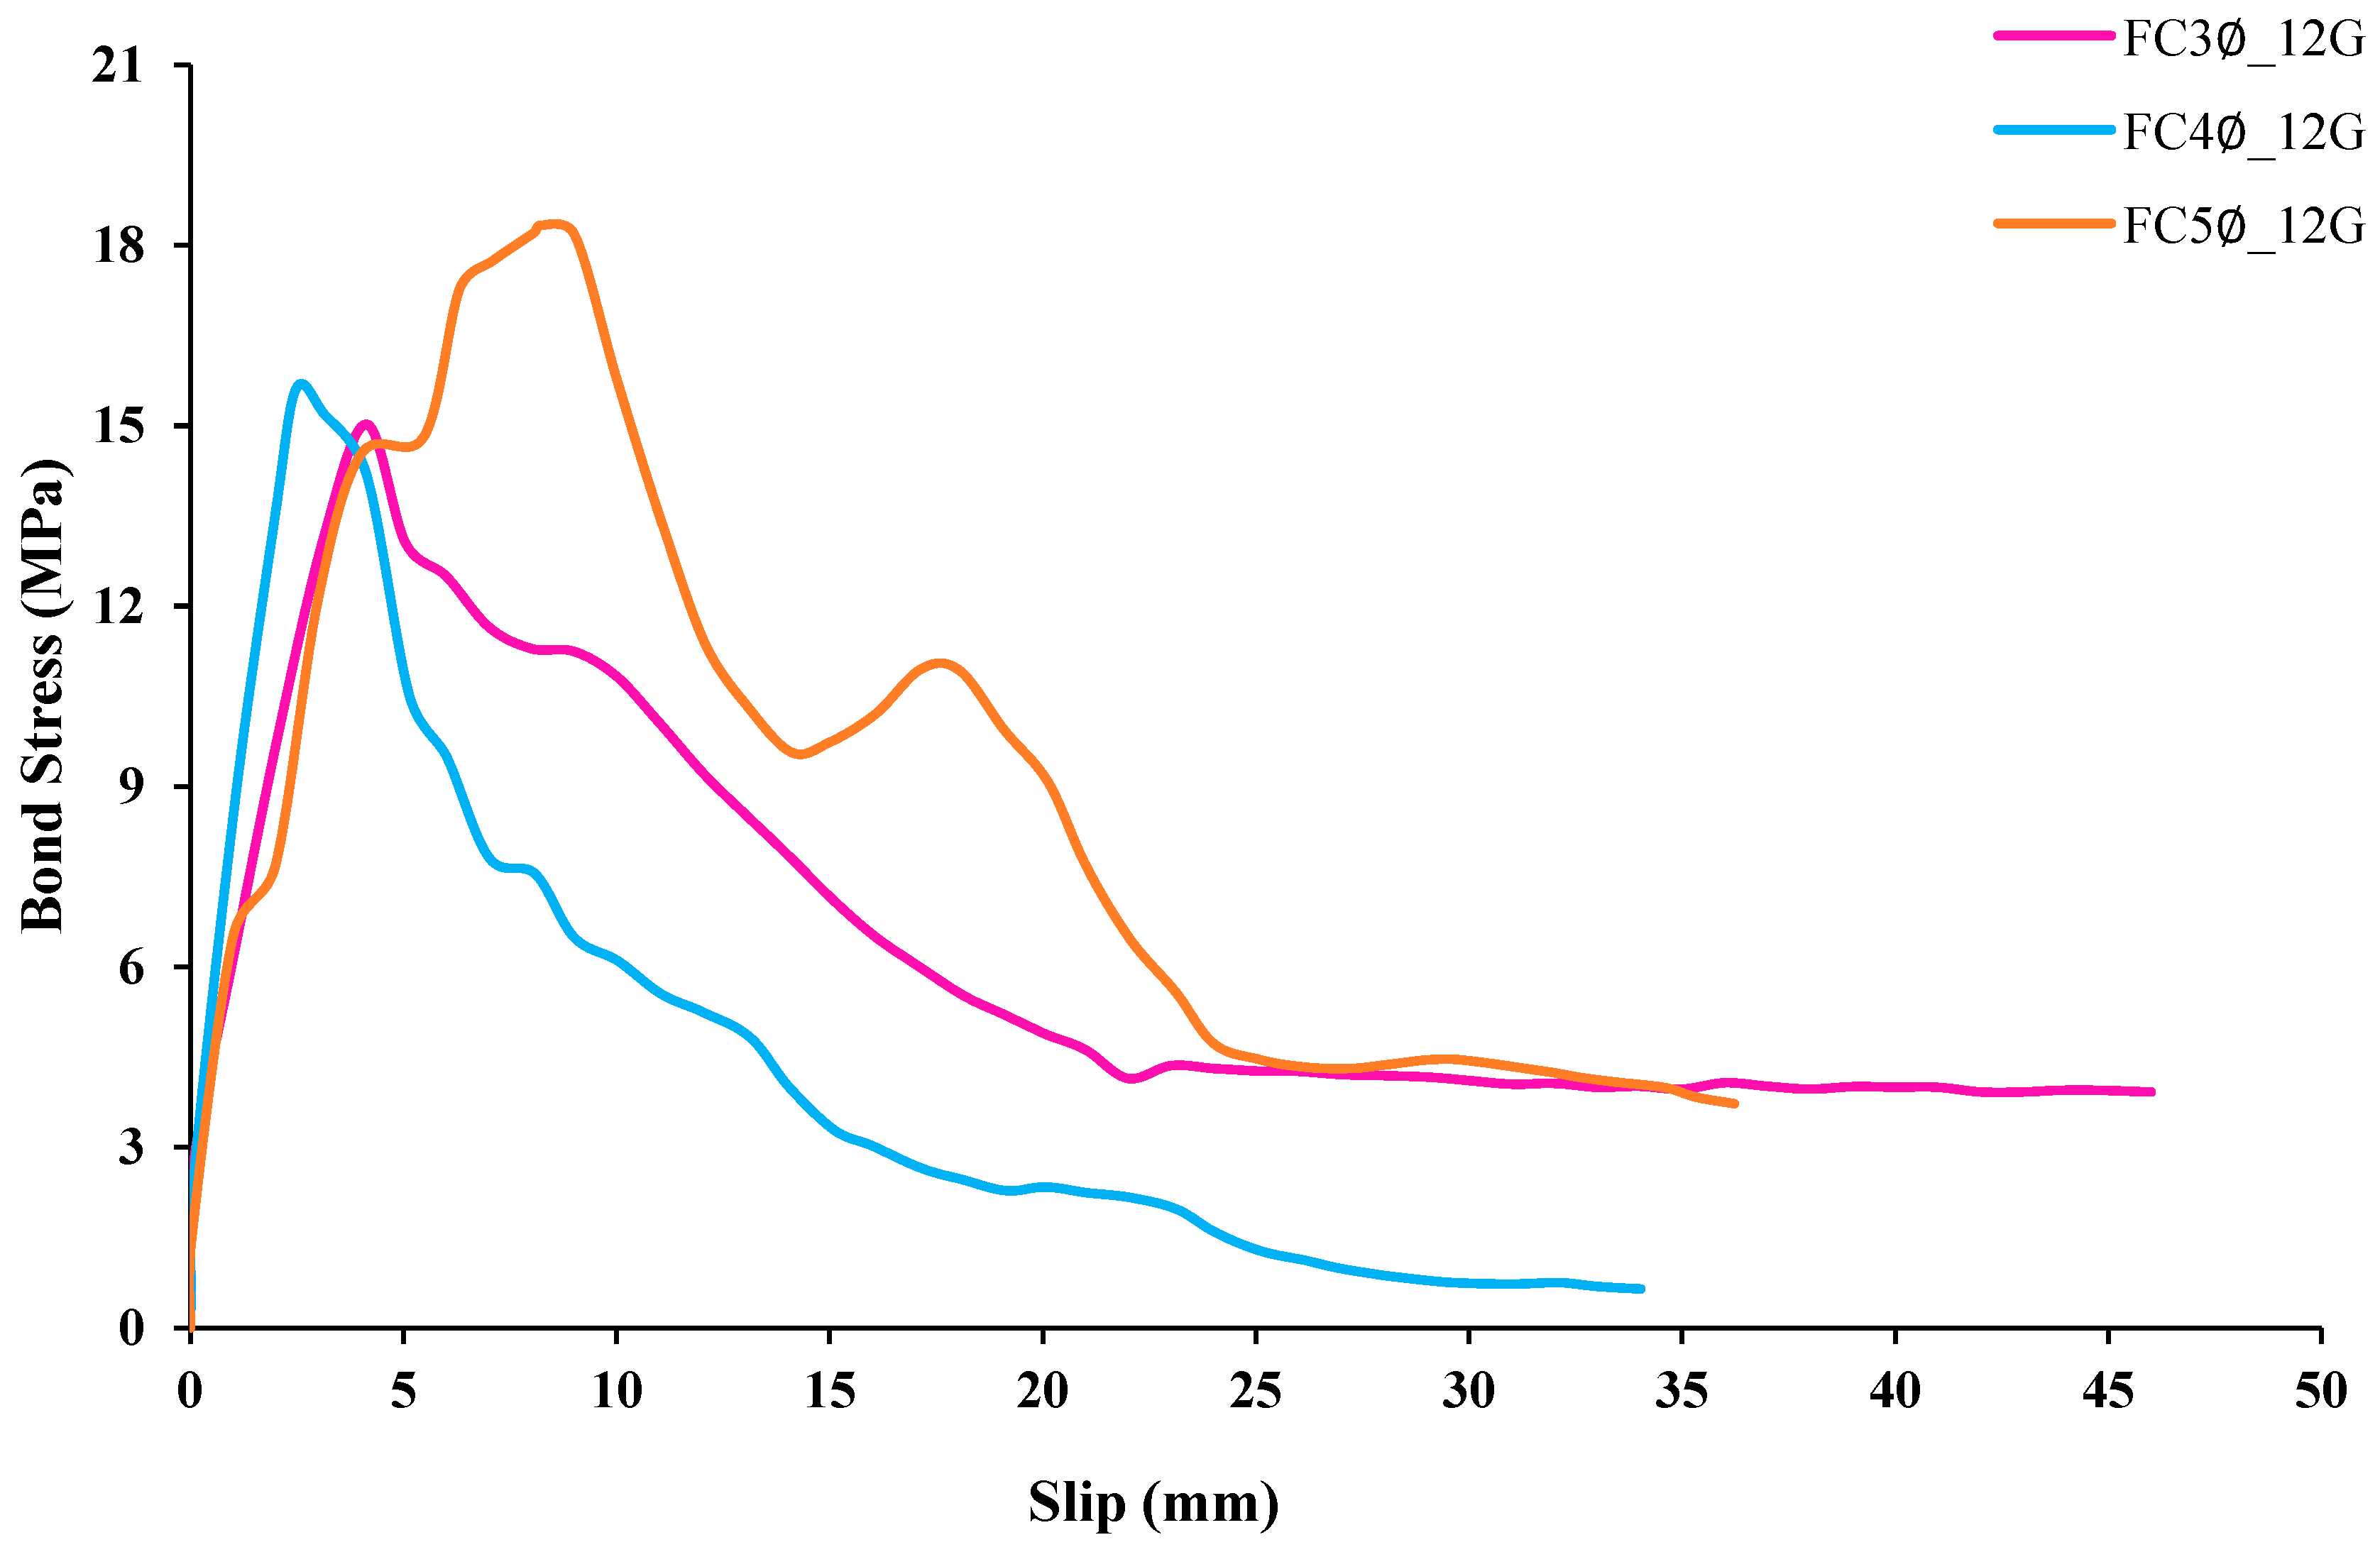
Figure 18.
Effect of variation in bonded length for the 12 mm diameter GFRP bar.
Figure 18.
Effect of variation in bonded length for the 12 mm diameter GFRP bar.
Figure 19.
Effect of variation in bonded length for 16 mm diameter GFRP bar.
Figure 19.
Effect of variation in bonded length for 16 mm diameter GFRP bar.
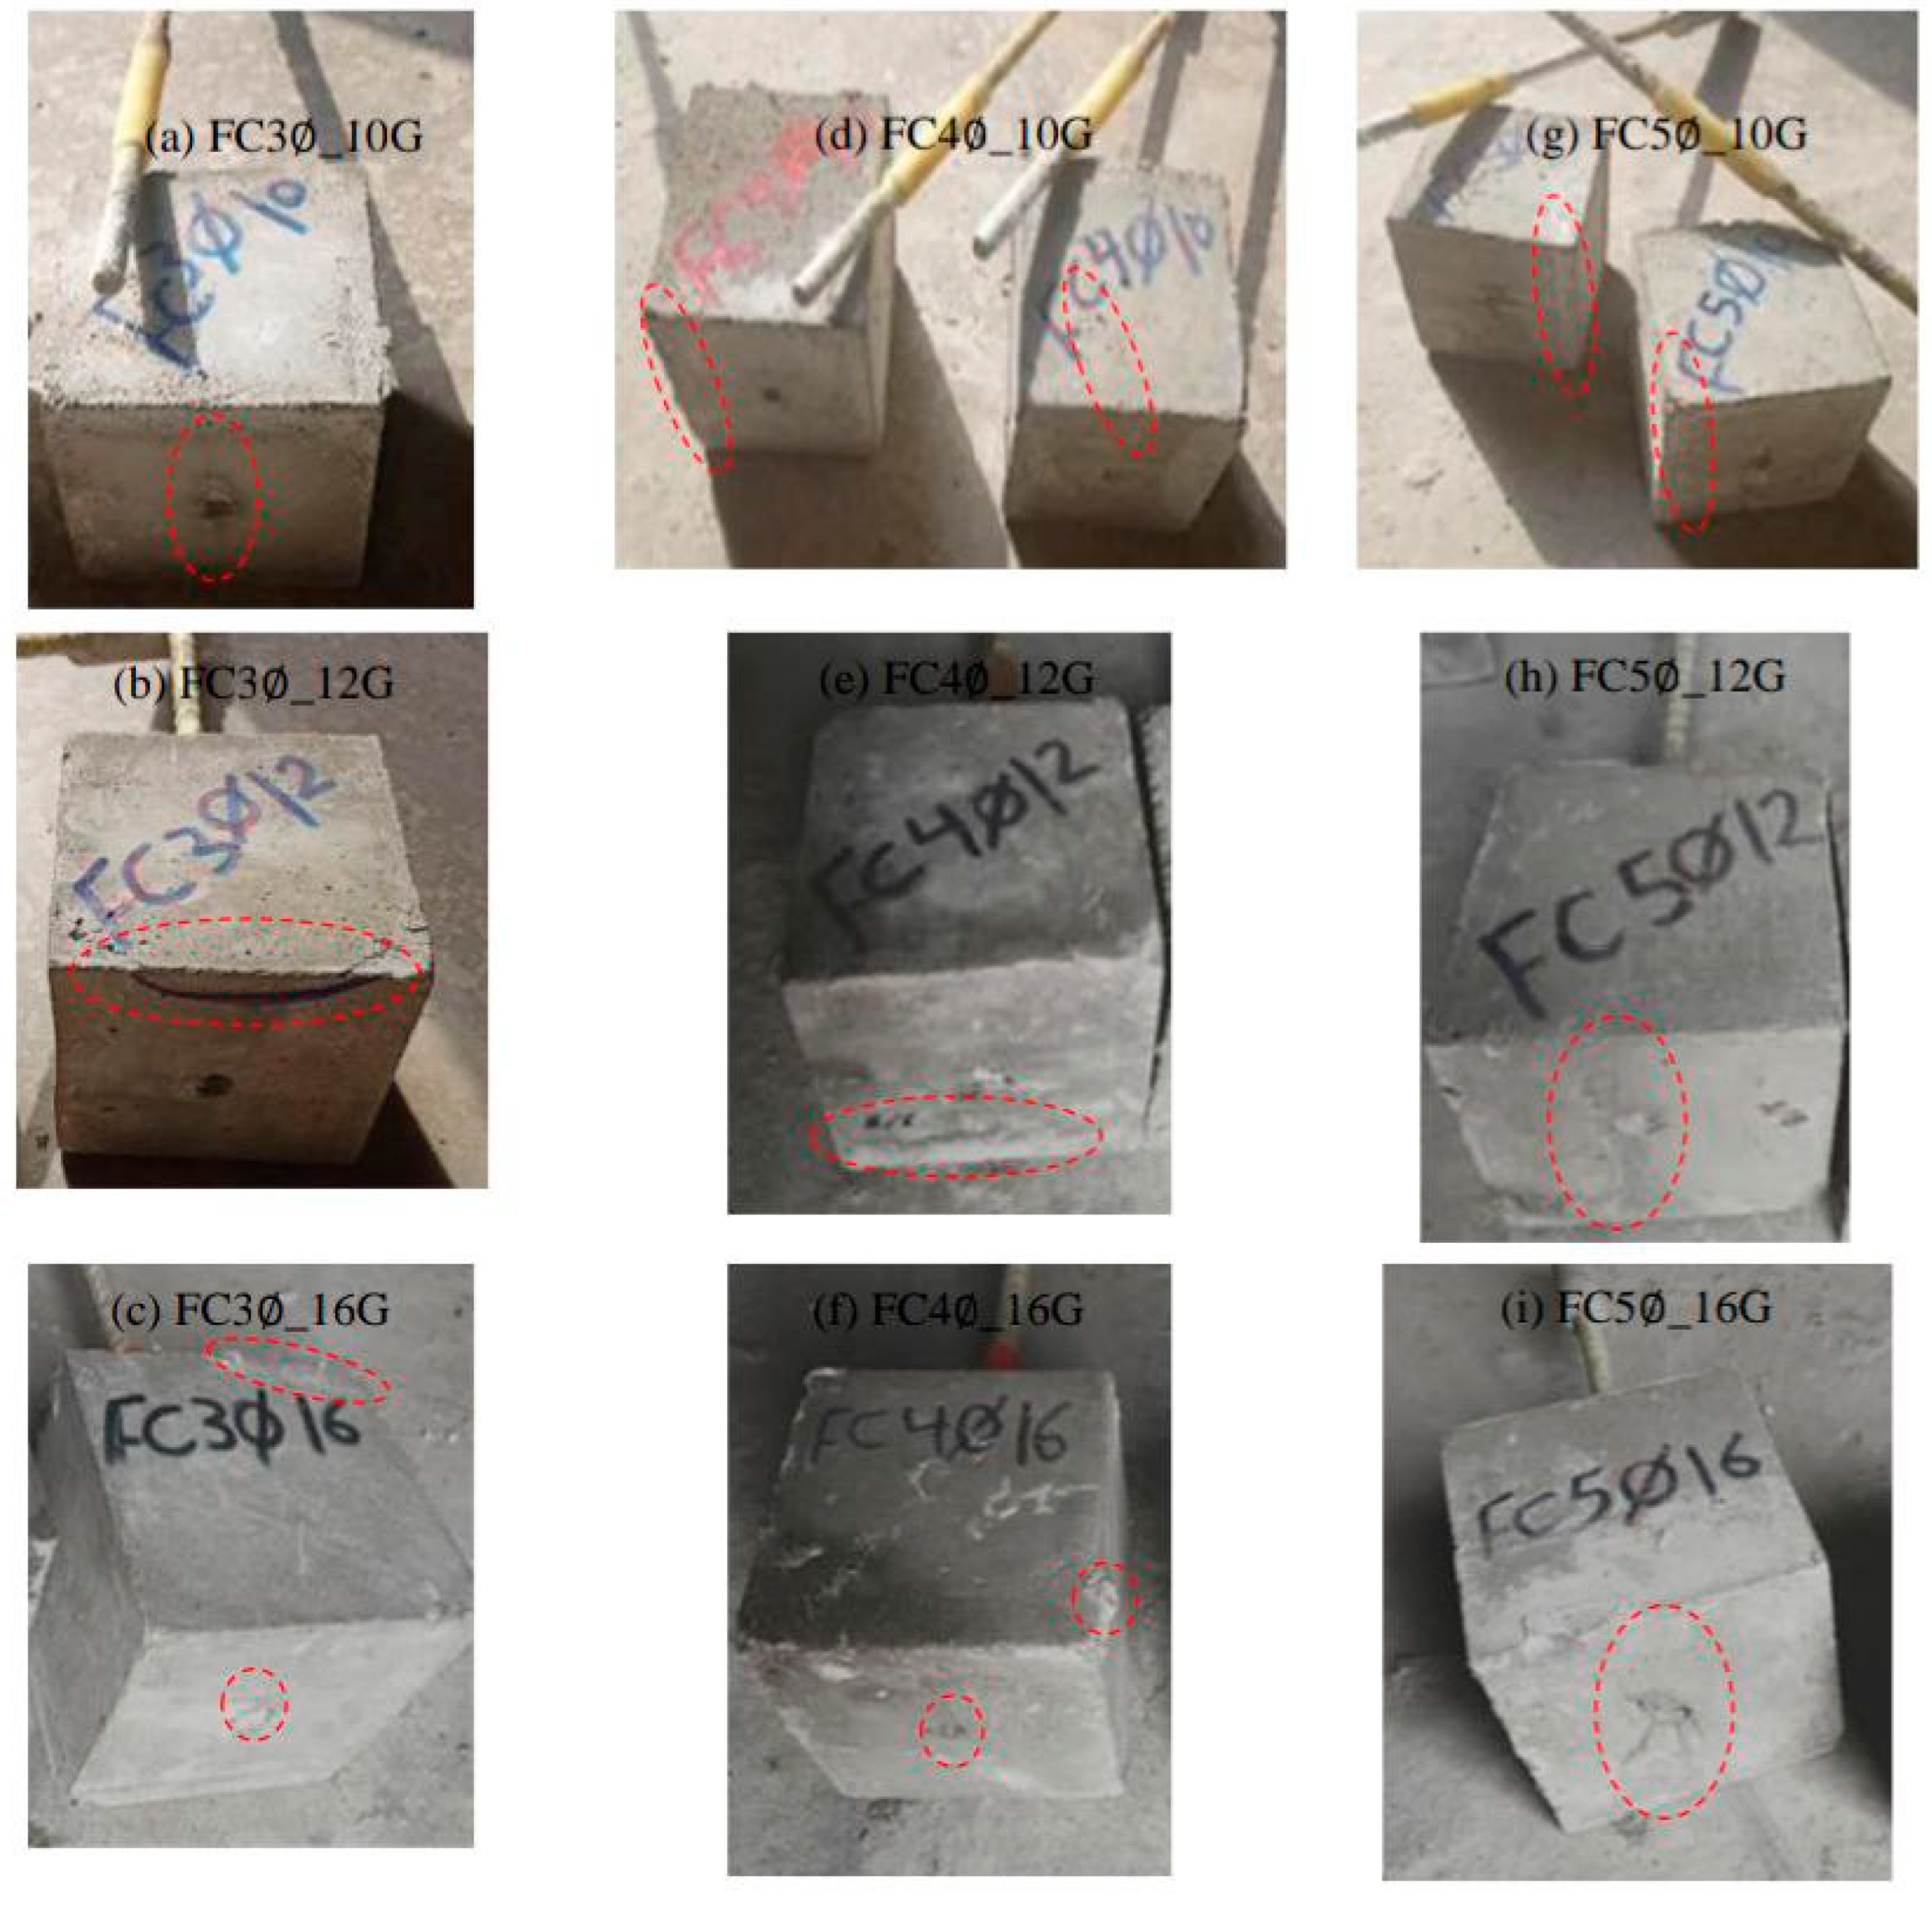
Figure 20.
Failure patterns of FC reinforced with sand- coated GFRP bars.
Figure 20.
Failure patterns of FC reinforced with sand- coated GFRP bars.
Figure 21.
Effect of variation in GFRP bars’ diameter for bonded length 3∅.
Figure 21.
Effect of variation in GFRP bars’ diameter for bonded length 3∅.
Figure 22.
Effect of variation in GFRP bars’ diameter for bonded length 4∅.
Figure 22.
Effect of variation in GFRP bars’ diameter for bonded length 4∅.
Figure 23.
Effect of variation in GFRP bars’ diameter for bonded length 5∅.
Figure 23.
Effect of variation in GFRP bars’ diameter for bonded length 5∅.
Figure 24.
Effect of variation in bonded length for the 10 mm diameter steel bar.
Figure 24.
Effect of variation in bonded length for the 10 mm diameter steel bar.
Figure 25.
Effect of variation in bonded length for the 12 mm diameter steel bar.
Figure 25.
Effect of variation in bonded length for the 12 mm diameter steel bar.
Figure 26.
Effect of variation in bonded length for the 16 mm diameter steel bar.
Figure 26.
Effect of variation in bonded length for the 16 mm diameter steel bar.
Figure 27.
Failure patterns of NWC reinforced with ribbed steel bars.
Figure 27.
Failure patterns of NWC reinforced with ribbed steel bars.
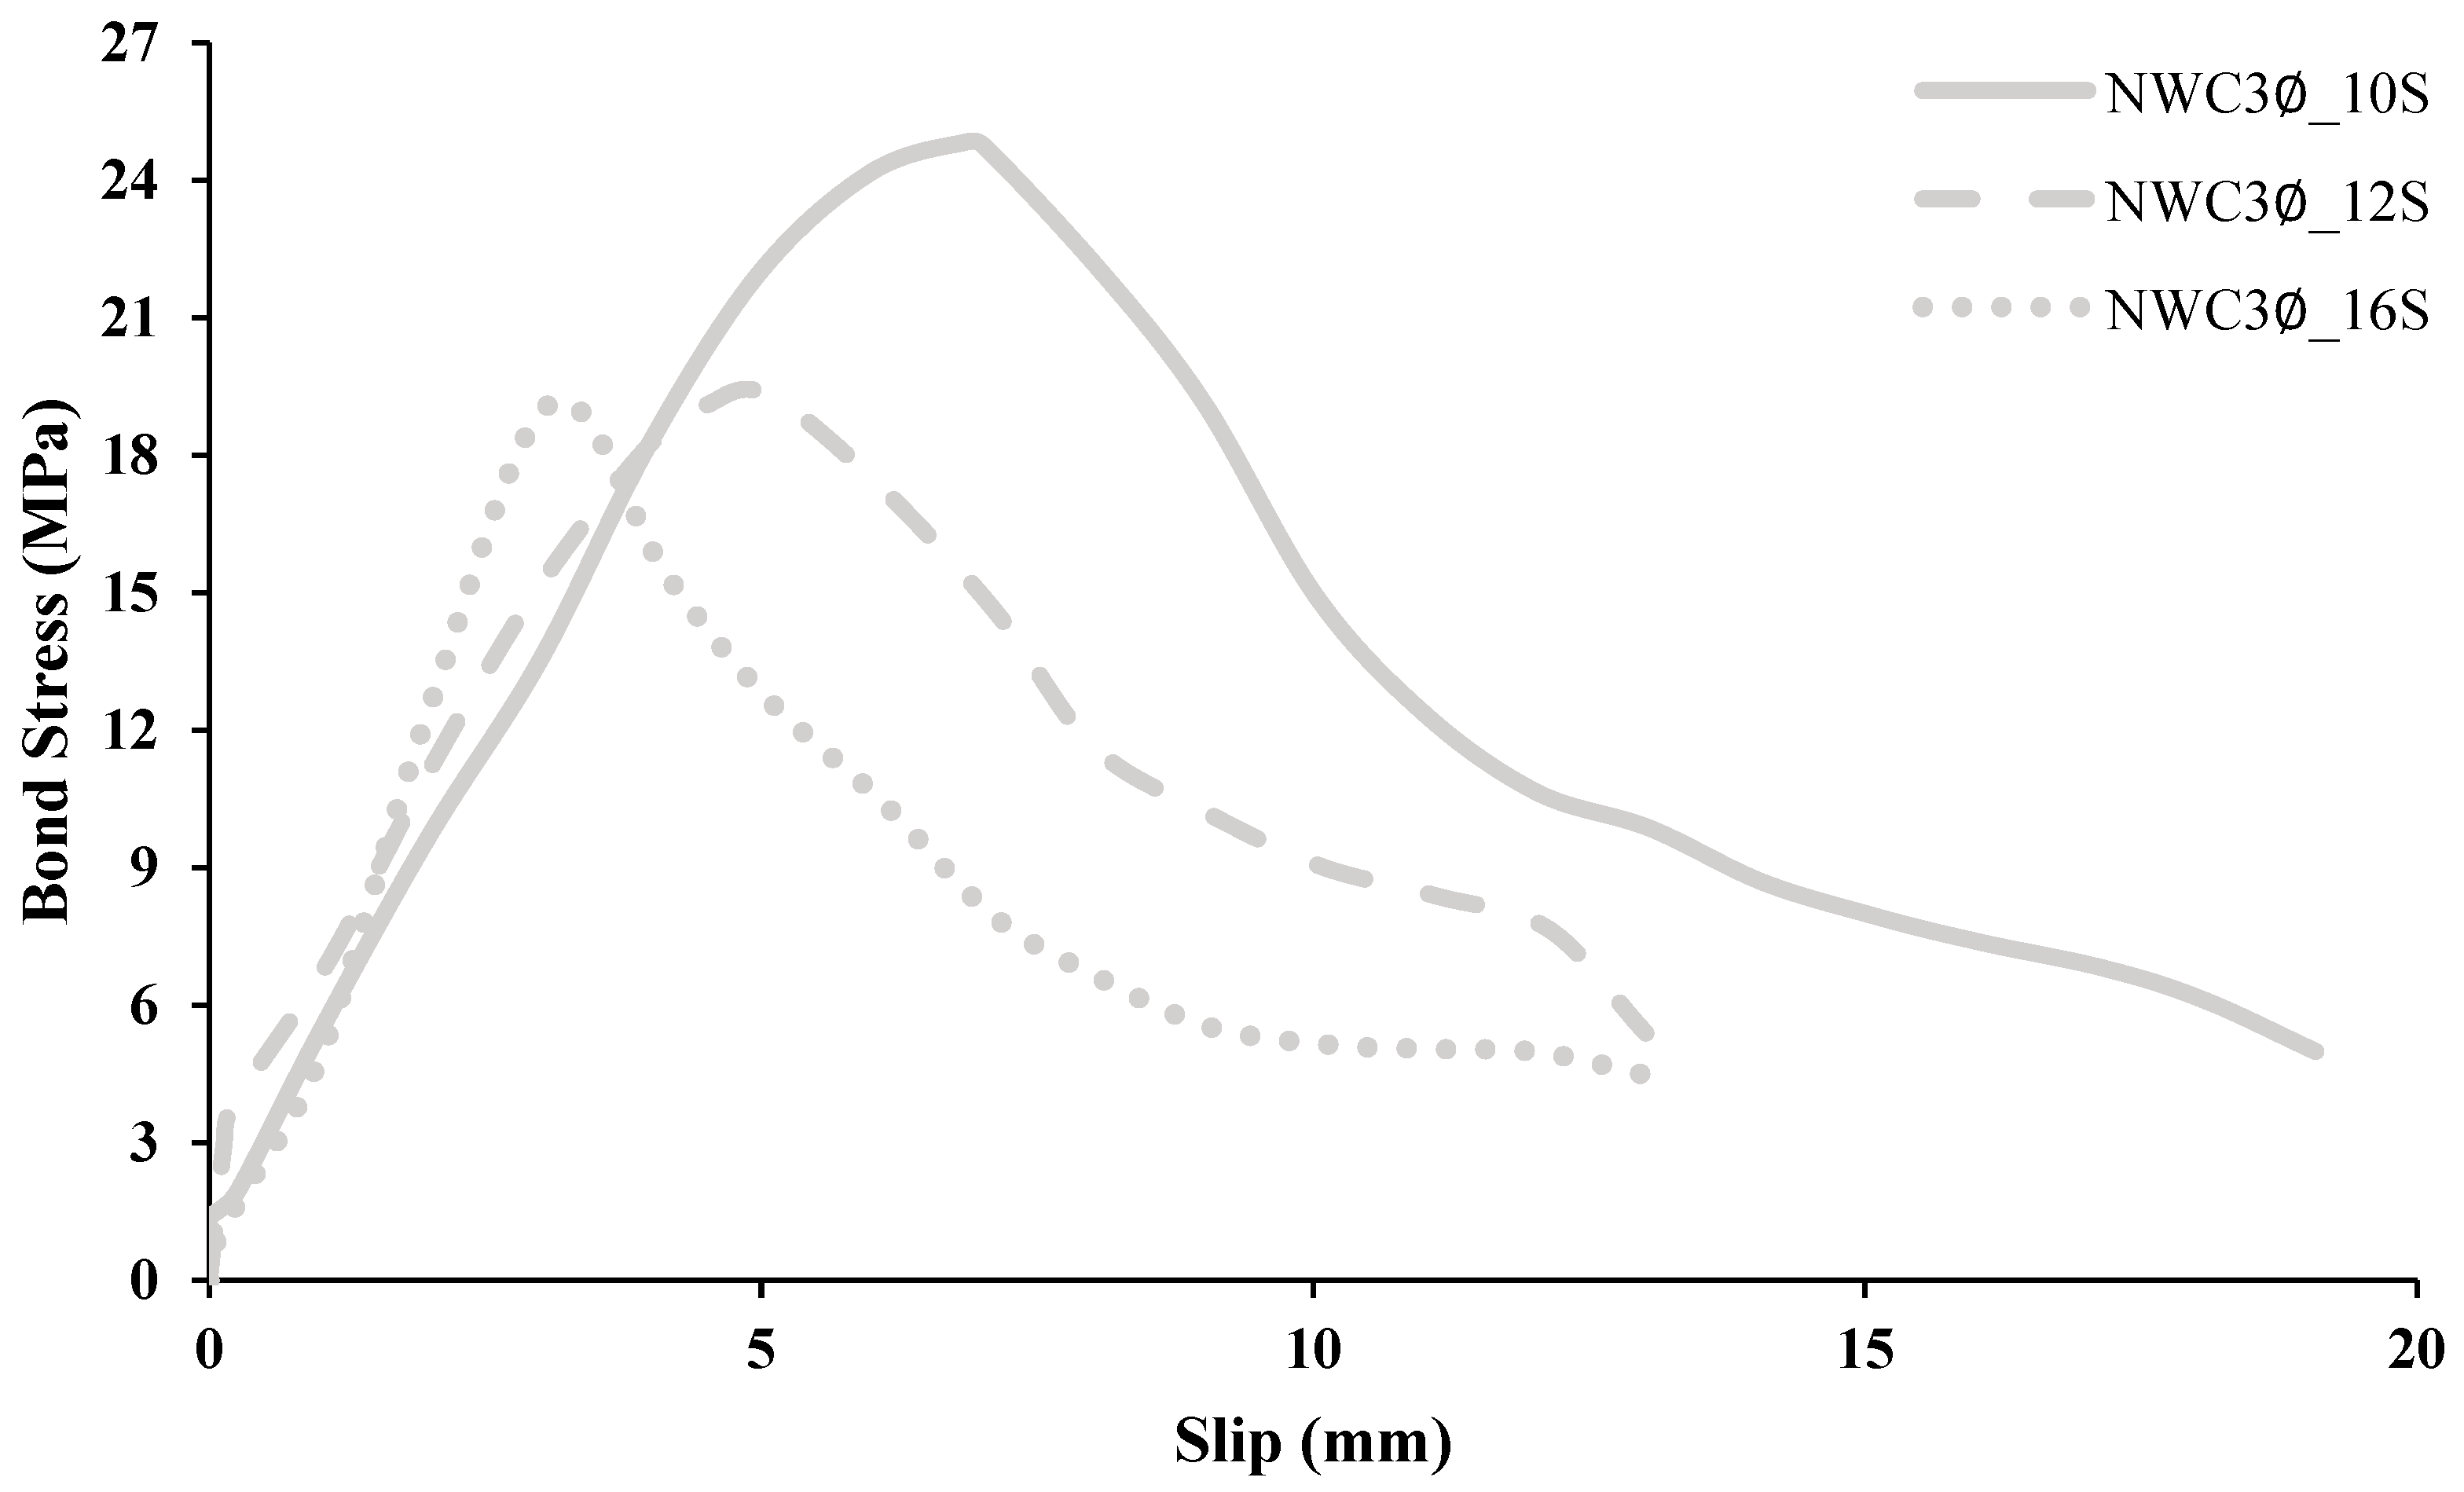
Figure 28.
Effect of variation in steel bars’ diameter for bonded length 3∅.
Figure 28.
Effect of variation in steel bars’ diameter for bonded length 3∅.
Figure 29.
Effect of variation in steel bars’ diameter for bonded length 4∅.
Figure 29.
Effect of variation in steel bars’ diameter for bonded length 4∅.
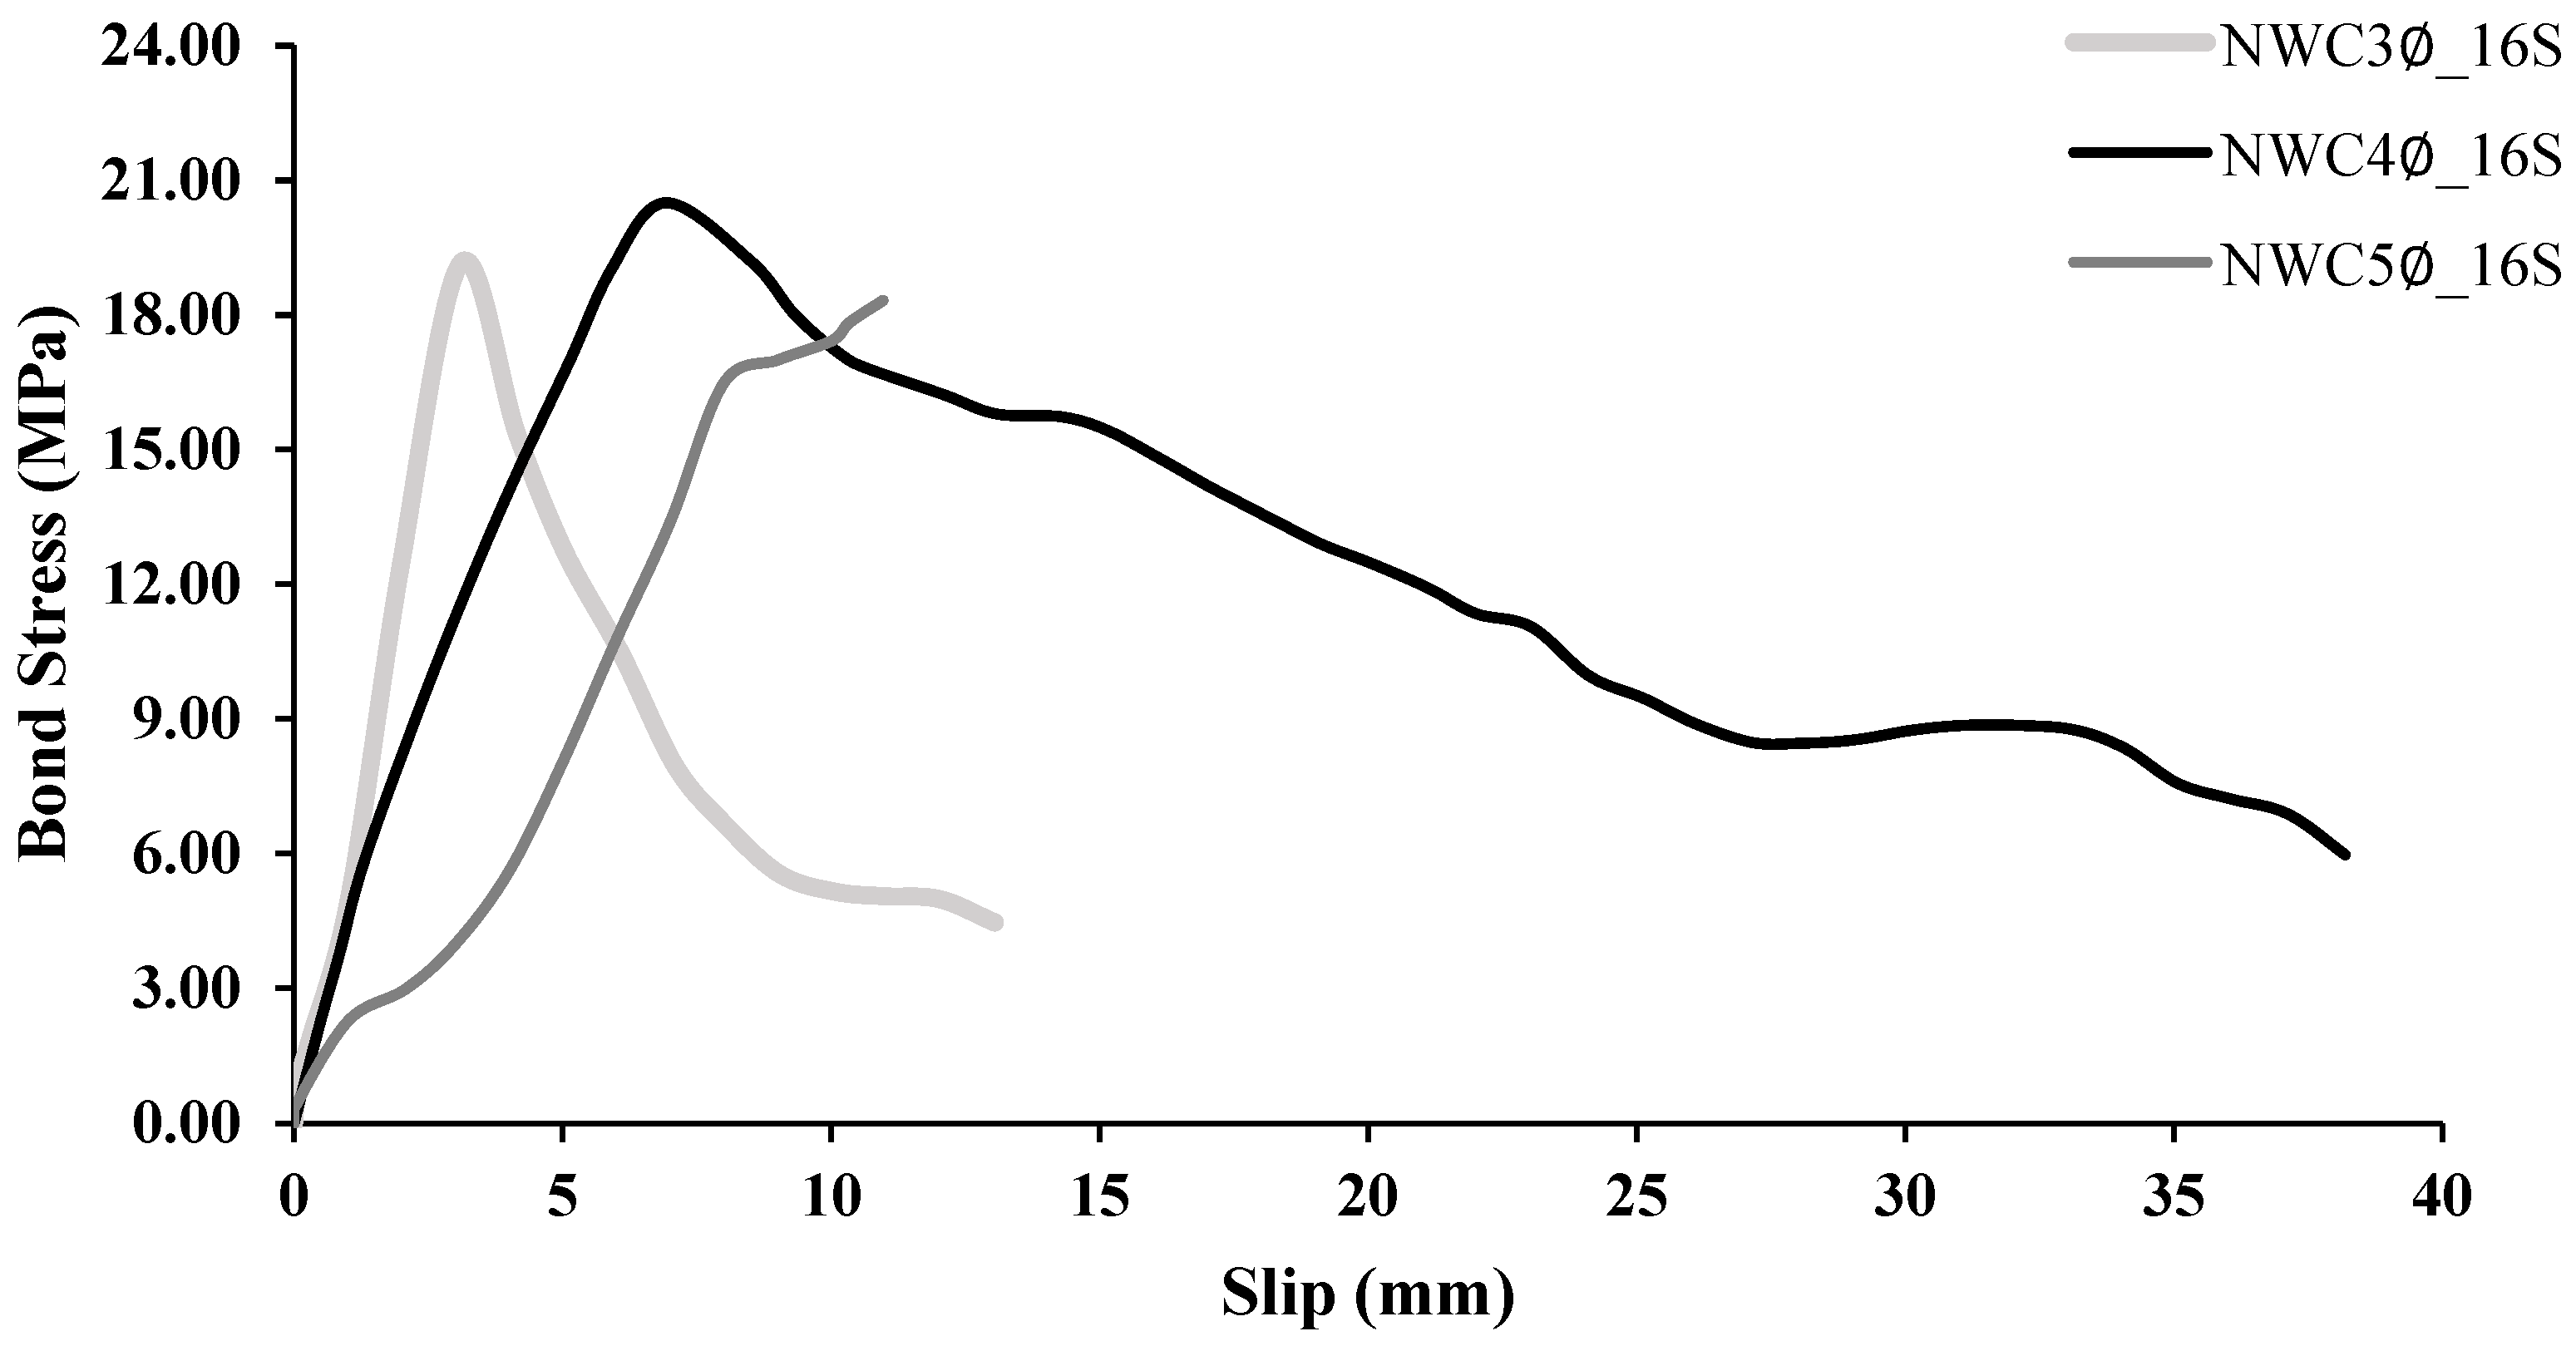
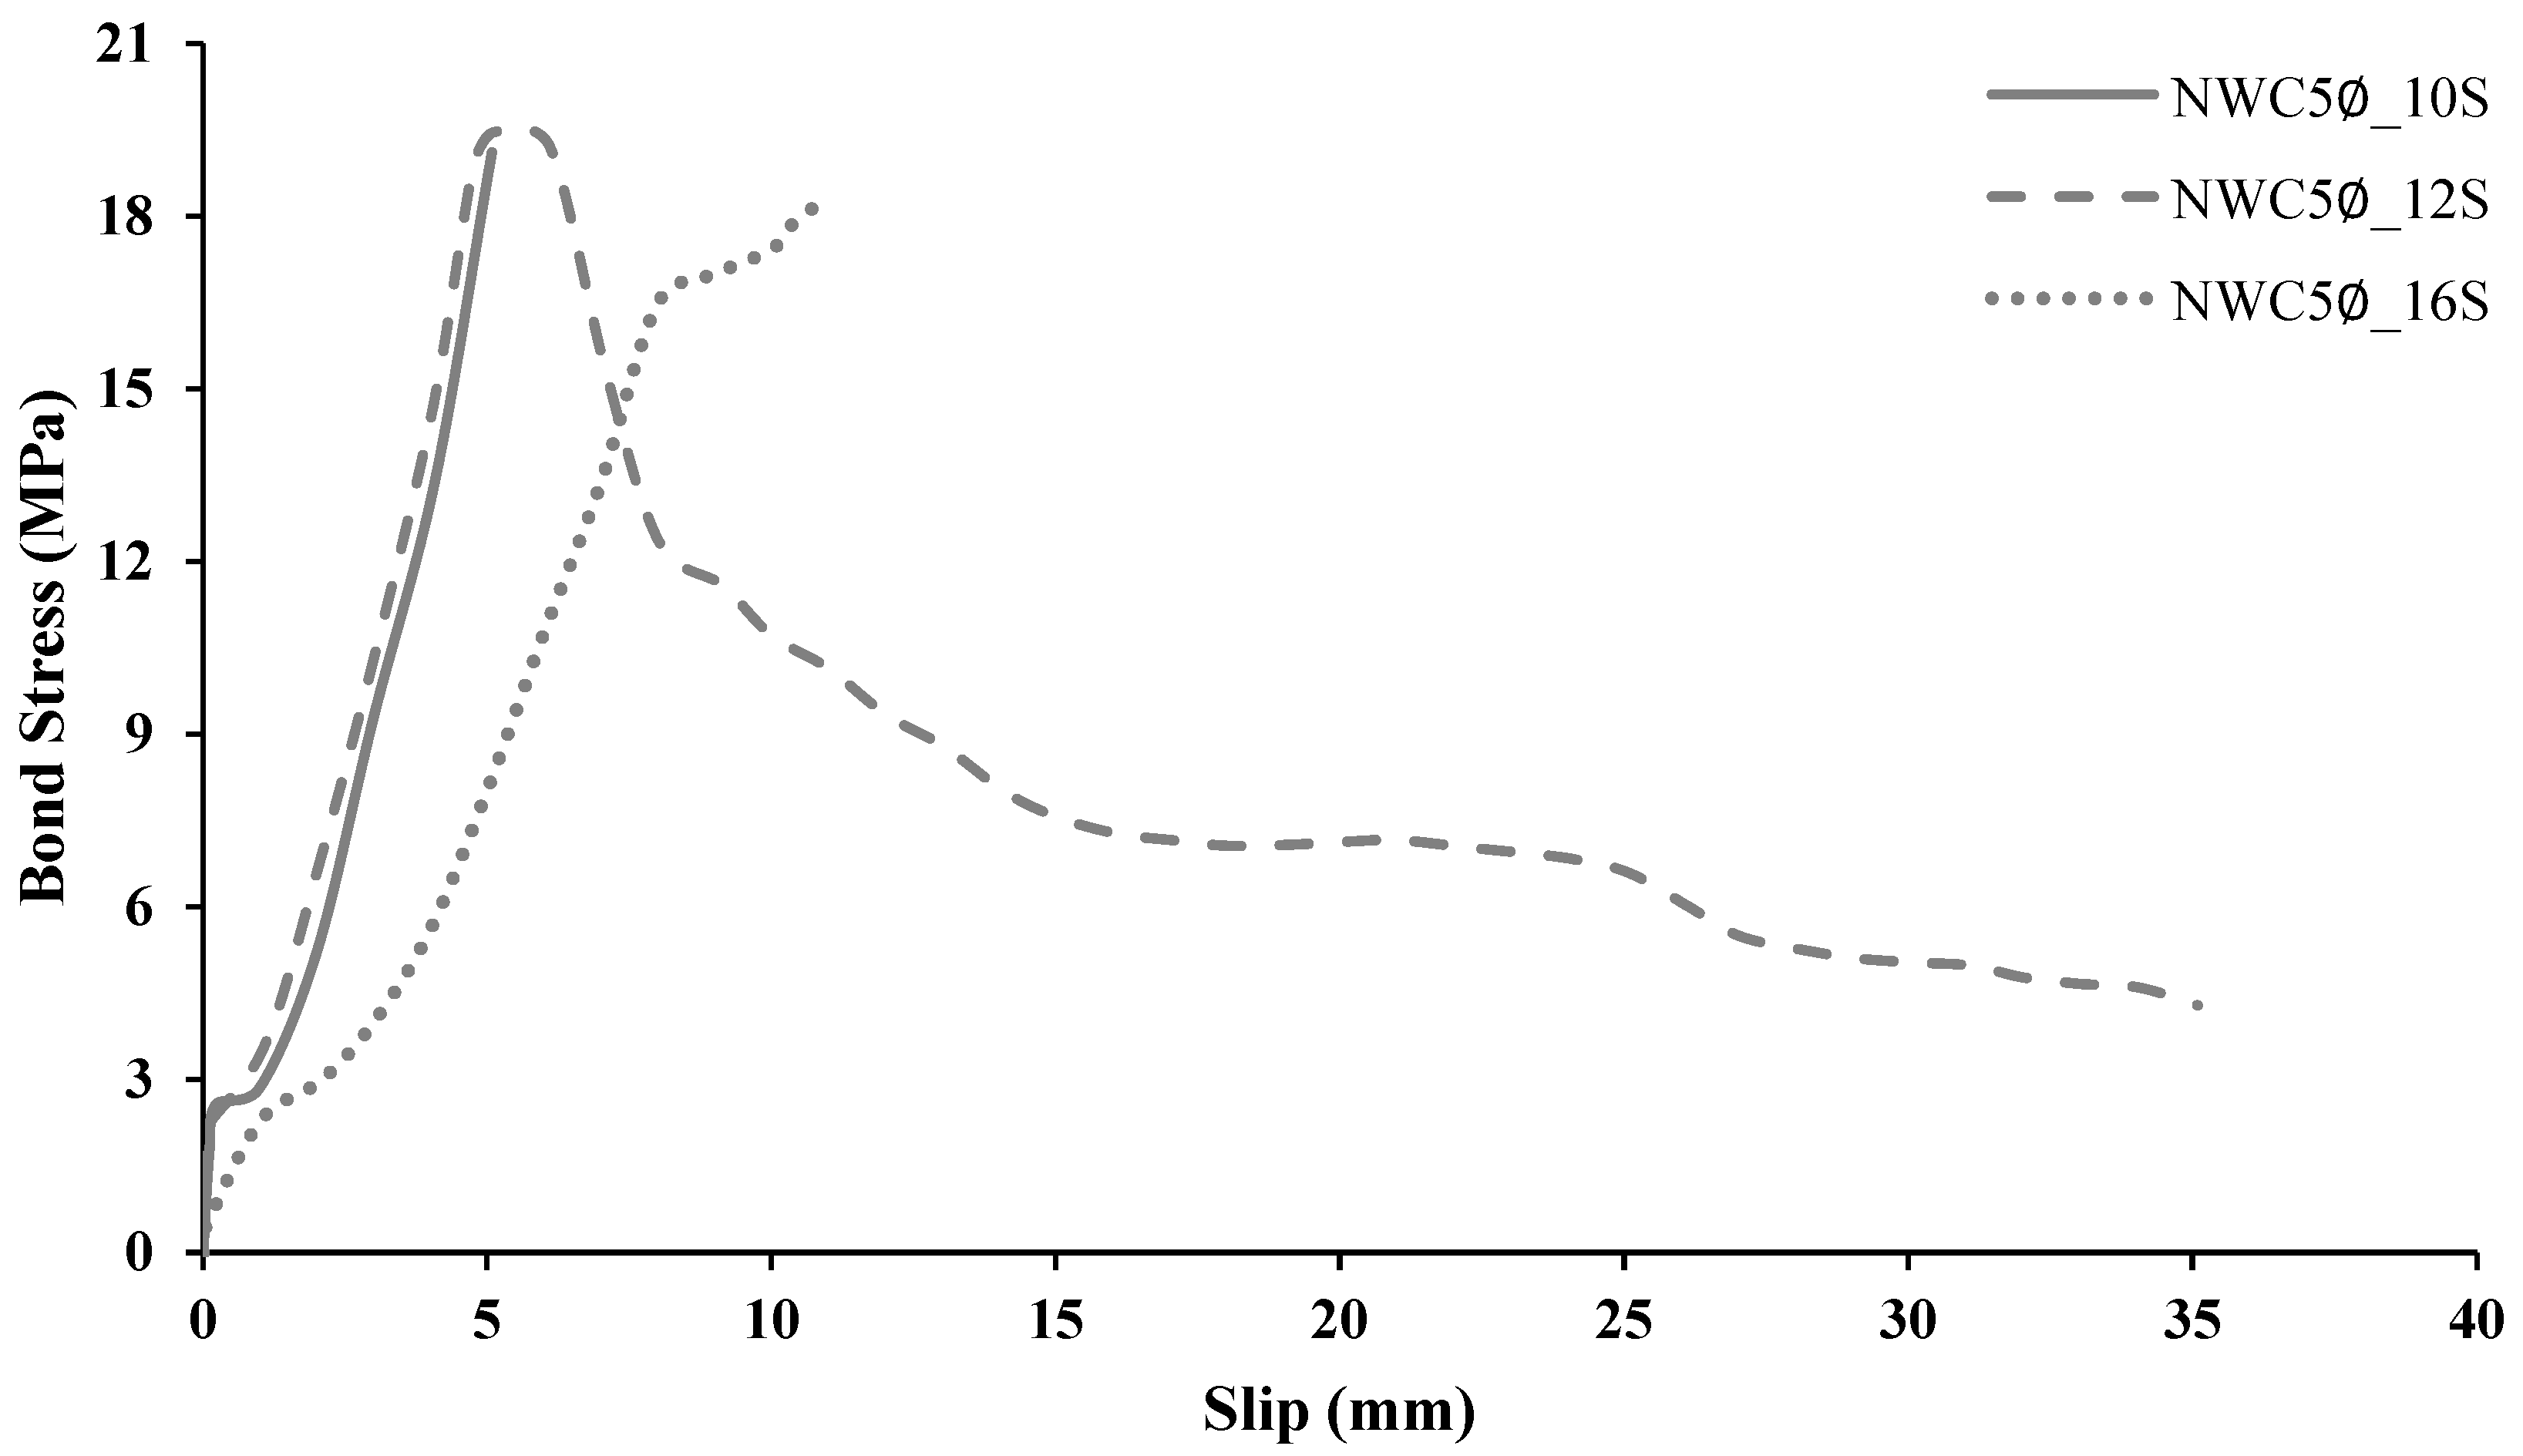
Figure 30.
Effect of variation in steel bars’ diameter for bonded length 5∅.
Figure 30.
Effect of variation in steel bars’ diameter for bonded length 5∅.
Figure 31.
Effect of shear stresses generated between bar ribs and concrete at the bond interface.
Figure 31.
Effect of shear stresses generated between bar ribs and concrete at the bond interface.
Figure 32.
Peel off and eroding of the layer covering the GFRP bar during the pull-out test.
Figure 32.
Peel off and eroding of the layer covering the GFRP bar during the pull-out test.
Figure 33.
Comparison between the experimental and predicted ultimate bond strength for bonded lengths 3∅ and 4∅ [
50,
52].
Figure 33.
Comparison between the experimental and predicted ultimate bond strength for bonded lengths 3∅ and 4∅ [
50,
52].
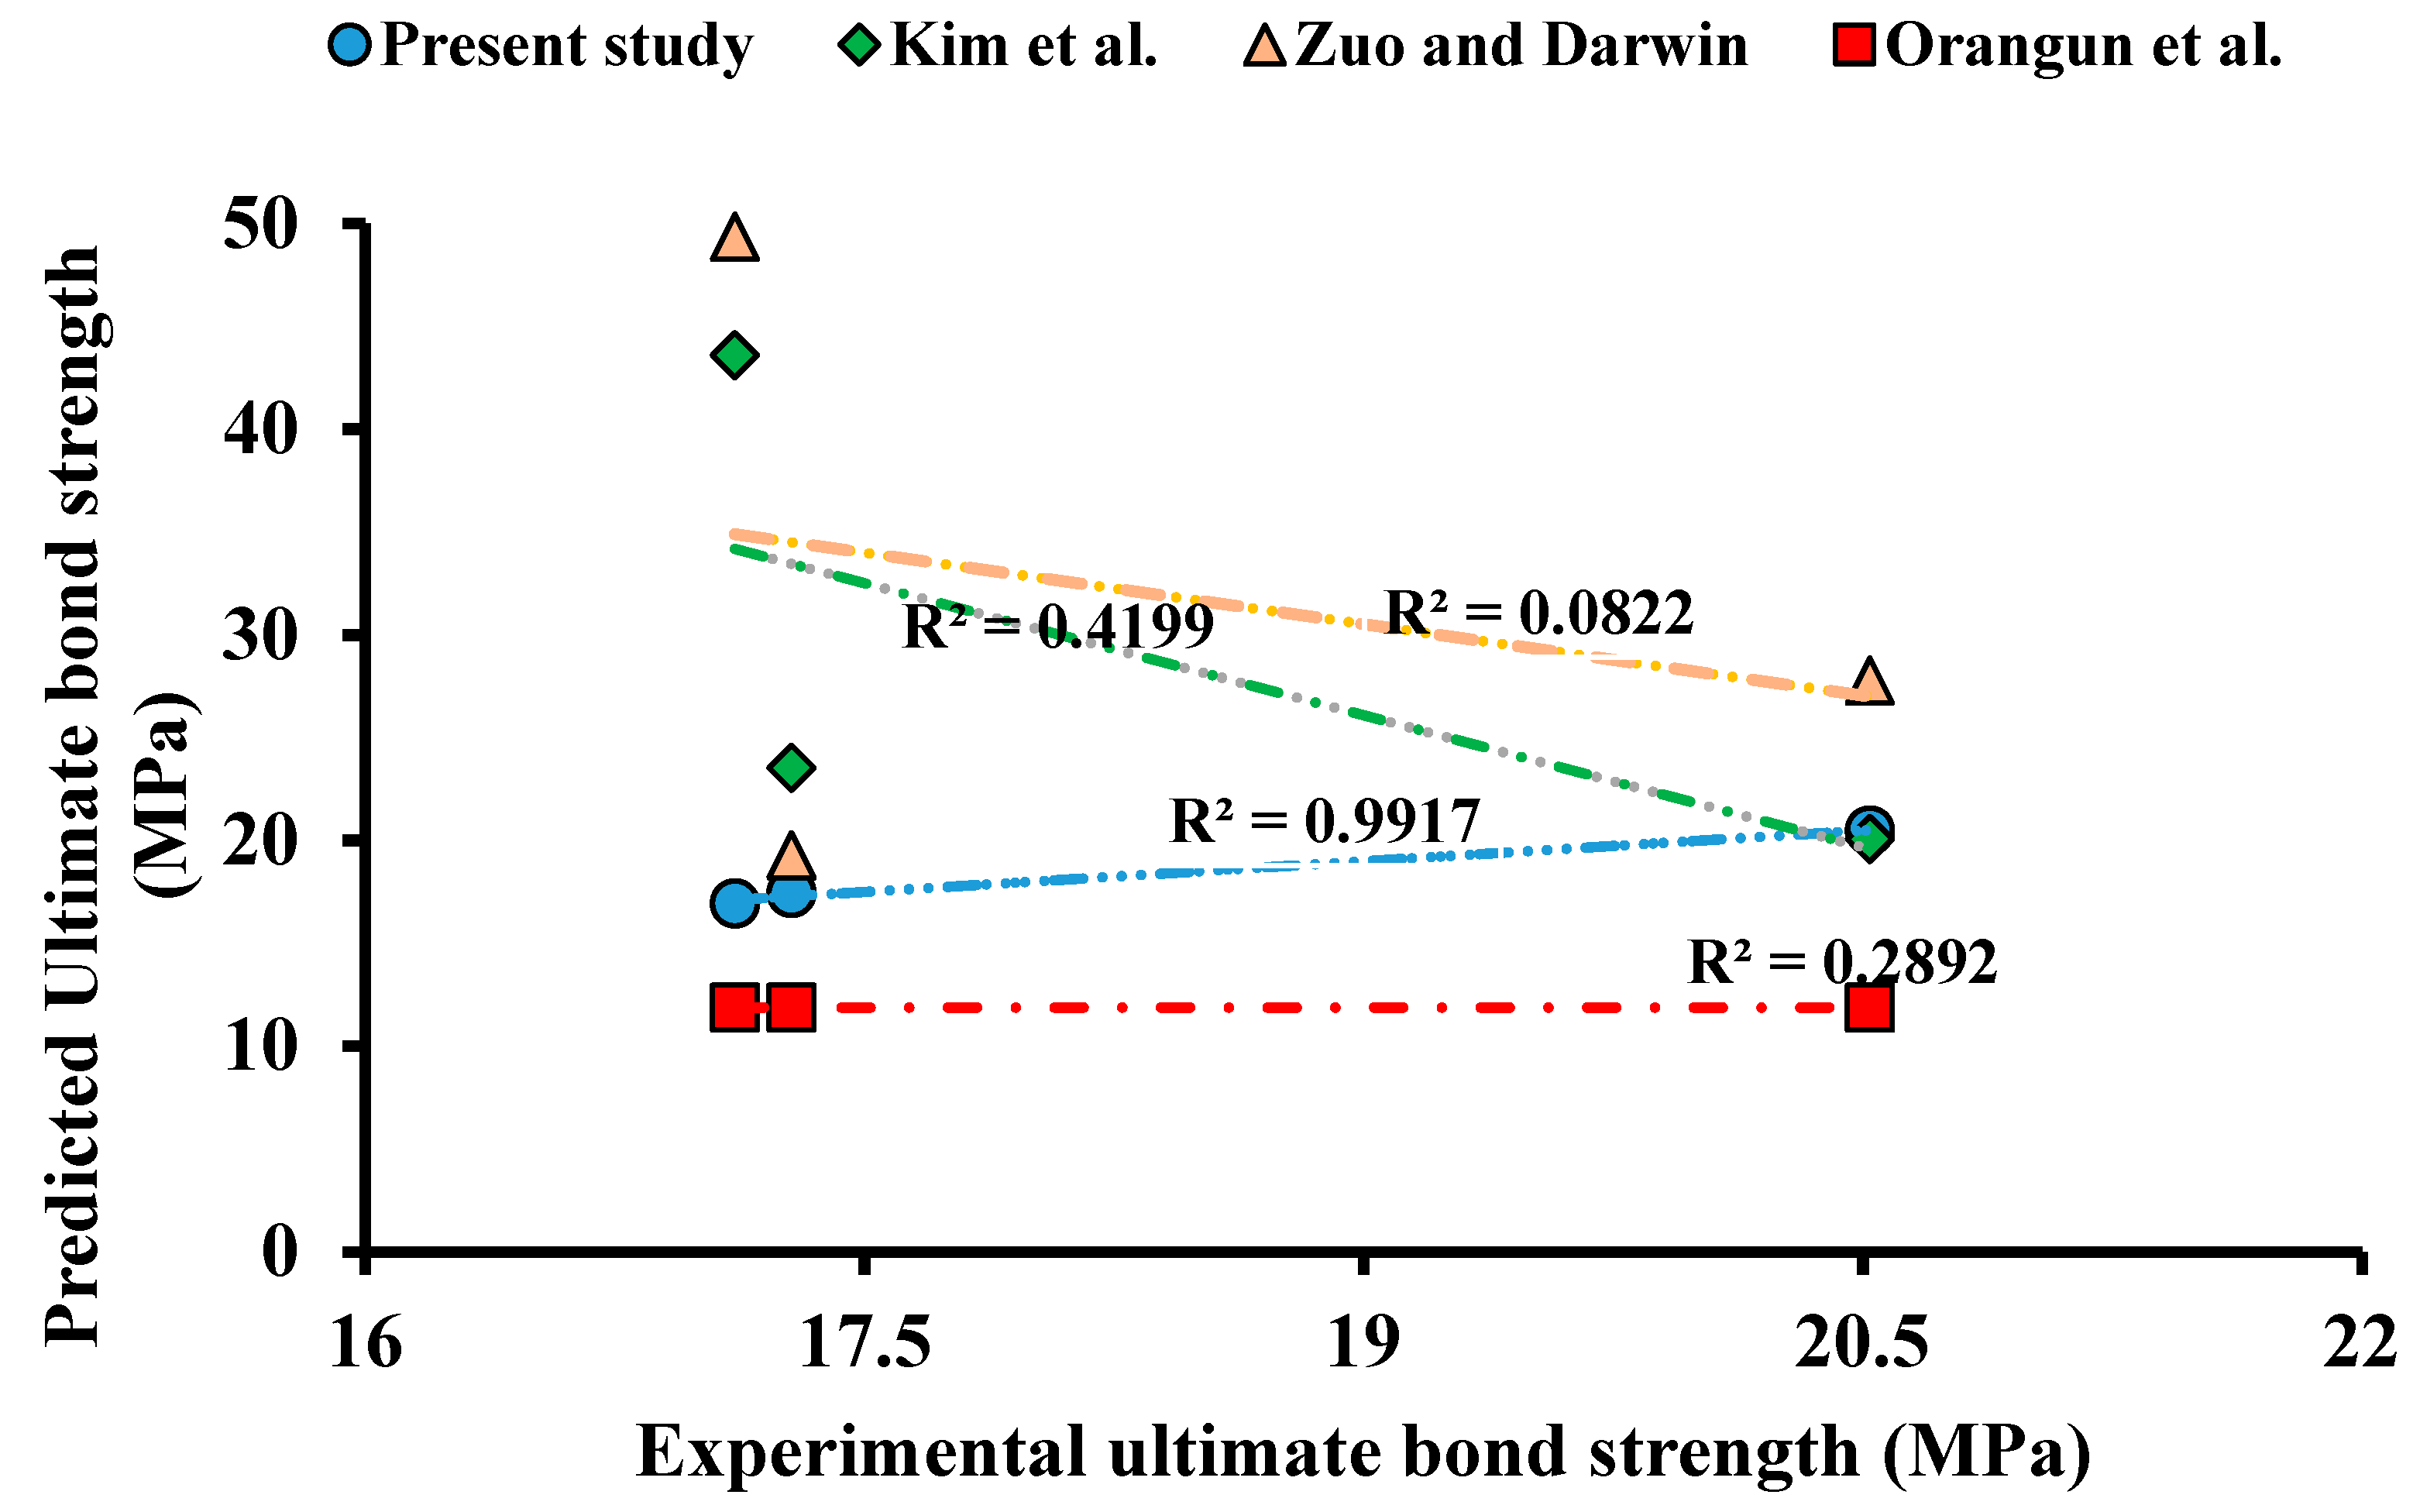
Figure 34.
Comparison between the experimental and predicted ultimate bond strength for bonded length 5∅ [
50,
52].
Figure 34.
Comparison between the experimental and predicted ultimate bond strength for bonded length 5∅ [
50,
52].
Figure 35.
Comparison between the experimental and predicted ultimate bond strength for the 10 mm diameter GFRP bars [
54].
Figure 35.
Comparison between the experimental and predicted ultimate bond strength for the 10 mm diameter GFRP bars [
54].
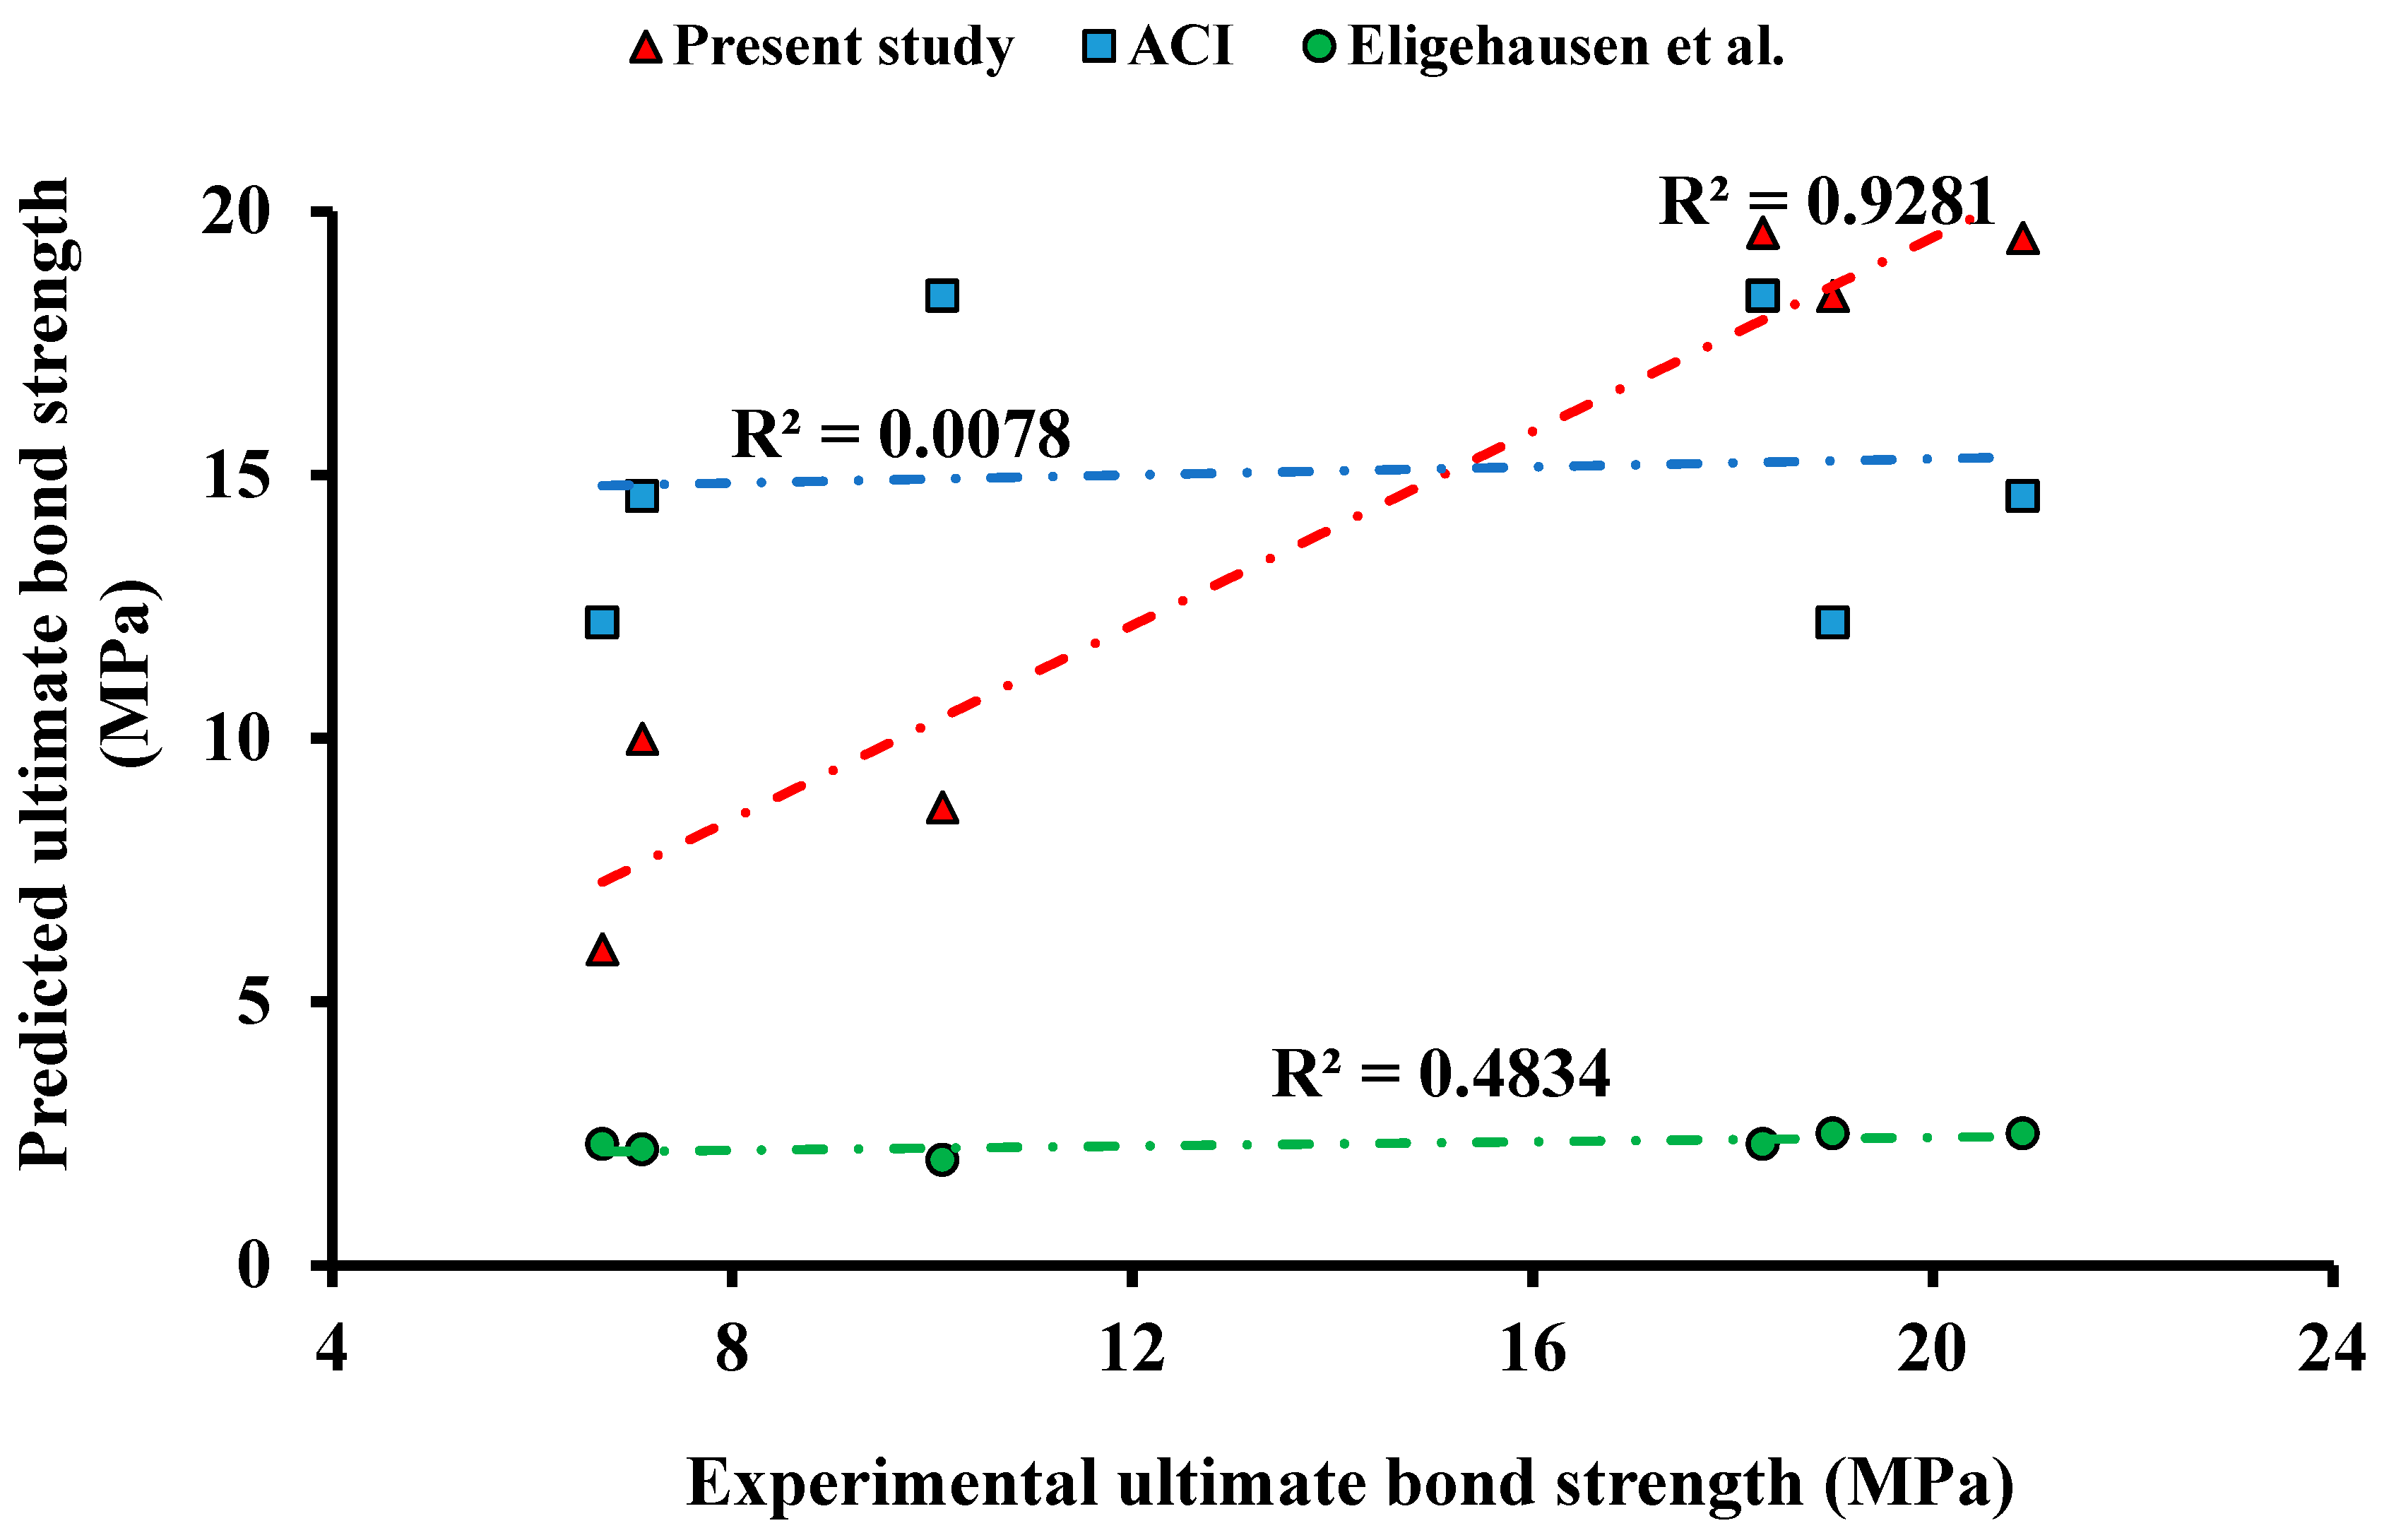
Figure 36.
Comparison between the experimental and predicted ultimate bond strength for the 12 mm and 16 mm diameter GFRP bars [
54].
Figure 36.
Comparison between the experimental and predicted ultimate bond strength for the 12 mm and 16 mm diameter GFRP bars [
54].
Table 1.
Chemical analysis of silica fume and ordinary Portland cement.
Table 1.
Chemical analysis of silica fume and ordinary Portland cement.
| Chemical Composition | Silica Fume | Ordinary Portland Cement |
|---|
| Results % | Results % |
|---|
| Al2O3 | 1.80 | 4.51 |
| Fe2O3 | 0.42 | 3.68 |
| CaO | 2.30 | 61.19 |
| MgO | 1.60 | 2.31 |
| SiO2 | 90.56 | 21.44 |
| Na2O | 0.70 | 0.1 |
| K2O | 0.73 | 0.48 |
| SO3 | 0.56 | 2.7 |
| Loss on ignition | 2.40 | 2.39 |
Table 2.
Material properties of silica fume.
Table 2.
Material properties of silica fume.
| Material | Color | Form | Specific Gravity | Bulk Density (kg/m3) | Average Particle Size (μm) | Compressive Strength 7 Days (MPa) | pH Value |
|---|
| Silica fume | White | Powder | 2.6 ± 0.1 | 550–650 | 0.1 | 86.0 | 2 |
Table 3.
Material properties of silica sand.
Table 3.
Material properties of silica sand.
| Material | Specific Gravity | Bulk Density (kg/m3) | Particle Size (mm) | Water Absorption (%) | Si2O (%) | Porosity (%) |
|---|
| Silica sand | 2.6 | 1588 | 0.75–1.50 | 1.6 | 97 | 0.4 |
Table 4.
Material properties of synthetic foam.
Table 4.
Material properties of synthetic foam.
| Material | Color | Form | Freezing Point (°C) | Foam Expansion | Surface Tension | pH Value |
|---|
| Synthetic foam | Light yellow | Liquid | −5 to −30 | 4 ± 1% to 20% | 17.1 ± 10 % | 6.0–9.5 |
Table 5.
Material properties of super plasticizer.
Table 5.
Material properties of super plasticizer.
| Material | Color | Form | Component | Specific Gravity | Chloride Content | pH Value |
|---|
| Super plasticizer | Opaque | Liquid | Single | 1.06 ± 0.01 | Nil to BSEN 934-2 | 5.0–7.0 |
Table 6.
Material properties of OPC.
Table 6.
Material properties of OPC.
| Material | Color | Fineness (m2/kg) | Specific Gravity | Setting Time (Minutes) | Compressive Strength (MPa) | Water Absorption (%) | Si2O (%) | Impact Value (%) | Crushing Value (%) |
|---|
| Initial | Final | 3 Days | 7 Days |
|---|
| OPC | Grey | 405 | 3.06 | 135 | 205 | 24.4 | 32.3 | 0.4 | 15.2 | 15.2 | 22.7 |
Table 7.
Material properties of gravel.
Table 7.
Material properties of gravel.
| Material | Specific Gravity | Bulk Density (kg/m3) | Maximum Particle Size (mm) |
|---|
| Gravel | 2.7 | 1734 | 12.5 |
Table 8.
Material properties of fibers.
Table 8.
Material properties of fibers.
| Material | Bulk Density (kg/m3) | Average Fiber Length (mm) | Average Fiber Diameter (mm) | Aspect Ratio L/D | Tensile Strength (MPa) | Ultimate Elongation (%) |
|---|
| Hs fiber | 7800 | 30 | 0.750 | 40.0 | >1100 | <2 |
| Pp fiber | 910 | 12 | 0.018 | 666.7 | 300–440 | - |
Table 9.
Properties of steel bars.
Table 9.
Properties of steel bars.
| Diameters ∅ (mm) | Surface Texture | Ultimate Stress fu (MPa) | Yield Stress fy (MPa) |
|---|
| 10 | Ribbed | 684 | 420 |
| 12 | Ribbed | 709 | 446 |
| 16 | Ribbed | 790 | 514 |
Table 10.
Properties of GFRP bars.
Table 10.
Properties of GFRP bars.
| Diameters, ∅ (mm) | Surface Texture | Tensile Strength (MPa) |
|---|
| 10 | Sand coated | 827 |
| 12 | Sand coated | 758 |
| 16 | Sand coated | 724 |
Table 11.
Mix proportion of NWC.
Table 11.
Mix proportion of NWC.
| Cement (kg/m3) | Sand (kg/m3) | Gravel (kg/m3) | Slump (mm) | w/c Ratio | Density kg/m3 |
|---|
| 450 | 750 | 860 | 110 | 0.43 | 2320 |
Table 12.
Mixing proportions of LWFC.
Table 12.
Mixing proportions of LWFC.
| Mix Code | LWFC | LWFC Hs | LWFC Pp | LWFC Hs + Pp |
|---|
| Fibers (kg/m3) | 0 | 31.20 | 1.83 | 31.20 + 1.83 |
| Cement (kg/m3) | 1350 | 1350 | 1350 | 1350 |
| Sand (kg/m3) | 900 | 900 | 900 | 900 |
| Silica fume (%) | 10 | 10 | 10 | 10 |
| Superplasticizer (SP) (%) | 1.12 | 1.12 | 1.12 | 1.12 |
| Water binder ratio | 0.28 | 0.28 | 0.28 | 0.28 |
| fc at 7 days (MPa) | 28.51 | 33.40 | 30.73 | 34.60 |
| fc at 28 days (MPa) | 34.00 | 38.06 | 37.12 | 40.80 |
| Foam (L/m3) | 215 | 225 | 218.75 | 221.25 |
Table 13.
Results of mechanical properties of concrete.
Table 13.
Results of mechanical properties of concrete.
| Mechanical Properties | (MPa) | (MPa) | (MPa) | Ec (GPa) | Slump (mm) | Flow (mm) | ρd (kg/m3) |
|---|
| NWC | 41.52 | 3.48 | 5.67 | 25.33 | 110 | - | 2325 |
| LWFC | 34.00 | 2.41 | 2.53 | 11.53 | - | 120 | 1820 |
| LWFC Hs + Pp (FC) | 40.80 | 4.59 | 5.83 | 24.60 | - | 100 | 1840 |
Table 14.
Results of pull-out tests.
Table 14.
Results of pull-out tests.
| Specimen Code | Dimension (mm) | Su (mm) | τu (MPa) | | c (mm) | Mode of Failure |
|---|
| FC3∅_10S | 100 × 100 × 100 | 4.3 | 24.66 | 3 | 45 | Pull-out |
| FC3∅_12S | 120 × 120 × 120 | 4.6 | 22.24 | 3 | 54 | Pull-out |
| FC3∅_16S | 160 × 160 × 160 | 5.3 | 18.91 | 3 | 72 | Pull-out |
| FC4∅_10S | 100 × 100 × 100 | 3.8 | 27.59 | 4 | 45 | Pull-out |
| FC4∅_12S | 120 × 120 × 120 | 8.0 | 24.39 | 4 | 54 | Pull-out |
| FC4∅_16S | 160 × 160 × 160 | 8.1 | 21.00 | 4 | 72 | Pull-out |
| FC5∅_10S | 100 × 100 × 100 | 5.1 | 17.28 | 5 | 45 | Pull-out |
| FC5∅_12S | 120 × 120 × 120 | 7.8 | 20.52 | 5 | 54 | Pull-out |
| FC5∅_16S | 160 × 160 × 160 | 6.0 | 17.11 | 5 | 72 | Pull-out |
| FC3∅_10G | 100 × 100 × 100 | 10.2 | 18.97 | 3 | 45 | Pull-out |
| FC3∅_12G | 120 × 120 × 120 | 4.1 | 15.03 | 3 | 54 | Pull-out |
| FC3∅_16G | 160 × 160 × 160 | 7.3 | 7.14 | 3 | 72 | Pull-out |
| FC4∅_10G | 100 × 100 × 100 | 9.7 | 20.86 | 4 | 45 | Pull-out |
| FC4∅_12G | 120 × 120 × 120 | 2.5 | 15.62 | 4 | 54 | Pull-out |
| FC4∅_16G | 160 × 160 × 160 | 5.6 | 10.13 | 4 | 72 | Pull-out |
| FC5∅_10G | 100 × 100 × 100 | 4.1 | 12.00 | 5 | 45 | Pull-out |
| FC5∅_12G | 120 × 120 × 120 | 8.2 | 18.33 | 5 | 54 | Pull-out |
| FC5∅_16G | 160 × 160 × 160 | 8.0 | 6.73 | 5 | 72 | Pull-out |
| NWC3∅_10S | 100 × 100 × 100 | 6.8 | 24.83 | 3 | - | Pull-out |
| NWC3∅_12S | 120 × 120 × 120 | 5.0 | 19.35 | 3 | - | Pull-out |
| NWC3∅_16S | 160 × 160 × 160 | 3.1 | 19.17 | 3 | - | Pull-out |
| NWC4∅_10S | 100 × 100 × 100 | 5.0 | 28.65 | 4 | - | Splitting |
| NWC4∅_12S | 120 × 120 × 120 | 9.5 | 20.57 | 4 | - | Pull-out |
| NWC4∅_16S | 160 × 160 × 160 | 6.9 | 20.50 | 4 | - | Splitting |
| NWC5∅_10S | 100 × 100 × 100 | 5.1 | 19.11 | 5 | - | Splitting |
| NWC5∅_12S | 120 × 120 × 120 | 5.1 | 19.45 | 5 | - | Pull-out |
| NWC5∅_16S | 160 × 160 × 160 | 11.0 | 18.32 | 5 | - | Splitting |
Table 15.
Comparison of pull-out test results for the two types of reinforcing bars.
Table 15.
Comparison of pull-out test results for the two types of reinforcing bars.
| Specimen Code | (MPa) | Specimen Code | (MPa) | (%) |
|---|
| FC3∅_10S | 24.66 | FC3∅_10G | 18.97 | 76.9% |
| FC3∅_12S | 22.24 | FC3∅_12G | 15.03 | 67.6% |
| FC3∅_16S | 18.91 | FC3∅_16G | 7.14 | 37.8% |
| FC4∅_10S | 27.59 | FC4∅_10G | 20.86 | 75.6% |
| FC4∅_12S | 24.39 | FC4∅_12G | 15.62 | 64.0% |
| FC4∅_16S | 21.00 | FC4∅_16G | 10.13 | 48.2% |
| FC5∅_10S | 17.28 | FC5∅_10G | 12.00 | 69.4% |
| FC5∅_12S | 20.52 | FC5∅_12G | 18.33 | 89.3% |
| FC5∅_16S | 17.11 | FC5∅_16G | 6.73 | 39.3% |
Table 16.
Comparison of average pull-out test results for the two types of concrete (NWC and FC).
Table 16.
Comparison of average pull-out test results for the two types of concrete (NWC and FC).
| Specimen Code | (MPa) | Specimen Code | (MPa) | (%) |
|---|
| FC3∅_10S | 24.66 | NWC3∅_10S | 24.83 | 99.3% |
| FC4∅_10S | 22.24 | NWC3∅_12S | 19.35 | 114.9% |
| FC5∅_10S | 18.91 | NWC3∅_16S | 19.17 | 98.6% |
| FC3∅_12S | 27.59 | NWC4∅_10S | 28.65 | 96.3% |
| FC4∅_12S | 24.39 | NWC4∅_12S | 20.57 | 118.6% |
| FC5∅_12S | 21.00 | NWC4∅_16S | 20.5 | 102.4% |
| FC3∅_16S | 17.28 | NWC5∅_10S | 19.11 | 90.4% |
| FC4∅_16S | 20.52 | NWC5∅_12S | 19.45 | 105.5% |
| FC5∅_16S | 17.11 | NWC5∅_16S | 18.32 | 93.4% |
Table 17.
A comparison between the experimental and the predicted results of average ultimate bond strength (MPa) for FC + steel bar.
Table 17.
A comparison between the experimental and the predicted results of average ultimate bond strength (MPa) for FC + steel bar.
| Specimen Code | (MPa) |
|---|
| [Present Study] | [Present Study] | τu [30] | τu [31] | τu [32] |
|---|
| FC3∅_10S | 24.7 | 24.5 | 31.9 | 16.6 | 15.1 |
| FC4∅_10S | 27.6 | 27.0 | 27.2 | 18.4 | 13.1 |
| FC5∅_10S | 20.5 | 20.5 | 23.5 | 19.3 | 11.9 |
| FC3∅_12S | 22.2 | 22.3 | 28.0 | 24.0 | 15.1 |
| FC4∅_12S | 24.4 | 25.0 | 23.5 | 26.6 | 13.1 |
| FC5∅_12S | 17.3 | 17.5 | 20.1 | 27.8 | 11.9 |
| FC3∅_16S | 19.0 | 18.4 | 22.3 | 42.6 | 15.1 |
| FC4∅_16S | 21.0 | 21.5 | 18.1 | 47.2 | 13.1 |
| FC5∅_16S | 17.1 | 17.0 | 43.6 | 49.4 | 11.9 |
Table 18.
Comparison between the experimental and the predicted results of average ultimate bond strength (MPa) for FC + GFRP.
Table 18.
Comparison between the experimental and the predicted results of average ultimate bond strength (MPa) for FC + GFRP.
| Specimen Code | (MPa) |
|---|
| (Present Study) | (Present Study) | τu (ACI [53]) | τu (Eligehausen et al. [54]) |
|---|
| FC3∅_10G | 19.0 | 18.4 | 18.4 | 1.4 |
| FC4∅_10G | 20.9 | 19.5 | 14.6 | 1.8 |
| FC5∅_10G | 18.3 | 19.6 | 12.2 | 1.8 |
| FC3∅_12G | 15.0 | 18.0 | 18.4 | 2.3 |
| FC4∅_12G | 15.62 | 9.5 | 14.6 | 2.5 |
| FC5∅_12G | 12 | 8.4 | 12.2 | 2.5 |
| FC3∅_16G | 7.14 | 10.0 | 18.4 | 2 |
| FC4∅_16G | 10.3 | 8.7 | 14.6 | 2.2 |
| FC5∅_16G | 6.7 | 6.0 | 12.2 | 2.3 |


 and
and 


