
User-Centric Innovation District Planning: Lessons from Brisbane’s Leading Innovation Districts


Abstract
1. Introduction
2. Literature Background
3. Research Design
3.1. Case Study
3.2. Data Collection
3.3. Data Analysis
4. Results
4.1. Qualitative Analysis
4.1.1. Form
4.1.2. Function
4.1.3. Ambiance
4.1.4. Image
4.2. Quantitative Analysis
5. Discussion
- Centrality is not a priority for all types of workers; for example, ICT workers in BTP were satisfied with their quiet and less expensive location. However, all workers expect innovation districts to be highly connected to CBDs and other urban centres. Even though DKP is located close to the CBD, most workers were unsatisfied with the isolated location. Decision makers need to consider connectivity rather than solely closeness to CBDs.
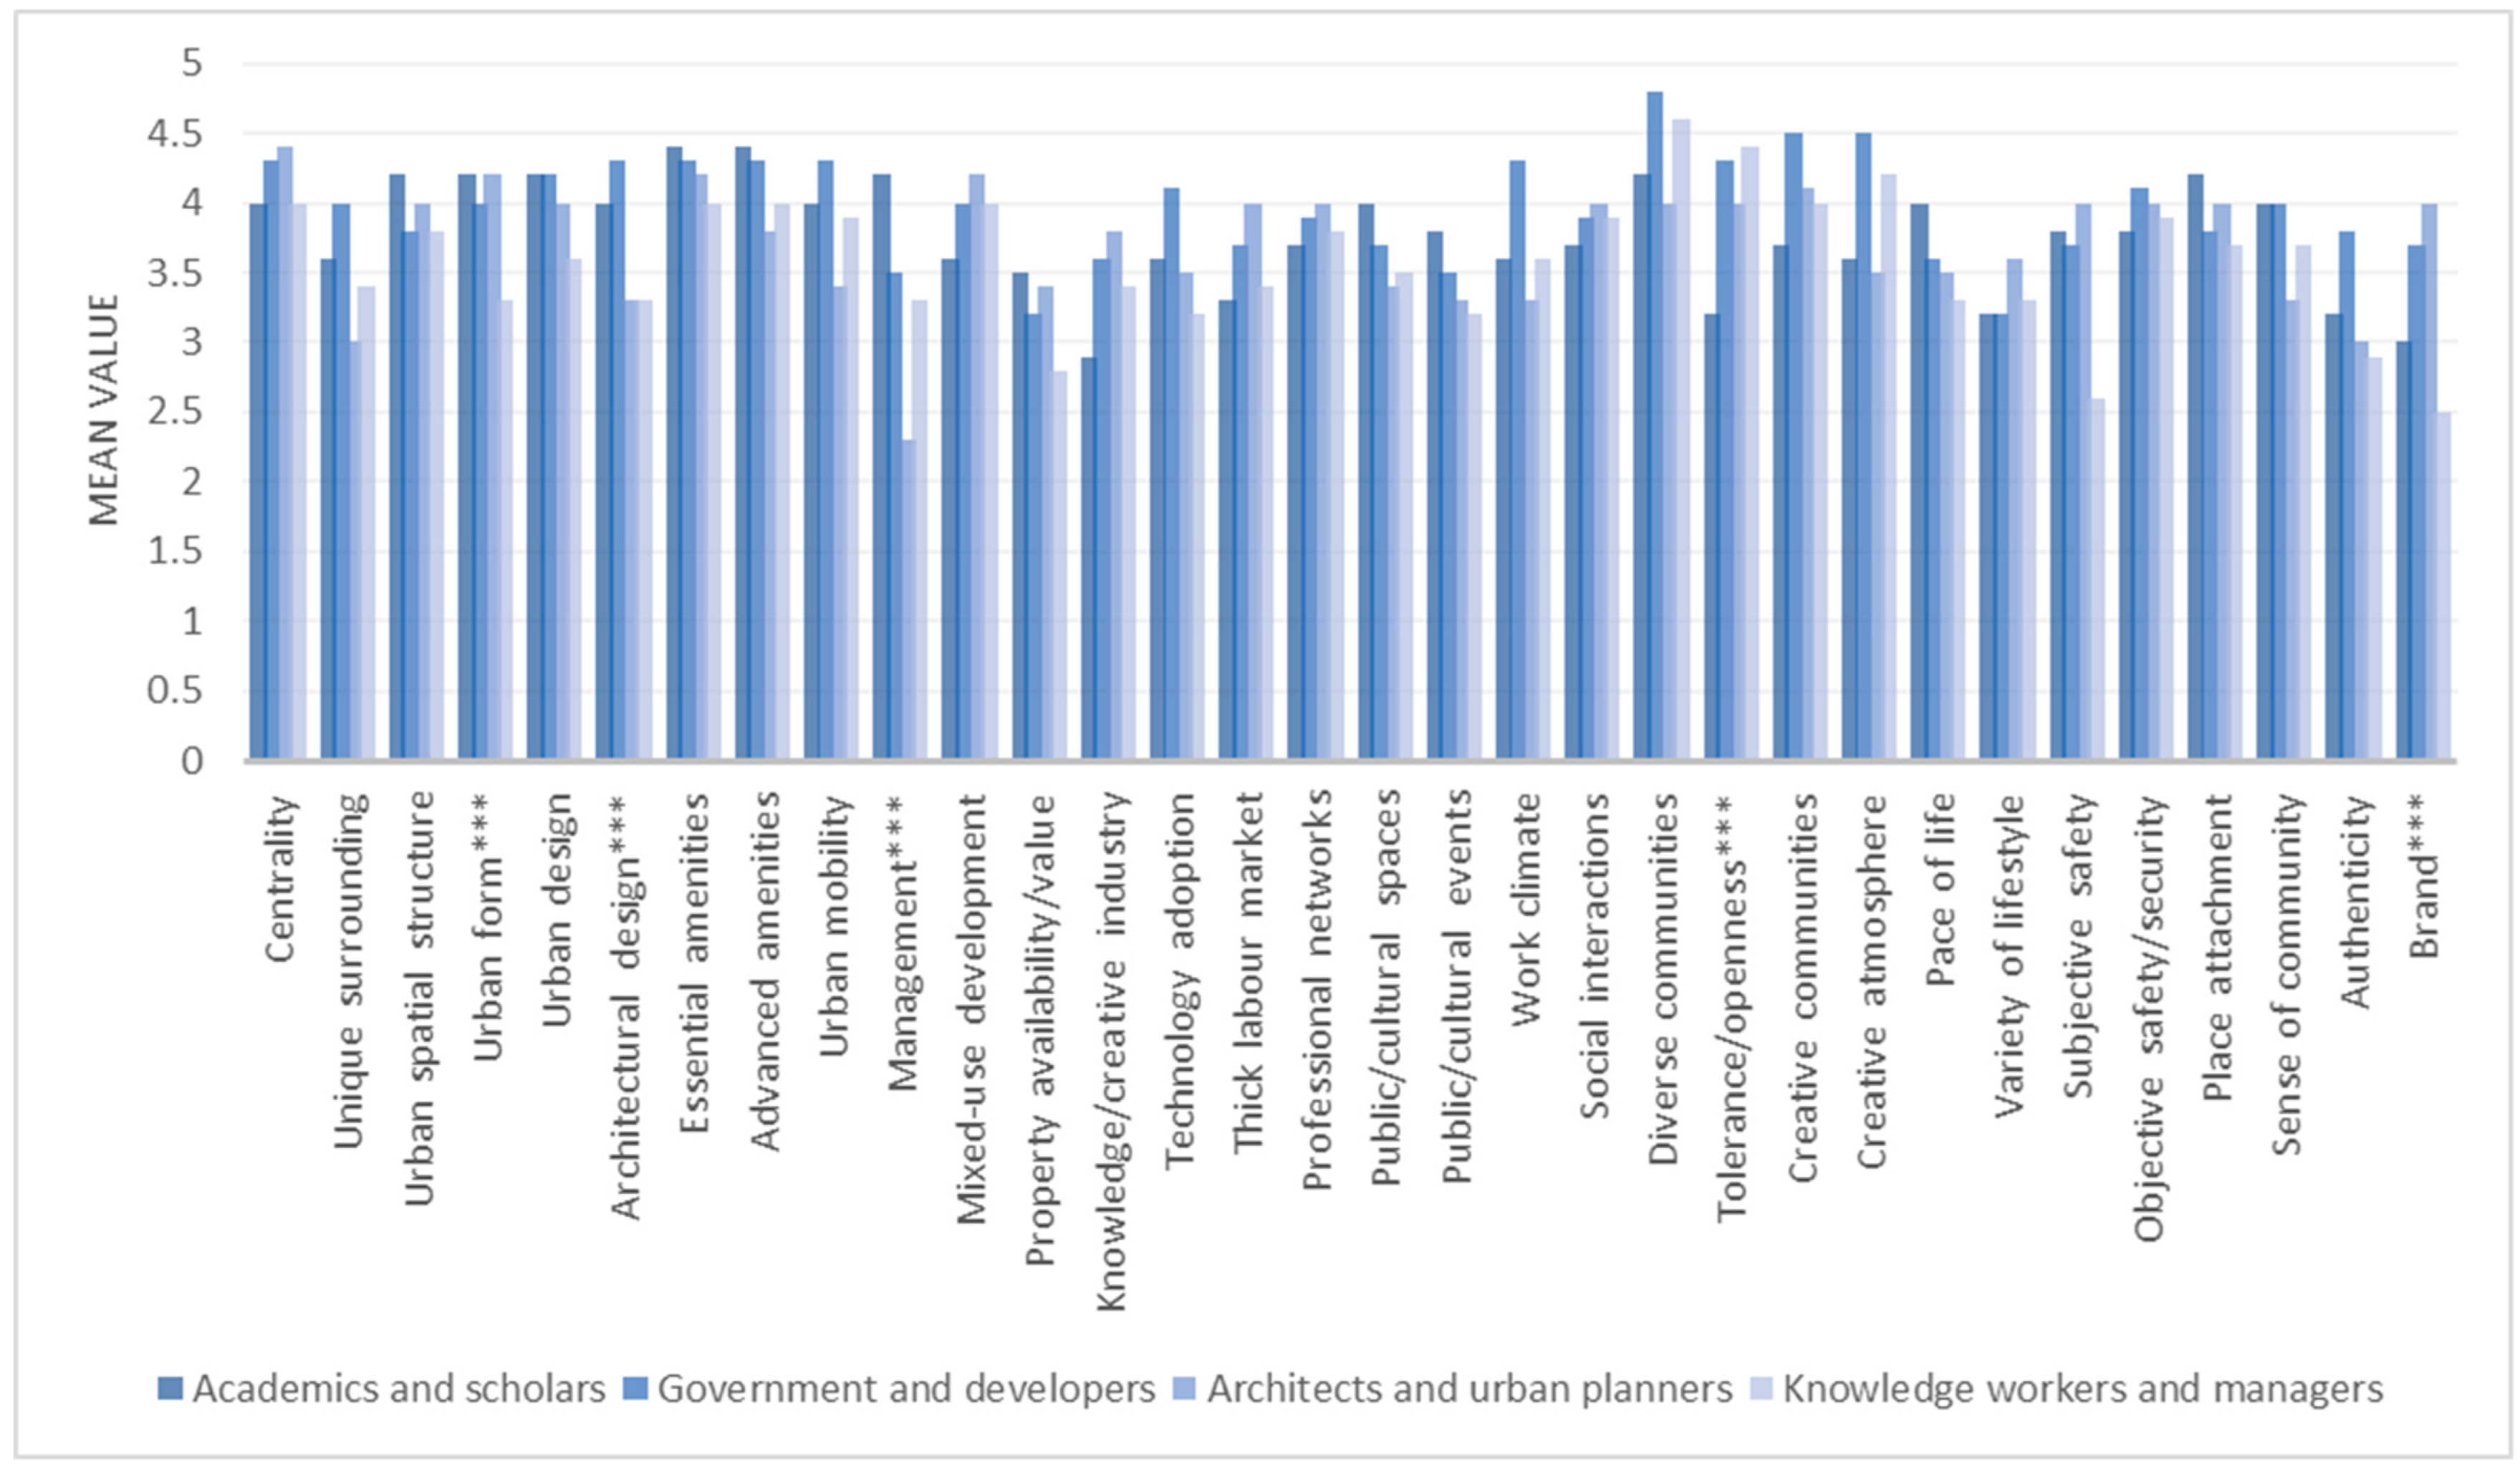
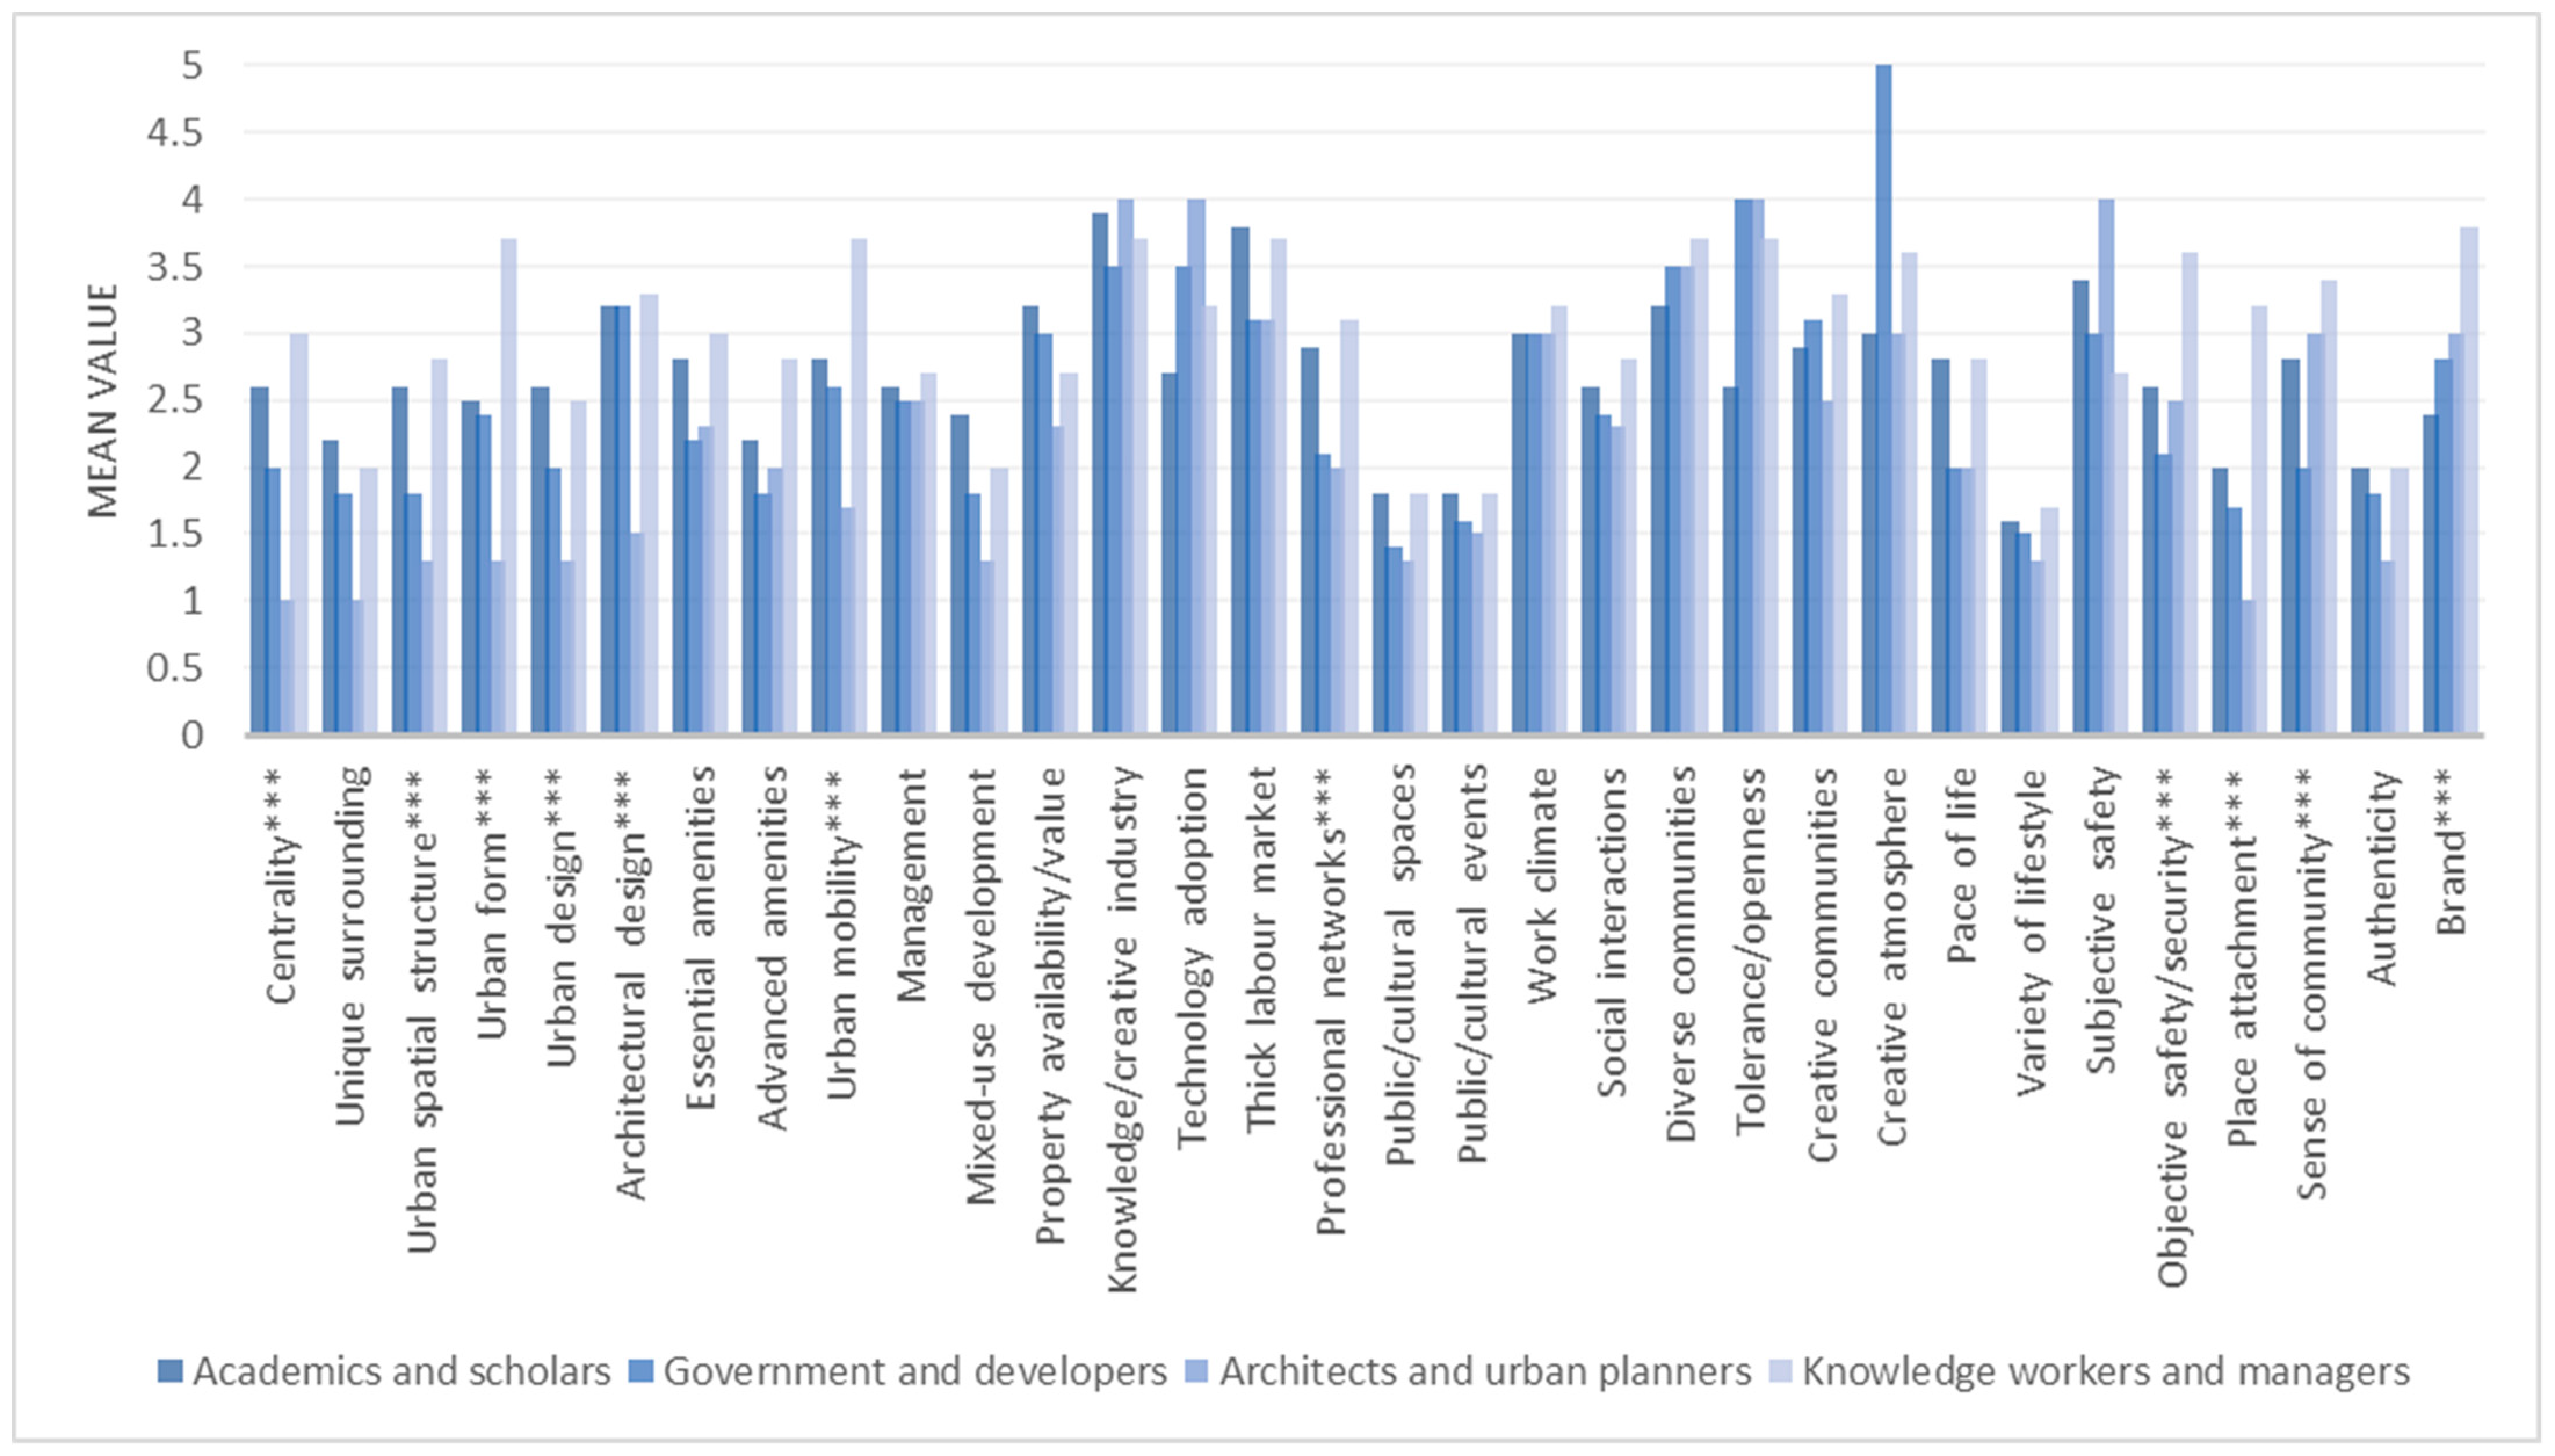
- While decision makers confidently gave high scores to KGUV’s urban form and extremely low scores to BTP, the choice of workers were different—3.3 and 3.7 for KGUV and BTP, respectively. KGUV lacks parking, workplaces, and a diversity of housing options and instead is occupied by quite tall student accommodation buildings, faculty buildings, and huge research institutes; in other words, KGUV still has a campus form rather than being an innovation district. On the other hand, BTP is more professional. This study suggests that decision makers need to revise their perception that a campus form or an urban village concept can fulfil the requirements of an innovation district. Innovation districts are ‘professional configurations’ for work, study, and living that require a distinguished form from other functions such as universities or research hubs. They also need to be combined with a balanced number of other functions and facilities.
- Unlike decision makers, users expect a hierarchy of places, including planned and designed parts as well as flexible ones. Decision makers should designate a space for the public and workers to shape their place identity and build a sense of attachment [69]. In addition, a flexible design will blur the boundary of innovation districts within their neighbourhoods.
- Decision makers believe that innovation districts are leaders of future urban developments in cities. Therefore, they prefer iconic urban/architectural design for shaping innovation districts, e.g., DKP. This strategy undesirably separates these districts from the city fabric. This research recommends that a balance between iconic and usual design would be suitable for integrating innovation districts into neighbourhoods and attracting the public.
- Decision makers need to plan for an environmentally friendly form of place that respects the concern of users about the natural environment and their health. Otherwise, they will lose the public trust in the efficiency of innovation districts for their cities. In recent years, countries such as China and Japan have employed the concept of healthy urban areas in their innovation districts; their priorities are: (a) constructing healthy environments; (b) building a healthy society; (c) optimising health services; (d) fostering healthy people; and (e) developing healthy culture [70].
- Despite the attempts of decision makers to accomplish open-door policies and benefiting society [38], there is no balance of amenities for all levels of society. At least some activities and services need to meet the expectations of the locals [59]. These facilities must also be accessible and affordable for most people.
- Urban mobility relates more to ease of access than to public transport. Both DKP and BTP workers evaluated the urban mobility the same—3.7. BTP is highly accessible by car and lacks public transport; oppositely, urban mobility in DKP is restricted to public transport. Decision makers need to accelerate ease of access to innovation districts through all forms of the urban mobility system. In this regard, smart mobility plans can be employed to encourage users to choose different modes of transport; this is widely known as ‘mobility-as-a-service’ (MaaS) [71,72,73].
- Users do not trust the efficiency of the management system in shaping world-class innovation districts that improve their wellbeing. Decision makers, theoretically and practically, should inform and assure users that innovation districts have been professionally planned to serve them. Communicating with users, consulting with them, and directly engaging them in the decision-making process are highly recommended. St. Louis (Missouri), San Diego (California), Detroit Innovation District, and Boston Innovation District are examples of districts that have followed various community engagement plans to gather public and political support [74].
- Decision makers mainly follow a holistic approach for planning innovation districts at the city scale. However, users deal with the tangible characteristics of innovation districts on neighbourhood scales [50]. Decision makers need to replace their current method with a multi-scale plan.
- Both workers and locals prefer not to work and live in the same area. Decision makers need to plan for a new model of an urban setting that keeps the living areas private.
- Innovation districts have been partially effective in mixed-use development and bringing jobs/amenities to neighbourhoods; however, they still struggle with job–housing/amenity matching and balance, e.g., KGUV. The importance of matching and balancing uses has been frequently recommended [75] and needs to be considered by decision makers in the planning phases. In addition, studying valuable plans from other countries for achieving sustainability in the long term is suggested, e.g., Hong Kong [76], Nanjing [77], and Singapore [78].
- Innovation districts are effective in gentrification and increase the value of properties in the neighbourhood accordingly [79]. A lack of reasonably priced workplaces and housing threatens the social mix. Decision makers should anticipate price-controlling plans before establishing innovation districts.
- In both structural and marketing plans, innovation districts need to be prepared for hosting large companies as well as small-/medium-sized businesses and start-ups, e.g., BTP. A lack of diversity will disappoint users, e.g., KGUV and DKP. The Cortex Innovation Community in St. Louis, High Tech Campus Eindhoven, and 22@Barcelona are among the examples of combining various sizes of businesses [80].
- Innovation districts provide no targeted job/educational opportunities for locals who live around the area. The challenge of linking locals to knowledge-based activities is critical [11]. Decision makers should allocate some affordable services and programmes to educate locals.
- Following the ‘creative class hypothesis’ [29], decision makers increasingly value soft quality-based factors for attracting talent to innovation districts. However, the result showed that talented workers initially choose their location based on hard traditional factors such as stability, highly paid jobs, tax-exempting opportunities, and low-rent properties.
- Decision makers are responsible for introducing, branding, and advertising the social character of innovation districts. This responsibility is undoubtedly beyond moving physical barriers and offering their professional amenities. A community development system is required to not only link locals and workers, but also identify the catalyser activities and amenities.
- Decision makers need to consider that the public, like talented workers, respect diverse communities and are tolerant of openness.
- Mono-functional districts that offer a variety of appealing hard factors can still be attractive for some categories of workers, e.g., ICT workers in BTP.
- While centrality, nightlife, and the presence of housing blocks improve safety in innovation districts, design and connectivity are the most effective elements in shaping a sense of safety, since KGUV and BTP showed the same sense of safety.
- The public not only has no negative image of innovation districts, but, like workers [48], enjoys high-quality places, authenticity, and dynamic vibes. The public only expect unlimited access to these facilities.
- Decision makers should be aware that innovation districts, unexpectedly, raise the social and economic inequality in society [8,29,32,81,82]. Social coherency needs to be shaped between the community of workers and the locals. Otherwise, innovation districts will threaten social sustainability in neighbourhoods.
6. Conclusions
Author Contributions
Funding
Data Availability Statement
Acknowledgments
Conflicts of Interest
References
- Bontje, M.; Musterd, S. Creative industries, creative class and competitiveness. Geoforum 2009, 40, 843–852. [Google Scholar] [CrossRef]
- Cooke, P. Complex spaces. J. Open Innov. 2017, 3, 9–32. [Google Scholar] [CrossRef]
- Pancholi, S.; Yigitcanlar, T.; Guaralda, M. Public space design of knowledge and innovation spaces. J. Open Innov. 2015, 1, 13. [Google Scholar] [CrossRef]
- Adu-McVie, R.; Yigitcanlar, T.; Erol, I.; Xia, B. Classifying innovation districts. Land Use Policy 2021, 111, 105779. [Google Scholar] [CrossRef]
- Kunzmann, K. The strategic dimensions of knowledge industries in urban development. DISP Plan. Rev. 2009, 45, 40–47. [Google Scholar] [CrossRef]
- Carvalho, L.; Van Winden, W. Planned knowledge locations in cities. Int. J. Knowl. Based Dev. 2017, 8, 47–67. [Google Scholar] [CrossRef]
- Yigitcanlar, T.; Dodson, J.; Gleeson, B.; Sipe, N. Travel self-containment in master planned estates: Analysis of recent Australian trends. Urban Policy Res. 2007, 25, 129–149. [Google Scholar] [CrossRef]
- Kayanan, C. A critique of innovation districts: Entrepreneurial living and the burden of shouldering urban development. Environ. Plan. A Econ. Space 2022, 54, 50–66. [Google Scholar] [CrossRef]
- Yigitcanlar, T.; Fabian, L.; Coiacetto, E. Challenges to urban transport sustainability and smart transport in a tourist city: The Gold Coast, Australia. Open Transp. J. 2008, 2, 29–46. [Google Scholar] [CrossRef]
- Van Winden, W.; De Carvalho, L.; Van Tuijl, E.; Van Haaren, J.; Van den Bergs, L. Creating Knowledge Locations in Cities; Routledge: London, UK, 2013. [Google Scholar]
- Katz, B.; Wagner, J. The Rise of Innovation Districts; Brooklyn Institution: Washington, DC, USA, 2014. [Google Scholar]
- Zheng, J. ‘Creative industry clusters’ and the ‘entrepreneurial city’ of Shanghai. Urban Stud. 2011, 48, 3561–3582. [Google Scholar] [CrossRef]
- Martin, R.; Florida, R.; Pogue, M.; Mellander, C.; Gugler, P.; Ketels, C. Creativity, clusters and the competitive advantage of cities. Compet. Rev. 2015, 25, 482–496. [Google Scholar] [CrossRef]
- Yigitcanlar, T.; Adu-McVie, R.; Erol, I. How can contemporary innovation districts be classified? A systematic review of the literature. Land Use Policy 2020, 95, 104595. [Google Scholar] [CrossRef]
- Esmaeilpoorarabi, N.; Yigitcanlar, T.; Guaralda, M.; Kamruzzaman, M. How can an enhanced community engagement with innovation districts be established? Cities 2020, 96, 102430. [Google Scholar] [CrossRef]
- Baum, S.; Yigitcanlar, T.; Horton, S.; Velibeyoglu, K.; Gleeson, B. The Role of Community and Lifestyle in the Making of a Knowledge City; Griffith University: Brisbane, Australia, 2007. [Google Scholar]
- Loures, L.; Panagopoulos, T.; Burley, J. Assessing user preferences on post-industrial redevelopment. Environ. Plan. B 2016, 43, 871–892. [Google Scholar] [CrossRef]
- Ji, T.; Chen, J.; Wei, H.; Su, Y. Towards people-centric smart city development. Sustain. Cities Soc. 2021, 67, 102691. [Google Scholar] [CrossRef]
- Capdevila, I.; Zarlenga, M. Smart city or smart citizens? J. Strategy Manag. 2015, 8, 266–282. [Google Scholar] [CrossRef]
- Yeh, H. The effects of successful ICT-based smart city services: From citizens’ perspectives. Gov. Inf. Q. 2017, 34, 556–565. [Google Scholar] [CrossRef]
- Fernandez, V.; Fernandez, J.; Giffinger, R. Smart City implementation and discourses. Cities 2018, 78, 4–16. [Google Scholar] [CrossRef]
- Macke, J.; Casagrande, R.; Sarate, J.; Silva, K. Smart city and quality of life: Citizens’ perception in a Brazilian case study. J. Clean. Prod. 2018, 182, 717–726. [Google Scholar] [CrossRef]
- Asheim, B.; Hansen, H. Knowledge bases, talents, and contexts. Econ. Geogr. 2009, 85, 425–442. [Google Scholar] [CrossRef]
- Darchen, S.; Tremblay, D. What attracts and retains knowledge workers/students? Cities 2010, 27, 225–233. [Google Scholar] [CrossRef]
- Clark, J.; Huang, H.; Walsh, J. A typology of innovation districts. Camb. J. Reg. Econ. Soc. 2010, 3, 121–137. [Google Scholar] [CrossRef]
- Pancholi, S.; Yigitcanlar, T.; Guaralda, M. Societal integration that matters. City Cult. Soc. 2018, 13, 13–21. [Google Scholar] [CrossRef]
- Pancholi, S.; Yigitcanlar, T.; Guaralda, M. Governance that matters. J. Place Manag. Dev. 2017, 10, 73–87. [Google Scholar] [CrossRef]
- Lawton, P.; Murphy, E.; Redmond, D. Residential preferences of the creative class? Cities 2013, 31, 47–56. [Google Scholar] [CrossRef]
- Florida, R. The New Urban Crisis; Basic Books: New York, NY, USA, 2017. [Google Scholar]
- Benneworth, P.; Ratinho, T. Reframing the role of knowledge parks and science cities in knowledge-based urban development. Environ. Plan. C 2014, 32, 784–808. [Google Scholar] [CrossRef]
- Glaeser, E.; Edward, L. Glaeser, review of Richard Florida’s the rise of the creative class. Reg. Sci. Urban Econ. 2005, 35, 593–596. [Google Scholar] [CrossRef]
- Hawken, S.; Han, J. Innovation districts and urban heterogeneity: 3D mapping of industry mix in downtown Sydney. J. Urban Des. 2017, 22, 568–590. [Google Scholar] [CrossRef]
- Stehlin, J. The post-industrial shop floor. Antipode 2016, 48, 474–493. [Google Scholar] [CrossRef]
- Pancholi, S.; Yigitcanlar, T.; Guaralda, M. Attributes of successful placemaking in knowledge and innovation spaces. J. Urban Des. 2018, 23, 693–711. [Google Scholar]
- Pancholi, S.; Yigitcanlar, T.; Guaralda, M. Placemaking for innovation and knowledge-intensive activities. Technol. Forecast. Soc. Chang. 2019, 146, 616–625. [Google Scholar] [CrossRef]
- Kloosterman, R.; Trip, J. Planning for quality? J. Urban Des. 2011, 16, 455–470. [Google Scholar] [CrossRef]
- Esmaeilpoorarabi, N.; Yigitcanlar, T.; Guaralda, M.; Kamruzzaman, M. How does the public engage with innovation districts? Sustain. Cities Soc. 2020, 52, 101813. [Google Scholar] [CrossRef]
- Blakely, E.; Hu, R. Crafting Innovative Places for Australia’s Knowledge Economy; Springer: Singapore, 2019. [Google Scholar]
- Yigitcanlar, T.; Inkinen, T. Geographies of Disruption; Springer: Cham, Switzerland, 2019. [Google Scholar]
- Porter, M. The competitive advantage of nations. Harv. Bus. Rev. 1990, 68, 73–93. [Google Scholar]
- Glaeser, E. Are cities dying? J. Econ. Perspect. 1998, 12, 139–160. [Google Scholar] [CrossRef]
- Esmaeilpoorarabi, N.; Yigitcanlar, T.; Guaralda, M. Place quality in innovation clusters. Cities 2018, 74, 156–168. [Google Scholar] [CrossRef]
- McCann, E. Best places. Urban Stud. 2004, 41, 1909–1929. [Google Scholar] [CrossRef]
- Frenkel, A.; Bendit, E.; Kaplan, S. Residential location choice of knowledge-workers. Cities 2013, 35, 33–41. [Google Scholar] [CrossRef]
- Brown, J. Home from home? Eur. Plan. Stud. 2015, 23, 2336–2355. [Google Scholar] [CrossRef]
- Storper, M.; Scott, A. Rethinking human capital, creativity and urban growth. J. Econ. Geogr. 2009, 9, 147–167. [Google Scholar] [CrossRef]
- Scott, A. Jobs or amenities? Pap. Reg. Sci. 2010, 89, 43–63. [Google Scholar] [CrossRef]
- Alfken, C.; Broekel, T.; Sternberg, R. Factors explaining the spatial agglomeration of the creative class. Eur. Plan. Stud. 2015, 23, 2438–2463. [Google Scholar] [CrossRef]
- Boren, T.; Young, C.; Kulturgeografiska, I.; Stockholms, U.; Samhällsvetenskapliga, F. Getting creative with the creative city? Int. J. Urban Reg. Res. 2013, 37, 1799–1815. [Google Scholar]
- Durmaz, S. Analyzing the quality of place. J. Urban Des. 2015, 20, 93–124. [Google Scholar] [CrossRef]
- Pancholi, S.; Yigitcanlar, T.; Guaralda, M.; Mayere, S.; Caldwell, G.; Medland, R. University and innovation district symbiosis in the context of placemaking. Land Use Policy 2020, 99, 105109. [Google Scholar] [CrossRef]
- Esmaeilpoorarabi, N.; Yigitcanlar, T.; Guaralda, M.; Kamruzzaman, M. Evaluating place quality in innovation districts. Land Use Policy 2018, 76, 471–486. [Google Scholar] [CrossRef]
- Brown, J.; Mczyski, M. Complexities. Built Environ. 2009, 35, 238–252. [Google Scholar] [CrossRef]
- Grant, J.; Buckwold, B. Precarious creativity: Immigrant cultural workers. Camb. J. Reg. Econ. Soc. 2013, 6, 1–17. [Google Scholar] [CrossRef]
- Clifton, N.; Cooke, P. Creative knowledge workers and location in Europe and North America. Creat. Ind. J. 2009, 2, 73–89. [Google Scholar]
- Heebels, B.; Van Aalst, I. Creative clusters in Berlin. Geogr. Ann. 2010, 92, 347–363. [Google Scholar] [CrossRef]
- Sepe, M. Liveability, quality and place identity in the contemporary city. J. Place Manag. Dev. 2010, 3, 221–246. [Google Scholar] [CrossRef]
- Trip, J. The role of urban quality in the planning of international business locations. J. Urban Des. 2007, 12, 275–293. [Google Scholar] [CrossRef]
- Esmaeilpoorarabi, N.; Yigitcanlar, T.; Guaralda, M.; Kamruzzaman, M. Does place quality matter for innovation districts? Land Use Policy 2018, 79, 734–747. [Google Scholar] [CrossRef]
- Yang, C.; Hwang, M.; Chen, Y. An empirical study of the existence, relatedness and growth theory in consumers selection of mobile value-added services. Afr. J. Bus. Manag. 2011, 5, 7885–7898. [Google Scholar]
- Yin, R. Case Study Research, Design and Methods; Sage: Newbury Park, CA, USA, 2003. [Google Scholar]
- Eisenhardt, K. Building theories from case study research. Acad. Manag. Rev. 1989, 14, 532–550. [Google Scholar] [CrossRef]
- Yigitcanlar, T.; Sabatini-Marques, J.; Costa, E.; Kamruzzaman, M.; Ioppolo, G. Stimulating technological innovation through incentives. Technol. Forecast. Soc. Chang. 2019, 146, 403–412. [Google Scholar] [CrossRef]
- Yigitcanlar, T.; Guaralda, M.; Taboada, M.; Pancholi, S. Placemaking for knowledge generation and innovation. J. Urban Technol. 2016, 23, 115–146. [Google Scholar] [CrossRef]
- Linacre, J.M. Optimizing rating scale category effectiveness. J. Appl. Meas. 2002, 3, 85–106. [Google Scholar]
- Mommaas, H. Cultural clusters and the post-industrial city. Urban Stud. 2004, 41, 507–532. [Google Scholar] [CrossRef]
- Kinnear, S.; Ogden, I. Planning the innovation agenda for sustainable development in resource regions. Resour. Policy 2014, 39, 42–53. [Google Scholar] [CrossRef]
- Engel, J.; Berbegal-Mirabent, J.; Pique, J. The renaissance of the city as a cluster of innovation. Cogent Bus. Manag. 2018, 5, 1–20. [Google Scholar] [CrossRef]
- Sepe, M.; Pitt, M. The characters of place in urban design. Urban Des. Int. 2014, 19, 215–227. [Google Scholar] [CrossRef]
- Mak, H.; Koh, K. Building a Healthy Urban Environment in East Asia; Report No. 1; Joint Lab on Future Cities (JLFC): Hong Kong, China, 2021. [Google Scholar]
- Butler, L.; Yigitcanlar, T.; Paz, A. Barriers and risks of Mobility-as-a-Service (MaaS) adoption in cities: A systematic review of the literature. Cities 2021, 109, 103036. [Google Scholar] [CrossRef]
- Alyavina, E.; Nikitas, A.; Njoya, E. Mobility as a service (MaaS): A thematic map of challenges and opportunities. Res. Transp. Bus. Manag. 2022, 43, 100783. [Google Scholar] [CrossRef]
- Geurs, K.; Gkiotsalitis, T.; Fioreze, G.; Visser, G.; Veenstra, M. Chapter Three—The Potential of a Mobility-as-a-Service platform in a Depopulating Area in The Netherlands: An Exploration of Small and Big Data. In Advances in Transport Policy and Planning; Franklin, R., Van Leeuwen, E., Paez, A., Eds.; Academic Press: Cambridge, MA, USA, 2018; Volume 2, pp. 57–79. [Google Scholar]
- Drucker, J.; Kayanan, C.; Renski, H. Innovation Districts as a Strategy for Urban Economic Development: A Comparison of Four Cases. Center for Economic Development Technical Reports. 2019, p. 192. Available online: https://dx.doi.org/10.2139/ssrn.3498319 (accessed on 10 March 2023).
- Loo, B.; Chow, A. Jobs-housing balance in an era of population decentralization. J. Transp. Geogr. 2011, 19, 552–562. [Google Scholar] [CrossRef]
- Chi, Y.L.; Mak, H.W.L. From Comparative and Statistical Assessments of Livability and Health Conditions of Districts in Hong Kong towards Future City Development. Sustainability 2021, 13, 8781. [Google Scholar] [CrossRef]
- Shi, B.; Yang, J. Scale, distribution, and pattern of mixed land use in central districts: A case study of Nanjing, China. Habitat Int. 2015, 46, 166–177. [Google Scholar] [CrossRef]
- Centre of Livable Cities, Singapore: Integrating Land Use and Mobility. Available online: https://www.clc.gov.sg/research-publications/publications/urban-systems-studies/view/integrating-land-use-mobility (accessed on 10 March 2023).
- Lee, J.; Hancock, M.; Hu, M. Towards an effective framework for building smart cities. Technol. Forecast. Soc. Chang. 2014, 89, 80–99. [Google Scholar] [CrossRef]
- Lawrence, S.; Hogan, M.; Brown, E. Planning for an Innovation District: Questions for Practitioners to Consider; No. OP-0059-1902; RTI Press: Research Triangle Park, NC, USA, 2019. [Google Scholar]
- Gabe, T.; Florida, R.; Mellander, C. The creative class and the crisis. Camb. J. Reg. Econ. Soc. 2012, 6, 37–53. [Google Scholar] [CrossRef]
- Morisson, A.; Bevilacqua, C. Balancing gentrification in the knowledge economy: The case of Chattanooga’s innovation district. Urban Res. Pract. 2019, 12, 472–492. [Google Scholar] [CrossRef]
- Kavaratzis, M.; Hatch, M. The dynamics of place brands: An identity-based approach to place branding theory. Mark. Theory. 2013, 13, 69–86. [Google Scholar] [CrossRef]
- Braun, E.; Kavaratzis, M.; Zenker, S. My city–my brand: The different roles of residents in place branding. J. Place Manag. Development. 2013, 6, 18–28. [Google Scholar] [CrossRef]
- Yigitcanlar, T.; Bulu, M. Dubaization of Istanbul: Insights from the knowledge-based urban development journey of an emerging local economy. Environ. Plan. A 2015, 47, 89–107. [Google Scholar] [CrossRef]


| Theme | Category | Indicator | Kelvin Grove Urban Village | Diamantina Knowledge Precinct | Brisbane Technology Park |
|---|---|---|---|---|---|
| Form | Location | Centrality | Inner city (2 km from CBD) | Inner city (3.5 km from CBD) | Suburban (13 km from CBD) |
| Unique surroundings | University, hospital, golf fields, natural green spaces, old army barrack | University, hospital, river, Dutton Park, research institutes | Other business and technology parks | ||
| Urban form and structure | Urban structure | Connected to the city fabric with blurring boundaries, highly walkable | Poor integration with the neighbourhood, lack of walkability | Clear boundaries with adjacent neighbourhoods, car-oriented | |
| Urban form | Medium/high density, well connected to the streetscape, campus form | Extremely large buildings with massive vacant lands between them | Medium- to low-density segmented workplaces, poor connection to streetscapes, business park form | ||
| Design | Urban design | Mixed-use development around the main street, high-quality public green/open spaces | Five huge buildings with no purposefully designed public and green places between them | Introverted workplaces around a network of streets, lack of public and green places | |
| Architectural design | Generic design with no iconic or cutting-edge architecture | Award-winning high-tech and futuristic architecture | Good quality modern buildings with no iconic or cutting-edge architecture | ||
| Amenities | Essential amenities | Schools, healthcare services, convenience stores | No amenities | No amenities | |
| Advanced amenities | Gym, public Wi-Fi, restaurants, sports courts, swimming pool, café, coworking meeting and research spaces | Café, official meeting spaces | Café, official meeting spaces | ||
| Function | Services | Urban mobility | High-quality sidewalks, bike paths, well-served public transport | Well-served public transport | Lack of walkability and public transport, highly accessible by car |
| Management | Developed and managed by a public–private system | Developed and managed by a public system | Developed and managed by a private system | ||
| Land use | Mixed-use development | Mixed-use development, combines life, work, study, and entertainment | Combines work and study | Only work areas | |
| Property availability and value | Expensive inner-city properties, lack of working spaces, domination of residential blocks | Expensive inner-city properties, lack of residential and working spaces | Affordable suburban properties, accessibility to a variety of working spaces | ||
| Company profile | Knowledge/creative industries | Health institutes and creative industries start-ups | Governmental health and eco-science institutes | Large number of ICT companies | |
| Technology adoption/facilities | High-quality technical infrastructure | High-quality technical infrastructure | High-quality technical infrastructure | ||
| Work condition | Thick labour markets | Limited to research positions and start-ups | Limited to research positions | Varieties of job opportunities | |
| Professional networks | Varieties of plans and places for formal and informal professional networks | Lack of plans and places for professional networks | Lack of plans and places for professional networks | ||
| Ambiance | Public spaces and events | Public and cultural spaces | Several open/public spaces—parks, playground, library, theatre, heritage buildings | Heritage building | No spaces |
| Public and cultural events | Various public events—fashion shows, Brisbane Festival, movie nights, Saturday markets | No events | No events | ||
| Public engagement | Work climate | Formal and informal working and interacting climate | Formal climate | Formal climate | |
| Social interaction | Variety of occasional, accidental and co-incidental social interactions | Lack of social activities and interactions | Lack of social activities and interactions | ||
| Diversity | Diverse communities | High diversity of cultures and ethnic groups, presence of multicultural amenities, heterogeneous community | Homogeneous community | Homogeneous community | |
| Tolerance/openness | Highly open to new people and ideas | Highly open to new ideas | Highly open to new people and ideas | ||
| Creativity | Creative communities | Dense creative community with a chance of communicating together | Dense creative community with no chance of communicating together | Dense creative community with no chance of communicating together | |
| Creative atmosphere | Artistic features/performances, inspiring architecture, visibility of creative activities | Inspiring architecture | No elements | ||
| Image | Buzz of place | Pace of life | Dense population, active street life, the artistic buzz of creative industry activities | Lack of people and activities in the streetscape | Lack of people and activities in the streetscape |
| Variety of lifestyles | Limited to students’ lifestyle, lack of nightlife | Poor | Poor | ||
| Sense of safety | Subjective safety | Highly safe and secure | Safe and secure during the day | Safe and secure during the day | |
| Objective safety and security | Guaranteed by active presence of people in streets and during nights | Lack of walkability and housing | Lack of walkability and housing | ||
| Sense of place | Place attachment | Strong, no boundaries between district and surrounding, no boundaries between life, work, study | Poor | Poor | |
| Sense of community | Strong | Poor | Poor | ||
| Place identity | Authenticity | Poor, generic design with no unique or monumental bold statement | Average, award-winning architectures | Poor, generic design, long distance from CBD | |
| Brands | Does not host distinguished companies or institutes | Hosts CSIRO, TRI | Hosts headquarters office of some famous companies |
| Group | No | Expertise | Involvement |
|---|---|---|---|
| Group 1: Government, Developers, Body Corporates | #1 | Strategy Planner | Brisbane Marketing |
| #2 | Economist | Queensland Department of Infrastructure | |
| #3 | Regional Planner | Queensland Asset Management | |
| #4 | Strategy Planner | Economic Development Queensland | |
| #5 | External Relations | University involvement in KGUV * | |
| #6 | Systematic Thought | KGUV building manager | |
| #7 | Infrastructure | Eco-sciences Precinct in DKP ** | |
| #8 | Business | BTP *** services | |
| Group 2: Urban Planners, Designers, Architects | #9 | Architect | KGUV, DKP |
| #10 | Architect/Urban Designer | KGUV | |
| #11 | Architect/Urban Morphologist | DKP, KGUV, BTP | |
| #12 | Urban Designer/Planner | KGUV, BTP, DKP | |
| #13 | Place Specialist | KGUV, DKP, BTP | |
| Group 3: Knowledge Workers, Company Managers | #14 | Management | KGUV |
| #15 | Musician | KGUV | |
| #16 | Optometrist | KGUV | |
| #17 | Digital Mapping | KGUV | |
| #18 | Computational Biologist | DKP | |
| #19 | Toxicology Analyst | DKP | |
| #20 | Plant Biochemist | DKP | |
| #21 | Ecologist | DKP | |
| #22 | Performance Analyst | BTP | |
| #23 | Software Developer | BTP | |
| #24 | System Engineer | BTP | |
| #25 | Solution Architect | BTP | |
| #26 | Electronic Design | BTP | |
| #27 | Infrastructure Operations | BTP |
| Theme | Category | Similarities |
|---|---|---|
| Form | Location | -Decentralising innovation districts to provide jobs and amenities balance in different parts of cities -Locating innovation districts in different neighbourhoods across cities’ flow roads, public transport, and other mobility systems and supporting the job–housing balance -Locating innovation districts in old industrial sites or disturbing neighbourhoods to facilitate the process of revitalisation and renovation -Collocating innovation districts with existing universities, research institutes, hospitals, and other knowledge-intensive activities is beneficial |
| Urban form and structure | -Prevent sprawling and focus on medium- to high- density urban form -Mixed-use development to provide living, working, studying and entertainment opportunities close together -Excellent connections to the city centres and neighbourhoods both by car and on foot -Strong integration with the city fabric with no boundaries between districts and neighbourhoods | |
| Design | -Provide more greenery, open spaces, and third places to encourage incidental interactions -Improve walkability and prevent car-oriented design -Provide transparency of activities, connect them to the streetscape, and shape plenty of movement between places -Host modern aesthetic buildings and architecture | |
| Amenities | -Presence of smart facilities -Presence of essential and advanced amenities, e.g., parks, sports grounds, hiking and cycling opportunities, healthcare facilities, entertainment facilities, shopping centres, restaurants, and cafés | |
| Function | Services | -Share infrastructure and services with the surrounding areas -Cluster smart, ICT, and AI services -Presence of innovation districts in neighbourhoods balances investment in different modes of mobility system for all parts of cities |
| Land use | -Unify work, study, and living experiences -Increase the value of properties in neighbourhoods by branding—gentrification | |
| Company profile | -Dense presence of companies accelerates generation of knowledge and also its spill-over -Bring businesses, expertise and universities to the neighbourhoods and increase the population of elites -Increase the role of knowledge-based activities in the economic growth-Cluster diverse specialties together -Bring universities, researchers, and professionals together -Locate universities across cities rather than city centres or remote suburbs -Develop technological culture and connect people to new technologies | |
| Work condition | -Gather like-minded people and complementary industries together -Create more jobs and new careers within neighbourhoods -Provide specialised education that supports the requirements of workers in neighbourhoods -Ease connection of businesses -Encourage networking -Facilitate knowledge spill-over between disciplines | |
| Ambiance | Public spaces and events | -Bring various events and facilities to neighbourhoods -Attract people through cultural and social activities as well as professional ones -Provide plenty of third places that gather communities together and encourage social/professional interactions |
| Public engagement | -Provide casual ambiances to smooth the official environments -Bring enough people, facilities, and interactions together to activate districts’ life -Inspire local communities to be creative -Harmonise the place for both workers and the public as well as both adults and kids | |
| Diversity | -Bring social and cultural diversity -Connect communities with different experiences, educations, nationalities, genders, etc. | |
| Creativity | -Provide cutting-edge advanced knowledge and facilities -Gather talented people to inspire both workers and locals -Artistic vibes, visibility of actives, and state-of-the-art services | |
| Image | Buzz of place | -Combine different aspects of life to create a new concept of living -Bring a variety of lifestyles and a dynamic buzz to gloomy neighbourhoods -Attract more people to the neighbourhood |
| Sense of safety | -Adopt pedestrian- and cycle-friendly plans and mixed-use development that brings enough people into the streetscape -Provide well-oriented urban structure and social control to improve the objective safety -Invite elites and highly educated population into neighbourhoods, which, in return, improve the reputation and subjective safety | |
| Sense of place | -Respect community-based values and provide public amenities -Be a friendly place for all people -Blur social boundaries and unite elites and locals -Adapt to upcoming requirements of local communities | |
| Place identity | -Signify its brand, e.g., through well-known firms and institutes, creative vibes and unique architectures -Improve the popularity of the neighbourhood -Improve the standing of the regions at both national and global scales |
| Theme | Category | Indicator | Question | Original Data | DA% vs. A% | ||
|---|---|---|---|---|---|---|---|
| DA% | Neutral% | A% | Sig(2-Tailed) | ||||
| Form | Location | Centrality | Presence of most innovation districts in distant suburbs | 28.4 | 45.9 | 25.7 | 0.656 |
| Districts are overloaded by people or cars | 11.5 | 36.5 | 52 | 0.00 | |||
| Unique surroundings | Bring positive environmental impacts | 27.3 | 54.3 | 18.3 | 0.026 | ||
| Urban form and structure | Urban structure | Not fit residential requirements | 17.6 | 41.9 | 40.5 | 0.00 | |
| Urban form | Lack of connectivity to nearby neighbourhoods | 32.4 | 50.4 | 17.3 | 0.00 | ||
| Have noticeable boundary | 20.5 | 52.9 | 26.6 | 0.138 | |||
| Design | Urban design | Provide various open spaces | 6.9 | 42.3 | 50.8 | 0.00 | |
| Architectural design | Provide high-quality buildings | 15.8 | 51.8 | 32.4 | 0.00 | ||
| Bring iconic design to neighbourhood | 9.7 | 50 | 40.3 | 0.00 | |||
| Amenities | Essential amenities | Enhance infrastructure and public facilities | 12.9 | 56.5 | 30.6 | 0.00 | |
| Accessibility to both essential and advanced amenities | 3.1 | 39.2 | 57.7 | 0.00 | |||
| Advanced amenities | The innovation district does not provide extra amenities to the neighbourhood | 22.7 | 56.1 | 21.2 | 0.718 | ||
| Accessibility to smart technologies and facilities | 10.8 | 37.7 | 51.5 | 0.00 | |||
| Bring advanced amenities to suburbs (such as shopping centres, cafés, restaurants, sports grounds) | 10.8 | 48.9 | 40.3 | 0.00 | |||
| Function | Services | Urban mobility | Improve urban mobility | 6.2 | 38.5 | 55.4 | 0.00 |
| Management | Not available | ||||||
| Land use | Mixed-use development | No boundaries between work, life, and play | 11.5 | 43.1 | 45.4 | 0.00 | |
| Uncomfortable sense of living too close to your work | 25 | 39.2 | 35.8 | 0.092 | |||
| Property availability and value | Negatively impact the price of properties | 10.4 | 57.6 | 32 | 0.00 | ||
| Provide reasonably priced housing and offices | 38.1 | 44.6 | 17.3 | 0.00 | |||
| Have a positive role in shaping neighbourhood reputation and respectively properties’ value | 11.5 | 48.9 | 39.6 | 0.00 | |||
| Company profile | Knowledge/creative industries | Ease the economic growth | 16.5 | 50.7 | 32.7 | 0.00 | |
| Technology adoption/facilities | Provide high-quality education | 11.9 | 43.5 | 44.6 | 0.00 | ||
| Bring technical complications | 31.8 | 41.9 | 26.4 | 0.390 | |||
| Provide targeted education | 5.8 | 45 | 49.3 | 0.00 | |||
| Work condition | Thick labour markets | Possibility of moving between jobs | 6.2 | 44.6 | 49.2 | 0.00 | |
| Provide plenty of job opportunities | 10.4 | 42.4 | 47.1 | 0.00 | |||
| Professional networks | Proximity to a wide range of professional networks | 10.8 | 36.9 | 52.3 | 0.00 | ||
| Facilitate professional networking | 3.6 | 25.9 | 70.5 | 0.00 | |||
| Connect companies and universities | 3.6 | 33.1 | 63.3 | 0.00 | |||
| Ambiance | Public spaces and events | Public and cultural spaces | Support cultural dynamics | 16.9 | 53.2 | 29.9 | 0.001 |
| Public and cultural events | Accessibility to different cultural and social activities | 9.2 | 39.2 | 51.5 | 0.00 | ||
| Public engagement | Work climate | Not available | |||||
| Social interaction | Facilitate social interactions | 21.2 | 45.3 | 33.5 | 0.006 | ||
| Encourage social interactions within their neighbourhood | 9 | 46.4 | 44.6 | 0.00 | |||
| Diversity | Diverse communities | It is interesting to live in a diverse community | 18.5 | 45.4 | 36.2 | 0.006 | |
| Host diverse communities | 6.5 | 33.8 | 59.7 | 0.00 | |||
| Tolerance/openness | Negative presence of too many immigrants | 30.6 | 51.8 | 17.6 | 0.002 | ||
| Presence of too many young people | 43.9 | 44.2 | 11.9 | 0.00 | |||
| Openness to new ideas and people | 4.6 | 45.4 | 50.0 | 0.00 | |||
| Creativity | Creative communities | Help the city to become smart | 17.3 | 45.3 | 37.4 | 0.00 | |
| Creative atmosphere | Living in an artistically or technologically creative atmosphere | 9.2 | 45.4 | 45.4 | 0.00 | ||
| Shape creative atmospheres for children | 10.8 | 46 | 43.2 | 0.00 | |||
| Image | Buzz of place | Pace of life | The innovation district attracts a large population to the neighbourhood, which makes it overcrowded and hectic | 25.5 | 57.9 | 16.5 | 0.021 |
| Street life is not attractive in innovation districts | 27.7 | 47.3 | 25 | 0.652 | |||
| Variety of lifestyles | Support diversity of lifestyle opportunities | 19.4 | 45.7 | 39.9 | 0.00 | ||
| Accessibility to a variety of restaurants, cafés, bars, and nightlife | 5.4 | 33.8 | 60.8 | 0.00 | |||
| Sense of safety | Subjective safety | Improve physical and mental health of society | 27 | 45.7 | 27.3 | 0.935 | |
| Improve walkability | 5.4 | 30 | 64.6 | 0.00 | |||
| They are good places for raising children | 33.1 | 38.5 | 28.4 | 0.465 | |||
| Objective safety and security | Improve the safety and security of the city | 27 | 48.6 | 24.5 | 0.559 | ||
| Sense of place | Place attachment | Nothing interesting about innovation districts | 26.6 | 47.5 | 25.9 | 0.869 | |
| Sense of community | I feel banned from being a part of districts’ life | 36.3 | 44.2 | 19.4 | 0.00 | ||
| Nothing interesting about innovation districts’ community | 28.1 | 42.8 | 29.1 | 0.812 | |||
| Lack of acceptance from the community of innovation districts | 23 | 52 | 25 | 0.723 | |||
| Place identity | Authenticity | Enhance the reputation of neighbourhoods | 4.6 | 39.2 | 56.2 | 0.00 | |
| Brand | Improve national and international reputation and connections | 15.8 | 46 | 38.1 | 0.00 | ||
| Theme | Category | Insights |
|---|---|---|
| Form | Location | Unlike connectivity, closeness to CBDs is not necessary for all types of knowledge workers |
| Urban form and structure | Innovation districts need their specific form and structure that is distinct from other functions, such as universities and urban villages | |
| Design | Flexible designing is an essential approach for developing place identity and a sense of place | |
| A balance between iconic and norm design integrates innovation districts with their surroundings | ||
| Environmentally friendly design is a vital concept for innovation districts | ||
| Amenities | The match, accessibility, and affordability of amenities are beyond solely removing the gates | |
| Function | Services/management | Being highly accessible through all forms of urban mobility systems is established prior to focusing on public transport |
| Innovation districts need to inform users about and ensure the efficiency of their plans for cities and societies | ||
| Multi-layered strategies are required to fulfil the macro-scale plans of cities and the micro-scale needs of users; detailed plans need to be employed beside regional strategies | ||
| Land Use | A new hierarchy of spaces is required to reduce the uncomfortable sense of locating users’ home too close to their work | |
| The match and balance between uses is as crucial as mixed-use development | ||
| Price-controlling plans need to be considered before disrupting the social mix | ||
| Company profile/technology | The presence of small/medium size companies and start-ups is critical | |
| Targeted education is necessary for linking locals to knowledge-based activities | ||
| Work condition | Hard factors are still the first reason for selecting jobs and innovation districts | |
| Ambiance | Public spaces and events | Not available |
| Public engagement | The social roles of innovation districts need to be planned and advertised through systematic management, rather than remaining limited to physical strategies | |
| Diversity | The public, like knowledge-workers, respect diversity and openness | |
| Creativity | Not available | |
| Image | Buzz of place | Hard factors are still a priority for some types of workers in comparison to vibes and lifestyles |
| Sense of safety | Design and connectivity are highly effective in shaping the sense of safety | |
| Sense of place | The public and knowledge workers have similar expectations from their place | |
| Social coherency/equality needs to be precisely considered in innovation districts | ||
| Place identity | Branding still relies on hard factors (such as located companies) rather than soft factors (such as vibes and design) |
Disclaimer/Publisher’s Note: The statements, opinions and data contained in all publications are solely those of the individual author(s) and contributor(s) and not of MDPI and/or the editor(s). MDPI and/or the editor(s) disclaim responsibility for any injury to people or property resulting from any ideas, methods, instructions or products referred to in the content. |
© 2023 by the authors. Licensee MDPI, Basel, Switzerland. This article is an open access article distributed under the terms and conditions of the Creative Commons Attribution (CC BY) license (https://creativecommons.org/licenses/by/4.0/).
Share and Cite
Esmaeilpoorarabi, N.; Yigitcanlar, T. User-Centric Innovation District Planning: Lessons from Brisbane’s Leading Innovation Districts. Buildings 2023, 13, 883. https://doi.org/10.3390/buildings13040883
Esmaeilpoorarabi N, Yigitcanlar T. User-Centric Innovation District Planning: Lessons from Brisbane’s Leading Innovation Districts. Buildings. 2023; 13(4):883. https://doi.org/10.3390/buildings13040883
Chicago/Turabian StyleEsmaeilpoorarabi, Niusha, and Tan Yigitcanlar. 2023. "User-Centric Innovation District Planning: Lessons from Brisbane’s Leading Innovation Districts" Buildings 13, no. 4: 883. https://doi.org/10.3390/buildings13040883
APA StyleEsmaeilpoorarabi, N., & Yigitcanlar, T. (2023). User-Centric Innovation District Planning: Lessons from Brisbane’s Leading Innovation Districts. Buildings, 13(4), 883. https://doi.org/10.3390/buildings13040883