Abstract
Buildings are significant contributors to climate change through their energy consumption, particularly in countries with hot and dry climates where cooling services require substantial amounts of energy. Climate change is expected to increase cooling demand, further exacerbating the problem. This study investigates the impact of climate change on cooling demands in different building types in Qatar and evaluates related environmental impacts. Using a high-resolution regional climate model, future climate data were obtained for 2071 and 2100 under the Representative Concentration Pathway (RCP) 4.5. The energy consumption of eight prototype buildings was simulated under baseline and future climates, and the environmental impacts were assessed using Life Cycle Assessment (LCA) for natural gas and solar power as energy sources. The study found that the cooling demand could increase by 13–53% and 19–67% in 2071 and 2100, respectively, with buildings having higher thermal insulation and lower window-to-wall ratio being less affected by climate change. The LCA results showed that replacing natural gas with solar power can reduce cooling energy-associated CO2 emissions by 92%. However, challenges such as human toxicity and metal depletion need to be addressed. The study highlights the importance of considering potential climate change scenarios to develop more resilient buildings and encourages implementing efficient recycling and waste management strategies before implementing PV panels.
1. Introduction
The world is facing rapid climate change, which is one of the biggest challenges nowadays. Climate change’s environmental and socioeconomic consequences have pushed nations worldwide to take action and commit to lowering their Greenhouse Gas (GHG) emissions. In this context, the building sector has received great attention. It is reported that the building sector is responsible for over 30% of the total GHG emissions in the world and 32% of the global energy consumption (projected to be doubled in 2050) [1]. In contrast, climate change has a significant effect on buildings [2,3]. Local weather conditions have a major influence on buildings’ energy requirements [4]. The energy required to maintain a comfortable indoor environment in buildings is inextricably related to outdoor weather conditions [5,6]. Therefore, changes in the weather conditions locally and globally could result in an evolution in the energy requirements for the existing buildings [7,8]. Due to climate change, buildings would be exposed to new climate conditions, which will lead to a change in their energy requirements [9,10,11].
1.1. Climate Change Impact on Cooling Requirement
The future change in climate conditions is described by the Intergovernmental Panel on Climate Change (IPCC) through different assessment reports. The IPCC stated that the world average surface air temperature would increase by 1 °C to 1.8 °C and 2.1 °C to 3.5 °C under the very low and medium GHG emission scenario [12]. However, a significate increase of 3.3 °C to 5.7 °C is projected under the very high GHG scenario [12]. On a global scale, a 1 K rise in average global ambient temperature is expected to cost $75.1 billion in energy consumption for cooling [13]. The increase in outdoor temperature would raise the cooling energy intensity in buildings and increase their cooling demand [14]. The future global need for building cooling would significantly exceed the need for building heating [15]. Therefore, climate change could have a significant impact on building cooling systems.
Recent studies indicate that climate change has a major impact on energy demand for cooling and heating in buildings due to changes in outdoor ambient conditions [16]. Therefore, the need to control energy consumption and associated Greenhouse Gas (GHG) emissions in buildings is increasing as part of adapting to new climatic conditions by incorporating those measures into standards and regulations that will ensure user comfort [17]. Globally, several studies indicated that the cooling requirement would increase due to climate change. Gi et al. [18] found that global cooling demand in 2010 would be 3.8 to 4.5 times higher in the middle of the 21st century. Levesque et al. [15] evaluated the energy demand for building worldwide. They found that the energy used for cooling is dominating the future increase in building energy, where the global demand for building cooling could increase from 14% in 2010 to 36–71% by the end of the 21st century. Santamouris [13] found that by 2050, the average cooling demand for residential buildings is expected to grow by 750%, while for commercial buildings, it could increase by 275%.
The future cooling energy for United States buildings was quantified in different locations. Two studies in the USA used EnergyPlus software and downscaled the global climate model (GCM) data to study the impact of climate change on building cooling demand [19,20]. Shen [19] simulated the cooling demand in 2040–2069 under the A2 emission scenario in four American cities. The study found that cooling demand for residential buildings would increase by 27.0% in Philadelphia, 24.8% in Chicago, 17.4% in Phoenix, and 26.6% in Miami. Jiang et al. [20] focused their study on commercial buildings in Florida under the same emission scenario (A2). The results showed an increase in the cooling demands in all commercial buildings. For example, in 2080, the cooling demand in high-rise Apartments would rise by 74% in Jacksonville, 62% in Daytona, 58% in Tampa, and 45% in Key West. In Canada, Berardi and Jafarpur [21] performed energy building modeling using OpenStudio to investigate the future cooling demand for different building types in Ontario under the A2 emissions scenario. The study showed that in 2070 the increase in energy use intensity for cooling would be 36% to 44% in apartments, 35% to 46% in hotels, and 116% to 126% in restaurants. Under the representative concentration pathway (RCP) 8.5 emissions scenario, the same researchers indicated that the cooling load for a medium office could increase by 34.6% in Quebec, 32.2% in Toronto, and 27.8% in Vancouver [22].
Bamdad et al. [23] exhibited that under the A2 emission scenario, the cooling demand in 2080 could be higher by 19% to 23.9% in two Australian cities, Brisbane and Canberra. Invidiata and Ghisi [24] found that the cooling requirement for buildings in Brazil in 2050 would be higher than in 2015. Specifically, the increase would be 210% in Curitiba, 120% in Florianópolis, and 70% in Belém. Liu et al. [25] performed an energy simulation for buildings in Hong Kong, China, under RCP4.5 and RCP8.5 scenarios. The result indicated that in cooling seasons, indoor discomfort could increase from 21.9% in 1979–2003 to 36.0% and 50.4% under RCP4.5 and RCP8.5. In Jinan, China, the increase in the residential building cooling load could reach 80.3% between 2020 and 2080 under the A2 emission scenario [26]. Shibuya and Croxford [27] investigated the impact of climate change on energy consumption in office buildings in three cities in Japan. They found that by 2090 the cooling requirement in office buildings would increase by 46.7% in Sapporo, 32.8% in Tokyo, and 19.8% in Naha.
Several studies in Europe discussed how climate change affects cooling demand in buildings and stated that climate change would drive the cooling demand in London to be doubled in 2030. A recent study [28] used EnergyPlus simulation and adopted the A2 emissions scenario to quantify the future cooling needs for a hypothetical house in different European cities. The study relieved that by 2050 the need for building cooling would increase by 1370% in London, 427% in Paris, 129% in Granada, and 144% in Rome. By the middle of the 21st century, the building’s cooling requirement in Vienna, Austria, is expected to increase by 28% to 92% under the A1B emission scenario [29]. Between 2021 and 2040, residential buildings in Milan, Italy, would face an increase in cooling energy consumption of 47% and 56% under the RCP4.5 and RCP8.5, respectively. In Geneva, Switzerland, The peak cooling load In the near term (2026–2045), would rise by 28.5% [30]. Frank [31] found the increase in building cooling demand in Switzerland would reach 223% to 1050% between 2050 and 2100.
The impact of climate change on cooling systems in hot regions could be severe since the cooling systems are already overloaded in such countries, especially during summer [32]. Cooling energy dominates the energy consumption in buildings in the Middle East countries and especially the Gulf Cooperation Council (GCC) countries. The cooling load of buildings accounts for the largest proportion of energy consumption (70%) in countries with hot and humid climates [33]. For example, in Saudi Arabia, 65% of the total energy consumption in buildings is attributed to air conditioning systems [34]. In Qatar, the cooling systems in buildings are responsible for more than half of the total energy consumption [35]. In Kuwait, the energy required for cooling systems accounts for 45% of the total electricity demand in buildings [36]. Radhi [37] evaluated the climate change impact on residential buildings in Al-Ain, United Arab Emirates. He found that by 2100 the cooling demand could increase by 23.5%. Andric and Al-Ghamdi [38] studied the climate change implications on the residential sector of Qatar. They simulated the energy performance of a two-story villa under the A2 emissions scenario. The results highlighted that under future climate conditions, heatwaves would become more frequent, more intense, and last longer. As a result, building energy usage will rise by 30%.
1.2. Environmental Impacts and Energy Transition
The environmental impacts of the buildings are mainly attributed to fossil fuel consumption during their construction and operational phase. Life Cycle Assessment (LCA) allows for assessing the environmental effects and energy consumption trends related to the building. Several LCA studies have found that the operational energy usage of buildings is responsible for a significant portion of these CO2 emissions [39,40,41,42]. Osman and Ries [43] conducted an LCA study to assess the environmental implications of different energy generation systems for buildings. The study found that the selection of a generation system can reduce the environmental impacts of the operational energy of buildings. Another study evaluated the environmental impacts of an office building considering three electricity sources, natural gas, coal, and PV panels [44]. The findings demonstrate that when fossil fuels are replaced by PV energy generation, there is a larger necessity to employ the LCA technique in building design in combination with energy requirements. Only a few studies investigated the life cycle of the building considering climate change. A study [45] in Austria evaluated the environmental impacts of using different building refurbishment strategies considering future climate conditions. The results indicated that using a thermal envelope combined with PV panels and thermal collectors was the best strategy.
Energy transition plays an essential role in addressing the concerns of fossil fuel consumption and climate change, and it is becoming a larger part of the global energy mix. For instance, renewables generated nearly 30% of power output in the United Kingdom between April and June 2017 [46]. This quick rise in renewable energy production, up from just 5.5% in 2009, is being driven by growth in solar and wind energy. The biggest percentage of renewable technology was found in onshore wind and solar PV, which combined made up around 31% of all renewable capacity. Solar energy provides for 13% of overall energy use in buildings, but this figure is predicted to climb to 50%, or more in some locations, by 2010 [47]. Gulf countries heavily depend on fossil fuels to produce energy, which means the increase in cooling demand due to climate change would increase energy consumption, emit more GHG, and contribute again to climate change [48,49].
Table 1 presents relevant studies available in the literature that have investigated the impact of climate change on the cooling load of buildings in various climatic regions. It reveals that most of the studies are regionally based, there is wide variation in the results of these studies, and that they are not comparable, mainly due to differences in the types of buildings, methodologies, and climate features of the regions considered in these studies. However, there is a lack of systematic research that focuses on the impact of climate change on the cooling demand of buildings in hot and dry regions such as the Gulf region, which is one of the most venerable regions. The study conducted in the GCC, specifically in UAE, evaluated the future increase in cooling demand. However, climate projections in that study [37] were based on assumptions rather than approved climate models. In addition, most LCA studies for buildings neglect possible changes in operational energy demand caused by climate change.

Table 1.
Summary of previous literature about the impact of climate change on the cooling demand of buildings.
The literature shows that future cooling requirements in arid regions are not well investigated under the high-resolution-approved climate change model. Moreover, while most of the studies focused on one side of the dual effect relation between climate change and building cooling requirements, this paper comprehensively investigates the nexus of climate change, cooling demand, and energy transition in arid regions in terms of future requirements and associated environmental impacts.
2. Objective and Methods
The framework of this study is presented in Figure 1. In order to evaluate the effect of climate change on building cooling energy consumption, two sets of weather data are required: baseline and future weather data. The weather files will be inputs for the energy simulation process where the baseline and future cooling demands for different building types in Doha, Qatar, are obtained. Then, an environmental impact assessment is conducted using Life Cycle Assessment (LCA) tool to evaluate the environmental consequences associated with the baseline and future cooling demands. The environmental impacts in the baseline climate are evaluated, considering natural gas as the only energy source to produce electricity. However, in the future climate, we considered switching to a green energy source (solar power) to align with Qatar National Vision 2030.
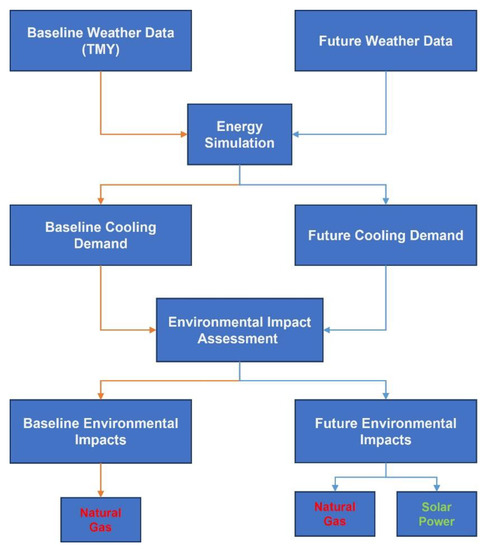
Figure 1.
Study Framework.
2.1. Energy Simulation
Energy simulation for different building types was performed in this study using EnergyPlus software (v.9.6.0) and its graphical interface tool Openstudio (v.3.3.0). EnergyPlus is an open-source, validated whole-building energy simulation program developed by The U.S. Department of Energy (DOE). It allows users such as researchers, architects, and engineers to model and simulate the energy consumption for buildings, including cooling, heating, ventilation, plugs and lighting loads, and water usage [63], considering the statistical weather conditions. Using Openstudio, eight types of commercial buildings (Figure 2) in climate zone 0B were selected from the prototype buildings, which are developed by U.S. DOE in compliance with ASHRAE standard 90.1 version 2016 [64]. The selected building types are apartment buildings (mid-rise and high-rise), office buildings (medium and large), hotels (small and large), hospitals, and fast-food restaurants. The building details and the technical description of the envelope elements for the selected prototype buildings are presented in Table 2 and Table 3.
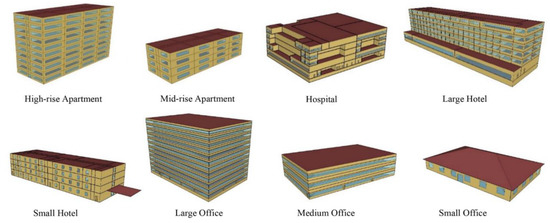
Figure 2.
Prototype buildings [64].
Table 2.
Prototype building models details.
Table 3.
Building envelope components.
The primary input to EnergyPlus software is a weather file. This file is text-based and includes hourly weather data separated by a comma (EPW format) for a typical year for the selected city [65]. The file contains two sets of data, where the first set describes the intended location (e.g., city name, longitude, latitude, elevation, time zone, and peak design conditions). The second set contains meteorological weather variables such as dew point and dry bulb temperature, atmospheric pressure, relative humidity, wind speed, and solar radiation. Two types of weather files are used for buildings’ energy simulation. The first type represents the reference climate conditions (baseline weather data), and the second type represents the climate change conditions (future weather data).
2.1.1. Baseline Weather Data
The baseline weather file used in this study includes weather information for a typical meteorological year (TMY) of Doha. The TMY is one of the most often utilized sets of meteorological data for analyzing building energy usage [21]. The method of generating the TMY file was developed by Hall et al. [66], which is one of the most widely used techniques for generating typical weather years. Based on s Finkelstein–Schafer (F.S) statistics, The technique picks the best typical representative months from multiple years of long-term observed weather data. It then merges the selected months into a single year known as TMY. The data are based on statistical measurements of uniformity of daily indicators such as maximum, mean, and minimum dry-bulb temperature, dew-point temperature, solar radiation, and wind velocity. The Doha TMY file includes hourly weather data for 12 months collected from different years from the period 1985–2004.
2.1.2. Future Weather Data
The influence of climate change on the need for cooling in buildings was examined using a variety of climatic variables such as dry bulbs and dew point temperatures, atmospheric pressure, solar radiation, and wind speed. The projection years were considered as 2071 and 2100 under RCP4.5. The future climate variables were obtained from a Regional Climate Model (RCM) that covers southwest Asia. The RCM was developed by the Massachusetts Institute of Technology (MIT) based on atmospheric boundary conditions of three selected General Climate Models (GCMs). The selected GCMs are the Max-Planck Institute Earth System Model (MPI-ESM), the Community Climate System Model V4 (CCSM4), and the Norwegian community Earth System Model (NorESM). Over southwest Asia, the original MIT RCM has a spatial resolution of 25 km. The MIT RCM’s spatial resolution across Qatar has been increased for this study to 12.5 km, and it has been run under all GCM boundary conditions, generating the results of three runs. The reader can refer to [67] for more details about the MIT RCM and its setup.
The RCM used in this study adopted the Representative Concentration Pathways (RCPs). The RCPs are future climate scenarios proposed by IPCC in their fifth assessment report (AR5) [68]. The RCPs describe the future climate conditions based on the amount of GHG that could be emitted in the coming years. They are developed using predictions for economic development, technological advancements, land usage, and climate policy that are recognized by specific radiative forcing value (warming impact) in watts per square meter in 2100 [68]. In this study, we consider the intermediate scenario the RCP4.5, which predicts that the CO2 emission would reach its peak around 2040 and then start to decline and stabilize by the end of the century.
2.2. Life Cycle Assessment (LCA)
The continuous increase in lifestyle standards and the greater demand for items and products negatively affect the natural environment. LCA is a systematic method that measures the environmental effects of any process or product throughout its existence, from the beginning (purchasing raw materials) to the end (disposal), and aids in choosing the products or process with the minimum impacts over other alternatives. The LCA was conducted using GaBi software [69]. Based on the ISO 14040 and 14044 criteria [70,71], the LCA framework consists of four steps. The first step defines the study’s goals and objectives, the system boundary, and the functional unit. This LCA study aims to quantify the environmental impacts related to the change in cooling demand due to climate change. Considering the current technological improvement in the energy sector in Qatar, this study investigates the effect of switching the energy source from natural gas to solar power by implementing solar panels. The functional unit in this study is 1 kWh. All life phases for both methods are considered, including raw material extraction, manufacturing, operation, and disposal and the system boundary is from the power plant to the end user considering the grid transmission losses.
The second step is called the life cycle inventory (LCI), which refers to the process of compiling all the inputs and outputs to the system. This step was performed using GaBi database [72], where all the inputs and outputs for electricity production through natural gas and PV panels for Qatar are available. Table 4 shows the main technical specification for PV panels in Qatar, the reader can refer to [73] for more details. Thirdly, the Life Cycle Impact Assessment (LCIA) step. This process primarily uses characterization criteria to translate the LCI data into quantified environmental impacts. The methodology used in this step is the ReCiPe methodology. ReCiPe methodology contains two levels of assessments: midpoint and endpoint. Midpoint impact assessment methods focus on environmental indicators such as climate change and water depletion. In contrast, endpoint impact assessment methods focus on the ultimate impact on human health, ecosystems, or resources. This study used the ReCiPe Midpoint assessment for five categories: climate change, fossil depletion, human toxicity, metal depletion, and water depletion. The last step is the interpretation process, where the results are evaluated and discussed to obtain conclusions.
Table 4.
PV panels technical specification.
3. Results
This section shows the impact of climate change on building cooling demand and the related environmental impacts. The energy consumption of eight prototype buildings in Qatar was simulated under reference climate (1985–2004) and future climate considering the emission scenario RCP4.5 in the years 2071 and 2100. Then, the environmental consequences associated with cooling energy consumption were investigated by conducting an LCA study through Gabi software based on the ReCiPe assessment method.
3.1. Climate Change Impact on Building Cooling Demand
The annual cooling energy consumption for all buildings under reference and future climate is illustrated in Table 5. The energy simulation results show that annual cooling demand for all building types is expected to increase due to climate change. The percentage increase in the building cooling demand compared to the reference climate has a proportional relationship with time. For example, under RCP-4.5, the annual cooling demand for mid-rise apartments increased by 17% in 2071 and 28% in 2100. These percentages are in line with Andric and Al-Ghamdi’s [38] study that suggests that the need for cooling energy would drive building energy consumption in Qatar to 30% by 2080.
Table 5.
Climate change impact on the annual cooling demand.
The cooling demand is not only affected by climate change but also depends on the building typology. Table 5 shows the annual cooling demands for all building types in TMY and the expected increase in 2071 and 2100. The cooling demand is expected to increase in all building types under the RCP4.5 with a range of 13% to 53% in 2071 and 19% to 67% in 2100. However, some building models are expected to be more affected by climate change than others. Hospital buildings showed the lowest increase in cooling demand by 13% in 2071 and 19% in 2100. On the other hand, medium office buildings reported the highest increase in cooling demand by 53% and 67% in 2071 and 2100, respectively.
The change in cooling demand for the hospital building model is relatively small due to the large internal loads, including hospital equipment and lights that stay constant regardless of the change in the outdoor environment. Furthermore, compared to other buildings, the hospital model has the lowest WWR (12%). The impact of WWR can also be confirmed in high-rise and mid-rise apartment models where they share the same insulation level; however, the increase in cooling demand is higher in high-rise apartments due to larger WWR. Although the large office has the highest WWR (40%), the medium office has a higher increase in cooling demand because the large office model has a lower U-factor for the external wall, which means higher thermal insulation. In other words, the medium office building has low thermal insulation with a large WWR (33%); therefore, it is the most affected building type by climate change.
3.2. Environmental Impact Assessment
The production of electricity through natural gas or solar power contributes to the overall environmental burden in different ways. The effect of using natural gas or photovoltaic (PV) panels is classified into five different impact categories, illustrated in Figure 3. Producing 1 kWh of electricity through natural gas contributes to climate change by 0.619 kg CO2-eq and fossil depletion by 0.254 kg oil-eq. On the other hand, the embodied energy of the PV panels accounts for 0.048 kg CO2-eq and 0.014 kg oil-eq per 1 kWh of produced electricity. As a result, the overall impact (embodied and operational) for climate change and fossil depletion categories could be reduced by 92% and 94%, respectively. The findings are consistent with previous studies that reported a similar value range [74,75,76]. The advantage of solar power over natural gas in mitigating climate change can be much appreciated in Table 6. Table 6 shows the impacts associated with the cooling demand for mid-rise apartments in reference and future climates. Shifting to solar power in 2100 could reduce the annual CO2 emission associated with future cooling demand by almost 87 metric tons of CO2-eq, which is equivalent to CO2 emitted by a typical passenger car driven for about 19 years [77].
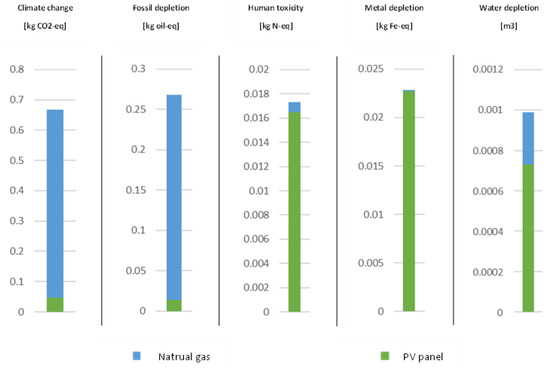
Figure 3.
Impact results for energy production through natural gas and solar power.
Table 6.
The environmental impacts associated with the cooling demand for mid-rise apartments.
Although solar power can enhance the environmental performance in climate change and oil depletion categories, it could increase the risk of human toxicity. The results indicated that the risk of human toxicity considering natural gas as an energy source is 0.000803 kg 1,4-DB eq/kWh and could increase to 0.0165 kg 1,4-DB eq/kWh considering the PV panel. PV panels highly contribute to human toxicity due to their waste at the disposal stage. Based on Qatar General Electricity and Water Corporation (KAHARAMA) specifications, the PV technology used in Qatar is crystalline silicon which has an average lifespan of 25 to 30 years [73,78,79]. After the end life of a PV panel, it is considered electronic waste (e-waste), and it is often disposed of in a landfill or burnt, releasing harmful and carcinogenic elements into the environment [80]. Therefore, it is essential to improve the PV technology to enhance their lifetime and their ability to be recycled. Different studies were conducted to investigate the possible solutions and introduce recycling strategies [78,81,82].
It is clearly observed from Figure 3 that metal depletion and water depletion are expected to increase more by using PV panels compared to natural gas. The impacts on these two categories are attributed to the manufacturing process and production and mining of structural elements of the PV panels, especially metal components. However, the impact on water depletion, even for the PV panel, is relatively small (0.000732 m3/kWh) and consistent with the range reported in other studies from 0.00002 to 0.00109 m3/kWh [83]. On the other hand, the PV panels could have a significant impact on the metal depletion category of 0.0227 kg Fe-eq, whereas using natural gas has an impact of 0.000115 kg Fe-eq. Considering efficient recycling strategies for the main elements can reduce resource depletion [81].
4. Discussion
The study examined the influence of climate change on building cooling demand and the environmental consequences in Qatar. According to the findings, climate change is anticipated to increase yearly cooling demand for all building types. The percentage increase in cooling demand relative to the reference climate varies with building type and has a proportionate connection with time. Due to the difference in design parameters, medium office buildings showed the highest increase in cooling demand, while hospital buildings showed the lowest increase in cooling demand. The study also examined the environmental implications of increased cooling energy usage. Electricity generation from natural gas or solar power both contribute to the total environmental load in various ways. Because the embodied energy of PV panels has a smaller environmental effect compared with natural gas, employing PV panels for electricity production can significantly lessen the overall CO2 emissions and reduce fossil fuel depletion. The production and disposal of PV panels include some potential risks of toxicity. These risks are relatively low and can be managed by proper handling, disposal, and recycling. Nevertheless, the manufacture and disposal of PV panels must be monitored and improved for safety and sustainability developments.
This study used a high-resolution regional climate model to examine the influence of climate change on building cooling demand, which yields a more precise forecast of future energy use in the region. In addition, the environmental impacts were assessed under current and future scenarios, which sheds light on the environmental advantages of the energy transition for decision-makers in Qatar. Nevertheless, there are a few limitations of the study that need to be taken into account. The study mainly looked at the influence of climate change on cooling demand in Qatar and ignored other aspects such as population increase and urbanization. Additionally, while there are several climate change scenarios, this study only looked at one scenario RCP 4.5.
This study opens the door for other researchers to investigate and answer several research questions. as highlighted in the study, mitigation strategies should be investigated to reduce the cooling demand in future years. It would be of great value to investigate the application of different mitigation strategies for buildings in Qatar and to conduct a sensitivity analysis to discover the best combination to mitigate the impact of climate change on the cooling requirements. Moreover, from a technical perspective, the capacity of the existing cooling systems should be studied to ensure that the cooling systems can handle the expected increase in the cooling demand during summer.
5. Conclusions
Building cooling energy is vulnerable to climate change, and it is expected to increase in the future, especially in hot countries. In contrast, the increase in the cooling energy consumption in buildings contributes again to climate change. This study quantified the increase in building cooling demand due to climate change in Qatar and assessed the related environmental impacts. Initially, energy simulations were performed for eight prototypes, building models under baseline and future climate conditions. Future weather data were obtained from high-resolution RCM, considering the emission scenario RCP4.5 for the years 2071 and 2100. Then, LCA was performed to evaluate the environmental burdens associated with energy consumption, considering natural gas and solar power as energy sources. The results showed an increase in the annual cooling demand for all buildings ranging from 13–53% in 2071 and 19–67% in 2100. It was found that the cooling demands for buildings with higher thermal insulation and lower WWR% are less affected by climate change than others.
The LCA results showed that switching to solar power could reduce CO2 emission and fossil depletion significantly, thus breaking the loop between energy consumption and the contribution to climate change. On the other hand, generating electricity through PV panels contributes more than natural gas to human toxicity, metal depletion, and water depletion impact categories. The study highlighted the importance of considering possible climate change scenarios in designing more resilient buildings and reducing their carbon footprint. The findings strongly suggest improving the PV technologies and considering efficient recycling and waste management techniques to reduce the environmental burdens at the end-of-life stage.
Author Contributions
Conceptualization, A.M.K. and S.G.A.-G.; Methodology, A.M.K. and S.G.A.-G.; Software, A.M.K.; Formal analysis, A.M.K.; Investigation, A.M.K., T.A.A.-A. and S.G.A.-G.; Resources, S.G.A.-G.; Data curation, A.M.K.; Writing—original draft preparation, A.M.K.; Writing—review and editing, T.A.A.-A. and S.G.A.-G.; Visualization, A.M.K.; Supervision, S.G.A.-G.; Project administration, S.G.A.-G.; Funding acquisition, S.G.A.-G. All authors have read and agreed to the published version of the manuscript.
Funding
This publication was made possible by NPRP-Standard (NPRP-S) Twelfth (12th) Cycle grant NPRP12S-0212-190073 from the Qatar National Research Fund (a member of Qatar Foundation). The findings herein reflect the work and are solely the responsibility of the authors.
Data Availability Statement
The data presented in this study are available on request from the corresponding author.
Conflicts of Interest
The authors declare no conflict of interest.
References
- Yang, Y.; Javanroodi, K.; Nik, V.M. Climate change and energy performance of european residential building stocks—A comprehensive impact assessment using climate big data from the coordinated regional climate downscaling experiment. Appl. Energy 2021, 298, 117246. [Google Scholar] [CrossRef]
- Andrić, I.; Koc, M.; Al-Ghamdi, S.G. A review of climate change implications for built environment: Impacts, mitigation measures and associated challenges in developed and developing countries. J. Clean. Prod. 2019, 211, 83–102. [Google Scholar] [CrossRef]
- Azimi Fereidani, N.; Rodrigues, E.; Gaspar, A.R. A review of the energy implications of passive building design and active measures under climate change in the Middle East. J. Clean. Prod. 2021, 305, 127152. [Google Scholar] [CrossRef]
- Ciancio, V.; Falasca, S.; Golasi, I.; Curci, G.; Coppi, M.; Salata, F. Influence of input climatic data on simulations of annual energy needs of a building: Energyplus and WRF modeling for a case study in Rome (Italy). Energies 2018, 11, 2835. [Google Scholar] [CrossRef]
- Jandaghian, Z.; Berardi, U. Analysis of the cooling effects of higher albedo surfaces during heat waves coupling the weather research and forecasting model with building energy models. Energy Build. 2020, 207, 109627. [Google Scholar] [CrossRef]
- Tahir, F.; Ajjur, S.B.; Serdar, M.Z.; Al-Humaiqani, M.M.A.; Kim, D.; Al-Thani, S.K.; Al-Ghamdi, S.G. Qatar Climate Change Conference 2021: A Platform for Addressing Key Climate Change Topics Facing Qatar and the World; Al-Ghamdi, S.G., Al-Thani, S.K., Eds.; Hamad bin Khalifa University Press (HBKU Press): Doha, Qatar, 2021. [Google Scholar]
- Andrić, I.; Pina, A.; Ferrão, P.; Fournier, J.; Lacarrière, B.; Le Corre, O. The impact of climate change on building heat demand in different climate types. Energy Build. 2017, 149, 225–234. [Google Scholar] [CrossRef]
- Al Huneidi, D.I.; Tahir, F.; Al-Ghamdi, S.G. Energy modeling and photovoltaics integration as a mitigation measure for climate change impacts on energy demand. Energy Rep. 2022, 8, 166–171. [Google Scholar] [CrossRef]
- Huang, J.; Gurney, K.R. Impact of climate change on U.S. building energy demand: Sensitivity to spatiotemporal scales, balance point temperature, and population distribution. Clim. Change 2016, 137, 171–185. [Google Scholar] [CrossRef]
- Lo Basso, G.; Nastasi, B.; Salata, F.; Golasi, I. Energy retrofitting of residential buildings—How to couple combined heat and power (CHP) and heat pump (HP) for thermal management and off-design operation. Energy Build. 2017, 151, 293–305. [Google Scholar] [CrossRef]
- Zhai, Z.J.; Helman, J.M. Implications of climate changes to building energy and design. Sustain. Cities Soc. 2019, 44, 511–519. [Google Scholar] [CrossRef]
- IPCC. Climate Change 2021: The Physical Science Basis. Contribution of Working Group I to the Sixth Assessment Report of the Intergovernmental Panel on Climate Change; IPCC: Geneva, Switzerland, 2021.
- Santamouris, M. Cooling the buildings—Past, present and future. Energy Build. 2016, 128, 617–638. [Google Scholar] [CrossRef]
- Wang, H.; Chen, Q. Impact of climate change heating and cooling energy use in buildings in the United States. Energy Build. 2014, 82, 428–436. [Google Scholar] [CrossRef]
- Levesque, A.; Pietzcker, R.C.; Baumstark, L.; De Stercke, S.; Grübler, A.; Luderer, G. How much energy will buildings consume in 2100? A global perspective within a scenario framework. Energy 2018, 148, 514–527. [Google Scholar] [CrossRef]
- Biardeau, L.T.; Davis, L.W.; Gertler, P.; Wolfram, C. Heat exposure and global air conditioning. Nat. Sustain. 2020, 3, 25–28. [Google Scholar] [CrossRef]
- Pérez-Andreu, V.; Aparicio-Fernández, C.; Martínez-Ibernón, A.; Vivancos, J.L. Impact of climate change on heating and cooling energy demand in a residential building in a Mediterranean climate. Energy 2018, 165, 63–74. [Google Scholar] [CrossRef]
- Gi, K.; Sano, F.; Hayashi, A.; Tomoda, T.; Akimoto, K. A global analysis of residential heating and cooling service demand and cost-effective energy consumption under different climate change scenarios up to 2050. Mitig. Adapt. Strateg. Glob. Chang. 2018, 23, 51–79. [Google Scholar] [CrossRef]
- Shen, P. Impacts of climate change on U.S. building energy use by using downscaled hourly future weather data. Energy Build. 2017, 134, 61–70. [Google Scholar] [CrossRef]
- Jiang, A.; Zhu, Y.; Elsafty, A.; Tumeo, M. Effects of global climate change on building energy consumption and its implications in Florida. Int. J. Constr. Educ. Res. 2018, 14, 22–45. [Google Scholar] [CrossRef]
- Berardi, U.; Jafarpur, P. Assessing the impact of climate change on building heating and cooling energy demand in Canada. Renew. Sustain. Energy Rev. 2020, 121, 109681. [Google Scholar] [CrossRef]
- Jafarpur, P.; Berardi, U. Effects of climate changes on building energy demand and thermal comfort in Canadian office buildings adopting different temperature setpoints. J. Build. Eng. 2021, 42, 102725. [Google Scholar] [CrossRef]
- Bamdad, K.; Cholette, M.E.; Omrani, S.; Bell, J. Future energy-optimised buildings—Addressing the impact of climate change on buildings. Energy Build. 2021, 231, 110610. [Google Scholar] [CrossRef]
- Invidiata, A.; Ghisi, E. Impact of climate change on heating and cooling energy demand in houses in Brazil. Energy Build. 2016, 130, 20–32. [Google Scholar] [CrossRef]
- Liu, S.; Kwok, Y.T.; Lau, K.K.L.; Tong, H.W.; Chan, P.W.; NG, E. Development and application of future design weather data for evaluating the building thermal-energy performance in subtropical Hong Kong. Energy Build. 2020, 209, 109696. [Google Scholar] [CrossRef]
- Wang, Y.; Lin, H.; Wang, W.; Liu, Y.; Wennersten, R.; Sun, Q. Impacts of climate change on the cooling loads of residential buildings differences between occupants with different age. Energy Procedia 2017, 142, 2677–2682. [Google Scholar] [CrossRef]
- Shibuya, T.; Croxford, B. The effect of climate change on office building energy consumption in Japan. Energy Build. 2016, 117, 149–159. [Google Scholar] [CrossRef]
- Ciancio, V.; Salata, F.; Falasca, S.; Curci, G.; Golasi, I.; de Wilde, P. Energy demands of buildings in the framework of climate change: An investigation across Europe. Sustain. Cities Soc. 2020, 60, 102213. [Google Scholar] [CrossRef]
- Berger, T.; Amann, C.; Formayer, H.; Korjenic, A.; Pospischal, B.; Neururer, C.; Smutny, R. Impacts of climate change upon cooling and heating energy demand of office buildings in Vienna, Austria. Energy Build. 2014, 80, 517–530. [Google Scholar] [CrossRef]
- Moazami, A.; Nik, V.M.; Carlucci, S.; Geving, S. Impacts of future weather data typology on building energy performance—Investigating long-term patterns of climate change and extreme weather conditions. Appl. Energy 2019, 238, 696–720. [Google Scholar] [CrossRef]
- Frank, T. Climate change impacts on building heating and cooling energy demand in Switzerland. Energy Build. 2005, 37, 1175–1185. [Google Scholar] [CrossRef]
- Khourchid, A.M.; Ajjur, S.B.; Al-Ghamdi, S.G. Building cooling requirements under climate change scenarios: Impact, mitigation strategies, and future directions. Buildings 2022, 12, 1519. [Google Scholar] [CrossRef]
- Rashid, M.; Ara, D. Tectonics in the gulf architecture: ‘Modernity of tradition’ in buildings. In Building in Hot and Humid Regions; Springer: Singapore, 2020; pp. 137–150. [Google Scholar] [CrossRef]
- Kharseh, M.; Al-Khawaja, M. Retrofitting measures for reducing buildings cooling requirements in cooling-dominated environment: Residential house. Appl. Therm. Eng. 2016, 98, 352–356. [Google Scholar] [CrossRef]
- Bayram, I.S.; Saffouri, F.; Koc, M. Generation, analysis, and applications of high resolution electricity load profiles in Qatar. J. Clean. Prod. 2018, 183, 527–543. [Google Scholar] [CrossRef]
- Ameer, B.; Krarti, M. Impact of subsidization on high energy performance designs for Kuwaiti residential buildings. Energy Build. 2016, 116, 249–262. [Google Scholar] [CrossRef]
- Radhi, H. Evaluating the potential impact of global warming on the UAE residential buildings—A contribution to reduce the CO2 emissions. Build. Environ. 2009, 44, 2451–2462. [Google Scholar] [CrossRef]
- Andric, I.; Al-Ghamdi, S.G. Climate change implications for environmental performance of residential building energy use: The case of Qatar. Energy Rep. 2020, 6, 587–592. [Google Scholar] [CrossRef]
- Ali, K.A.; Ahmad, M.I.; Yusup, Y. Issues, impacts, and mitigations of carbon dioxide emissions in the building sector. Sustainability 2020, 12, 7427. [Google Scholar] [CrossRef]
- Allacker, K.; Castellani, V.; Baldinelli, G.; Bianchi, F.; Baldassarri, C.; Sala, S. Energy simulation and LCA for macro-scale analysis of eco-innovations in the housing stock. Int. J. Life Cycle Assess. 2019, 24, 989–1008. [Google Scholar] [CrossRef]
- Junnila, S.; Horvath, A.; Guggemos, A.A. Life-cycle assessment of office buildings in Europe and the United States. J. Infrastruct. Syst. 2006, 12, 10–17. [Google Scholar] [CrossRef]
- Ortiz, O.; Castells, F.; Sonnemann, G. Sustainability in the construction industry: A review of recent developments based on LCA. Constr. Build. Mater. 2009, 23, 28–39. [Google Scholar] [CrossRef]
- Osman, A.; Ries, R. Life-cycle impact analysis of energy systems for buildings. J. Infrastruct. Syst. 2004, 10, 87–97. [Google Scholar] [CrossRef]
- Pushkar, S.; Yezioro, A. Life cycle assessment meeting energy standard performance: An office building case study. Buildings 2022, 12, 157. [Google Scholar] [CrossRef]
- Passer, A.; Ouellet-Plamondon, C.; Kenneally, P.; John, V.; Habert, G. The impact of future scenarios on building refurbishment strategies towards plus energy buildings. Energy Build. 2016, 124, 153–163. [Google Scholar] [CrossRef]
- Greenwood, D.; Walker, S.; Wade, N.; Munoz-Vaca, S.; Crossland, A.; Patsios, C. Integration of high penetrations of intermittent renewable generation in future electricity networks using storage. In Future Energy Improved, Sustainable and Clean Options for our Planet; Elsevier: Amsterdam, The Netherlands, 2020; pp. 649–668. [Google Scholar] [CrossRef]
- Rezaie, B.; Esmailzadeh, E.; Dincer, I. Renewable energy options for buildings: Case studies. Energy Build. 2011, 43, 56–65. [Google Scholar] [CrossRef]
- Tahir, F.; Baloch, A.A.B.; Al-Ghamdi, S.G. Impact of climate change on solar monofacial and bifacial photovoltaics (PV) potential in Qatar. Energy Rep. 2022, 8, 518–522. [Google Scholar] [CrossRef]
- Imteyaz, B.; Lawal, D.U.; Tahir, F.; Rehman, S. Prospects of large-scale photovoltaic-based power plants in the Kingdom of Saudi Arabia. Eng. Rep. 2021, 3, e12398. [Google Scholar] [CrossRef]
- D’Agostino, D.; Parker, D.; Epifani, I.; Crawley, D.; Lawrie, L. How will future climate impact the design and performance of nearly zero energy buildings (NZEBs)? Energy 2022, 240, 122479. [Google Scholar] [CrossRef]
- Bamdad, K.; Matour, S.; Izadyar, N.; Omrani, S. Impact of climate change on energy saving potentials of natural ventilation and ceiling fans in mixed-mode buildings. Build. Environ. 2022, 209, 108662. [Google Scholar] [CrossRef]
- Steffen, P. The effect of local climate data and climate change scenarios on the thermal design of office buildings in Denmark. In Proceedings of the International Conference Organised by IBPSA—Nordic, Oslo, Norway, 13–14 October 2020. [Google Scholar]
- Farah, S.; Whaley, D.; Saman, W.; Boland, J. Integrating climate change into meteorological weather data for building energy simulation. Energy Build. 2019, 183, 749–760. [Google Scholar] [CrossRef]
- Flores-Larsen, S.; Filippín, C.; Barea, G. Impact of climate change on energy use and bioclimatic design of residential buildings in the 21st century in Argentina. Energy Build. 2019, 184, 216–229. [Google Scholar] [CrossRef]
- Cellura, M.; Guarino, F.; Longo, S.; Tumminia, G. Climate change and the building sector: Modelling and energy implications to an office building in Southern Europe. Energy Sustain. Dev. 2018, 45, 46–65. [Google Scholar] [CrossRef]
- Huang, K.T.; Hwang, R.L. Future trends of residential building cooling energy and passive adaptation measures to counteract climate change: The case of Taiwan. Appl. Energy 2016, 184, 1230–1240. [Google Scholar] [CrossRef]
- Xu, P.; Huang, Y.J.; Miller, N.; Schlegel, N.; Shen, P. Impacts of climate change on building heating and cooling energy patterns in California. Energy 2012, 44, 792–804. [Google Scholar] [CrossRef]
- Asimakopoulos, D.A.; Santamouris, M.; Farrou, I.; Laskari, M.; Saliari, M.; Zanis, G.; Giannakidis, G.; Tigas, K.; Kapsomenakis, J.; Douvis, C.; et al. Modelling the energy demand projection of the building sector in Greece in the 21st century. Energy Build. 2012, 49, 488–498. [Google Scholar] [CrossRef]
- Wan, K.K.W.; Li, D.H.W.; Pan, W.; Lam, J.C. Impact of climate change on building energy use in different climate zones and mitigation and adaptation implications. Appl. Energy 2012, 97, 274–282. [Google Scholar] [CrossRef]
- Chan, A.L.S. Developing future hourly weather files for studying the impact of climate change on building energy performance in Hong Kong. Energy Build. 2011, 43, 2860–2868. [Google Scholar] [CrossRef]
- Olonscheck, M.; Holsten, A.; Kropp, J.P. Heating and cooling energy demand and related emissions of the german residential building stock under climate change. Energy Policy 2011, 39, 4795–4806. [Google Scholar] [CrossRef]
- Wang, X.; Chen, D.; Ren, Z. Assessment of climate change impact on residential building heating and cooling energy requirement in Australia. Build. Environ. 2010, 45, 1663–1682. [Google Scholar] [CrossRef]
- EnergyPlus. Available online: https://energyplus.net/ (accessed on 22 March 2022).
- U.S. Department of Energy Commercial Building Prototype Models. Available online: https://www.energycodes.gov/prototype-building-models (accessed on 22 March 2022).
- NREL. Weather Data. Available online: https://energyplus.net/weather (accessed on 22 March 2022).
- Hall, I.J.; Prairie, R.R.; Anderson, H.E.; Boes, E.C. Generation of a typical meteorological year. In Proceedings of the Analysis for Solar Heating and Cooling, San Diego, CA, USA, 27–29 June 1978. [Google Scholar]
- Pal, J.S.; Eltahir, E.A.B. Future temperature in Southwest Asia projected to exceed a threshold for human adaptability. Nat. Clim. Chang. 2016, 6, 197–200. [Google Scholar] [CrossRef]
- IPCC. Climate Change 2014: Synthesis Report. Contribution of Working Groups I, II and III to the Fifth Assessment Report of the Intergovernmental Panel on Climate Change; IPCC: Geneva, Switzerland, 2014.
- Sphera. What Is GaBi Software? Available online: https://gabi.sphera.com/international/overview/what-is-gabi-software/ (accessed on 5 April 2022).
- ISO 14040; Environmental Management—Life Cycle Assessment—Principles and Framework. International Organization for Standardization: Geneva, Switzerland, 2006. Available online: https://www.iso.org/standard/37456.html (accessed on 15 August 2022).
- ISO 14044; Environmental Management—Life Cycle Assessment—Requirements and Guidelines. International Organization for Standardization: Geneva, Switzerland, 2006. Available online: https://www.iso.org/standard/38498.html (accessed on 15 August 2022).
- Sphera. GaBi Comprehensive Life Cycle Assessment (LCA) Databases with over 15,000 Annually Updated Datasets. Available online: https://sphera.com/product-sustainability-gabi-data-search/ (accessed on 1 January 2023).
- Kaharama. Conservation and Energy Efficiency Department Guideline Specifications for Standalone Solar PV Systems; Kaharama: Doha, Qatar, 2020. [Google Scholar]
- Atilgan, B.; Azapagic, A. An integrated life cycle sustainability assessment of electricity generation in Turkey. Energy Policy 2016, 93, 168–186. [Google Scholar] [CrossRef]
- Šerešová, M.; Štefanica, J.; Vitvarová, M.; Zakuciová, K.; Wolf, P.; Kočí, V. Life cycle performance of various energy sources used in the Czech Republic. Energies 2020, 13, 5833. [Google Scholar] [CrossRef]
- Turconi, R.; Boldrin, A.; Astrup, T. Life cycle assessment (LCA) of electricity generation technologies: Overview, comparability and limitations. Renew. Sustain. Energy Rev. 2013, 28, 555–565. [Google Scholar] [CrossRef]
- EPA. Greenhouse Gas Emissions from a Typical Passenger Vehicle. Available online: https://www.epa.gov/greenvehicles/greenhouse-gas-emissions-typical-passenger-vehicle (accessed on 15 April 2022).
- Daljit Singh, J.K.; Molinari, G.; Bui, J.; Soltani, B.; Rajarathnam, G.P.; Abbas, A. Life cycle analysis of disposed and recycled end-of-life photovoltaic panels in Australia. Sustainability 2021, 13, 11025. [Google Scholar] [CrossRef]
- Giacchetta, G.; Leporini, M.; Marchetti, B. Evaluation of the environmental benefits of new high value process for the management of the end of life of thin film photovoltaic modules. J. Clean. Prod. 2013, 51, 214–224. [Google Scholar] [CrossRef]
- Dwivedy, M.; Suchde, P.; Mittal, R.K. Modeling and assessment of e-waste take-back strategies in India. Resour. Conserv. Recycl. 2015, 96, 11–18. [Google Scholar] [CrossRef]
- Ardente, F.; Latunussa, C.E.L.; Blengini, G.A. Resource efficient recovery of critical and precious metals from waste silicon PV panel recycling. Waste Manag. 2019, 91, 156–167. [Google Scholar] [CrossRef]
- Kang, S.; Yoo, S.; Lee, J.; Boo, B.; Ryu, H. Experimental investigations for recycling of silicon and glass from waste photovoltaic modules. Renew. Energy 2012, 47, 152–159. [Google Scholar] [CrossRef]
- Mekonnen, M.M.; Gerbens-Leenes, P.W.; Hoekstra, A.Y. The consumptive water footprint of electricity and heat: A global assessment. Environ. Sci. Water Res. Technol. 2015, 1, 285–297. [Google Scholar] [CrossRef]
Disclaimer/Publisher’s Note: The statements, opinions and data contained in all publications are solely those of the individual author(s) and contributor(s) and not of MDPI and/or the editor(s). MDPI and/or the editor(s) disclaim responsibility for any injury to people or property resulting from any ideas, methods, instructions or products referred to in the content. |
© 2023 by the authors. Licensee MDPI, Basel, Switzerland. This article is an open access article distributed under the terms and conditions of the Creative Commons Attribution (CC BY) license (https://creativecommons.org/licenses/by/4.0/).