Abstract
This study investigates the thermal performance of the ventilated mask wall used in the low-income neo-vernacular dwellings designed by André Ravéreau to cope with the warm desert climate conditions of M’zab Valley, Ghardaia, in southern Algeria. This device is a ventilated façade provided with an opaque external massive cladding. It is designed to be particularly efficient in hot climates, functioning simultaneously as a brise-soleil and a ventilated façade, compared with conventional façade systems. Based on a typical experiment conducted during the summertime (12–14 August), a residential unit in Sidi Abbaz selected as a case study was modeled and calibrated using EnergyPlus (v8.4) software, and then a dynamic simulation was performed in order to assess the efficiency of the ventilated mask wall as a cooling strategy. By means of the validated thermal model, various alternatives for the façade materials were investigated, and the thermal behavior of the current ventilated mask wall was compared with a 45 cm thick limestone façade wall, and a 30 cm thick hollow clay brick wall under the same conditions. Countless benefits were achieved by the application of the mask wall system, including a stable and less fluctuant inner surface temperature, and a reduction in the incoming summer heat flux. The improvements performed, in particular the time lag of 12 h and the related decrement factor of 0.28 indicate the effectiveness of this wall system, which enabled radiant temperature drops of more than 10 °C, and an air temperature decrease of about 6 °C, during the summer sunniest hours. The results demonstrate that this solution is suitable for buildings design applications to meet the objective of low-energy demand in warm desert climates.
1. Introduction
In recent decades, the building sector is being pointed out as responsible for countless environmental damages on a global scale including: global warming, environmental impact, pollution, and the depletion of natural resources. According to the International Energy Agency, this sector consumes 36% of the worldwide global energy, whereas 22% of the total energy use is attributed to the residential buildings [1]. Furthermore, the building sector accounts for 39% of CO2 emissions, of which 17% are primarily released by residential buildings [1].
Due to population growth and extremely fast urbanization, energy consumption and related CO2 emissions raised by 7% and 9%, respectively, between 2010 and 2019. This increase is considered faster than demographic growth (+1.1%) [2]. Indeed, CO2 emissions reached 37.9 billion tons in 2018, with an average of 5.0 tCO2/capita [2]. Heating, ventilation, and air conditioning systems (HVAC) account for 60% of the total residential energy usage nowadays [3]. These systems account for 80% of the CO2 emissions generated by this type of building [4]. This percentage can be increased in arid climates. In Algeria, the residential sector of the aforementioned climate consumes more than 35% of total energy [5,6], and air-conditioning alone contributes to 40% of Algeria’s annual energy consumption [7], a figure that is expected to double by 2050.
Faced with these issues, various green objectives have recently been set, including lowering CO2 emissions by 40% by 2030 and reaching 100% zero net energy by 2050 [8]. Summer thermal comfort is considered a key contributor to achieving these goals. The vision of reconciling this parameter has favored passive solutions and strategies that are the outcome of climate adaptation and have formed the basis of all norms and standards. These passive solutions are summed up in the building’s features, including its position, geometry, shape, orientation, architectural design, and construction materials [9,10,11].
Among these solutions, natural ventilation is the most adequate bioclimatic solution to reduce thermal discomfort in hot climates [12,13,14]. This effective passive cooling technique exploits the pressure differential between the inside of a building and the outdoor environment to transport air from a high-pressure to a low-pressure zone. In arid climates with high thermal amplitudes, night ventilation may reduce the temperature of the building envelope [15,16,17], allowing for a good thermal decrement factor and phase shift time [3,18]. The efficiency of this passive technique can be enhanced by the thermal inertia and insulation of the envelope [19,20,21].
Exizidou et al. [16] investigated the effect of ventilation on the thermal comfort of vernacular dwellings under the climatic conditions of Nicosia, Cyprus, and found that this passive technique enables the optimization of comfort degree up to 26%. The assessment of the ventilation effect on the energy efficiency of adobe dwellings revealed that this solution decreases the cooling energy needs by 27% while maintaining an ambient temperature that does not exceed 25 °C [20]. Blondeau et al. [22] reported that for a ventilation intensity of 8ACH, the cooling loads could be reduced by up to 56%. Geros et al. [23] revealed that 30ACH could reduce energy requirements by 71%.
Indeed, natural ventilation can be provided by several alternatives, including the double skin façade (DSF). This alternative, commonly called ventilated façade, airflow window, or twin skin [24], provides adequate thermal insulation while simultaneously maintaining air circulation via the chimney effect, allowing the facade and hence the indoor environment to be cooled, resulting in lower air-conditioning needs. Ballestini et al. [25] achieved energy savings of about 12% per year by adding a DSF to a historical industrial building. Another study concluded that using a DSF can save up to 299.279 kWh of energy in an office building in Algiers’ Mediterranean climate, reducing energy consumption by 53.5% during hot, dry summers [26]. According to research by Aruta et al. [27], the implementation of a double-skin façade for retrofitting an office building can achieve energy saving of 37% and 3%, respectively, in the cold and warm seasons of a Mediterranean climate.
The effectiveness of a DSF depends on several factors, including orientation, solar radiation level, shading device use, window-to-wall ratio, wind speed, cavity width, glazing type, and the opening-to-glazing ratio [28,29,30,31,32,33,34]. According to the study by Alibaba et al. [24], which investigated the impact of the DSF on the thermal comfort of administrative buildings in a warm climate, this alternative provides a pleasant environment (PMV = 0.5, and PPD = 50%) while reducing energy consumption by up to 25%. A cavity width of 30 cm yielded the best results. However, the research by Radhi et al. [35] compared the efficiency of a DSF with different cavity widths (50, 70, 100, 120, 150 cm) and reported that a cavity width between 70 and 120 cm could provide a balance between solar gain and heat transfer.
Qahtan [36] investigated the double skin façade of a certified energy-efficient office building in Kuala Lumpur, Malaysia, and discovered that direct solar radiation and glazing surfaces affect increasing indoor air temperature during the summer, with shading devices essential for the western facade. The analysis of a DSF equipped with a movable shading device, under the warm climate of Italy [37], concluded that during summer, the solar heat absorbed by the external wall has no significant impact on the inner skin and the indoor air temperature; this can reduce the building cooling loads.
The assessment of the effectiveness of the DSF on an office building in Iran’s hot, arid climate revealed that night ventilation and the installation of shading devices are critical for reducing cooling loads; the temperature in the cavity of the DSF was higher than the outdoor air temperature during the night due to the greenhouse effect [38]. Another study reported that if natural cooling strategies are used, the greenhouse effect is favored in double-skin south-oriented façades [28]. A study conducted under a Mediterranean climate [39] concluded that in summer, the air temperature of a double-skin cavity, oriented west and exposed to high solar radiation, remains higher than the outdoor air temperature. The difference is estimated to be 2 °C and 10 °C during the night and the daytime, respectively.
According to the reported framework, it appears that a great deal of interest has been devoted to DSFs due to the advantages attributed to this facade design feature in terms of energy efficiency especially in temperate climatic zones. Furthermore, if it is assumed that a DSF corresponds to an outer glazed layer, an intermediate gap, and an inner enclosure, most studies that support the energy efficiency potential of DSFs have overlooked their disadvantages relating to overheating during the hot season. Thus, research on the thermal behavior and performance of a DSF building located in a hot region is still lacking. Moreover, the case studies focused on contemporary buildings did not highlight the advantage of using traditional building materials instead of conventional brick and concrete walls.
The present research attempts to fill such a gap in knowledge by investigating the thermal performance of an innovative DSF used in a residential building located in a Saharan region. The DSF examined is made with breezeblocks (internal layer) and hollow clay bricks (external layer) with an air cavity between the two walls. Compared with a conventional facade system, this ventilated enclosure system is expected to be particularly efficient under hot climatic conditions, considering it simultaneously works as a brise-soleil and a DSF. In short, this technique based on the principle of combining solar shading and thermal insulation while simultaneously maintaining air circulation through the chimney effect, should significantly minimize overheating and, therefore, decrease the energy cooling demand.
To learn more about the thermal performance of this device, a study was conducted on the low-income neo-vernacular dwellings designed by Ravereau in Sidi Abbaz (Ghardaia) to cope with the warm desert climate conditions of the M’Zab valley in southern Algeria. The Sidi Abbaz dwellings are distinguished by their use of a particular enclosure system that can be assimilated to a ventilated double-layer wall provided with an opaque external massive cladding known as “mask wall”. The study aims to quantitatively assess the thermal behavior of the mask wall in real conditions by investigation an existent building. For this purpose, field research was conducted in a naturally ventilated residential building located in Sidi Abbaz. The monitored building used as a case study was modeled and calibrated using EnergyPlus (v8.4) software. A dynamic simulation was then performed in order to assess the cooling efficiency of the ventilated mask wall by considering different alternatives for the materials of the boundary surfaces.
In the sequel, the case study building and the methodology are described first. The results and discussion are presented in the third section. Finally, conclusions are given in the last section of the paper. The findings of this investigation will enhance the efficiency of the DSF system as a cooling design strategy for future applications in warm desert climates.
2. Reference Dwellings Presentation
2.1. Site Location Description and Climatic Characteristics
The studied low-income neo-vernacular dwellings designed by Ravereau are located in the Saharan city of Ghardaia, in Sidi Abbaz, to be precise. Based on the Koppen-Geiger climate classification, Ghardaia’s climate falls in zone BWh, thus, it is characterized by warm desert climate [40] (Figure 1). This climate is distinguished by a continuous drought, evaporation that is greater than precipitation, a high daily thermal amplitude (with an annual average exceeding 18 °C), and a constant and often strong wind.
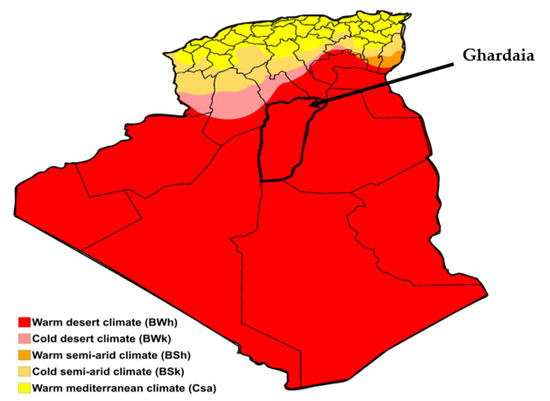
Figure 1.
Map of Algeria showing the location of Ghardaia and the main climatic zones according to Koppen-Geiger climate classification [40].
According to the meteorological station data of Ghardaia (10 years), the mean monthly temperature was found to vary between 11 °C in January and 34 °C in July. The thermal amplitude was 23 °C throughout the year. Additionally, the monthly solar radiations average varied from 3.2 to 7.0 kWh/m2. The highest monthly average was recorded in June, and the lowest solar radiation occurred in December. The average annual humidity was 38%. It ranged from 20% to 55%, recorded in July and December, respectively (Table 1). In these severe climatic conditions, the hot season is quite lengthy and occurs from June to October.

Table 1.
Monthly dry bulb temperature, solar radiation, and relative humidity, average 10 years.
However, designing energy-efficient buildings under the desert climate of Ghardaia must achieve summer-acceptable indoor conditions and conform to the requirements of ASHRAE standard 55 (Equations (1) and (2)) [41], as summarized in Table 2. This comfort range is defined by the highest monthly average temperature (tpma(out)) [41].
Table 2.
The summer indoor conditions recommended according to ASHRAE 55 [41].
Upper 80% acceptability limit (°C) = 0.31 tpma (out) + 21.3
Lower 80% acceptability limit (°C) = 0.31 tpma (out) + 14.3
2.2. Case Study Building
The case study building is a low-income house located in Sidi Abbaz at the east of Ghardaia (southern Algeria). It is part of the so-called Sidi Abbaz housing project (260 individual dwellings), built in 1976 in the context of ERSAURE (Saharan Regional Establishment of Architecture, Urbanism, and Environment). The housing project was designed by the renowned French architect André Ravereau (1919–2017) who was awarded by the Algerian National Order of Merit in 2012 for his contributions to the valorization of the built heritage [42,43].
This residential project is located in the M’Zab valley, at the foot of a rocky hill, with a panoramic view of the historic Ksar of Beni Isguen (a UNESCO World Heritage Site) and the palm grove. It consists of nineteen (19) dwellings designed according to a neo-vernacular approach (vernacular architecture being a contemporary production process) [44,45]. The housing settlement was designed according to cultural, social, and physical local context; as such, it embodies various climatic passive design strategies inspired from vernacular architecture. In this regard, the compactness of the urban configuration intended to limit the thermal exchanges with the external environment while ensuring protection against the intense solar radiation and dominant winds (narrow alleys), favoring natural ventilation, and preserving the intimacy of the inhabitants (Figure 2).
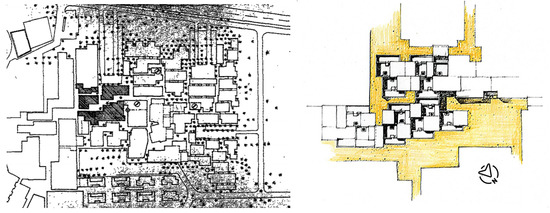
Figure 2.
Site location of Sidi Abbaz housing project (left) and the dwellings settlement (right) [44,46].
The Sidi Abbaz neo-vernacular dwellings are designed by referring to the Mozabite traditions, which are primarily influenced by climate, religion, and cultural constraints. The design of these houses incorporates the Mozabite vernacular architecture typology based on the dialectic of interior volumes and habitable terraces. Moreover, the housing units are oriented along a southeast axis that forms a 20-degree angle with the north–south axis (an orientation considered adequate for the climate of Ghardaia) [44,47]. They are characterized by their introversion and are developed on a rectangular plan with two stories (Figure 3).
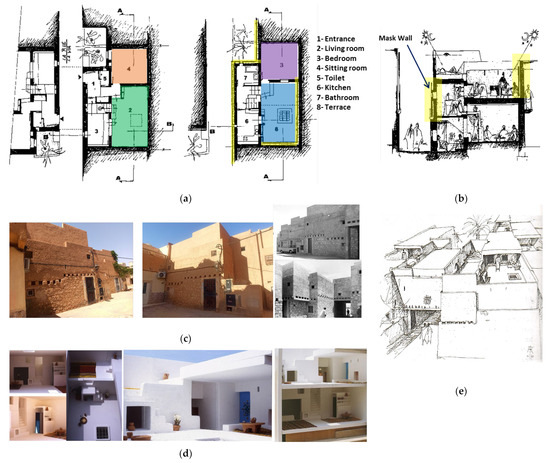
Figure 3.
Plans, section and views on Sidi Abbaz’s neo-vernacular dwelling: (a) Ground floor plan (left) and first-floor plan (right) showing the monitored rooms; (b) Section B-B showing the mask wall; (c) exterior views of the dwelling; (d) interior views on a small scale model of the dwelling; (e) Ravereau’s freehand sketching showing a general view on the terraces and a covered alleyway [44,47].
A chicane entrance (Taskift) marks the dwelling (Figure 3). The latter comprises a small L-shaped corridor that opens into a living room (Amasn’tidar) and gives access to a sitting room (Tizifri), a toilet for the male guest, and a small bedroom (Tazka) (Figure 3) [48]. A terrace (Stah) can be found on the upper level, as well as a kitchen located at mid-level between the bedroom and the terrace (which serves both the ground and first floors), and a bathroom (Figure 3) [49]. Indeed, this configuration provides visual privacy by preventing prying eyes from penetrating the filter space known as Taskift. This intimacy and privacy principle are also reinforced by the habitat’s introversion through the opening of its rooms on the patio (in the ceiling of which a rectangular opening called Chebek, ensuring ventilation and lighting, is pierced), the height of construction (7.2 m), and the limitation of the window size (1 m2) [49].
Furthermore, the Sidi Abbaz dwellings are distinguished by their use of particular external walls that can be assimilated to ventilated facades provided with an opaque external massive cladding (known as “mask walls”). The base of the façade walls is made of quarry-extracted limestone, whereas the upper floor walls are doubled with a massive exterior cladding fitted with openings at the top and bottom and built from the outside to the inside surface, of hollow clay bricks of 5 cm and breezeblocks of 20 cm (Figure 4). This masonry is finished with Timchent (a lime–sand-based plaster whipped with date bunches) [44].
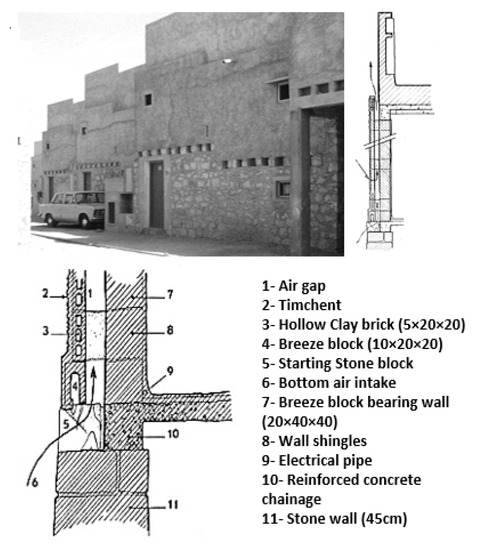
Figure 4.
The mask wall: view and section showing constructive details (layers and materials) [44,47].
As previously stated, this wall system consists of an opaque external cladding that functions as a brise-soleil to impede direct sunlight from penetrating the building and reduce the amount of heat that is absorbed through the façade. The vented cavity underneath the cladding permits air movement and convection that cool the external wall surface and lessen heat transfer to the building’s interior. It is noteworthy that while certain ventilated facade systems introduce fresh air into a building through the cavity for ventilation purposes, the ventilation in the ventilated mask wall system is exclusively used to refresh the internal wall and does not supply fresh air for indoor air quality.
The floor structure is made of light steel beams covered with prefabricated cement pavers and a layer of clay coated with plaster. The floor is finished with locally manufactured tile. Doors and windows are made of locally produced wood. According to the available documentation, thermal properties of the materials used in the building envelope components are given in Table 3.
Table 3.
Thermal properties of the building’s envelope components [50,51].
3. Materials and Methods
3.1. In Situ Measurement Method and Instrumentation
To conduct a quantitative assessment on the impact of the mask wall on the indoor thermal conditions, an in situ measurement campaign was carried out on the neo-vernacular dwelling from 12 to 14 August 2022. The outdoor air temperatures during the month in question did not exhibit substantial variations, as indicated by the meteorological data from Ghardaia, thereby maintaining relatively constant environmental conditions over time (Figure 5).
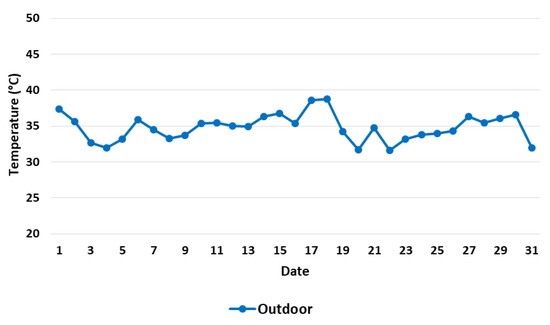
Figure 5.
Daily average air temperature of August 2022.
The case study was monitored using the Misol HP3001 data logger wireless weather station (5 sensors) (Figure 6), with temperature and relative humidity accuracy of 1 °C and 5%, respectively, and a Mastek IR01B infrared thermometer (Figure 6) with an accuracy of 2 °C (Table 4). The variables monitored were air temperatures (outdoor and indoor), relative humidity, and the surface temperatures of the building envelope.
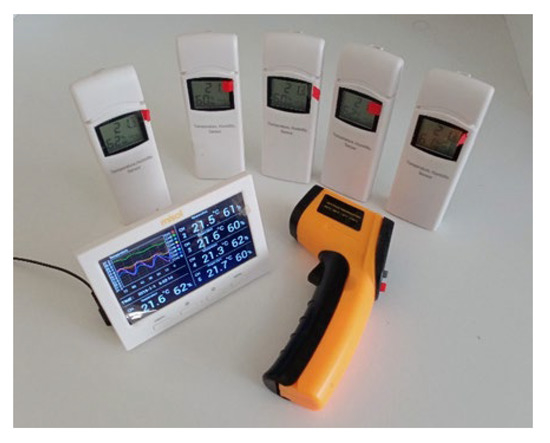
Figure 6.
Instruments of measurement.
Table 4.
Instrumentation range and accuracy.
The field measurements were conducted in two ground-floor rooms, namely the sitting room (8.9 m2) and the living room (11.7 m2), as well as the first-floor bedroom (8.9 m2) and terrace (11.7 m2), as illustrated in Figure 7 and Table 5. It is noteworthy that the mask wall is exclusively implemented in the upper rooms, with the first-floor bedroom serving as a suitable location for examining its thermal behavior and evaluating its effectiveness as a cooling strategy. Moreover, the study intends to compare the thermal performance of the current mask wall with alternative material configurations and boundary surface solutions. The sitting room and the first-floor bedroom, which share similar characteristics, provide an opportunity for a comparative analysis of their thermal performance, as depicted in Figure 7.
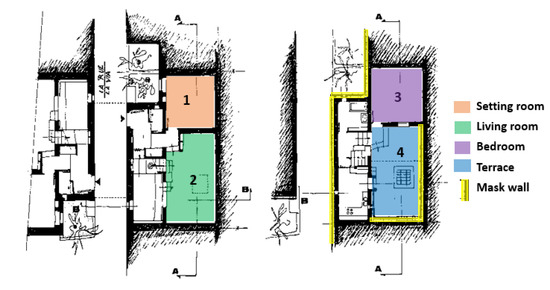
Figure 7.
The monitored rooms: sitting room (1) and the living room (2) located on the ground floor (left); the bedroom (3) and the terrace (4) located in the first floor (right). The mask wall covers partially the bedroom façade wall (8.6% of the total envelope surface area) [44,47].
Table 5.
Main characteristics of the monitored rooms.
The two rooms under consideration are superimposed and share several similarities regarding their surface area, ceiling height, and openings. However, their envelope properties differ significantly; the bedroom façade incorporates a mask wall, it is located on the upper floor of the building, and therefore has a high shape factor of about 0.98 inducing stronger thermal exchanges. Conversely, the sitting room is situated on the ground floor and has a single façade consisting of a 45 cm thick limestone-bearing wall. Although, its shape factor is lower (0.20) but it does not feature the mask wall (Table 5).
During the experimental survey, the sensors were placed on a table 1.0 m above the floor and in the center of the monitored space. The position of the shadow has been considered when using the sensors on the terrace. Precisely, the measurement tool was placed in a shaded area, away from sunlight throughout the day; it was installed at 1.0 m above the floor, 0.4 m from the wall separating the bedroom and the terrace, and 0.2 m from the east-southern wall of the terrace. Their readings were recorded at one-hour intervals for a forty-eight-hour duration. The manual readings of the infrared thermometer were recorded at two-hour intervals. During recording of measurements, the dwelling was not occupied, so no heat source was considered. Moreover, the building was naturally ventilated (doors and windows were kept open); the air conditioners were switched off. The outdoor air temperatures were obtained from the meteorological station of Ghardaia.
3.2. Thermal Model and Numerical Simulation Settings
To assess the thermal performance of the ventilated mask wall as a cooling design strategy, a dynamic simulation was performed. The building used as a case study was modeled under EnergyPlus (v8.4) software (Figure 8).
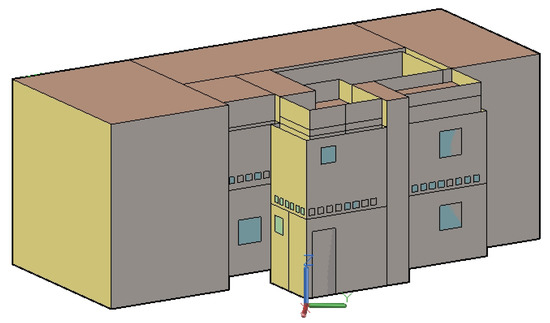
Figure 8.
Simulation model of the base case dwelling.
The most relevant data considered to carry out the dynamic simulation for the base case dwelling were the building geometry description, the weather data file with meteorological data referring to the Ghardaia climate, the hygrothermal properties of the envelope, and the definition of schedules for the ventilation systems, including the windows opening handling, occupation, lighting, and shading. In this regard, the thermal model was assumed to be unoccupied (no internal gain loads due to occupancy). However, natural ventilation was considered (doors and windows were completely open). No mechanical cooling system is proposed. The weather data used (Epw format) was generated by the Meteonorm tool v7.3.
The simulation model allows predicting air temperatures and humidity ratios, the surface (radiant) temperatures, as well as energy loads in the reference dwelling, considering the three rooms (the sitting room, the living room, and the bedroom) monitored during the experimental study. Each room was identified as a thermal zone in the dwelling simulation model. While running the EnergyPlus program, the data were generated referring to two simulation periods: firstly, from 12 to 14 August 2022 that corresponds to the period in which the in situ measurements were recorded, and then, during the entire overheating period from 21 June to 21 September. Indoor and outdoor air temperatures, surface temperatures, relative humidity ratios, and cooling loads, were generated as outputs.
A dynamic simulation was also performed in order to compare the thermal behavior of the current ventilated mask wall to a 30 cm thick hollow clay brick wall under the same conditions. In this regard, the thermal behavior of the ventilated mask wall was simulated using the exterior naturally vented cavity module [52]. This module is provided by the software for opaque surfaces that include multi-layers. It is based on the characteristics of the outer and inner wall surfaces, the ventilated cavity, and the openings [52]. In fact, the presence of this cavity can modify the radiation and convection phenomena between the wall’s inner surface and the outdoor environment. EnergyPlus calculates the heat transfer between these two elements based on the cavity characteristics and the meteorological data. Additionally, this model assumes the air temperature in the cavity to be homogeneous; the airflow rate is calculated considering natural and forced convection due to the wind (Equation (3)) [53].
where:
- Cv: opening efficiency that depends on geometry and wind direction.
- Ain: opening area, m2
- U: wind speed, m/s
- CD: discharge coefficient
- g: force of gravity, m/s2
- ΔH: height between the center of the bottom opening and the zero pressure point, m
- Tcav: air temperature in the cavity, °C
- Tamb: outdoor air temperature, °C
3.3. Thermal Model Calibration
The validation/calibration of the thermal model to be used in the simulation process is a crucial step to ensure the relevance of the simulation’s results. Accordingly, in a first step, a data graph containing the measured and simulated values of the same variable will be used to check if the monitored data are correlated to the calculated ones. In a second step, specific mathematical equations relating to error margin calculations will be implemented to verify that the limit conditions for hourly values set in the ASHRAE guideline [54,55] are satisfied.
In this regard, the assessment of the thermal model adequacy is based on the relative error (RE) [6,56], the normal mean bias error (NMBE), and the coefficient of variation of the root mean squared error (CVRMSE), as recommended by ASHRAE (Equations (4)–(6)) [54,55], considering the air temperature results.
where:
: Measured value.
: Simulated value.
: Average measured value.
: Average simulated value.
3.4. Airflow Rate Calculation
The accurate calculation of airflow rate (D) within a mask-ventilated wall is vital for understanding its thermal behavior. The rate of heat transfer within the wall is dependent on the airflow rate, which affects the temperature levels inside it. Precise calculations of the airflow rate can assist in predicting the wall’s behavior under varying outdoor conditions. In this study, the calculation of the airflow rate inside the mask-ventilated wall was based on the Natural Ventilation Air Flow equation, which takes into account the air pressure (P), the air volume (V), the total area of the opening, and the temperature difference between the indoor and outdoor environments (Equations (7) and (8)) [57].
where:
- h: height between lower and upper openings, m
- t’: average air temperature inside wall, °C
- t: average outdoor air temperature, °C
- S: total area of the air intake opening, m2
- c: a coefficient that depends on the ratio between the area of the lower and upper openings (r) (Table 6).
Table 6. c coefficient as a function of r [57].
3.5. Operative Temperature
The operative temperature is a key parameter to assess the thermal behavior in buildings, as it takes into account both air temperature and radiant temperature. By referring to ASHRAE standard [41], the operative temperature (To) is equal to the average of the air temperature (Ta) and the mean radiant temperature (Tr) when the airspeed is less than 0.2 m/s (Equation (10)). This parameter allows assessing the thermal environment based on the adaptive thermal comfort range recommended by the standards (Table 2).
where:
- A: radiant fraction, it depends on the airspeed (Vs) (Table 7)
Table 7. Radiant fraction as a function of airspeed [41].
- Ta: air temperature, °C
- Tr: radiant temperature, °C
The summary Figure 9 below provides a visual representation of the methods and materials used in this study to explore the potential of using a ventilated mask wall as a cooling design strategy for the neo-vernacular dwelling of André Ravereau.
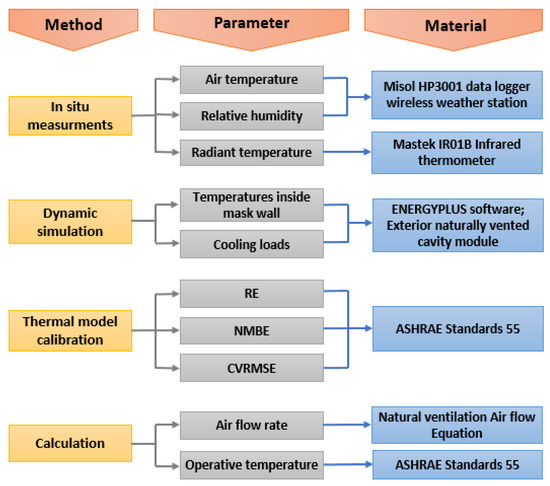
Figure 9.
Flow chart of materials and methods.
4. Results and Discussion
4.1. Thermal Model Validation
The experimental results were used to validate the dynamic numerical simulation model that will serve as a basis to quantitatively assess the thermal behavior of the mask wall implemented in the neo-vernacular dwellings designed by Ravereau in Sidi Abbaz. Precisely, the data recorded during the experimental campaign that was conducted from 12 to 14 August 2022, was used to validate the simulation model. For that, a dynamic simulation was performed under EnergyPlus program by referring to the in situ measurement period. Although, the results obtained by running the simulation calculations correspond to the same variables measured during the building’s monitoring, including: air temperature, relative humidity, and surface temperature, the model validation was based on the assessment of the indoor air temperature, given that it is the most important parameter to evaluate thermal comfort.
Accordingly, the temperatures provided by the weather file and those measured outside were compared. The same procedure has been carried out with regard to the indoor temperatures of the different rooms considered in the study. In particular, the bedroom (1st floor) and the sitting room (ground floor), which are similar in size and shape allow exploring the impact of the mask wall. Figure 10 shows the measured and simulated air temperatures both outside and inside the considered areas (sitting room, living room, and bedroom) during the monitoring period.
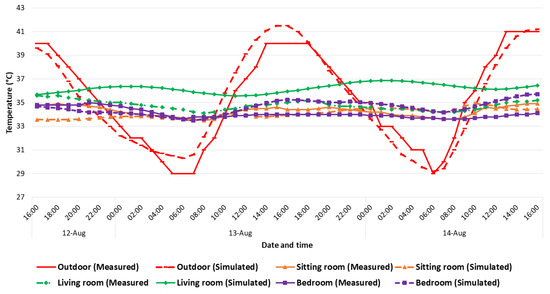
Figure 10.
Outdoor and indoor air temperature corresponding to 12–14 August 2022: measured versus simulated values.
The measured air temperatures ranged between 29 and 41 °C outside, between 33.5 and 34.9 °C in the sitting room, between 34.1 and 35.6 °C in the living room, and between 33.6 and 35 °C in the bedroom. However, the calculated temperatures of the outdoor, sitting room, living room, and bedroom range from 29.2 to 41.5 °C, from 33.4 to 34.9 °C, from 35.5 to 36.8 °C, and from 33.4 to 35.7 °C, respectively. The simulated temperatures are slightly higher than those measured particularly for the ambient outdoor temperature and the living room. Nevertheless, the shapes of the two curves are similar, and the simulated temperatures match those measured.
Table 8 shows the values obtained for the thermal model validation indices (RE, NMBE, and CVRMSE). These values fulfill the validation criteria. The validation indices fall within the acceptable range, given that relative error (RE) and the normal mean bias error (NMBE) hourly values are within ± 10%, whereas the variation coefficient of the root-mean-squared error (CVRMSE) hourly values are below 30%.
Table 8.
Values of validation indices.
The outdoor air temperature uncertainty may be linked to the interpolation of the weather file data, which allows for the completion of the data by a time step; short time steps of 10 min or less (number of calculation steps equal to six or more) increase the accuracy of the results. The simulation’s time step implemented is 60 min [58]. Furthermore, the thermal properties of the envelope can explain the slight temperature differences (measured and simulated) in the investigated rooms.
However, by referring to ASHRAE (Equations (4)–(6)) [54,55], the developed model confirms its ability to represent reality well. Thus, it is considered calibrated and suitable for use in the following calculations. In particular, the indices of the indoor air temperature assessed in the bedroom and the sitting room (which allow exploring the impact of the mask wall) have reached the required values for validation, consequently, this thermal model can be considered to estimate the radiant temperature of the different mask wall layers, daily cooling loads, and trimestral energy consumption. Furthermore, the model is also valuable for investigating alternatives relating to the materials of the boundary surfaces. Indeed, similar results were obtained in a study that evaluated the thermal performance of vernacular houses in the Casbah of Algiers, which demonstrated a difference of up to 3.86% between simulation data and experimental results [59]. Furthermore, a temperature difference of 2 °C between EnergyPlus numerical simulation results and experimental measurements was estimated in a study that evaluated the energy efficiency of an education building in Miliana, Algeria [60].
4.2. Assessing the Thermal Performance of the Mask Wall
After the thermal model was validated, the simulation was carried out to evaluate the thermal behavior of the mask wall over the overheating period and to assess the efficiency of this cooling strategy by investigating different alternatives for the materials of the boundary surfaces. The validated model was used to predict the indoor air temperatures in the reference dwelling according to the examined scenarios (naturally ventilated, unoccupied rooms).
The graph given below (Figure 11) displays the results for indoor and outdoor air temperatures. It shows that the outdoor air temperature was between 29 °C and 41 °C during the monitoring period, recorded at 5:00 a.m. and 2:00 p.m., with daily thermal amplitude of 12 °C. The terrace had a significant temperature variation, with daily thermal amplitude of 8.7 °C, and minimum and maximum temperatures of 35.2 °C and 43.9 °C, respectively, measured at 5:00 a.m. and 1:00 p.m.
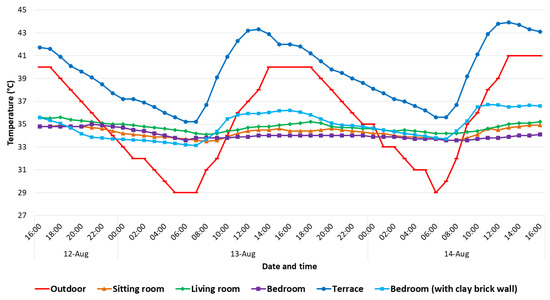
Figure 11.
Trend of the indoor temperatures against the outdoor temperature during 12–14 August.
Likewise, the temperatures recorded in the sitting room, living room, and bedroom (with mask wall), showed thermal amplitudes that do not exceed 1.5 °C. The air temperature variations in these rooms are from 33.5 to 34.9 °C, 34.1 to 35.6 °C and 33.6 to 35 °C, respectively. The highest indoor air temperatures are usually reached from 2:00 to 6:00 p.m., whereas the minimum temperatures are recorded around 6:00 a.m.
Moreover, by assuming that a standard hollow clay brick wall of 30 cm thickness substitutes the ventilated mask wall, the air temperatures calculated in the bedroom fluctuated between 33.1 °C and 36.7 °C recorded at 7:00 a.m. and 4:00 p.m., respectively, with a thermal amplitude of 3.6 °C (Figure 10). Thus, the indoor temperatures generated after using a hollow clay brick wall are higher than those obtained with the mask wall for most of the time. A maximum difference of 2.9 °C has been registered, whereas the decrement factor and the phase shift were estimated to be 0.3 and 2 h, respectively.
It is noteworthy that despite the high daily fluctuations of the outdoor temperature, the air temperatures within the monitored rooms remained relatively constant. This can be attributed primarily to the thermal mass of the envelope components, such as the external walls and roof, as well as to the implementation of compactness and introversion principles in Ravereau’s design. These design features effectively mitigate the large fluctuations in external temperature, contributing to the maintenance of stable indoor conditions.
The analysis carried out on indoor air temperatures indicate that the monitored rooms (the sitting room, the living room, and the bedroom) reached thermal ambient conditions that are challenging to attain in contemporary buildings without running air conditioning systems. Specifically, during the overheating season between 12 and 14 August, indoor air temperatures were approximately 7 °C above the average outdoor temperatures. Further analysis of the temperature curves presented in Figure 10 reveals that between 10:00 a.m. and midnight, indoor temperatures remain lower than outdoor temperatures, with the highest temperature differential of 6.9 °C being observed in the bedroom. Conversely, indoor temperatures are higher than outdoor temperatures for the remainder of the day, with the maximum temperature difference of 5.5 °C being recorded in the living room. These observations highlight the significance of temperature control mechanisms, particularly during times of high temperatures.
Additionally, the analysis of the temperature curves presented in the below Figure 10 shows a noteworthy correlation between the outdoor and the terrace ambient temperatures. The examined temperatures increase similarly until they reach their maximum values, after which they gradually decrease over the next 16 h to reach their minimum values. However, the temperatures on the terrace indicate a maximum of 3.7 °C higher than outdoor temperatures.
In fact, these temperatures are similar to the mean radiant temperatures depicted in below Figure 12, which reveal a distinct variation on the terrace, ranging between 32.34 °C and 55.9 °C. In contrast, the indoor temperature range displays and a minor thermal amplitude not exceeding 2.2 °C. Specifically, the temperatures range between 32.9 and 34.7 °C, 32.8 and 34.9 °C, and 31.53 and 33.7 °C in the sitting room, living room, and bedroom, respectively.
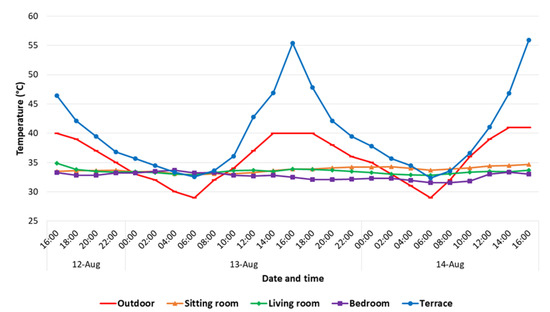
Figure 12.
Variation in the average radiant temperature.
The results obtained in the sitting room and living room can be explained by the thermal inertia of the walls (made of local limestone). The latter makes it possible to delay and slow down the heat exchanges between the internal thermal environment and the adjacent external environment, reducing daily temperature variations, storing heat, and then restituting it diffusely at low outside air temperatures. This property has the advantage of improving thermal comfort by offering some stability of indoor air temperature [61,62], as shown by the values relating the thermal amplitude that does not exceed 1.5 °C.
Drawing on the thermo-physical properties of the local limestone used in Sidi Abbaz dwellings, as presented in Table 3 [50], it is apparent that this material possesses excellent damping capacity and good thermal phase shift, attributed to its low thermal diffusivity (1.11 × 10⁻⁶ m2/s). Further examination of the thermal behavior the load-bearing structure of the ground floor walls, composed of 45 cm thick, quarry-extracted limestone, offers greater insight into the efficacy of this wall system. The decrement factor (ƒ) and the time lag (φ) are estimated to be 0.125 and 5 h, respectively; the maximum outdoor temperature of 41 °C, measured at 1:00 p.m., is dampened and shifted in time so that at 6:00 p.m. in the sitting room and living room, maximum temperatures of 34.9 °C and 35.6 °C are reached. The difference between the temperatures of these two rooms is due to the exposure of the living room ceiling to external climatic conditions and the presence of the zenithal opening (Chebek).
The energy released into these spaces at the end of the daytime and in the early evening leads to reach indoor air temperatures, which are higher than those outside. This heat is returned to the room by forced convection through night ventilation (mass cooling), which allows the warm air to be removed outside to cool the room. This freshness is maintained throughout the day due to thermal inertia, which depends on various physical factors such as solar radiation, wall orientation, and the presence of sun masks provided the surrounding areas; these parameters are controlled by compactness and introversion of the dwellings.
Therefore, when the temperature drops, part of the energy stored in the wall, especially that separating the rooms on the first floor and the terrace, is returned to the terrace (the flow of heat is directed to the two sides of the walls). This justifies the resulting nighttime temperatures in this area, which are generally higher than those outside. Additionally, the high temperatures reached in this open space throughout the day (up to 43 °C) are due to radiation coming directly from the sun, as well as scattered from the atmosphere or reflected from the wall surfaces. These radiations also cause surface temperatures to rise above outside temperatures. It is worth noting that positioning the sensor next to the terrace wall (for shading) may affect its reading.
Out of the three monitored rooms, the bedroom offers the most comprehensive analysis of the ventilated mask wall’s cooling efficiency. The obtained surface and air temperatures in the bedroom can be attributed to the ventilated mask wall design feature. This passive cooling alternative allows the constant and permanent circulation of air within the structure through the natural convection phenomenon known as the “chimney effect”, caused by the difference in density between warm and cold air; warm air rises naturally and easily escapes through high openings (by pressure), whereas cooler outside air enters the wall through low openings (by depression).
The chimney effect is negligible in strong winds and vice versa in calm weather, which is common in hot desert climates, particularly at night [57]. According to the numerical simulation, the average air temperature inside the ventilated channel of the wall is 36.17 °C (ranging between 28.5 and 47 °C), resulting in a pressure difference (P) of 0.0052 mm between the two wall openings (Figure 13) and an air volume (V) of 0.072 circulating between these openings. The airflow rate (D) through the wall is 44.39 m3/h.
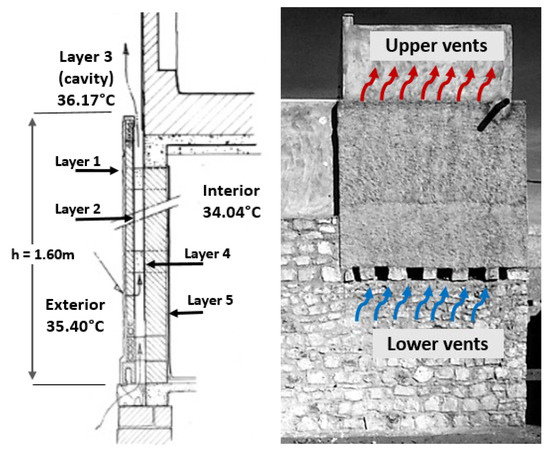
Figure 13.
Air circulation inside the ventilated channel of the mask wall.
Additionally, this façade design feature provides external thermal insulation. As such, it prevents heat and solar radiation from reaching the wall’s inner face, as shown in the graph below (Figure 14), which compares the surface temperatures of the mask wall’s inner and outer surfaces. The latter ranges from 28.5 to 47 °C on the wall’s outside face and 32.2 to 37.5 °C on its inside face. Furthermore, the highest outer surface temperature is reached around 10:00 a.m., whereas the highest inner surface temperature is reached around 10:00 p.m. For this ventilated and shaded wall, the thermal phase shift and decrement factor are estimated to be 12 h and 0.28, respectively.
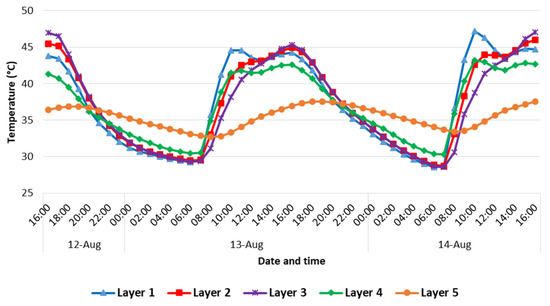
Figure 14.
Radiant temperature variations in the mask wall layers.
Moreover, the compactness of the shape and the low window-to-wall ratio, the light color of the walls, and the low ceiling height (between 2.8 and 3.2 m) contribute to the achievement of these results. The first parameter makes it possible to reduce the surface area exposed to external climatic conditions, thus limiting heat transfer [63], whereas the second allows up to 70% of the incident energy to be reflected [63]. The last parameter accelerates the renewal of the indoor air provided by the windows and the opening of the living room ceiling [64].
4.3. Thermal Comfort Evaluation
As previously stated, the operative temperature serves as a crucial parameter for evaluating the thermal conditions of a building, as it enables an assessment of the indoor thermal environment in accordance with the adaptive thermal comfort range as recommended by ASHREA standards [41]. Figure 15 shows the operative temperatures obtained in the different rooms considered in the reference building. It shows that To is between 33.3 and 34.8 °C in the sitting room, between 33.5 and 35.25 °C in the living room, and between 32.5 and 34 °C in the bedroom. The thermal amplitude in these rooms does not exceed 1.75 °C (recorded in the living room).
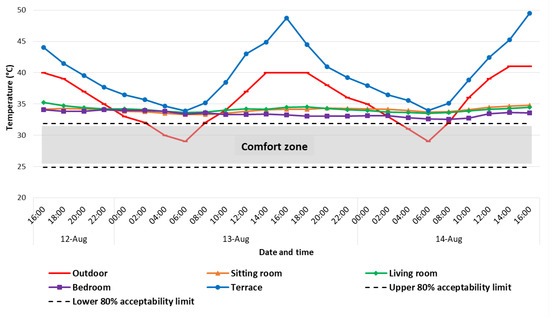
Figure 15.
Variations in the operative temperature.
However, the operative temperatures recorded at the terrace have a high thermal amplitude of 15.6 °C and range between 33.89 and 49.5 °C. That is mainly due to the daily temperature variations and because it is directly exposed to sunlight. As a result, the terrace provides a warmer thermal environment than outdoors throughout the day. In return, the other rooms offer more cool thermal conditions, except between midnight and 6:00 a.m. where the situation is reversed, and the weather outside becomes milder than inside.
The comparison of the resulting operative temperatures with the summer adaptive thermal comfort range (28.84 to 31.84 °C) recommended for the city of Ghardaia, shows that the thermal environment of the considered spaces is uncomfortable. The indoor operative temperature (sitting room, living room, and bedroom) exceeded the upper limit of thermal comfort with a maximum difference of 3.4 °C (measured in the living room) and a minimum difference of 0.7 °C (measured in the bedroom). The discomfort is more accentuated in these areas during the night. Nevertheless, the minimum difference between the terrace operative temperature and the upper limit of thermal comfort is 2 °C, which is reached at 6:00 a.m. The highest temperature difference is maintained around 4:00 p.m., it is equal to 16.8 °C.
However, when comparing the operative temperatures in the bedroom and sitting room (two superimposed rooms with the same parameters, namely surface area, ceiling height, and location regarding the neighborhood), it appears that the wall mask has led to improvements in thermal comfort. Despite the fact that it holds the highest shape factor coefficient (0.98), as well as being the most exposed to the outside (two external walls and roof), the bedroom showed the best operative temperature results. Considering the acclimatization that can be developed by frequent exposure to heat (from 8 to 22 days), the occupants can find a temperature of 34 °C that is relatively comfortable in the harsh desert climatic conditions of Ghardaia where outdoor temperature frequently peaks at more to 40 °C [65,66].
Furthermore, relative humidity influences the individual sense of comfort; a humid area may feel warmer than an area where the temperature is higher but the air is dry. According to ASHRAE, the relative humidity should be maintained between 30 and 60% [41]. The following humidity chart (Figure 16) shows that the outdoor relative humidity does not exceed 35% and reaches a minimum value of 11% around noon. This variation differs significantly from that maintained indoors. The relative humidity on the terrace follows a similar pattern as outside, ranging from 12 to 25%. These values are lower than the outdoor relative humidity, maintaining a maximum difference of 8%. In comparison, indoor relative humidity is higher, ranging from 20 to 29% in the sitting room, 22 to 35% in the living room, and 24 to 31% in the bedroom.
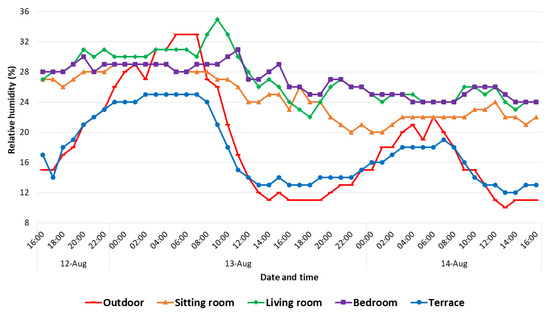
Figure 16.
Variation in the indoor and outdoor relative humidity.
These rates can be explained by the perspiring nature of stone and brick walls [67,68], which naturally regulate ambient air hygrometry. When the indoor air humidity is higher than that of the wall, the latter absorbs the excess vapor (like a sponge), which is released into the indoor air when the latter becomes too dry. However, the maintained hygrometry is not within the comfort zone, thus humidification is required.
4.4. Cooling Energy Savings Assessment
EnergyPlus is a software that allows the simulation of the indoor thermal environment, as well as the energy required to maintain a thermal zone at a predetermined temperature throughout the entire duration of the simulation. Accordingly, the cooling loads of the case study dwelling and its energy consumption were estimated by considering a comfort temperature of 30 °C. Figure 17 shows the daily cooling loads of the rooms under consideration. It can be seen that the bedroom has the lowest cooling loads (10,789 W) despite the fact that this room is the most exposed to the external environment; its shape factor (0.98) is the highest relatively to the living room (0.38) and the sitting room (0.2) (Table 5).
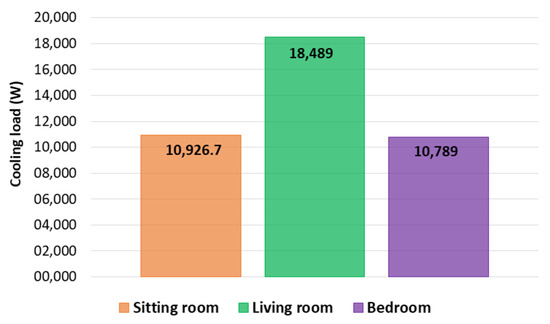
Figure 17.
Daily cooling loads required in the monitored rooms.
Furthermore, to assess the impact of the mask wall on the mitigation of energy consumption, the bedroom (1st floor) and the sitting room (ground floor) which are similar in size and shape were compared in terms of cooling loads. Considering the sitting room energy consumption is 10,926.7 W, this implies that a ventilated mask wall with an area of 4.35 m2 that represents only 8.6% of the total envelope surface area can reduce the daily cooling load by about 2%. The building energy consumption is estimated to be 47.7 kWh during the two monitoring days (12–14 August), and 1158.4 kWh (33 kWh/m2) during the summer period (June 21–September 21).
Finally, taking into account the internal heat gain sources (occupancy and lighting) (Table 9), the daily cooling loads of the considered rooms (the sitting room, the living room and the bedroom) are estimated to be 11,145 W, 18,705 W, and 10,989 W, respectively (Figure 18). The building cooling energy consumption is expected to be 67.22 kWh during the monitoring period and 1470.77 kWh during the summer season.
Table 9.
Details of the internal heat gain sources.
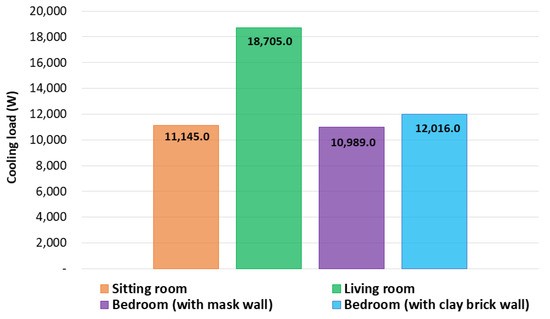
Figure 18.
Daily cooling loads considering the internal heat gain sources.
Upon replacing the ventilated mask wall with a conventional 30 cm thick hollow clay brick wall, commonly used in contemporary constructions, the cooling loads experienced by the bedroom significantly escalate to 12,016 W per day, thereby necessitating a total cooling energy consumption of 69.17 kWh and 1500.35 kWh for the monitoring period and summer season, respectively. These results unequivocally highlight the superior thermal performance of the ventilated mask wall as it engenders daily energy savings of approximately 8.5% as compared to the conventional wall configuration.
5. Conclusions and Further Research
This paper investigates the thermal performance of the ventilated mask wall used in the low-income neo-vernacular dwellings designed by Ravereau to cope with the warm desert climate conditions of M’Zab Valley, Ghardaia, southern Algeria. To quantitatively assess the thermal behavior of the mask wall in real conditions, a field investigation was conducted in a naturally ventilated residential building located in Sidi Abbaz during the summertime from 12 to 14 August 2022. The monitored building selected as a case study was modeled and calibrated under EnergyPlus (v8.4) software. A dynamic simulation was then performed in order to assess the cooling efficiency of the ventilated mask wall in terms of indoor environment, thermal comfort, and cooling energy demand. The EnergyPlus software was used to simulate the thermal model based on the external naturally vented cavity module. By applying different alternatives for the materials of the enclosure, it was possible to evaluate the importance of the mask wall on the reduction in thermal discomfort. The following main results were obtained:
- The ventilated mask wall allows a time lag of 12 h, a decrement factor of 0.28, and a reduction in the radiant temperature by up to 10 °C. These achievements are best appreciated when compared to the other two examined alternatives, notably: a 45 cm thick stone wall that provides only 5 h of phase shift and a 0.125 decrement factor, and a 30 cm thick hollow clay brick wall that induces 2 h of phase shift and a 0.3 decrement factor.
- The bedroom, with a mask wall represents 8.6% of the total envelope area, and with a shape factor of 0.98, provides thermal environment conditions that are slightly cooler than the sitting room; even though this room (with shape factor of 0.20) is less exposed and features a massive structure of 45 cm thick load bearing walls built of local limestone.
- Implementing a 30 cm thick clay brick wall instead of a ventilated mask wall leads to higher indoor temperatures for most of the time with a maximum difference of 2.9 °C and results in more substantial energy consumption.
- The daily cooling energy savings that can be achieved by using a ventilated mask wall are approximately 8.5%.
Finally, the study demonstrated how the thermal behavior of the building enclosure can be significantly improved through the use of passive cooling alternatives such as ventilated facades with opaque external massive cladding. The results confirmed that ventilated mask walls could help to reduce summer thermal loads and, therefore, the energy consumption due to air-conditioning systems.
The findings of this study are very promising for further implementation of the ventilated mask wall as a passive design strategy in warm desert climates. Nevertheless, to enhance its performance, some of its design parameters need to be thoroughly assessed, in particular the height of the air gap, its width, the materials to be used for the construction of the inner and outer slabs, and the exposure. Moreover, the airflow patterns should be investigated further for future development. This prospect allows for the identification of the velocity-field characteristics in the wall cavity through an accurate evaluation of the effects of parameters, such as the ventilation opening size, its position, and orientation.
Author Contributions
Conceptualization, B.A.; methodology, B.A., L.S. and D.B.; software, D.B.; validation, D.B.; investigation, B.A.; resources, B.A. and L.S.; data curation, B.A. and M.A.K.; writing—original draft preparation, B.A.; writing—review and editing, L.S. and G.S.; visualization, B.A.; supervision, L.S., G.S. and M.A.K.; project administration, L.S. and G.S. All authors have read and agreed to the published version of the manuscript.
Funding
This research received no external funding.
Acknowledgments
The authors gratefully acknowledge the support of LACOMOFA laboratory and Mohamed Khider University (for the material used for experiments). They would also like to thank the Studies Office for the Protection and the Promotion of the M’Zab Valley (OPVM), namely Hammou Achour for generously providing all the documentation needed for the study. They express their deepest gratitude to Hamida Bencheikh, from Amar Telidji University, for his assistance with research.
Conflicts of Interest
The authors declare no conflict of interest.
References
- UN. Global Status Report for Buildings and Construction; United Nations Environment Programme: Montreal, QC, Canada, 2020. [Google Scholar]
- DataLab, Chiffres clés du Climat France, Europe et Monde. Edition 2021, Ministére de la transition écologique. 2021. Available online: https://www.statistiques.developpement-durable.gouv.fr/edition-numerique/chiffres-cles-du-climat/6-emissions-de-co2-hors-utcatf (accessed on 22 July 2022).
- Mezouari, M.; Fezzioui, N.; El-Mir, M.; Claude-Alain, R. Potential of Natural Ventilation in Different Algerian Climates. J. Adv. Res. Fluid Mech. Therm. Sci. 2021, 66, 176–192. [Google Scholar] [CrossRef]
- Rumsey, P. How Building Decarbonization Can Transform HVAC. ASHRAE J. 2021, 63, 14. [Google Scholar]
- APRUE. La Situation Energitique Régionale; Ministere de l’énergie et des mines: Alger, Algérie, 2015. [Google Scholar]
- Bencheikh, D.; Bederina, M. Assessing the duality of thermal performance and energy efficiency of residential buildings in hot arid climate of Laghouat, Algeria. Int. J. Energy Environ. Eng. 2019, 11, 143–162. [Google Scholar] [CrossRef]
- Benelkadi, K. Les climatiseurs font exploser la consommation électrique. El Watan 2019, 169. [Google Scholar]
- WorldBGC. Bringing Embodied Carbon Upfront Coordinated Action for the Building and Construction Sector to Tackle Embodied Carbon; World Green Building Council: Toronto, ON, Canada, 2019. [Google Scholar]
- Tewari, P.; Veer Pratap Singh, R. Thermal Comfort Prescription for Cooling Dominated Indian Residential Buildings, New Delhi; The Energy and Resources Institute: New Delhi, India, 2021. [Google Scholar]
- Szokolay, S. Introduction to Architectural Science: The Basis of Sustainable Design; Elsevier: Amsterdam, The Netherlands; Architectural Press: Oxford, UK, 2004; p. 327. [Google Scholar]
- Rahmani, S.; Kaoula, D.; Hamdy, M. Exploring the thermal behaviour of building materials: Terracotta, concrete hollow block and hollow brick, under the arid climate, case study of Biskra-Algeria. Mater. Proc. 2022, 58, 1380–1388. [Google Scholar] [CrossRef]
- Kubota, T.; Hooi Chyee, D.T.; Ahmad, S. The effects of night ventilation technique on indoor thermal environment for residential buildings in hot-humid climate of Malaysia. Energy Build. 2009, 41, 829–839. [Google Scholar] [CrossRef]
- Dudzińska, A.; Kisilewicz, T. Efficiency of night ventilation in limiting the overheating of passive sports hall. MATEC Web Conf. 2020, 322, 01031. [Google Scholar] [CrossRef]
- Bencheikh, D.; Bederina, M. The Rehabilitation effects on the thermal behaviour of Algerian earthen built heritage. MATEC Web Conf. 2018, 149, 02049. [Google Scholar]
- Breesch, H.; Janssens, A. Reliable design of natural night ventilation using building simulation. Therm. Perform. Exter. Envel. Whole Build. X Proc. 2007, 186, 432774. [Google Scholar]
- Exizidou, P.; Christoforou, E.; Fokaides, P. Numerical assessment of night ventilation impact on the thermal comfort of vernacular buildings. J. Build. Pathol. Rehabil. 2017, 2, 2. [Google Scholar] [CrossRef]
- Artmann, N.; Jensen, R.L.; Manz, H.; Heiselberg, P. Experimental investigation of heat transfer during nighttime ventilation. Energy Build. 2010, 42, 366–374. [Google Scholar] [CrossRef]
- Hamdani, M.; Bekkouche, S.M.; Benouaz, T.; Belarbi, R.; Cherier, M.K. The study natural ventilation by using buildings windows: Case study tudy in a hot dry climate, Ghardaïa, Algeria. Energy Procedia 2017, 139, 475–480. [Google Scholar] [CrossRef]
- Corgnati, S.P.; Kindinis, A. Thermal mass activation by hollow core slab coupled with night ventilation to reduce summer cooling loads. Build. Environ. 2007, 42, 3285–3297. [Google Scholar] [CrossRef]
- Darmanis, M.; Çakan, M.; Moustris, K.; Kavadias, K.; Nikas, K.-S. Utilisation of Mass and Night Ventilation in Decreasing Cooling Load Demand. Sustainability 2020, 12, 7826. [Google Scholar] [CrossRef]
- Kuczyński, T.; Staszczuk, A.; Gortycha, M.; Stryjskic, R. Effect of thermal mass, night ventilation and window shading on summer thermal comfort of buildings in a temperate climate. Build. Environ. 2021, 204, 108126. [Google Scholar] [CrossRef]
- Blondeau, P.; Sperandio, M.; Allard, F. Night ventilation for building cooling in summer. Sol. Energy 1997, 61, 327–335. [Google Scholar] [CrossRef]
- Geros, V.; Santamouris, M.; Tsangrasoulis, A.; Guarracino, G. Experimental evaluation of night ventilation phenomena. Energy Build. 1999, 29, 141–154. [Google Scholar] [CrossRef]
- Alibaba, H.; Ozdeniz, M. Energy Performance and Thermal Comfort of Double-Skin and Single-Skin Facades in Warm-climate office. J. Asian Archit. Build. Eng. 2016, 15, 635–642. [Google Scholar] [CrossRef]
- Ballestini, G.; De-Carli, M.; Tombola, G. Buildings with a double-skin façade in Mediterranean climates. Build. Environ. 2005, 40, 983–995. [Google Scholar] [CrossRef]
- Ahriz, A.; Mesloub, A.; Djeffal, L.; Alsolami, B.; Ghosh, A.; Abdelhafez, M.H. The Use of Double-Skin Façades to Improve the Energy Consumption of High-Rise Office Buildings in a Mediterranean Climate (Csa). Sustainability 2022, 14, 6004. [Google Scholar] [CrossRef]
- Aruta, G.; Ascione, F.; Bianco, N.; Lovane, T.; Mauro, G.M. A responsive double-skin façade for the retrofit of existing buildings: Analysis on an office building in a Mediterranean climate. Energy Build. 2023, 284, 112850. [Google Scholar] [CrossRef]
- Gratia, E.; De Herde, A. Greenhouse effect in double-skin façade. Energy Build. 2007, 39, 199–211. [Google Scholar] [CrossRef]
- Haggag, M.A. Building skin and energy efficiency in a hot climate with particular reference to Dubai, UAE. Ecol. Environ. 2007, 105, 287–297. [Google Scholar]
- Lee, S.K.; Chen, H.; Fan, S.K.; His, H.; Horng, S. Thermal performance and durability properties of the window glazing with exterior film(s). Indoor Built Environ. 2014, 23, 1163–1176. [Google Scholar] [CrossRef]
- Yoon, N.; Min, D.; Heo, Y. Dynamic compartmentalization of double-skin façade for an office building with single-sided ventilation. Build. Environ. 2022, 208, 108624. [Google Scholar] [CrossRef]
- Hong, X.; Lin, J.; Yang, X.; Wang, S. Comparative Analysis of the Daylight and Building-Energy Performance of a Double-Skin Facade System with Multisectional Shading Devices of Different Control Strategies. J. Energy Eng. 2022, 148, 05022001. [Google Scholar] [CrossRef]
- Haase, M.; Amato, A. An investigation of the potential for natural ventilation and building orientation to achieve thermal comfort. Sol. Energy 2009, 83, 389–399. [Google Scholar] [CrossRef]
- Memari, A.; Solnosky, R.; Hu, C. Multi-Disciplinary Characteristics of Double-Skin Facades for Computational Modeling Perspective and Practical Design Considerations. Buildings 2022, 12, 1576. [Google Scholar] [CrossRef]
- Radhi, H.; Sharples, S.; Fikiry, F. Will multi-facade systems reduce cooling energy in fully glazed buildings? A scoping study of UAE buildings. Energy Build. 2013, 56, 179–188. [Google Scholar] [CrossRef]
- Qahtan, A. Thermal performance of a double-skin façade exposed to direct solar radiation in the tropical climate of Malaysia: A case study. Case Stud. Therm. Eng. 2019, 14, 100419. [Google Scholar] [CrossRef]
- Baldenilli, G. Double skin façades for warm climate regions: Analysis of a solution with an integrated movable shading system. Build. Environ. 2009, 44, 1107–1118. [Google Scholar] [CrossRef]
- Hashemi, N.; Fayaz, R.; Sarshar, M. Thermal behaviour of a ventilated double skin facade in hot arid climate. Energy Build. 2010, 42, 1823–1832. [Google Scholar] [CrossRef]
- Larsen, S.F.; Rengifo, L.; Filippín, C. Double skin glazed façades in sunny Mediterranean climates. Energy Build. 2015, 102, 18–31. [Google Scholar] [CrossRef]
- Rubel, F.; Kottek, M. Observed and projected climate shift 1901-2100 depicted by world maps of the Koppen-Geiger climate classification. Meteorol. Z. 2010, 19, 135–141. [Google Scholar] [CrossRef]
- ANSI/ASHRAE Standard 55. Thermal Environmental Conditions for Human Occupancy; American Society of Heating, Refregirating and Air-Conditioning Engineers: Atlanta, GA, USA, 2017; p. 52. [Google Scholar]
- Ruggeri, D. André Ravéreau et le M’Zab: Regarder, dessiner, construire. Insaniyat 2021, 91, 77–92. [Google Scholar] [CrossRef]
- Wilson, A. André Ravéreau, leçons d’un homme assis. Prix D’arcitecture 2022, 260, 12–13. [Google Scholar]
- ALADAR, Logements à Sidi Abbaz. 2015. Available online: http://www.aladar-assoc.fr/portfolio/logemenet-a-sidi-abbaz/ (accessed on 15 March 2023).
- Amraoui, K.; Sriti, L.; Di Turi, S.; Ruggiero, F.; Kaihoul, A. Exploring building’s envelope thermal behavior of the neo-vernacular residential architecture in a hot and dry climate region of Algeria. Build. Simul. 2021, 14, 1561–1585. [Google Scholar] [CrossRef]
- Bouchareb, A. Andre Ravereau. Hypothèses. 2020. Available online: https://archialg.hypotheses.org/74 (accessed on 17 March 2023).
- Ravereau, A.; Baudouï, R.; Potié, P. L’atelier du Désert; Parenthèses: Paris, France, 2003; p. 189. [Google Scholar]
- Bensayah, A.; Bencheikh, H.; Abdessemed, A. Mzabite Heritage in southern Algeria: What bioclimatic lessons can be learned to optimize thermal comfort. MATEC Web Conf. 2019, 287, 04005. [Google Scholar] [CrossRef]
- Abdelbaki Mohamed, I. Sidi Abbas Housing, Gharadia, Algeria. Alam El Bena’a 1999, 10, 10–12. [Google Scholar]
- CNERIB. Réglementation Thermique du Bâtiment (DTR C3-T); Ministre de l’Habitat et de l’Urbanisme: Alger, Algerie, 2011. [Google Scholar]
- Chahma, S. Etude des Propriétés Thermomécanique Des Briques En Terre Gypse traditionnel (Temchemt) stabilisée par le ciment ou par la chaux (Cas de La ville d’ouargla). Ph.D. Thesis, Université Kasdi Merbah, Ouargla, Algeria, 2018. [Google Scholar]
- Griffith, B. Model for Naturally Ventilated Cavities on the Exteriors of Opaque Building Thermal Envelopes; Simbuild: Cambridge, MA, USA, 2006. [Google Scholar]
- Bannier, E.; Cantavella, V.; Silva, G.; Pinazo, J.M.; Soto, V.M.; Sarabia, E. Contribution of the ventilated façade to building energy demand. In Proceedings of the Qualicer 2012, Castellón, Spain, 13–14 February 2012; pp. 1–16. [Google Scholar]
- Hema, C.; Messan, A.; Lawane, A.; Van Moeseke, G. Impact of the Design of Walls Made of Compressed Earth Blocks on the Thermal Comfort of Housing in Hot Climate. Buildings 2020, 10, 157. [Google Scholar] [CrossRef]
- Gucyeter, B. Calibration of a building energy performance simulation model via monitoring data. In Proceedings of the Building Performance Analysis Conference and SimBuild co-organized by ASHRAE and IBPSA-USA, Chicago, IL, USA, 26–28 September 2018. [Google Scholar]
- Kat, C.-J.; Els, P.S. Validation metric based on relative error. Math. Comput. Model. Dyn. Syst. 2012, 18, 487–520. [Google Scholar] [CrossRef]
- Dreyfus, J. Le Confort dans L’habitat en Pays Tropical: La Protection des Constructions Contre la Chaleur; problèmes de ventilation: Eyrolles, France, 1960; p. 363. [Google Scholar]
- Spitz, C. Analyse de la Fiabilité des Outils de Simulation et des Incertitudes de Métrologie Appliquée à L’efficacité énergéTique des bâtiments; Université de Grenoble: Grenoble, France, 2012; p. 196. [Google Scholar]
- Benchekroun, M.; Chergui, S.; Ruggiero, F.; Di Turi, S. Indoor Microclimate Conditions and the impact of transformations on hygrothermal comfort in the old ottoman houses in Algiers. Int. J. Archit. Herit. 2019, 14, 1296–1319. [Google Scholar] [CrossRef]
- Khledj, S.; Bencheikh, H. Impact of a Retrofitting Project on Thermal Comfort and Energy Efficiency of a Historic School in Miliana, Algeria. Int. J. Archit. Herit. 2019, 15, 407–425. [Google Scholar] [CrossRef]
- Felix, M.; Elsamahy, E. The Efficiency of Using Different Outer Wall Construction Materials to Achieve Thermal Comfort in Various Climatic Zones. Energy Procedia 2017, 115, 321–331. [Google Scholar] [CrossRef]
- Bellahcene, L.; Cheknane, A.; Bekkouche, A.; Sahel, D. The effect of the thermal inertia on the thermal transfer in building wall. E3S Web Conf. 2017, 22, 00013. [Google Scholar] [CrossRef]
- Liebard, A.; De herde, A. Traité d’architecture te d’Urbanisme Bioclimatique; Le moniteur: Antony Cedex, France, 2005; p. 778. [Google Scholar]
- Cen, C.; Jia, Y.; Liu, K.; Geng, R. Experimental comparison of thermal comfort during cooling with a fan coil system and radiant floor system at varying space heights. Build. Environ. 2018, 141, 71–79. [Google Scholar] [CrossRef]
- Pandolf, S.Y.B.; Avellini, A.; Pimental, N.; Goldman, R. Physiological responses of men and women to humid and dry heat. J. Appl. Physiol. 1980, 49, 1–8. [Google Scholar]
- Périard, D.; Racinais, S.; Sawka, M. Adaptations and mechanisms of human heat acclimation: Applications for competitive athletes and sports. Scand. J. Med. Sci. Sport. 2015, 25, 20–38. [Google Scholar] [CrossRef]
- Kunzel, H. Effect of interior and exterior insulation on the hygrothermal behaviour of exposed walls. Mater. Struct. 1998, 31, 99–103. [Google Scholar] [CrossRef]
- Wessberg, M.; Vyhlídal, T.; Broström, T. Humidity change rate control in intermittently heated historic buildings. E3S Web Conf. 2020, 172, 15004. [Google Scholar] [CrossRef]


Disclaimer/Publisher’s Note: The statements, opinions and data contained in all publications are solely those of the individual author(s) and contributor(s) and not of MDPI and/or the editor(s). MDPI and/or the editor(s) disclaim responsibility for any injury to people or property resulting from any ideas, methods, instructions or products referred to in the content. |
© 2023 by the authors. Licensee MDPI, Basel, Switzerland. This article is an open access article distributed under the terms and conditions of the Creative Commons Attribution (CC BY) license (https://creativecommons.org/licenses/by/4.0/).