Article

Coupling Analysis of Tunnel Construction Safety Risks Based on N-K Model and SD Causality Diagram

School of Civil Engineering, Central South University, Changsha 410075, China
*
Author to whom correspondence should be addressed.
Buildings 2023, 13(4), 1081; https://doi.org/10.3390/buildings13041081
Submission received: 21 March 2023 / Revised: 15 April 2023 / Accepted: 18 April 2023 / Published: 20 April 2023
(This article belongs to the Section Construction Management, and Computers & Digitization)

Abstract

:
Tunnel construction is characterized by its large scale, long periods and vulnerability to environmental impact, which pose great challenges to tunnel construction safety. In order to analyze the coupling mechanism of tunnel construction safety risks and assess these risks, we conducted a study on the coupling evaluation of these risks in order to improve tunnel construction safety risk management. By analyzing 150 accident cases related to tunnel construction safety, an N-K model (natural killing model) was constructed to quantify the risk level of each coupling form from four aspects—personnel risk factors, equipment risk factors, environmental risk factors and management risk factors—and the SD (system dynamics) causality diagram was used to construct risk element conduction paths and identify the key influencing factors of different coupling forms. The research results show that with the increase in risk coupling factors, the risk of tunnel construction safety accidents also increases; weak personnel safety awareness, aging and wear of equipment, poor operating environment and construction site management chaos are the key risk factors whose prevention needs to be focused on. The related research results can provide a new method for decision makers to assess tunnel construction safety risks and enrich the research on tunnel construction safety risk management.

1. Introduction

Tunneling is an important engineering structure for national transportation networks and infrastructure construction, with significant economic and social benefits. The large scale and long construction period of tunnel projects, the environmental impact and the complex external conditions [1] during the construction of new tunnels, as well as the complex geology and harsh operating environments are often encountered, in addition to the comprehensive nature of the tunnel construction process, which also leads to a large number of disturbing events during the construction process, affecting the quality, progress and construction safety of the project [2,3]. The frequent occurrence of tunnel construction safety accidents not only prolongs the tunnel construction cycle and reduces its economic and social benefits, but also causes casualties and seriously damages people’s lives and properties [4,5], so it is necessary to assess tunnel construction safety risks from the perspective of risk evaluation in order to achieve risk avoidance.
In recent years, researchers have conducted a large number of studies on safety risks during the construction phase of tunnels, which can be broadly divided into three stages. In the initial stage, case studies and expert surveys were mainly used for qualitative research on tunnel construction safety risks, which are more subjective and rely more on historical information and expert experience. For example, Professor Einstein H.H. of MIT, USA, is a representative figure who engaged in the early safety risk analysis of tunnel engineering; he introduced the uncertainty of risk analysis into tunnel engineering and proposed the basic principles and characteristics of risk analysis that should be followed in tunnel engineering [6]. Chapman D.F.C. introduced the expert investigation method into the study of construction safety risks in tunnel engineering and analyzed the risks in various aspects of construction [7], applying risk analysis methods to specific cases and analyzing the causes and laws of accidents. With the continuous advancement of research work, the hierarchical analysis method [8], fuzzy comprehensive evaluation method, accident tree method and Monte Carlo method have gradually been applied to tunnel construction safety risk evaluation, using statistical and mathematical analysis models to realize the quantification of tunnel safety risk analysis, improve the scientific nature of risk research, make the conclusions more accurate and reliable and promote the development of tunnel construction safety risk evaluation to a large extent. For example, Sturk R. et al. applied the accident tree method to the Stockholm ring road tunnel to deal with uncertainty and safety risks in the tunnel construction process in a more scientific way [9]; Wang J. et al. established a fuzzy evaluation matrix for the subordination of safety risks in the construction of a super-shallow buried large-span continuous arch tunnel, the Xiamen Haicang tunnel, by using the fuzzy comprehensive evaluation method, which makes the evaluation method more accurate and reasonable, and proposed measures based on the risk assessment results [10]; Mirhabibi A. et al. evaluated the risk factors leading to ground building settlement during the construction of underground works by means of Monte Carlo simulations, and developed two design maps for the rapid assessment of the impact of buildings on surface settlement based on the results of numerical simulations [11]. With the continuous development of computer technology and the rise of risk network models, the development of tunnel construction safety risk assessment has entered a new stage, and the optimization of previous models has been continuously carried out. For example, Deng X. et al. applied the fuzzy hierarchical analysis method to tunnel construction risk assessment, which solved the defects of the hierarchical analysis method, which does not easily guarantee consistency of thinking when evaluating multiple indicators, and consequently improved the scientificity of the decision making [12]; Lin C. et al. divided the tunnel construction safety risks into monitoring data, rock quality, safety management and equipment operation and management personnel, and combined fuzziness and randomness into the risk assessment, achieving an improvement in the traditional cloud model and verifying the feasibility and accuracy of the method by assessing the safety risk of construction in the Tiger Mountain Tunnel [13]; Ou X. et al. predicted the dynamic risk probability and dominant factors of environmental risk, construction risk and management risk during tunnel construction based on a dynamic Bayesian network for the accurate control of collapse risk during tunnel construction, and realized the dynamic assessment of risk [14]; Ge S. et al. used ground settlement and tube sheet floating to represent the two main aspects of construction safety based on the serious problems of shield tunnel construction safety, and proposed a deep confidence network based on whale optimization algorithm optimization for the safety prediction of shield tunnel construction, which was validated in the shield tunnel construction of Line 18 of Guangzhou Subway in China [15]. In addition, neural networks [16], fuzzy theory [17] and other methods have also been applied to greatly enrich the research on safety risk evaluation of tunnel construction. In recent years, studies related to seismic resistance [18] and fire resistance [19] of tunnels have also been gradually incorporated into tunnel construction safety management, promoting the diversified development of tunnel construction safety risk evaluation. However, most of the current studies on tunnel construction safety risks are focused on a single dimension, and few studies have been conducted on the relationships and paths of interaction between risk factors, which cannot clarify the coupling relationship between risk factors when an accident occurs; to briefly summarize, there is a lack of studies on the coupling of tunnel construction safety risks.
The concept of “coupling” first originated In physics to denote the phenomenon of interaction between two or more systems or forms of motion [20]. Current models commonly used in coupling studies in the risk domain include the N-K model, the coupling degree model, the system dynamics model, the SHEL model and the risk transmission model. Among them, N-K model is widely used in the field of coupling research on complex problems because it can calculate the coupling frequency, coupling probability and coupling degree among elements, and the system dynamics model is more widely used in the study of risk mechanisms because it can analyze the structure, behavior and causality of the system by using the principle of system dynamics. The N-K model was introduced by Kauffman S. to analyze the impact of coupling between factors within a complex system on the system as a whole [21], and the application of the N-K model allows for the use of case data to identify internal correlation links and determine the degree of impact, and calculate the risk flow value through the information interaction formula to quantitatively analyze the degree of coupling of risk factors. Currently, the N-K model is applied in the fields of transportation, safety management and disaster prevention. In the field of transportation, Mo J. et al. constructed the N-K model and system dynamics simulation model to quantify the hazard level of the coupling effect of quality risk factors in railroad engineering, and concluded that reducing the coupling value could help control the growth rate and total level value of the system risk [22]; in the field of safety management, Yan H. et al. conducted a risk coupling assessment of the social stability of major projects based on the N-K model and found that the social stability risk of major projects increased in the multifactor coupling state [23]; in the field of disaster prevention, Liu Z. et al. studied the degree of risk coupling in submarine blowout accidents based on dynamic Bayesian networks and N-K models, and used N-K models to calculate the parameters of risk coupling nodes in dynamic Bayesian networks [24], and Qiao W. introduced N-K models for coal mine accident risk analysis, and used data from 375 major accidents to make risk coupling effect size measurements [25]. Through literature reading, it is found that the coupling analysis of risk factors using the N-K model can only quantitatively analyze the coupling degree of the main factors, and cannot explore the coupling relationship of subrisk factors under the main factors, which leads to poor solvability of the results and makes it difficult to make targeted suggestions in the practice stage.
System dynamics was first proposed by Professor Forrester of MIT in the mid-20th century, and was initially applied to the field of business management, and then gradually developed into a comprehensive interdisciplinary discipline for understanding and solving complex system problems [26,27,28]. In system dynamics models, causality diagrams are often used to represent the structure and operating mechanism of a system, and are now also applied in the field of risk management. For example, Yang, K. used the SD model to establish a coupled causality diagram of a gas pipeline leakage disaster system depicting the coupled paths of system factors [29]. Xue Y. et al. developed system dynamics equations to study the level of coupled risk in a high-speed rail project, showing that the constructed system dynamics model can be used to identify and reduce risk [30]. Pan Y. et al. constructed a cause-and-effect diagram of policy, technology and economy with respect to the market share of assembled buildings, and established a systematic feedback loop based on logical deduction to address the dilemma of the gap between the effect of assembled buildings on the ground and the intensity of incentive policies [31]. Through literature reading, it was found that SD causality diagrams can only qualitatively study the relationship between subfactors due to their characteristics, ignoring the influence of the main factors on the system, and cannot achieve the quantification of factor analysis.
It is found that the N-K model and SD model can achieve complementary advantages in risk factor analysis. Therefore, in this paper, for the characteristics of the tunnel construction phase, the N-K model is used to analyze the coupling relationship between the main factors in tunnel construction safety risk factors, and on this basis, the SD model is used to further analyze the coupling links of subfactors in the hazard coupling state to find the key risk factors, so as to achieve the optimization of the traditional N-K model in order to make targeted suggestions for decision makers in tunnel construction safety risk management.

2. Materials and Methods

2.1. Tunnel Construction Safety Risk Factor Identification

Grounded theory is a qualitative research method that builds theory based on historical information, allowing for analysis of complex relationships between data and distillation of core concepts [32]. When using the grounded theory to identify the safety risk factors of tunnel construction, it is necessary to first collect a large quantity of historical data, generate concepts from the data, and log in the data level by level. In the process of collecting cases, we followed the principles of true and complete accident cases, representative accident cases and informative and reliable accident investigation reports, according to the State Administration of Work Safety, public reports on news websites and relevant books [33] on tunnel construction safety accident cases for statistical analysis; excluding cases that do not meet the requirements, a total of 150 accident cases that meet the requirements for the 20 years from 2003 to 2022 were collected. According to the relevant provisions of Article 3 of the Regulations on the Reporting and Investigation and Handling of Production Safety Accidents [34] in China, accidents are classified into extraordinarily serious accidents, serious accidents, major accidents and ordinary accidents according to the casualties or direct economic losses caused by production safety accidents. The specific grading criteria are shown in Table 1, their year distribution is shown in Figure 1, some cases are shown in Table 2 and the complete cases are shown in Appendix A.
In this paper, 150 cases were collected as the original data material for the grounded theory, and 120 accident cases from the original data were randomly selected for the grounded theory study, while 30 accident cases were reserved for the saturation test. By analyzing the similarities and differences of the causes of the 120 accidents and coding the causes of the accidents, a total of three levels of coding could be obtained: open coding, associative coding and core coding, including 100 open codes such as “complex geological conditions”, “support collapse”, “continuous rainfall” and “poor site management”, and 25 associated codes such as “complex geological environment”, “construction site management confusion” and “harsh climatic environment”. The core coding is a further summary of the correlation coding, which is understood as the main risk factor in this paper; for example, “complex geological environment” and “harsh climate” can be summarized as “environmental risk factors”, and their core codes can be regarded as “environmental risk factors”, so the core codes and their associated codes are shown in Table 3.
The 30 accident cases reserved were brought into the grounded theory model for saturation test, and no new code types appeared during the test of the 30 cases, which proves that the saturation test passed, and the model based on the grounded theory for tunnel construction safety risk factor analysis was successfully established, with a total of 4 core-type codes and 25 associated-type codes, so the results of tunnel construction safety risk factor identification are shown in Figure 2.

2.2. Analysis of Risk Factor Coupling Mechanism

Tunnel construction safety system is a complex dynamic system; its internal risk factors depend on each other and influence the coupling relationship. When one or more risk factors in the system undergo adverse changes to a certain extent and break through the defense system to which they belong, it will have an associated effect on other risk factors, i.e., risk factor coupling occurs [35]. If the coupling of risk factors keeps occurring without taking measures, the coupling will continue to increase until it breaks the risk threshold that the system can withstand, which leads to the coupling effect of safety risk factors in tunnel construction [36]. The formation mechanism of the coupling effect of tunnel construction safety risks is shown in Figure 3.
According to the tunnel construction risk itself, the tunnel construction safety risk coupling type can be divided into homogeneous single-factor coupling risk, heterogeneous two-factor coupling risk and heterogeneous multifactor coupling risk; tunnel construction safety risk factor coupling types are shown in Figure 4, where the factor coupling risk flow values expressed by T, such as T a b , indicate the personnel–equipment risk factor coupling in the two-factor coupling risk.
  • Homogeneous single-factor coupled risk: refers to the coupled risk formed by the interaction of various factors within a single subsystem in the personnel risk subsystem, equipment risk subsystem, management risk subsystem and environmental risk subsystem, and is recorded as the four categories of personnel risk T a , equipment risk T b , environmental risk T c and management risk T d ;
  • Heterogeneous two-factor coupling risk: refers to the coupling risk formed by the interaction of different factors between two certain subsystems, including personnel–equipment risk factor coupling T a b , personnel–environment risk factor coupling T a c , personnel–management risk factor coupling T a d , equipment–environment risk factor coupling T b c , equipment–management risk factor coupling T b d and environment–management risk factor coupling T c d ;
  • Heterogeneous multifactor coupling risk: refers to the coupling risk formed by the interaction of different factors between multiple subsystems, where the three-factor risk coupling includes personnel–equipment–environment risk factor coupling T a b c , personnel–equipment–management risk factor coupling T a b d , personnel–environment–management risk factor coupling T a c d and equipment–environment–management risk factor coupling T b c d , and four-factor risk coupling includes personnel –equipment–environment–management risk factor coupling T a b c d .

2.3. Risk Factor Coupling Metric N-K Model and Its Optimization

2.3.1. Risk Coupling Metric N-K Model

N in the N-K model represents the number of influencing factors in the system, while K represents the number of interrelationships in a coupled system. N-K model can use case data to find out the internal correlation links, calculate the interaction information between risk subsystems by calculating the probability of occurrence of the coupling type and calculate the risk flow value T through the information interaction formula. The greater the calculated T value, the higher the degree of coupling of this type, and the more profound the impact of the resulting risk event.
Mutual coupling among risk factors in tunnel construction safety risk system can form homogeneous risk factor coupling, two-factor coupling, three-factor coupling and four-factor coupling. Based on the N-K model, when the factors in the four dimensions of personnel risk (a), equipment risk (b), environmental risk (c) and management risk (d) are involved in the coupling, the formula for calculating the tunnel construction safety risk flow value can be expressed as [38]:
T a b c d = h = 1 H i = 1 I j = 1 J k = 1 K p h , i , j , k log 2 p h , i , j , k p h p . i . . p j . p k
where p h , i , j , k denotes the probability of coupling occurrence when the state of personnel risk factor is h, the state of equipment risk factor is i, the state of environmental risk factor is j and the state of management risk factor is k; h = 1, 2, …, H; i = 1, 2, 3, …, I; j = 1, 2, 3, …, J; k = 1, 2, …, K.
According to the case study, it is found that there is also a local coupling risk during the tunnel construction process, i.e., coupling occurs by any three factors among personnel risk (a), equipment risk (b), environmental risk (c) and management risk (d), and the risk flow values of the three can be calculated by Equations (2)–(5).
T a b c = h = 1 H i = 1 I j = 1 J p h . i . j log 2 p h . i . j p h p . i . . p . . j .
T a b d = h = 1 H i = 1 I k = 1 K p h . i , k log 2 p h . i , k p h p . i . . p k
T a c d = h = 1 H j = 1 J k = 1 K p h . j , k log 2 p h . j , k p h p . . j . p k
T b c d = i = 1 I j = 1 J k = 1 K p i . j , k log 2 p i . j , k p . i . . p . . j . p k
In addition to three-factor coupling, the case of coupling by any two factors among personnel risk (a), equipment risk (b), environmental risk (c) and management risk (d) also belongs to the local coupling risk, and its risk flow value can be calculated by Equations (6)–(11).
T a b = h = 1 H i = 1 T p h . i log 2 p h . i p h p . i . .
T a c = h = 1 H j = 1 J p h . j log 2 p h . j p h p . . j .
T a d = h = 1 H k = 1 K p h . k log 2 p h . k p h p k
T b c = i = 1 I j = 1 J p i . j log 2 p i . j p . i . . p . . j .
T b d = i = 1 I k = 1 K p i . k log 2 p i . k p . i . . p k
T c d = j = 1 J k = 1 K p j . k l o g 2 p j . k p . . j . p k

2.3.2. Optimization of N-K Model Based on SD Causality Diagram

Due to the complexity, nonlinearity and many variables of tunnel construction safety risks, the causal relationship between each risk subfactor is complex. SD causality diagram is based on the principle of system dynamics to study the system behavior and intrinsic mechanism, and establish causal chains and causal loops according to the causal relationship between factors within the system. SD cause–effect diagram can describe the feedback relationship between factors within a complex system, reflect the path of action between risk factors through the chain of cause–effect relationship, find the key risk factors from the source and thus determine the evolution law and action results of risk factors.
Since the N-K model can only conduct quantitative analysis on the risk coupling between subsystems, it is unable to explore the causal relationship between the key influencing factors in the subsystem and the risk subfactors. The SD causality diagram can realize the microscopic study of the relationship between the system subfactors and make up for the deficiencies of the N-K model by describing the mutual influence relationship between the various factors in the system and analyzing the system operation mechanism. Therefore, the N-K model is optimized by applying the causality diagram in system dynamics.

3. Results

3.1. Calculation of Risk Flow Value Based on N-K Model

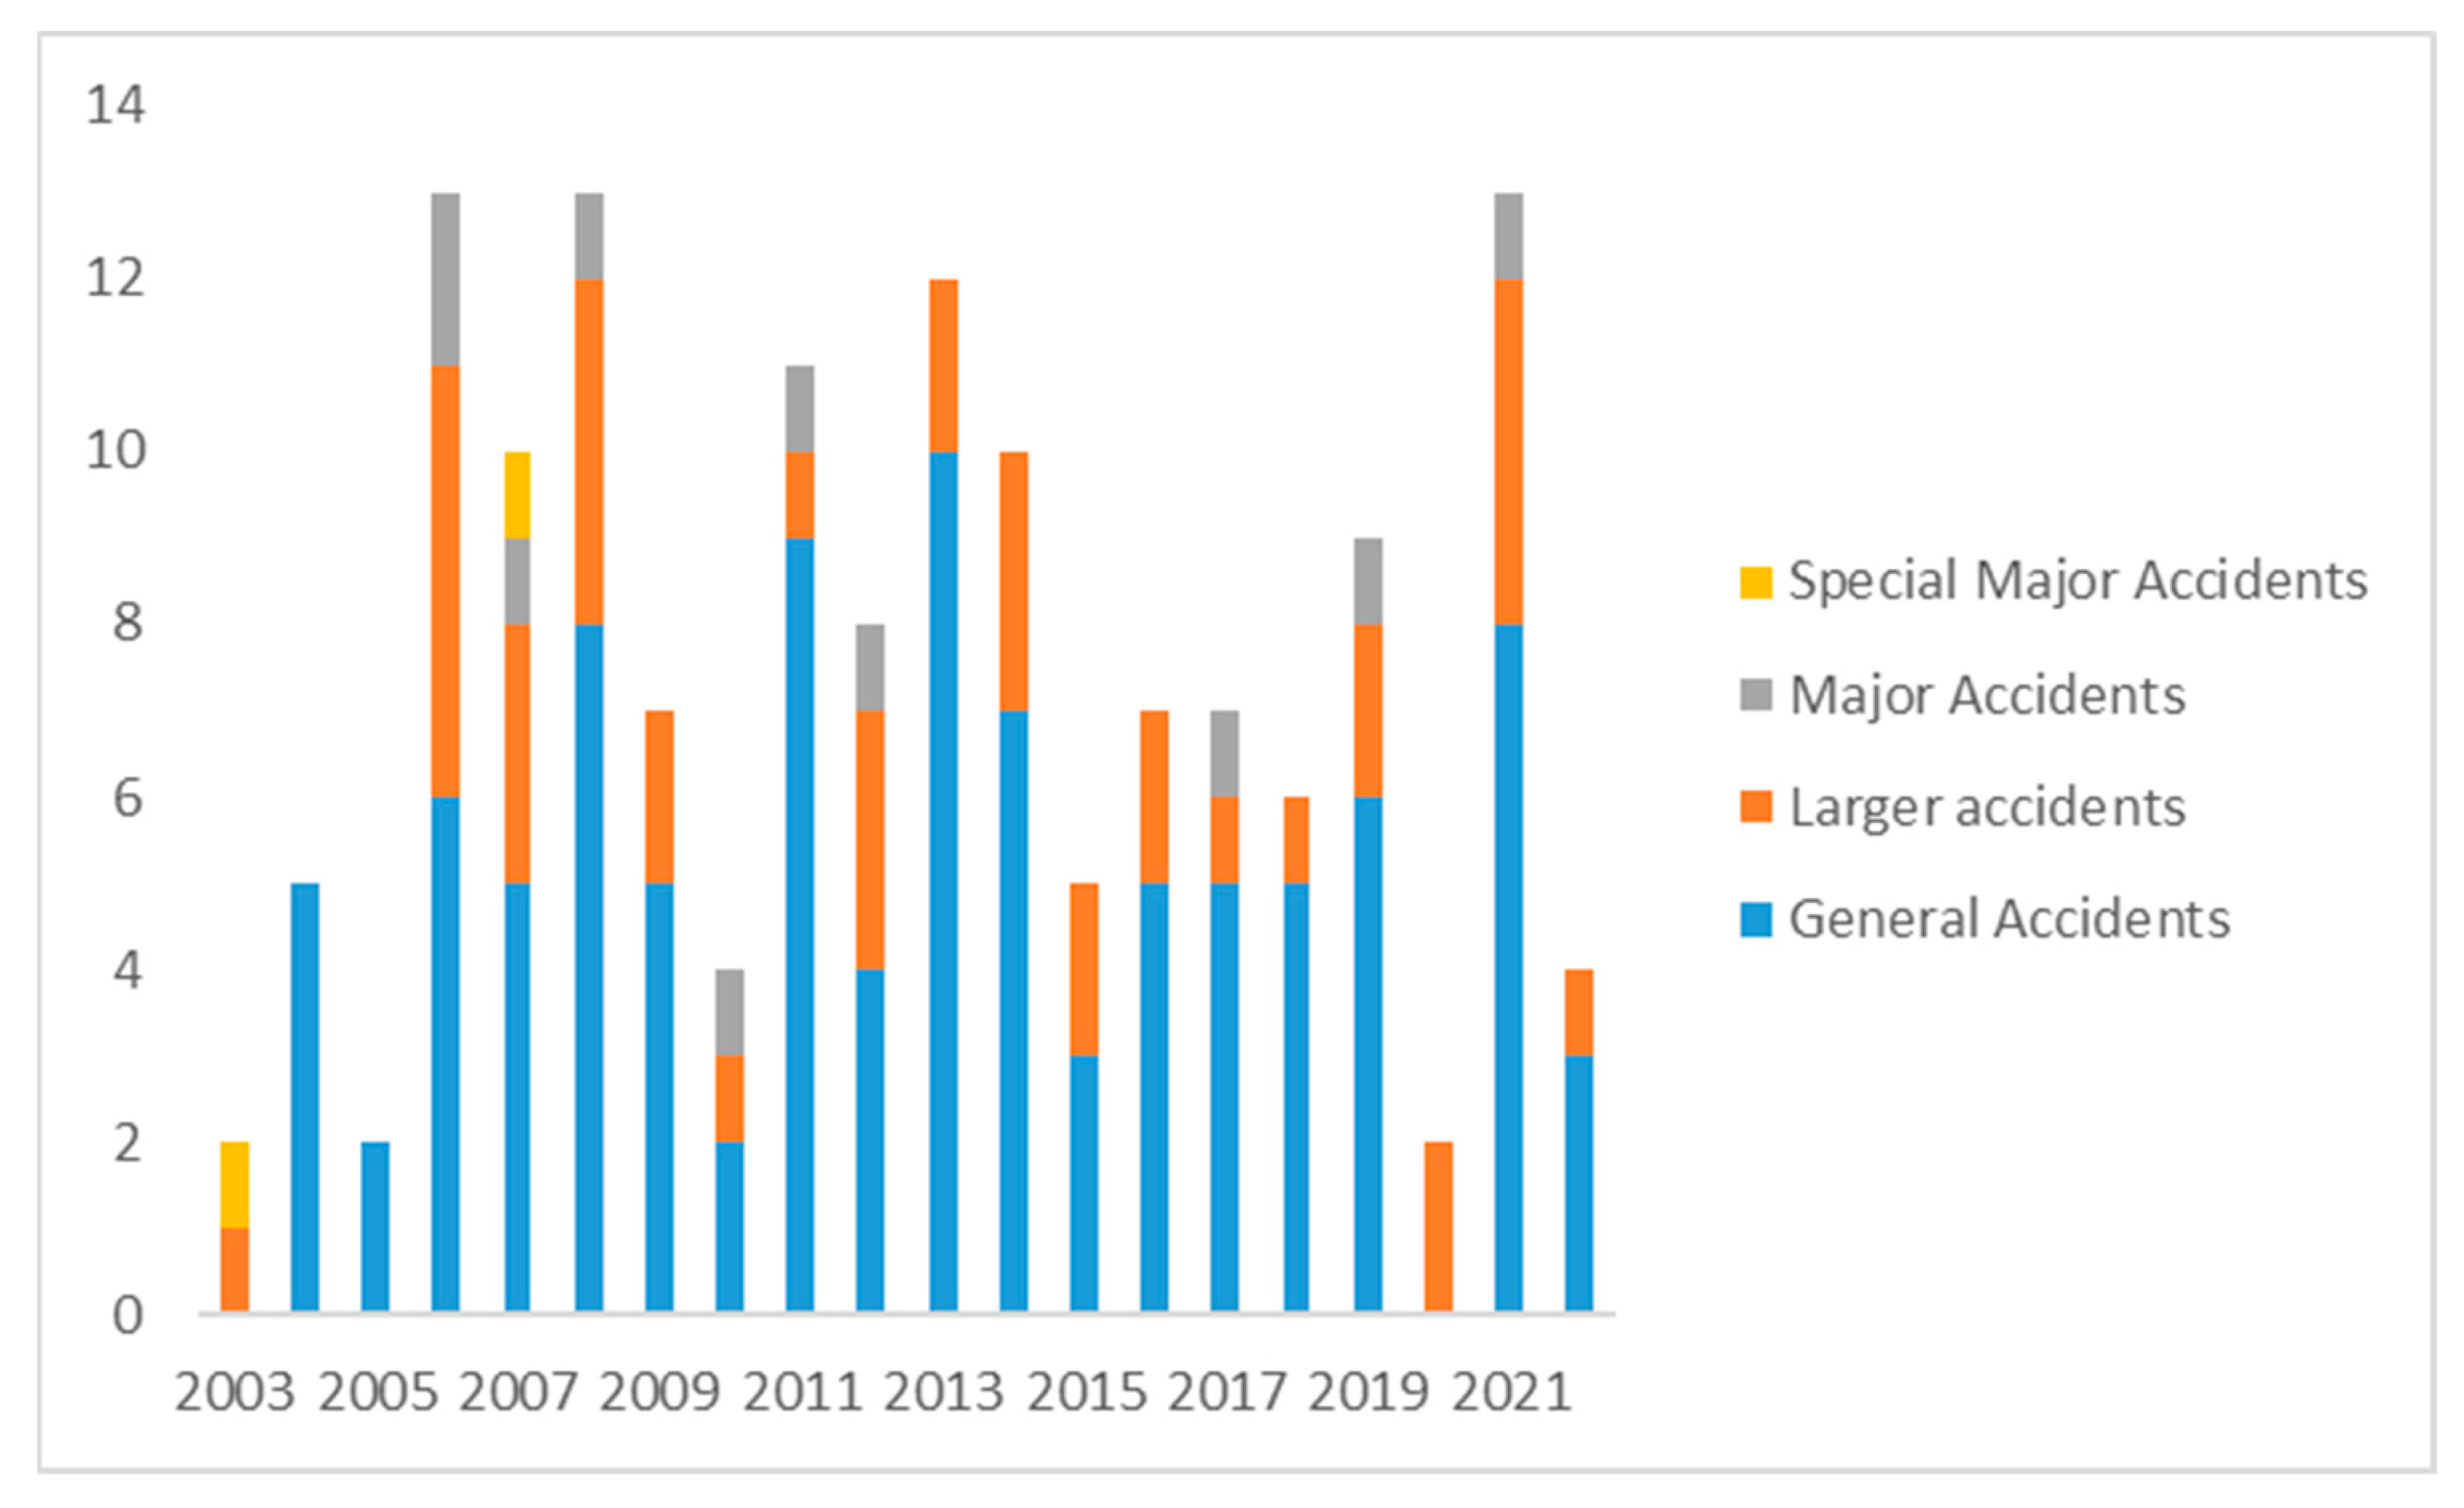
Based on the N-K model, 150 accident causes were analyzed, the frequency of occurrence of 16 types of coupling patterns were counted, and their risk coupling times and frequency of occurrence are shown in Table 4, where “0” means that in this coupling pattern, the corresponding risk factors were not involved in the coupling; and “1” indicates that in this coupling pattern, the corresponding risk factors are involved in the coupling. For example, the single-factor coupling of personnel risk appeared 14 times, i.e., P 1000 = 14/150 = 0.0933; the two-factor coupling of personnel and equipment risk appeared once, i.e., P 1100 = 1/150 = 0.0067; the three-factor coupling of personnel, equipment and environment risk appeared twice, i.e., P 1110 = 2/150 = 0.0133; and the three-factor coupling of equipment, environment and management risk appeared 5 times, i.e., P 0111 = 5/150 = 0.0333; and other coupling patterns were calculated as above.
Firstly, the probability of occurrence of different coupling types was calculated, as shown in Table 5, where P 0 = P 0000 + P 0100 + P 0010 + P 0001 + P 0110 + P 0101 + P 0011 + P 0111 = 0.5067 , and the probability of coupling of other factors was calculated as above.
Based on 
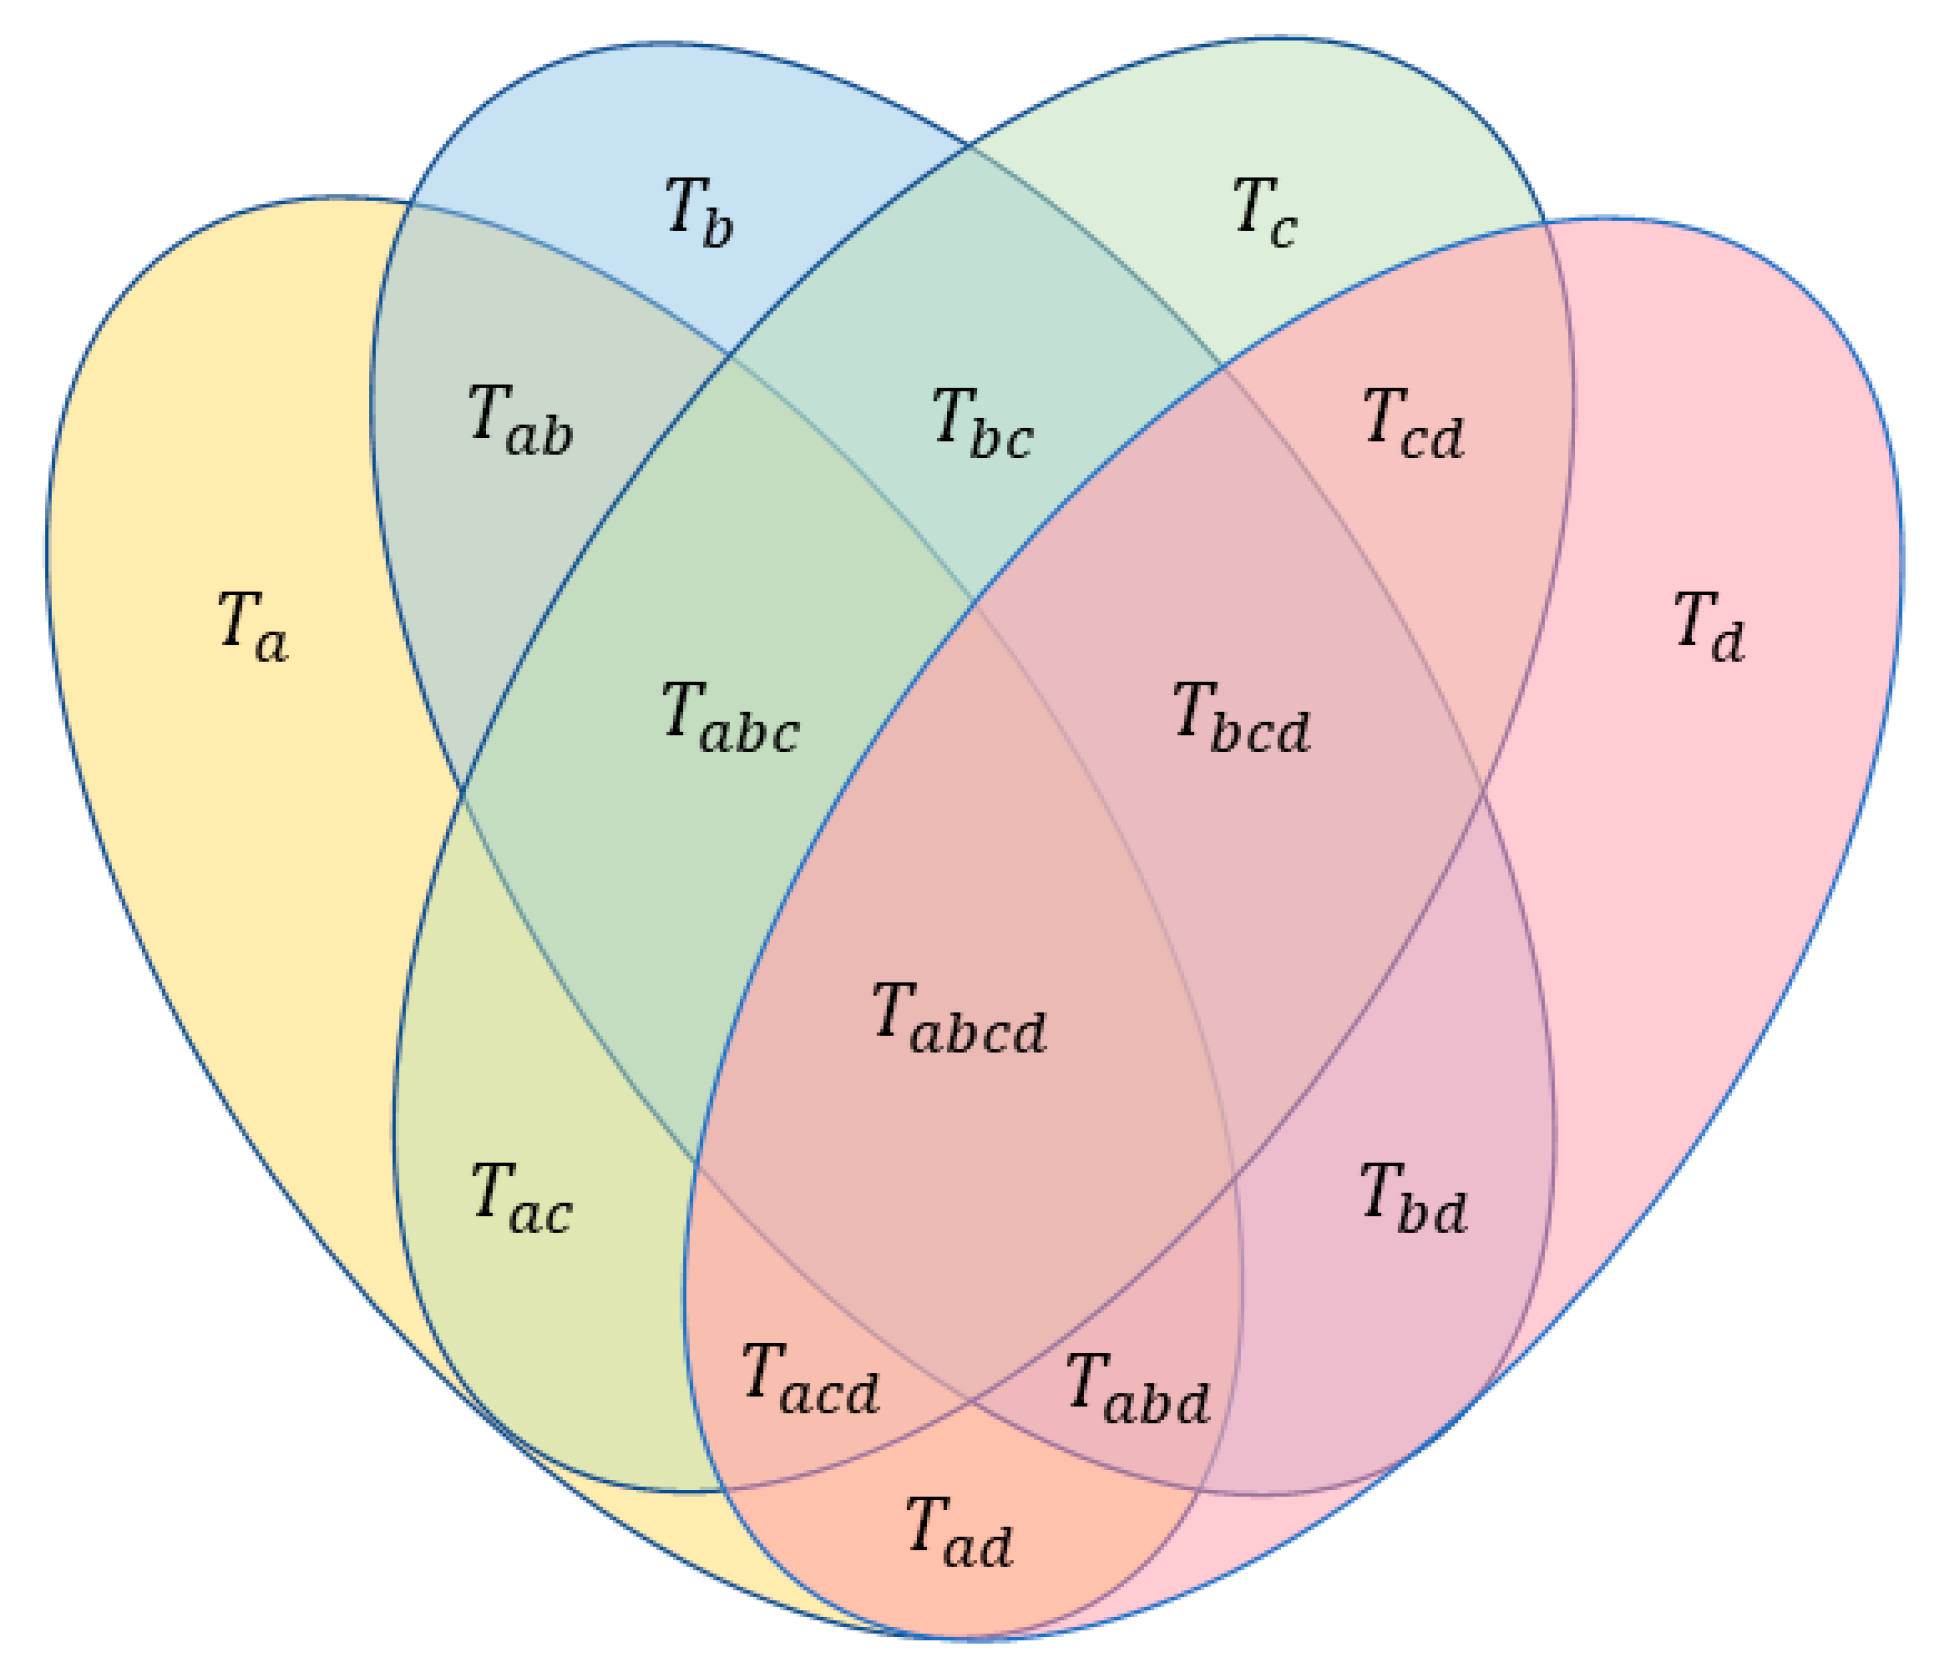
Table 4, the risk flow values T for construction safety accidents caused by different types of risk coupling can be calculated according to Equations (1)–(11).
As an example, a four-factor coupled stream-of-risk value was calculated:
T a b c d = h = 1 H i = 1 I j = 1 J k = 1 K p h , i , j , k l o g 2 ( p h , i , j , k / p h p . i . . p j . p k ) = 0.38395
Similarly, the three-factor coupled risk flow and two-factor coupled risk flow values can be calculated as in Table 6.
Comparing the above results, it can be concluded that T a b c d > T a b c > T a c > T a c d > T a b d > T a d > T b c d > T b c > T a b > T b d > T c d .
That is, the risk flow values are ranked from highest to lowest: personnel–equipment–environment–management, personnel–equipment–environment, personnel–environment, personnel–environment–management, personnel–equipment–management, personnel–management, equipment–environment–management, equipment–environment, equipment–management, environment–management, personnel–equipment.

3.2. Analysis of Key Influences in the Coupling Path of SD Causality Diagram

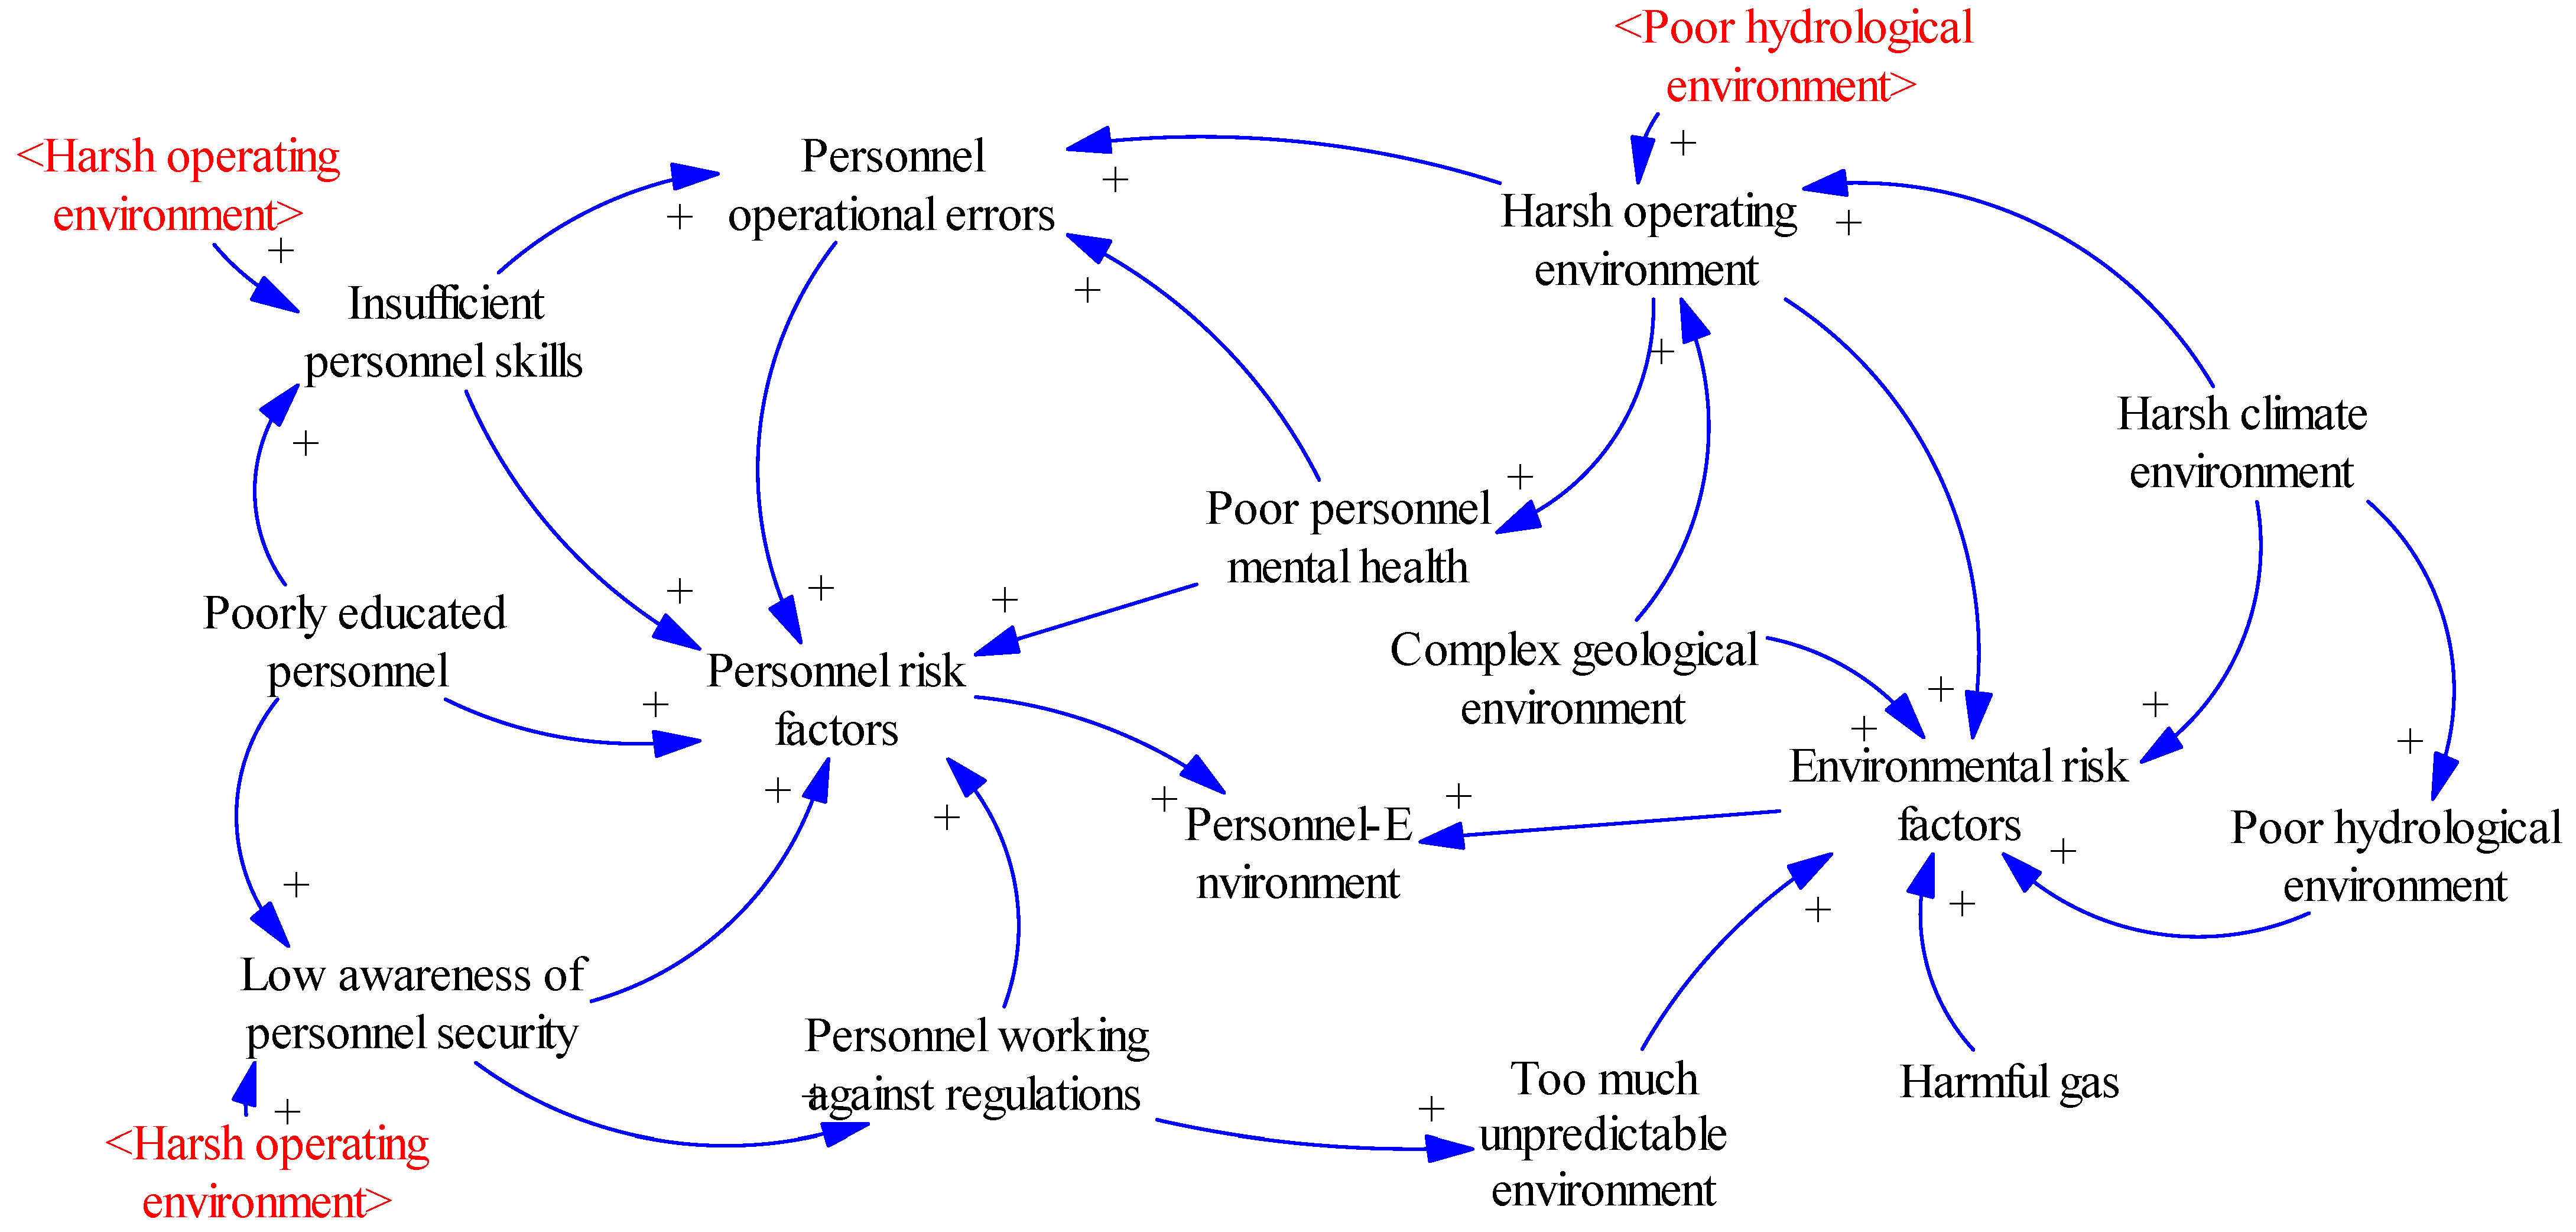
In the two-factor coupled risk, the “personnel–environment” coupling risk is the largest, and the coupling relationship of key factors in the “personnel–environment” coupling risk is analyzed by the SD model. In the tunnel construction safety system, the tunnel construction environment is a risk source that the construction personnel cannot avoid, and the complexity of the construction environment will affect the working conditions of the construction personnel, while the unsafe behavior of the construction personnel will also lead to unforeseen environmental risk factors. In the “personnel–environment” system, the complex geological environment, harsh climate and poor hydrological environment will cause a complex operating environment, which will result in an insufficient technical level or lower safety awareness of personnel, leading to operational errors and increased probability of construction safety accidents; at the same time, the weak safety awareness of personnel will also lead to violations of regulations. At the same time, the low awareness of personnel safety will also lead to the unregulated operation of personnel, thus causing an unforeseen environment. Therefore, in the coupled risk of “personnel–environment”, the insufficient technical level and low safety awareness of personnel are the key subfactors of personnel risk, while the complex geological environment and complex operation environment are the key subfactors of environmental risk. The cause-and-effect relationship between the risk factors in the “personnel–environment” coupling is shown in Figure 5.
To verify the rationality of the “personnel–environment” risk coupling causality diagram, two typical cases are selected to support it.
On 11 April 2008, a mud-bursting and water gushing accident occurred in Maluqing Tunnel, resulting in five deaths. The main cause of the accident was a complex operating environment caused by regional heavy rainfall. After the construction unit required all personnel to evacuate, some did not evacuate and entered the water release tunnel in violation of regulations, leading to the accident. The coupling link of risk factors can be summarized as follows: harsh climate environment→harsh operating environment→low awareness of personnel security→personnel working against regulations.
On 19 July 2009, a collapse accident occurred in Yangjiagou Tunnel, resulting in two deaths. The main reason for the accident is that the continuous rainfall before the accident caused the seepage of fissure water in local strata, forming a complex working environment. Due to the poor measurement of the surrounding rock by the construction personnel, the initial completed support was crushed during the construction process, leading to local collapse. The risk factor coupling link can be summarized as follows: harsh climate environment→poor hydrological environment→harsh operating environment→insufficient personnel skills→personnel operation errors.
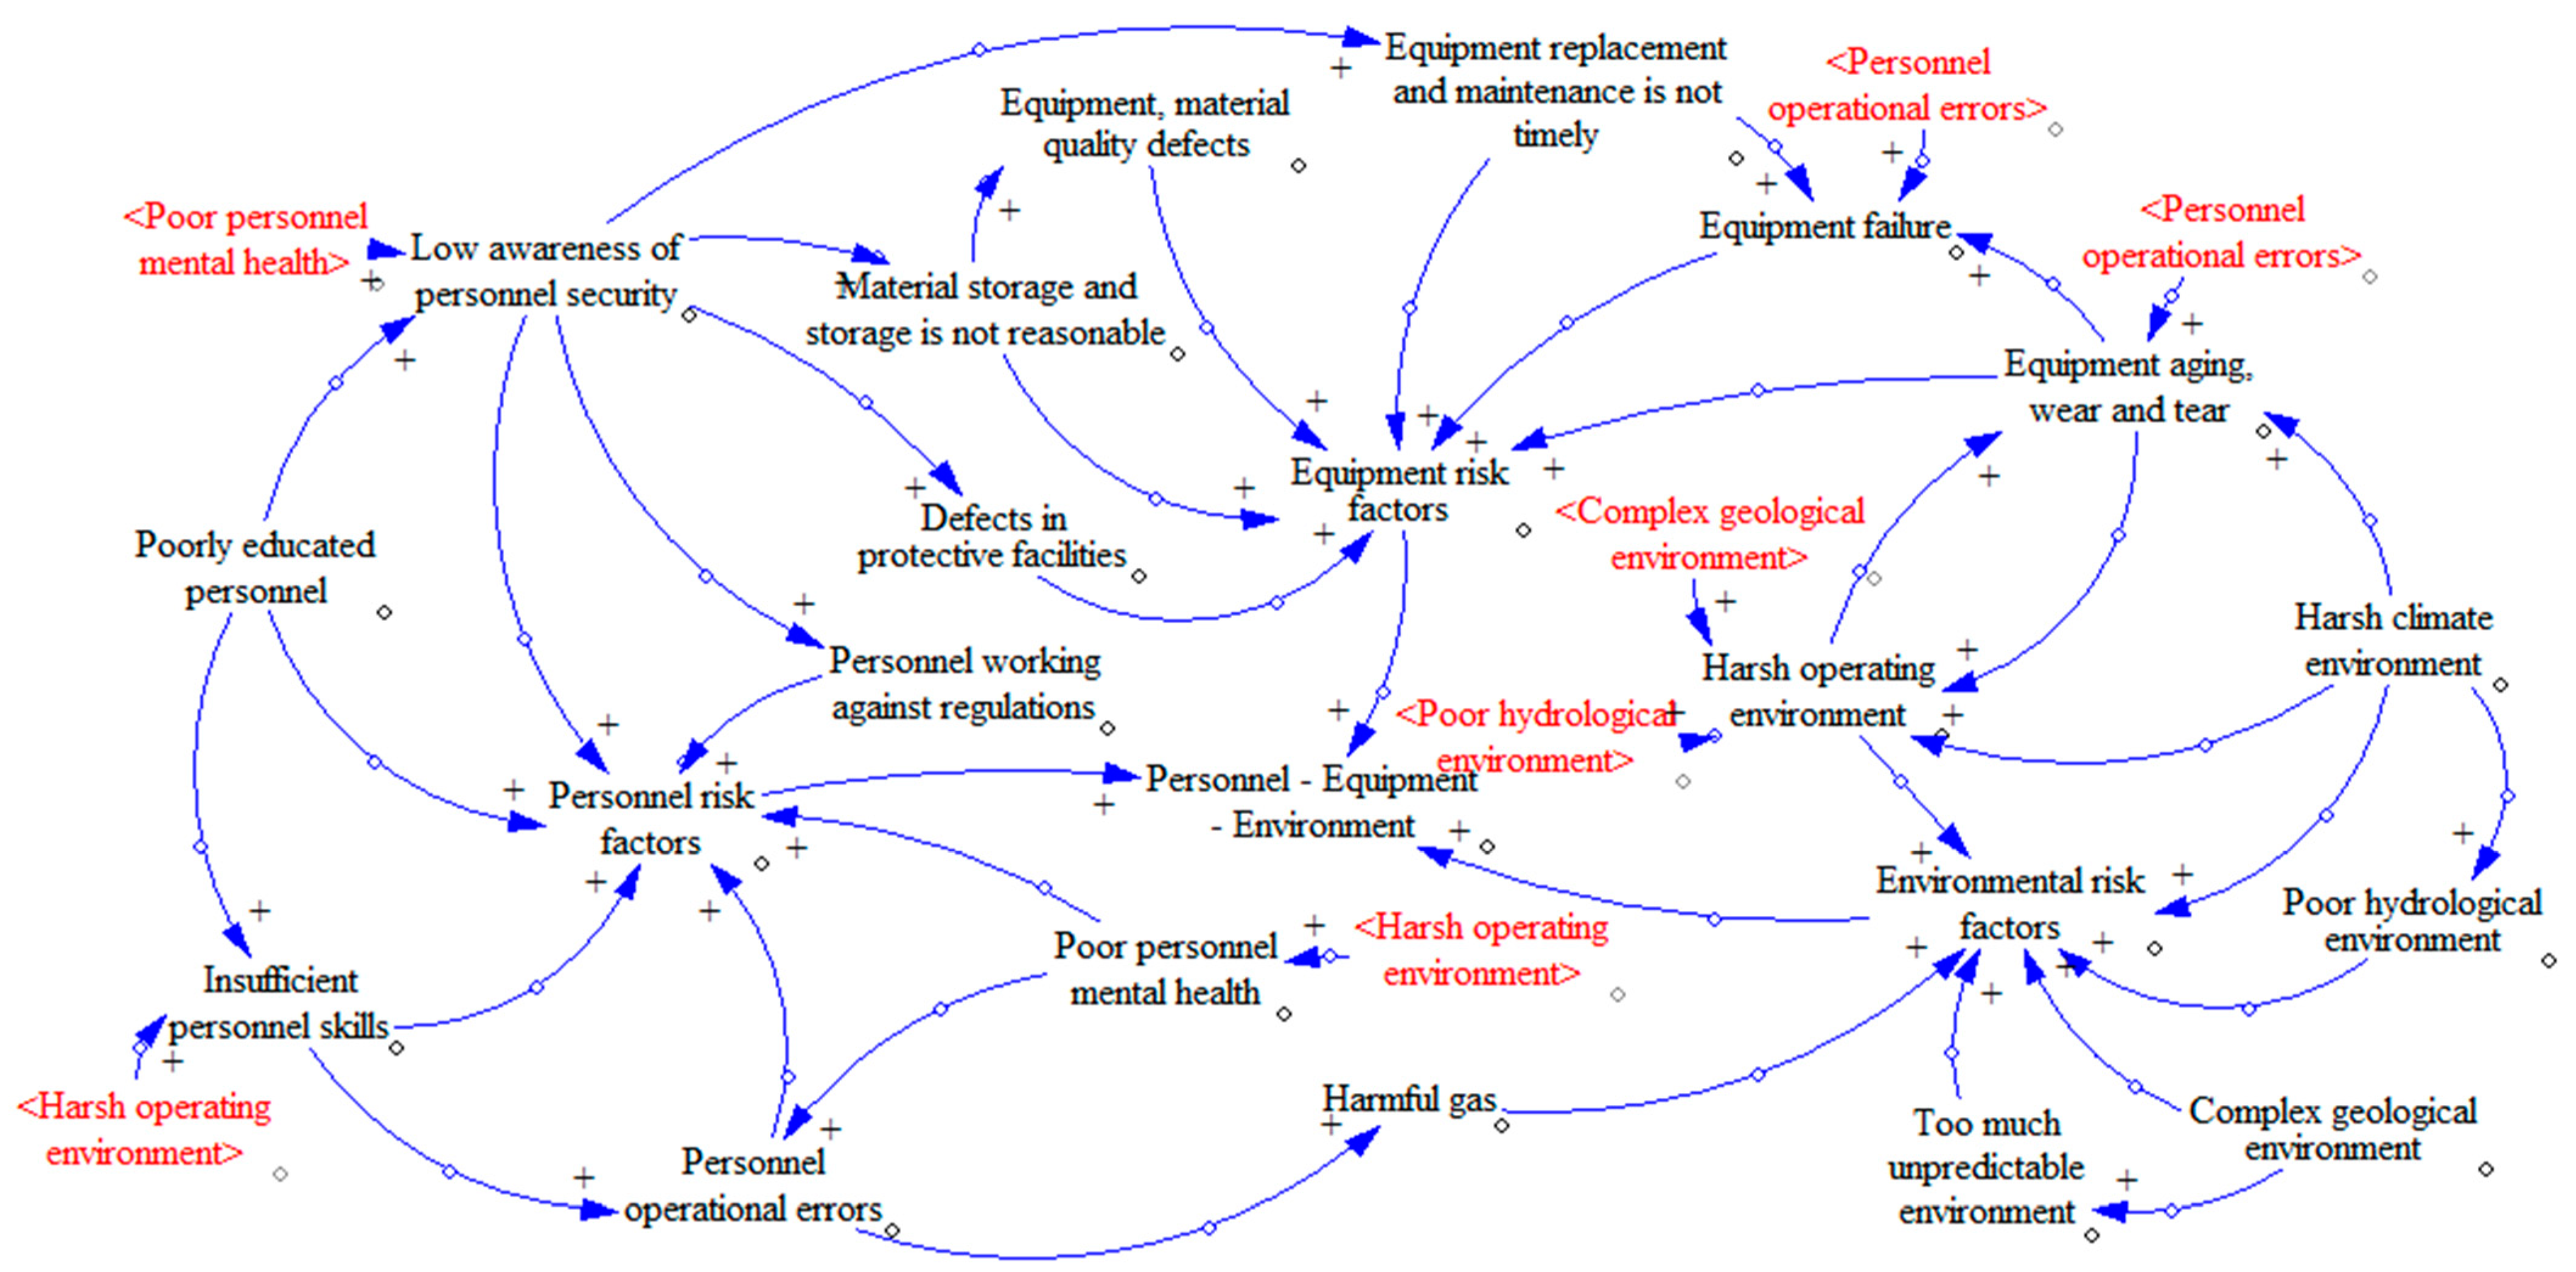
The coupling risk of “personnel–equipment–environment” is the largest among the three factors, and the coupling relationship of key factors in the coupling risk of “personnel–equipment–environment” is analyzed by the SD model. In the “personnel–equipment–environment” system, with personnel as the main body of construction activities, the psychological condition of the construction personnel will have a direct or indirect impact on the equipment risk factors and environmental risk factors; the low awareness of personnel safety will cause the use of equipment and materials to be unreasonable, thus increasing the level of equipment risk factors; while the inadequate technical level of personnel will lead to operational errors, which will accelerate equipment aging and wear and tear and increase the probability of equipment failure. Environmental risk factors such as harsh climate, a complex geological environment and a poor hydrological environment will cause a complex operating environment, which will affect the psychological condition of the construction personnel and influence their risk factors. The aging and wear of equipment will act on the environment, intensifying the complexity of the operating environment and leading to construction safety risks. Therefore, in the coupled risk of “personnel–equipment–environment”, the key subfactors of personnel risk include poor personnel mental health, insufficient personnel skills and low awareness of personnel security; the key subfactors of environmental risk include a complex geological environment, a harsh climate environment and a harsh operating environment; and the key subfactors of equipment risk include aging and wear and tear of equipment and equipment failure. The causal relationship between the risk factors in the coupling of “personnel–equipment–environment” is shown in Figure 6.
In order to verify the rationality of the “personnel–equipment–environment” risk coupling causality diagram, two typical cases have been selected to support it.
On 2 May 2021, a gas poisoning accident occurred in Huangshanshao Tunnel, resulting in three deaths and three serious injuries. The main cause of the accident was the special herringbone shape of the Huangshanshao tunnel, with long variable ramp terrain structure characteristics, forming a complex geological environment; the internal combustion locomotive operation due to the complex geological environment resulted in the locomotive diesel engine air intake being seriously inadequate, and due to the lack of oxygen, the emission of carbon smoke exhaust gas accumulated in the operating area, resulting in a poor operating environment; under the influence of this poor working environment, the construction personnel had little safety awareness and did not wear the relevant safety protection equipment, resulting in casualties from carbon monoxide (CO) poisoning. The coupling chain of risk factors can be summarized as follows: complex geological environment→harsh operating environment→poor personnel mental health→low awareness of personnel security→defects in protective facilities.
On 19 March 2010, a collapse accident occurred in a tunnel in Xinqixiaying, resulting in 10 deaths. The main reason for the accident was that the construction was at the turn of winter and spring, resulting in alternating freezing and thawing of geotechnical fissure water, causing tunnel destabilization and forming a complex geological environment; under this poor geological environment, the initial support grid steel frame destabilization caused the collapse of the surrounding rock due to a lack of understanding of the complex geological and natural conditions of the region by the construction party, and the lack of support measures in place. The coupling link of risk factors can be summarized as follows: harsh climate environment→complex geological environment→harsh operating environment→insufficient personnel skills→personnel operational errors→equipment failure.
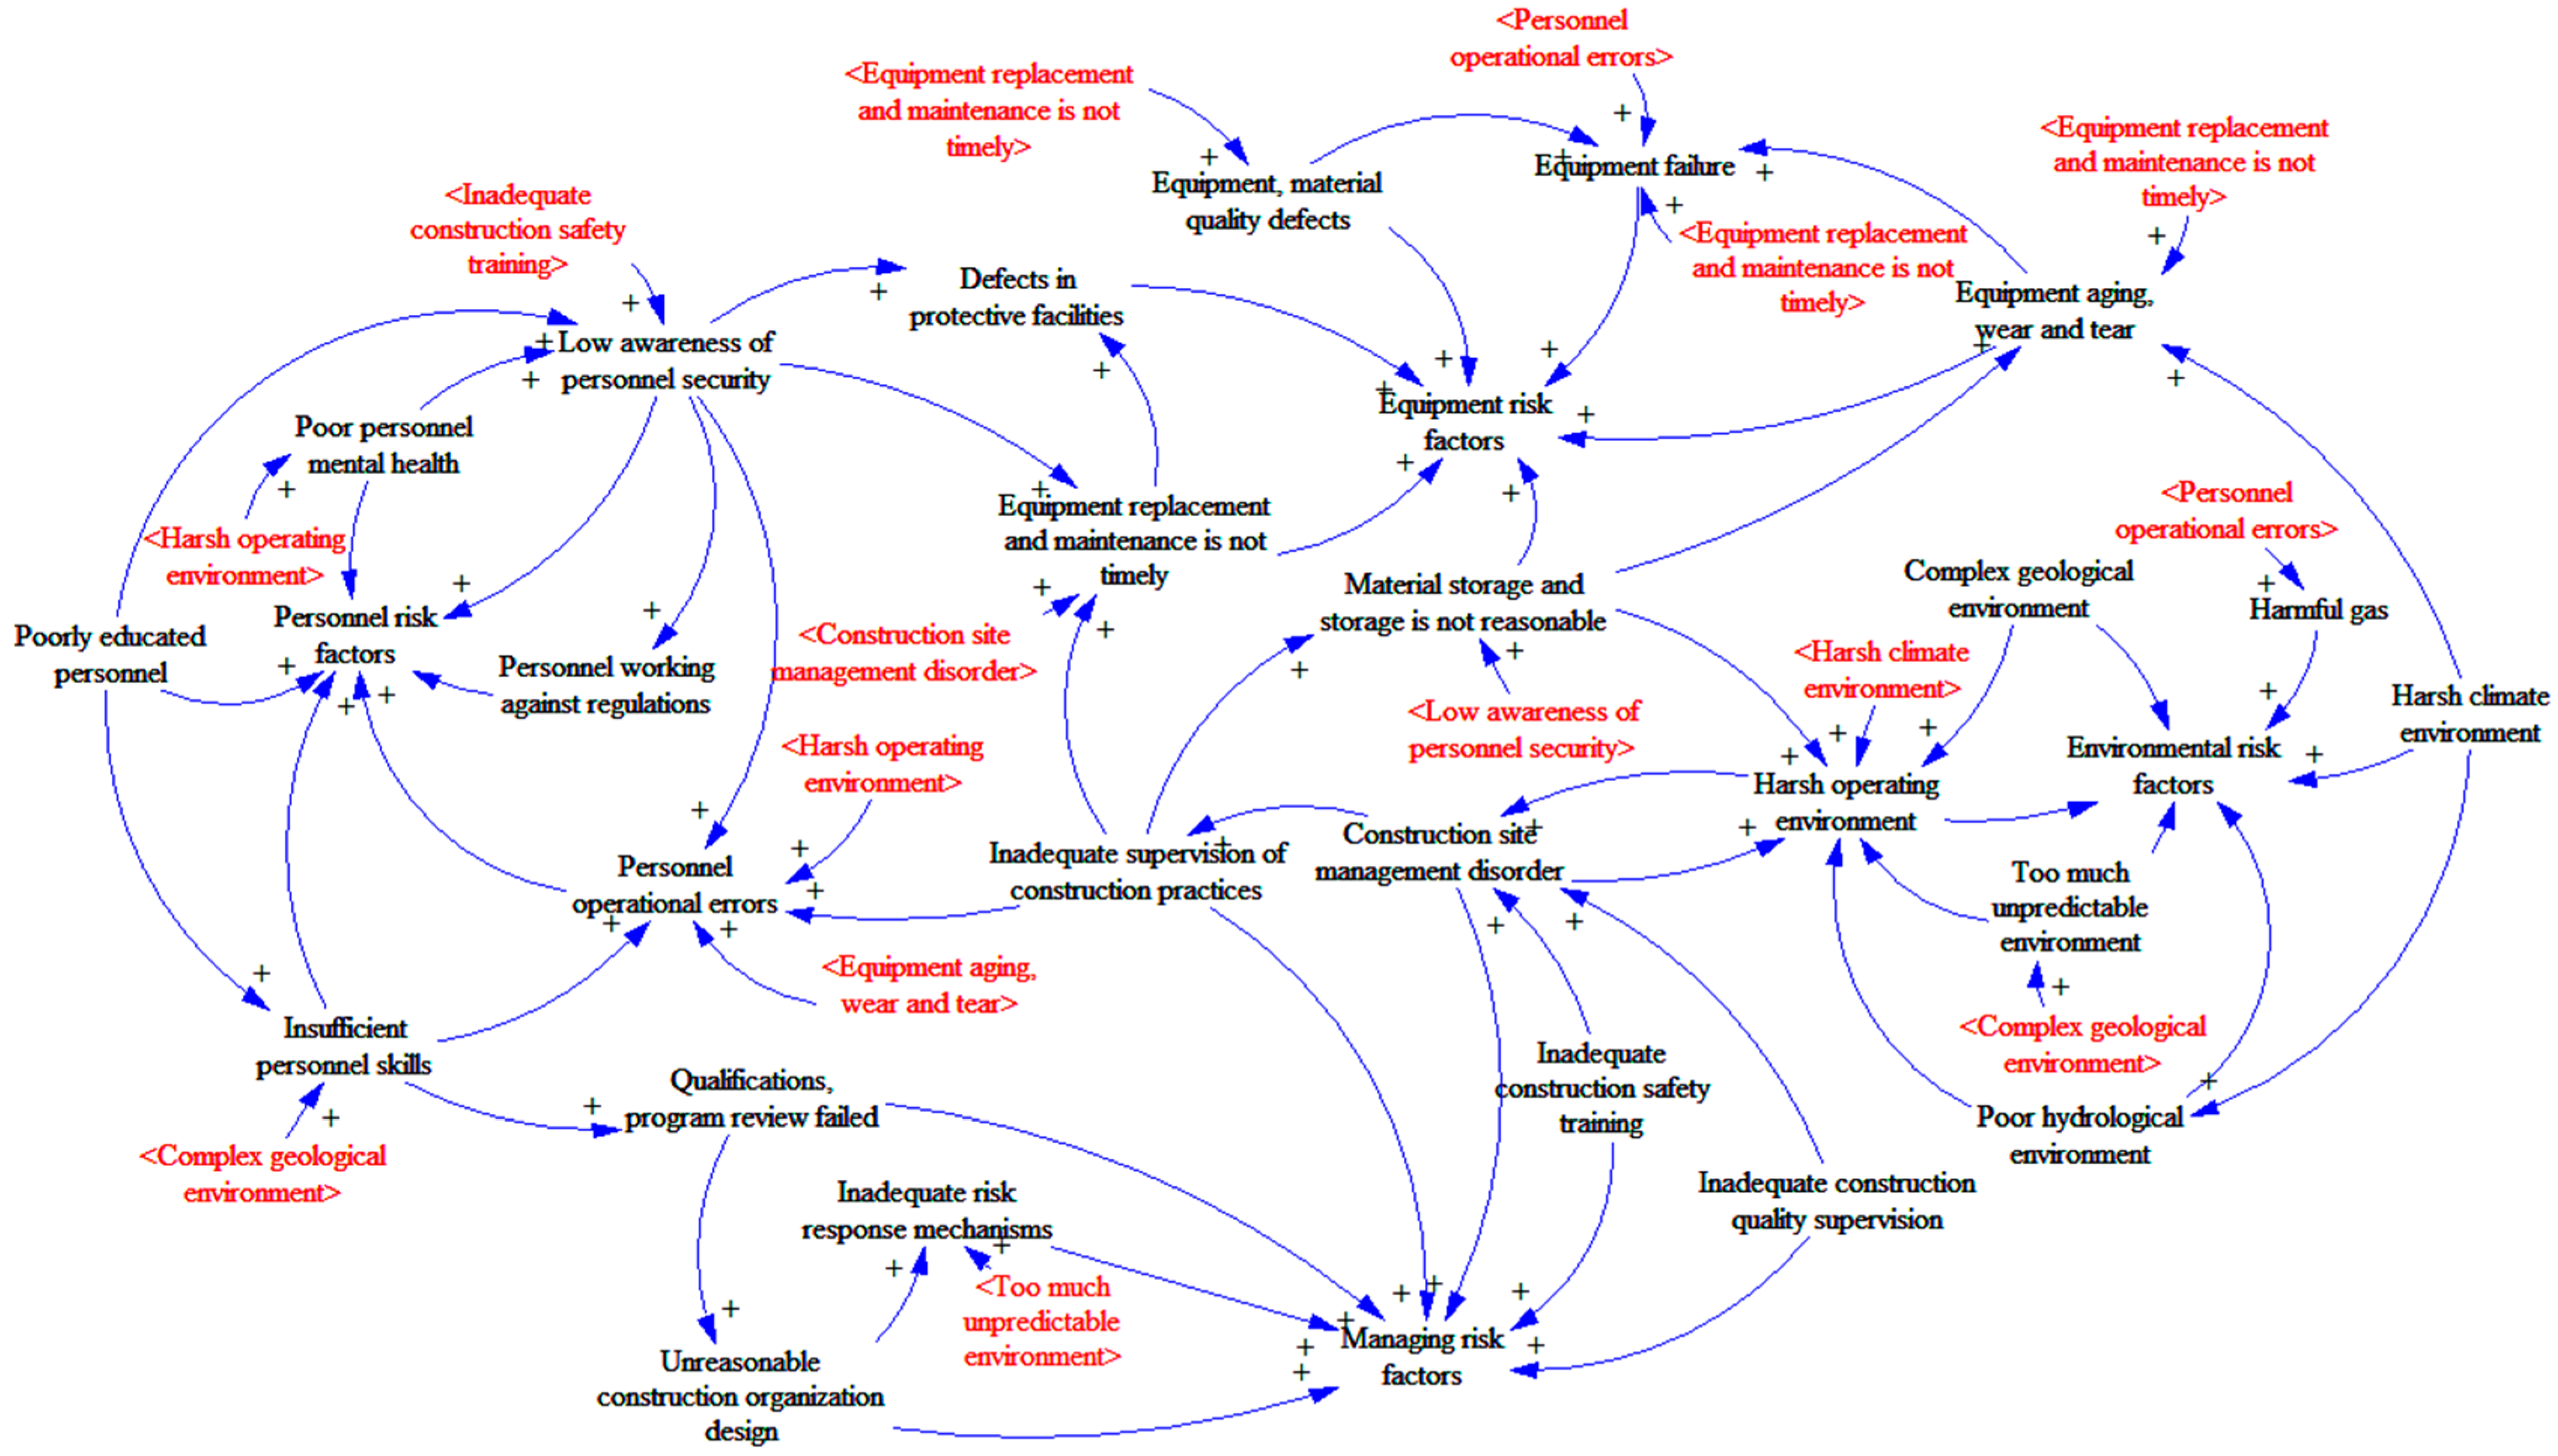
The coupling risk of “personnel–equipment–environment–management” has the largest risk flow value among all coupling risk types, and the coupling relationship of key factors in the coupling risk of “personnel–equipment–environment–management” is analyzed by the SD model. The personnel risk factor as a subjective factor in the “personnel–equipment–environment–management” system has a role in the other three risk factors; the management risk factor is the core element connecting the personnel risk factor, equipment risk factor and environmental risk factor. The construction site management level directly affects the environment and equipment factors, and the supervision of construction behavior also plays a restraining role on personnel risk factors; the use of equipment is closely related to the technical level and safety awareness of personnel, and is also affected by management factors and environmental factors; the geological environment, climatic environment and hydrological environment as irresistible environmental factors directly affect the psychological condition of construction personnel and the degree of aging and wear of equipment, and increase the difficulty of management. The cause-and-effect relationship between the risk factors in the coupling of “personnel–equipment–environment–management” is shown in Figure 7.
In order to verify the rationality of the risk-coupled cause-effect diagram of “personnel–equipment–environment–management”, a typical case is selected to support it.
On 14 September 2017, a tunnel roof collapse accident occurred in Manme Tunnel No. 1, resulting in nine people trapped and zero casualties. The main reason for the accident was that the tunnel construction was in the rainy season, the climatic environment caused the tunnel groundwater increase and the hydrological environment was complex; due to the construction site management chaos, construction behavior supervision was not effective, resulting in weak awareness of personnel safety; construction did not comply with the relevant technical regulations, resulting in safety steps exceeding the standard; the initial support had a longer period of time to bear a huge load, and the foot of the arch location I-beam base eventually softened, causing the collapse of the roof. The coupling link of risk factors can be summarized as follows: harsh climate environment→poor hydrological environment→harsh operating environment→construction site management disorder→inadequate supervision of construction practices→low awareness of personnel security→personnel operation errors→equipment failure.

4. Results and Discussion

This article constructs an N-K model and SD causality diagram based on 150 tunnel construction safety accidents that occurred from 2003 to 2022. The conclusions and suggestions drawn are as follows:
(1)
Based on the results of the N-K model, it is found that:
(a)
The risk value is greatest when all four factors are involved in the coupling, and the three-factor coupling is generally higher than the risk value when performing two-factor coupling. This indicates that as the risk factors increase, the risk of causing tunnel construction safety accidents also increases, so multifactor coupling should be avoided in tunnel construction as much as possible;
(b)
Among the three-factor coupled risks, accident occurrence is more closely coupled with the “personnel–equipment–environment” risk factors, indicating that equipment conditions and personnel factors have a more significant impact on tunnel construction safety in areas with complex geological conditions;
(c)
Among the two-factor coupled risks, the highest two-factor risk value is for “personnel–environment” risk coupling, followed by “personnel–management” risk coupling, both of which have human factors involved in the coupling, indicating that human subjective influence is the greatest in the tunnel construction process, while attention should also be paid to the influence of environmental and management factors on tunnel construction safety.
(2)
Based on the SD causality diagram, it is found that:
(a)
For the “personnel–environment” coupled risk, since the geological environment risk factor is unavoidable, the management of personnel should be strengthened to improve their technical level and safety awareness through safety training, and to establish a safety responsibility concept when tunneling in a complex environment, as well as a detailed exploration of the environment. The environment should be explored in detail to minimize the influence of the operating environment on the behavior of personnel and to create a good operating environment;
(b)
For the coupled risk of “personnel–equipment–environment”, in the process of tunnel construction, on the basis of the important subfactors of personnel risk and environmental risk, we should also strengthen the supervision of the important subfactors of equipment—regular maintenance and repair of equipment to reduce the risk of aging and wear of equipment and the probability of equipment failure—to reduce the coupling of risk factors. The coupling effect between risk factors should be reduced;
(c)
For the coupled risk of “personnel–equipment–environment–management”, since the personnel risk factors and management risk factors occupy a dominant position, a perfect construction supervision mechanism should be established to strengthen the supervision of personnel risk factors and management risk factors, optimize the construction site management, focus on the construction behavior of construction personnel to prevent their coupling with other factors, and minimize the probability of coupling of the four factors.
Compared with traditional studies that mostly quantify risk factors independently and ignore the mutual cross-coupling relationship between risk factors in risk evaluation [39,40,41], this study identifies the higher-risk coupling forms based on the N-K model for the characteristics of tunnel construction safety in the perspective of risk coupling, and quantifies the hazard degree of the coupling effect of different risk factors. On this basis, the important risk subfactors in the risk coupling chain are analyzed by establishing an SD causality diagram, which makes up for the deficiency of the traditional N-K model, which cannot explore the risk subfactor conduction path [25,42], and identifies the key risk factors and key coupling chains in risk coupling.
Taken together, this study provides a theoretical basis for the ex ante control of tunnel construction safety management and a new method for decision makers to assess tunnel construction safety risks, and helps to improve the level of tunnel construction safety risk control. However, since this paper only investigates the static coupling relationship between risk factors, we have not yet studied the dynamic changes of the coupling relationship between risk factors, and this needs to continue to be improved in future research.

Author Contributions

Methodology, D.Y.; Formal analysis, M.Z.; Investigation, M.Z. and T.W.; Project administration, D.Y.; Supervision, T.W. and C.X.; Writing—original draft, M.Z.; Writing—review & editing, D.Y., T.W. and C.X. All authors have read and agreed to the published version of the manuscript.

Funding

This research received no external funding.

Data Availability Statement

Not applicable.

Conflicts of Interest

The authors declare no conflict of interest.

Appendix A

Table A1. Tunnel construction safety accident case summary.
NumberDateLocation of the AccidentsRisk EventsType of AccidentsAccident CasualtiesType of Coupling
129 July 2022Hejianlan Expressway TunnelMud outburst and water gushingMajor accident4 deathsEnvironment
216 May 2022Huangbuwu TunnelRoof fallingOrdinary accident1 deathEnvironment
39 May 2022Dongshenlang TunnelHit by an objectOrdinary accident1 deathEquipment–environment
425 February 2022Hefei Metro Line 6CollapseOrdinary accident1 deathPersonnel–management
516 December 2021Xiahuangtian TunnelHit by an objectOrdinary accident1 deathPersonnel–management
616 November 2021Yantangshan TunnelCollapseMajor accident3 deathsEnvironment–management
712 October 2021Tianjin Metro Line 4CollapseMajor accident4 deathsPersonnel–management
88 October 2021Pingda TunnelCollapseOrdinary accident1 deathPersonnel–equipment–management
92 October 2021Hangzhou Metro Line 9CollapseOrdinary accident2 deathsPersonnel–equipment–environment–management
101 October 2021Xiangshan TunnelCollapseOrdinary accident1 deathEnvironment–management
1111 September 2021Paozhuqing TunnelRoof fallingOrdinary accident2 deathsEnvironment–management
127 September 2021Shangzhou TunnelCollapseOrdinary accident2 deathsPersonnel–environment–management
1329 July 2021Yongtai TunnelVehicle injuryOrdinary accident1 deathPersonnel–equipment–management
1415 July 2021Shijingshan TunnelWater leak accidentSerious accident14 deathsPersonnel–management
156 June 2021Tianshan Victory TunnelVehicle injuryOrdinary accident1 deathPersonnel
163 May 2021Longtouling TunnelCollapseMajor accident6 deathsEnvironment–management
172 May 2021Huangshanshao TunnelGas poisoningMajor accident3 deathsPersonnel–equipment–environment
1810 September 2020Shanggang TunnelCollapseMajor accident9 deathsPersonnel–environment–management
1925 May 2020Yongkang TunnelHit by an objectMajor accident3 deathsEnvironment–management
2030 December 2019Xichengshan TunnelCollapseMajor accident6 deathsPersonnel
218 December 2019Maoshan TunnelHit by an objectOrdinary accident1 deathPersonnel
2226 November 2019Anshi TunnelMud outburst and water gushingSerious accident12 deathsEnvironment
2320 November 2019Yakou TunnelVehicle injuryOrdinary accident1 deathPersonnel–management
247 November 2019Hongshiliang TunnelCollapseOrdinary accident1 deathEnvironment
2523 September 2019Hanjiashan TunnelVehicle injuryOrdinary accident1 deathPersonnel–management
2616 August 2019Yongfutun TunnelMud outburst and water gushingOrdinary accident1 deathEnvironment–management
2715 July 2019Jichang TunnelExplosion accidentMajor accident4 deathsManagement
286 April 2019Shantouping TunnelCollapseOrdinary accident1 deathEnvironment
2920 December 2018Wangzhushan TunnelCollapseOrdinary accident1 deathPersonnel–management
3015 September 2018Mialo No. 3 TunnelWater and stone inrush accidentMajor accident6 deathsEnvironment
316 September 2018Tianshui No. 1 TunnelCollapseOrdinary accident2 deathsManagement
3229 August 2018Yonghe No. 1 TunnelMechanical injuryOrdinary accident1 deathPersonnel–management
3310 July 2018Shangge Village Tunnel No. 1CollapseOrdinary accident1 deathEnvironment–management
3416 June 2018Fuxing TunnelHit by an objectOrdinary accident2 deathsPersonnel–equipment–management
3520 December 2017Yongcun TunnelVehicle injuryOrdinary accident1 deathPersonnel–management
364 November 2017Phoenix Hill Tunnel ProjectFalling from a heightOrdinary accident1 deathPersonnel–management
3714 September 2017Manme No. 1 TunnelRoof fallingOrdinary accident0 deathsPersonnel–equipment–environment–management
3821 June 2017Hongdoushan TunnelMud outburst and water gushingMajor accident6 deathsEnvironment–management
392 May 2017Qishanyan TunnelExplosion accidentSerious accident12 deathsPersonnel–environment–management
401 May 2017Zhongcun TunnelCollapseOrdinary accident2 deathsPersonnel–management
4111 January 2017Mira Mountain TunnelVehicle injuryOrdinary accident1 DeathPersonnel–management
4224 December 2016Aimin TunnelFireMajor accident3 deathsPersonnel–management
4323 December 2016Ranjiawan TunnelVehicle injuryMajor accident3 deathsEquipment
4429 August 2016Ping Salt Passage Section 3 TunnelHit by an objectOrdinary accident1 deathPersonnel–environment–management
4525 August 2016Daniujiaogou TunnelVehicle injuryOrdinary accident1 deathPersonnel
4610 August 2016Yubai TunnelFalling from a heightOrdinary accident1 deathPersonnel
4717 May 2016Tangjiagou TunnelHit by an objectOrdinary accident1 deathManagement
485 April 2016TJ11 Standard No. 3 TunnelRoof fallingOrdinary accident1 deathPersonnel–management
4918 December 2015Zhoubai Repeater Tunnel ProjectCollapseMajor accident6 deathsManagement
5016 October 2015Yanpoli TunnelMechanical injuryOrdinary accident1 deathPersonnel–environment–management
5113 August 2015Songshan Lake TunnelMud outburst and water gushingOrdinary accident1 deathEnvironment
5215 March 2015Qianshan TunnelExplosion accidentOrdinary accident2 deathsPersonnel
5324 February 2015Wuluo Road Tunnel No. 1Explosion accidentMajor accident7 deathsPersonnel–environment–management
545 December 2014Longyan Houci TunnelCollapseOrdinary accident0 deathsPersonnel–environment–management
5515 September 2014Taoyuan No. 1 TunnelCollapseOrdinary accident6 deathsPersonnel–equipment–management
5631 August 2014Yangpozhuang TunnelCollapseOrdinary accident0 deathsManagement
5728 July 2014Dunliang TunnelCollapseMajor accident3 deathsEnvironment–management
5824 July 2014Pupeng No. 1 TunnelExplosion accidentOrdinary accident1 deathPersonnel
5914 July 2014Funing TunnelCollapseOrdinary accident1 deathPersonnel–management
601 July 2014Da Dushan Tunnel No. 2 Cross HoleCollapseMajor accident4 deathsManagement
613 May 2014Longtouling TunnelCollapseMajor accident6 deathsEnvironment–management
622 April 2014Xiaopanling No. 1 TunnelCollapseOrdinary accident0 deathsPersonnel–management
6325 February 2014Datang TunnelRoof fallingOrdinary accident2 deathsPersonnel–environment–management
642 November 2013Huashi TunnelVehicle injuryOrdinary accident1 deathPersonnel
652 October 2013Taiping TunnelMud outburst and water gushingOrdinary accident0 deathsEnvironment
6619 July 2013Songzitou TunnelExplosion accidentOrdinary accident1 deathPersonnel
6728 June 2013Taoshuping TunnelHit by an objectOrdinary accident1 deathPersonnel–equipment
6813 June 2013Changchun Metro Line 1CollapseOrdinary accident1 deathPersonnel–management
696 May 2013Xian Metro Line 3CollapseMajor accident5 deathsEnvironment
702 May 2013Nanyashan TunnelCollapseOrdinary accident2 deathsEnvironment
7126 April 2013Lvliangshan TunnelExplosion accidentMajor accident8 deathsPersonnel–equipment–management
7222 April 2013Dabanshan No. 1 TunnelExplosion accidentOrdinary accident1 deathPersonnel
7311 March 2013Baoshang TunnelHit by an objectOrdinary accident2 deathsEnvironment
7422 February 2013Zhengzhou Metro Line 1CollapseOrdinary accident2 deathsEnvironment
7515 January 2013Laoluobao TunnelCollapseOrdinary accident2 deathsEnvironment
7631 December 2012Shanghai Metro Line 12CollapseMajor accident5 deathsPersonnel–equipment–management
7730 December 2012Wuhan Metro Line 3CollapseOrdinary accident0 deathsEquipment
7825 December 2012South Luliang Mountain No. 1 TunnelExplosion accidentMajor accident8 deathsPersonnel–equipment–management
7919 September 2012Wuhan Metro Line 2Vehicle injuryOrdinary accident0 deathsPersonnel
8024 August 2012Tongzhai TunnelCollapseOrdinary accident2 deathsEquipment–environment
818 August 2012Wuhan Metro Line 2Hit by an objectOrdinary accident1 deathEnvironment
8224 June 2012Cemacun TunnelCollapseMajor accident6 deathsPersonnel–management
8319 May 2012Bamianshan TunnelExplosion accidentSerious accident20 deathsPersonnel–management
849 December 2011Daan TunnelFireMajor accident6 deathsEquipment
851 December 2011Shengang TunnelHit by an objectOrdinary accident2 deathsEquipment
8625 August 2011Tanshan TunnelFalling from a heightOrdinary accident1 deathPersonnel–management
8726 June 2011Guzishan TunnelMud outburst and water gushingOrdinary accident0 deathsEnvironment
885 June 2011Wuhan Metro Line 2CollapseOrdinary accident0 deathsEnvironment
891 June 2011Beijing Metro Line 6CollapseOrdinary accident1 deathEnvironment
9020 April 2011Xiaopingqiang TunnelCollapseSerious accident12 deathsManagement
914 April 2011Shenzhen Metro Line 5Hit by an objectOrdinary accident1 deathManagement
9229 March 2011Shenzhen Metro Line 1CollapseOrdinary accident0 deathsEquipment
9318 March 2011Dongchuan No. 1 TunnelCollapseOrdinary accident1 deathEquipment–environment–management
9417 March 2011Bailonggang TunnelCollapseOrdinary accident2 deathsPersonnel–environment–management
9514 July 2010Beijing Metro Line 15Hit by an objectOrdinary accident2 deathsPersonnel–management
9619 March 2010Xinqixiaying TunnelCollapseSerious accident10 deathsPersonnel–equipment–environment
978 March 2010Mulan TunnelCollapseOrdinary accident2 deathsPersonnel–environment–management
9816 January 2010Baiyun TunnelMud outburst and water gushingMajor accident6 deathsEnvironment
9913 October 2009Shenzhen Metro Line 5Landslide accidentOrdinary accident1 deathEnvironment
1002 August 2009Xian Metro Line 1CollapseOrdinary accident2 deathsPersonnel–environment
1011 August 2009Meiziao TunnelCollapseMajor accident3 deathsEnvironment–management
10219 July 2009Shenzhen Metro Line 1CollapseOrdinary accident1 deathEnvironment
10319 July 2009Yangjiagou TunnelCollapseOrdinary accident2 deathsPersonnel–environment
10416 March 2009Baotaishan TunnelCollapseMajor accident3 deathsPersonnel–environment–management
10517 February 2009Zhaishancun TunnelCollapseOrdinary accident2 deathsEquipment–environment–management
10618 November 2008Huxing TunnelMud outburst and water gushingOrdinary accident2 deathsEnvironment
10715 November 2008Hangzhou Metro Line 1CollapseSerious accident21 deathsPersonnel–equipment–management
10817 October 2008Beijing Metro Line 4CollapseOrdinary accident0 deathsEquipment–environment
10929 August 2008Ketu TunnelRoof fallingMajor accident4 deathsEnvironment–management
11024 July 2008Shiziyang TunnelMechanical injuryOrdinary accident2 deathsPersonnel
11115 July 2008Gulan TunnelCollapseOrdinary accident1 deathEnvironment–management
11213 July 2008Shanghai Metro Line 10Falling from a heightOrdinary accident1 deathPersonnel
11325 April 2008Jinshazhou TunnelExplosion accidentOrdinary accident1 deathEquipment
11411 April 2008Maluqing TunnelMud outburst and water gushingMajor accident5 deathsPersonnel–environment
11525 March 2008Huoshatu TunnelCollapseMajor accident4 deathsEquipment–management
11621 March 2008Baian TunnelHit by an objectOrdinary accident2 deathsPersonnel–environment–management
11720 January 2008Pandong TunnelCollapseMajor accident3 deathsEquipment–environment
1189 January 2008Yangjiadian TunnelCollapseOrdinary accident2 deathsPersonnel–environment–management
11920 November 2007Gaoyangzhai TunnelCollapseExtraordinarily serious accident35 deathsPersonnel–environment–management
12029 September 2007Shanghai Metro Line 9Vehicle injuryOrdinary accident1 deathPersonnel
1212 September 2007Tingzishan No. 2 TunnelCollapseMajor accident5 deathsEnvironment–management
1226 August 2007Nanzhuang TunnelSupport collapseOrdinary accident2 deathsPersonnel–environment–management
1236 August 2007Shuitian TunnelCollapseOrdinary accident2 deathsPersonnel–environment–management
1245 August 2007Yesanguan TunnelMud outburst and water gushingSerious accident10 deathsPersonnel–environment–management
12528 May 2007Nanjing Metro Line 2LandslideOrdinary accident2 deathsEquipment
12630 April 2007Wubao TunnelCollapseMajor accident4 deathsEnvironment
12720 April 2007Shanghai Metro Line 10Vehicle injuryOrdinary accident0 deathsEquipment
12828 March 2007Beijing Metro Line 10CollapseMajor accident6 deathsEnvironment
12910 December 2006Daguishan TunnelExplosion accidentMajor accident3 deathsPersonnel–management
1301 October 2006Taihang Mountain TunnelFireMajor accident4 deathsPersonnel–management
13113 September 2006Xijiashan TunnelCollapseMajor accident3 deathsEnvironment
13212 August 2006Qindong TunnelCollapseOrdinary accident2 deathsEnvironment
13327 June 2006Beijing Metro Line 10CollapseOrdinary accident2 deathsEnvironment
1346 June 2006North Songping No. 1 TunnelMold frame collapseMajor accident3 deathsEquipment–environment
13521 May 2006Shuangpai No. 2 TunnelCollapseOrdinary accident1 deathEnvironment–management
13623 April 2006Guangzhou Metro Line 5Hit by an objectOrdinary accident1 deathEquipment
13728 February 2006Guantouling TunnelExplosion accidentMajor accident3 deathsEquipment
13827 February 2006Beijing Metro Line 10Mechanical injurySerious accident11 deathsEnvironment
13921 January 2006Maluqing TunnelMud outburst and water gushingSerious accident11 deathsPersonnel–equipment–management
14010 January 2006Beijing Metro Line 5FireOrdinary accident0 deathsPersonnel–management
1413 January 2006Beijing Metro Line 10CollapseOrdinary accident0 deathsEquipment–environment–management
1421 August 2005Beijing Metro Line 5Vehicle injuryOrdinary accident1 deathEquipment
14321 July 2005Guangzhou MetroCollapseOrdinary accident0 deathsEquipment–environment–management
1446 October 2004Beijing Metro Line 4CollapseOrdinary accident0 deathsEnvironment–management
14525 September 2004Guangzhou Metro Line 2CollapseOrdinary accident0 deathsEquipment–environment–management
14621 September 2004Shanghai Metro Line 9CollapseOrdinary accident0 deathsEquipment
1472 July 2004Beijing Metro Line 5CollapseOrdinary accident0 deathsEnvironment
1481 April 2004Guangzhou Metro Line 3CollapseOrdinary accident0 deathsEnvironment–management
1498 October 2003Beijing Metro Line 5Support collapseMajor accident3 deathsPersonnel–management
1501 July 2003Shanghai Metro Line 4CollapseExtraordinarily serious accident0 deaths (CNY 150 million in economic loss)Personnel–equipment–management

References

  1. Wang, X.; Lai, J.; Qiu, J.; Xu, W.; Wang, L.; Wang, L.; Luo, Y. Geohazards, reflection and challenges in Mountain tunnel con-struction of China: A data collection from 2002 to 2018. Geomat Nat. Hazards Risk 2020, 11, 766–785. [Google Scholar] [CrossRef]
  2. Fan, Y.; Fang, C.; Zhang, Q. Coupling coordinated development between social economy and ecological environment in Chinese provincial capital cities-assessment and policy implications. J. Clean. Prod. 2019, 229, 289–298. [Google Scholar] [CrossRef]
  3. Lu, X.; Xu, C.; Hou, B.; Du, X.; Li, L. A dynamic Bayesian network-based risk assessment for underpass tunnel construction. Chin. J. Geotech. Eng. 2022, 44, 492–501. (In Chinese) [Google Scholar]
  4. Wang, Y.; Jing, H.; Su, H.; Xie, J. Effect of a Fault Fracture Zone on the Stability of Tunnel-Surrounding Rock. Int. J. Geomech. 2016, 6, 04016135. [Google Scholar] [CrossRef]
  5. Ding, L.; Zhang, L.; Wu, X.; Skibniewski, M.J.; Yu, Q. Safety management in tunnel construction: Case study of Wuhan metro construction in China. Saf. Sci. 2014, 62, 8–15. [Google Scholar] [CrossRef]
  6. Einstein, H.H. Risk and risk analysis in rock engineering. Tunn. Undergr. Space Technol. 1996, 11, 141–155. [Google Scholar] [CrossRef]
  7. Chapman, D.F.C.A. Risk Analysis for Large Projects. J. Oper. Res. Soc. 1987, 38, 12–17. [Google Scholar] [CrossRef]
  8. Chen, X.; Chen, R.; Lin, K.; Zhang, M. Application of the improved analytic hierarchy process in the risk management of tunnel construction. In Proceedings of the International Conference on Mechanics, Mechatronics and Materials Research, Nanjing, China, 4–6 October 2014. [Google Scholar]
  9. Sturk, R.; Olsson, L.; Johansson, J. Risk and decision analysis for large underground projects, as applied to the Stockholm Ring Road tunnels. Tunn. Undergr. Space Technol. 1996, 11, 157–164. [Google Scholar] [CrossRef]
  10. Wang, J.; Cao, A.; Wu, Z.; Sun, Z.; Lin, X.; Sun, L.; Liu, W.; Liu, X.; Li, H.; Sun, Y.; et al. Dynamic Risk Assessment of Ul-tra-Shallow-Buried and Large-Span Double-Arch Tunnel Construction. Appl. Sci. 2021, 11, 11721. [Google Scholar] [CrossRef]
  11. Mirhabibi, A.; Soroush, A. Effects of surface buildings on twin tunnelling-induced ground settlements. Tunn. Undergr. Space Technol. 2012, 29, 40–51. [Google Scholar] [CrossRef]
  12. Deng, X.; Wang, R.; Xu, T. Risk assessment of tunnel portals in the construction stage based on fuzzy analytic hierarchy process. Arch. Civ. Eng. 2018, 64, 69–87. [Google Scholar] [CrossRef]
  13. Lin, C.J.; Zhang, M.; Li, L.P.; Zhou, Z.Q.; Liu, S.; Liu, C.; Li, T. Risk Assessment of Tunnel Construction Based on Improved Cloud Model. J. Perform. Constr. Facil. 2020, 34, 04020028. [Google Scholar] [CrossRef]
  14. Ou, X.; Wu, Y.; Wu, B.; Jiang, J.; Qiu, W. Dynamic Bayesian Network for Predicting Tunnel-Collapse Risk in the Case of Incomplete Data. J. Perform. Constr. Facil. 2022, 36, 04022034. [Google Scholar] [CrossRef]
  15. Ge, S.; Gao, W.; Cui, S.; Chen, X.; Wang, S. Safety prediction of shield tunnel construction using deep belief network and whale optimization algorithm. Autom. Constr. 2022, 142, 104488. [Google Scholar] [CrossRef]
  16. Shin, H.; Kwon, Y.; Jung, Y.; Bae, G.; Kim, Y. Methodology for quantitative hazard assessment for tunnel collapses based on case histories in Korea. Int. J. Rock Mech. Min. Sci. 2009, 46, 1072–1087. [Google Scholar] [CrossRef]
  17. Wang, Y.; Liu, B.; Qi, Y. A Risk Evaluation Method with an Improved Scale for Tunnel Engineering. Arab. J. Sci. Eng. 2018, 43, 2053–2067. [Google Scholar] [CrossRef]
  18. Zucca, M.; Valente, M. On the limitations of decoupled approach for the seismic behaviour evaluation of shallow multi-propped underground structures embedded in granular soils. Eng. Struct. 2020, 211, 110497. [Google Scholar] [CrossRef]
  19. Lu, L.; Qiu, J.; Yuan, Y.; Tao, J.; Yu, H.; Wang, H.; Mang, H. Large-scale test as the basis of investigating the fire-resistance of underground RC substructures. Eng. Struct. 2019, 178, 12–23. [Google Scholar] [CrossRef]
  20. Xue, Y.; Liu, Y.; Zhang, T. Study on the formation mechanism of coupled disaster risk. J. Nat. Disasters 2013, 22, 44–50. (In Chinese) [Google Scholar] [CrossRef]
  21. Kauffman, S. The Origins of Order: Self-Organization and Selection in Evolution, 1st ed.; Oxford University Press: New York, NY, USA, 1993; p. 732. [Google Scholar]
  22. Mo, J.; Li, J. Coupling effect analysis of railroad engineering quality risk factors based on improved N-K model. Sci. Technol. Manag. Res. 2022, 42, 202–207. (In Chinese) [Google Scholar]
  23. Yan, H.; Zheng, Z.; Huang, H.; Zhou, X.; Tang, Y.; Hu, P. Risk Coupling Evaluation of Social Stability of Major Engineering Based on N-K Model. Buildings 2022, 12, 702. [Google Scholar] [CrossRef]
  24. Liu, Z.; Ma, Q.; Cai, B.; Shi, X.; Zheng, C.; Liu, Y. Risk coupling analysis of subsea blowout accidents based on dynamic Bayesian network and NK model. Reliab. Eng. Syst. Saf. 2022, 218, 108160. [Google Scholar] [CrossRef]
  25. Qiao, W.G. Analysis and measurement of multifactor risk in underground coal mine accidents based on coupling theory. Reliab. Eng. Syst. Safe 2021, 208, 107433. [Google Scholar] [CrossRef]
  26. Yu, Q.; Xue, M.; Zhang, Y.; Li, S. Analysis of scrap aluminum recycling in China’s automotive industry based on system dynamics model. J. Northeast. Univ. (Nat. Sci.) 2020, 41, 68–73. (In Chinese) [Google Scholar]
  27. Mo, S.; Yue, Z.; Feng, Z.; Gao, H. Study on the dynamics of surface gear manifold system with uniform load characteristics. J. Huazhong Univ. Sci. Technol. (Nat. Sci. Ed.) 2020, 48, 23–28. (In Chinese) [Google Scholar] [CrossRef]
  28. Chang, D.; Gui, H.; Fan, R. Scenario evolution and simulation study of social security emergencies in mega-cities: Beijing as an example. J. Beijing Jiaotong Univ. (Soc. Sci. Ed.) 2020, 19, 86–97. (In Chinese) [Google Scholar] [CrossRef]
  29. Yang, K.; Lv, S.; Gao, J.; Pang, L. Research on the coupling degree measurement model of urban gas pipeline leakage disaster system. Int. J. Disaster Risk Reduct. 2017, 22, 238–245. [Google Scholar] [CrossRef]
  30. Xue, Y.; Xiang, P.; Jia, F.; Liu, Z. Risk Assessment of High-Speed Rail Projects: A Risk Coupling Model Based on System Dynamics. Int. J. Environ. Res. Public Health 2020, 15, 5307. [Google Scholar] [CrossRef]
  31. Pan, Y.; Wu, S. Research on the mechanism of enhancing the landing effect of assembled buildings based on system dynamics—An example from Jiangsu Province. Constr. Econ. 2020, 41, 301–307. (In Chinese) [Google Scholar] [CrossRef]
  32. Yue, R.; Han, M.; Hou, B. Cause Analysis of Consumer-Grade UAV Accidents Based on Grounded Theory-Bayesian. Trans. Nanjing Univ. Aeronaut. Astronaut. 2022, 39, 584–592. [Google Scholar] [CrossRef]
  33. Zhao, L.; Cheng, H. Early Warning and Control of Production Safety Accidents in Railroad Construction, 1st ed.; China Construction Industry Press: Beijing, China, 2020; pp. 17–48. (In Chinese) [Google Scholar]
  34. Regulations on the Reporting and Investigation and Handling of Production Safety Accidents. The Central People’s Government of the People’s Republic of China. Available online: http://www.gov.cn/zwgk/2007-04/19/content_588577.htm (accessed on 5 April 2023).
  35. Pan, F.; Zhang, Y.; Zhang, L.; Yang, X.; Li, M.; Yang, J. Study on the mechanism of coupled evolution of traffic accident risk in sub-sea tunnels. J. Saf. Sci. Technol. 2022, 18, 231–236. (In Chinese) [Google Scholar]
  36. Centeno, M.A.; Nag, M.; Patterson, T.S.; Shaver, A.; Windawi, A.J. The Emergence of Global Systemic Risk. Annu. Rev. Sociol. 2015, 41, 65–85. [Google Scholar] [CrossRef]
  37. Liu, J.; Wan, L.; Wang, W.; Yang, G.; Ma, Q.; Zhou, H.; Zhao, H.; Lu, F. Integrated Fuzzy DEMATEL-ISM-NK for Metro Operation Safety Risk Factor Analysis and Multi-Factor Risk Coupling Study. Sustainability 2023, 15, 5898. [Google Scholar] [CrossRef]
  38. Frenken, K. A complexity approach to innovation networks. The case of the aircraft industry (1909–1997). Res. Policy 2000, 29, 257–272. [Google Scholar] [CrossRef]
  39. Zhang, Q.; Wang, J.; Zhang, H. Attribute recognition model and its application of risk assessment for slope stability at tunnel portal. J. Vibroeng. 2017, 19, 2726–2738. [Google Scholar] [CrossRef]
  40. Wang, X.; Li, S.; Xu, Z.; Li, X.; Lin, P.; Lin, C. An interval risk assessment method and management of water inflow and inrush in course of karst tunnel excavation. Tunn. Undergr. Space Technol. 2019, 92, 103033. [Google Scholar] [CrossRef]
  41. Xu, T.; Song, Z.; Guo, D.; Song, Y. A Cloud Model-Based Risk Assessment Methodology for Tunneling-Induced Damage to Existing Tunnel. Adv. Civ. Eng. 2020, 2020, 1–11. [Google Scholar] [CrossRef]
  42. Liu, J.; Yang, G.; Wang, W.; Zhou, H.; Hu, X.; Ma, Q. Based on ISM—NK Tunnel Fire Multi-Factor Coupling Evolution Game Research. Sustainability 2022, 14, 7034. [Google Scholar] [CrossRef]
Figure 1. Distribution of safety accidents in tunnel construction from 2003–2022.
Buildings 13 01081 g001
Figure 2. Results of risk factor identification based on the grounded theory.
Buildings 13 01081 g002
Figure 3. Mechanism of the coupling of safety risks in tunneling construction (source: plotted with reference to [37]).
Buildings 13 01081 g003
Figure 4. Tunnel construction safety risk factor coupling diagram.
Buildings 13 01081 g004
Figure 5. “Personnel–environment” coupling SD causality diagram.
Buildings 13 01081 g005
Figure 6. “Personnel–equipment–environment” coupling SD causality diagram.
Buildings 13 01081 g006
Figure 7. “Personnel–equipment–environment–management” coupling SD causality diagram.
Buildings 13 01081 g007
Table 1. Accident type classification standards.
Type of AccidentClassification criteria
Extraordinarily serious accidentAccidents resulting in more than 30 deaths, or more than 100 serious injuries, or more than CNY 100 million in direct economic losses
Serious accidentAccidents resulting in more than 10 or fewer than 30 deaths, or more than 50 or fewer than 100 serious injuries, or more than CNY 50 million or less than CNY 100 million in direct economic losses
Major accidentAccidents resulting in more than 3 or fewer than 10 deaths, or more than 10 or fewer than 50 serious injuries, or more than CNY 10 million or less than CNY 50 million in direct economic losses
Ordinary accidentAccidents resulting in fewer than 3 deaths, or fewer than 10 serious injuries, or less than CNY 10 million in direct economic losses
Table 2. Excerpts of tunnel construction safety accident cases, 2003–2022.
NumberDateLocation of the AccidentRisk EventsType of AccidentAccident Casualties
129 July 2022Hejianlan Expressway TunnelMud outburst and water gushingMajor accident4 Deaths
216 May 2022Huangbuwu TunnelRoof fallingOrdinary accident1 Death
32 May 2021Huangshanshao TunnelGas poisoningMajor accident3 Deaths
48 December 2019Maoshan TunnelHit by an objectOrdinary accident1 Death
529 August 2018Yonghe No. 1 TunnelMechanical injuryOrdinary accident1 Death
624 December 2016Aaimin TunnelFireMajor accident3 Deaths
718 December 2015Zhoubai reline TunnelCollapseMajor accident6 Deaths
Table 3. Grounded theory core coding and associative coding list.
Core CodesAssociative Codes
Personnel risk factors (a)Poor personnel mental health (a1)
Poorly educated personnel (a2)
Personnel working against regulations (a3)
Low awareness of personnel security (a4)
Insufficient personnel skills (a5)
Personnel operational errors (a6)
Equipment risk factors (b)Defects in protective facilities (b1)
Equipment aging and wear and tear (b2)
Equipment replacement and maintenance is not timely (b3)
Equipment and material quality defects (b4)
Material storage and storage is not reasonable (b5)
Equipment failure (b6)
Environmental risk factors (c)Harsh climate environment (c1)
Complex geological environment (c2)
Poor hydrological environment (c3)
Harmful gas (c4)
Harsh operating environment (c5)
Too unpredictable environment (c6)
Management risk factors (d)Inadequate construction safety training (d1)
Construction site management disorder (d2)
Inadequate construction quality supervision (d3)
Inadequate supervision of construction practices (d4)
Unreasonable construction organization design (d5)
Qualifications, program review failed (d6)
Inadequate risk response mechanisms (d7)
Table 4. Number of risk couplings and frequency of occurrence.
Type of CouplingNumerical Value
Single-factor couplingTimes N 1000 = 14 N 0100 = 12 N 0010 = 28 N 0001 = 8 N 0000 = 0
Frequency P 1000 = 0.0933 P 0100 = 0.08 P 0010 = 0.1867 P 0001 = 0.0533 P 0000 = 0
Two-factor couplingTimes N 1100 = 1 N 1010 = 3 N 1001 = 25 N 0110 = 5 N 0101 = 1 N 0011 = 17
Frequency P 1100 = 0.0067 P 1010 = 0.02 P 1001 = 0.1667 P 0110 = 0.0333 P 0101 = 0.0067 P 0011 = 0.1133
Multifactor couplingTimes N 1110 = 2 N 1101 = 10 N 1011 = 17 N 0111 = 5 N 1111 = 2
Frequency P 1110 = 0.0133 P 1101 = 0.0667 P 1011 = 0.1133 P 0111 = 0.0333 P 1111 = 0.0133
Table 5. Probability of risk coupling of different factors.
Type of CouplingNumerical Value
Single-factor couplingFrequency P 0 P 1 P . 0 . . P . 1 . . P . . 0 . P . . 1 . P 0 P 1
0.50670.49330.74670.25330.47330.52670.43330.5667
Two-factor couplingFrequency P 00 . . P 01 . . P 10 . . P 11 . .
0.35330.15330.39330.1000
P 0.0 . P 0.1 . P 1.0 . P 1.1 .
0.14000.36670.33330.1600
P 0 . . 0 P 0 . . 1 P 1 . . 0 P 1 . . 1
0.30000.20670.13330.3600
P . 00 . P . 10 . P . 01 . P . 11 .
0.31330.16000.43330.0933
P . 0.0 P . 1.0 P . 0.1 P . 1.1
0.30000.13330.44670.1200
P . . 00 P . . 10 P . . 01 P . . 11
0.18000.25330.29330.2733
Three-factor couplingFrequency P 000 . P 100 . P 010 . P 001 . P 110 . P 101 . P 011 . P 111 .
0.05330.26000.08670.30000.07330.13330.06670.0267
P 00.0 P 10.0 P 01.0 P 00.1 P 11.0 P 01.1 P 10.1 P 11.1
0.18670.11330.11330.16670.02000.04000.28000.0800
P 0.00 P 1.00 P 0.10 P 0.01 P 1.10 P 1.01 P 1.11 P 0.11
0.065360.10000.22000.06000.03330.23330.12670.1467
P . 000 P . 100 P . 010 P . 001 P . 110 P . 101 P . 011 P . 111
0.09330.08670.20670.22000.04670.07330.22670.0467
Four-factor couplingFrequency P 0000 P 0001 P 0100 P 0010 P 1000 -
00.05330.0800.18670.0933-
P 1100 P 1010 P 1001 P 0110 P 0101 P 0011
0.00670.020.16670.03330.00670.1133
P 1110 P 1101 P 1011 P 0111 P 1111 -
0.01330.06670.11330.03330.0133-
Table 6. Risk coupling flow values.
Risk Flow Value T a b c T a b d T a c d T b c d T a b T a c T a d T b c T b d T c d
Numerical Value0.192730.104290.114790.051350.0095780.118640.077630.024720.008560.00745
Disclaimer/Publisher’s Note: The statements, opinions and data contained in all publications are solely those of the individual author(s) and contributor(s) and not of MDPI and/or the editor(s). MDPI and/or the editor(s) disclaim responsibility for any injury to people or property resulting from any ideas, methods, instructions or products referred to in the content.

