Abstract
In order to confirm the effect of multiple moderate earthquakes on the response deformation of wooden houses at the time of a major earthquake, an earthquake response analysis, considering performance deterioration due to repeated small deformations, was conducted. As a result, it was found that the effect of multiple moderate earthquakes on the mean response deformation during a major earthquake was small. On the other hand, in some cases, the response deformation was up to 1.2 times larger than that of the sound case. In the case of a house where the response deformation was near the criteria of continuous use and/or collapse, the influence of the response magnification was large. This shows the importance of giving higher seismic performance compared to the standard. The response deformation during repeated medium earthquakes may increase for houses with considerably low seismic performance. However, for the houses that meet current standards, little to no increase in response deformation was seen.
1. Introduction
Increasing the rate at which wooden houses can continue to be used after a large-scale earthquake is an important issue, not only in terms of maintaining the assets of individual houses but also for maintaining urban functionality and stimulating early reconstruction. To increase the continued use rate, it is necessary not only to improve the seismic performance of individual houses but also to appropriately promote the seismic reinforcement of existing housing [1,2]. In general, seismic performance is often discussed in terms of performance when constructing new buildings; however, wooden houses may experience repeated deformation due to small and medium earthquakes, and it is expected that these will be faced multiple times during their service lives. This deterioration in seismic performance needs to be taken into account in the seismic reinforcement of existing houses, as current seismic performance needs to be properly evaluated at this time. Additionally, to be able to use wooden housing for a longer period of time, it is necessary to grasp any tendencies in the deterioration of shear performance caused by repeated deformation and to include earthquake resistance as part of the design. This is because the response deformation during a major earthquake may be greater than initially assumed due to the deterioration of seismic performance caused by repeated deformation.
The main earthquake-resistant element in wooden housing is the shear wall. It is well-known that load reduction and stiffness reduction of shear walls, especially due to repeated large deformations, have a major effect on the response deformation of wooden houses when earthquakes occur again later. Studies of the shear performance of shear-resisting walls have been conducted in North America on light-frame timber structures [3,4]. Projects, such as the CUREE-Caltech Wood frame project in the United States, have performed static and dynamic experiments on wooden shear walls [5,6,7,8,9,10]. There are also reports evaluating the residual capacity of shear walls after major earthquakes that use energy as an indicator. Based on this, methods of reinforcement have been proposed [11]. Additionally, modeling of the nonlinear behavior of wooden shear walls is also underway to analyze the seismic response of wooden buildings. In terms of the wood-frame construction method, Stewart proposed a hysteretic model to reproduce the behavior of repeated experiment results [4]. Furthermore, Foliente et al. proposed a functional model with 10 or more parameters and demonstrated that this could be used to pursue more accurate repeated experiment results [12]. Additionally, Folz and Filiatrault have proposed a model in which the backbone curve is expressed as an exponential function and the maximum point is oriented after pinching through repeated behavior [13]. Pang et al. proposed the evolutionary parameter hysteretic model (EPHM), which, while adhering to Folz’s exponential model, uses two backbone curves to allow for stiffness degradation even in the face of repeated deformation [14]. Furthermore, based on these models, Hitomi et al. [15] and Isoda [16] proposed an improved EPHM that considers the way the maximum oriented point is lowered during repeated deformation in multiple repetitions of deformation at a constant deformation amount. In addition, models by Filiatrault [17] and Davenne et al. [18] have been proposed to account for stiffness degradation and strength reduction, respectively. Ayoub [19] proposed a hysteretic model that contributes to strength and stiffness degradation and vibration analysis. He emphasized the importance of accurately considering the effects of degradation when evaluating the response of wooden buildings. Many studies on repeated earthquakes have been reported to evaluate the response properties and seismic risk of buildings subjected to multiple earthquakes, such as the foreshock–mainshock sequence or mainshock–aftershock sequence (e.g., [20]). Recent earthquake disasters with a series of main- and aftershocks include the 2010-2011 Darfield-Christchurch earthquake sequence, the 2011 Great East Japan Earthquake, and the 2016 Kumamoto earthquakes. Probabilistic building damage assessments are being conducted, considering such earthquake sequences as mainshock–aftershock or foreshock–mainshock. For example, Yin and Li [21] used such a probabilistic approach to estimate earthquake damage to light-frame wooden buildings. Zhang et al. [22] reported that the results of a study using the developed fragility curves showed an increase in damage to wooden houses during mainshock–aftershock input. In addition, there is an example of a response analysis of the 2016 Kumamoto earthquakes using a two-degree-of-freedom model to examine collapse damage [23] and a shaking table test on a full-scale wooden house to confirm the seismic behavior [24]. It has been pointed out that in the case of a series of relatively large earthquakes, response deformation may be increased compared to the case of a single mainshock.
However, the purpose of these existing approaches is primarily to increase response-prediction accuracy during large earthquakes, to judge the effect of subsequent aftershocks, and to predict the seismic behavior of wooden houses. Therefore, they tend to cover the repeated large deformations seen in major earthquakes. There are few examples of studies that look at repeated small deformations, and their effects have yet to be clarified. In Japan, small and medium earthquakes are frequent; for example, Ibaraki Prefecture has had approximately 300 earthquakes with an intensity of 3 on the Japanese seismic scale over the past 30 years [25]. Understanding the degree to which the seismic performance and the response deformation during a large earthquake would be affected if the houses were previously subjected to numerous small-scale deformations due to an earthquake, such as 1/450 rad or 1/300 rad, generally considered to be in the elastic range, is an important issue.
Therefore, the authors, with the aim of clarifying the tendency of load reduction on shear walls due to numerous small-scale deformations, conducted repeated load tests with nail joints between face and frame materials and shear walls [26,27]. The shear tests [27] performed on plywood, gypsum board, and brace walls showed that repeated small-scale deformations did not impact the maximum load or yield load. Meanwhile, it was clarified that the load and equivalent stiffness of the sheathed walls gradually decreased with repeated small-scale deformations. In the case of brace shear walls, it was found that there was no extreme decrease in load due to repeated small-scale deformations.
The purpose of this paper is to analytically clarify the effect of load reduction of shear walls due to repeated small-scale deformations caused by moderate earthquakes on the response deformation of wooden houses during large earthquakes. Using trends in deterioration obtained from repeated loading experiments on shear walls, we shall develop a hysteretic model for the shear walls that can account for load reduction due to repeated small-scale deformations and conduct a response analysis using a two-degree-of-freedom model. This study examines the effects of repeated small and medium earthquakes on the response deformation of Japanese conventional wooden houses, with plywood walls as the main seismic element, during a large earthquake.
2. Analysis Methods
We analytically verified the response deformation of a wooden house subjected to multiple small and medium earthquakes followed by a large earthquake. Here, small and medium earthquakes were defined as those where the response deformation of a wooden house was below the elastic limit. In this study, the definition of a moderate earthquake was one that was approximately 3–5 on the Japan Meteorological Agency (JMA) seismic intensity scale.
We created seismic waves with an intensity of 3–5 by multiplying the building standard low (BSL) in Japan [28] waves by the magnification factor corresponding to each intensity. The standard BSL waveforms are shown in Figure 1, while Figure 2 shows the acceleration response spectra of seismic waves corresponding to each seismic intensity used in this report. The maximum acceleration for small earthquakes was assumed to be approximately 40 to 220 gal. Table 1 also examines this on a prefectural capital basis and shows the maximum number of occurrences by seismic intensity over the past 30 years. The maximum acceleration of the seismic waves used in this study is also shown. As described above, earthquakes with a seismic intensity of 3 are a typical occurrence during the service life of a wooden house.
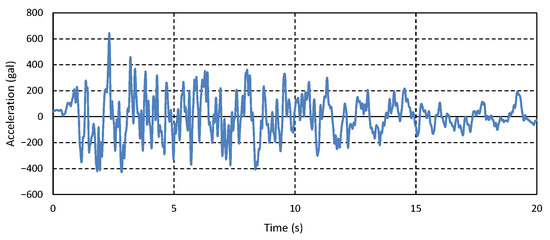
Figure 1.
Acceleration time history of a BSL wave.
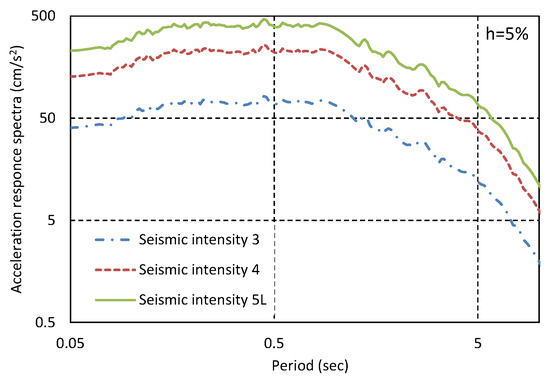
Figure 2.
Acceleration response spectra of each seismic intensity wave.

Table 1.
Maximum number of occurrences of each seismic intensity over 30 years.
The hysteretic model of shear walls uses an improved EPHM [15], which considers load reduction due to repeated deformation of the EPHM [14]. Figure 3 shows the hysteretic model of the improved EPHM. As the EPHM expresses everything as a function, it is characterized as being able to accurately represent wooden shear walls, which often have nonlinear behavior from their initial to their final states. The EPHM assumes an average constant backbone curve for the maximum point that is oriented during iterative deformation, even though it should inherently vary based on the number of repetitions. In other words, stiffness degradation does not take into account the multiple repeated deformations at a constant deformation rate. In the improved EPHM, a stiffness reduction rate αd is introduced based on empirical deformation and the number of repetitions, and this is multiplied by the initial backbone curve to represent the degradation phenomenon of the directional point load. However, the improved EPHM relates to a load deterioration of 1/200 rad or more, and this does not consider the repeated deformation from medium earthquakes. Therefore, to evaluate a load deterioration up to 1/200 rad, we attempted to calculate the load residual ratio of an arbitrary deformation. For the plywood wall, the relationship between the remaining load and the number of repetitions at each step in the previous report [27], as demonstrated in Figure 4, is displayed in terms of both logarithms, and the slope can be determined by a linear regression. Here, the load residual ratio for new deformations is 100%. The intercept of the approximate line was set to two because of the logarithmic representation. As shown in Figure 5, the slopes obtained at each step are plotted side by side for each deformation. The larger the deformation is, the steeper the slope of the approximate line, which indicates a more considerable load loss. Additionally, we can see that there is an almost proportional relationship between the repeated deformation quantity and the slope of the approximate line. When the deformation is 0, because load loss does not occur, the intercept is set to 0, and the slope is obtained by linear regression. Using this, we derived the load residual ratio shown in Equation (1). In Figure 6, we can see a comparison of the plywood wall load residual ratio calculation and experimental results. The figure also shows the load residual ratio obtained in reference documentation [15] for deformations of 1/200 rad or more. After 1/200 rad, the estimates in this report tended to underestimate the actual shear force. When performing the seismic analysis, therefore, Equation (1) was used below 1/200 rad, and Equation (2) from reference document [15] was used to express the shear force degradation thereafter.
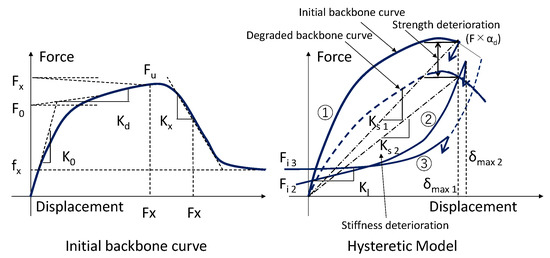
Figure 3.
Hysteretic model of the improved EPHM [15]. (The number means the number of repetitions.).
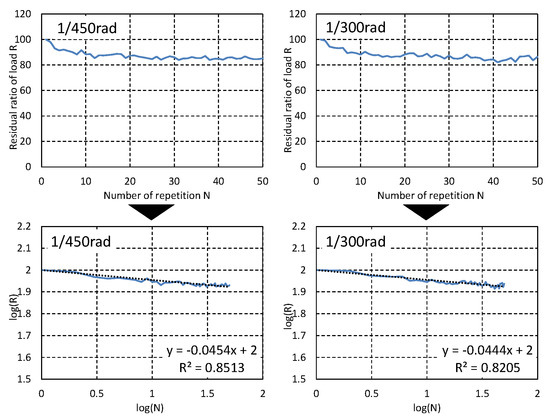
Figure 4.
Relationship between logarithmic load residual ratio and number of repetitions.
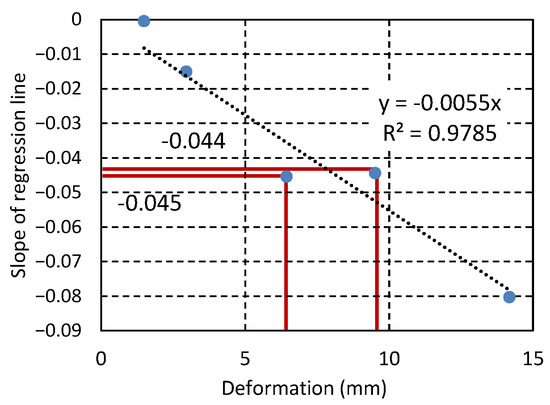
Figure 5.
Relationship between deformation and slope of regression line (Plywood).
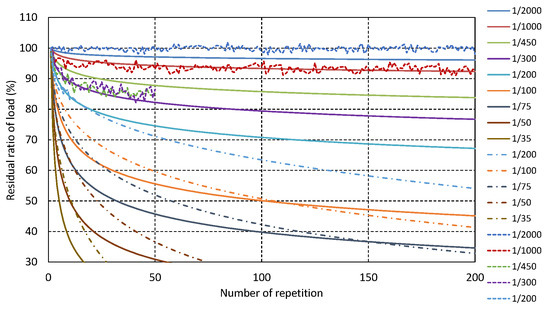
Figure 6.
Comparison between estimated value and test result of load residual ratio. (Plywood) Solid line: prediction; dotted line: test result; dashed line: reference value [16].
The same operation as was carried out on the plywood was performed on a gypsum board wall to obtain the calculation formula for the load residual ratio. However, when a linear approximation was performed on the relationship between the deformation and load residual ratio slope (Figure 7), as the load residual ratio on 1/1000 rad repetitions was overestimated, the model in this report was divided into Equation (3) for 1/300 rad and below, and Equation (4) for above 1/300 rad, to conform more closely to the experimental results. When determining the relationship between the displacement of 1/200 rad or above and the load residual ratio slope, we referenced an existing reference [15]. Figure 8 shows a comparison of the load residual ratio calculation results for a gypsum board wall with the experimental results.
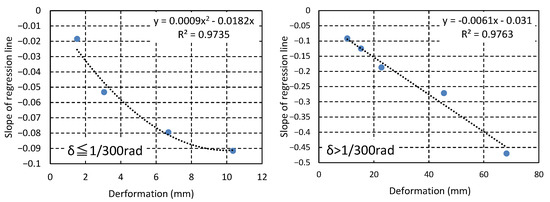
Figure 7.
Relationship between deformation and slope of regression line. (Gypsum board).
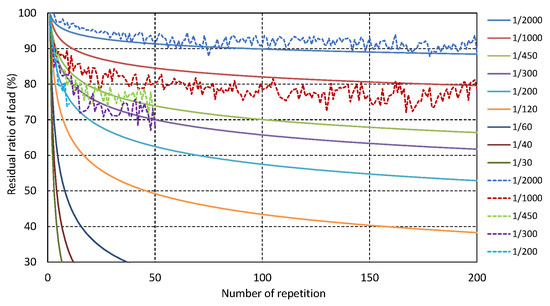
Figure 8.
Comparison between estimated value and test result of load residual ratio. (Gypsum board) Solid line: prediction; dotted line: test result.
Load residual ratio: (%)
Plywood:
Here,
: Deformation at the time of 1/200 rad
Gypsum board:
x: Deformation (mm), N: repetitions (times)
Furthermore, based on the results [27] of the previous report, in this study, it was assumed that the repeated experience of small-scale deformations does not cause load reduction in the case of new deformations. It was also assumed that the number of repetitions is reset when entering a new deformation.
The analytical model was a two-degree-of-freedom model. The structural elements were of two types—plywood and gypsum board walls—and the finish was not included in the model. Deterioration of shear-resisting walls, the main seismic element of wooden houses, determines the seismic performance of the building. In this paper, analysis was conducted on plywood and gypsum board walls as seismic elements, which, in the previous paper, were found to deteriorate due to repeated deformation. For the plywood wall, a backbone curve was created based on the results obtained from the previous report [27]. For the gypsum board, as the test specimen was the N50 nail specification in the previous report, the backbone curve was created from the experimental results [29] with the most standard specification (GN40 nail specification) in Japan, and the load residual ratios obtained in Equations (2) and (3) were applied. For the plywood and gypsum board walls, the parameters of the hysteretic model per wall (width: 910 mm) are shown in Table 2 and Table 3, respectively. The repetition experiment results and calculation values are shown in Figure 9 and Figure 10, respectively. The red line in the figure shows the backbone curve.
Table 2.
Set parameters of plywood walls per wall.
Table 3.
Set parameters of gypsum board walls per wall (GN40 specification).
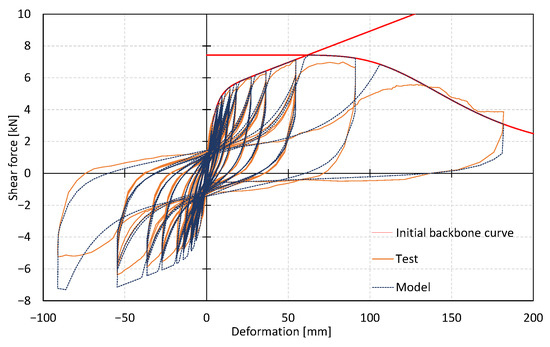
Figure 9.
Comparison between test results and prediction (Plywood).
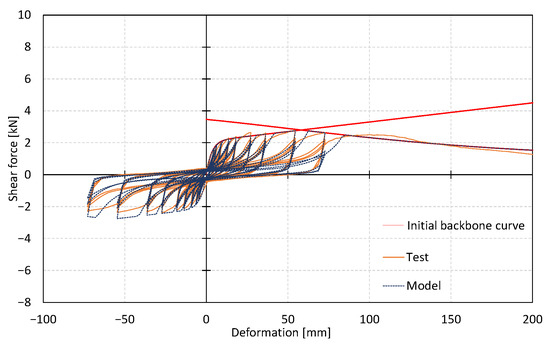
Figure 10.
Comparison between test results and prediction (Gypsum board).
A list of the analysis conditions is shown in Table 4. The seismic performance of the analysis model is defined by the base shear coefficient C0 (existing shear capacity of first layer/total weight of the building), and there are eight types (0.12, 0.15, 0.2, 0.3, 0.4, 0.6, 0.8, 1.0). The analysis model assumes a house with a total of two floors, with a total area of 100 m2, and after setting the number of walls in this wall amount calculation, weight was distributed according to C0 and calculated based on the allowable shear capacity of the wall. Here, the wall amount calculation is a simple shear capacity design method for a typical Japanese wooden house. Shear requirements are fixed based on the respective floor areas. The minimum required performance stipulated in BSL [28] is calculated, in the case of a first floor, by multiplying the area by 0.568 kN/m2, and in the case of second floors, the floor area is multiplied by 0.294 kN/m2. Therefore, the required performances in this case are 28.4 and 14.7 kN for the first and second floors, respectively. The allowable shear capacity of a wall is provided by the wall specifications, and these are 4.46 and 1.60 kN per wall for plywood and gypsum board walls, respectively. Here, with reference to the specimen specifications [30,31], in which shaking table tests were conducted for a typical wooden house, for either case here, the load capacity ratio (1F/2F) and weight ratio (1F/2F) were assumed to be 1.2 and 1.5, respectively. Therefore, based on the case assuming plywood walls for all shear-resisting elements, the wall amount was set at seven walls (31.22 kN) for the first floor and six walls (26.76 kN) for the second floor. As shown in Table 5, we set the seismic performance of the analytical model by changing the shear capacity of each layer without changing the weight. The housing C0 with the lowest required performance was 0.2.
Table 4.
Parameter of analysis.
Table 5.
Analysis models.
Other analytical parameters included three types of gypsum board rates (0%, 20%, 40%), four types of deterioration conditions (when input was only for a large-scale earthquake (sound), when a large-scale earthquake was input after 300 times seismic intensity 3 inputs (I3), when a large-scale earthquake was input after 100 times seismic intensity 4 inputs (I4), and when a large-scale earthquake was input after 10 times inputs at seismic intensity 5 lower (I5L)), and eight types of large-scale seismic waves. Gypsum board walls have a larger load reduction due to multiple deformations than do plywood walls. Therefore, we predicted that the higher the rate of gypsum board walls in their shear capacity, the larger the effect to response deformation during a large earthquake. The gypsum board rate is defined as the rate of gypsum board within the shear capacity. The shear capacity ratio of miscellaneous walls within Japanese wooden houses is said to be approximately 1/3 of the shear capacity of the building. Therefore, the parameters were set around this level. The hysteretic model and load residual ratio were added together based on the gypsum board rate. Table 6 gives a list of earthquake motions used in the analysis, whereas the acceleration response spectra are as shown in Figure 11. The input seismic waves were mainly seismic waves actually observed in Japan. However, Kasumigaseki and Tokai waves are assumed waves created based on estimated ground amplification characteristics.
Table 6.
Input ground motions.
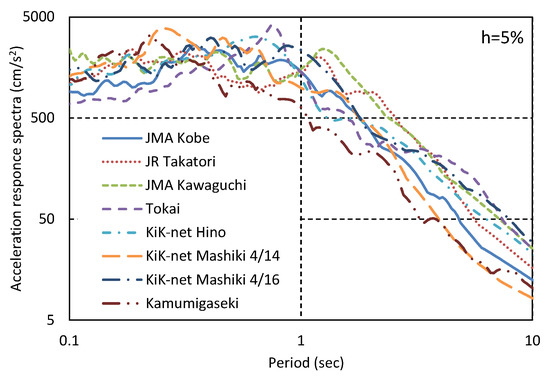
Figure 11.
Acceleration response spectra of used ground motion.
The response analysis used the Newmark β method (β = 1/6) with proportional initial stiffness damping and damping constants of 5%. However, the load values in the backbone curve were set to multiples of 1.25 of Table 2 and Table 3. The reason for this is that it has been reported that, even for specimens with the same specifications, there may be a 1.2- to a 1.6-fold difference in the measured load values between static and dynamic tests [32].
3. Results and Discussion
Figure 12 shows a list of the analysis results. For each model, from left to right, we can see the analysis results on soundness after experiencing a seismic intensity of 3, a seismic intensity of 4, and a seismic intensity of 5 lower. The deformation angle equivalent to collapse was set to 1/15 rad, and the results were shown with this as the upper limit. Figure 13 shows the response multipliers for a case of soundness compared to a case where a large-scale earthquake was input. Furthermore, Table 7 shows the mean response multiplier and the maximum response multiplier. Results in which the response deformation in the sound state was equivalent to collapse were not included.
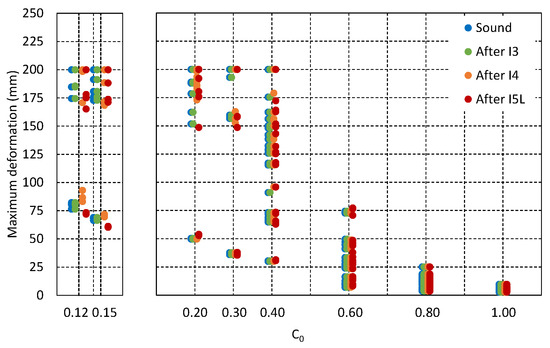
Figure 12.
Result of maximum deformation.
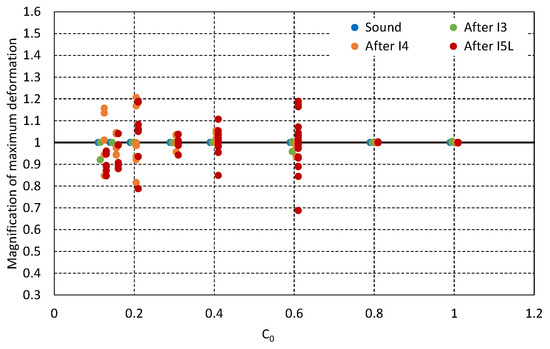
Figure 13.
Magnification of maximum deformation.
Table 7.
Magnifications of maximum deformation.
If we look at the mean value for the response multiplier, the repetitive deformations from multiple small and medium earthquakes are seen to have almost no effect on the maximum response deformation at the time of large-scale earthquakes, regardless of the performance level of the wooden housing. In this analysis, as repeated small deformations are shown not to lower strength at the time of large deformations, their impact is considered to be small. If we focus on the maximum response multiplier, we saw that even if earthquakes of seismic intensity 3 were repeated for housing of any performance level, an increase in response deformation was not seen. In the case where earthquakes of seismic intensity 4 were repeated, an increase in response deformation was seen in houses of C0 = 0.2 or below. In the case of repeated earthquakes with a seismic intensity of 5 lower, an increased response was seen in houses of C0 = 0.6 or below. However, in the case of high-performance housing, as the response deformation was small in the sound case, the influence was considered to be small.
The results overall demonstrated a considerable variation in response magnitudes depending on the seismic wave combination and the seismic performance of the houses, and this makes it difficult to assess the correlation between seismic performance and response magnitudes due to repetitive moderate earthquakes. Since, compared to the sound case, the response deformation was up to 1.2 times larger in some cases, the response factor due to the effect of moderate earthquakes was uniformly expected to be 1.25 times larger in such a case. Figure 14 shows the mean value of the analytical results, the deformation that is estimated by multiplying the average response value when sound by 1.25, as well as the upper limit that considers disparities resulting from seismic waves. It should be noted here that the response value is uniformly 200 mm for collapses and above. Therefore, the variation in deformation appears to be smaller, especially in lower-performing houses in the case of large responses.
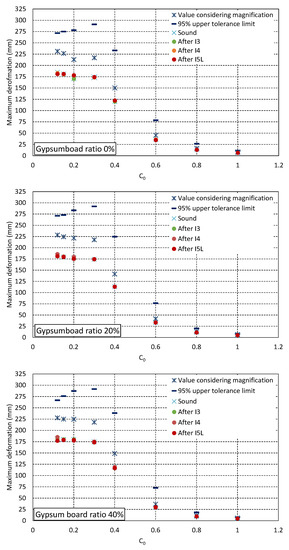
Figure 14.
Response deformation considering magnification.
The level of damage that could serve as a criterion for continued use after a major earthquake is approximately the level of partially damaged [2], and the response deformation at that time is considered to be 1/60 rad [31]. For houses of C0 = 0.5 or so, it was shown that if a response factor of 1.25 times is assumed as the response factor due to a moderate earthquake, the effect of such an event might exceed the criteria given for continued use. On average, it was discovered that a performance level of about C0 = 0.6 is required for new constructions to achieve continued use after a major earthquake. This is to reduce the response deformation to 1/60 rad or less if a large-scale earthquake occurs. In addition, it was also found that houses that were in a less-than-collapsed state and had low seismic performance may reach a state equivalent to the collapsed state due to the effects of multiple repeated moderate earthquakes. On average, a performance level of about C0 = 0.4 is required to ensure that the wooden house does not exhibit deformation equivalent to collapse when subjected to repeated moderate earthquakes.
No clear differences in maximum response deformation or response factor were found between the different ratios of gypsum board in terms of shear capacity. This is thought to be because the response deformation will always enter a new area in the case of a large-scale earthquake. From this, it could be argued that gypsum boards do not need to be taken into consideration when discussing the impact of medium earthquakes in terms of response at the time of large-scale earthquakes.
Figure 15 shows the maximum response deformation per seismic wave for each seismic intensity for the increase in response deformation for repeated small and medium earthquakes. There was no clear increase observed in response deformation in either performance for an earthquake of seismic intensity 3. These results indicate that there is no need to consider the effects of repeated earthquakes of seismic intensity level 3. For earthquakes of seismic intensity 4 and 5 lower, response deformation increased for wooden houses with considerably low performance. This was specifically the case for houses with C0 = 0.12 and 0.15 for seismic intensity 4, and for houses with C0 = 0.12–0.2 for seismic intensity 5 lower. However, as the C0 of a house built according to the current standard would be at least 0.2, it is clear that we do not need to pay attention to such housing.
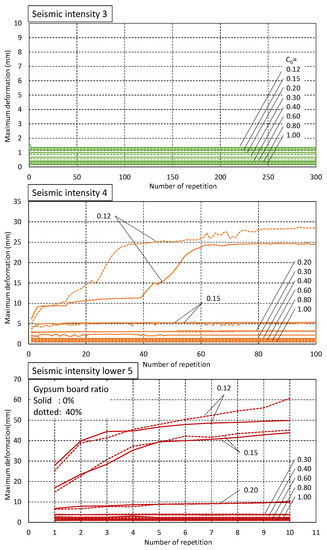
Figure 15.
Deformation due to numerous moderate earthquakes.
We confirmed that when response deformation increases, it tends to converge with the load-reducing properties of the shear walls. We learned that the higher the proportion of gypsum board in the shear capacity, the higher the increase in response deformation per repetition and the higher the convergence value of deformation. This is because, compared to plywood walls, the gypsum board walls have a higher reduction in load for the same deformation repetition.
4. Conclusions
We conducted an earthquake response analysis that considered repeated small deformations to clarify the impact of the repeated deformations, due to multiple small and medium earthquakes during the usage period, on the response deformation during a large-scale earthquake. These results are shown below:
- Compared to when sound, the maximum response deformation could be 1.2 times greater. For homes that are close to the collapse and/or continued use criterion when sound, the response factor from repeated medium earthquakes may have a greater impact. This reemphasizes the importance for new buildings to have built-in extra capacity for seismic performance.
- However, when looking at the average, the effect of multiple medium earthquakes on the response deformation of wooden houses during a large earthquake is minimal.
- If we envisage continued use after large-scale earthquakes, the required shear performance is approximately C0 = 0.6.
- The response deformation during repeated medium earthquakes may increase for houses with considerably low seismic performance. However, for the houses that meet current standards, little to no increase in response deformation was seen.
Based on the above results, except for houses with significantly low seismic performance, there is little need to consider the effects of repeated small earthquakes when examining the maximum response deformation during a large earthquake. However, when subjected to medium earthquakes, such as those of seismic intensity 5 lower, the possibility of an increase in response during subsequent large earthquakes was indicated. We consider that a wooden house that can be used for a longer period can be realized by adding a little margin to the required seismic performance.
The following two points are considered for future research. The number of data plots for calculating the load reduction trend of shear-resisting walls is small due to the small number of deformation categories that were repeated in the experiments. The load reduction trend should be confirmed in load-controlled or dynamic experiments and compared with the experimental results in displacement-controlled experiments.
The previous report also confirmed that the effect of numerous small deformations on the seismic performance of shear walls made of various face materials can be explained by using the experimental results of nailed joints. Seismic analysis can be performed using the hysteretic model of a shear-resisting wall created based on the results of nailed joints to accommodate housing of various specifications. When considering earthquake motion in other countries, the input wave can be changed. In addition, since the load deterioration due to repeated deformation can be expressed by the maximum experienced deformation and its number of repetitions, the number of times the seismic wave is input in the analysis can be changed even if the number of occurrences of earthquake is different. By applying the degradation trends of structural elements obtained from the experiments to the analytical model, the analysis method in this paper can be applied to seismic analysis of not only Japanese wooden houses but also wooden buildings of a wide range of specifications. This study will be useful for research on disaster prevention in countries that are similarly building wooden structures.
Author Contributions
Conceptualization, methodology, data curation, and writing—original draft preparation, R.I., T.M. and S.M.; supervision and writing—review and editing, T.M. and S.M. All authors have read and agreed to the published version of the manuscript.
Funding
This study received assistance from the Grant-in-Aid for JSPS Fellows (Proposal No.: 21J14285).
Data Availability Statement
All data generated or analyzed during this study are included in this published article.
Conflicts of Interest
The authors declare no conflict of interest.
References
- Sumida, K.; Isoda, H.; Inoue, R.; Mori, T.; Tanaka, K.; Sato, T. Survey of construction situation in Mashiki town two years after the 2016 Kumamoto earthquakes. J. Jpn. Assoc. Earthq. Eng. 2019, 19, 1_21–1_33. (In Japanese) [Google Scholar] [CrossRef]
- Inoue, R.; Mori, T.; Sumida, K.; Isoda, H.; Tanaka, K.; Sato, T. Status of wooden houses in Mashiki town two years after the 2016 Kumamoto earthquakes. In Proceedings of the 17th World Conference on Earthquake Engineering, Sendai, Japan, 27 September–2 October 2021. [Google Scholar]
- Van de Lindt, J.W. Evolution of Wood Shear Wall Testing, Modeling, and Reliability Analysis: Bibliography. Pract. Period. Struct. Des. Constr. 2004, 9, 944–953. [Google Scholar] [CrossRef]
- Stewart, W.G. The Seismic Design of Plywood Sheathed Shearwalls. Ph.D. Thesis, University of Canterbury, Christchurch, New Zealand, 1987. [Google Scholar]
- Stewart, W.G.; Dean, J.A.; Carr, A.J. The earthquake behavior of plywood sheathed shearwalls. In Proceedings of the International Conference on Timber Engineering, Seattle, WA, USA, 19–22 September 1988. [Google Scholar]
- Hanson, D. Shear Wall and Diaphragm Cyclic Load Testing, Cyclic Shear Fastener Testing, and Panel Durability Performance Testing of Weyerhaeuser Sturdi-Wood Oriented Strand Board; Weyerhaeuser Company: Federal Way, WA, USA, 1990. [Google Scholar]
- Schmid, B.L.; Nielsen, R.J.; Linderman, R.R. Narrow plywood shear panels. Earthq. Spectra 1994, 10, 569–588. [Google Scholar] [CrossRef]
- Shepherd, R. Cyclic Testing of Narrow Plywood Shear Walls; ATC R-1; Applied Technology Council: Redwood City, CA, USA, 1996. [Google Scholar]
- Johnson, A.C.; Dolan, J.D. Performance of long shear walls with openings. In Proceedings of the International Wood Engineering Conference, New Orleans, LA, USA, 28–31 October 1996. [Google Scholar]
- Dinehart, D.W.; Shenton, H.W., III. Comparison of Static and Dynamic Response of Timber Shear Walls. J. Struct. Eng. 1998, 124, 686–695. [Google Scholar] [CrossRef]
- Mori, T.; Tanaka, K.; Taki, Y.; Nagami, T.; Inoue, R.; Isoda, H. Experimental study on residual seismic performance using plywood wall and recovery strength performance after repairing. J. Struct. Eng. 2019, 65b, 179–183. (In Japanese) [Google Scholar]
- Foliente, G.; Paevere, P.; Ma, F. Parameter Identification and Seismic Response Analysis of Timber Structure. In Proceedings of the World Conference on Timber Engineering, Montreux, Switzerland, 17–20 August 1998. [Google Scholar]
- Folz, B.; Filiatrault, A. A Cyclic Analysis of Wood Shear Walls. J. Struct. Eng. Am. Soc. Civ. Eng. 2001, 127, 433–441. [Google Scholar] [CrossRef]
- Pang, W.C.; Rosowaky, D.V.; Pei, S.; Van de Lindt, J.W. Evolutionary Parameter Hysteretic Model for Wood Shear Walls. J. Struct. Eng. 2007, 133, 1118–1129. [Google Scholar] [CrossRef]
- Hitomi, Y.; Isoda, H.; Kawa, N. Hysteresis model of wood shear wall considering of large displacement and deterioration of cyclic load. J. Struct. Constr. Eng. 2009, 74, 2299–2306. [Google Scholar] [CrossRef]
- Isoda, H. Verification of Hysteresis Model of Wood Shear Wall Considering of Large Displacement Under Earthquakes. J. Struct. Constr. Eng. 2011, 76, 113–120. (In Japanese) [Google Scholar] [CrossRef]
- Filiatrault, A. Static and dynamic analysis of timber shear walls. Can. J. Civ. Eng. 1990, 17, 643–651. [Google Scholar] [CrossRef]
- Davenne, L.; Daudeville, L.; Ricahrd, N.; Kawai, N.; Yasumura, M. Modeling of timber shear walls with nailed joints under cyclic loading. In Proceedings of the World Conference on Timber Engineering, Montreux, Switzerland, 17–20 August 1998; Volume 1, pp. 353–360. [Google Scholar]
- Ayoub, A. Seismic analysis of wood building structures. Eng. Struct. 2007, 29, 213–223. [Google Scholar] [CrossRef]
- Goda, K.; Salami, M.R. Inelastic seismic demand estimation of wood-frame houses subjected to mainshock-aftershock sequences. Bull. Earthq. Eng. 2014, 12, 855–874. [Google Scholar] [CrossRef]
- Yin, Y.; Li, Y. Loss Estimation of Light-Frame Wood Construction Subjected to Mainshock-Aftershock Sequences. J. Perform. Constr. Facil. 2011, 25, 504–513. [Google Scholar] [CrossRef]
- Zhang, L.; Goda, K.; De Luca, F.; De Risi, R. Mainshock-aftershock state-dependent fragility curves: A case of wood-frame houses in British Columbia, Canada. Earthq. Eng. Struct. Dyn. 2020, 49, 887–903. [Google Scholar] [CrossRef]
- Murase, S.; Ohmura, S.; Sugino, M.; Hayashi, Y. Relationship between Characteristics of Ground Motions and Ratio of Collapsed Wooden Houses in the 2016 Kumamoto Earthquake. J. Jpn. Assoc. Earthq. Eng. 2018, 18, 147–165. [Google Scholar] [CrossRef]
- Sumida, K.; Isoda, H.; Mori, T.; Tanaka, K.; Tesfamariam, S. Experimental Seismic Response of a Japanese Conventional Wooden House Using 2016 Kumamoto Earthquake Records. J. Perform. Constr. Facil. 2019, 33, 04019014. [Google Scholar] [CrossRef]
- Japan Meteorological Agency. Seismic Intensity Database. Available online: https://www.data.jma.go.jp/svd/eqdb/data/shindo/index.html (accessed on 9 June 2020). (In Japanese).
- Inoue, R.; Mori, T.; Ariki, A.; Matsumoto, S. Evaluation of single shear performance of nailed joint damaged by cyclic deformation due to moderate earthquakes. Constr. Build. Mater. 2022, 342, 128044. [Google Scholar] [CrossRef]
- Inoue, R.; Mori, T.; Matsumoto, S. Effect of numerous small deformations caused by moderate earthquakes on shear performance of wooden walls. Constr. Build. Mater. 2023, 364C, 130016. [Google Scholar] [CrossRef]
- Building Center of Japan. The Building Standard Law of Japan; Article 46; BCJ: Tokyo, Japan, 2004. (In Japanese) [Google Scholar]
- Japan Housing and Wood Technology Center. Allowable Stress Design for Post and Beam Wooden Houses; Japan Housing and Wood Technology Center: Tokyo, Japan, 2017. (In Japanese) [Google Scholar]
- Shimizu, H.; Mori, T.; Murase, S.; Tachibana, K.; Isoda, H.; Komatsu, K.; Yoshikawa, S.; Fukuda, Y. Weight appraisal of newly built wood house—Weight measurement of full scale wood house. AIJ J. Technol. Des. 2009, 15, 115–120. (In Japanese) [Google Scholar] [CrossRef]
- Inoue, R.; Mori, T.; Tanaka, K.; Taki, Y.; Isoda, H. Comparison between finish damage level and story deformation of wooden house after earthquake. AIJ J. Technol. Des. 2020, 26, 917–922. (In Japanese) [Google Scholar] [CrossRef]
- Isoda, H.; Matsuda, M.; Tesfamariam, S.; Tamori, S. Shake Table Test of Full-Size Wooden Houses versus Wall Test Result: Comparison of Load-Deformation Relationship. J. Perform. Constr. Facil. 2021, 35, 04021043. [Google Scholar] [CrossRef]


Disclaimer/Publisher’s Note: The statements, opinions and data contained in all publications are solely those of the individual author(s) and contributor(s) and not of MDPI and/or the editor(s). MDPI and/or the editor(s) disclaim responsibility for any injury to people or property resulting from any ideas, methods, instructions or products referred to in the content. |
© 2023 by the authors. Licensee MDPI, Basel, Switzerland. This article is an open access article distributed under the terms and conditions of the Creative Commons Attribution (CC BY) license (https://creativecommons.org/licenses/by/4.0/).