1. Introduction
The need to address climate and environmental challenges has never been more pressing. The building sector is one of the major energy consumers in Europe covering a key role in energy efficiency measures to implement for making significant strides towards reducing energy consumption and improving energy efficiency in the residential sector. The European Union’s goals are very ambitious since they expect a greenhouse gas emission reduction of 55% at least by 2030 and to achieve climate neutrality by 2050 [
1].
However, while some countries have made progress in reducing emissions, others have continued to increase their consumption due to industrial and economic development [
2]. To reach the net zero emission target by 2050, carbon emissions must be halved by 2030 through a variety of energy measures, including the widespread adoption of clean technologies, such as high-insulated building envelopes, heat pumps, and district energy. However, it is worth noting that despite the transition to renewable energy sources, fossil fuels still account for 35% of the total building need in 2021 [
3].
European countries are aiming for an important reduction in the residential sector by 2030 to achieve the goal of decarbonizing the whole building stock by 2050, for which the renovation wave for Europe [
4] has been launched within the European Green Deal [
5], which aims to double annual energy renovation rates in the next 10 years. This means reducing consumption and emissions, improving the quality of life for residents, and generating new employment opportunities. Through national long-term strategies, Italy would like to achieve sustainable development goals and transform the economy over the next three decades by renovating the building sector and becoming a greener, more sustainable country [
6].
In this framework, the government’s national energy and climate plan aims to reduce greenhouse gas emissions of buildings by 33% compared with 2005 levels and to increase the share of renewable energy sources in the final consumption of energy to 30% [
7]. To achieve these goals, Italy relies on energy incentives, just introduced in 2014 and annually updated, i.e., a range of energy policies to encourage the renovation of existing buildings. The efficiency of the adopted energy measures is checked by using a standard calculation method, i.e., the one implemented in energy performance certificates (EPCs), which is the most useful tool to evaluate and collect energy information on national building stocks [
8,
9], resulting in a useful and common application for mapping building energy performance. EPC has been recently used at the national level to apply the latest incentivizing system, namely, Superbonus 110, to check the improvement of at least two energy classes in the energy retrofitting of buildings. Regardless, all the fiscal deductions for energy efficiency and the use of renewable energy sources used the standard calculation to assess the resulting energy savings. Therefore, the energy policies implemented at the national level are evaluated by using this easier calculation method as well as the energy savings and targets to be reached by 2030 and 2050.
Each European member state has included different energy services in EPC calculation, but the main objective remains to be energy efficiency awareness and the promotion of energy improvements in buildings to reduce carbon emissions. EPC is considered an important driver for building renovation [
10,
11], although other methods for the building energy performance assessment could be used. On the one hand, the asset rating is based on the real characteristics of the building envelope and its energy services, but conventional climate and operational conditions are adopted; for that reason, it can return unreliable energy consumption. On the other hand, other methods, such as dynamic or hourly calculation according to UNI 52016 [
12], could be able to give back more reliable outcomes at the expense of greater complexity for their use.
Although the reliability of the calculation method could be lower than other available energy calculation methods, EPC remains a very simple and easy-to-use tool for understanding the energy performance of buildings [
13,
14,
15]. Many studies have found that the gap between the standard calculation method and the actual one (i.e., the real energy consumption of buildings) could reach up to 30%, mainly due to the standard assumptions in EPC [
16,
17,
18,
19,
20,
21], but they also underlined the importance of EPC as a tool for energy performance assessment of the building stock, being the easier available method for an energy assessment. Semple and Jenkins highlighted that buildings are generally associated with 40% of total energy consumption, but the method used to identify this result is based on, albeit limited, different energy services considered in the EPC calculation method [
16], pointing out the necessity to adopt a uniform method at the European level. Hu et al. proposed a practical and complex approach based on a fuzzy analytic network to reduce this energy gap, obtaining a not-easy tool to be used or to extend to different contexts [
17]; on the other hand, Ferrari et al. proposed an easier approach based on multiple indicators, but it can be extended to another country, but it can be considered reliable only if energy consumption data are available [
19]. As underlined in [
20,
21], the correction of EPC outcomes is a relevant issue to be investigated to check the meeting of the national energy efficiency and carbon targets and to understand if correcting factors have to be used for more realistic energy consumption.
Furthermore, although more reliable energy consumption can be obtained with other calculation methods, a recent study highlighted that EPC can return comparable energy outcomes, especially in the case of highly efficient buildings (i.e., the ones with low energy needs) and when comparing analysis was performed, confirming its use for this kind of application [
22].
Other interesting applications of standard calculation can be found in the literature, such as developing national strategies [
10], or leveraging their data for the implementation of artificial intelligence to optimize the effects of national energy policies [
23], or checking the quality of data reported in EPC [
24], confirming the great ease of application of this kind of method.
According to these works, EPC is considered the easier and more useful tool to be used for checking the improvements of energy renovation actions and the achievement of national targets launched within the European Green Deal. Furthermore, EPC should ensure the application of a uniform method at the European level as the same goal has been set, although currently, EPC has differences in the calculation method, as shown in [
16,
25].
Although many studies have highlighted the potential of using EPC, only a few studies have been carried out on the effect it could have on energy forecasting analysis and on national targets’ achievements introduced by the European Green Deal, having recently been issued. For instance, Johansson et al. [
26] used EPC to analyze the energy targets’ achievement introduced by the government in the town of Kiruna, highlighting the importance of implementing the energy measures reported in EPC and the need for high energy measures’ impact to achieve the ambitious targets. Guo et al. [
27] investigated the effects of the photovoltaic industry on CO
2 emissions by 2060 in China to meet the neutrality target. Results have shown that the CO
2 emission could be reduced by around 88% by 2060, while the photovoltaic industry could reach neutrality between 2014 and 2015, allowing the reduction of 33 gigatons CO
2-eq by 2060. Energy security and carbon neutralization were analyzed by Wang et al. [
28] since they are the main targets for China, highlighting that energy security can negatively affect CO
2 emissions in the long-term impacts. Furthermore, Jiang et al. [
29] investigated the potential of CO
2 reduction in Shenzhen, pointing out that the reduction for the building sector could reach 60% by 2030 and that it could be significantly increased by accelerating the energy efficiency of existing buildings. Based on the European directives on the energy performance of buildings, Castellano et al. [
30] proposed and developed a straightforward procedure to obtain the environmental impact of building. This method proposed a new formula for CO
2 emissions, resulting in a useful support tool to address climate change mitigation. Conversely, Shi et al. [
31] carried out the impact of low-carbon transition in China by adopting a Bayesian network, pointing out that the transformation of energy subsystems plays a key role in the low-carbon strategy.
According to this brief literature description, the use of EPC is widely spread as a tool for energy performance assessment and its application in forecasting analysis. However, as the new targets provided by the European Green Deal were recently introduced, the effect of the European policy on the possibility or not of reaching the new targets has not yet been carried out, although some works found in the literature already addressed the relevance on CO
2 reductions to mitigate climate change. For a more comprehensive literature review, the grouping of the analyzed works by addressed topic is shown in
Table 1.
In this framework arises the present work aimed at evaluating the effects of the current energy policies on the residential building sector to highlight issues and potentialities of these strategies and to check the feasibility of achieving the ambitious targets by 2030. Considering the main findings of previous works [
8,
9,
10,
11,
12,
13,
14,
15,
16,
17,
18,
19,
20,
21,
22,
23,
24], the study was performed by assessing the energy consumption with the standard calculation method of the Umbrian residential building stock, chosen as a case study. Energy consumption was assessed starting from the characterization of the Umbrian heritage based on the most recent data provided by the National Institute of Statistics, and the current energy consumption and the CO
2 target to be reached by 2030 were estimated on the basis of national reports and data. Theoretical energy savings achieved by 2030 were thus assessed by applying a forecasting analysis, assuming a number of interventions consistent with the one observed in recent years. As highlighted by the literature review, this represents the first analysis of the possibility of achieving CO
2 targets by 2030 in the Italian context.
In addition to previous works, the EPC analysis was integrated with the artificial neural network (ANN) implemented in a previous work [
23] capable of optimizing the energy strategies in the Umbrian context to improve the energy savings of each energy measure. In this case, a new application of the ANN was proposed, i.e., to improve the energy actions to reach the regional targets by 2030. Therefore, this paper aims to investigate if the current national energy strategies can allow for achieving the ambitious targets set for 2030 and to evaluate if the use of the ANN can help to reach them in less time. The analysis aimed at checking the achievement of the targets set for 2030 and the use of the ANN for purposes related but different from those for which it was implemented is the main new novelties of the present work.
The study aims to understand the real potential of energy strategies by 2030 and to understand if the emission target of the residential sector can be reached. In addition, the integration with the ANN would like to show its effectiveness, allowing the improvement of each energy strategy. Therefore, the present work would answer the following key questions:
- (1)
Is it possible to achieve the CO2 emission target fixed for the residential sector by 2030 with the current energy policy?
- (2)
Can they be achieved by extending the current energy policy until 2025?
- (3)
Could the CO2 emission target set for the residential sector for 2030 be achieved by using the outcomes of the ANN?
The proposed study could have important feedback; for instance, it could allow for checking the effectiveness of current energy policies and evaluating whether corrective measures needed to be proposed to make the 2030 goals achievable. In addition, it could also highlight whether theoretically achievable CO
2 reduction could be improved with small corrections of the energy actions or by integrating them with other tools, such as the ANN. The paper is structured as follows: the research procedure is detailed in
Section 2, underlying the characteristics of the building stock of the Umbria Region (
Section 2.1), and the assumptions and the calculation method adopted in this work (
Section 2.2).
Section 2.1 is focused on the building stock’s geometrical and thermal properties (
Section 2.1.1), the state of the art of energy strategies adopted for the building renovation (
Section 2.1.2), and the theoretical targets to be reached by 2030 (
Section 2.1.2 and
Section 2.1.3).
Section 2.2 is focused on the main characteristics of the calculation method (
Section 2.2.1) and the peculiarities of the trained ANN (
Section 2.2.2), as well as the energy consumption assessed with the standard calculation (
Section 2.2.3) and the investigated energy scenarios (
Section 2.2.4). Finally, the energy and emission outcomes were discussed with both ANN integrations in
Section 3, while the main findings are remarked on in the conclusion.
2. Materials and Methods
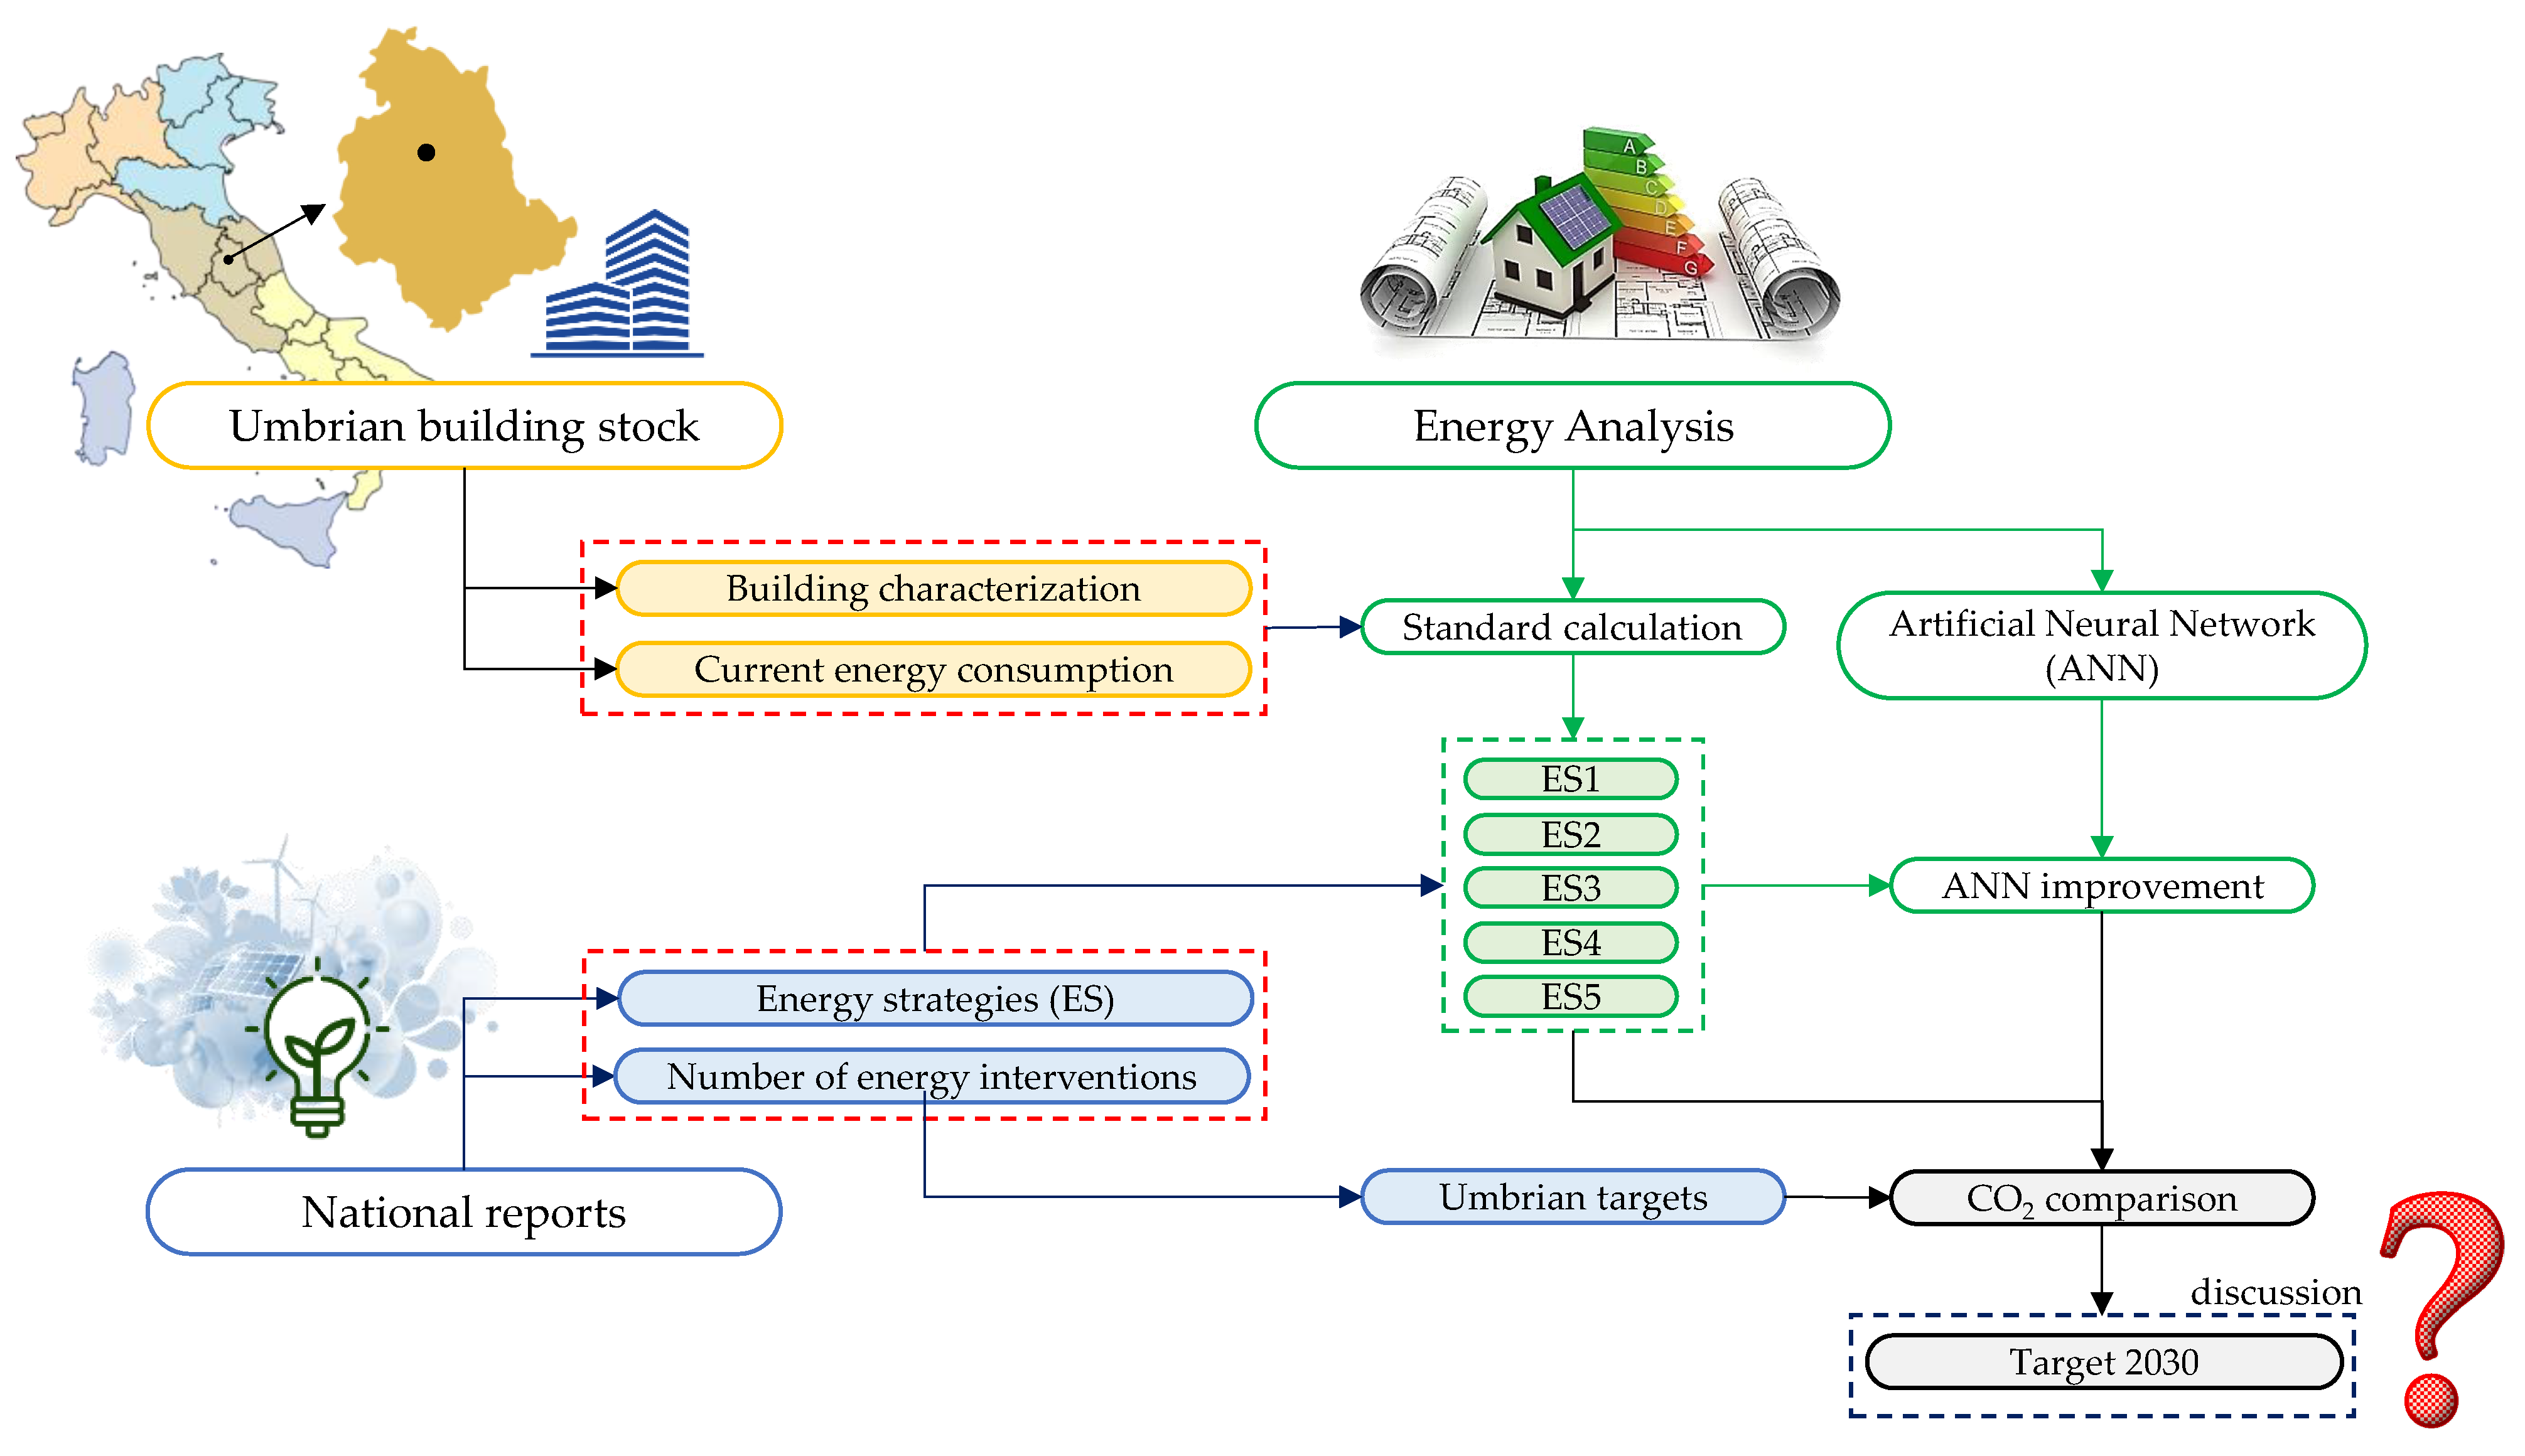
A detailed research procedure was planned (
Figure 1) to check the achievement of the Umbrian target by 2030. The present work consisted of two distinct parts: the first one aimed at identifying the state of the art of the Umbria Region (described in
Section 2.1), in terms of building stock, energy consumption, and savings, and the second part aimed at defining the assumptions required for the development of the work (
Section 2.2).
The Umbrian building stock was first analyzed by defining the main features and thermal properties of residential buildings (
Section 2.1.1); this kind of analysis was based on data provided by the National Institute of Statistics [
32] and on a recent study carried out by ENEA [
33]. It is worth noting that the data from the National Institute of Statistics were updated in 2010–2011; hence, they can be a good representation of the existing building stock since (i) new constructions are less than existing ones, (ii) the energy need of the new constructions is lower, and (iii) the new constructions are not subject to the efficiency measures. However, for that reason, the energy history of the Umbrian building stock has also been studied.
Additionally, national reports on fiscal deductions for the energy efficiency and use of renewable energy sources in the existing buildings [
34,
35,
36,
37,
38,
39] were examined to identify the most significant and widespread energy strategies in this area. The most widespread solutions capable of significantly increasing the energy efficiency of existing buildings were chosen and subsequently investigated (
Section 2.1.2).
Besides, baseline values were also defined for the Umbrian building stock (
Section 2.1.3), enabling the estimation of the current CO
2 emissions and the theoretical one related to the heating of the residential sector to be achieved by 2030 in accordance with the new national programs. For the latter analysis, data available online from the Italian Institute for Environmental Protection and Research were also used [
40,
41].
Once defined, the Umbrian building characterization, the baseline values of energy consumption and CO
2 emissions, the working assumptions, and the calculation approach adopted in this work were detailed (
Section 2.2). Particularly, energy analysis in agreement with standard calculation (
Section 2.2.1) was carried out starting from the Umbrian building stock characterization to define (i) the state of the art of the building stock of the Umbria Region, (ii) the energy consumption of the Umbrian building stock and the CO
2 emissions considering the real energy mix of the region, and (iii) the energy savings resulting from each energy strategy. Furthermore, the artificial neural network implemented in a previous work (of which the main peculiarities are reported in
Section 2.2.2) was applied to improve the same energy strategies and to assess the theoretical CO
2 emissions of the Umbrian building stock. Finally, the achievement of CO
2 targets considering different energy policies and strategies (with and without improvement with the ANN) was checked and discussed.
According to this premise, the work consisted of the following steps:
Definition and thermal characterization of the Umbrian building stock (
Section 2.1.1) based on data provided by the National Institute of Statistics [
25] and national report [
33];
Evaluation of the energy measures in place across the Umbria Region (
Section 2.1.2) based on national reports on fiscal deductions for energy renovation of existing buildings [
34,
35,
36,
37,
38,
39]. This step was focused on estimating the number of interventions implemented and energy savings reached every year in Umbria (from 2014 to 2021);
CO
2 reference value assessment (
Section 2.1.3) on the basis of data from the Italian Institute for Environmental Protection and Research [
40,
41];
Definition of the main assumptions made for the standard calculation (
Section 2.2.1) and artificial neural network application (
Section 2.2.2);
Assessment of the reference values for energy consumption for the Umbrian building stock (
Section 2.2.3) adopting the standard calculation provided by UNI TS 11300 [
42,
43,
44,
45,
46] and considering the energy savings achieved every year according to step 2. The outcomes were checked considering the ones obtained in step 3;
Number of interventions and energy savings definition (
Section 2.2.3) for each energy strategy to be implemented from 2022 to 2030 considering the main finding of step 2;
Assessment of the theoretical energy and CO
2 reduction by 2030 due to the application of different energy efficiency actions (
Section 3.1);
Improvement of the main energy actions with the ANN and theoretical energy and CO
2 reduction assessment as a result of the network (
Section 3.2).
2.1. Umbria Region State of the Art: Buildings, Energy Consumption, and Energy Savings
2.1.1. Umbrian Building Stock
A key point of the Umbrian energy assessment lies in the characterization of the Umbrian building stock; particularly, the type and geometrical dimensions of existing buildings were assessed from data provided by the National Institute of Statistics [
25] available online, while thermal properties were defined based on a previous work carried out by ENEA [
33], as already conducted in a previous study [
23] for the artificial neural network implementation. However, limited information and correlations are available from [
25] (such as the number of residential buildings per number of floors, the number of buildings per number of building units, and the number of building units per net surface range reported in
Appendix A); for that reason, the following steps were followed for the Umbrian building characterization for each municipality:
Step 1: a correlation between the number of buildings per number of floors (
Table A1) and the number of buildings per building unit (
Table A2 and
Table A3) was established by using an iterate approach and double-checking on both the number of buildings and the number of building units. In this way, the number of building units (as grouped by the National Institute of Statistics into “one unit”, “two units”, “three or four units”, “five to eight units”, “nine to fifteen units”, and “more than sixteen units) for the number of building floors (as grouped by the National Institute of Statistics into “one floor”, “two floors”, “three floors”, and “four and more floors”) was defined;
Step 2: once the number of building units for the number of floors was correlated, the net surface distribution of the building units was investigated. The analysis allows for defining the most widespread net surfaces, considering the range provided by [
25] (National Institute of Statistics groups data into “≤29 m
2”, “30–39 m
2”, “40–49 m
2”, “50–59 m
2”, “60–79 m
2”, “80–99 m
2”, “100–119 m
2”, “120–149 m
2”, and “≥150 m
2”).
To perform step 1, the assumptions shown in
Figure 2 were made; results related to the most representative cities (the ones that have a number of buildings greater than 2% of the total of Umbria) are reported in
Table 2. It is worth noting that this percentage distribution was assessed considering the whole Umbrian building units’ sample provided by [
32]. As shown, Umbria is predominantly characterized by buildings on one or two floors (around 30.6% of the sample shown in
Table 2 and about 48.7% overall), of which more than 22% (40% of the whole sample) are on two floors with only one building unit (i.e., single-family houses (SFH)). Among the multifamily houses (MFH), i.e., the ones with two or more building units, a greater number of buildings with three floors can be highlighted (around 28% of the sample shown in
Table 2 and about 31% overall), with a significant prevalence of buildings with two building units. Only in the biggest cities (such as Perugia and Terni) a greater number of buildings with four or more floors were found.
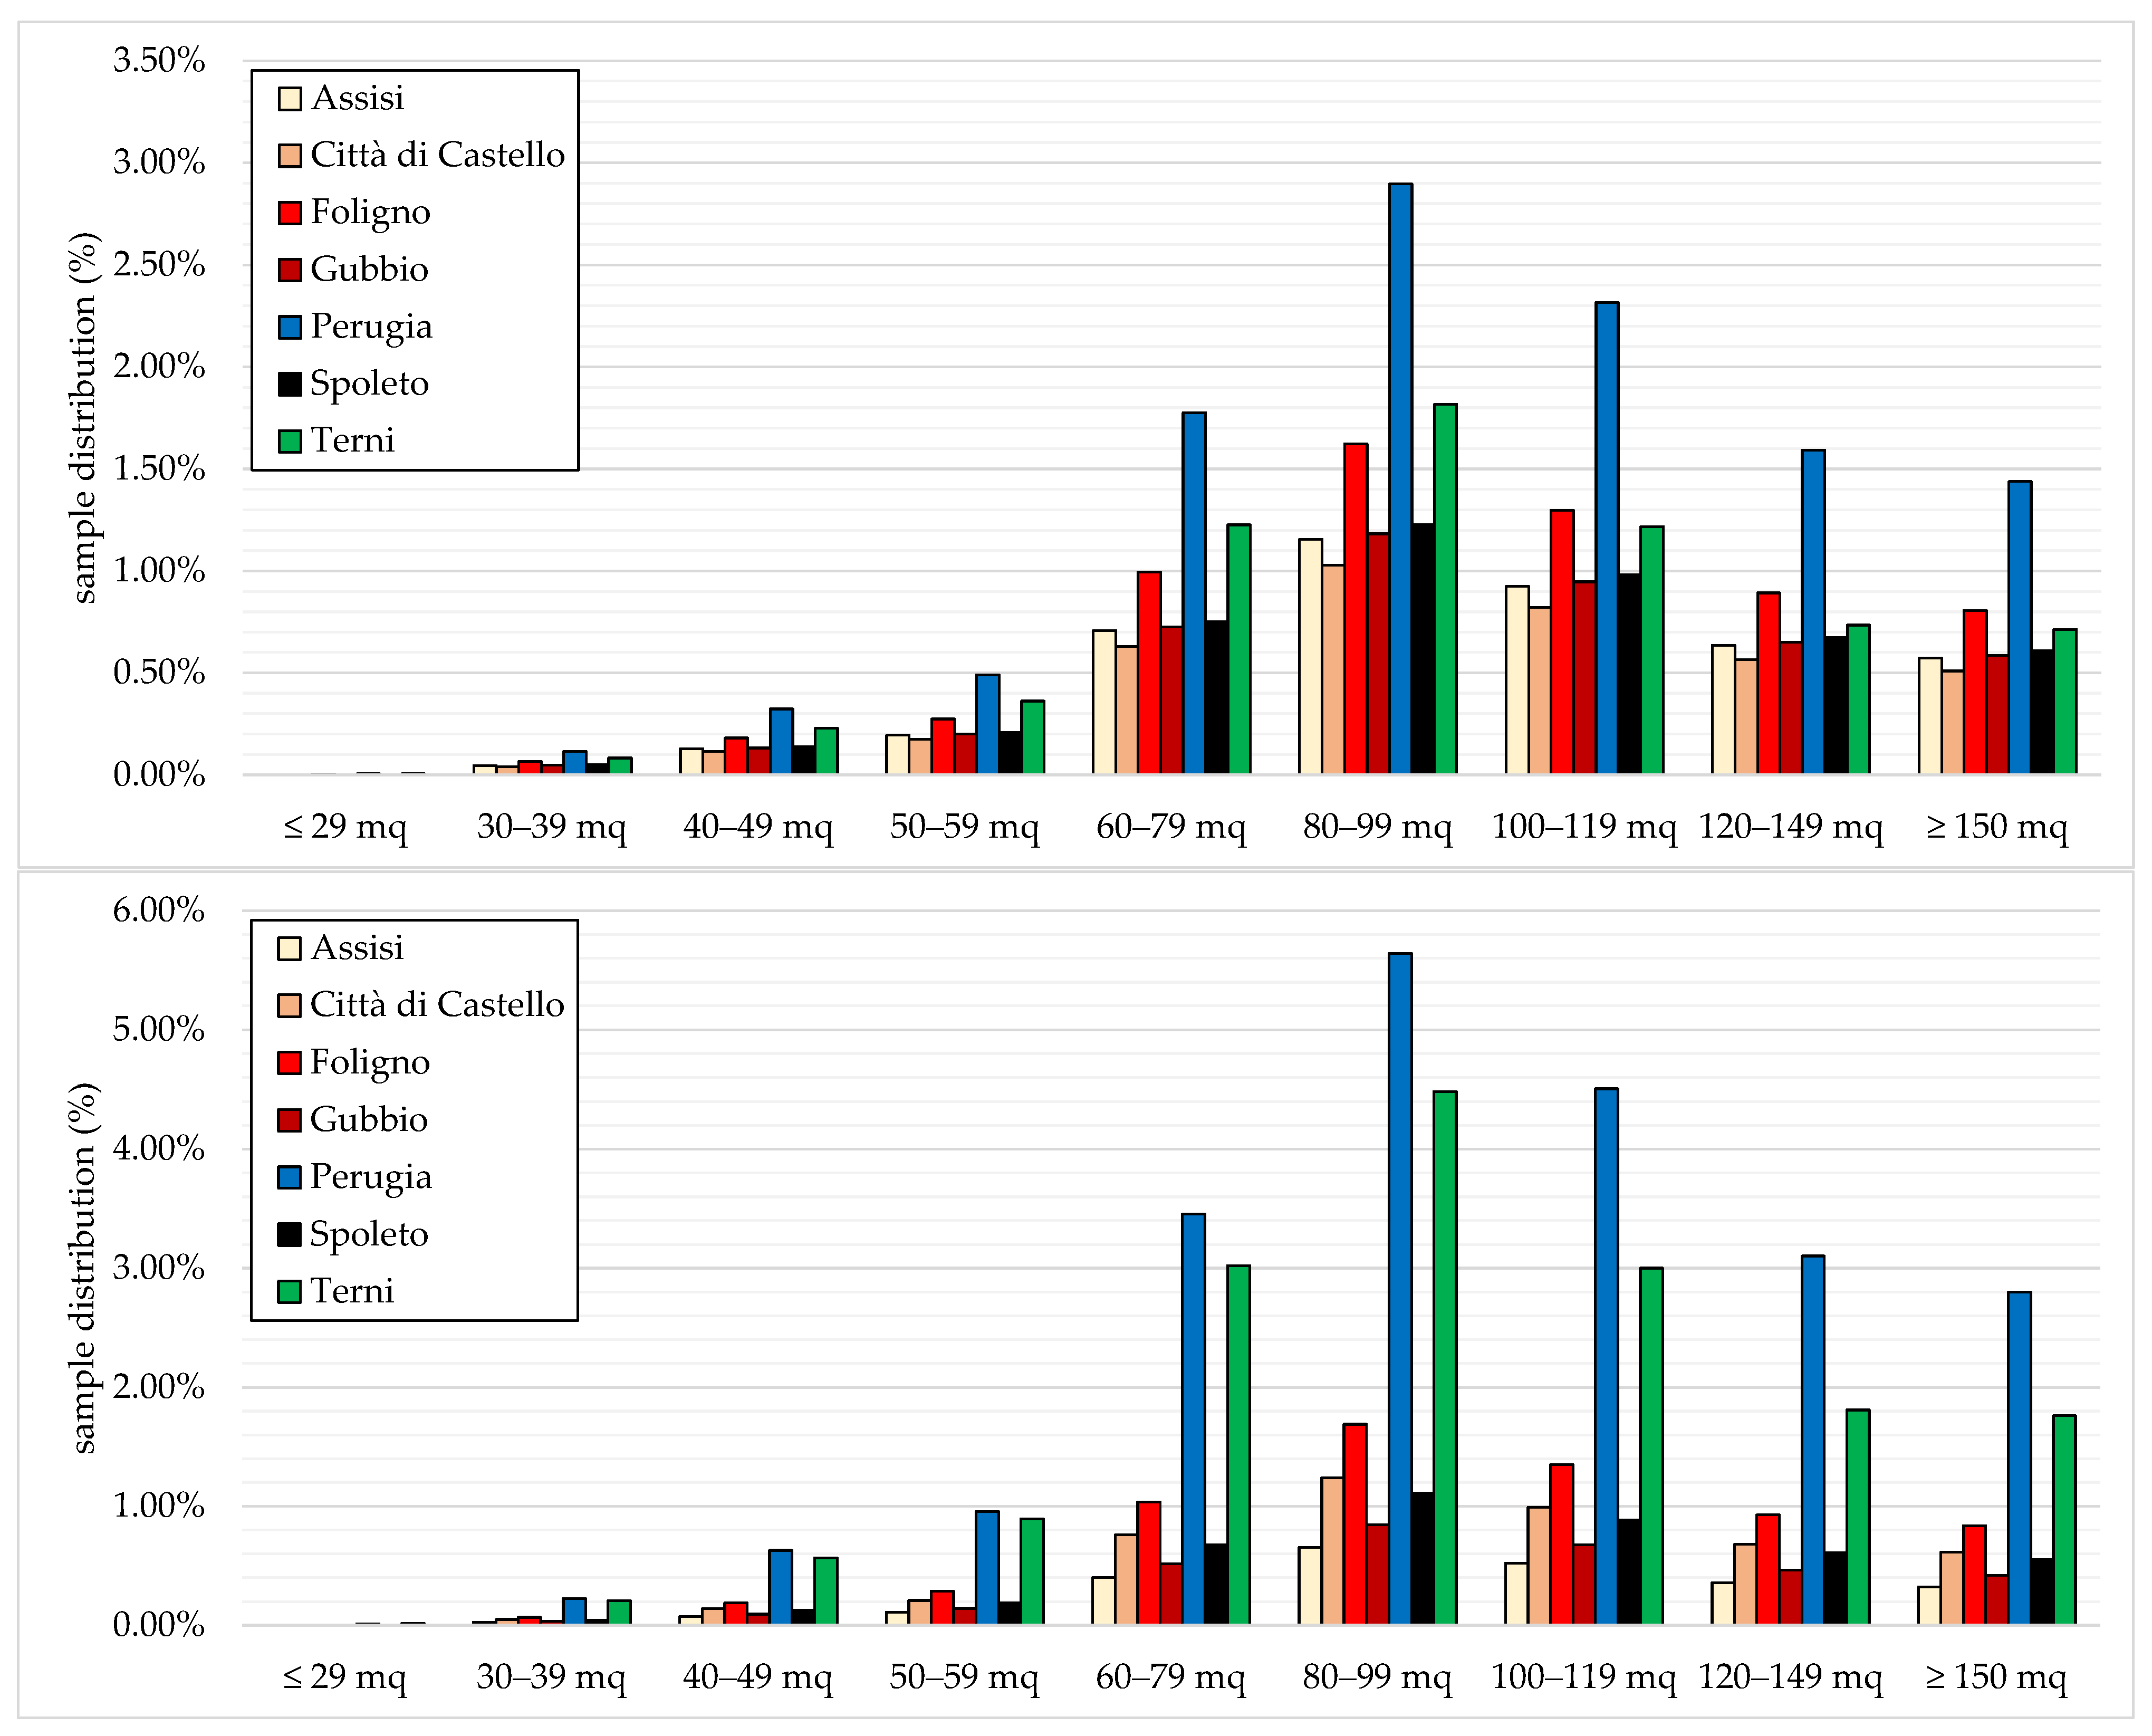
On the basis of step 1, the distribution of the net surfaces was thus evaluated to check the most widespread solutions; the ones found in the most representative Umbrian cities are shown in
Figure 3, highlighting that the building units are greater than 60 m
2.
The thermal properties of the building envelope and the heating characterization of the building stock were based on a previous work carried out by ENEA [
33]. Particularly, this study carried out a thorough analysis of the thermal properties of building components based on the year of construction of buildings, thermal insulation, and materials. For instance, buildings built before 1991, i.e., before the issue of the second and most important Italian energy regulation, were generally built without or with a small thickness (up to 2 cm) of thermal insulation materials, corresponding to greater thermal transmittance values (falling into 0.75 and 3.5 W/m
2K range); on the other hand, the new construction can have a lower variability of the thermal transmittance, which can fall within the 0.2–0.3 W/m
2K range.
The same considerations were made for transparent surfaces; however, their thermal transmittance is less variable, mainly between 1.3 and 3.0 W/m2K.
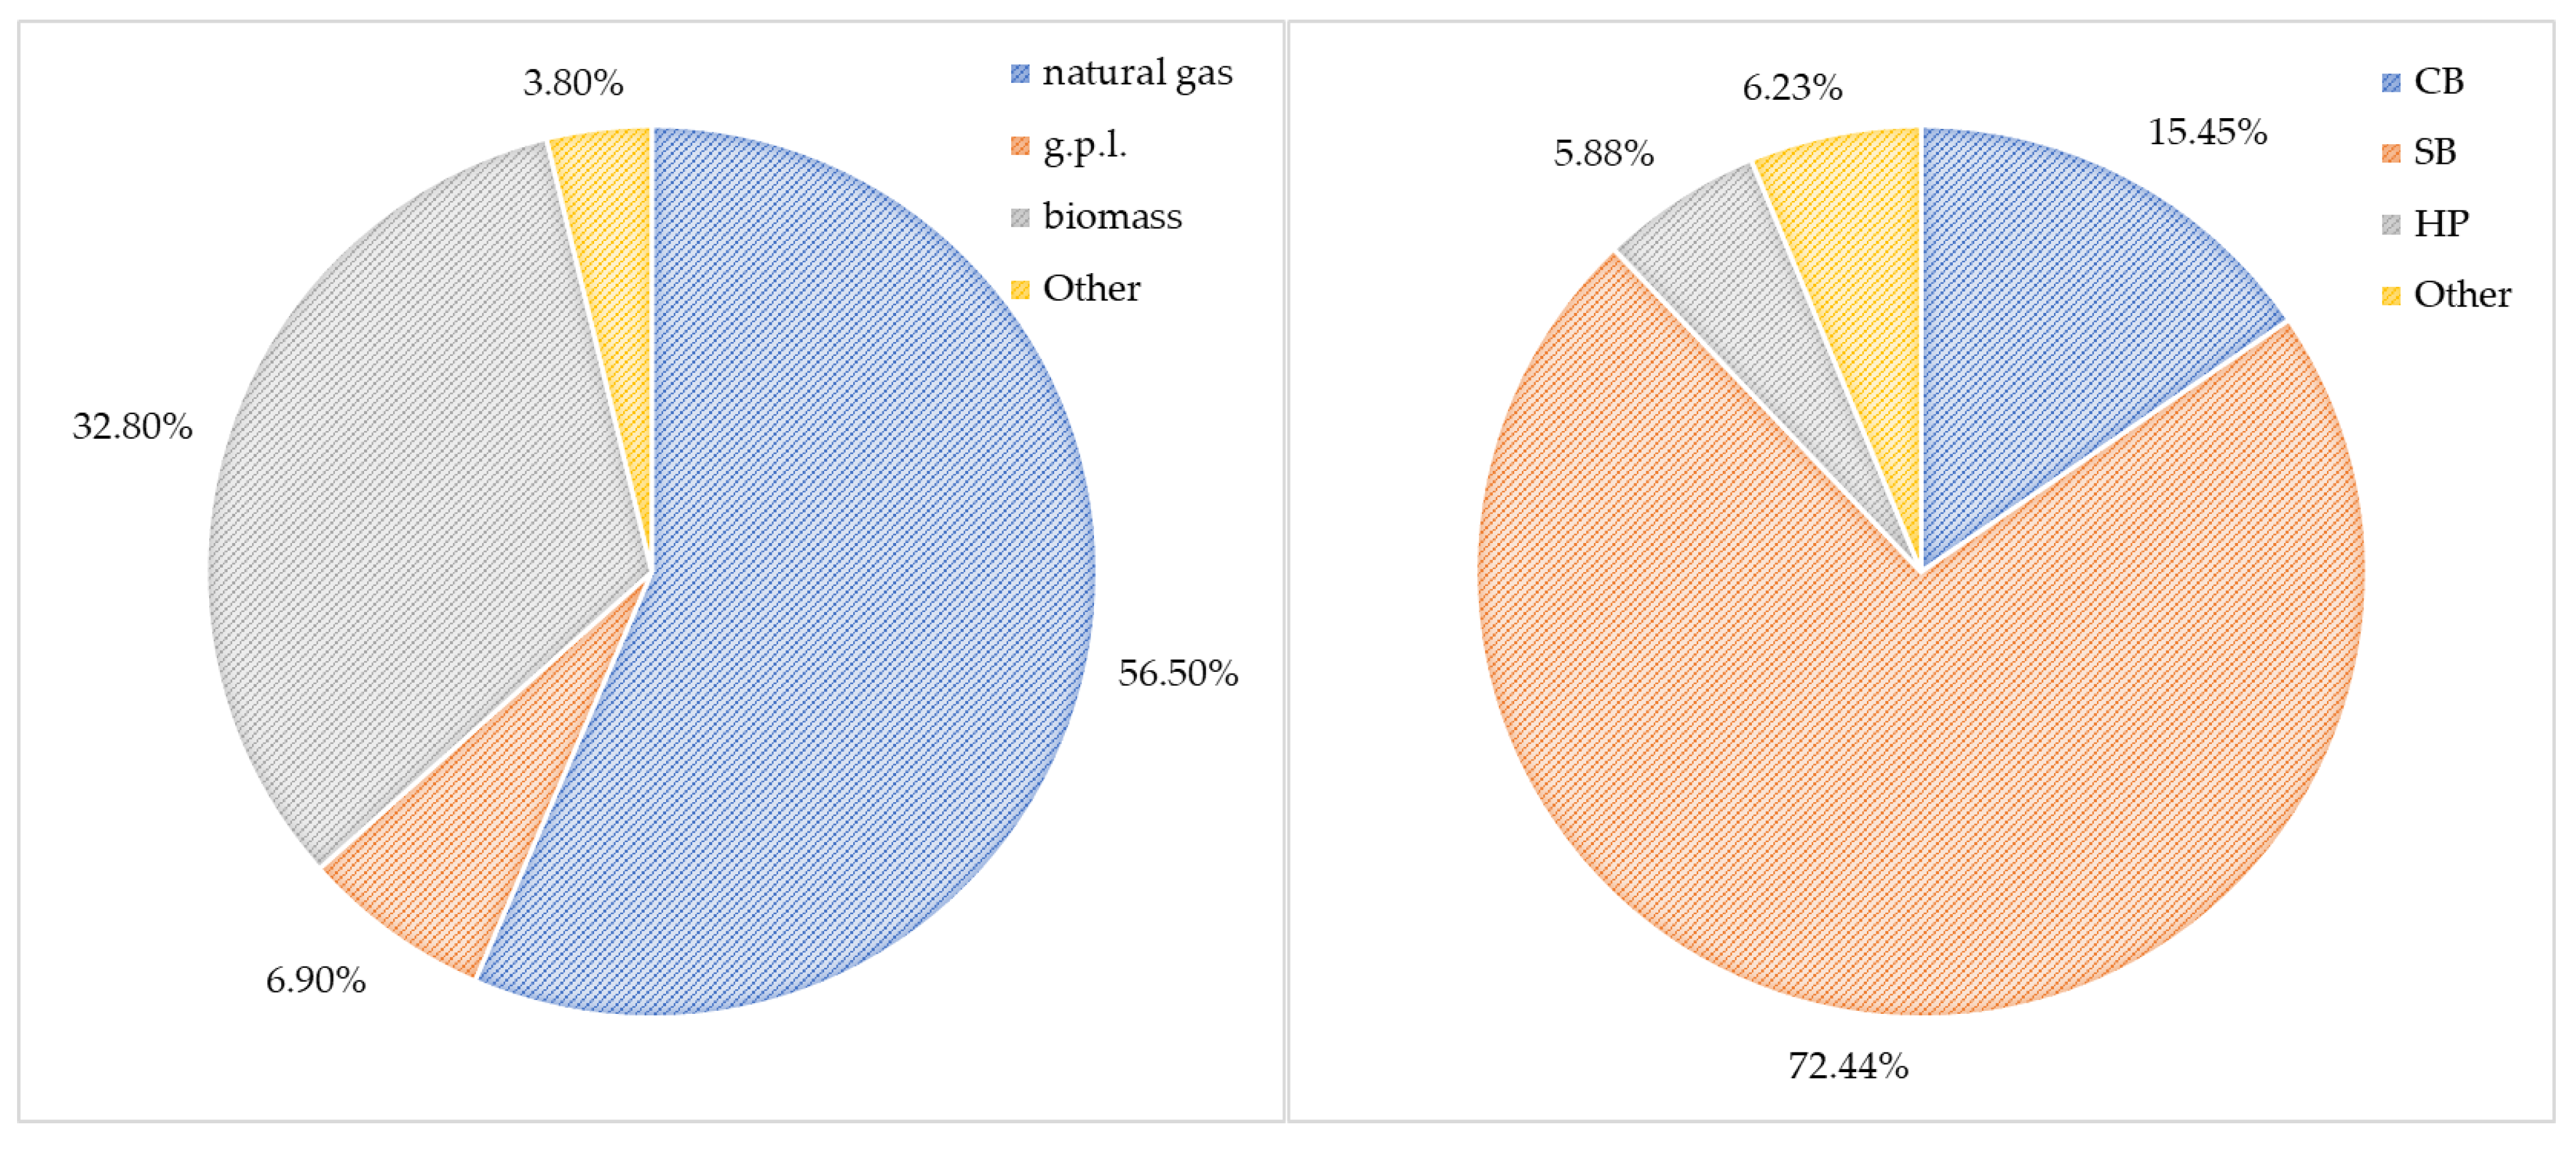
Besides, the same study provided information on heating systems, thanks to the integration of the database of the National Institute of Statistics with data from Informative System on Energy Performance Certificates (SIAPE in Italian). In Umbria, the widespread heating system (
Figure A1) used in existing buildings consists of standard boilers (around 72%), followed by condensing boilers (around 15%); other heating systems, such as heat pumps (less than 6%), are common only in new construction. This last one can be used also as an integration heating system or for cooling. Moreover, natural gas is the main energy carrier used for heating in Umbria (more than 56% of the sample), followed by biomass (32% of the sample) and g.p.l. (6.9% of the sample).
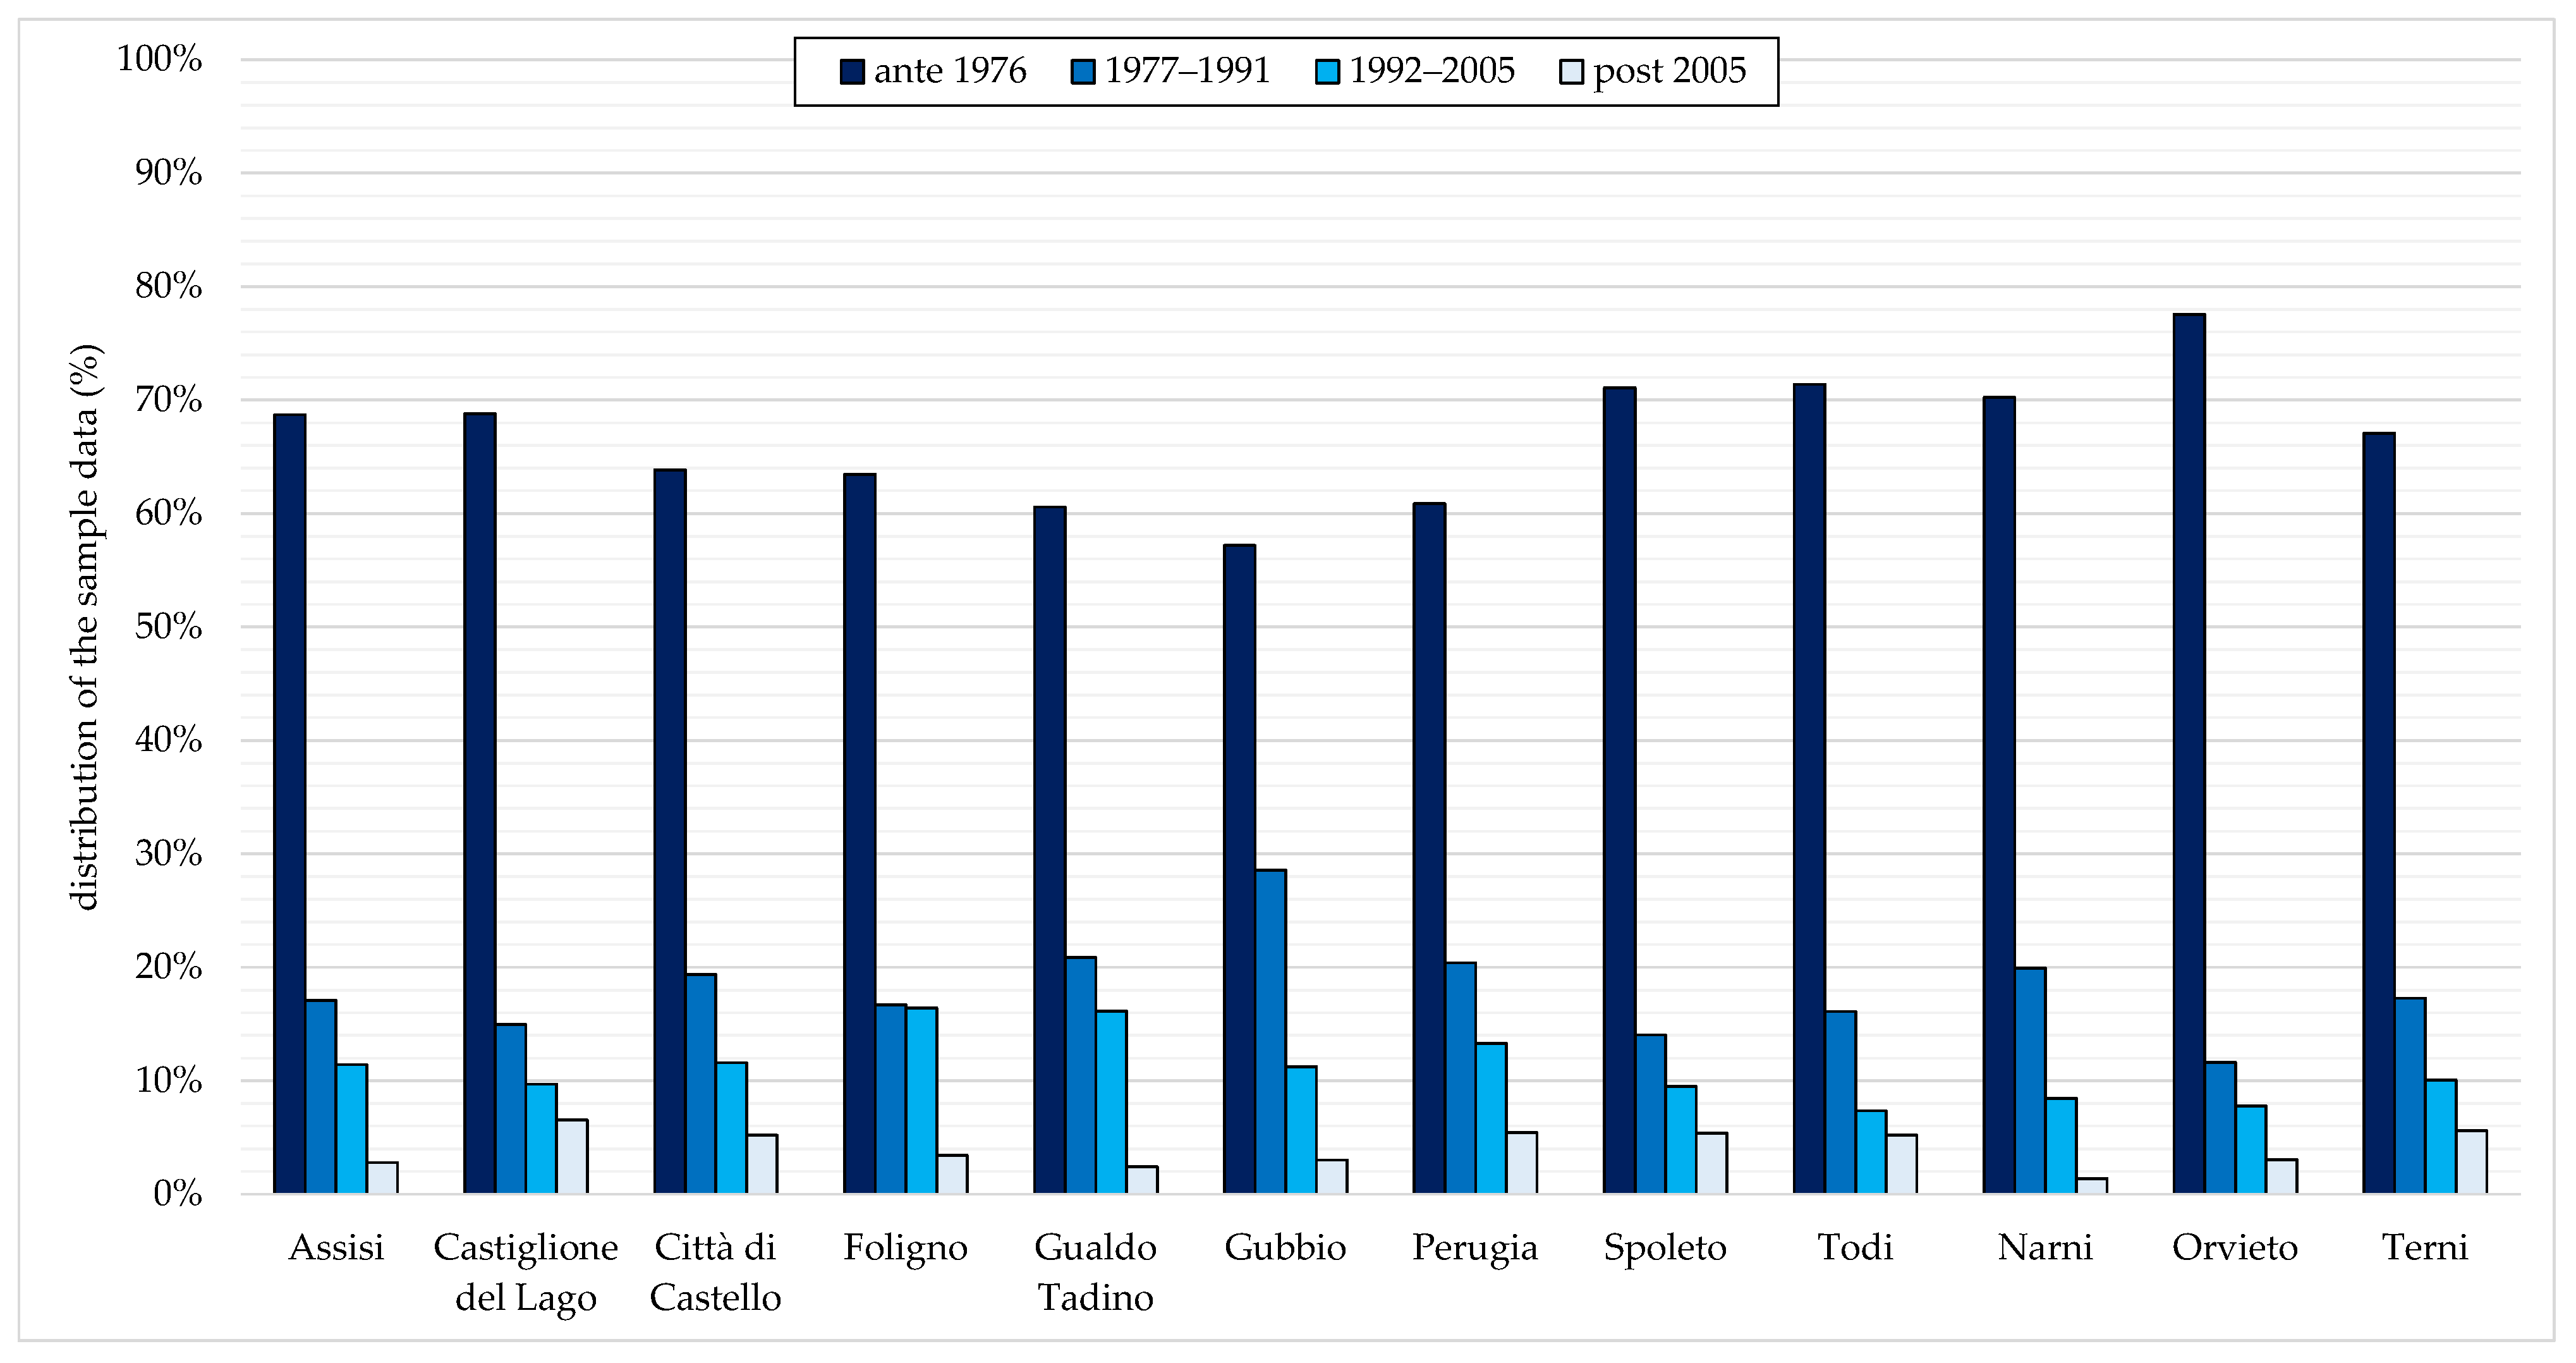
Based on the state of the art of the Umbrian building stock, the sample was grouped into four different periods of construction (before 1976, between 1977 and 1991, between 1992 and 2005, and after 2005) to take into account the different thermal properties according to the national regulation evolution and to correlate the properties of the building components with the year of construction of the building stock. Particularly, data from ISTAT highlighted that in all the Umbrian municipalities, the majority of the buildings are built before 1976 (values around 50–70%), followed by buildings built between 1991 and 2005 (between 30% and 10% on average). This analysis pointed out that the whole residential building stock has poor thermal properties since it was built before the second and most important national energy regulation. The found trend for the most representative cities of the Umbria Region is shown in
Figure 4.
Based on these premises, archetypes with the geometrical characterization described above were defined and used for the parametric energy simulations; the thermal properties of the building opaque components applied in this analysis are shown in
Table 3, while the heating systems for heating and the energy mix previously described were considered.
2.1.2. Energy Measures in Place
Another important point for the present analysis consists in the definition of the number of new interventions that could be implemented by 2030. This analysis was performed considering national reports [
34,
35,
36,
37,
38,
39] by analyzing the number of interventions performed from 2014 and the energy savings obtained for each intervention. Analysis revealed that thermal coating, standard boiler replacement with a condensing one, window replacement, and heat pump installations were the energy measures most implemented in the Umbria Region in the last decade, although the heat pumps are mainly used as an integration of existing heating systems or for cooling (
Table 4).
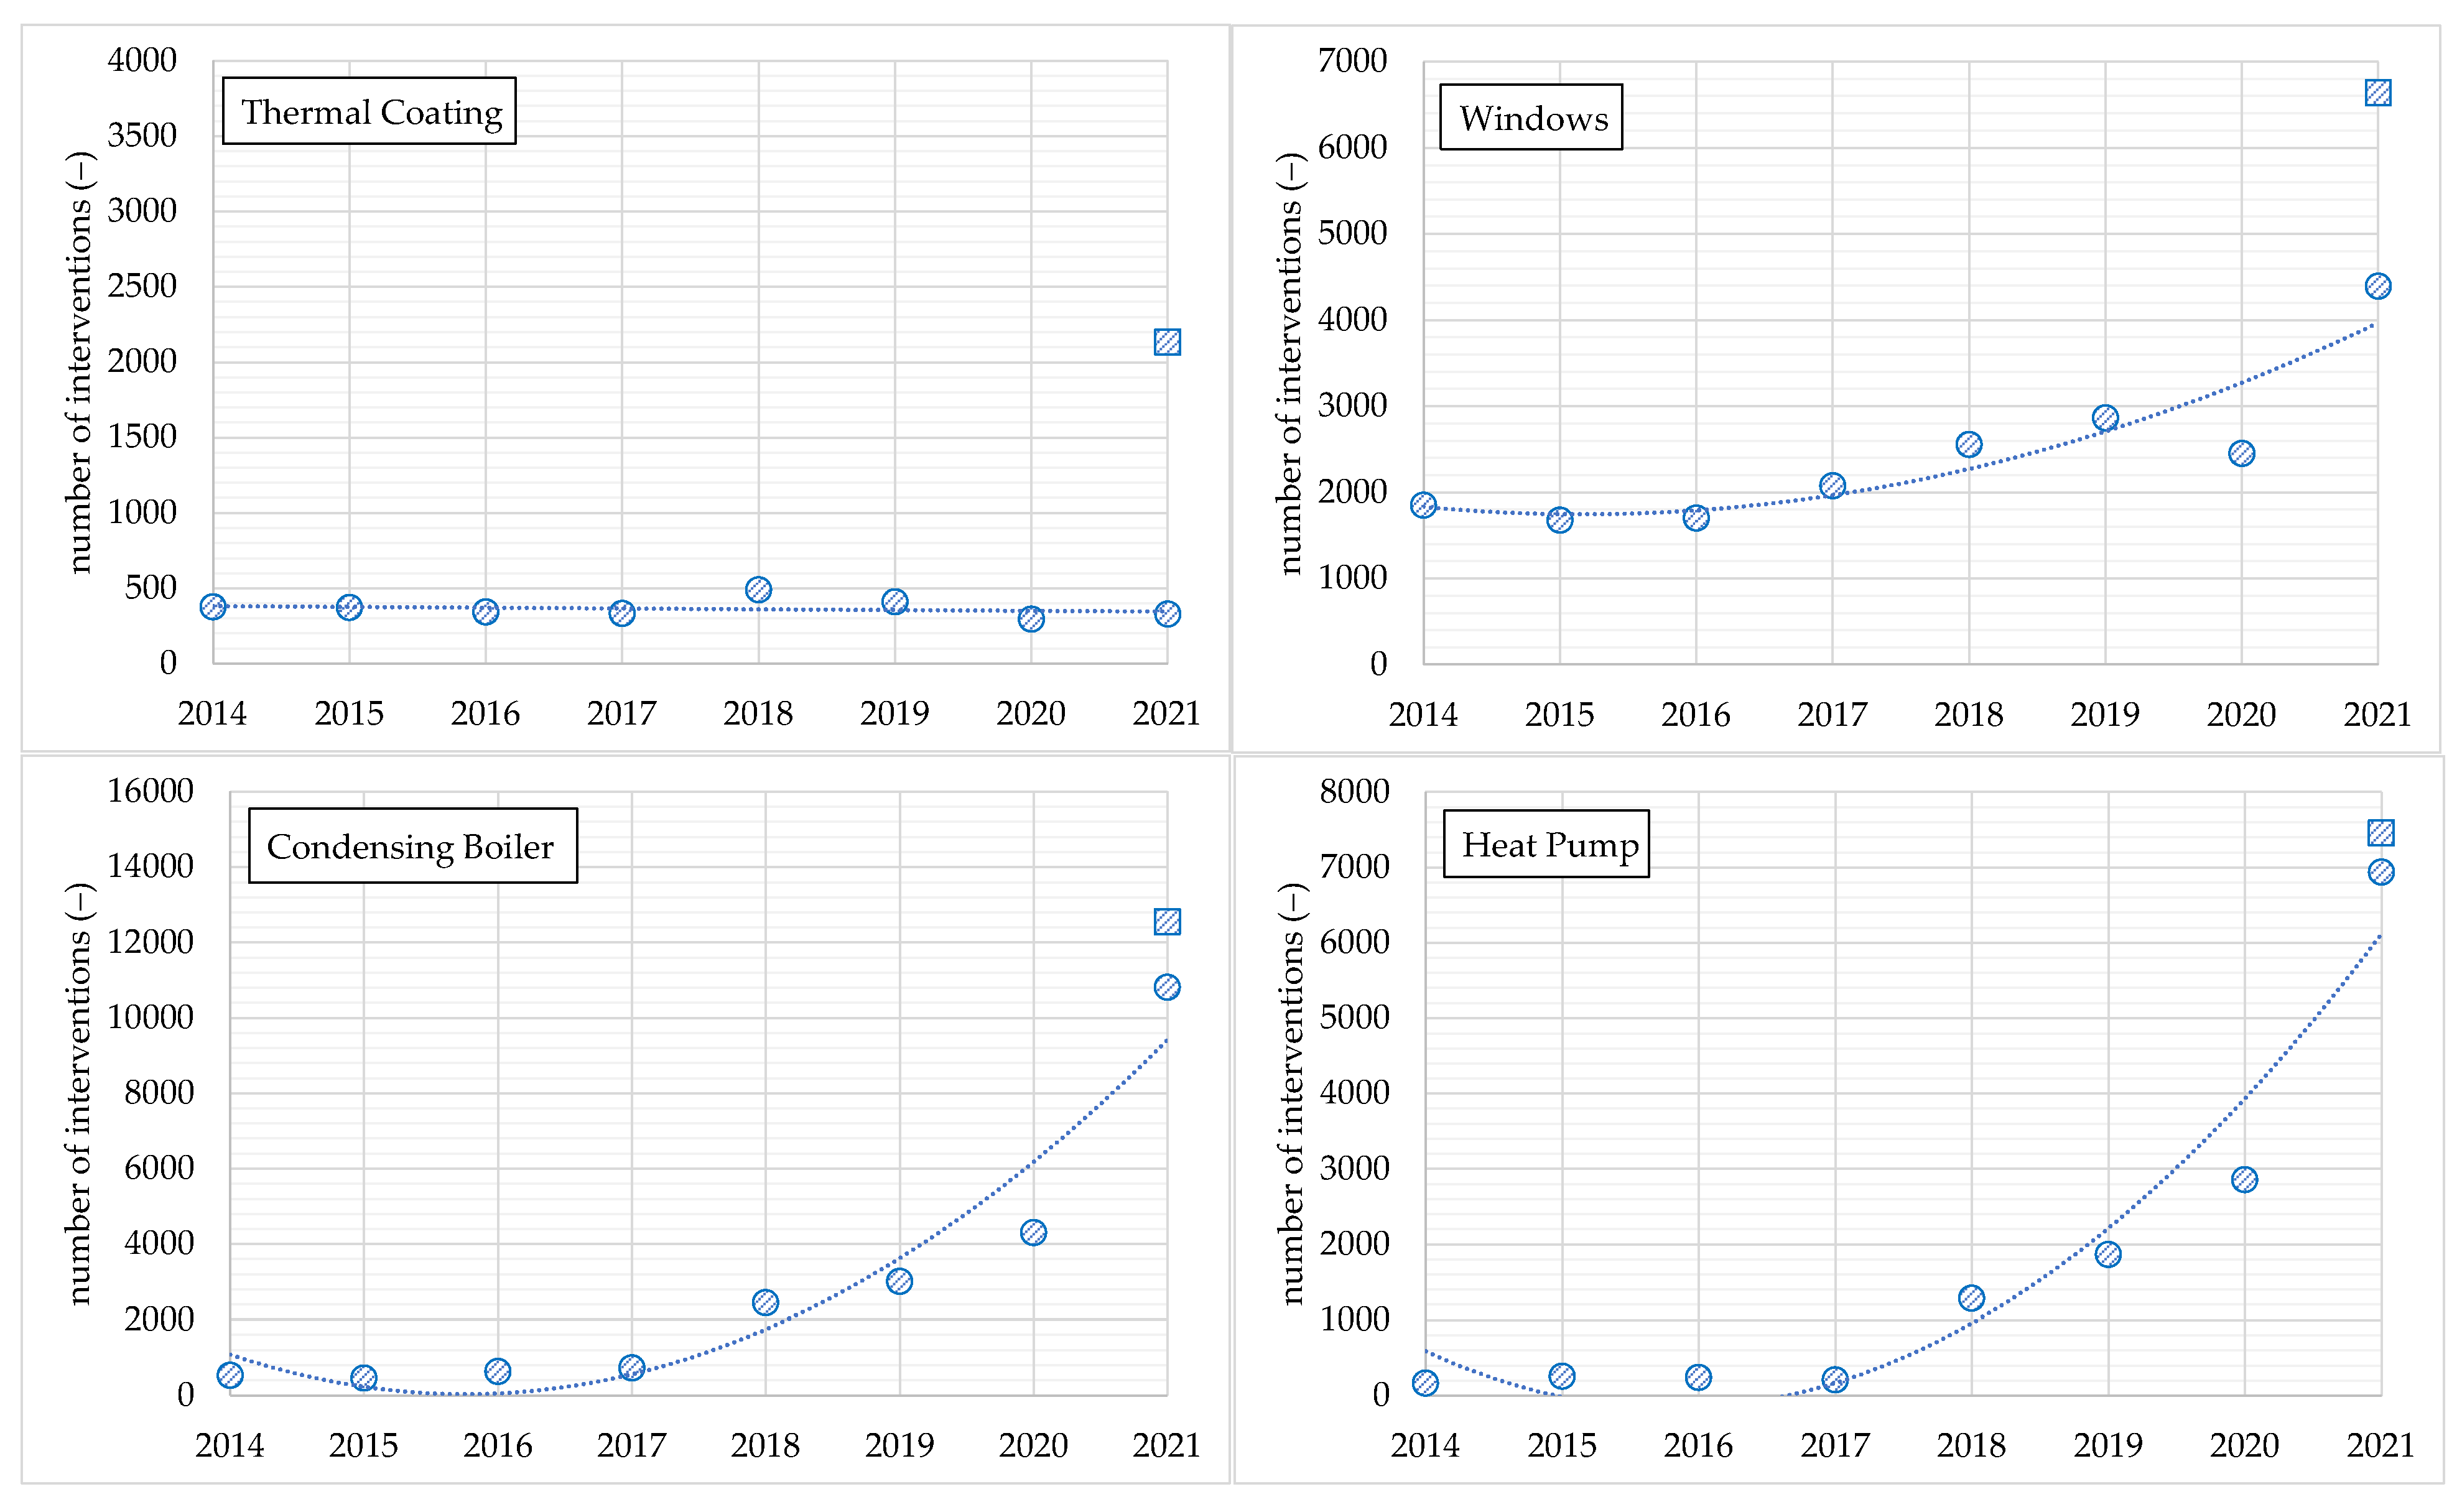
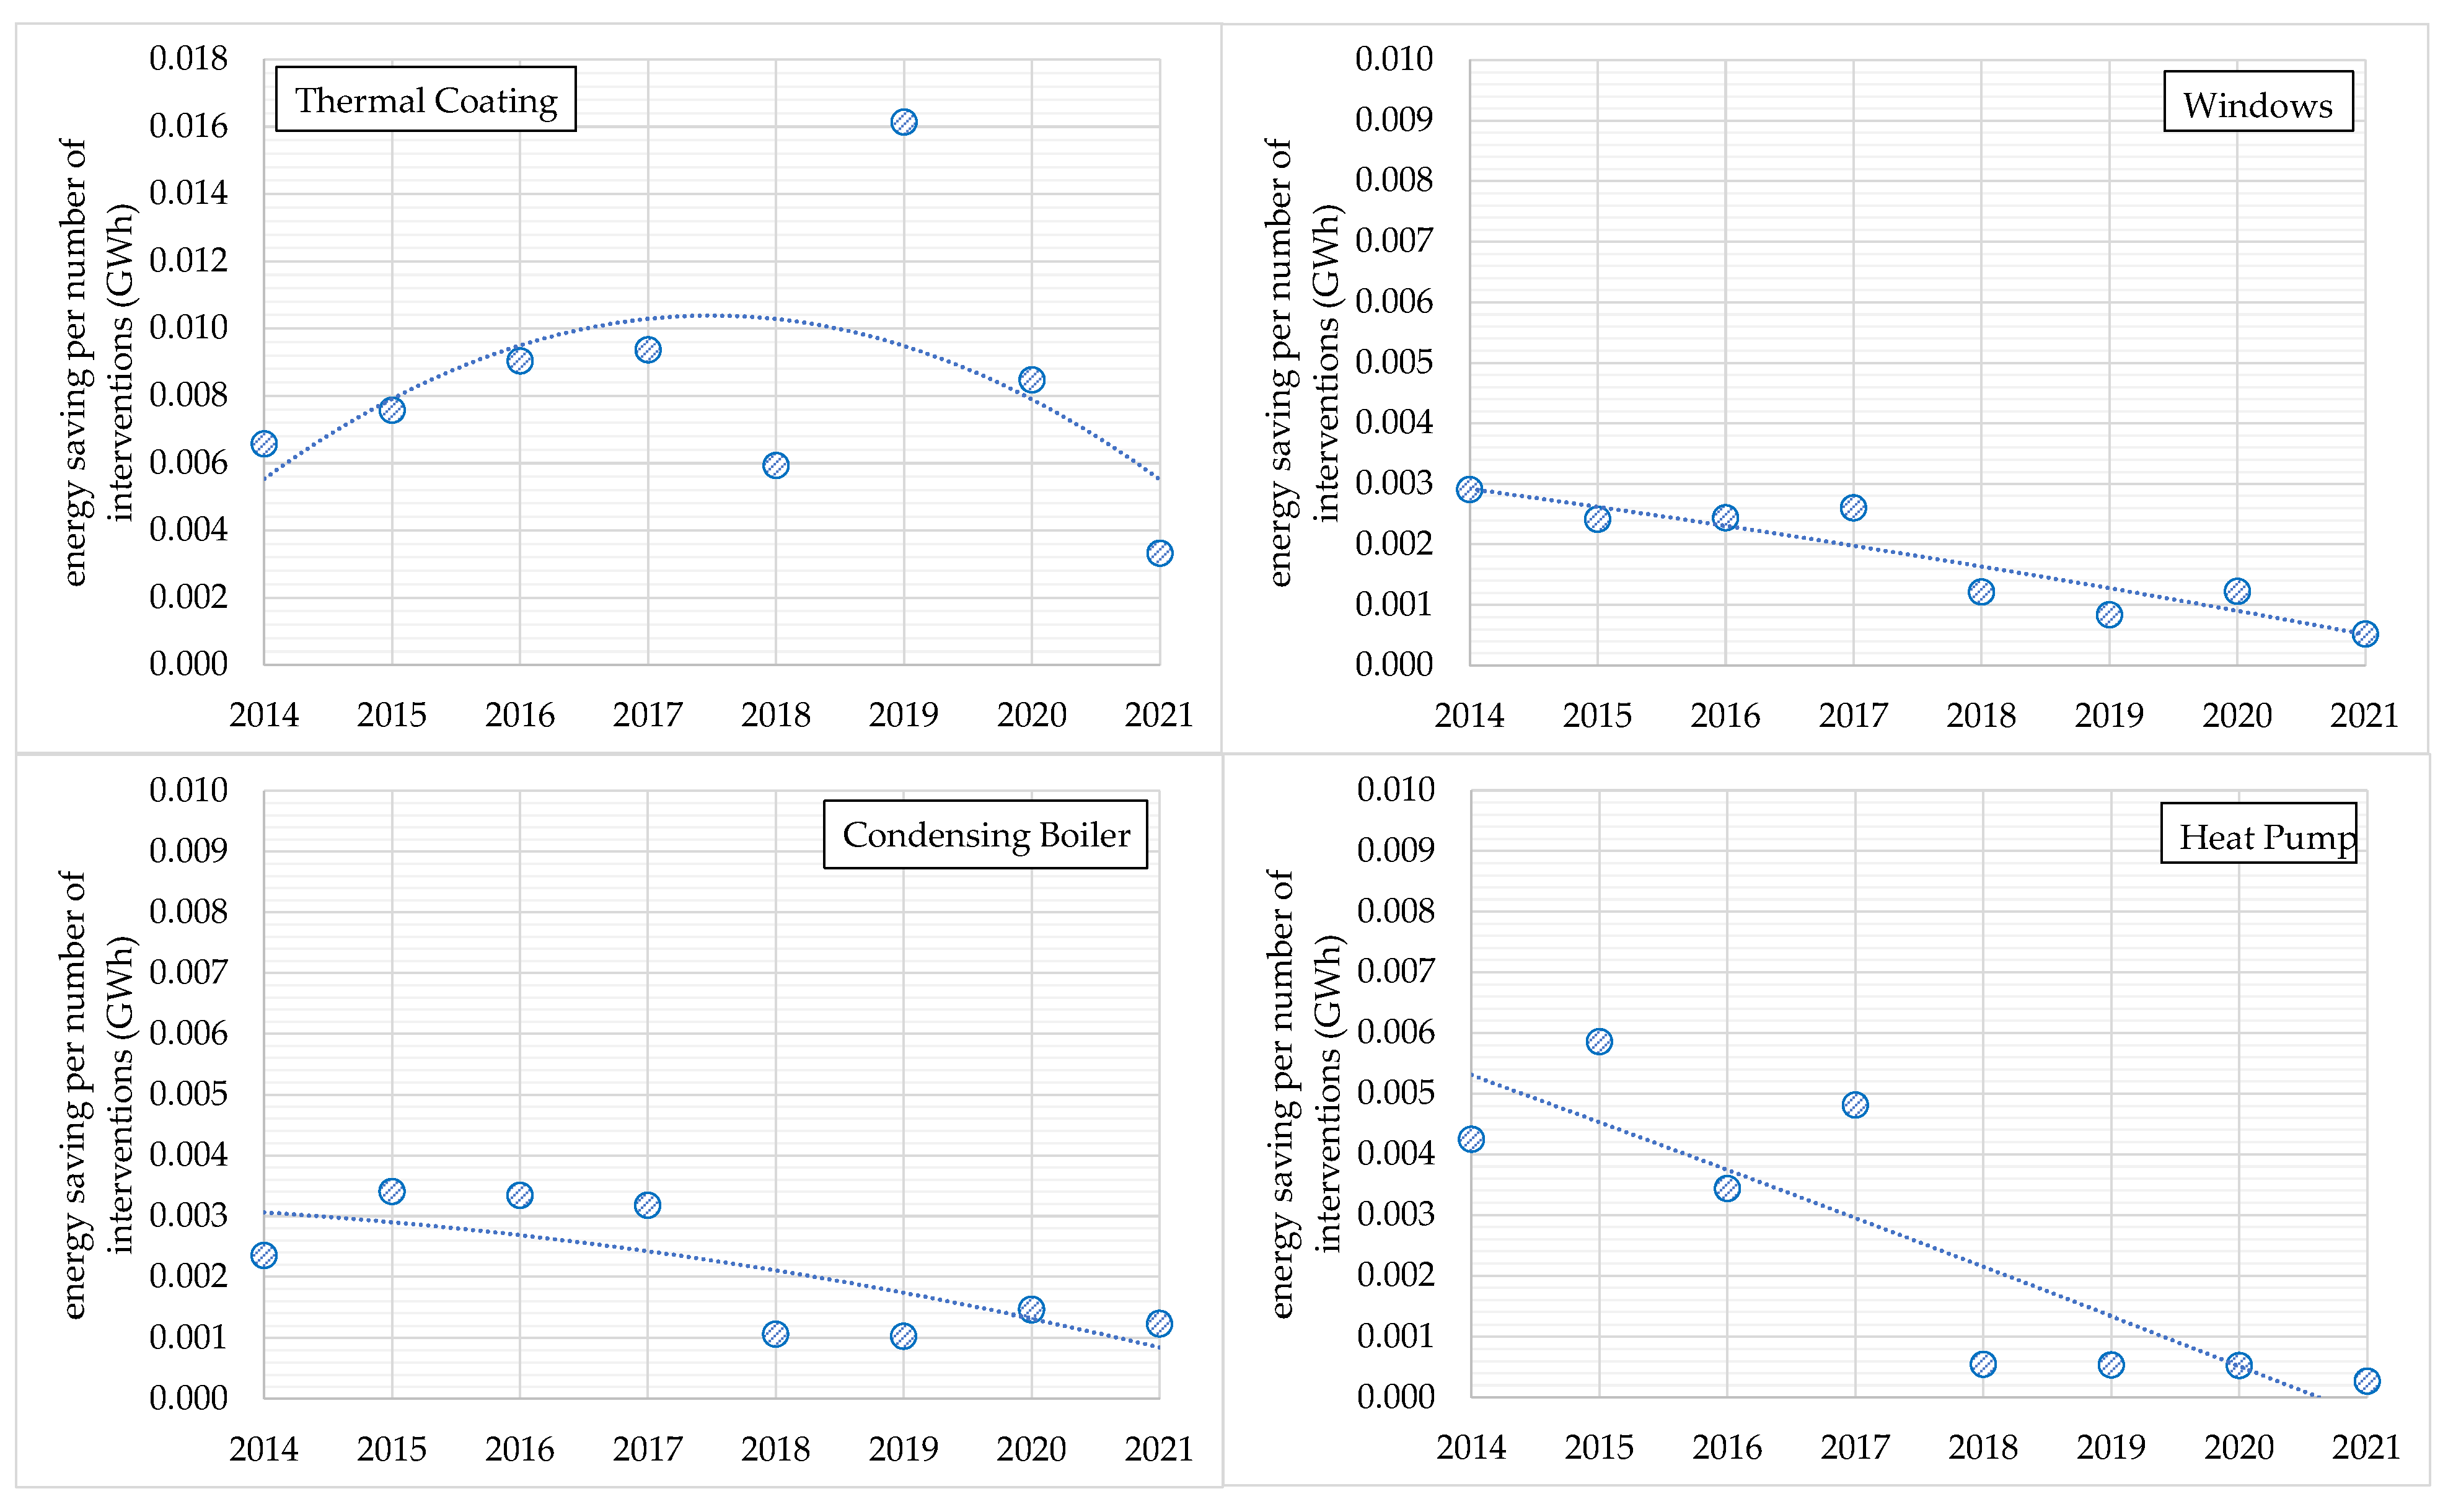
The trend in the last decade distinguishing the interventions due solely to the last implemented energy policy (i.e., Superbonus) and the other ones was thus studied (
Figure 5), highlighting an increasing trend in the number of interventions, although this was not matched by an increase in the energy savings per intervention (
Figure 6). The found trend pointed out that, more recently (from 2018), energy efficiency actions were also implemented in more performing buildings that would not need energy efficiency measures.
2.1.3. CO2 Emissions Baseline
Another key point of the work consists of the baseline evaluation of energy consumption and CO
2 emissions related to the heating of the building sector. However, national reports and data from the Italian Institute for Environmental Protection and Research [
40,
41] provided only aggregated values, indicating the range of percentages due to the heating service; particularly, around 6.9 million of CO
2 emissions in 2019, 9.3 million in 2010, and 12.1 million in 2005 were recorded in Umbria. Around 20% is attributed solely to the heating of residential buildings (i.e., more than 2.4 million in 2005). According to these reports, the baselines related to 2005, 2010, and 2021 were thus estimated and adopted as reference values:
2005: it is the baseline value to take into account to assess the CO2 target to be achieved by 2030 (estimated at about 1.62 million of CO2 emissions);
2010: it is the baseline value (about 1.87 million of CO2 emissions) used to check the reliability of the energy analysis as the reference buildings were based on data from the National Institute of Statistics updated in 2010–2011;
2021: it consists of the baseline starting value of the forecasting analysis. This last value was assessed, considering the recorded CO
2 emissions and correcting it for the energy savings achieved through energy policies each year, provided by national reports and reported in
Table 5.
According to this approach, considering data provided by national reports on energy savings and CO
2 emission reduction achieved by applying the different energy strategies [
34,
35,
36,
37,
38,
39,
40,
41], the residential building stock of Umbria could have consumed around 7800 GWh in 2021, corresponding to about 1.82 million of CO
2 emissions.
This means that the CO2 emissions of the Umbrian building stock should be reduced by 0.20 million to reach the target of 1.62 million by 2030 (assessed by reducing by 33% the value of 2005).
2.2. Calculation Method and Working Assumptions
2.2.1. Standard Calculation
The standard calculation method is detailed in the package of standards UNI 11300 [
42,
43,
44,
45,
46] and consists of monthly average energy balance considering monthly mean values both for outdoor conditions (such as air temperatures and solar radiation) and indoor ones. This method allows for assessing the primary energy need for heating (but also for the other energy services) on the basis of the thermal properties of the building envelope and energy efficiency of technical building systems.
Currently, this method is adopted to draw up energy performance certifications (EPCs) by using standard input data (such as by setting 20 °C within the residential environments), outdoor conditions (by setting conventional outdoor conditions provided by national regulations), and operating schedules of buildings (such as the heating period).
The energy need for heating is assessed through a monthly balance between the heat losses through the building envelope and the total heat gains (including solar and internal heat gains), corrected by a utilization factor. Although the lower accuracy in estimating actual energy consumption, previous works have highlighted the good reliability of the outcomes compared with other calculation methods, such as with the hourly scale [
12], or when a comparative analysis is performed [
22].
According to this premise, in the present work, the standard calculation method is adopted by using conventional parameters:
Outdoor conditions: conventional data of monthly air temperatures, solar irradiation on vertical surfaces with different orientation and horizontal surface (both the directive and diffuse components), and vapor pressures provided by national regulation [
47] were set;
Indoor air temperature: standard set-point value equal to 20 °C was set;
Heating period: conventional period was considered for the two climatic zones found in Umbria: from 1 November to 15 April (D zone) and from 15 October to 15 April (E zone).
2.2.2. Artificial Neural Network
The neural network used in the present work was trained in [
23] by exploiting parameters and results used for the energy parametric analysis. Specifically, based on a national report [
33], several building archetypes were defined that well represent the existing Italian building stock. These archetypes were used to carry out a parametric energy analysis in which many different parameters were varied, including:
Type and building geometry: both single-family and multifamily buildings were considered by varying their useful floor area between 40 and 160 sq m;
Thermal properties of building envelope components: more than 150 types of vertical opaque walls and more than 40 of horizontal ones (both lower and upper floors) and some types of glazed components were defined according to the findings of the nationwide study [
33]. The corresponding transmittance value was thus calculated for each component, obtaining values falling within the range of 0.13–3.50 W/m
2K for opaque components and between 1.3 and 3.0 W/m
2K for transparent components;
Technical building system: thanks to the integration of different databases and national reports, in [
33], the types and characteristics of the most common technical building systems were defined, associating with useful floor area, climatic zone, building insulation level of buildings, and energy services;
Climatic conditions: in order to carry out a representative energy analysis across the country, the most representative cities were selected as a function of the number of built buildings, population, and climatic conditions. Twenty-five locations ranging from 568 to 4264 heating degree days were chosen overall.
Based on this characterization, more than 10 million energy simulations were performed in [
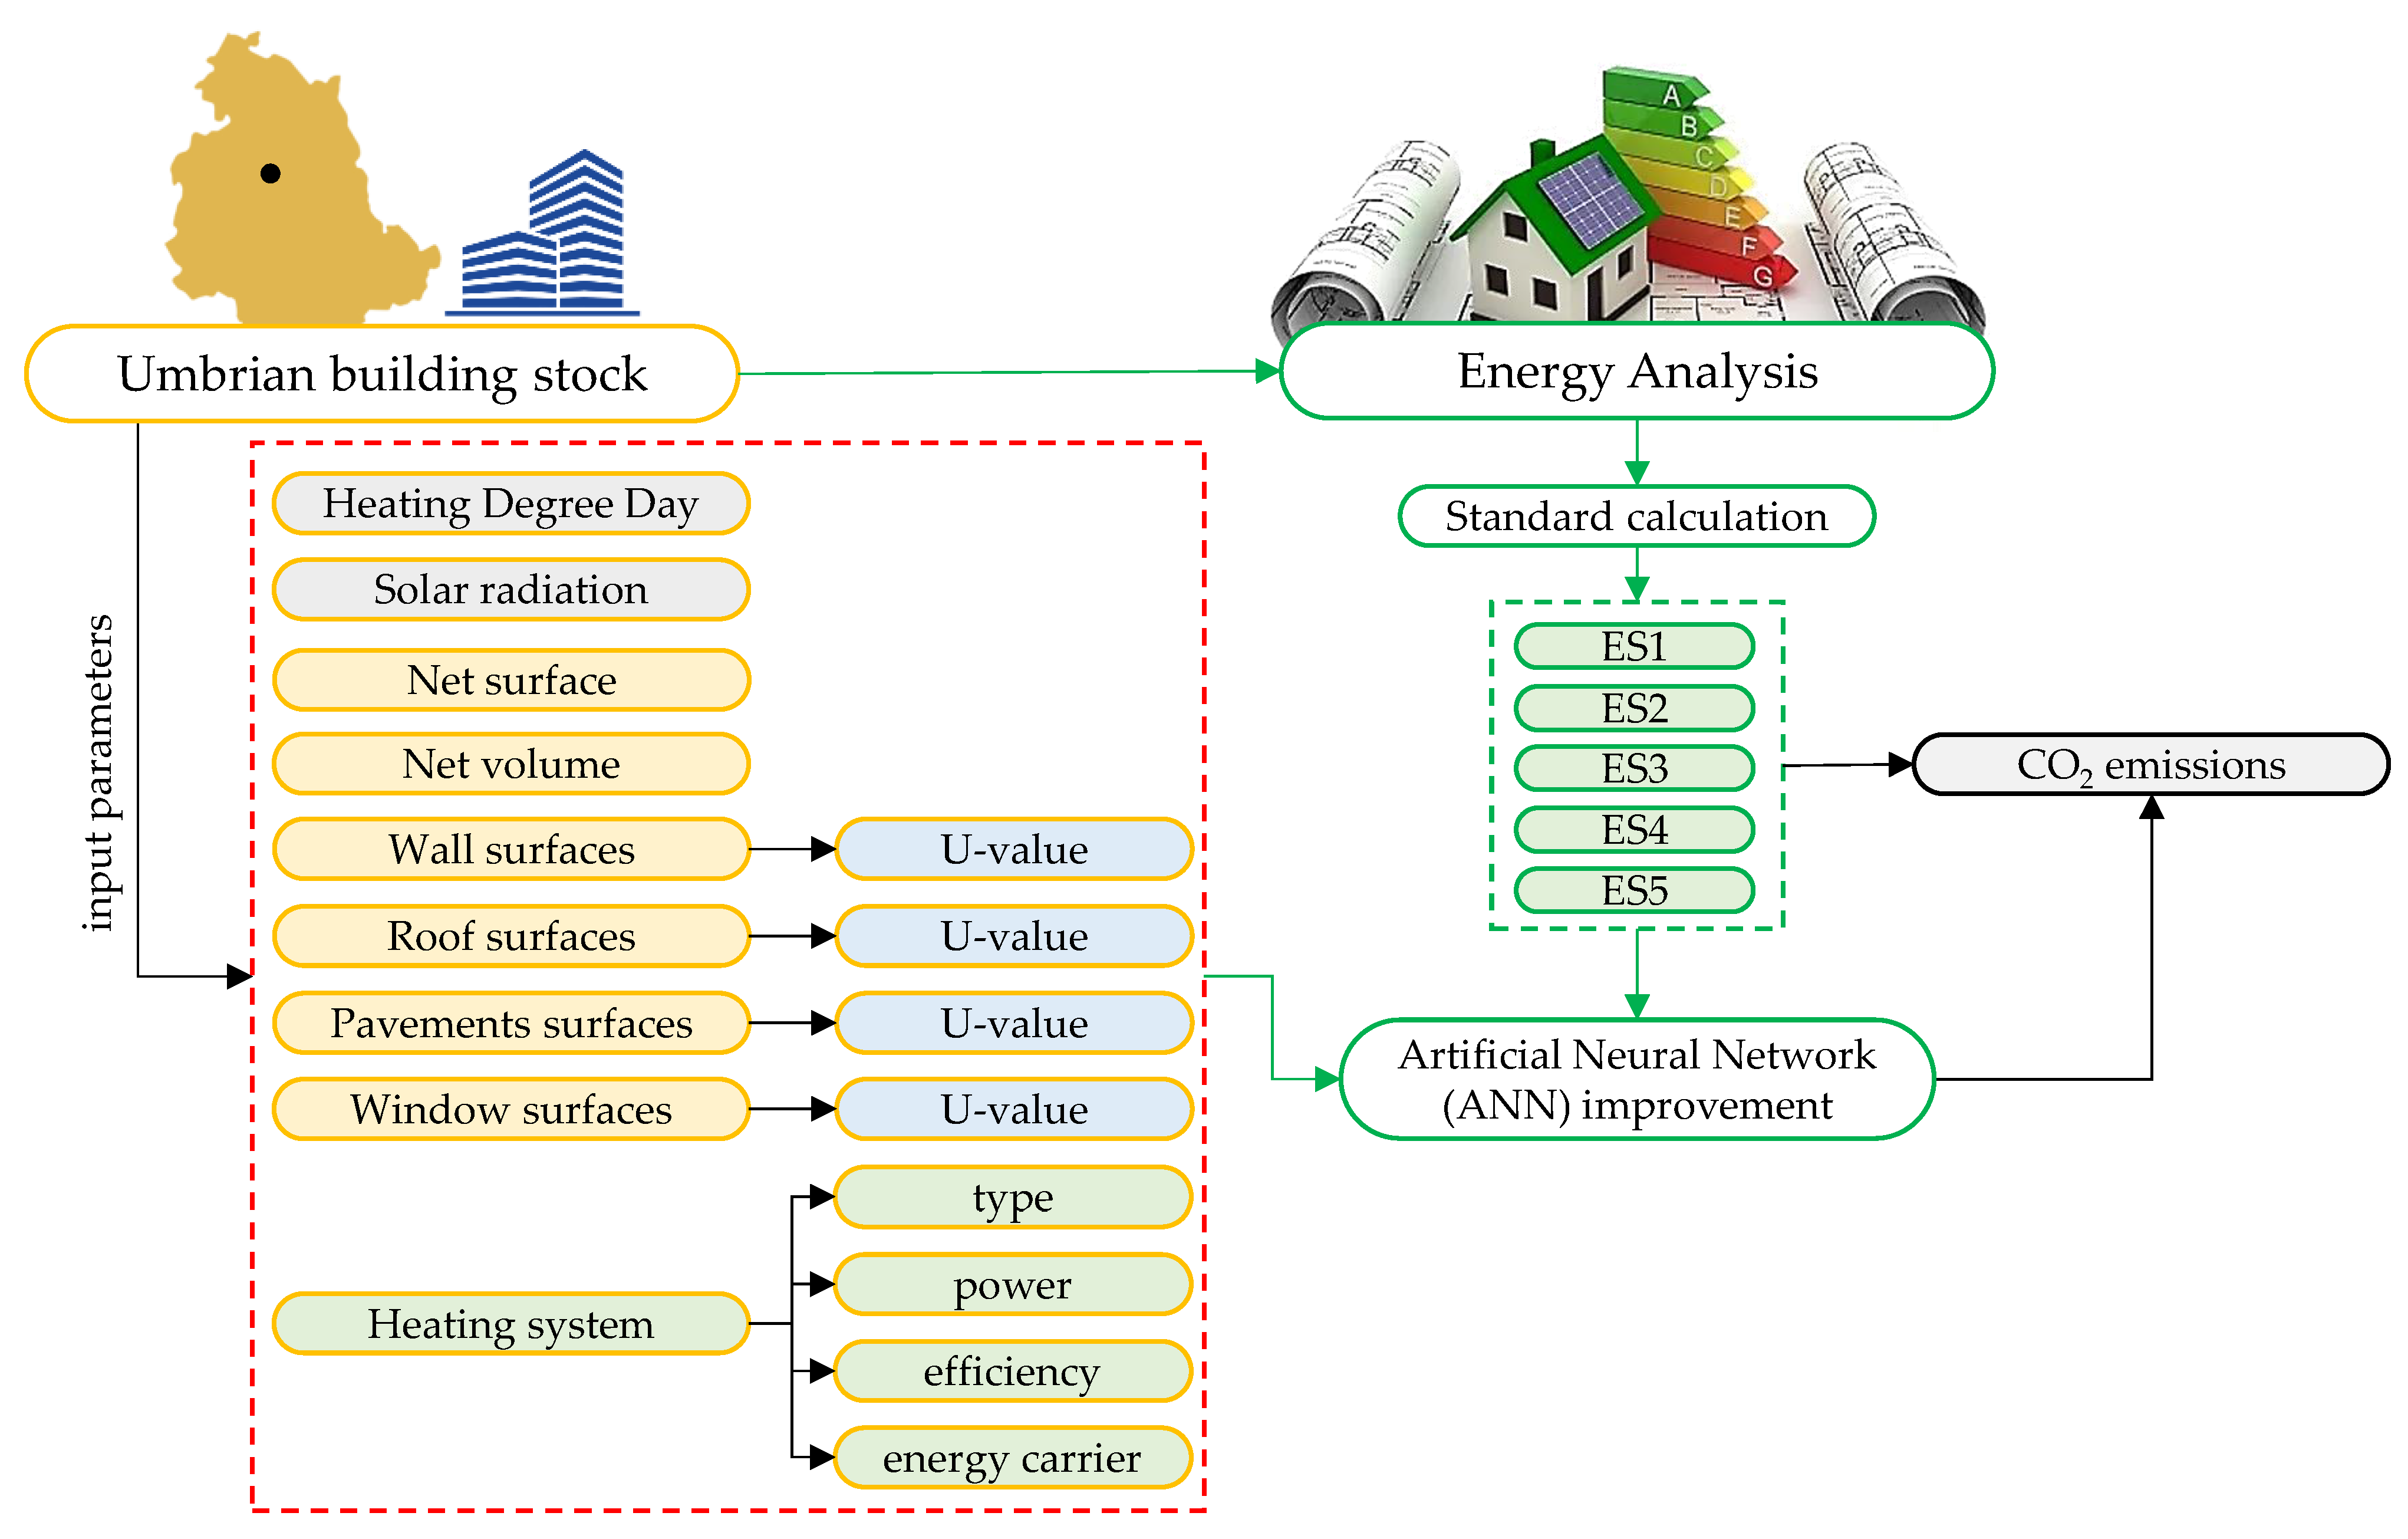
33] by adopting the standard calculation method, i.e., EPC, and some input parameters and outcomes were used for training a multilayer perceptron neural network with the back error propagation algorithm. In particular, the ANN, able to calculate the primary energy need of buildings (target), was trained with the following input parameters: global solar radiation, heating degree days, net surface, net volume, building envelope surfaces, thermal transmittance of building components (both opaque components and transparent surfaces), technical building system type, power, nominal efficiency, and energy carrier. A schematization of the methodological approach adopted for the ANN application and the input parameters to be supplied are reported in
Figure 7.
It is worth noting that ANN outcomes (i.e., energy needs for heating) were converted in CO
2 emissions, considering the conversion factors provided by the official gazette or Umbria Region [
48], depending on the energy carriers (
Table 6).
It is worth noting that the implemented ANN did not take into account some factors that affect urban development policymaking, such as technological development, economic level, and human cost. Since the investigated period analyzed in this work is quite narrow (2022–2030), the ANN can be considered a useful support tool to be used to improve energy efficiency strategies. Nevertheless, it is recommended to check its outcomes every year to make corrections ongoing.
2.2.3. Energy Consumption of Umbrian Building Stock
Since official data are missing, in accordance with a previous study [
22] where the reliability and accuracy of the standard calculation were highlighted when the comparative analysis was performed, energy simulations using the standard calculation method (EPC) of the archetypes of the Umbrian building stock were carried out, allowing the energy consumption estimation due to solely heating.
Based on the Umbrian building stock characterization, in terms of the number of building units and buildings, thermal properties of the building components, year of construction, and heating systems, the theoretical energy consumption for heating was assessed by means of the standard calculation method, i.e., adopting monthly energy balance, as described in the national regulations [
42,
43,
44,
45,
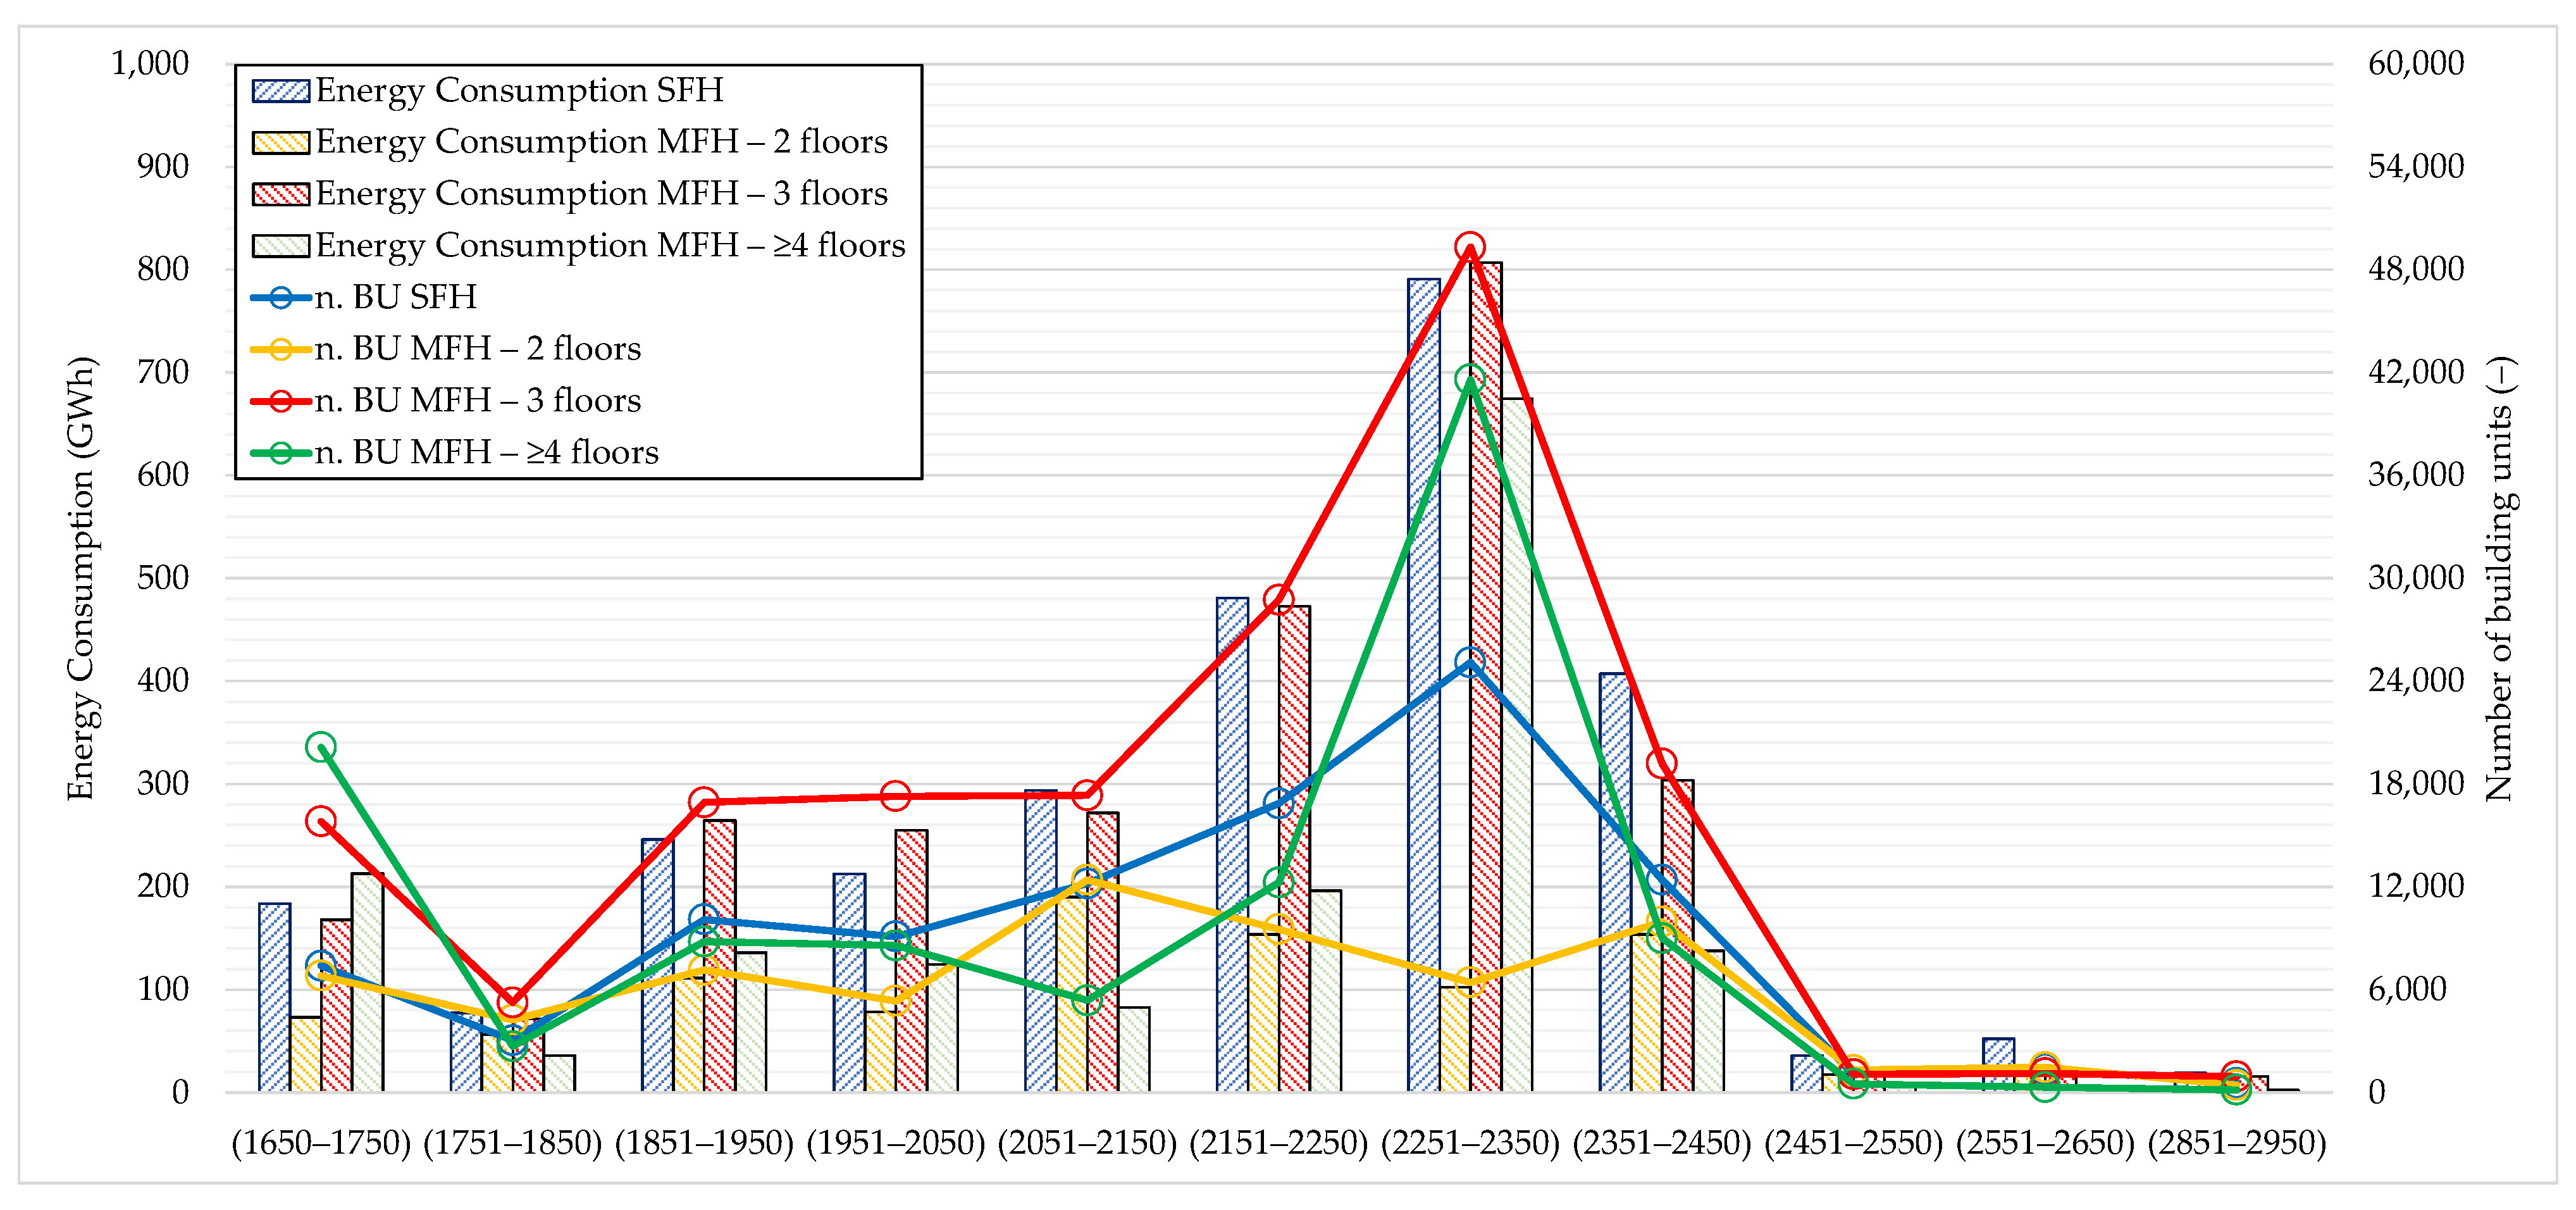
46], and by using standard climate and operational conditions. Energy consumption outcomes were reported in
Figure 8 for a fixed range of heating degree days (ordinate axis on the left), distinguishing the building type (SFH, MFH) and highlighting the number of building units for each range (ordinate axis on the right). This analysis pointed out that the theoretical energy consumption of the residential building stock (associated with 2010–2011 since data from ISTAT are related to this period) could have been around 8000 GWh, corresponding to around 1.87 million of CO
2 emissions (value assessed considering the energy carrier mix found in Umbria in 2010, described in previous
Section 2.1, and by taking into account the conversion factors provided by the official gazette of the Umbria Region reported in
Table 6).
Although slightly different from the value recorded in 2010 (about 0.21% in relative terms; see
Section 2.1.3), this value and the energy simulations were considered reliable and usable for the present comparative analysis.
Moreover, according to
Figure 8, the following assumption was also made: all the scenarios may have to take into account the redevelopment of 40% of SFH and 60% of MFH since SFH consumes around 35–40% of total energy consumption for heating.
2.2.4. Scenario Definition
Several scenarios were thus defined based on the findings of previous analyses (see
Section 2.1.2); specifically, the number of interventions for each energy strategy was thus estimated with an increasing or decreasing trend, as shown in
Figure 5 for the most widespread energy measures, and a mean energy saving for each energy strategy was calculated. The assessed number of interventions to be implemented in the next years and the mean energy savings for each one, reported in
Table 7, were considered for the forecasting analysis.
Finally, the widespread energy strategies that could bring more energy efficiency for the building sector were improved using the artificial neural network. Specifically, the most popular measures—such as the thermal coating on external walls, replacement of existing heating systems with condensing ones, and window replacement—were selected and improved as they provide significant energy savings.
Several possible scenarios were thus defined which differ in limits set for the application of the ANN:
Scenario 1: it consists of the baseline scenario without improving the energy strategies with the ANN. It was performed by renovating 40% of SFH and 60% of MFH on the basis of the estimated energy consumption of existing buildings (see
Section 2.1.3);
Scenario 2: all the energy measures were implemented as in scenario 1, but the thermal coating action was improved with the ANN; i.e., it was implemented on the buildings chosen by the ANN based on their energy consumption;
Scenario 3: all the energy measures were implemented as in scenario 1, but both the thermal coating and window actions were improved with the ANN (not necessarily implemented in the same buildings);
Scenario 4: all the energy measures (thermal coating, windows, and condensing boiler replacement) were improved with the ANN but not necessarily implemented in the same buildings;
Scenario 5: all the energy measures were improved with the ANN and implemented in the same buildings (as long as possible); i.e., one existing building is renovated with all of them (thermal coating, windows, and condensing boiler replacement);
Scenario 6: all the buildings to be renovated were chosen by the ANN without limits.
Furthermore, all the defined scenarios were investigated in three different national energy policies hypothesized in this work:
Policy 1: it was assumed that the Superbonus incentive may conclude at the end of 2023;
Policy 2: it was assumed that the Superbonus incentive may conclude at the end of 2024;
Policy 3: it was assumed that the Superbonus incentive may conclude at the end of 2025.
3. Results and Discussion
3.1. CO2 Reduction as a Result of Energy Measures
As stated, the forecasting analysis started in 2022 since official data are provided until 2021. Due to the unavailability of the number of interventions implemented in 2022, the same one found in 2021 was assumed.
The energy consumption of the whole residential Umbrian building stock was thus assessed as well as the energy savings due to the implementation of the energy efficiency actions, and the CO
2 reduction concerning the 2005 value was assessed. The first comparison, reported in
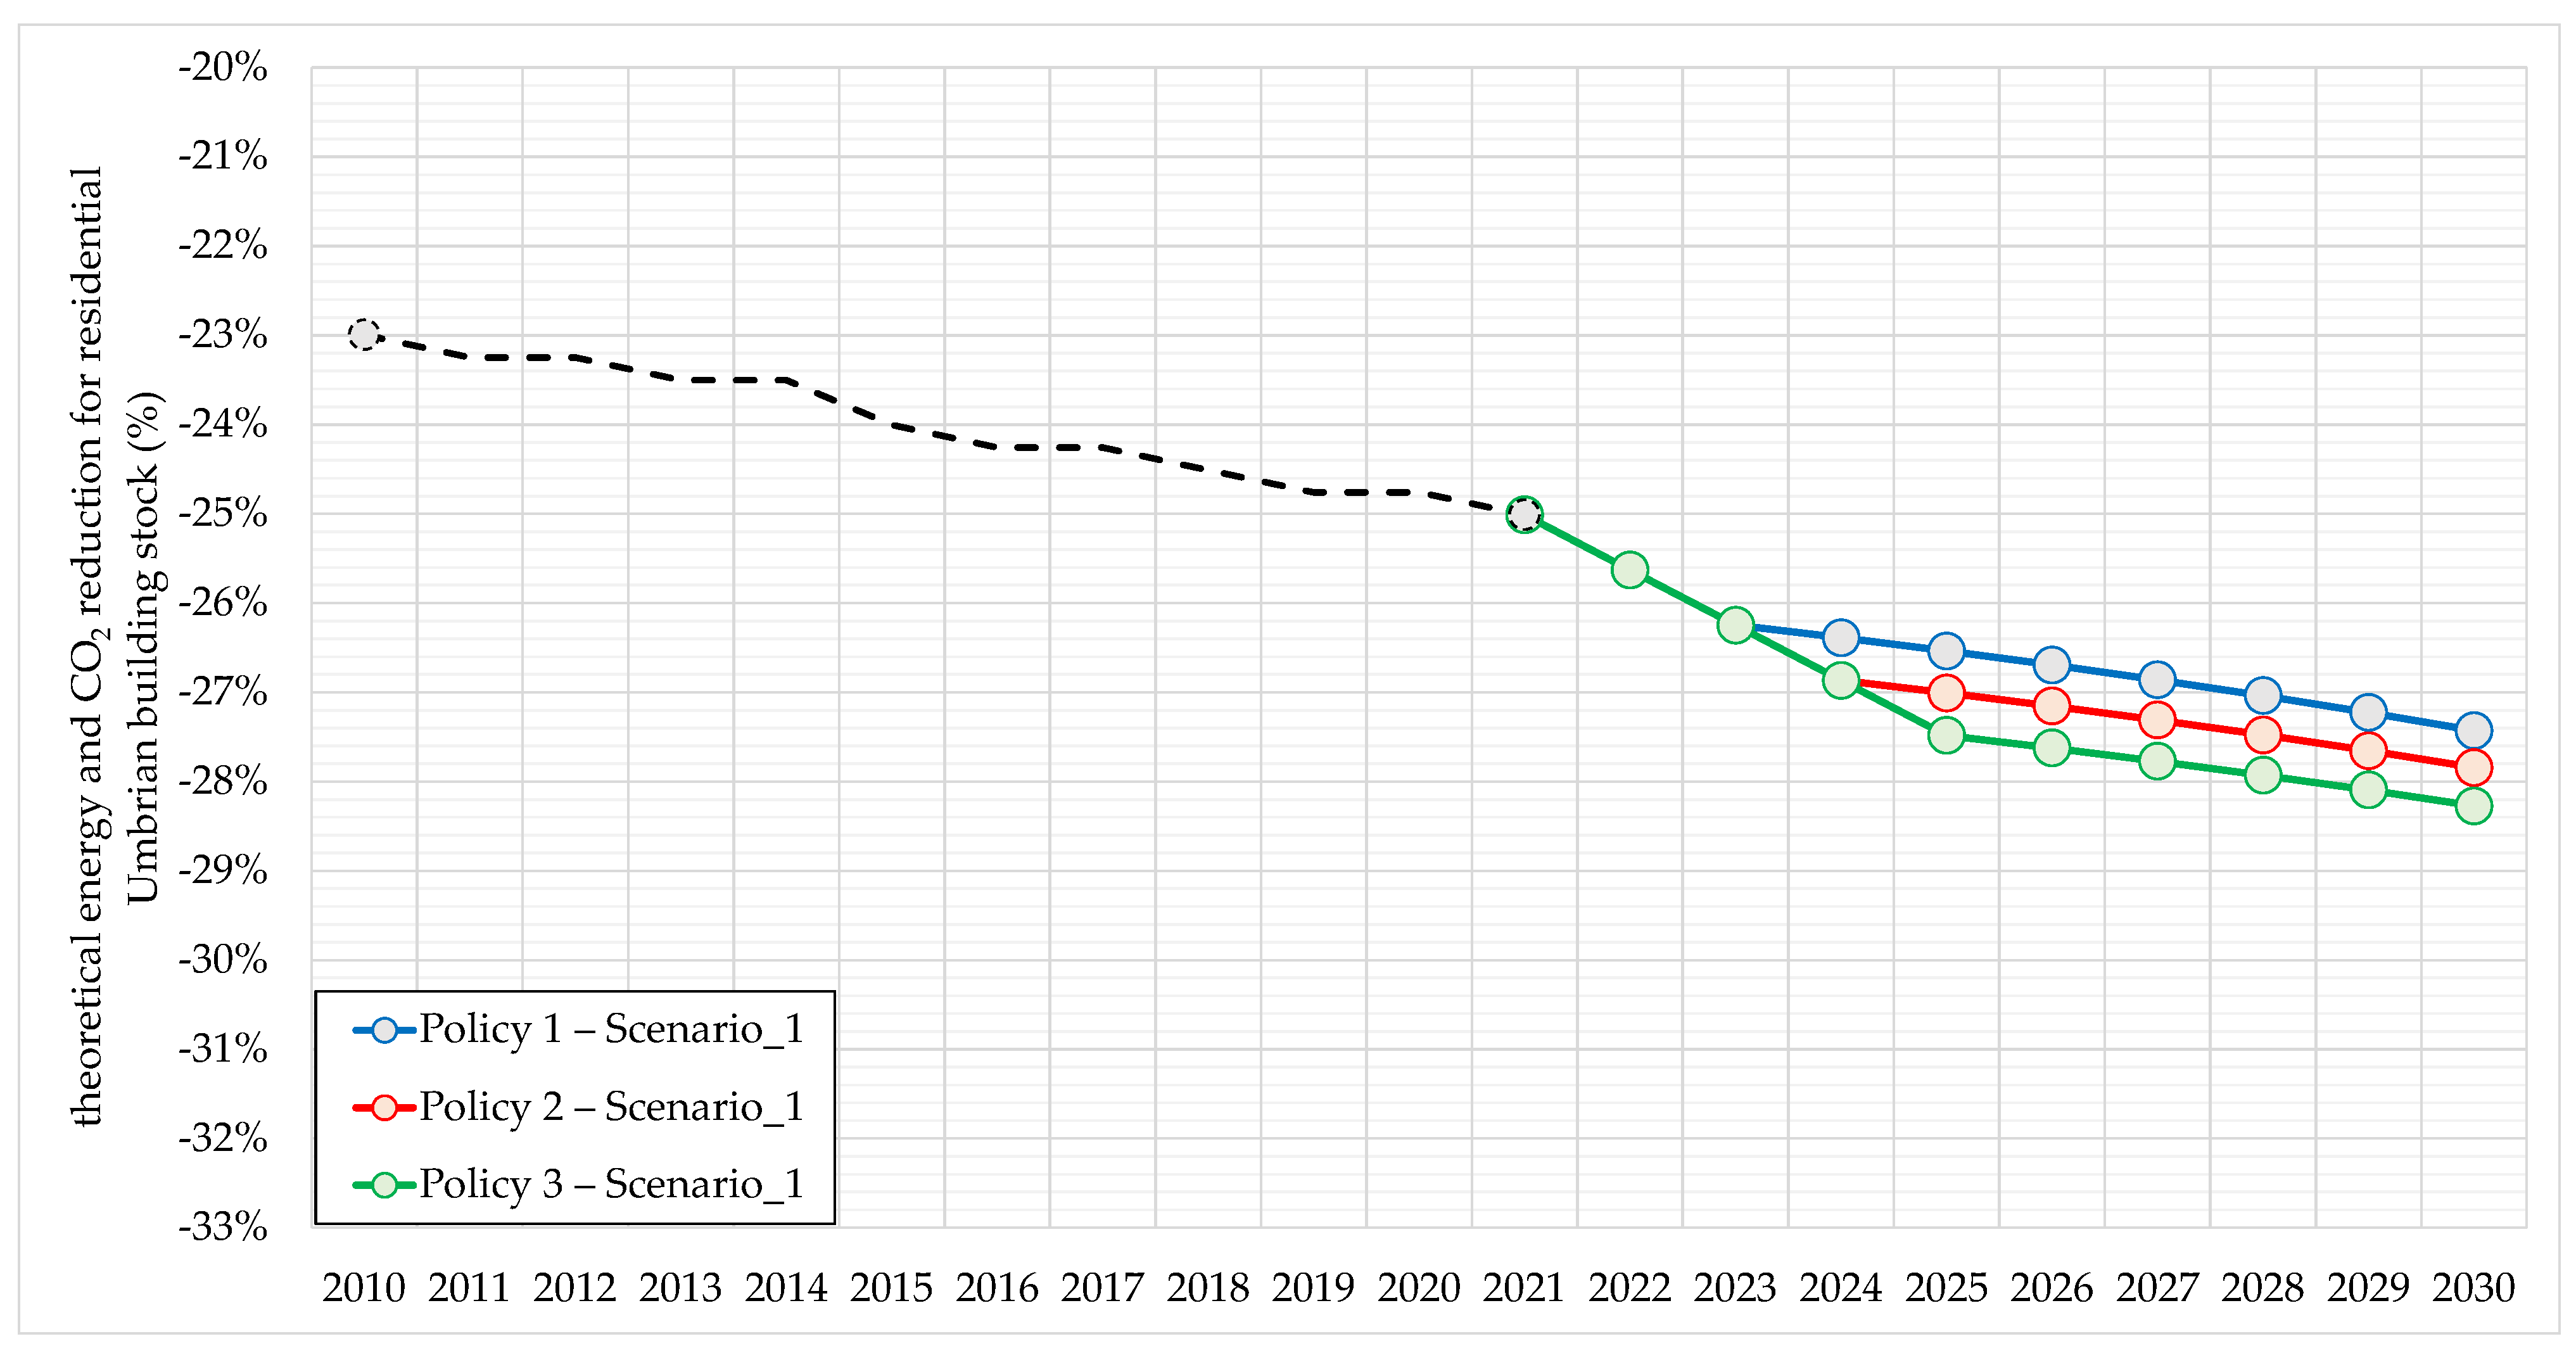
Figure 9, is concerned with only energy strategies in the three adopted energy policies without considering ANN improvement. It is worth noting that these outcomes could represent the more probable trends for the Umbrian building stock.
A first relevant finding can be pointed out: an important CO2 reduction compared with the 2005 value seems to be achieved in Umbria. The estimated reduction in 2021 could be around −25% compared with −23% recorded in 2010. The current energy policy of Superbonus 110 implemented to further reduce the CO2 emissions of the building stock could allow getting close to the 2030 target (reduction of 27.4 ÷ 28.3%) but not achieving it. Furthermore, it is worth noting that the extension of the current energy policy (Superbonus) could allow significantly increasing CO2 reductions, although the goal (reduction of 33% for the residential sector) could not be reached by intervening only in the heating of buildings even by extending this fiscal deduction until 2030. In fact, it was found that each year of the incentive extension results in an average annual reduction of 0.6%.
The found trend makes it possible to underline that the application of specific energy incentives without setting any kind of limit (for instance, on the energy consumption or the year of construction of the existing buildings) may not allow achieving the ambitious target fixed for the residential sector by 2030 by intervening only in the heating service. Other energy efficiency solutions could be implemented in addition to the ones adopted in this work, such as the replacement of the existing boiler with a heat pump or the installation of photovoltaic panels, but they could not be always feasible, as shown in a recent work [
49]. In addition, it is worth noting that this type of intervention is poorly suited to the Umbrian building stock needs, limiting its effectiveness. Nevertheless, the found trends confirmed the need for other energy incentive systems or optimization of the existing ones by introducing focused limits.
3.2. CO2 Reduction as a Result of Energy Measures Improved with the ANN
The energy consumption of the whole residential Umbrian building stock was thus assessed, and the energy savings due to the implementation of the energy efficiency actions improved by using the ANN, and the CO
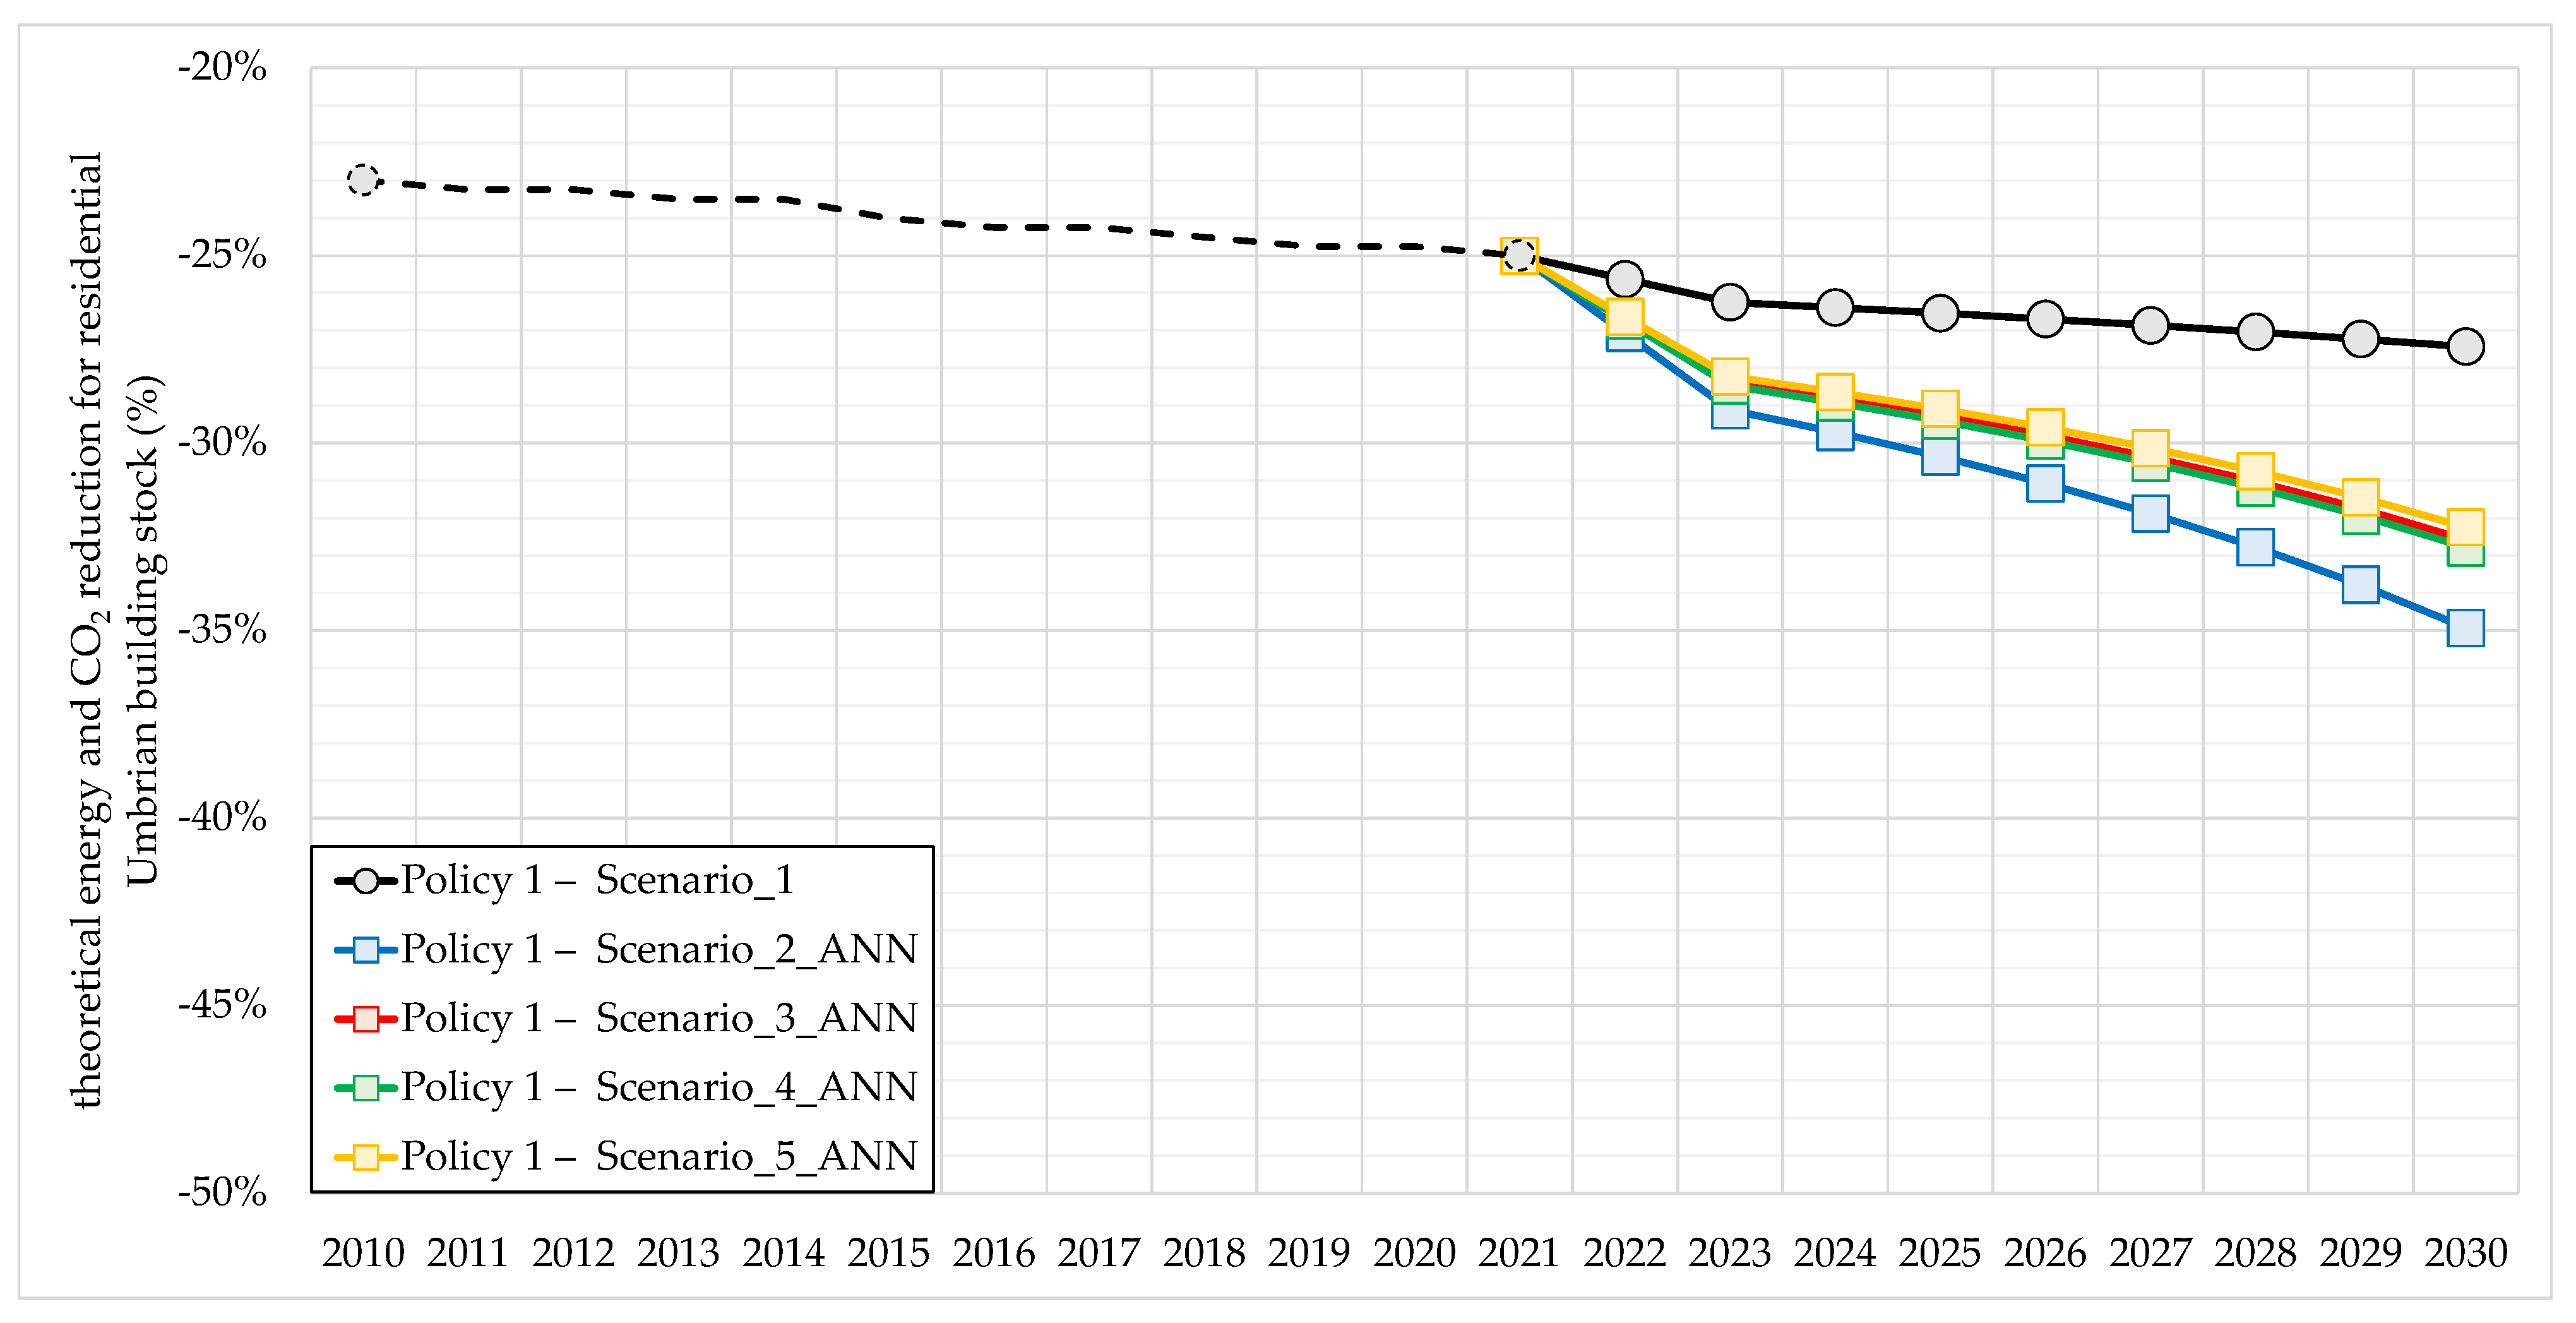
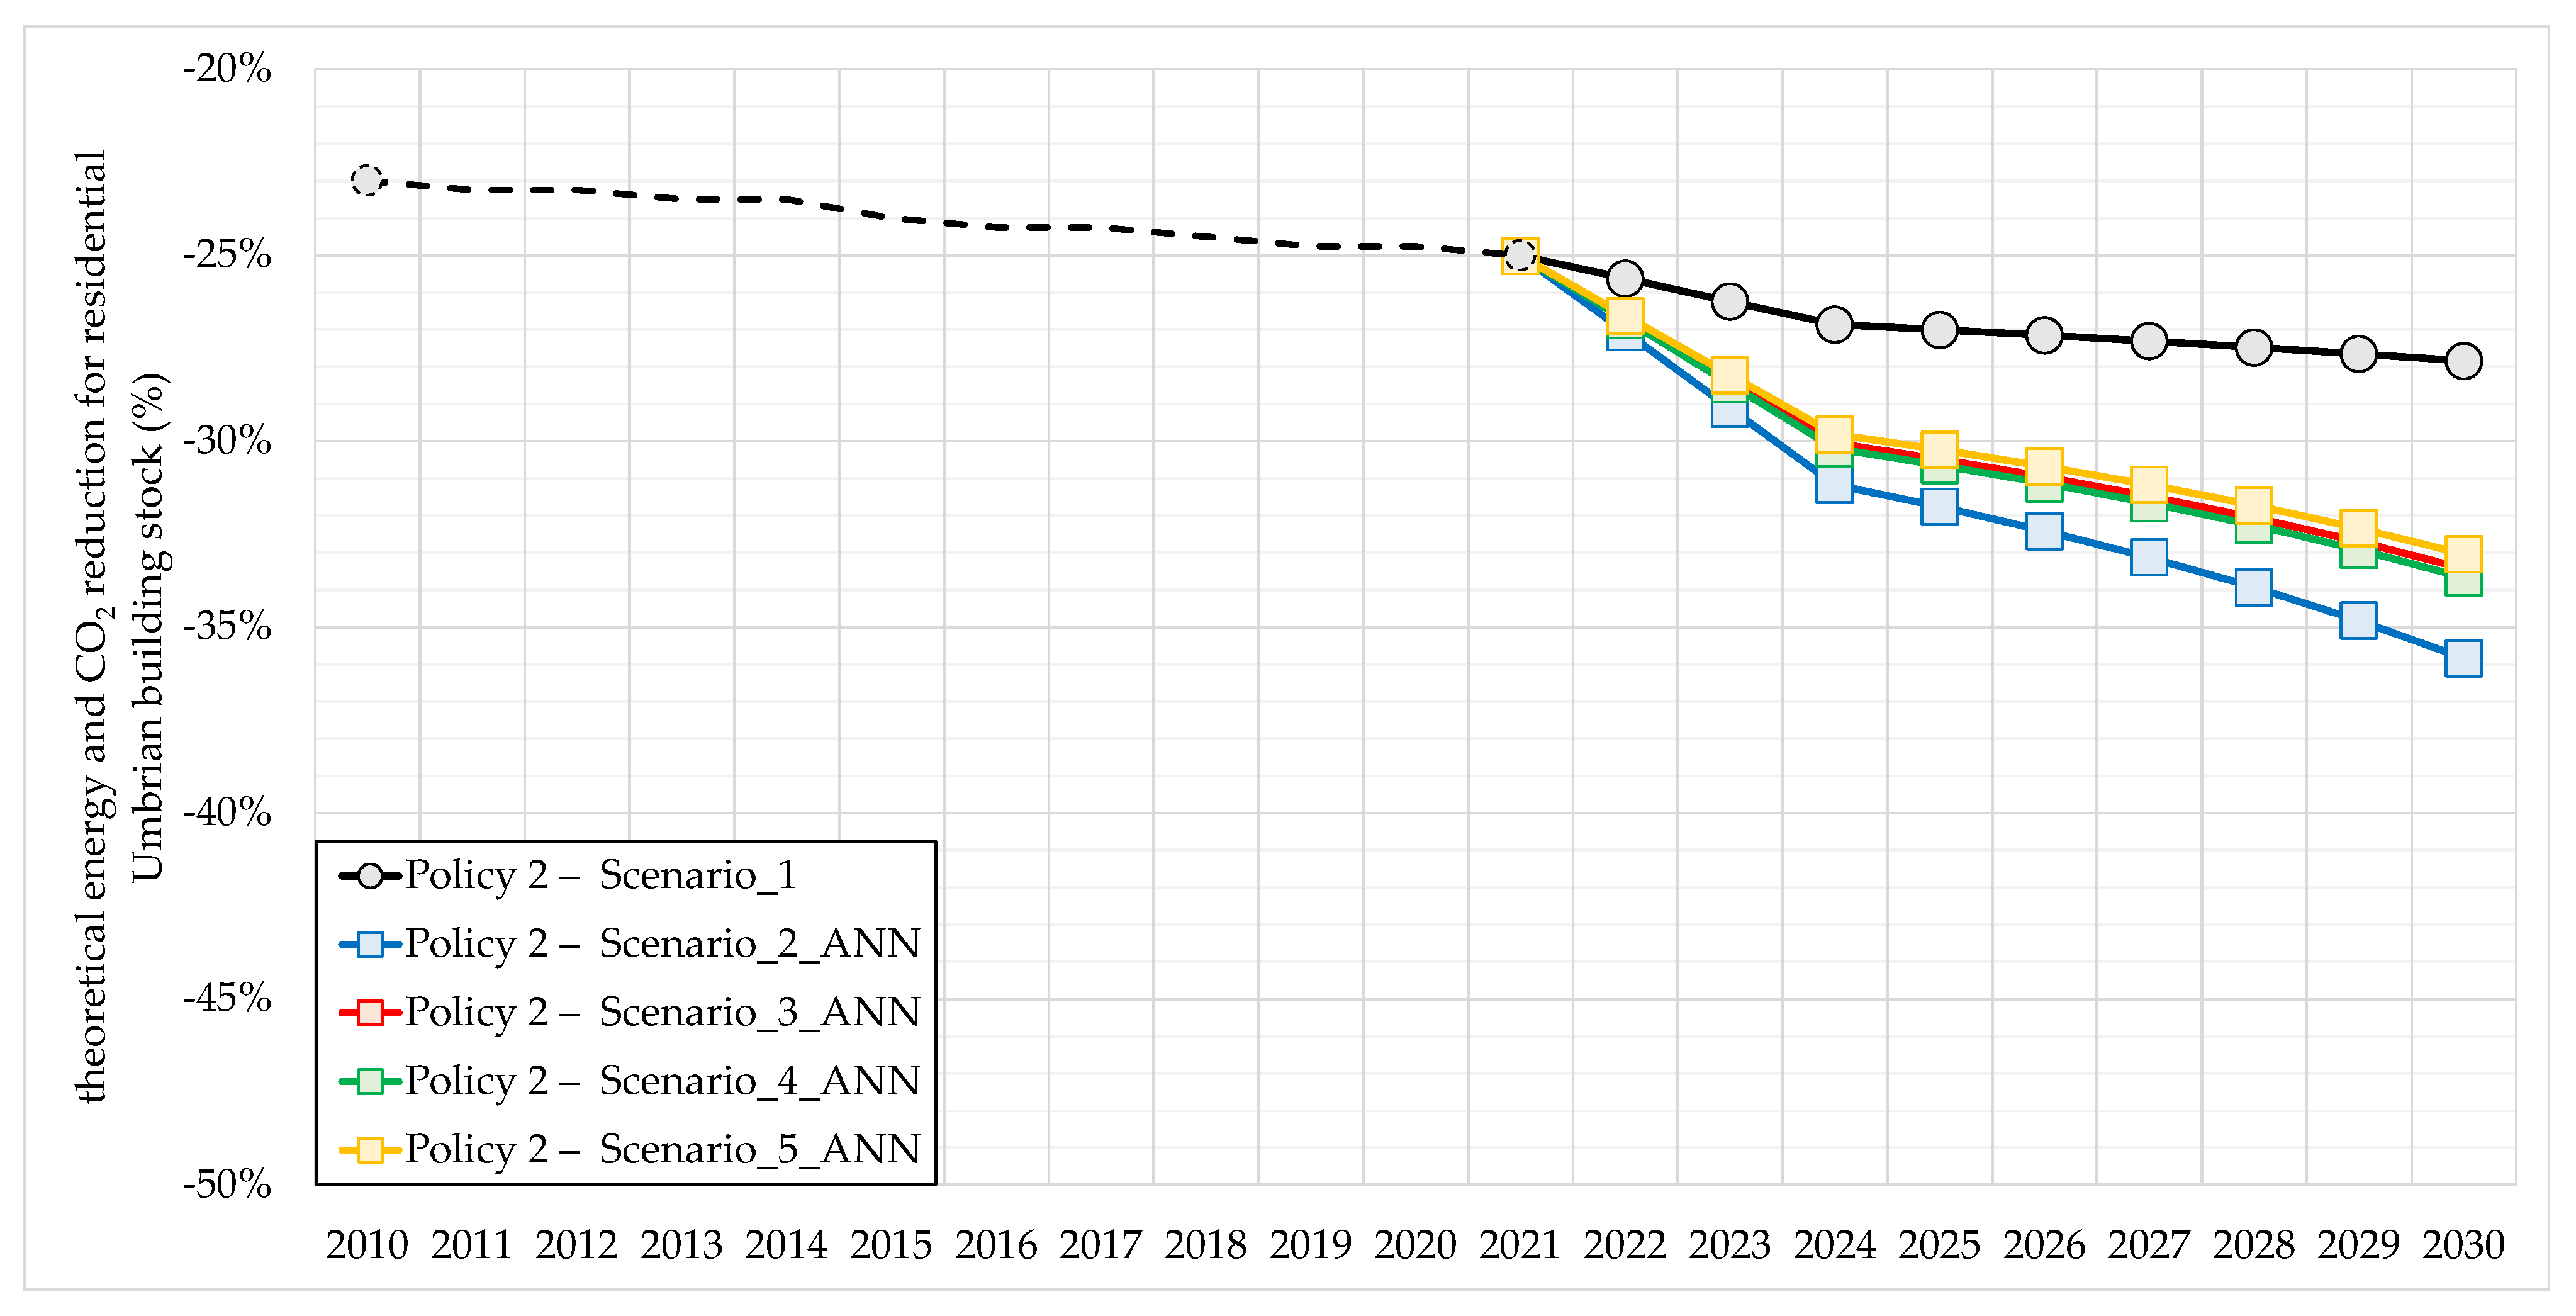
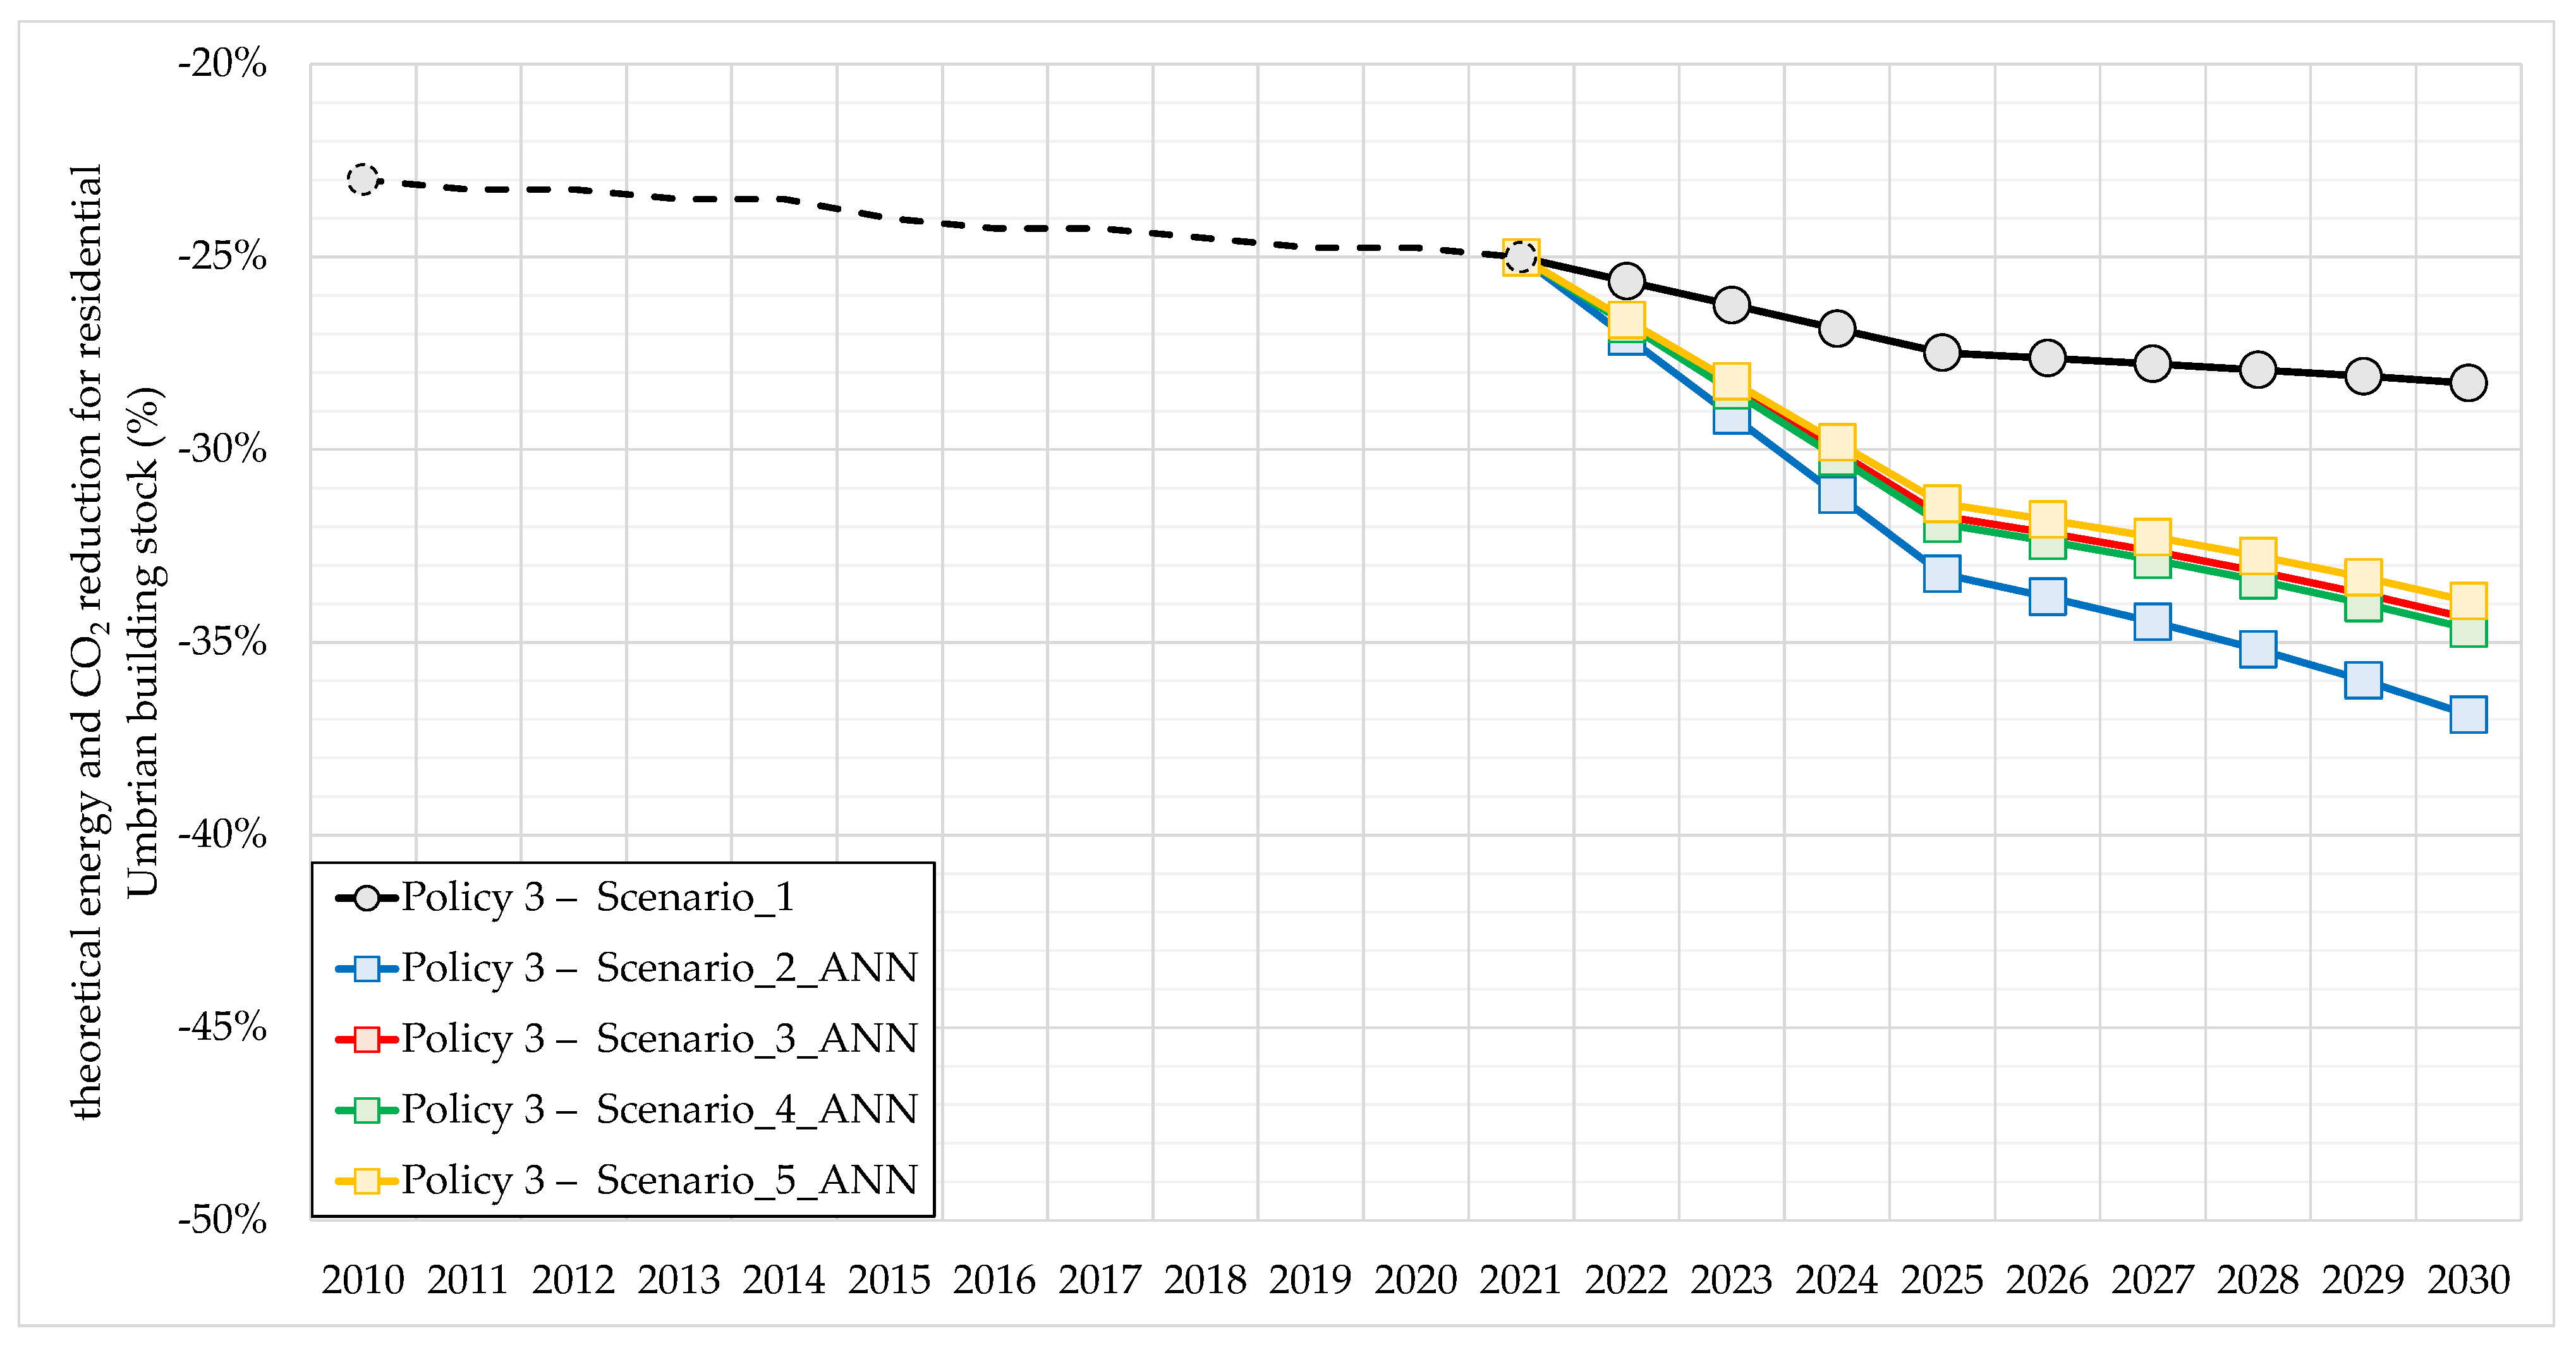
2 reduction concerning the 2005 value was assessed. Results are shown in
Figure 10,
Figure 11 and
Figure 12, distinguishing for each considered energy policy and for the adopted energy actions improved with the ANN (from scenario 2 to scenario 5).
Interesting insights can arise from these figures; as already stated in the previous work, the use of the implemented ANN could allow further increasing the energy savings for each selected energy strategy (thermal coating, windows, and replacement of heating system with condensing boiler) of a variable percentage, depending on the type of intervention. From scenario 2 (thermal coating) to scenario 5 (concerning all the energy measures), i.e., the ones where limits on the ANN application have been set, the ANN was capable of increasing energy efficiency by 10%–18%, depending on the energy scenarios. More in detail, the thermal coating on external walls (scenario 2, blue lines in the figures) is the measure on which the ANN can have the greatest impact, allowing for achieving the goal as early as 2029 (policy 1—
Figure 10), 2027 (policy 2—
Figure 11), or 2025 (policy 3—
Figure 12).
In the national energy policy 1, i.e., the one where it was assumed that the Superbonus ends in 2023, the ANN would not allow reaching the CO
2 targets by 2030 in all the other scenarios (from 3 to 5) due to their lower influence on energy savings, although scenario 4 would come remarkably close (−32.8%). On the other hand, in the other two national energy policies, i.e., the ones where it was assumed that the Superbonus ends in 2024 or 2025, the ANN might be capable of achieving the CO
2 target also with the other energy scenarios but only by 2030 (policy 2—
Figure 11) or 2028–2029 (policy 3—
Figure 12).
In addition, another interesting and well-known outcome can also be remarked: scenario 5, i.e., the one that includes all the energy efficiency actions in the same buildings, involves smaller energy savings. This trend is due to the energy balance of buildings. Energy measures can be divided into two main categories: interfering and noninterfering interventions. In other words, each interfering energy action can affect the energy savings of other energy measures, leading to a reduction of the same. This is what happens in scenario 5, where the implementation of all the energy actions in the same building leads to an energy improvement of the same, but lower energy savings in the Umbrian context.
This trend is remarkable in all the considered national policies, pointing out, probably, from the point of view of a common target, the lower energy convenience in the implementation of different interfering actions in the same buildings. In addition, it is worth noting that the ANN is more able to improve energy savings if the actions are not interfering with each other or if they are implemented in different buildings. This finding could also indicate the need for a further improvement of the ANN to optimize the interfering interventions.
Furthermore, as also highlighted in a previous study, the ANN allows obtaining greater energy savings for the scenario related to the replacement of the existing boiler (around 115–154 GWh in 8 years, depending on the considered energy policy) than the window one (around 110–117 GWh in 8 years, depending on the considered energy policy) due to the worse efficiency of existing heating systems.
Regardless of the energy policy, the use of the ANN could allow reaching the goal of CO2 emissions before 2030, highlighting a further convenience in the use of the ANN as a support tool for medium-to-long-term forecasting analysis of energy efficiency strategies in the Umbria Region.
Finally, the last energy scenario (scenario 6) was analyzed; in this case, no limits were set to the ANN, allowing for the optimization of choosing buildings; i.e., the buildings to be renovated were indicated by the ANN on the basis of the estimated energy consumption from the ANN itself. The comparison of this last scenario is shown in
Figure 13 in all the adopted national policies concerning the outcomes returned by applying the same energy strategies without ANN improvement.
As already stated, scenario 1 would not be able to achieve the regional target; on the other hand, the ANN could allow already reaching it by 2025 if the current energy incentive ended in 2024.
Compared with the previous scenarios (from 2 to 5), scenario 6 would allow for further reducing the emissions of the building stock of around 0.7% on average (corresponding to more than 200,000 t
CO2), resulting in the best energy scenario to be implemented. However, the accuracy and the convenience of this last scenario is significantly affected by the energy policy; particularly, in the case of energy policy 1, little difference can be found between scenarios 1 and 6 (
Table 8), indicating that the trained network is not able to optimize the energy measures in such a short time. Conversely, if the fiscal deduction is maintained for a long time (such as in energy policy 3), the ANN could be able to decrease the CO
2 emissions by about 1.5% point more.
According to these results, the achievement of the regional target in CO2 reduction by 2030 in the residential sector seems that it could not be reached by intervening only in the heating service with the current energy policy. Nevertheless, as it is the most energy-intensive service for the residential sector, it is essential to implement energy measures to reduce the energy needs for heating the building stock. However, without the use of more focused energy strategies, it seems that a further reduction of 5% could be achieved compared with the values recorded in 2010 (recorded in −23%). On the other hand, the integration of the current energy strategies with the trained artificial neural network could allow achieving the ambitious target as early as 2025 (without setting limits to the ANN and if the current energy policies were extended until 2025) or 2029 (setting focused limits to the ANN and if the current energy policies were not extended beyond 2023). Furthermore, the integration of the ANN into the implementation of national or regional energy policies or energy strategies would seem to improve the achievable outcomes.
Anyway, it is worth noting that the present study was performed on standard analysis and taking into account only the heating, being the most energy-intensive service. These assumptions can also represent the limitations of the work, opening up for interesting future developments, such as analysis where all the energy services are taken into account or more accurate calculation methodologies can be used.
4. Conclusions
The building sector covers a key role in addressing climate and environmental challenges since it is one of the major energy consumers in Europe. To achieve the new ambitious European goal, i.e., a greenhouse gas emission reduction of 55% at least by 2030 and climate neutrality by 2050, it is essential the focused energy measures implementation aimed at reducing the consumption of buildings.
In this framework arises the present work focusing on evaluating the effects of the current energy policies on the residential building sector in the regional context to highlight issues and potentialities and check the feasibility of achieving the ambitious targets fixed by 2030.
The study was performed by characterizing the residential building stock of the Umbria Region, chosen as a case study, and carrying out parametric energy simulations to assess the current energy consumption and CO2 emissions for heating, as it is the most energy-intensive service, according to the standard calculation method, i.e., the one adopted in energy savings assessment in the national fiscal deduction application.
The results suggested that (i) the current energy strategies, such as Superbonus 110, may not be enough to achieve the 2030 target of reducing CO2 emissions in the Umbrian residential buildings, allowing for reaching (ii) the maximum of around −28% on the basis of the extension of the current energy strategies.
Furthermore, the implementation of more energy strategies on the same buildings allows for increasing the energy savings of the same (as already known), but it may not be convenient from the point of view of a common target, as interfering actions in the same buildings entail lower energy savings overall.
Nevertheless, the integration of the energy strategies with the artificial neural network (ANN), trained in a previous work for the Umbria Region, could allow for greater energy savings in all the investigated scenarios. In this case, the ambitious target could be achieved in as early as 2025 (without setting limits to the ANN and if the current energy policies were extended until 2025) or 2029 (setting focused limits to the ANN and if the current energy policies were not extended beyond 2023). Hence, the use of the ANN in the national energy strategies’ implementation would seem to improve the achievable outcomes, confirming its essential support for the optimization of medium-to-long-term energy efficiency strategies in the Umbria Region. This result could open up a new interesting application for the ANN; in fact, it could be used by policymakers to maximize CO2 reductions while optimizing economic resources. In addition, the use of the ANN for specific energy strategies, such as the thermal coating of external walls, would allow policymakers to define more accurate restrictions for energy incentive systems.
Furthermore, the present study has also highlighted limitations of ANN application, such as the lack of ability to optimize interfering interventions or maximize energy savings and CO2 reductions when actions are applied in a too short time. The ANN seems to be more able to improve energy savings if the actions are not interfering with each other and when the fiscal deduction is extended for a long time.
