Article

Analysis of Building Retrofit, Ventilation, and Filtration Measures for Indoor Air Quality in a Real School Context: A Case Study in Korea

1
School of Architecture, Seoul National University of Science and Technology, Seoul 01811, Republic of Korea
2
Public Works Department City of Austin, Austin, TX 78704, USA
*
Author to whom correspondence should be addressed.
Buildings 2023, 13(4), 1033; https://doi.org/10.3390/buildings13041033
Submission received: 2 March 2023 / Revised: 3 April 2023 / Accepted: 11 April 2023 / Published: 14 April 2023
(This article belongs to the Section Building Energy, Physics, Environment, and Systems)

Abstract

:
While many school retrofits in Korea tend to focus on energy savings, some school operation practices and policies in the field may cause indoor air quality issues. This study aims to analyze the indoor air quality impact when selected measures of the energy retrofit package are applied to classrooms in a real operation context with actual airflow and contaminant transport characteristics. The selected measures included replacement of envelope windows/doors/hallway-side windows, more airtight enclosures as a byproduct of adding envelope insulation, ventilation systems and air purifiers under various operating conditions, and natural ventilation. Actual classrooms with the ages of 10, 20, and 80 years were selected. Their CONTAM base models were calibrated with the measured airflow and contaminant transport variables per American Society for Testing and Materials (ASTM) D5157. The near-open-air hallways and frequent door opening made ambient PM2.5 in the hallways, which initially originated from outdoors, flow into the classrooms. Therefore, the infiltrations and penetrations from hallways to classrooms should also be secured along with those via the envelope. When the enclosures’ airtightness is enhanced, mechanical ventilation and filtration should be in operation. Specifically, they should operate independently from school energy demand reduction policy. Installing a high-efficiency filter can help a situation when mechanical ventilation needs to run at a reduced volume. Natural ventilation, as intended for energy savings, should be introduced only when the outdoor conditions are desirable and should be supplemented with a high-capacity air purifier to maintain stable indoor concentrations.

1. Introduction

Retrofits for elementary, middle, and high schools aim to provide a better educational environment, reduce operating and maintenance costs, and improve the comfort and productivity of students, instructors, and staff members. Specifically, as most school retrofits in Korea have been initiated by national low-carbon footprint policies, school retrofits tend to emphasize energy savings. Thus, some of those retrofit practices have been called school “energy” retrofits.
When a school retrofit is excessively focused on energy savings, there could be concern over the neglect of other environmental aspects, such as indoor air quality (IAQ) [1], which seriously affects the health and learning productivity of students. Notably, as outdoor pollution warnings are occurring more often than ever before in Korea, the risk of pollution exposure to school residents is increasing.

1.1. Relevant Literature Concerning School Energy Retrofit

The literature concerning school energy retrofits firstly focuses on building envelope measures that add insulation to external walls and roofs and replace windows and doors with performance products [2,3]. Envelope retrofits contribute to tapering inflows of outdoor contaminants through infiltration and penetration, while cracks and gaps in the building structure and apertures’ perimeters are sealed or caulked [4,5,6].
If space ventilation mostly relies on infiltration due to the closed openings, particle penetration is heavily dependent on the air exchange rate, particle size, and geometry of cracks in the envelope [7,8]. Jo et al. (2022) [9] confirmed that the airtight entrance door and external windows of a Korean elementary school after a retrofit helped reduce the inflows of particulate matter (PM), resulting in a lower input/output (I/O) ratio compared to before the retrofit. They also reported that the retrofit reduced the impact of the outdoor conditions on the indoor temperature and humidity.
Without the intentional introduction of fresh air into a space whose envelope has been made more airtight, the diminished infiltration may not be able to provide the required ventilation rate, thus potentially causing CO2 to accumulate indoors [10]. Therefore, many schools have chosen natural ventilation (e.g., opening windows), which has the potential to provide acceptable IAQ without using power, as the primary method for improving the IAQ of existing or retrofitted schools [11,12,13]. In a study by Stabile et al. (2019) [14], as more natural ventilation was provided, the indoor CO2 level of an actual classroom dropped, which had been higher due to the occupants, and the indoor PM concentration was maintained at the outdoor level. However, because school IAQ is strongly affected by surrounding environments [15,16,17], improper natural ventilation practices may make the classroom IAQ even worse.
Indeed, the efficacy concerning IAQ and energy performance of HVAC system retrofitting and recommissioning, one of the typical school energy retrofit measures, has been demonstrated in many studies. Gupta and Cheong (2007) [18] reported that the I/O ratio of a mechanically ventilated space was much lower than that of a naturally ventilated space. Specifically, they found almost no PM larger than 2.5 μm in the mechanically ventilated room. Stabile et al. (2019) [14] reported that mechanical ventilation reduced the indoor CO2 concentration more than natural ventilation, and that the indoor PM level was maintained more steadily at a lower level than that outdoors (i.e., decreased I/O ratio). In particular, the ventilation system with heat recovery provided a higher flowrate than the EN152251 standard but consumed less heating energy. They found that it was due to the reduced ventilation heat loss when the incoming outdoor air (OA) exchanged the (sensible) heat with the exhaust air (EA). Similarly, case studies by Merema et al. (2018) [19] presented that demand control ventilation (DCV) can maintain good IAQ and save significant amounts of energy for schools and offices by reducing fan and ventilation heat losses. Wang et al. (2014) [20] revealed that good IAQ and reduced energy use of schools could be simultaneously achieved with the appropriate operation of a heat recovery heat pump and ventilation system. Barbosa, Freitas, and Almeida (2020) [21] reported that although there was an expected increase of indoor CO2 concentration, daily discomfort in a Portugal classroom improved after applying passive retrofit measures (more air-tight enclosure and roof insulation). Additionally, they also found that the convective heating system led to better thermal comfort with a reasonable increase in energy use.
Along with the mechanical ventilation system, Pacitto et al. (2020) [22] reported that the use of high efficiency particulate air (HEPA)-filtered air purifiers (APs) can lead to a significant reduction in the I/O ratio of PMs for small school gyms with all the openings closed. Rawat and Kumar (2022) [23] also reported that APs can effectively remove PM10 and PM2.5 by up to 34% and 57%, respectively, in classrooms.
In summary, the literature concerning school retrofits suggests the following: (i) Envelope retrofitting, including replacing windows/doors and adding insulation, is an effective measure for enhancing existing buildings’ energy performance; additionally, making the whole classroom enclosure more air-tight is necessary to prevent the contaminant inflows via cracks and gaps. (ii) Tighter enclosures apparently attenuate infiltration and penetration but also may not meet the required ventilation rate. More seriously, the reduced exfiltration makes the discharge of CO2 emitted by occupants difficult. Appropriate ventilation strategies are of the utmost importance for energy retrofits either by opening fenestrations or by using a mechanical system. (iii) Mechanical ventilation can be more reliable than natural ventilation in terms of steadily providing the required ventilation rate and filtrating the indoor air. (iv) Retrofitting HVAC systems with heat recovery and high-efficiency filters can enhance both the energy performance and IAQ of existing buildings. (v) Installation of separate APs can significantly help in lowering indoor particulate concentration.

1.2. Relevant Literature Concerning School Operation and Maintenance Issues

However, in many retrofit cases, the actual energy performance and IAQ obtained after a retrofit may not be as good as what was originally expected. This performance gap can be mainly attributed to poor design, inadequate installation or maintenance, unintended operations, and changes in building use or occupancy. Specifically, the literature says that performance gaps in schools are due to sub-optimal operation and maintenance issues related to school systems and classroom activities.
Jain et al. (2020) [24] claimed that a coarse and centralized system design with a lack of user-friendly building management system controls is one of primary causes that design intents of a school are not properly translated into actual performance.
Based on the CO2 concentration data of naturally ventilated schools under study, Fisk (2017) [1] claimed that naturally ventilated schools cannot consistently rely on the opening of windows to provide the recommended minimum ventilation rate. However, he reported that low ventilation rates are also found in many mechanically ventilated schools. He suggested the following potential reasons for the low ventilation rates based on his observations and experiences:
  • Many ventilation systems are turned on only when heating and cooling is needed;
  • OA dampers are intentionally closed even though the ventilation system is operating (i.e., only to recirculate the indoor air).
He explained that the above two reasons are strongly associated with the energy cost savings. However, he further noted that ventilation systems are often turned off because occupants perceive operation noises as bothersome to learning. He also attributed the low ventilation rates to the poorly designed or maintained ventilation systems.
Chan et al. (2020) [25] confirmed Fisk’s reasoning by finding that ventilation systems with issues of improperly selected equipment, lack of commissioning, incorrect fan control settings, and heavily loaded filters may not deliver a sufficient ventilation rate for classrooms.
Cai et al. (2021) [26] mentioned that it is difficult to reduce PM2.5 concentration in classrooms if there are both a high density of occupants and essential activities during breaks between classes. They also reported that the insufficient filtration capacities of ventilation systems (e.g., clean air delivery rate) cannot remove particles fast enough to achieve a steady state with sufficiently low concentration.
Additionally, de Mesquita et al. (2022) [27] indicated that behavioral and operational challenges may promote IAQ performance gaps in buildings, such as the following:
  • Portable air cleaners can generate noticeable or uncomfortable noise levels at maximum fan speed. So, ASHRAE has suggested selecting air cleaners based on reduced fan speed if noise is a concern [28];
  • Controls that rely on human behavior, such as opening windows or manually controlled mechanical ventilation or filtration systems, may not be implemented reliably or as intended. In some situations, heuristic operations may jeopardize or diverge the built environment that has converged to the optimum.
Sanguinetti, Outcault, Pistochini, and Hoffacker (2022) [29] supported these behavioral and operational challenges for schools’ indoor environments based on teachers’ surveys and interviews:
  • Teachers were not educated regarding mechanical ventilation. Errors in HVAC system installation and programming may have contributed to misunderstandings and even occasionally made it possible for teachers to turn off the HVAC fan to reduce noise;
  • Occupants in classrooms with poorer ventilation may momentarily perceive more comfort because room temperatures fluctuated more when ventilation rates were higher, such that teachers in the classroom were not likely to accurately perceive insufficient ventilation or turn on the ventilation.

1.3. Typical Building Measures for Domestic School Retrofit and Operation Issues

Referring to the standard manuals for educational facilities’ construction and operation/maintenance and practitioners’ surveys of more than 20 school retrofit projects [30,31,32], typical building and system measures for domestic elementary, middle, and high school retrofits are elaborated in Table 1 and Table 2, with strengths and weaknesses from energy performance and IAQ perspectives. The surveyed domestic retrofit measures were not specifically different from those shown in the literature of Section 1.1. However, most Korean school retrofits tended to adopt a prescriptive set of measures (i.e., a retrofit package) that have been repeatedly chosen by many projects, considering climate and indigenous specificity and local operation customs.
Summers in Korea (from June to mid-September) are hot and humid, with temperatures averaging between 23 to 30 °C and relative humidity ranging between 60 to 90%. Winters (from mid-November to March) are cold and dry, with temperatures ranging from −7 °C to 5 °C and relative humidity ranging between 20 to 50%. The in-between swing seasons are comparatively shorter. Therefore, most retrofit projects emphasize insulation of the envelope to enhance the facility’s function as a shelter. The typical scope of insulation includes external walls, roofs, and slabs-on-grade, while exterior fenestrations are replaced with performance products. To add insulation to the envelope, they reinforce the structural walls first, filling and blocking the penetrations and holes (in penetrating pipes, wires, ducts, etc.) and then sealing/caulking/gasketing gaps and cracks. Finally, the surface of the finished material is taped, polished, and coated, if necessary. Perimeters of the replaced fenestration frame are also sealed and taped when they are replaced. Therefore, envelope refabrication certainly enhances the airtightness of the corresponding space against outdoor air infiltration.
The internal walls between classrooms and those between classrooms and hallways are usually built with masonry, in which significant gaps are often observed between the masonry wall and the upper slab. Therefore, the gaps are likely to exchange air and PMs if a significant pressure difference between spaces is created. When the retrofit budget is sufficient, these gaps are filled with silicone or mortar first, and then the ceiling panels are re-installed. Otherwise, only the ceiling may be replaced with acoustic panels, which can often cause a leak issue of ambient contaminant sources even for retrofitted classrooms.
The classroom floor is usually replaced with a hard floor made of materials such as micro cement or hardwood. Additionally, the floor is periodically water-cleaned [30], and all occupants wear indoor shoes in most schools. Thus, particle resuspension from the floor tends to be low. For furniture and blinds, matte finishing material is preferred over fabric, which can also make the surface adsorption of particles low.
In most elementary, middle, and high school classrooms in Korea, openable windows are installed on the inter-walls between classrooms and hallways (i.e., hallway-side walls), and there are two doors at the front and rear of the classroom. This opening configuration was intended to induce cross-ventilation for free cooling when there was no air-conditioner (AC) in old schools. However, hallway-side windows and doors are typically excluded from replacement, because the energy performance assessment tool for domestic certification assumes that there is no mutual heat exchange between classrooms and hallways, both of which are deemed air-conditioned spaces with only small temperature differences. In this case, decreased energy demands due to enhanced insulation and airtightness by the replaced windows and doors cannot be verified using the domestic assessment tool. Thus, general school retrofit practices instead choose to replace existing hallway windows and doors with economy products (i.e., higher thermal conductivity and less airtightness compared to performance products) or make no change.
Another problematic operation practice is that hallway exterior windows are often kept open in summer because most schools provide no cooling and heating in hallways. However, this may be the case in many schools in cold seasons as well due to the large floating population along the hallways and the lack of dedicated management personnel. If classroom doors or hallway-side windows are not properly replaced, gaps between mullion/sash/jamb and casing, and between casing and wall may allow considerable air exchange and contaminant penetration between classrooms and hallways even while classrooms are closed. Additionally, economy rail doors without sills, which are typically selected due to school barrier-free certification, may inevitably cause considerable air leakage and penetration. More seriously, classroom doors are kept open when most students pass by, such as during access hours, breaks, and lunchtimes. Thus, contaminants and unconditioned air in the hallway, which may not be different from those of the outdoors, can frequently enter the classroom with no compensation.

1.4. Typical System Measures for Domestic School Retrofit and Operation Issues

Most Korean elementary, middle, and high school classrooms do not have central air-conditioning systems (i.e., no air-handler), while existing old schools used to rely on steam radiators for heating only. Like many schools described in the literature, they used to rely on natural ventilation for cooling and fresh air. However, in the 2000s, they began to install separate stand-alone ACs in the classroom. Currently, most retrofitted schools are equipped with variable refrigerant flow (VRF) systems that can service heating and cooling at the same time. Because VRF systems do not provide the required ventilation rate as central air handlers do, a separate mechanical ventilation system must be installed by law [30]. In most domestic retrofit projects, an energy recovery ventilation (ERV) system is installed instead of a heat recovery ventilation (HRV) system due to the large outdoor humidity variation across seasons. According to related laws and regulations [35], supply air (SA) filters with minimum efficiency reporting value (MERV) ratings of 12 or higher must be installed in ERVs. If it is difficult to install ERVs, an AP can be an alternative. In this case, an AP with filtration capability that covers at least 150% of the standard classroom area (66 m2) should be set up [35]. HEPA filters are typically equipped with APs.
If sufficient plenum clearance is secured, ERVs can be installed in the plenum. However, in many retrofit cases, floor-standing ERVs are installed under a windowsill, or a stand-alone type is set up at the rear of the classroom. Often, ERVs operate at a forcibly reduced flowrate instead of the rated volume due to the running noise at higher velocity when they are installed exposed to the indoors. Moreover, it is frequently observed that furniture and obstructions block the SA outflow of floor-standing ERVs. This coincides with the operation and maintenance issues noted by [1,24,25,27].
Most domestic schools are under centrally enforced (energy) “demand reduction policy”, which regulates operation hours and space setpoint temperatures for energy savings according to the guideline by the regional office of education. Typically, during the semester days from late May until before the summer vacation, the cooling temperature is set to 26 °C for classes, while during the semester days from early November until before the winter vacation, the heating temperature is set to 20 °C for classes. However, occupants are not allowed to change the pre-set temperatures. Heating and cooling are turned off during lunchtime as well as after class. For the rest of the semester days in spring and autumn (swing seasons), there is no cooling or heating. Instead, natural ventilation and free cooling by opening windows and doors is one of the legacy school operation policies. As unforeseen outdoor temperatures, extreme weather, and unprecedented outdoor contaminant concentrations are often observed in Korea, however, these operation customs often result in discomfort (e.g., too hot despite cooling being on, too humid on rainy days but they cannot turn on AC) and IAQ challenges in the classroom (e.g., VRFs are running in the closed classroom, but no ERVs are running due to a lack of interlocking control; in spring, when outdoor contaminant warning alerts are likely, natural ventilation is tried out).

1.5. Study Objectives and Steps

According to the initial intent of many energy retrofit projects for domestic elementary, middle, and high schools in Section 1.3 and Section 1.4, the retrofitted schools in Korea rely more on mechanical ventilation than natural ventilation. As envelope insulation, external window replacement, and VRFs are the primary measures, namely, of the school energy retrofit package, ERVs are added as another primary HVAC retrofit measure to meet the required ventilation rate because added insulation and high-performance windows reduce infiltration, and VRFs cannot provide fresh OA.
However, some school operation and maintenance practices and enforced demand reduction policies seem to cause some IAQ issues, as elaborated in Section 1.2, Section 1.3 and Section 1.4. Specifically, no previous studies seem to have dealt with operational issues such as ambient contaminant in hallways, inappropriate interlock between air-conditioning and ventilation systems, and improper natural ventilation guidance.
This study analyzes the impact on classroom IAQ when select, but directly relevant, measures of the school energy retrofit package and their suggested operations (Section 2) are applied to classrooms in a real operation context. The real operation context includes near-open-air hallways, frequent door opening, HVAC systems at enforced demand reduction, reduced SA volume, and real airflow and contaminant transport characteristics of classrooms. Based on the analysis results of building refabrication, ventilation, and filtration measures, this study intends to provide a more streamlined recommendation from the perspective of the real school context, which can reduce the performance gap. The detailed process is depicted in Figure 1 and is described as follows.
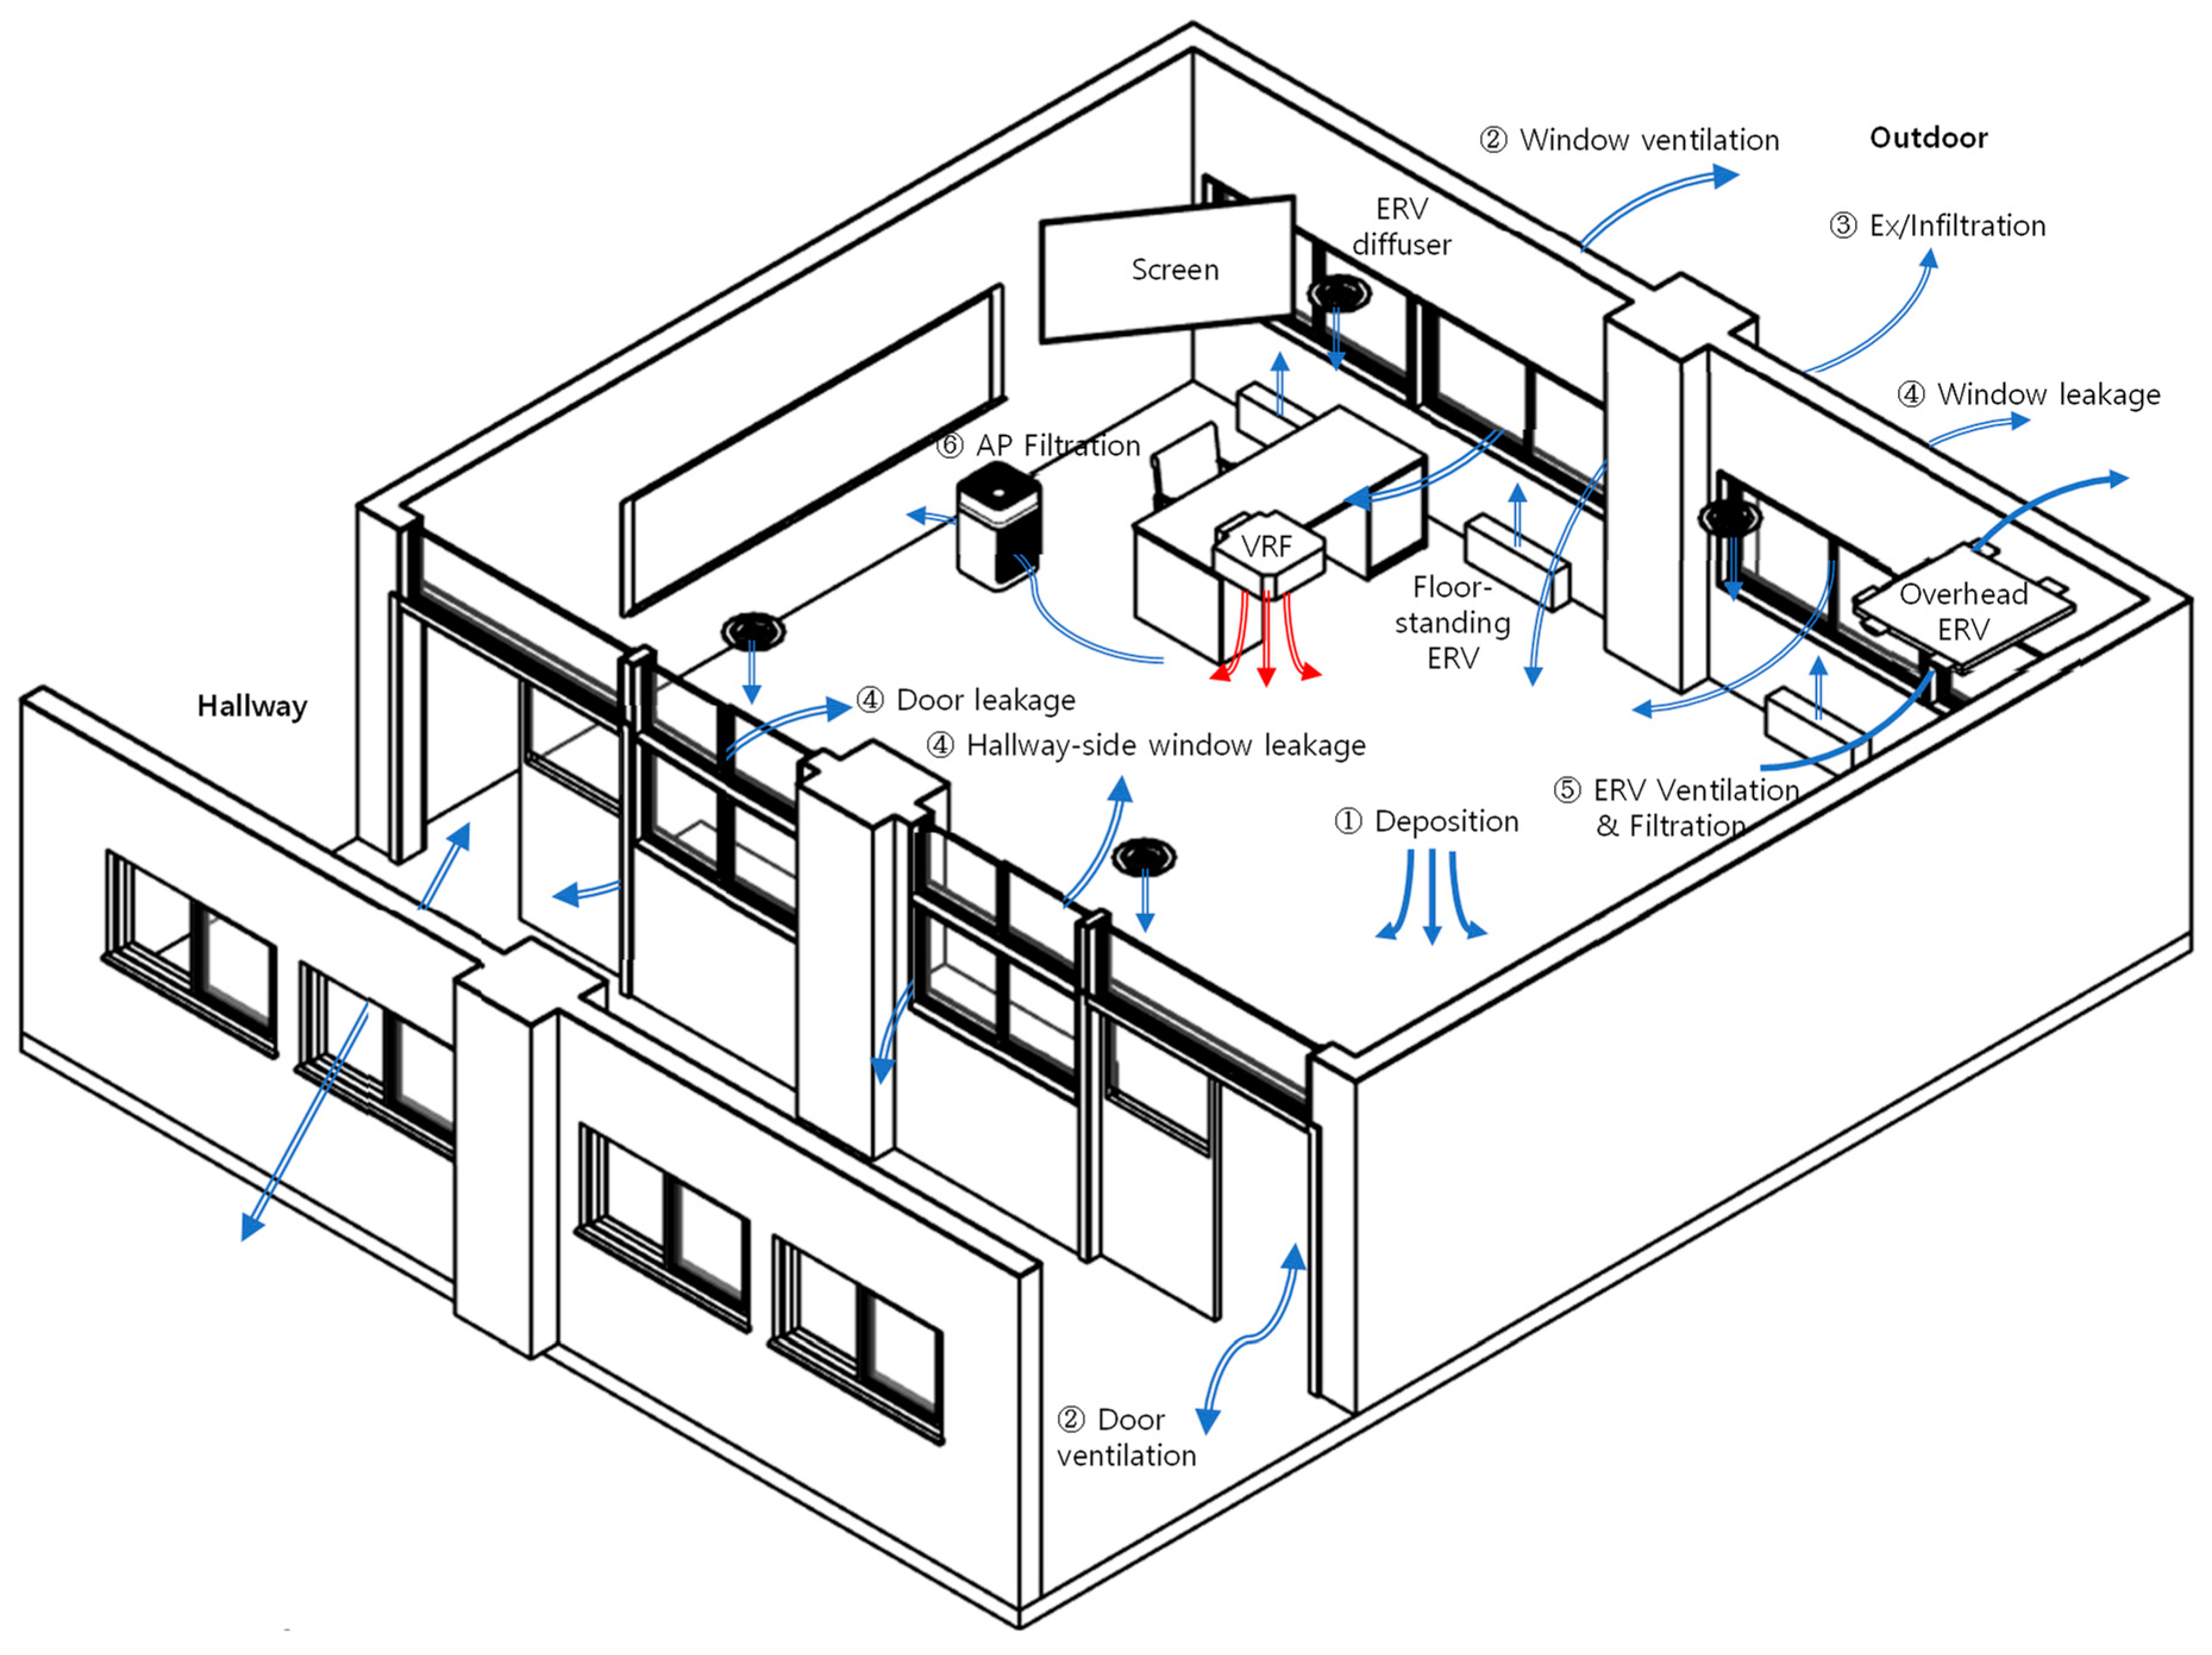
Step 1: Actual elementary and middle school classrooms with the ages of 10, 20, and 80 years were selected, surveyed, and measured to obtain the airflow and contaminant transport configurations as depicted in Figure 2. Then, variables representing the configurations were quantified using the mass transport equation (Equation (1)) (Section 3.1).
Step 2: The CONTAM [36] base model was fabricated based on the spatial and physical surveys of each classroom and its surroundings. The CONTAM base model was updated by inputting actual external environmental conditions. In addition, it was calibrated with the airflow and contaminant transport variables quantified in Step 1 and measured data (Section 3.2).
Step 3: The annual I/O profile of PM2.5 and CO2 and their daily profile in the worst-case scenario were analyzed after applying the selected building retrofit, ventilation, and filtration measures to the calibrated CONTAM baseline for each classroom (Section 3.3 and Section 3.4).
Step 4: The desired strategies for building/envelope retrofit, mechanical/natural ventilation, and filtration measures and their operation protocols were discussed and recommended (Section 4.1).

2. Selected Building Retrofit, Ventilation, and Filtration Measures

The building and HVAC retrofit measures directly relevant to IAQ, which were selected from Table 1 and Table 2, are presented in Table 3 and Table 4, respectively. Their installation variations and/or operation options are added in. Natural ventilation options are listed in Table 5.
Replacing external windows with first-grade airtight products (B1) can greatly reduce infiltration and exfiltration via the window perimeter. According to KS F 2292 (the method of ensuring airtightness for windows and doors) [34], products can be classified as first-grade if the air leakage ≤1 m3/h per unit window area when the pressure difference is 10 Pa.
Although economy products are typically installed for windows and doors in the hallway-side walls of classrooms (B2a, B3a), replacement options using first-grade airtight products were also considered (B2b, B3b). This study assumed that the airtightness of economy rail doors corresponds to the airtight 30th-grade according to a previous experimental study [37], and the airtightness of economy PVC windows corresponds to the airtight sixth-grade according to a previous experimental study [38].
Since the airtightness of a whole classroom enclosure can be greatly improved if insulation is added to the envelope (B4), this study assumed that the classroom airtightness increases to 3.0 ACH50, which corresponds to the airtightness of a high-energy-performance residential building [39].
As typical domestic classroom floors are already constructed as hard floors and periodically water-cleaned, and almost all occupants wear indoor shoes, this study assumed that there is little accumulation and resuspension of contaminants from the floor. Thereby, no floor retrofit measure was considered.
Among HVAC retrofit measures of the package, only ERVs were considered because ERVs are practically the only ventilation measure that comes with VRFs, while air handlers are rarely installed in domestic classrooms. For a classroom with 25 occupants, 800 m3/h (CMH) of the rated SA volume was a reasonable sizing (S1b) based on the minimum ventilation rate. As the reduced SA volume of ERVs due to rumbling noise is often observed in the classroom, however, 600 CMH of the silent operation of newly installed ERVs was assumed (S1a). As ERVs available on the market have a single pre-filter and a single medium filter, the VRF’s default filter efficiency was assumed to be 0.8. For the case in which only the existing filter is replaced, replacement with a MERV 15 filter was considered as another HVAC recommissioning option (S2). Once all the ERVs were turned on when class started at 9 a.m., they kept running until class ended at 3 p.m.
APs are frequently found in domestic classrooms; compared to HVAC-type air filtration solutions such as ERVs or air handlers, their initial cost is lower, and they are easier to operate and maintain. As APs should provide air filtration for larger than 150% of the standard classroom area, this study assumed a single AP with 900 CMH of the rated air volume and HEPA filter (S3a). Additionally, dual APs (S3b) whose total rated air volume was 1200 CMH (600 CMHx2) were also considered because they are more available on the market than the large-volume APs. Once all the APs were turned on when class started at 9 a.m., they kept running until class ended at 3 p.m.
Lastly, natural ventilation was included as a ventilation option for classrooms because many instructors, who are the actual operators of classrooms, prefer opening windows and doors when they perceive the weather as “fine.” Moreover, because natural ventilation has been one of the legacy cooling methods for centuries, people think it is a fair method of circulating the air. This study defined natural ventilation as opening windows (Nwin) and cross-ventilation as opening both windows and doors (Ncv). Despite actual field practice, however, it was assumed that natural ventilation was possible only when there were no running HVAC systems (including AC, heaters, VRF, ERV), there were no outdoor contaminant alerts (i.e., average daily PM2.5 concentration ≤35 μg/m3) [41], and the outdoor temperature was mild (22–28 °C), per the demand reduction policy and natural ventilation compliance.

3. Case Studies

3.1. Observation and Measurement of Airflow and Contaminant Transport Characteristics of Test Classrooms

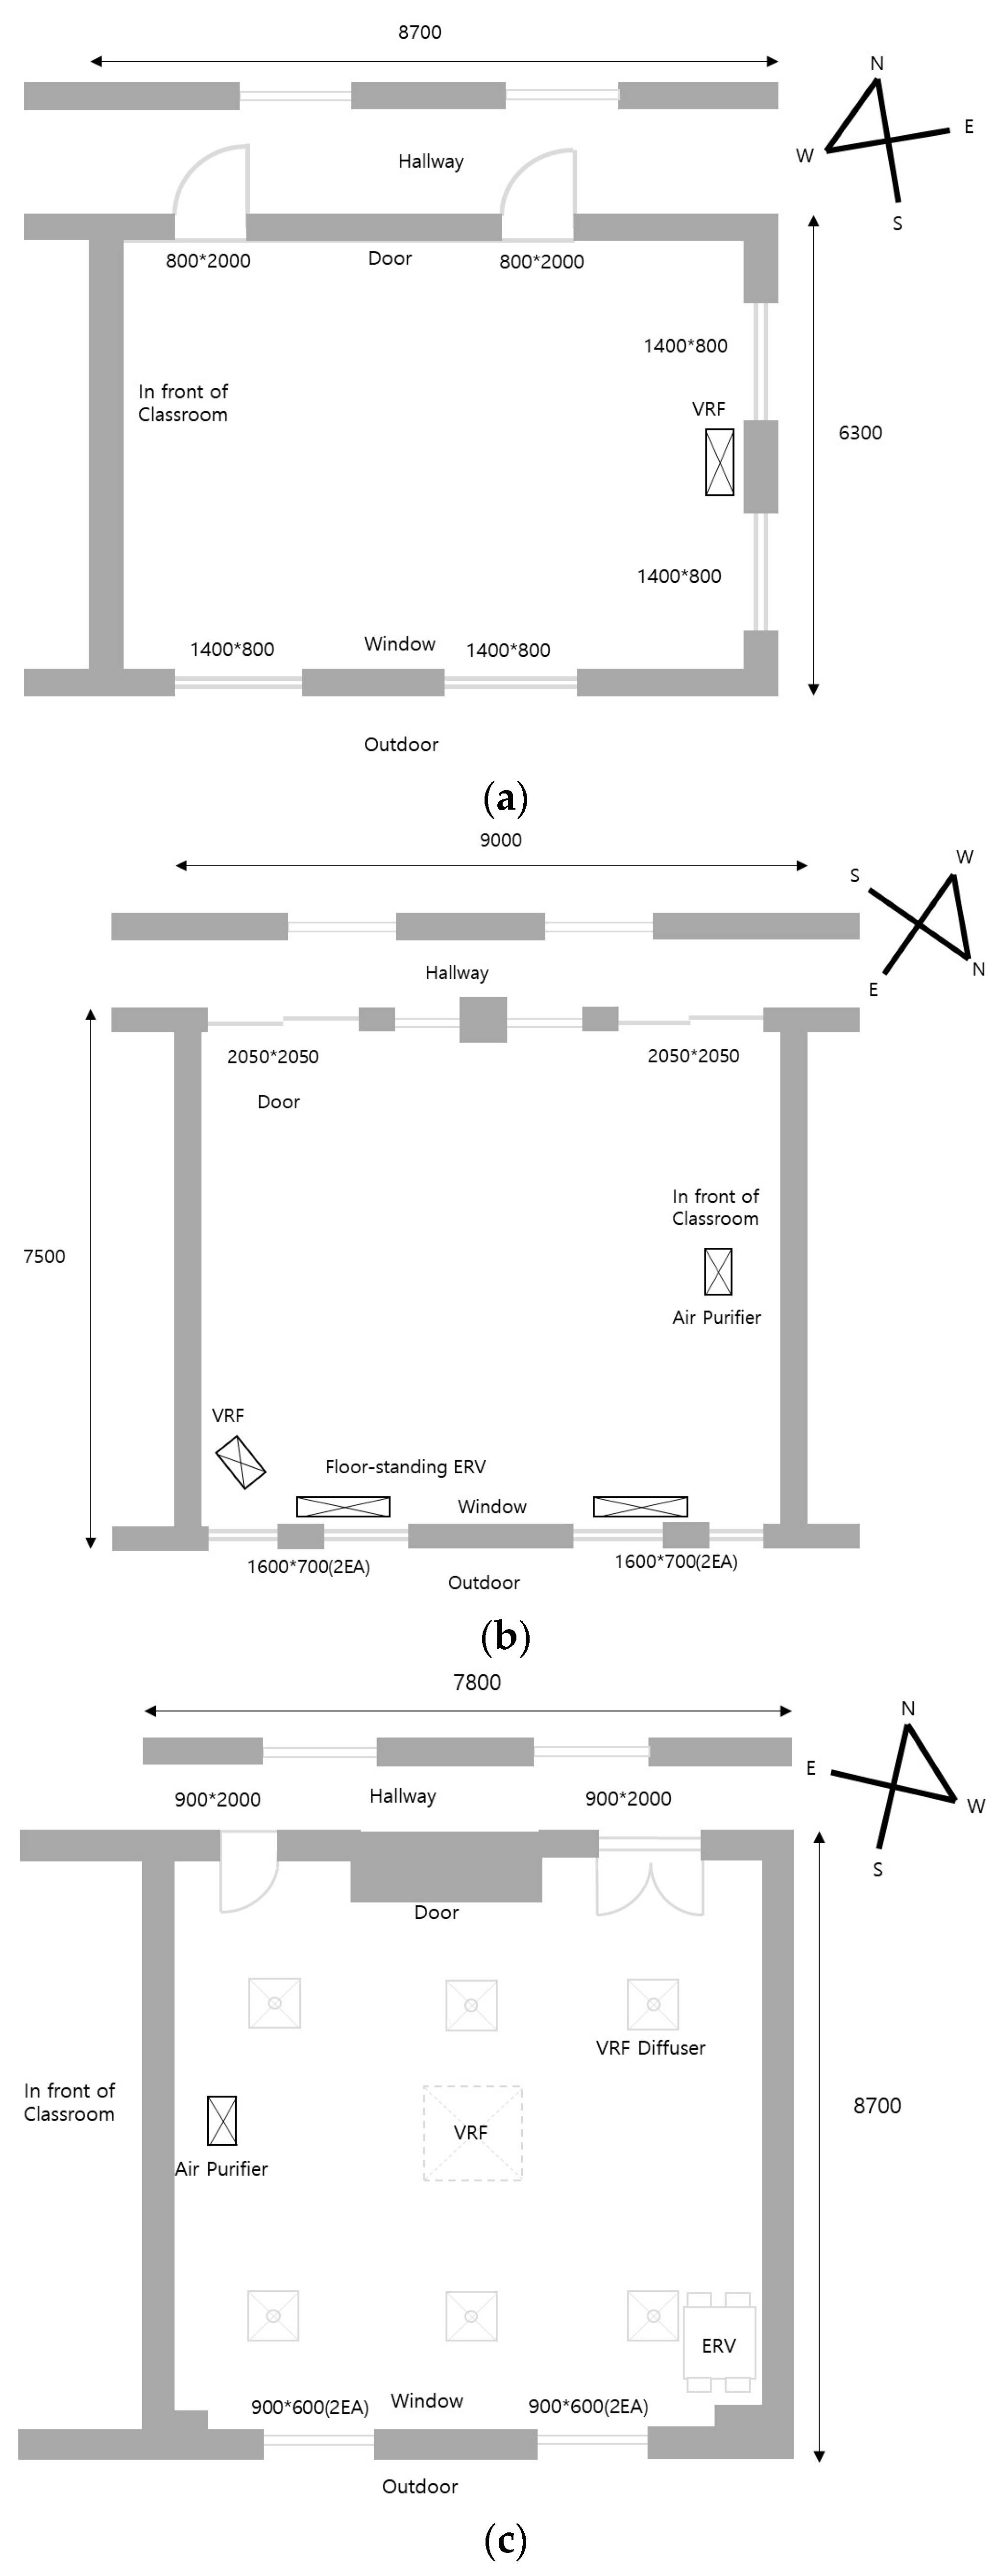
This study selected an 80-year-old classroom (Case D), a 20-year-old classroom (Case I), and a 10-year-old classroom (Case M), all located in Seoul, a metropolitan city in Korea (Figure 3). In Case D, the classroom, which had undergone several retrofit sessions, was equipped with double-glazed aluminum windows, steel doors, system AC, steam heaters, and AP. However, due to the worn and old masonry structure, cracks, gaps, and small holes were observed on the walls, floors, and ceilings even with the naked eye. In Case I, although VRF, floor-standing ERV, and AP were installed, the classroom still had old-fashioned double-glazed aluminum windows. The windows and doors on the hallway-side walls were railed products on wooden frames, and the partition walls shared with neighboring classrooms were brick. Thus, air leaks through the perimeter of fenestrations and shared walls seemed to be present. Case M, the newest classroom, was equipped with double-glazed PVC window frames along with VRF, overhead ERV, and AP. However, the steel door without a doorsill allowed considerable air exchange with the hallway through the bottom gap.
In all three schools, there was no separate heating and cooling equipment or air filtration equipment in the hallways. Because the windows and doors in the hallways were kept open at almost all times during semesters, the hallway indoor environment was hardly different from the outdoor environment. Classrooms were closed during off-school hours (e.g., vacations and after class), but classroom doors remained open during access hours, breaks, and lunchtimes. Hence, although HVAC systems of the classrooms were still running when doors were open, an inflow of ambient contaminants from the hallway seemed unavoidable.
To measure the airflow and contaminant transport characteristics of each classroom, as well as the system variables of ERV and AP, six measurement scenarios were devised to estimate the following:
(i).
Infiltration and exfiltration flowrates by measuring CO2 concentration decay;
(ii).
Penetration coefficient and deposition rate of PM2.5 by measuring PM2.5 concentration decay through infiltration and exfiltration;
(iii).
Supply flowrate and filter efficiency of the existing ERV by measuring decreasing PM2.5 concentration;
(iv).
Supply flowrate and filter efficiency of the existing AP by measuring decreasing PM2.5 concentration;
(v).
Incoming and outgoing flowrates when windows were open by measuring decreasing PM2.5. concentration;
(vi).
Incoming and outgoing flowrates when both windows and doors were open by measuring decreasing PM2.5 concentration.
For every measurement scenario, 2000 ppm of CO2 and 80 μg/m3 of PM2.5 were artificially created in the classroom after keeping all windows and doors closed, and a blower was turned on to circulate CO2 and PM2.5, thus mimicking a well-mixed state. Subsequently, IAQ-CW1 IAQ stations [42] (PM2.5 range: 0~1000 μg/m3; PM2.5 accuracy: 84.2%; PM2.5 resolution: 1 μg/m3; CO2 range: 0~10,000 ppm) were set up in classrooms, hallways, and outdoors to measure CO2 and PM2.5 concentrations every minute. ELAs by windows, doors, and holes/gaps/cracks on the structure were measured and estimated through blow door testing (BDT) using the Minneapolis Blower Door System [43].
A mass transport equation (Equation (1)) was defined to quantify the characteristic variables measured in each scenario. After eliminating irrelevant terms of Equation (1) for each scenario, the variable values that best fit the measurement profile were estimated.
V d C i n d t = P Q i n f C o u t + C h a l l + 1 η e r v Q e r v C o u t P Q e x f C i n V k C i n η e r v Q e r v + η a p Q a p C i n + G
Here, V denotes space air volume from floor to ceiling (m3); Cin denotes indoor PM2.5 concentration (μg/m3); Cout denotes outdoor PM2.5 concentration (μg/m3); Chall denotes hallway PM2.5 concentration (μg/m3); P denotes penetration coefficient of PM2.5 (-); k denotes deposition rate of PM2.5 (1/h); Qinf denotes infiltration flow rate (m3/h); Qexf denotes exfiltration flow rate (m3/h); Qerv denotes ERV supply flow rate (m3/h); ηerv denotes ERV filter efficiency(-); Qap denotes AP supply flow rate (m3/h); ηap denotes AP filter efficiency(-); G denotes contaminant generation rate (μg/h).
Table 6 presents the estimated and measured variables of classrooms. Unlike other cases, the PM2.5 of Case D decreased linearly over the measurement period, which was longer than 14 h. Because Equation (1) assumes that the PM2.5 concentration attenuates exponentially, it was necessary to estimate the penetration coefficient (P) and deposition rate (k) of PM2.5 to be 1 and 0, respectively, to best fit the linear decrease of PM2.5 (i.e., by nullifying the deposition rate term in Equation (1)). This could be explained by the fact that the exfiltration of PM2.5 was much stronger than the deposition of PM2.5 because of the aged envelope of Case D. This reasoning was supported by the fact that the ELA of holes/cracks/gaps, which was measured by BDT, was considerably larger (968.6 cm2; 6.726 cm2/m3) than that of the other classrooms.
Although the hallway-side window frame in Case I was made of old worn wood that looked leaky, the ELA of that window was measured to be somewhat smaller (36.6 cm2; 10.007 cm2/m2) because the window sashes were tightly held with a hook. In contrast, the ELA of the door in Case I, which was an old wood sliding door with large gaps but no doorsill, was measured to be quite large (676.2 cm2; 160.904 cm2/m2). Meanwhile, ERVs in Case I were operating at a reduced volume (approx. 640 CMH) due to noise, and at a low filter efficiency (0.6) due to wear and tear over time.
In Case M, the newest classroom, the airtightness of windows was quite small (3.6 cm2; 1.667 cm2/m2 of ELA). However, because the new door of Case M had a large eye-catching gap under it, i.e., no doorsill, the ELA of the door was unexpectedly high (169.8 cm2; 35.375 cm2/m2). The supply volume and filter efficiency of ERV and AP in Case M were slightly lower than the rated values, as less than 10 years had passed since their installation.

3.2. Preparation of Calibrated CONTAM Models

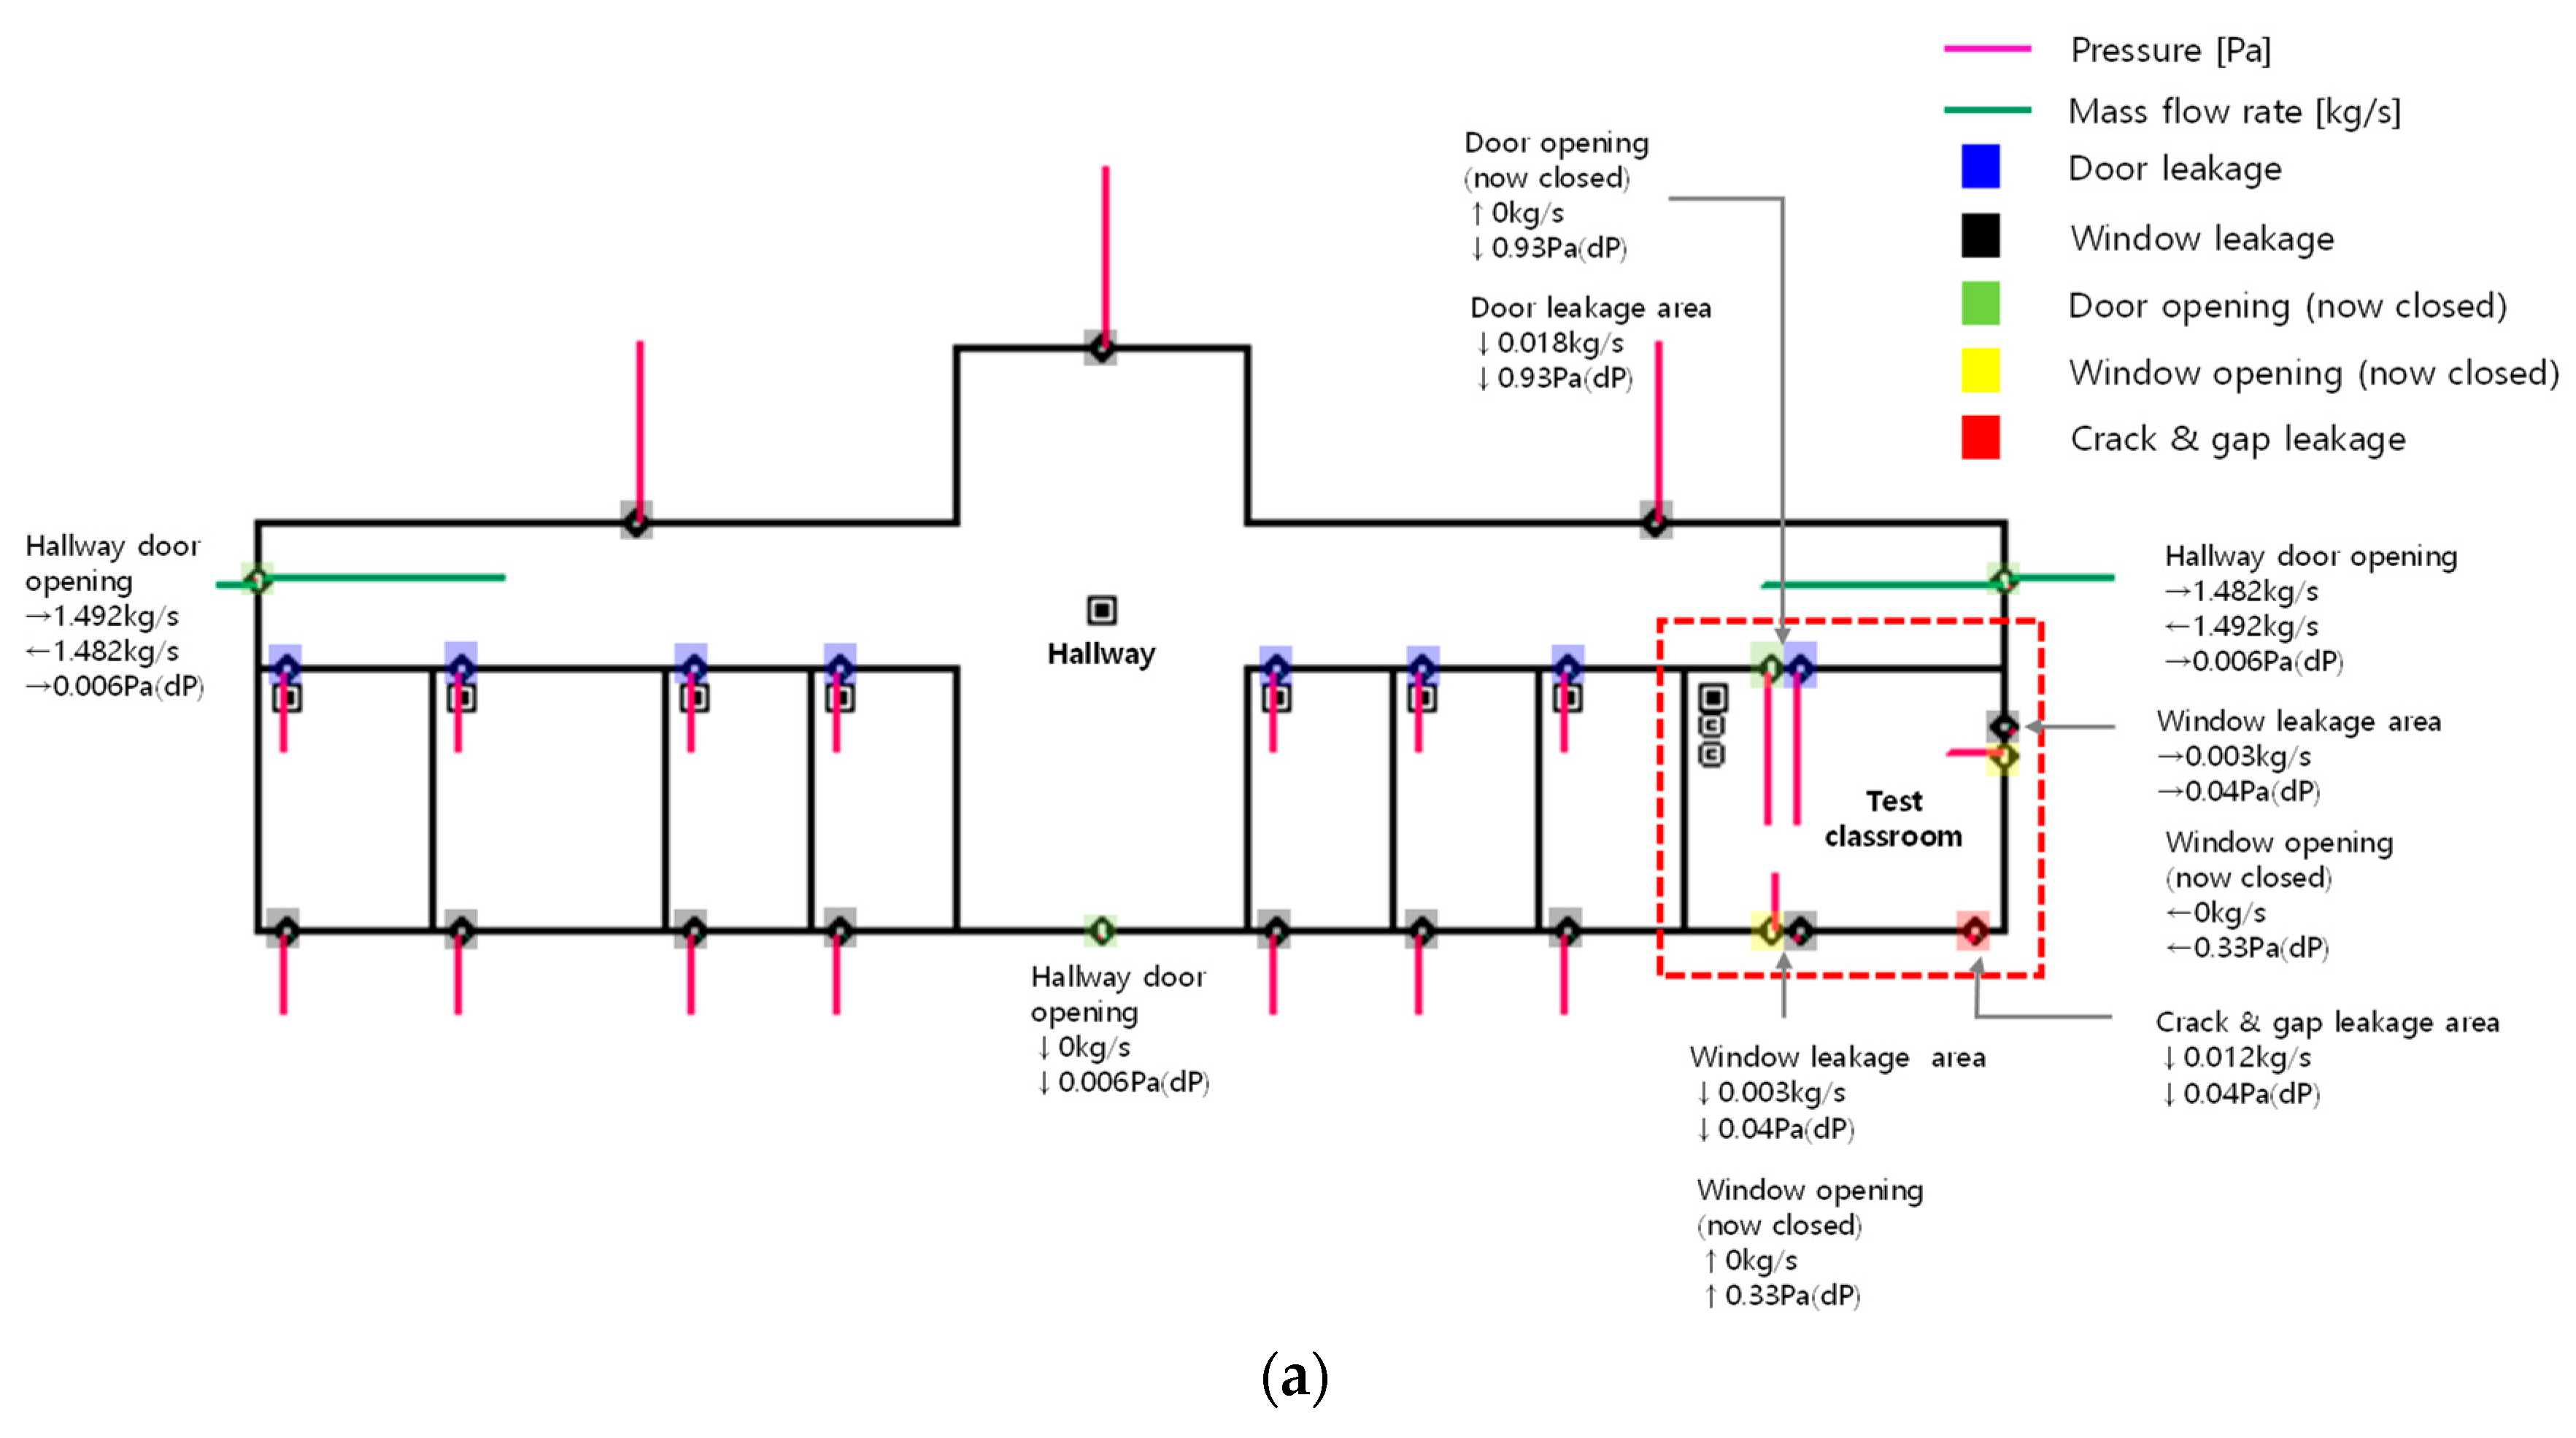
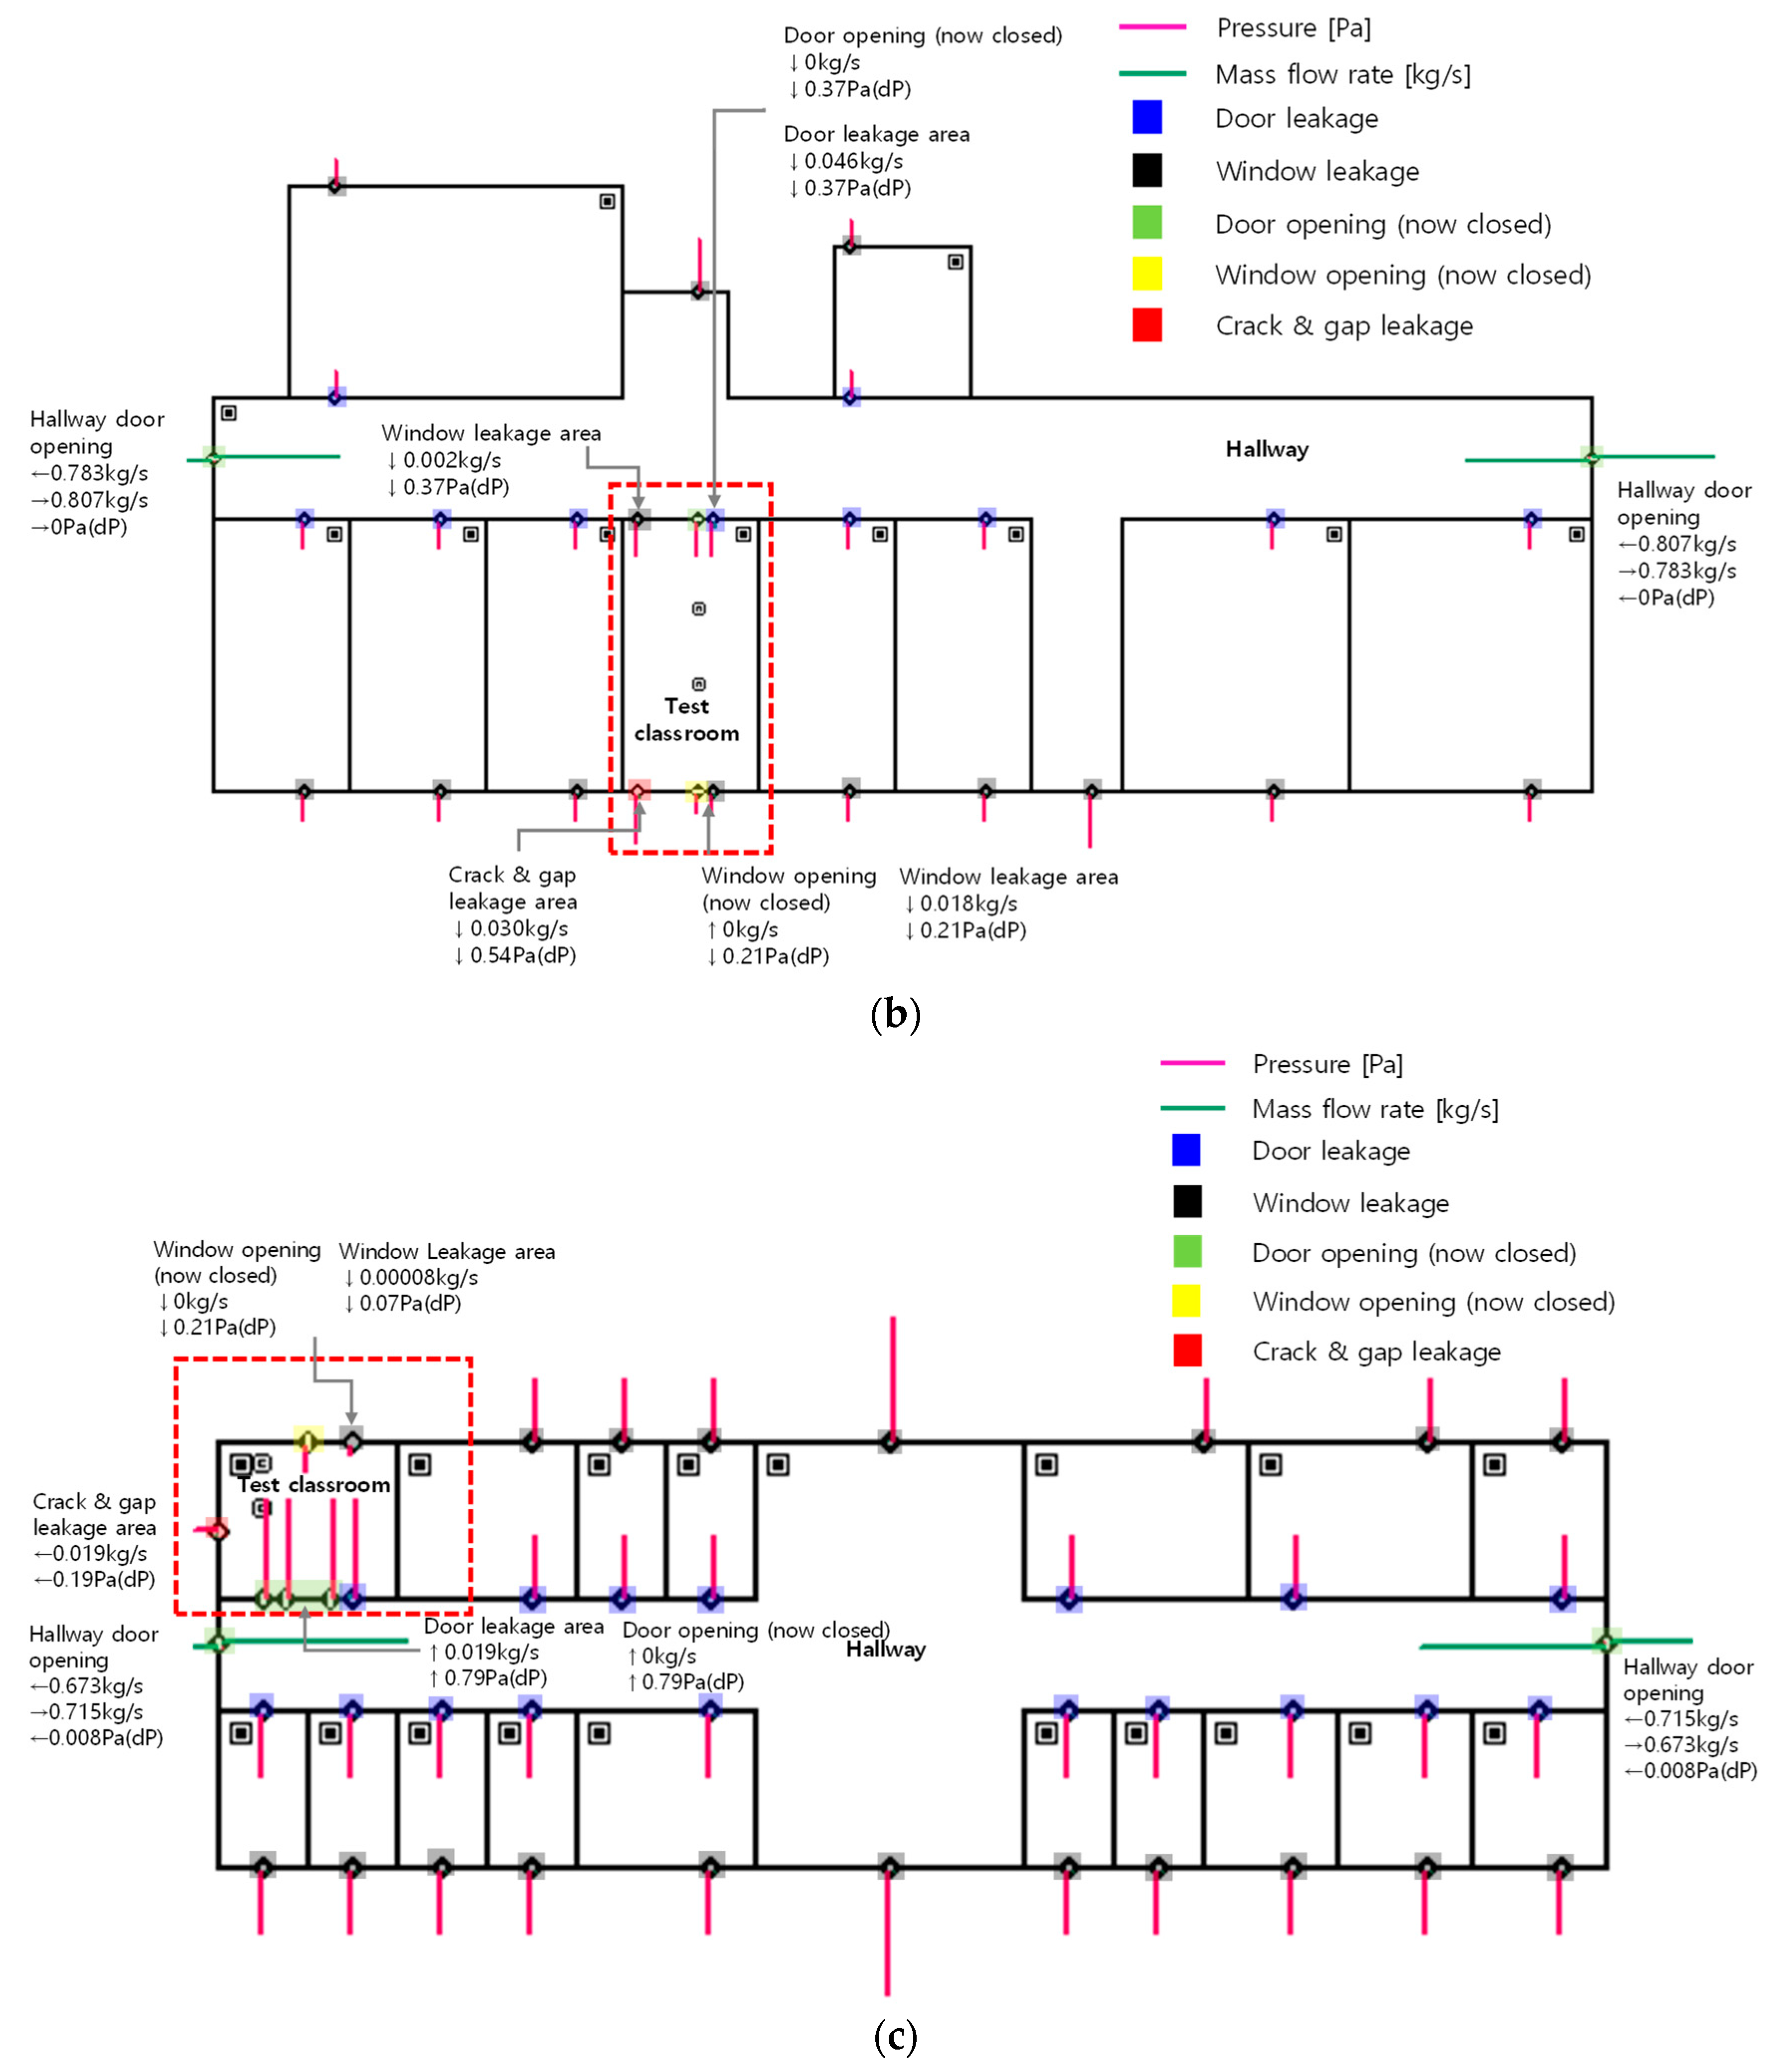
With the geometry and dimensions of each classroom, a CONTAM base model was constructed, including other classrooms on the same floor, as depicted in Figure 4. The CONTAM base models were updated as indicated in the modeling guide (Table 7) using the estimated and measured airflow and contaminant transport variables in Table 6. To properly simulate the behavior of natural ventilation by opening windows and doors, the dimensions of the doors and windows in each classroom were measured with care and inputted into the corresponding dimensions of the single opening model of CONTAM.
As in a real school, the external windows and entrance doors of the hallways were modeled as the single opening model and set to open constantly, such that the simulated PM2.5 concentration was fitted to the measured PM2.5 in actual hallways with a reasonable variation. Outdoor weather data of the base model consisted of the measurements obtained from IAQ stations, including temperature, relative humidity, and hourly averaged PM2.5 and CO2 concentrations.
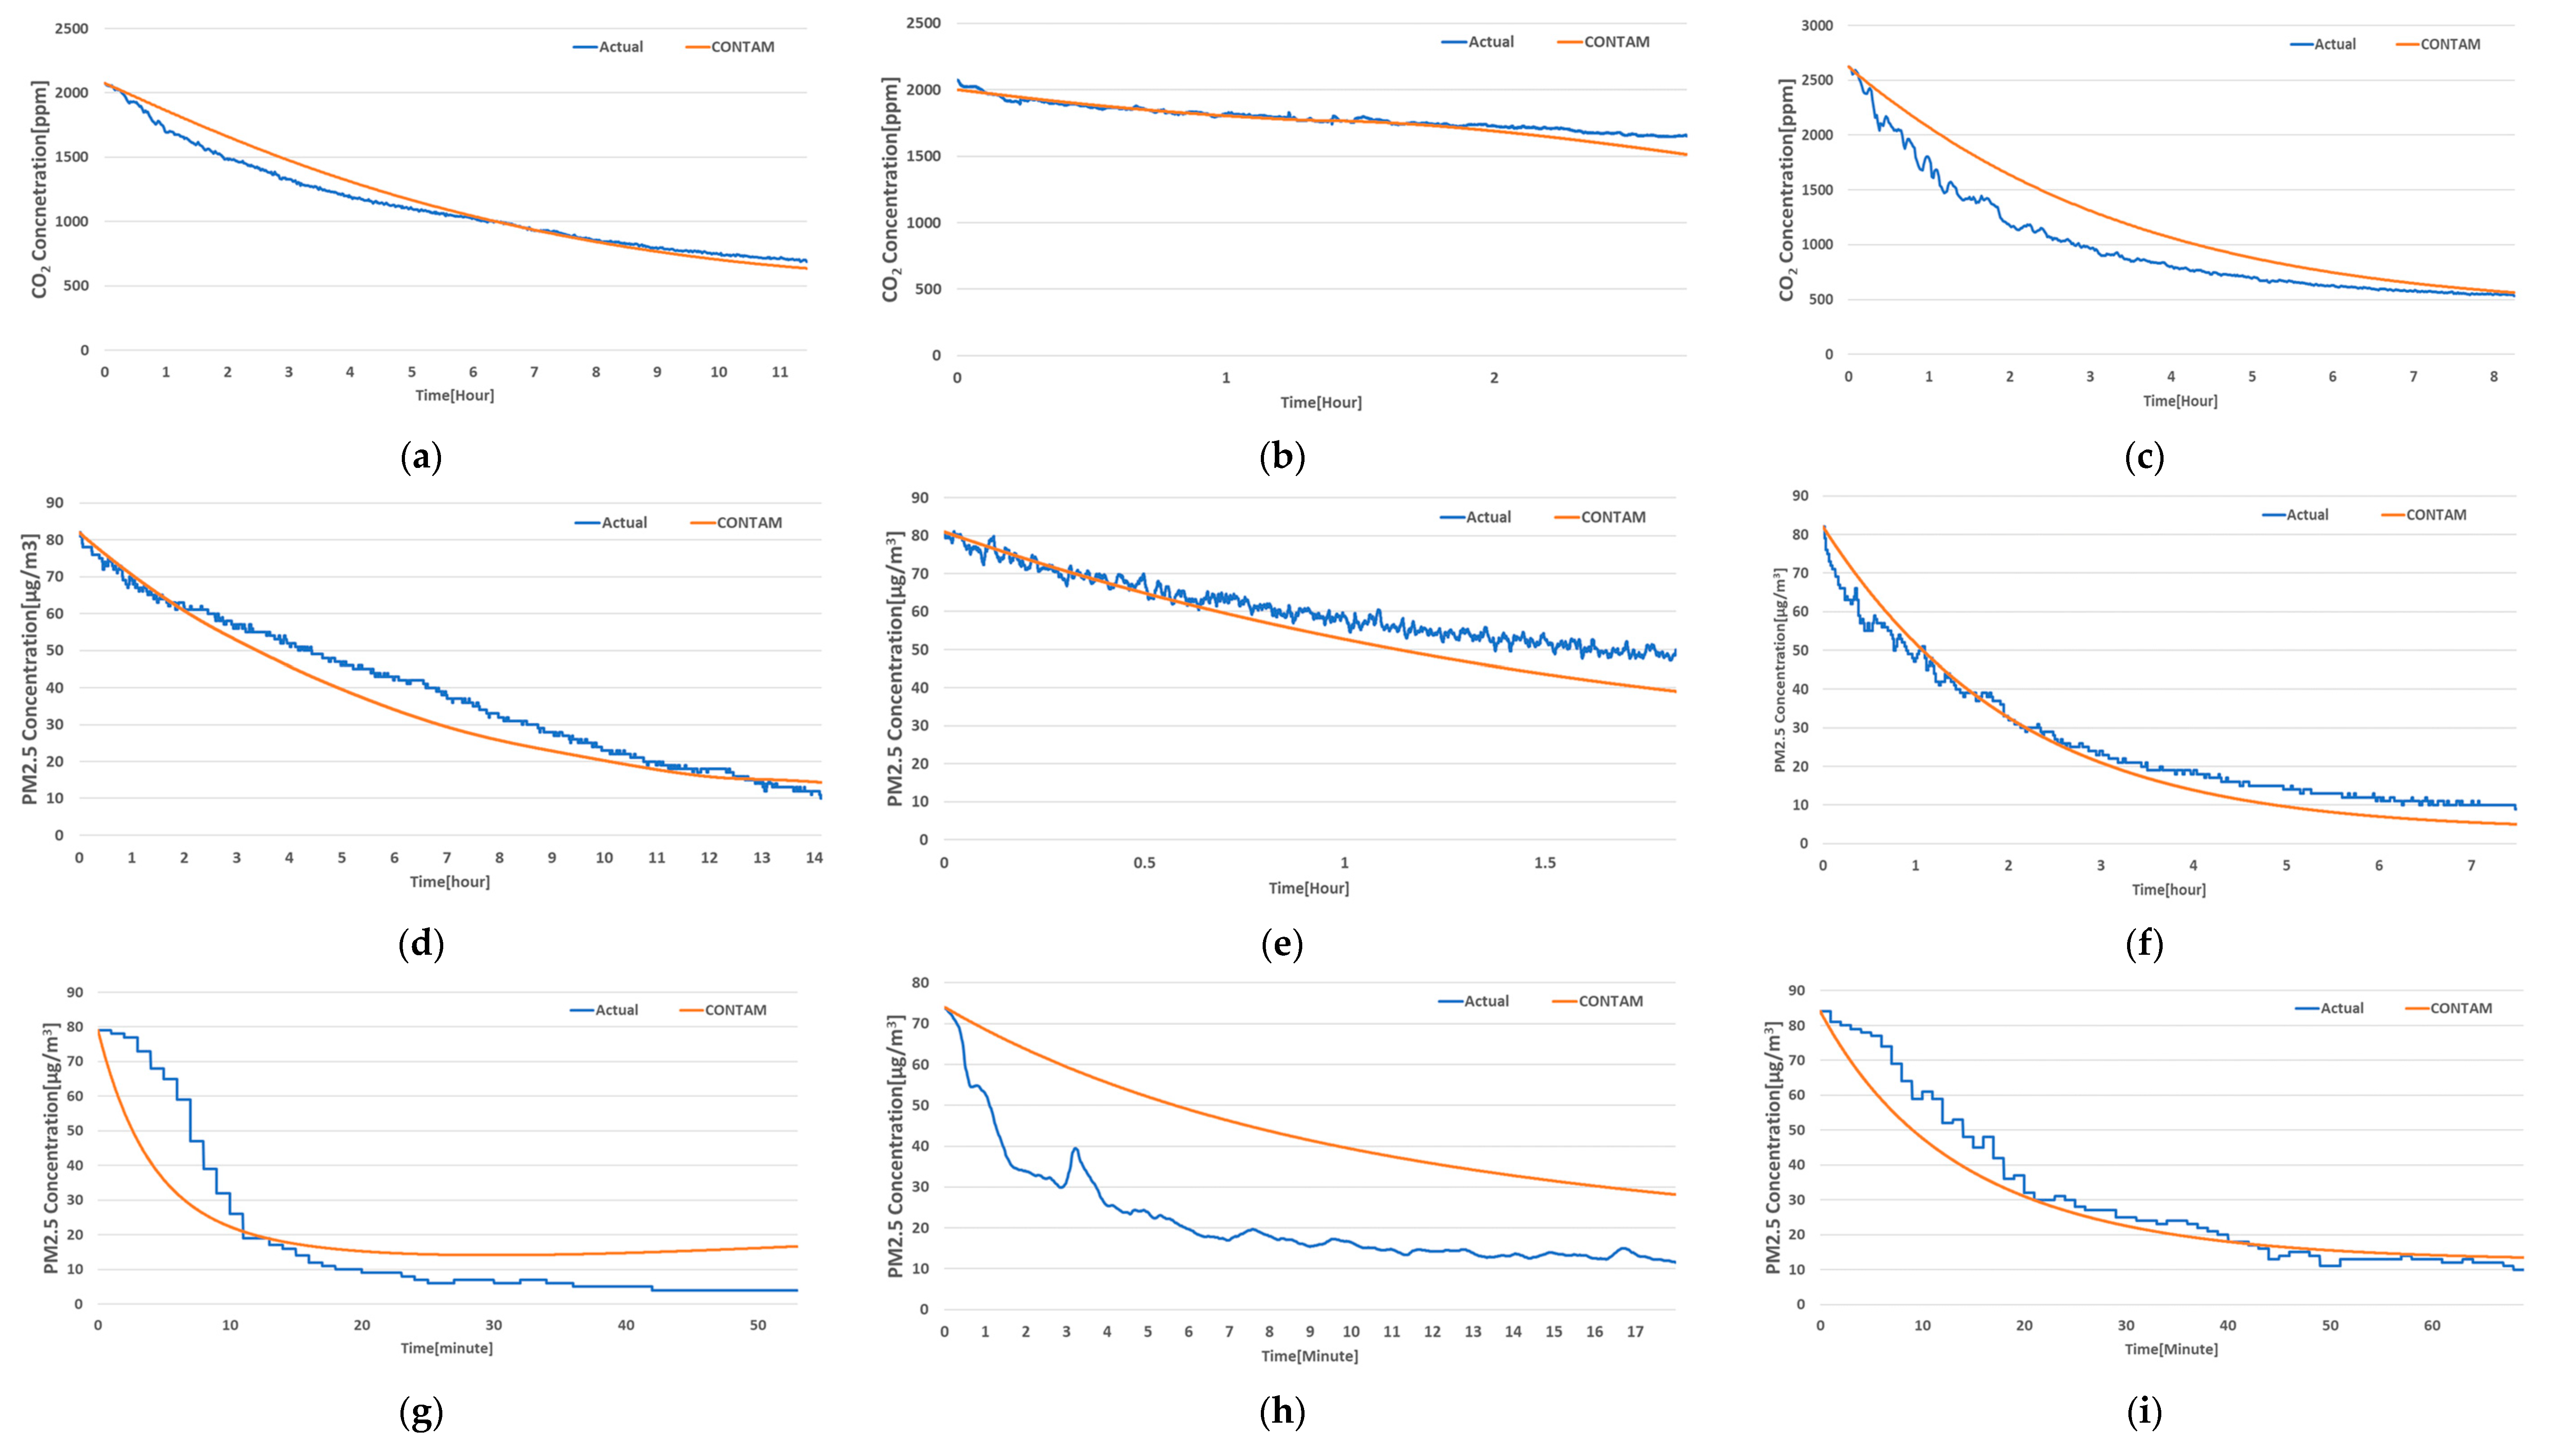
To verify the credibility of the calibrated base models, the PM2.5 and CO2 CONTAM profiles were compared with the measurements under the scenarios of (i) decay of CO2 and PM2.5 when all the windows and doors were closed and there was no mechanical ventilation; (ii) ERV in operation; (iii) AP in operation; (iv) natural ventilation by opening windows; and (v) cross-ventilation by opening both windows and doors. As listed in Table 8, Table 9 and Table 10, the credibility was assessed with the accuracy criteria (r, a, b, NMSE) and bias criteria (FB, FS) [44] according to the ASTM D5157 standard guide [45]. Acceptable criteria were given as follows:
(i).
r (Correlation coefficient) ≥ 0.9;
(ii).
0.75 ≤ a (Regression slope) ≤ 1.25;
(iii).
b (Regression intercept) ≤ 0.25 × Average concentration;
(iv).
NMSE (Normalized mean square error) ≤ 0.25;
(v).
FB (Fractional bias) ≤ 0.25;
(vi).
FS (Similar index of bias) ≤ 0.5;
As depicted in Figure 5, the calibrated CONTAM model of Case M showed better accuracy and precision between CONTAM results and measurements than the calibrated CONTAM models of Cases D and I, because Case M was relatively new and more airtight, and the measurement period was long enough to represent the airflow and contaminant transport behaviors. However, the PM2.5 and CO2 concentrations of the Case I CONTAM result was slightly lower than the actual measurement perhaps due to the shorter measurement period.
In all three cases, CONTAM resulted in consistent and coinciding profiles with the measurement under ERV and AP operation scenarios compared to natural ventilation scenarios. It seemed to be because (i) natural ventilation is sensitively affected by the variability of the outdoor environment, such as wind direction, wind pressure, and buoyancy due to temperature differences and (ii) the natural ventilation measurements were conducted over a shorter time (e.g., ≤15 min for cross-ventilation, ≤20 min for many window and door open measurements). On the other hand, mechanical ventilation scenarios were tested within a closed enclosure with the least disturbance, and the flowrate, flow direction, and pressure difference of the discharged flows of ERV and AP were comparatively stable.
Except for the natural ventilation scenarios that inherently contained sporadic uncertainty, and the PM2.5 and CO2 decay scenarios of Case I in shorter measurement, the calibrated CONTAM base models resulted in PM2.5 and CO2 profiles that were relatively consistent with the measurement, according to the ASTM D5157 criteria.

3.3. Annual PM2.5 I/O Ratio by Building Retrofit, Ventilation, and Filtration Measures

Annual assessments resulted from building retrofit measures, including window and door replacements and more airtight enclosures (Table 3), mechanical ventilation, filtration measures including ERV and AP (Table 4), and natural ventilation (Table 5) were performed on CONTAM baselines.
It should be noted that because the CONTAM baselines should run up to a year of the simulation period, the outdoor weather and contaminant profiles of the CONTAM base models and their classroom schedules should also be extended to the same timeframe while keeping other variables the same. Outdoor weather data was replaced with the year 2020 weather data published by the Korea Meteorological Administration [46] (including temperature, wind direction, wind speed, pressure) and the hourly average PM2.5 and CO2 concentrations of Seoul for the last 3 years. To assign real operation conditions to the CONTAM baselines, eight operation seasons were defined according to the outdoor temperature range and typical school calendar, as listed in Table 11. Note that per the enforced demand reduction policy, heating was only available for the Spring#1 and Fall#3 seasons, while cooling was only available for the Spring#3 and Fall#1 seasons. In addition, natural ventilation was available only for swing seasons such as Spring#2 and Fall#2.
Additionally, the baselines were assumed to have all the windows closed, but doors set to be constantly open during access hours, breaks, and lunchtimes, as they were in real classrooms. Also, they have neither existing ERVs (except for S2) nor existing APs.
The PM2.5 concentration of the classroom compared to the outdoor concentration (I/O ratio in Equation (2) was calculated every 10 min during the class hours of the semester (9 a.m.–3 p.m. of two semesters equals 1030 h/year). In the case of natural ventilation, the annual PM2.5 I/O ratio was calculated for the 43 h out of the 1030 class hours, which was only when the outdoor PM2.5 concentration and temperature met the predetermined conditions in swing seasons (Spring#2 and Fall#2).
I / O r a t i o = C P M 2.5 _ c l a s s r o o m C P M 2.5 _ o u t d o o r
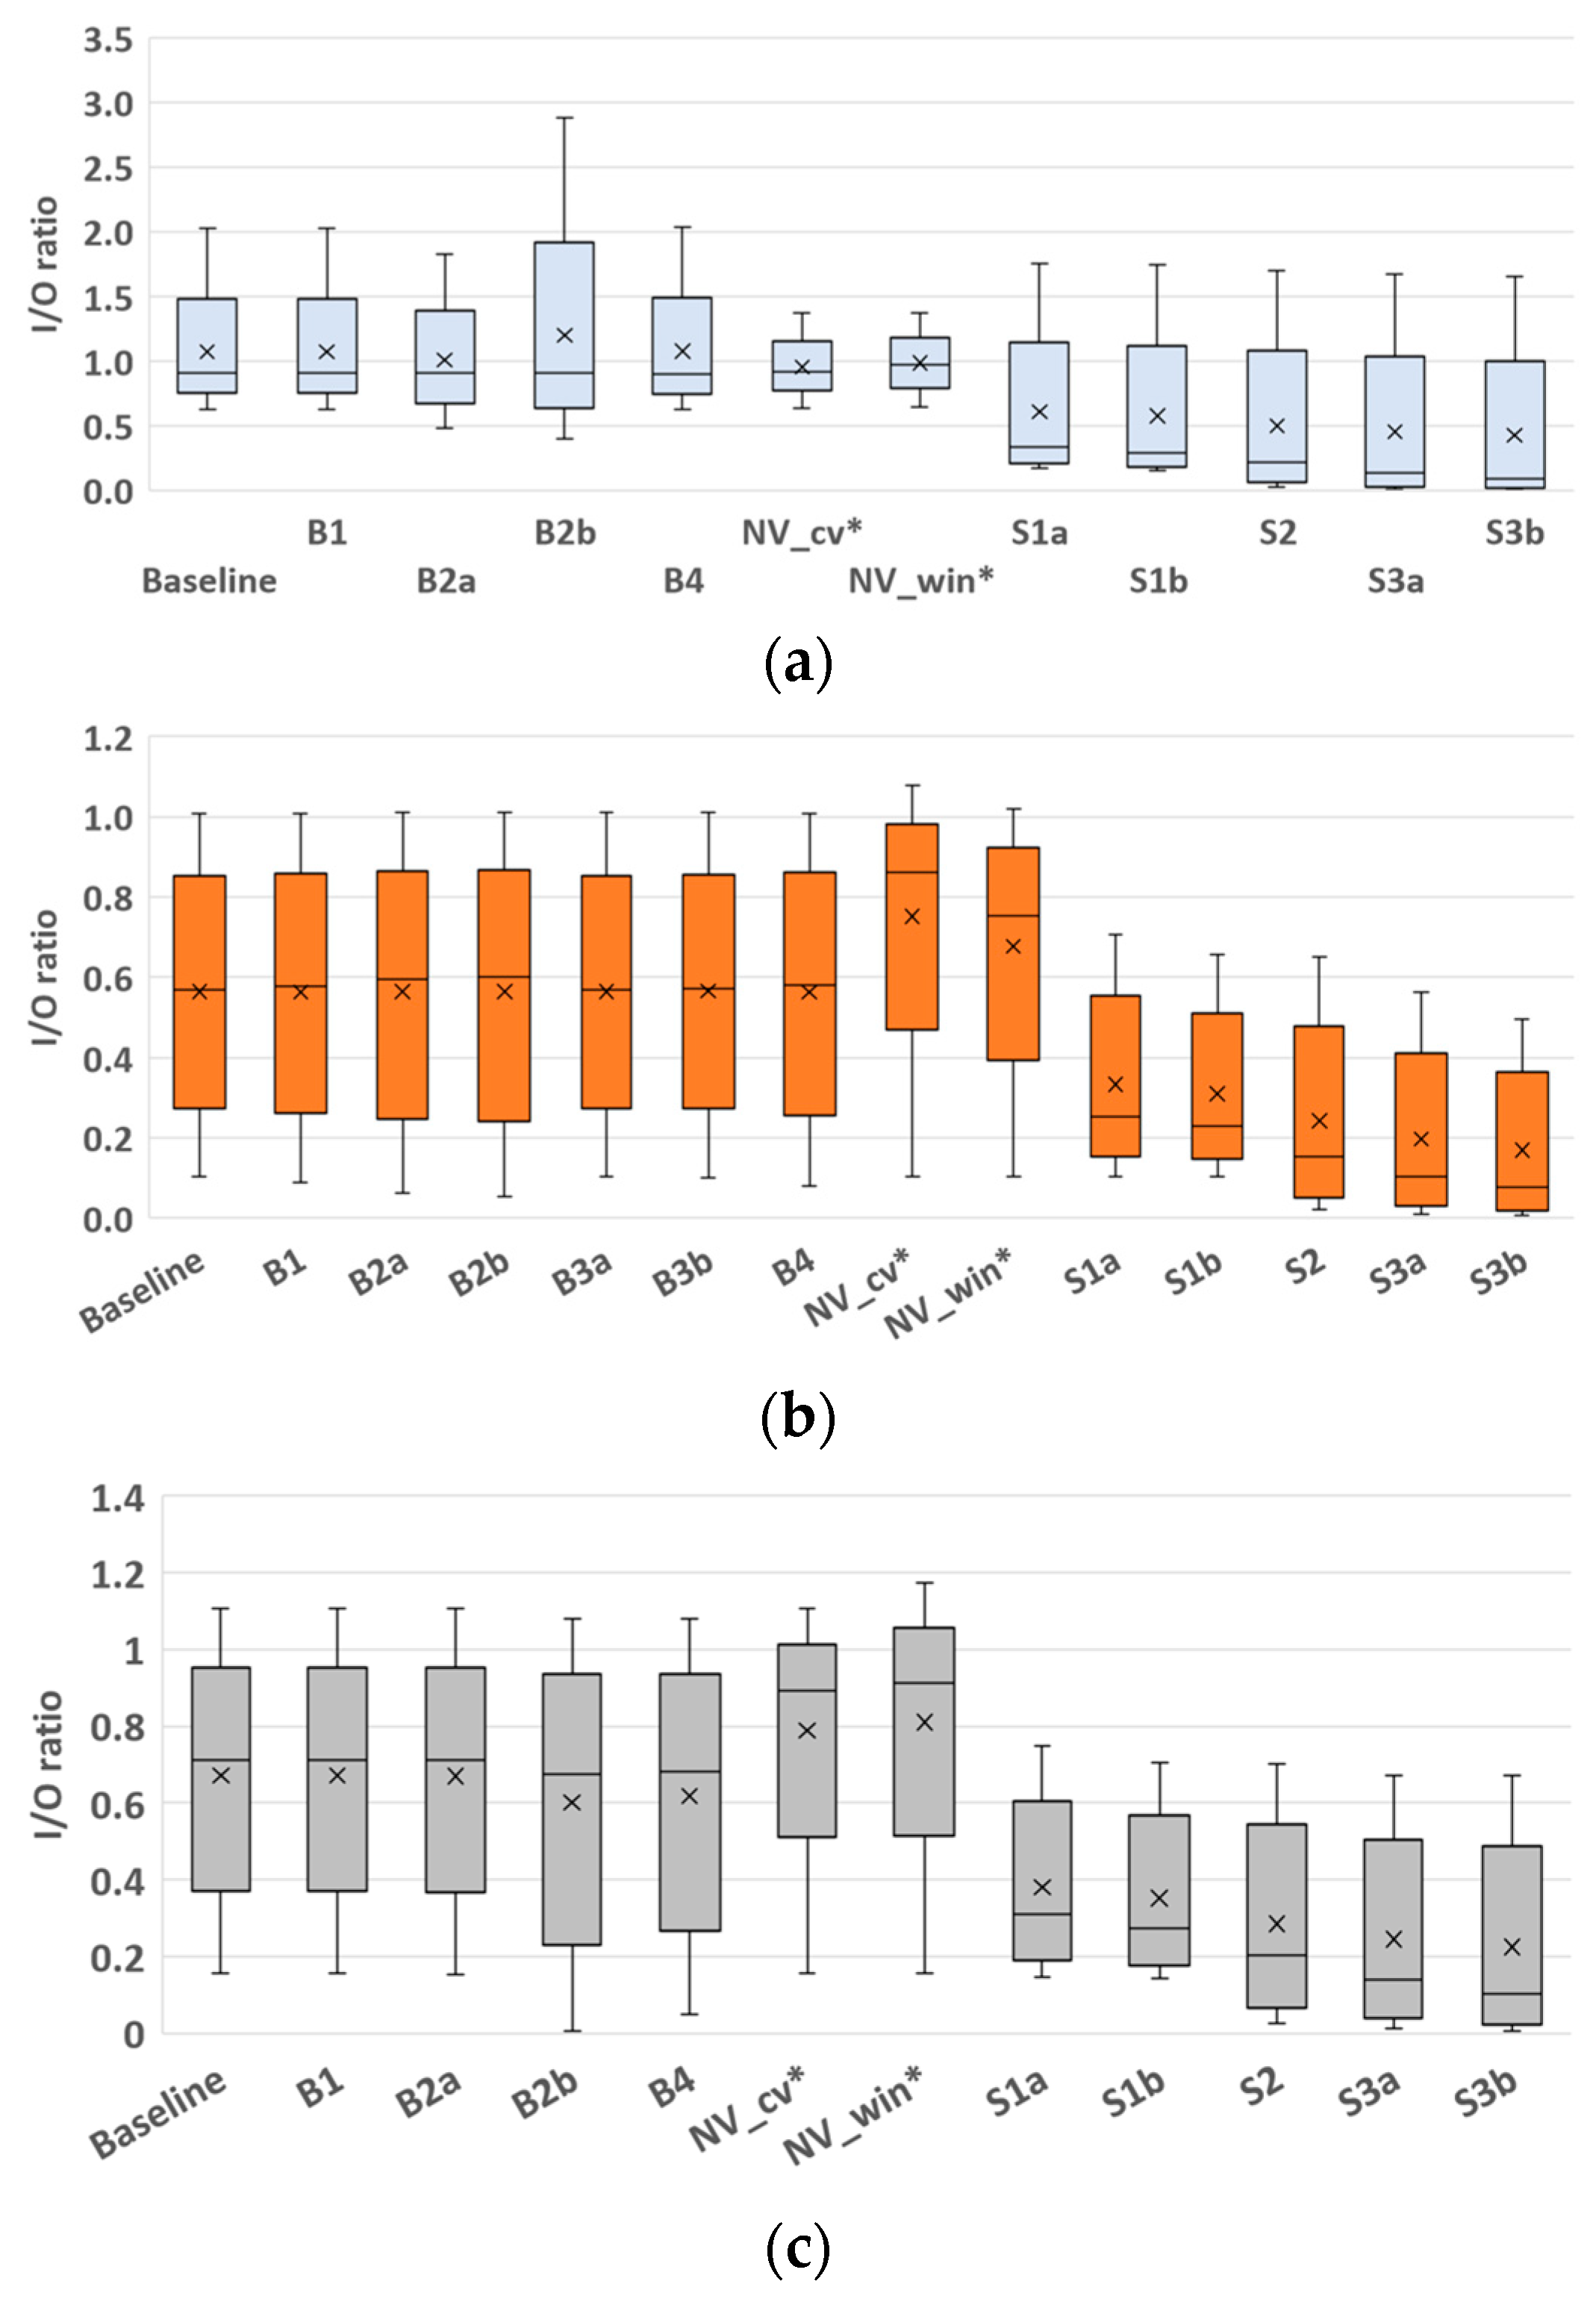
As shown in Figure 6, when building retrofit measures (B1–B4) were applied, there was no significant variation in the mean or median in any of the three cases and no significant change in the annual I/O ratio compared to the baselines. It seemed that ambient contaminants in the hallways entered the classroom when classroom doors were left open during access hours, breaks, and lunchtimes. However, without mechanical/natural ventilation or filtration intentionally in operation during class hours, the inflowed PM2.5 did not naturally flow out from classroom; thus, the classroom PM2.5 concentration during class hardly dropped. In this respect, even if the classroom windows or doors were replaced with first-grade airtight products (B1, B2, B3) and the airtightness of the whole classroom enclosure was enhanced by sealing the gaps and cracks (B4), such building retrofit measures may not be so effective in decreasing the “already-high” PM2.5 concentration in the classroom.
In contrast, when mechanical ventilation and filtration were operated using ERV and AP (S1, S2, S3), there was an apparent decrease in the mean and median by 0.3–0.5, and the min approached 0. That is, mechanical ventilation and filtration significantly shifted down the annual I/O ratio compared to the baseline. The low-shifted I/O ratio distribution indicated that the already-high concentration of classroom PM2.5 due to the frequently opened doors can effectively decrease by diluting and/or removing the indoor contaminant using ERV and/or AP. Moreover, as the supply air volume increased and the filter efficiency was higher, the annual I/O ratio meaningfully decreased.
When natural ventilation was introduced (Nwin, Ncv) instead of mechanical ventilation on a day when the daily average outdoor PM2.5 was lower than 35 μ/m3, the classroom PM2.5 concentration was similar to or lower than the outdoor PM2.5 concentration during most of the class hours (PM2.5 I/O ratio ≤ 1). These results indicated that although the annual I/O ratio by natural ventilation looked higher than the baseline, the classroom PM2.5 concentration during class was still lower than 35 μ/m3.

3.4. Daily PM2.5 and CO2 Profiles by Building Retrofit, Ventilation, and Filtration Measures in the Worst-Case Situation

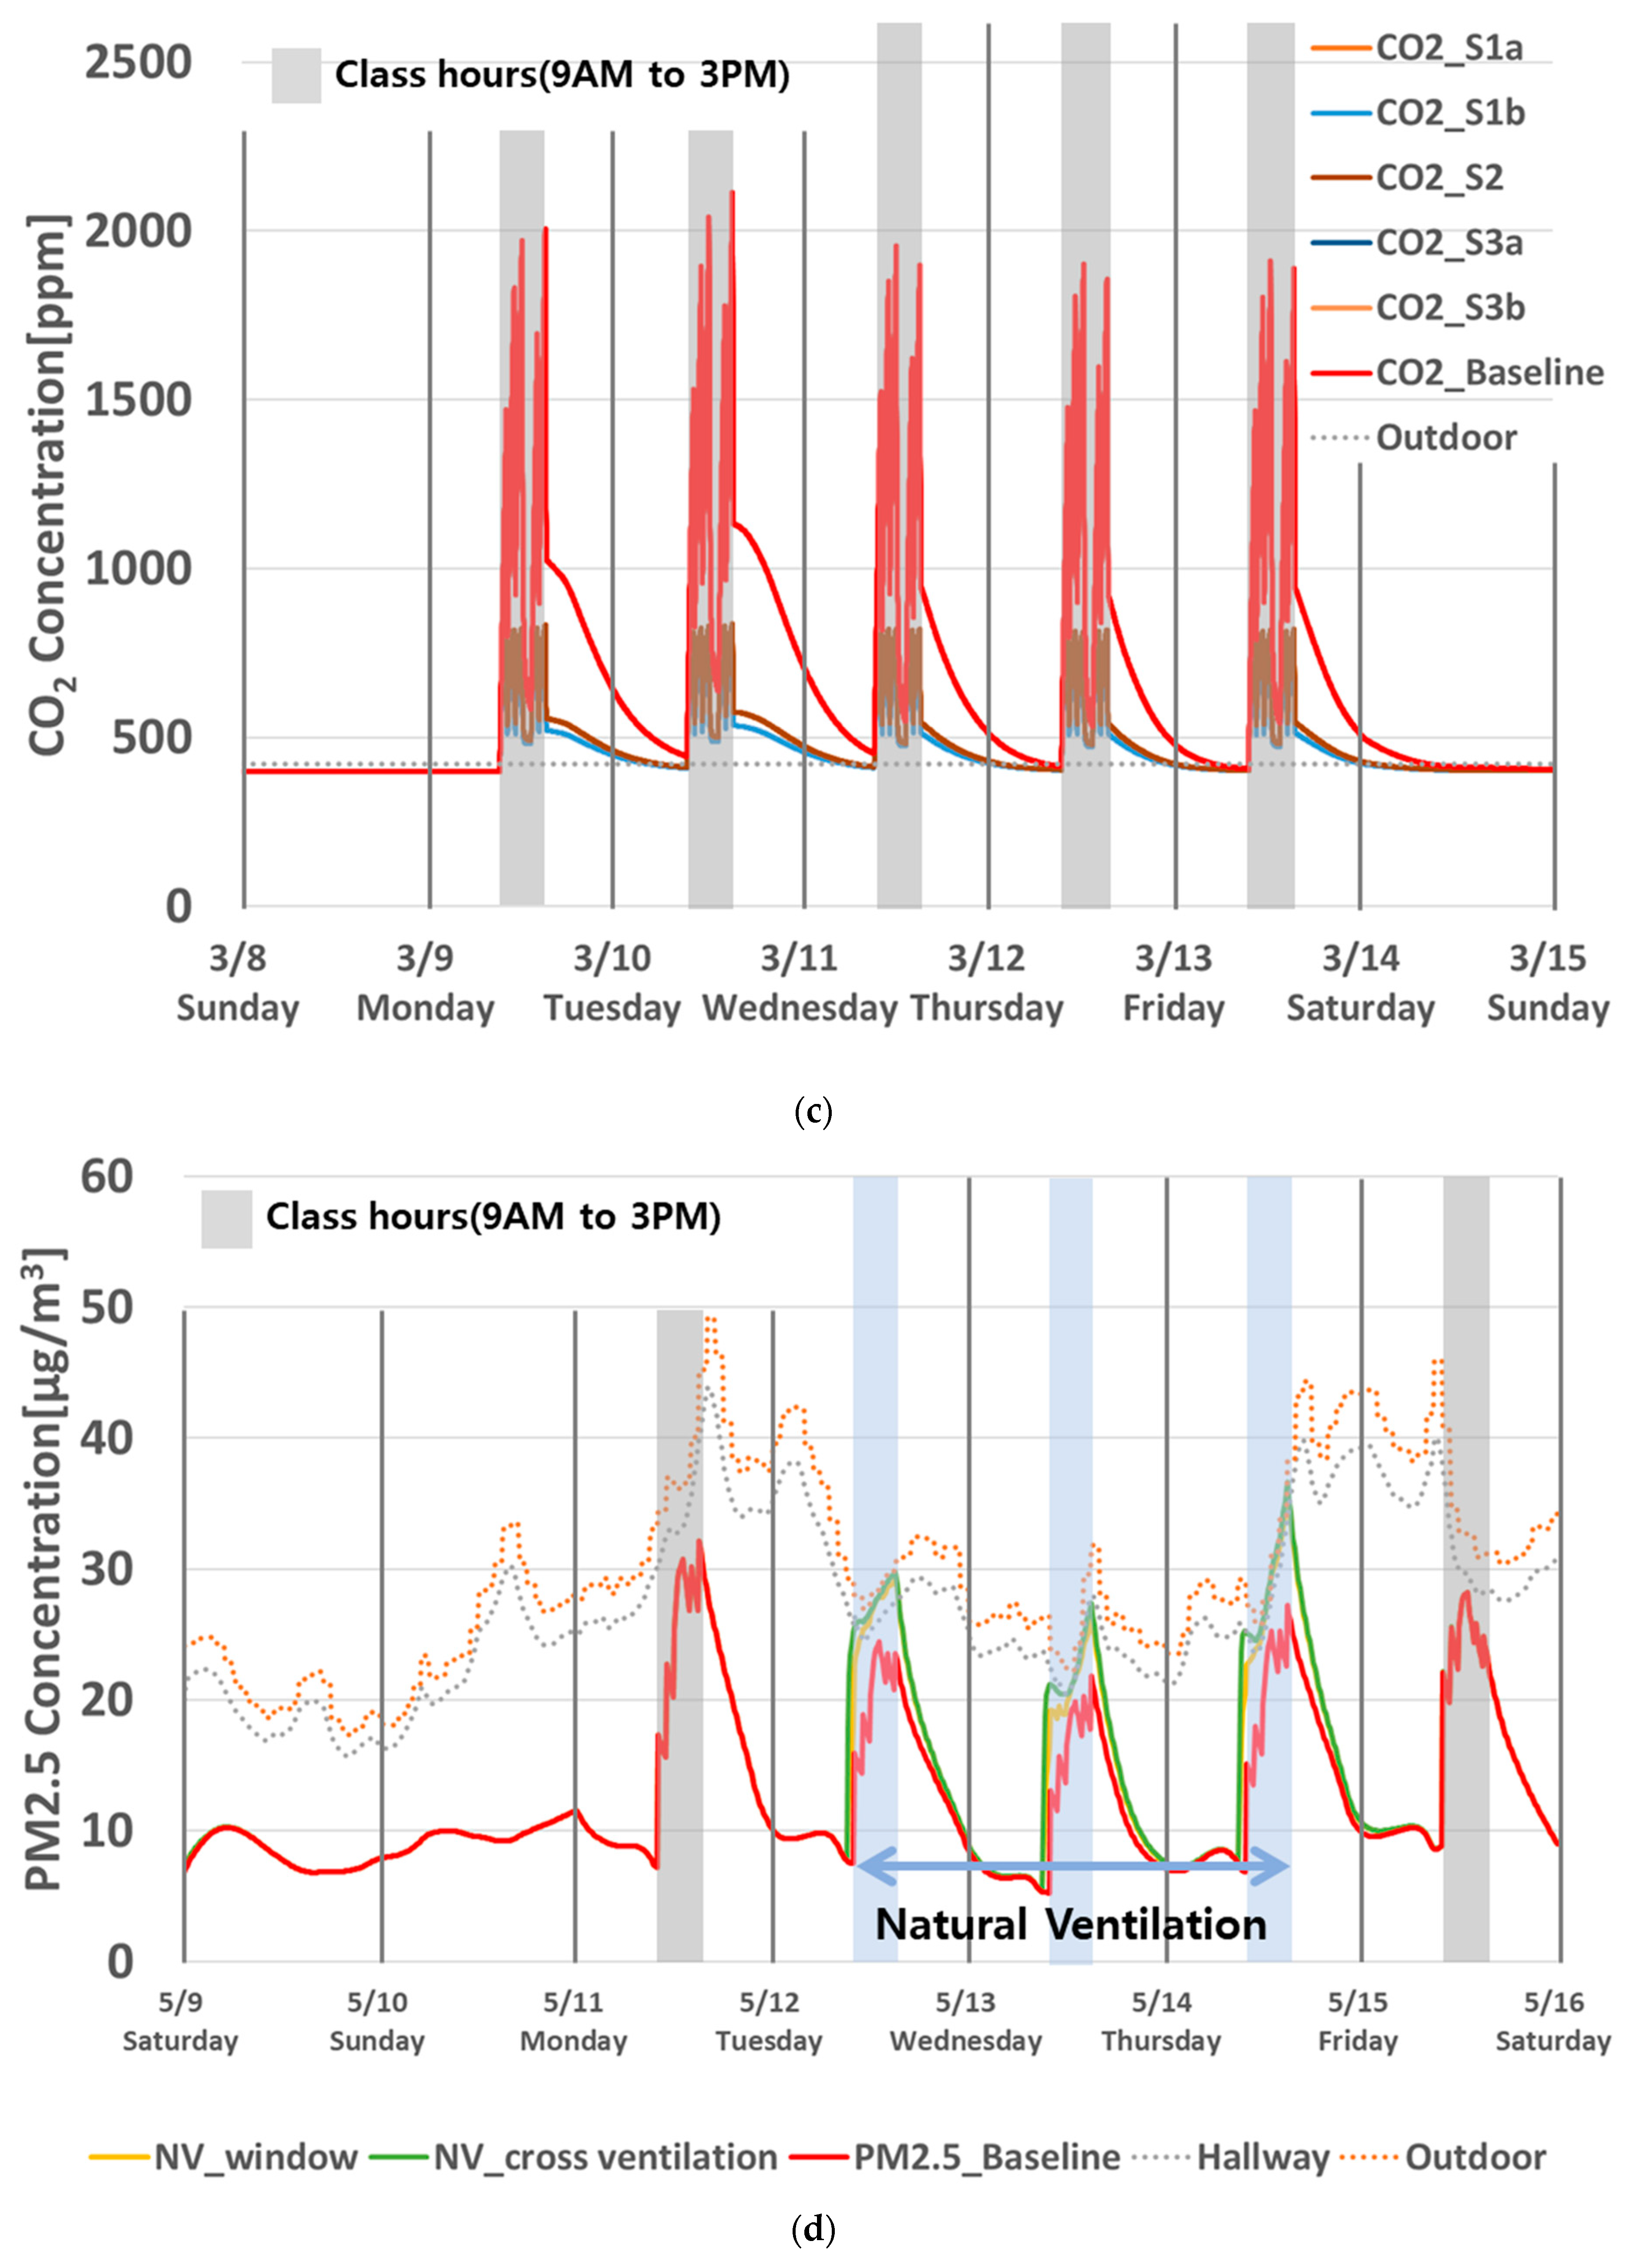
In addition to the annual PM2.5 I/O ratio, this study also analyzed daily PM2.5 and CO2 profiles using the same building and system measures (Table 3 and Table 4) from March 8 to 14 when the peak outdoor PM2.5 concentrations through the year were observed.
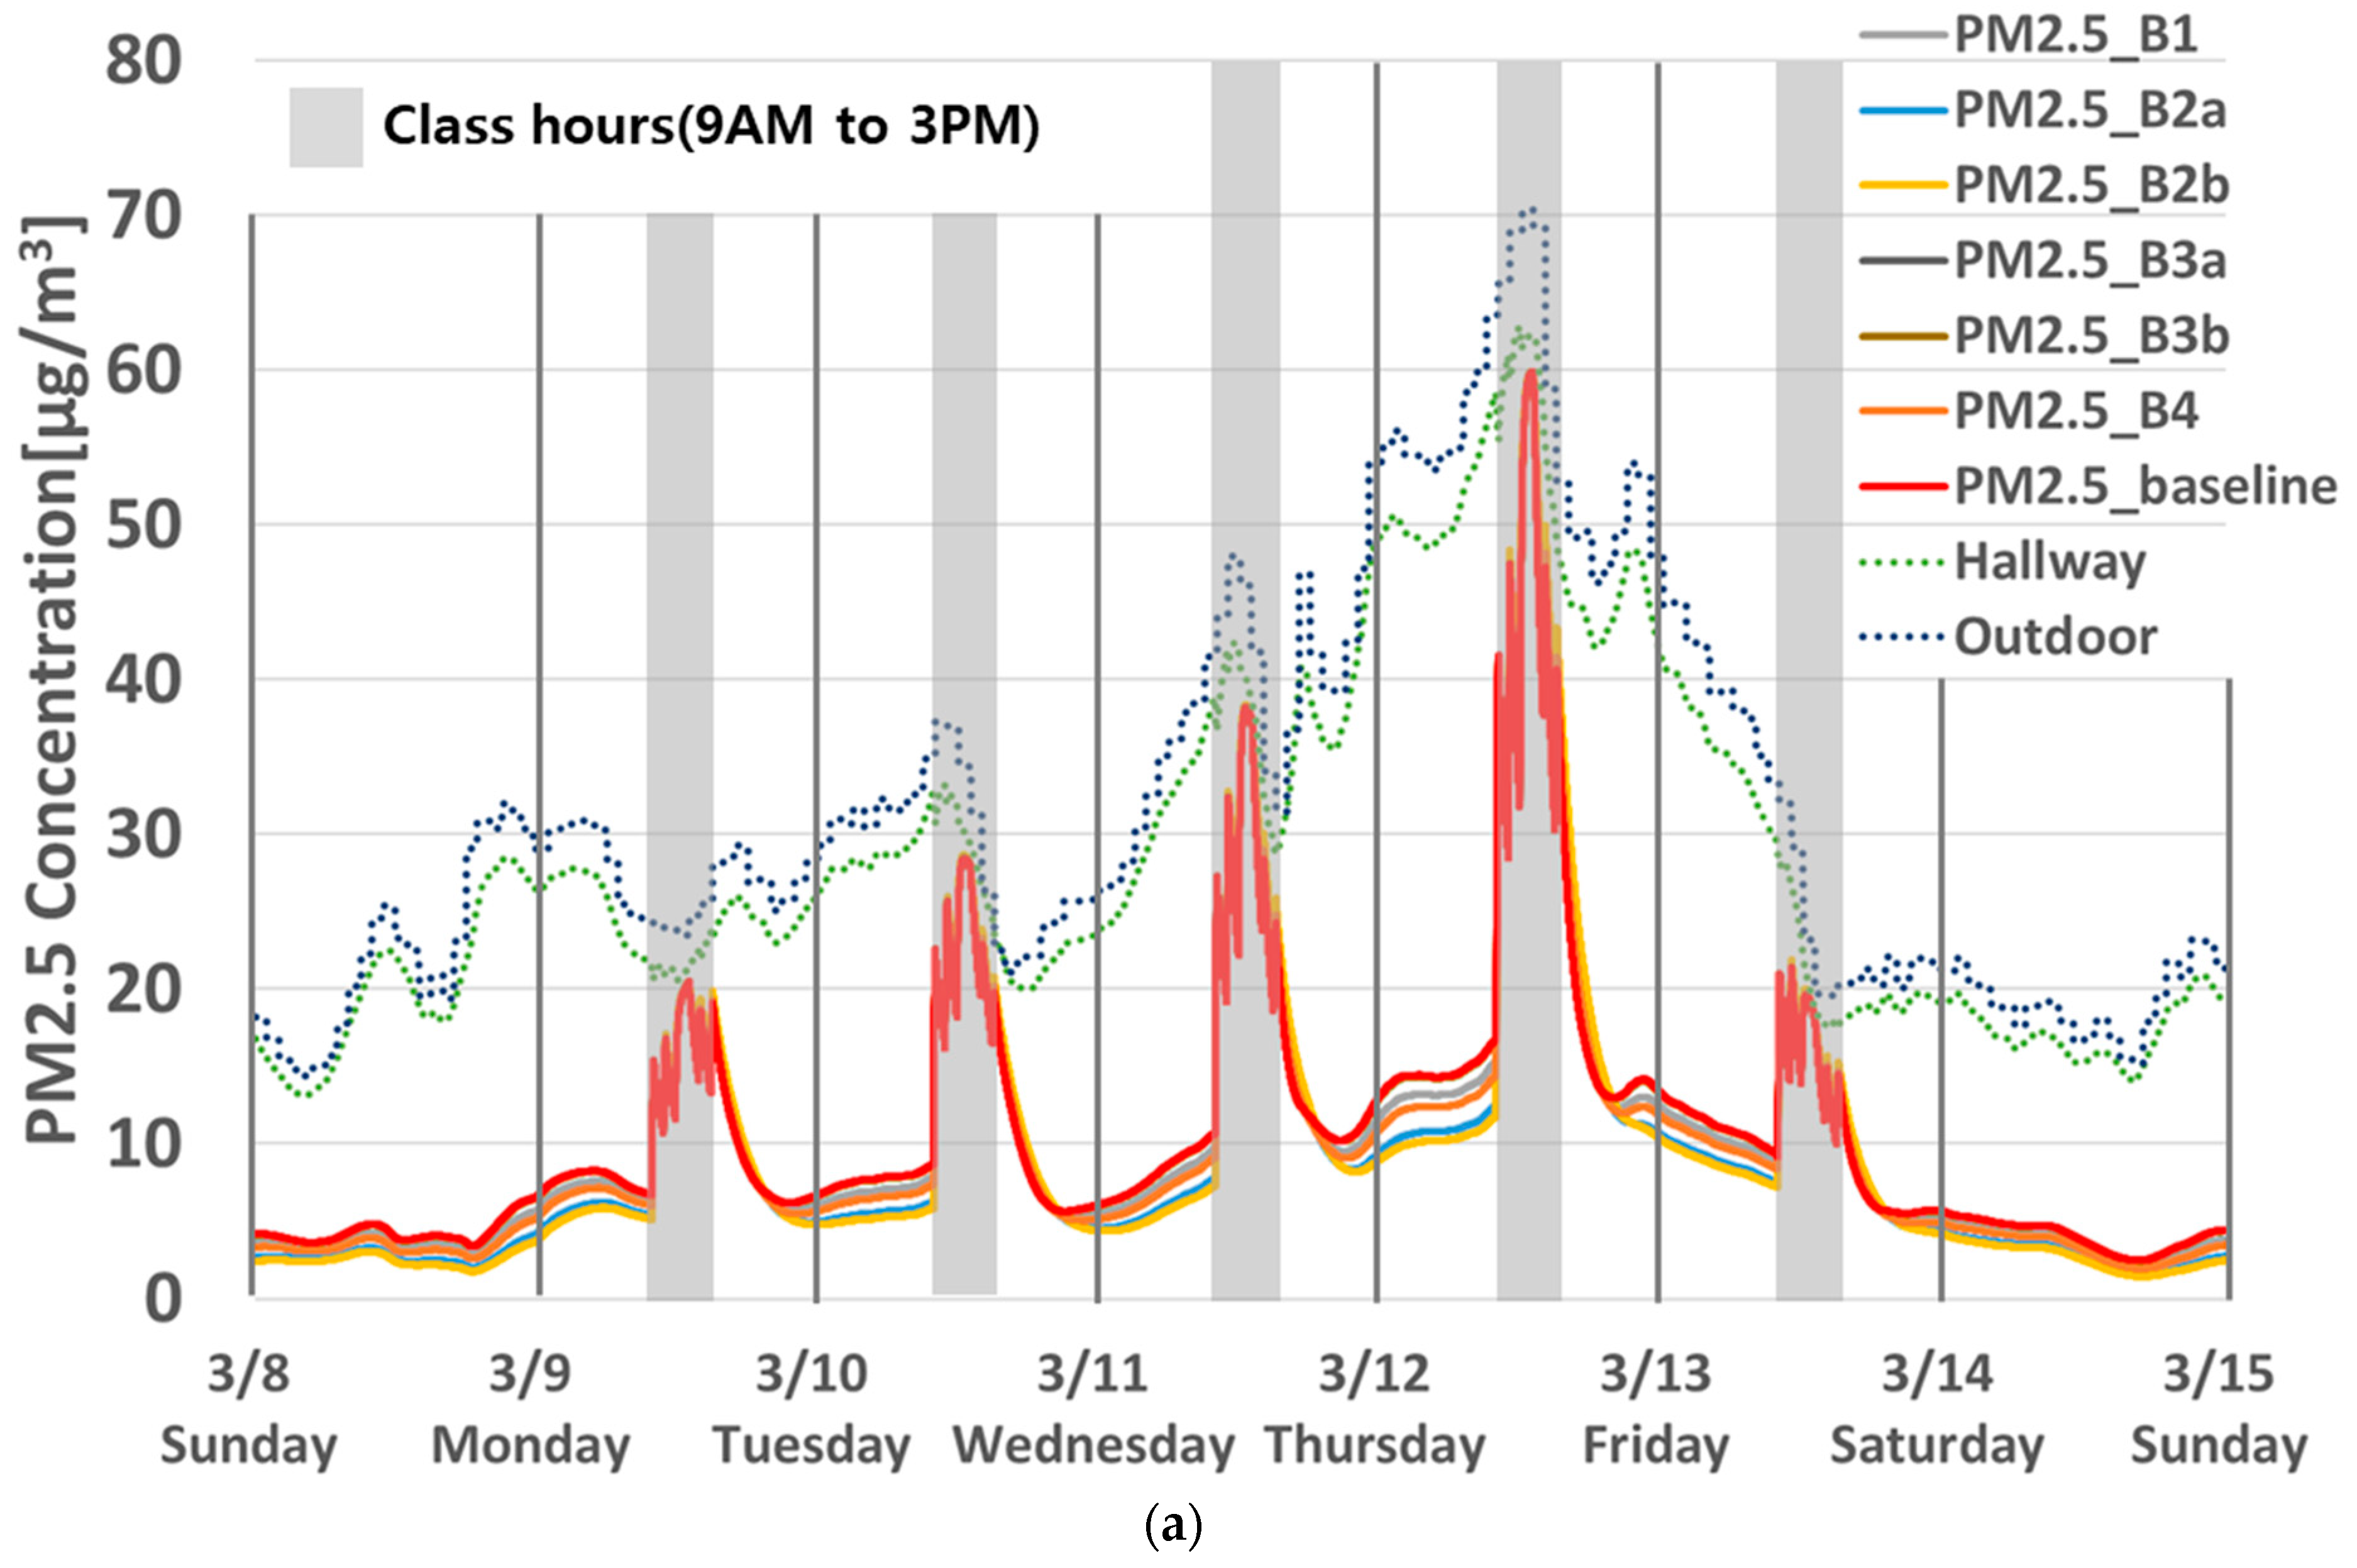
The hallway PM2.5 concentrations during the corresponding timeframe synchronized with the outdoor PM2.5 concentrations with some offsets (Figure A1a,b, Figure A2a,b and Figure A3a,b); on 12 March, when the maximum outdoor PM2.5 concentration approached 70 μ/m3, the maximum hallway PM2.5 concentration approached 65 μ/m3. Consequently, in all cases, the classroom PM2.5 concentrations of the baselines approached the hallway concentrations whenever the classroom door was opened during occupied hours of the week. When the door was closed after class, the classroom PM2.5 concentrations started to move following the outdoor PM2.5 concentrations until the classroom door was reopened the next day, yet with some delays.
In Case D, the classroom PM2.5 concentration profiles did not significantly deviate from the baseline, even if the external windows were replaced with first-grade airtight windows (B1), the classroom doors were replaced with economy sliding doors (B2a), or the gaps and cracks of the classroom were sealed and thus infiltration and exfiltration were significantly reduced (B4) as depicted in Figure A1a. This is because an airflow path from the hallway to the classroom was formed when hallway windows and doors were kept open. Outdoor contaminants enter the hallway via hallway openings, then again enter the classroom via classroom doors, and finally leave the classroom via classroom windows and holes/gaps/cracks. Thereby, when the classroom doors were opened from time to time, a large mass of PM2.5 in the hallway flowed into the classroom, instantly increasing the classroom PM2.5 concentration. Even if the classroom door was closed shortly after, PM2.5 continued to flow in from the hallway via the door gap and then kept accumulating in the classroom while some of particles were discharged into the outdoors via gaps and cracks.
This reasoning became clearer when the existing classroom door was replaced with a first-grade airtight door (B2b), which somewhat weakened the synchronicity between the classroom concentration profile and hallway profile. When the first-grade airtight door decreased the infiltration and penetration from the hallway, the classroom PM2.5 concentration gradually increased after class even if the hallway PM2.5 concentration was suddenly high (March 11th after class). When the hallway PM2.5 concentration was suddenly low after class, the classroom PM2.5 concentration gradually decreased (12 March after class).
Interestingly, when the gaps and cracks of the classroom were sealed (B4), the PM2.5 inflows from the hallways tapered off accordingly. This is because when the contaminant discharge mass to the outdoors decreases due to the reduced exfiltration (due to sealed holes/gaps/cracks), the inflowing mass also decreases in proportion to the decreased discharge mass, i.e., mass balance. However, the decreased inflows of PM2.5 due to the decreased exfiltration could not stop the accumulation in the classroom. Therefore, replacing the classroom door with a first-grade airtight door (B2b) turned out be the best working measure to prevent or mitigate the inflow of PM2.5 from the hallways.
In Cases I and M (Figure A2a and Figure A3a), the classroom PM2.5 concentration of the baselines approached the hallway concentration whenever the classroom door was opened during class hours of the week, as in Case D. In both cases, replacing the classroom door with a first-grade airtight door (B2b) lowered the classroom PM2.5 concentration more than other building retrofit measures did. Specifically, in Case I, there was no significant change in the daily IAQ profile (Figure A1a) after replacing the existing hallway-side windows with a first-grade airtight door (B3b) because the existing windows were already quite airtight.
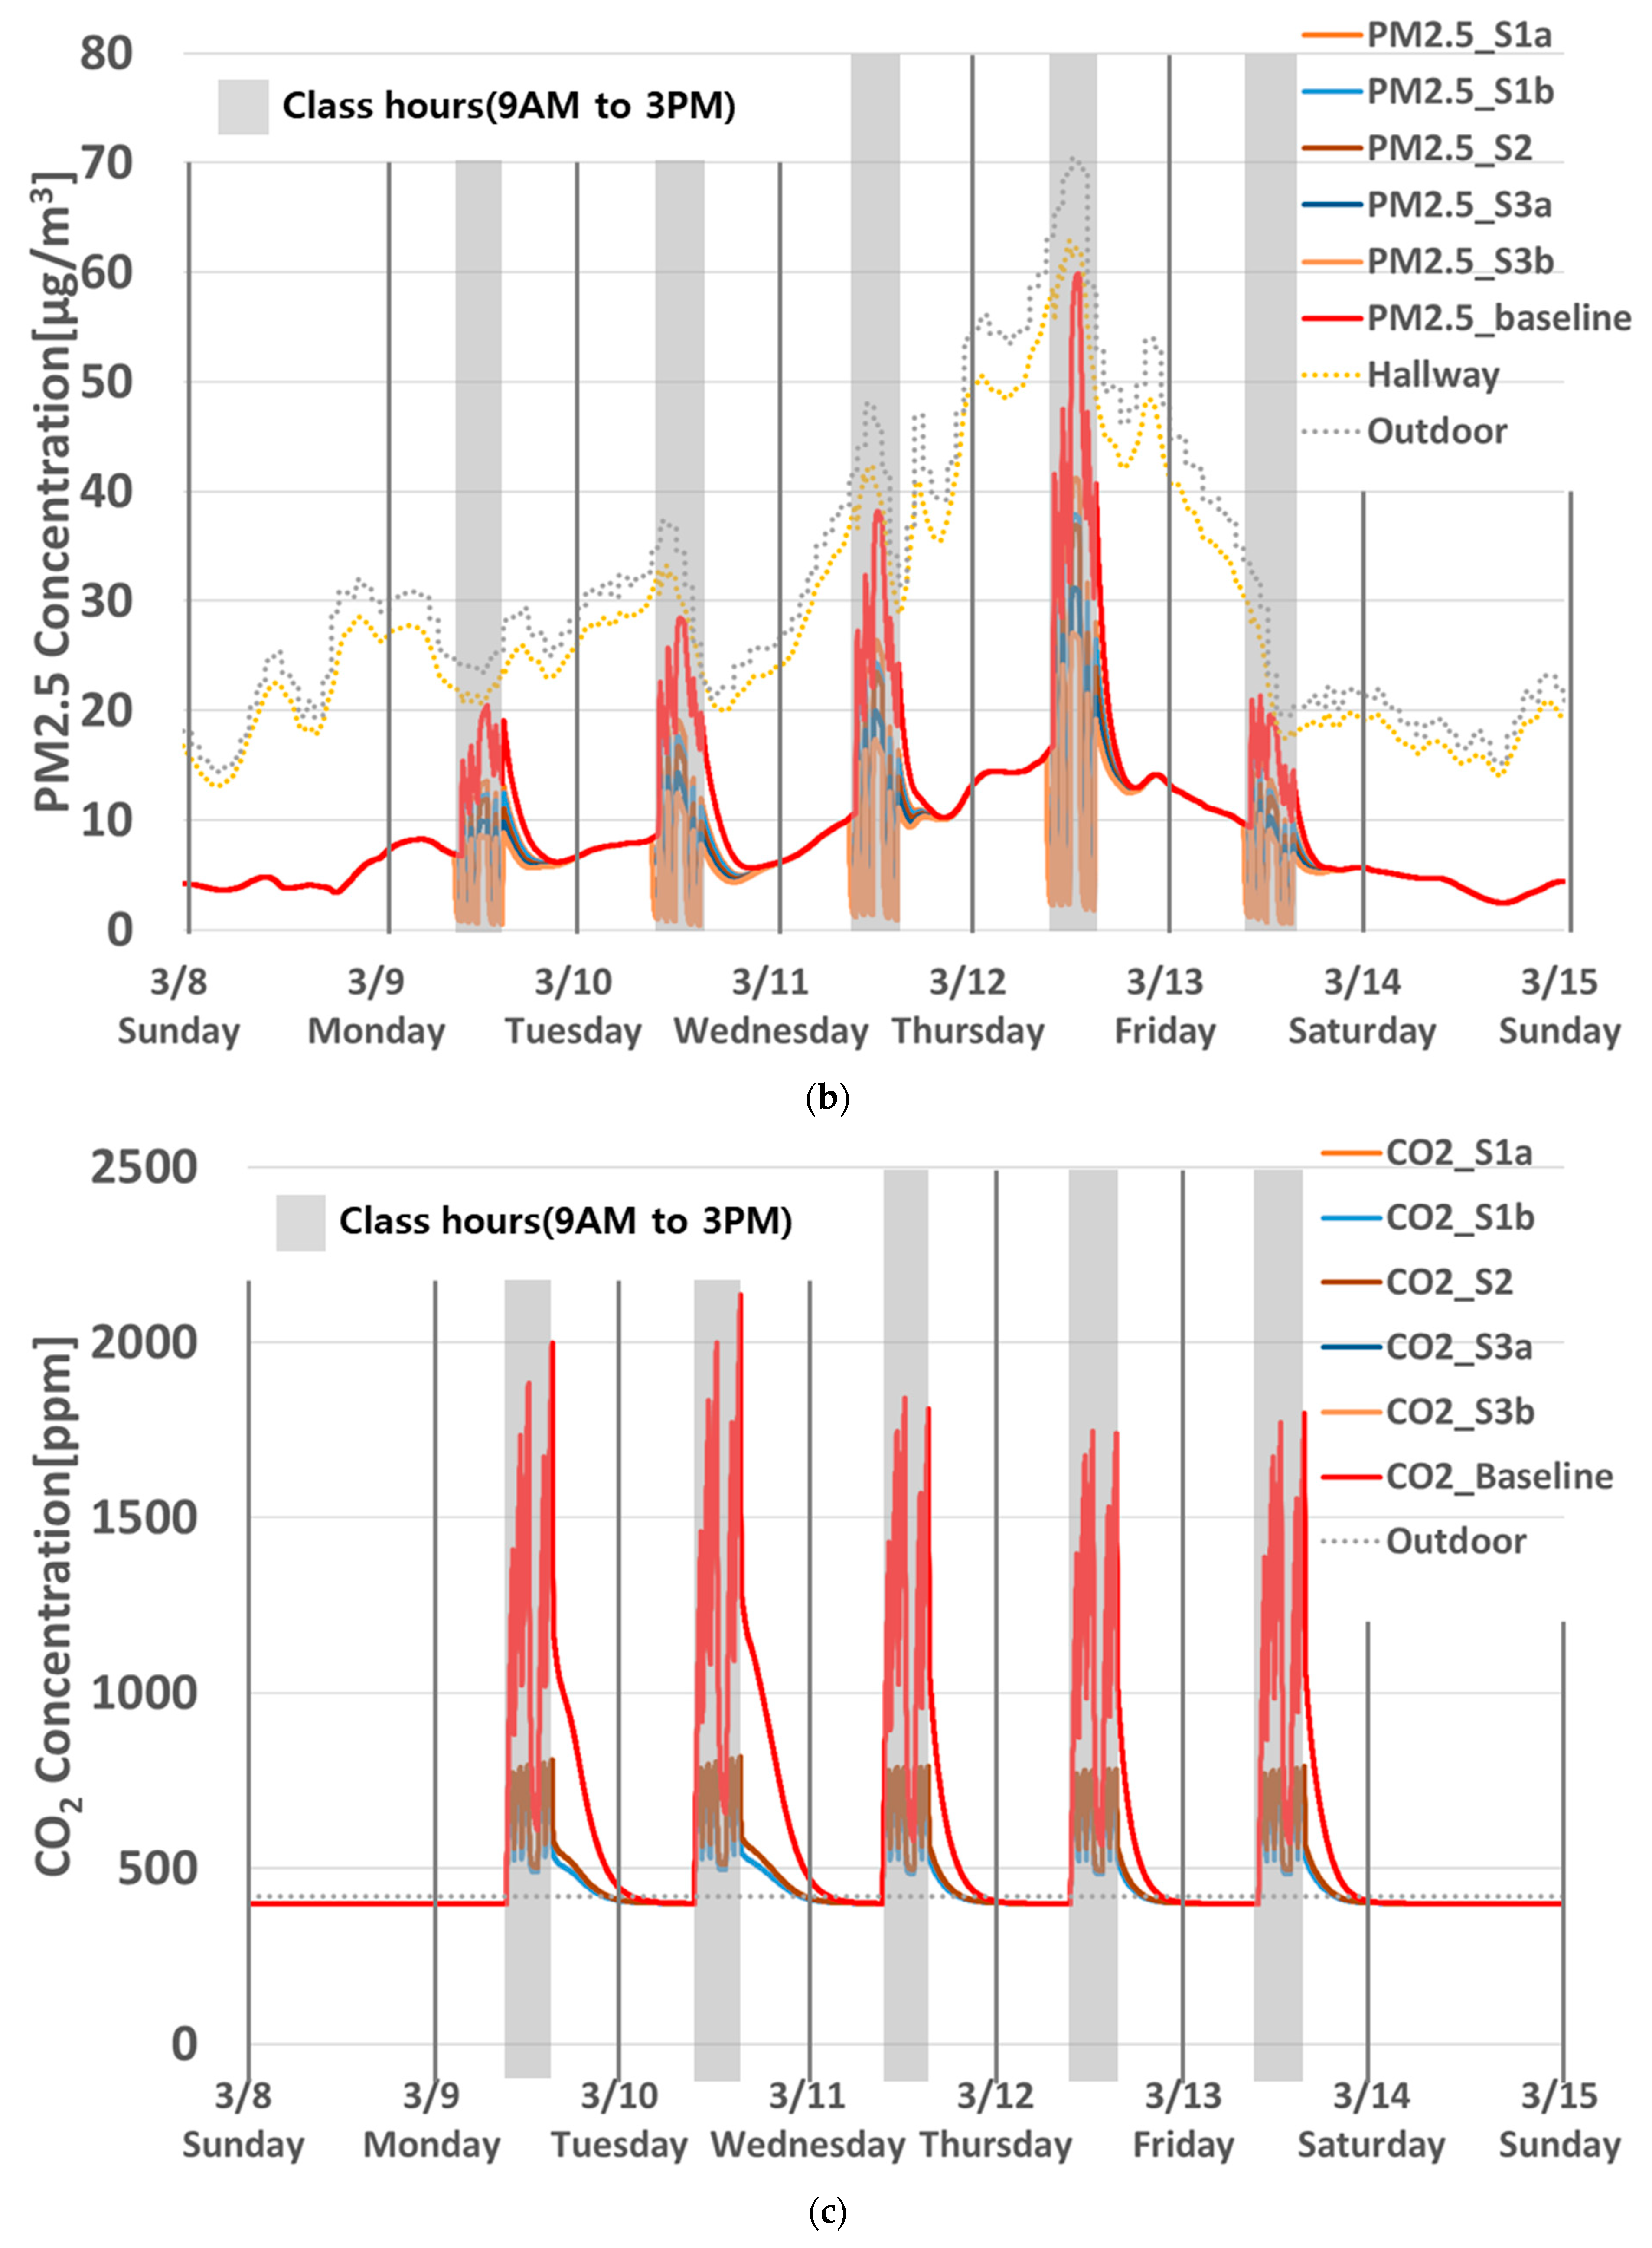
On the other hand, in all three cases, when the ERV or AP was operated (S1, S2, S3), the classroom PM2.5 concentration did not rise as much as the baseline during class even if the classroom door was opened every break time and lunchtime (Figure A1b, Figure A2b and Figure A3b). Moreover, it immediately decreased to quite a low level as soon as the door was closed. In particular, as the supply volume and the filter efficiency of ERV and AP increased (S1a→S1b, Baseline→S2, S3a→S3b), the classroom PM2.5 concentration during class decreased more promptly.
When investigating the CO2 profiles of the baselines (in which only VRFs were running for heating), there were apparent CO2 concentrations far higher than the 1000-ppm legal threshold [31], with the peaks sometimes hitting over 2000 ppm (baselines in Figure A1c, Figure A2c and Figure A3c). This was due to the CO2 emissions from occupants and the CO2 accumulation when they closed the door during class. However, when ERV was operated (S1, S2), the classroom CO2 concentration dropped to a significantly low level. As the supply volume of ERV increased (S1a→S1b), the classroom CO2 concentration dropped more quickly. However, a higher filter efficiency of ERV at the same supply volume did not result in any CO2 difference (Baseline→S2). AP did not result in any changes to the classroom CO2 profiles either (Baseline→S3, S3a→S3b) because filters of ERV and AP do not work on removing CO2.
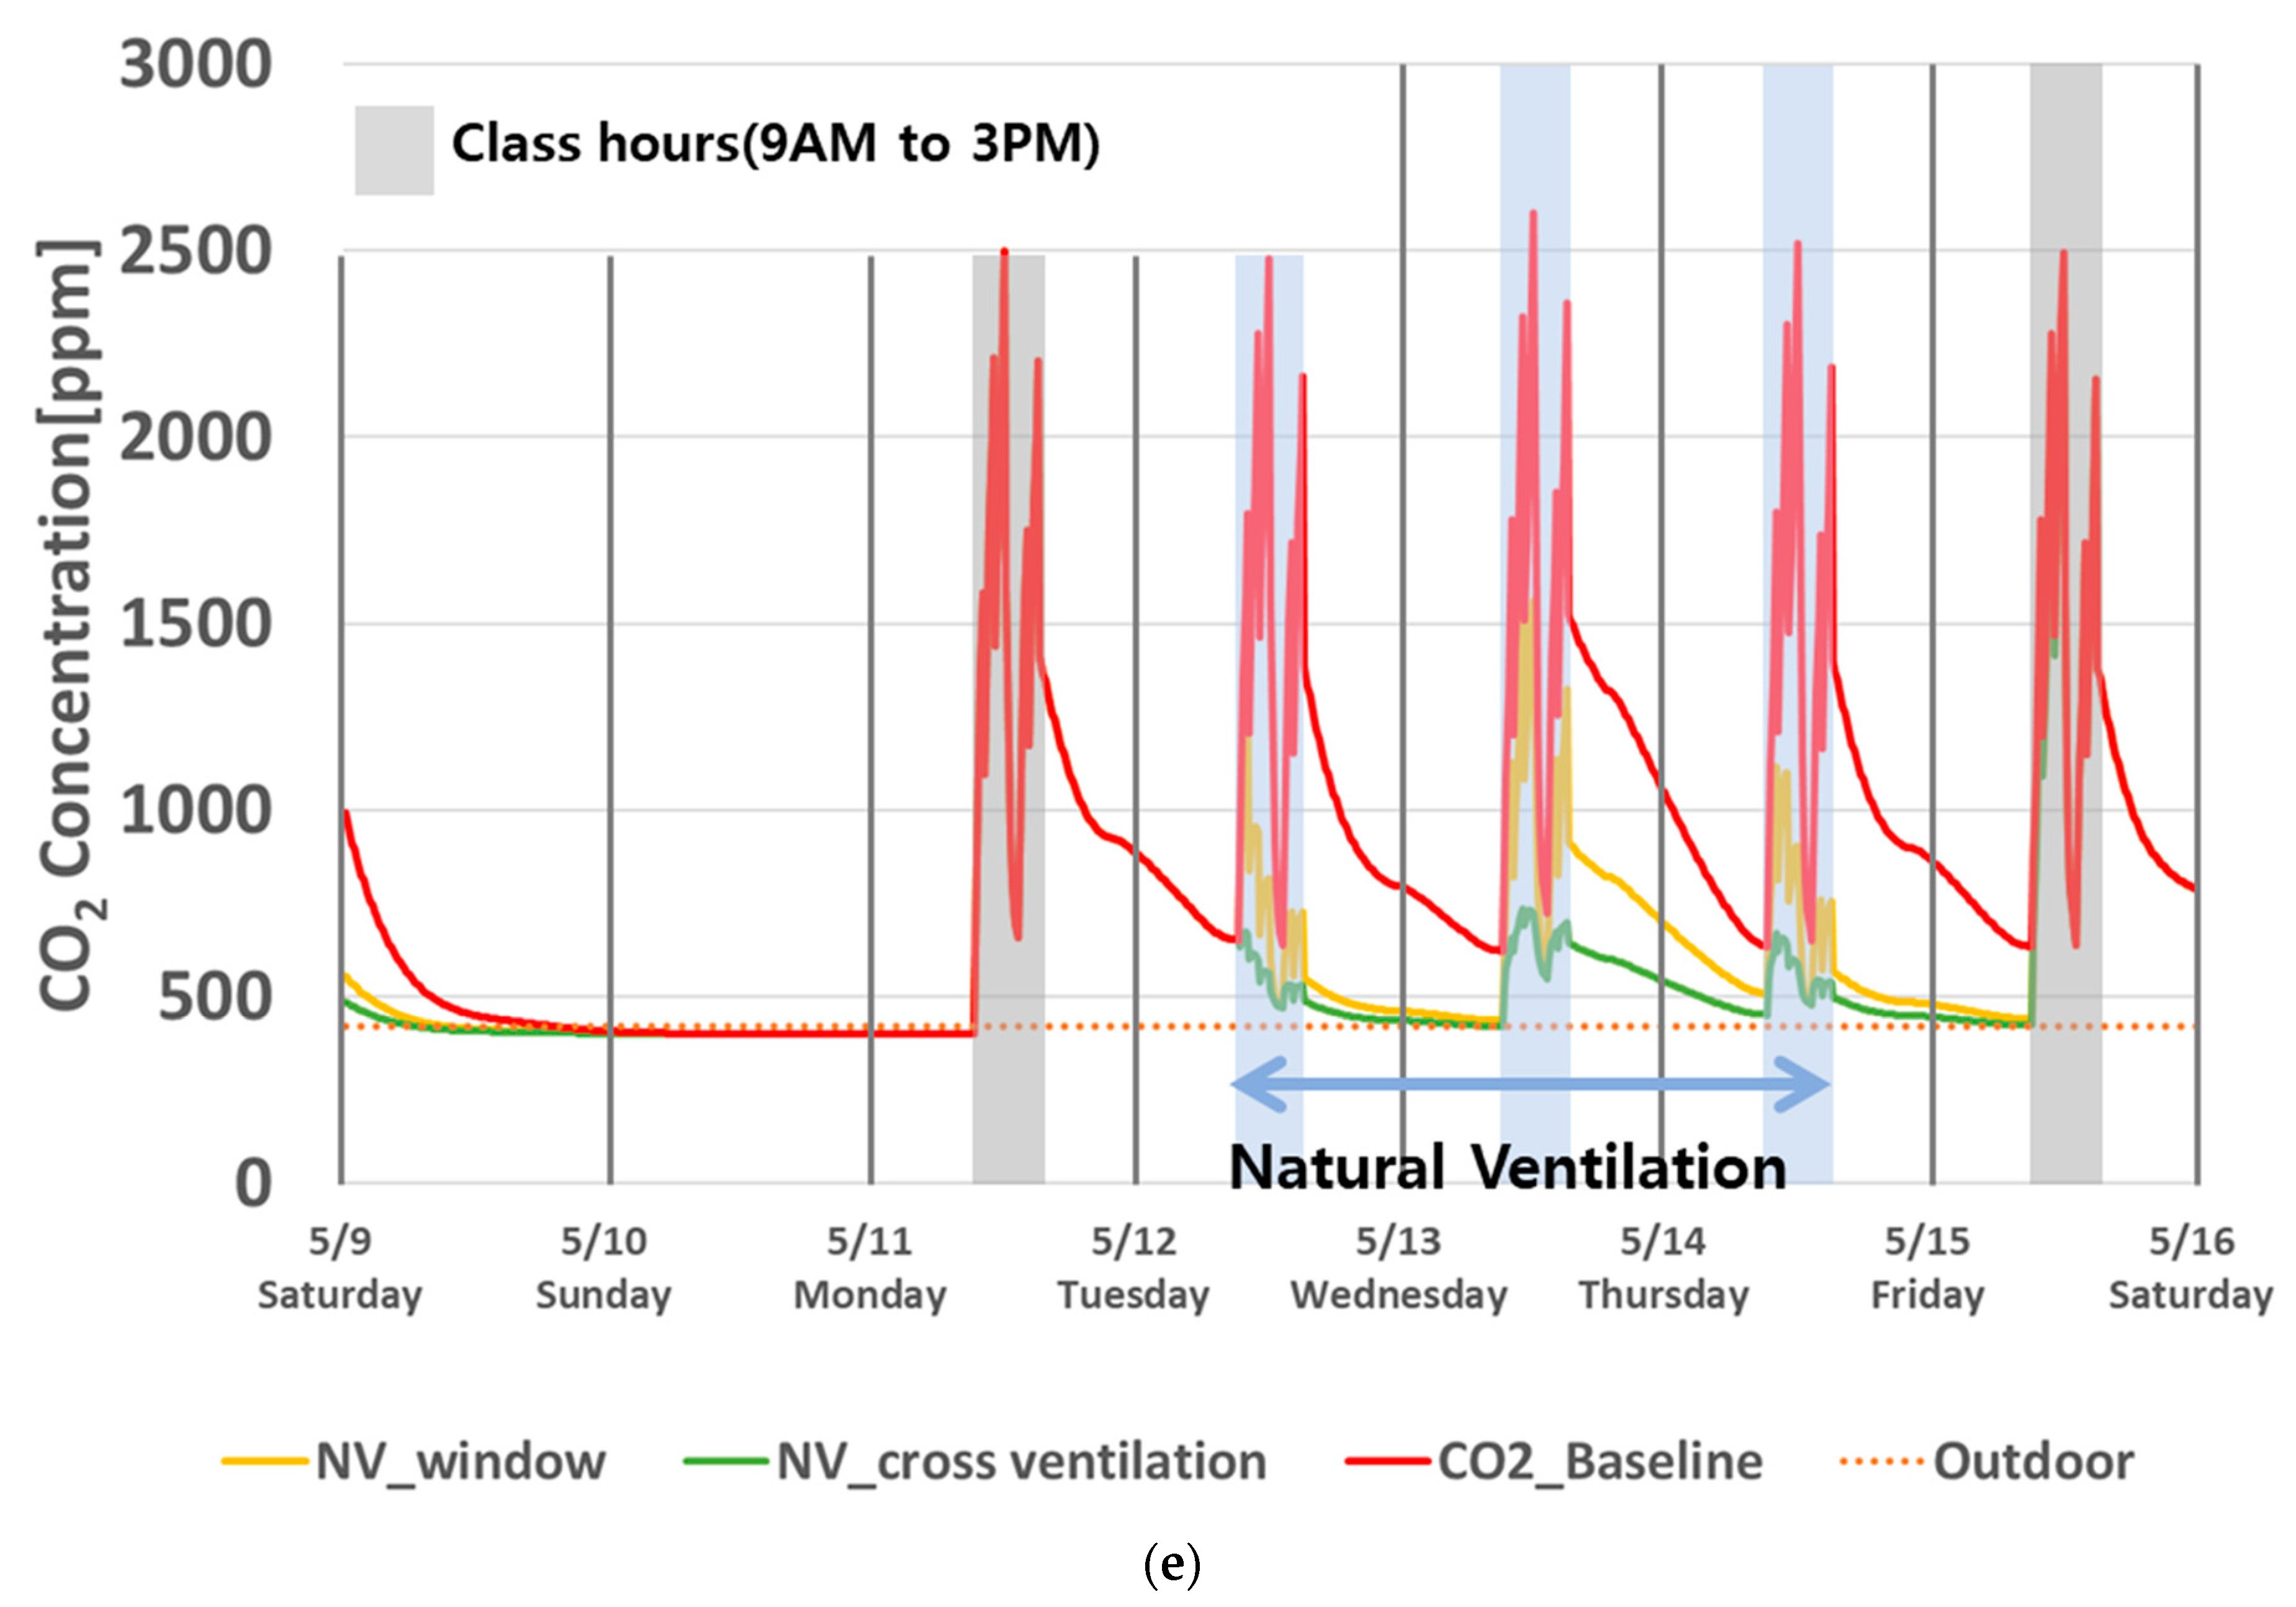
This study also analyzed the daily PM2.5 and CO2 profiles by natural ventilation (Table 5) from 12 to 14 May in spring, in which no heating or cooling was on, and the daily average PM2.5 concentration did not exceed 35 μ/m3. In this case, it was assumed that no mechanical ventilation or filtration by ERV or AP was operated.
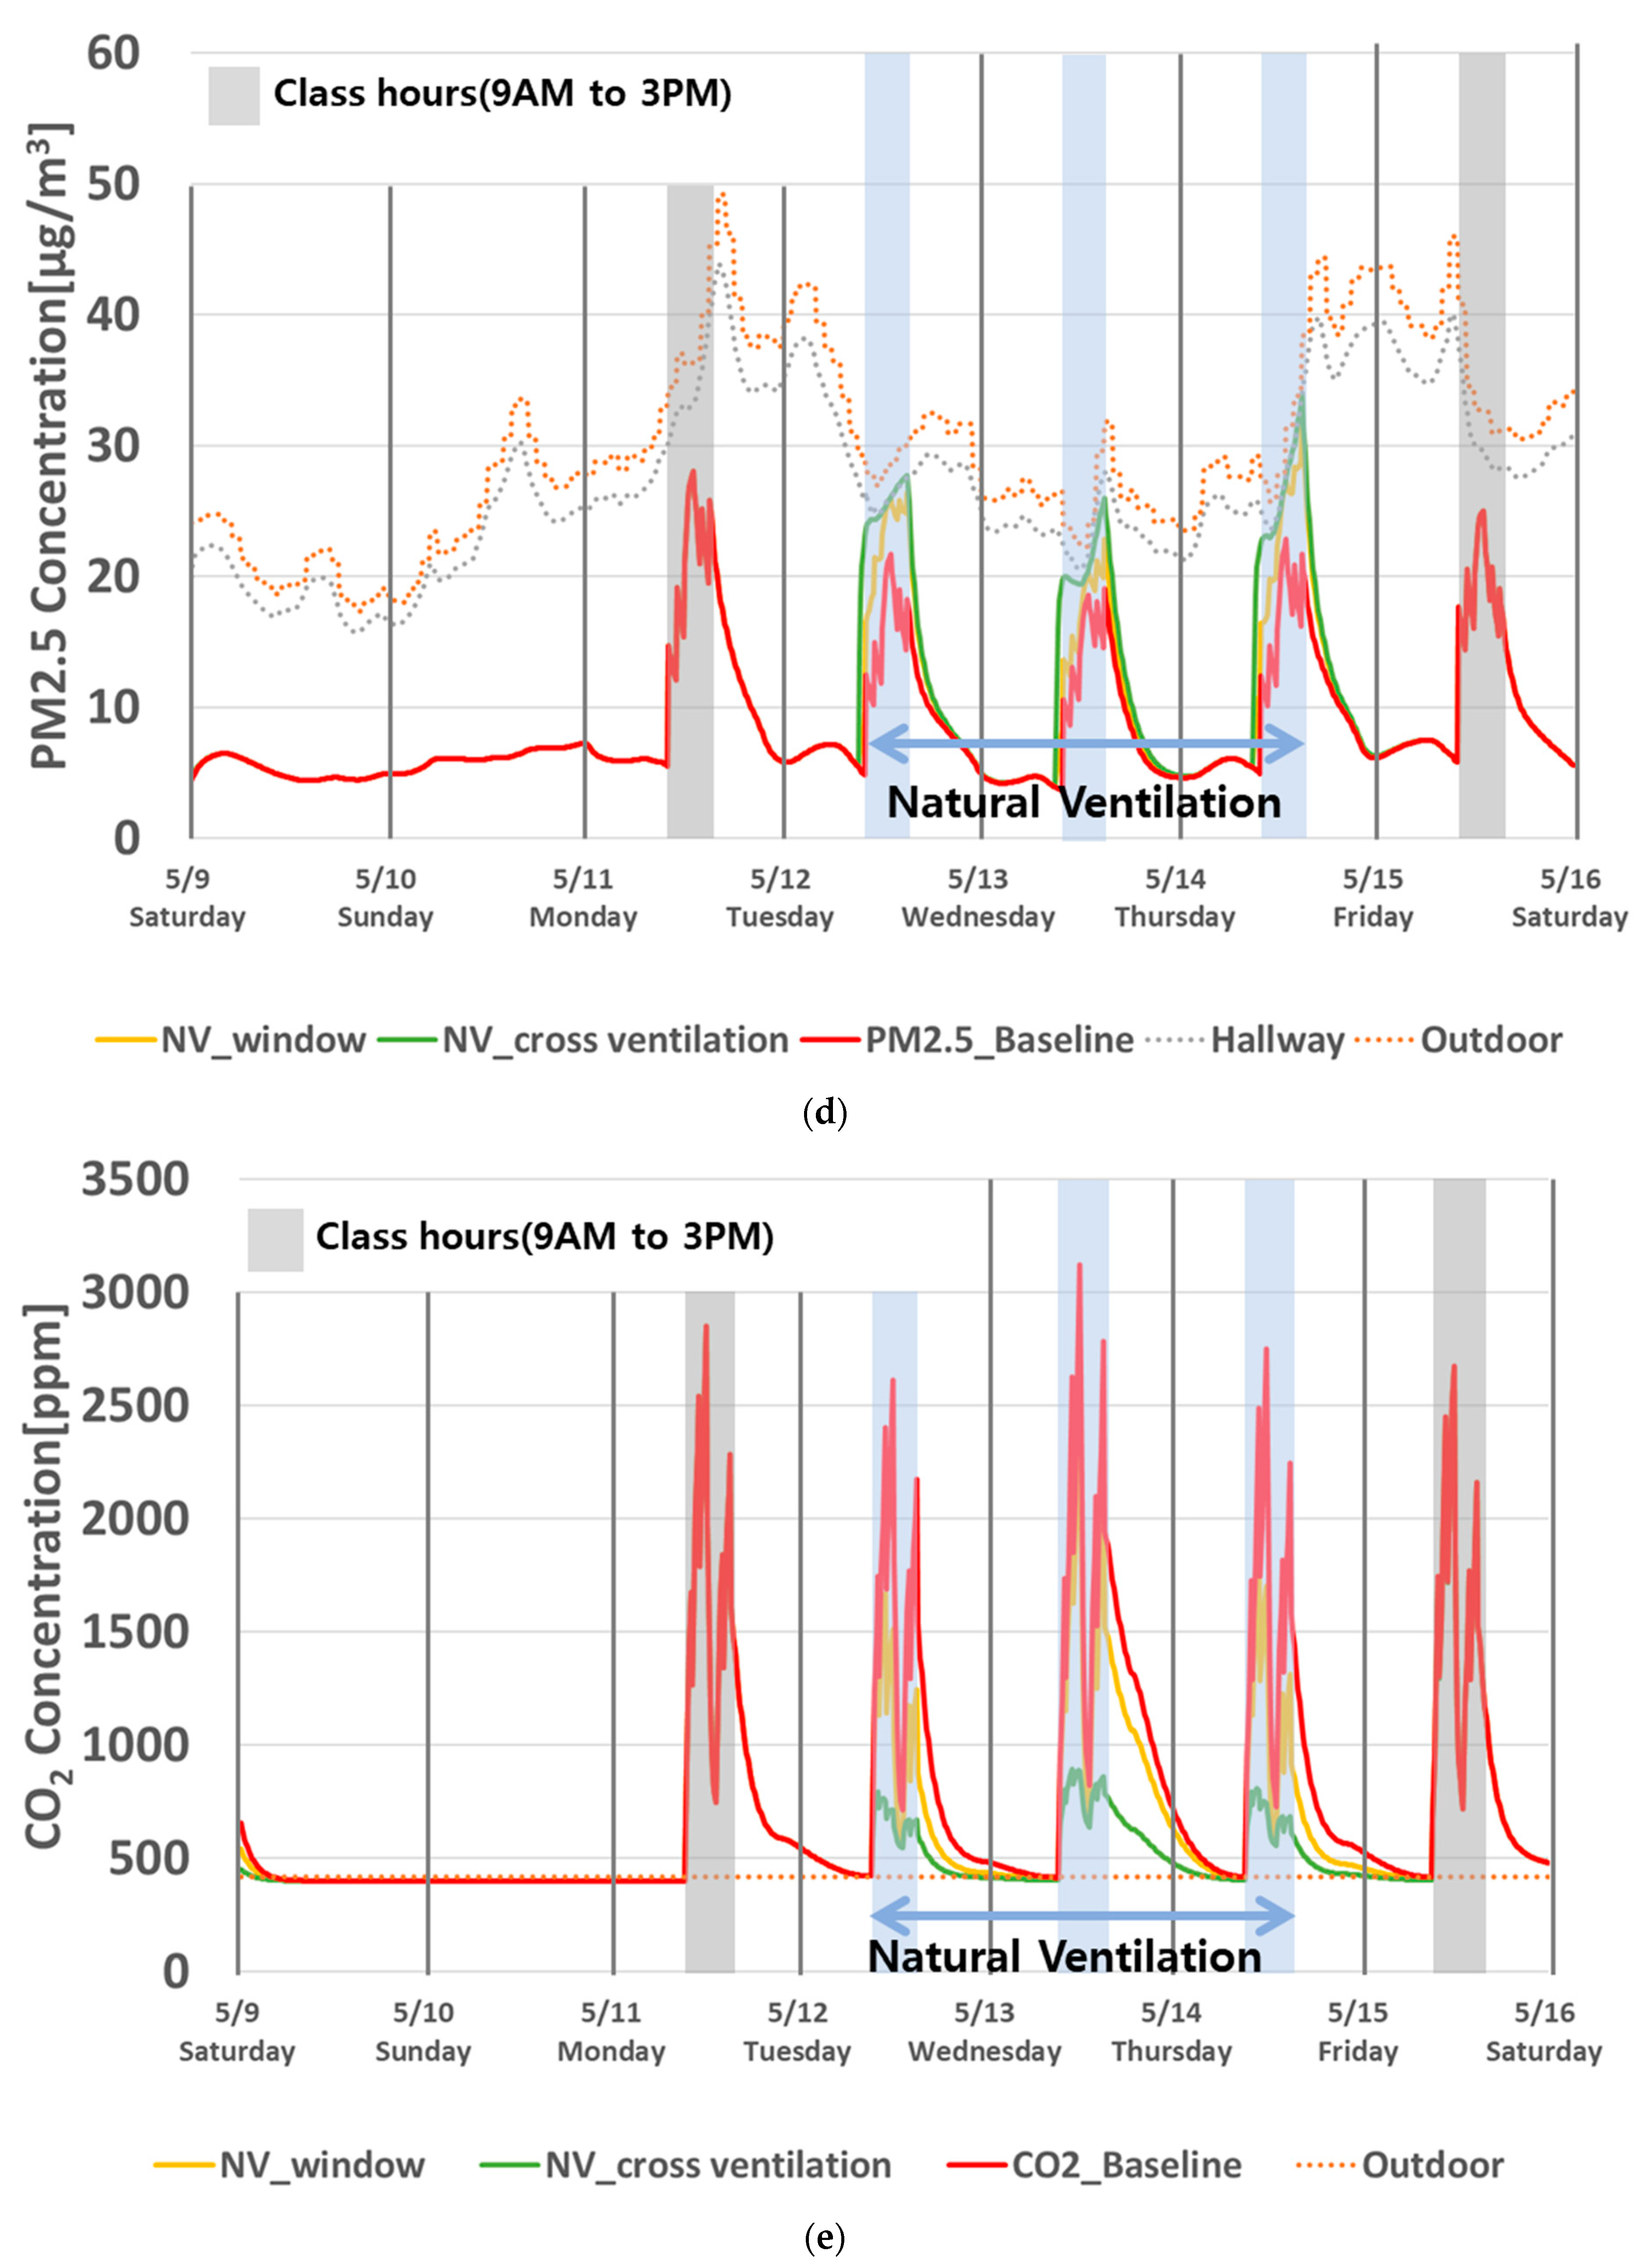
In all cases, both when natural ventilation was introduced by opening windows and when cross-ventilation was introduced by opening windows and doors, the classroom PM2.5 concentration during class was maintained as low as the outdoor concentration, despite some increase above the baseline (Figure A1d, Figure A2d and Figure A3d).
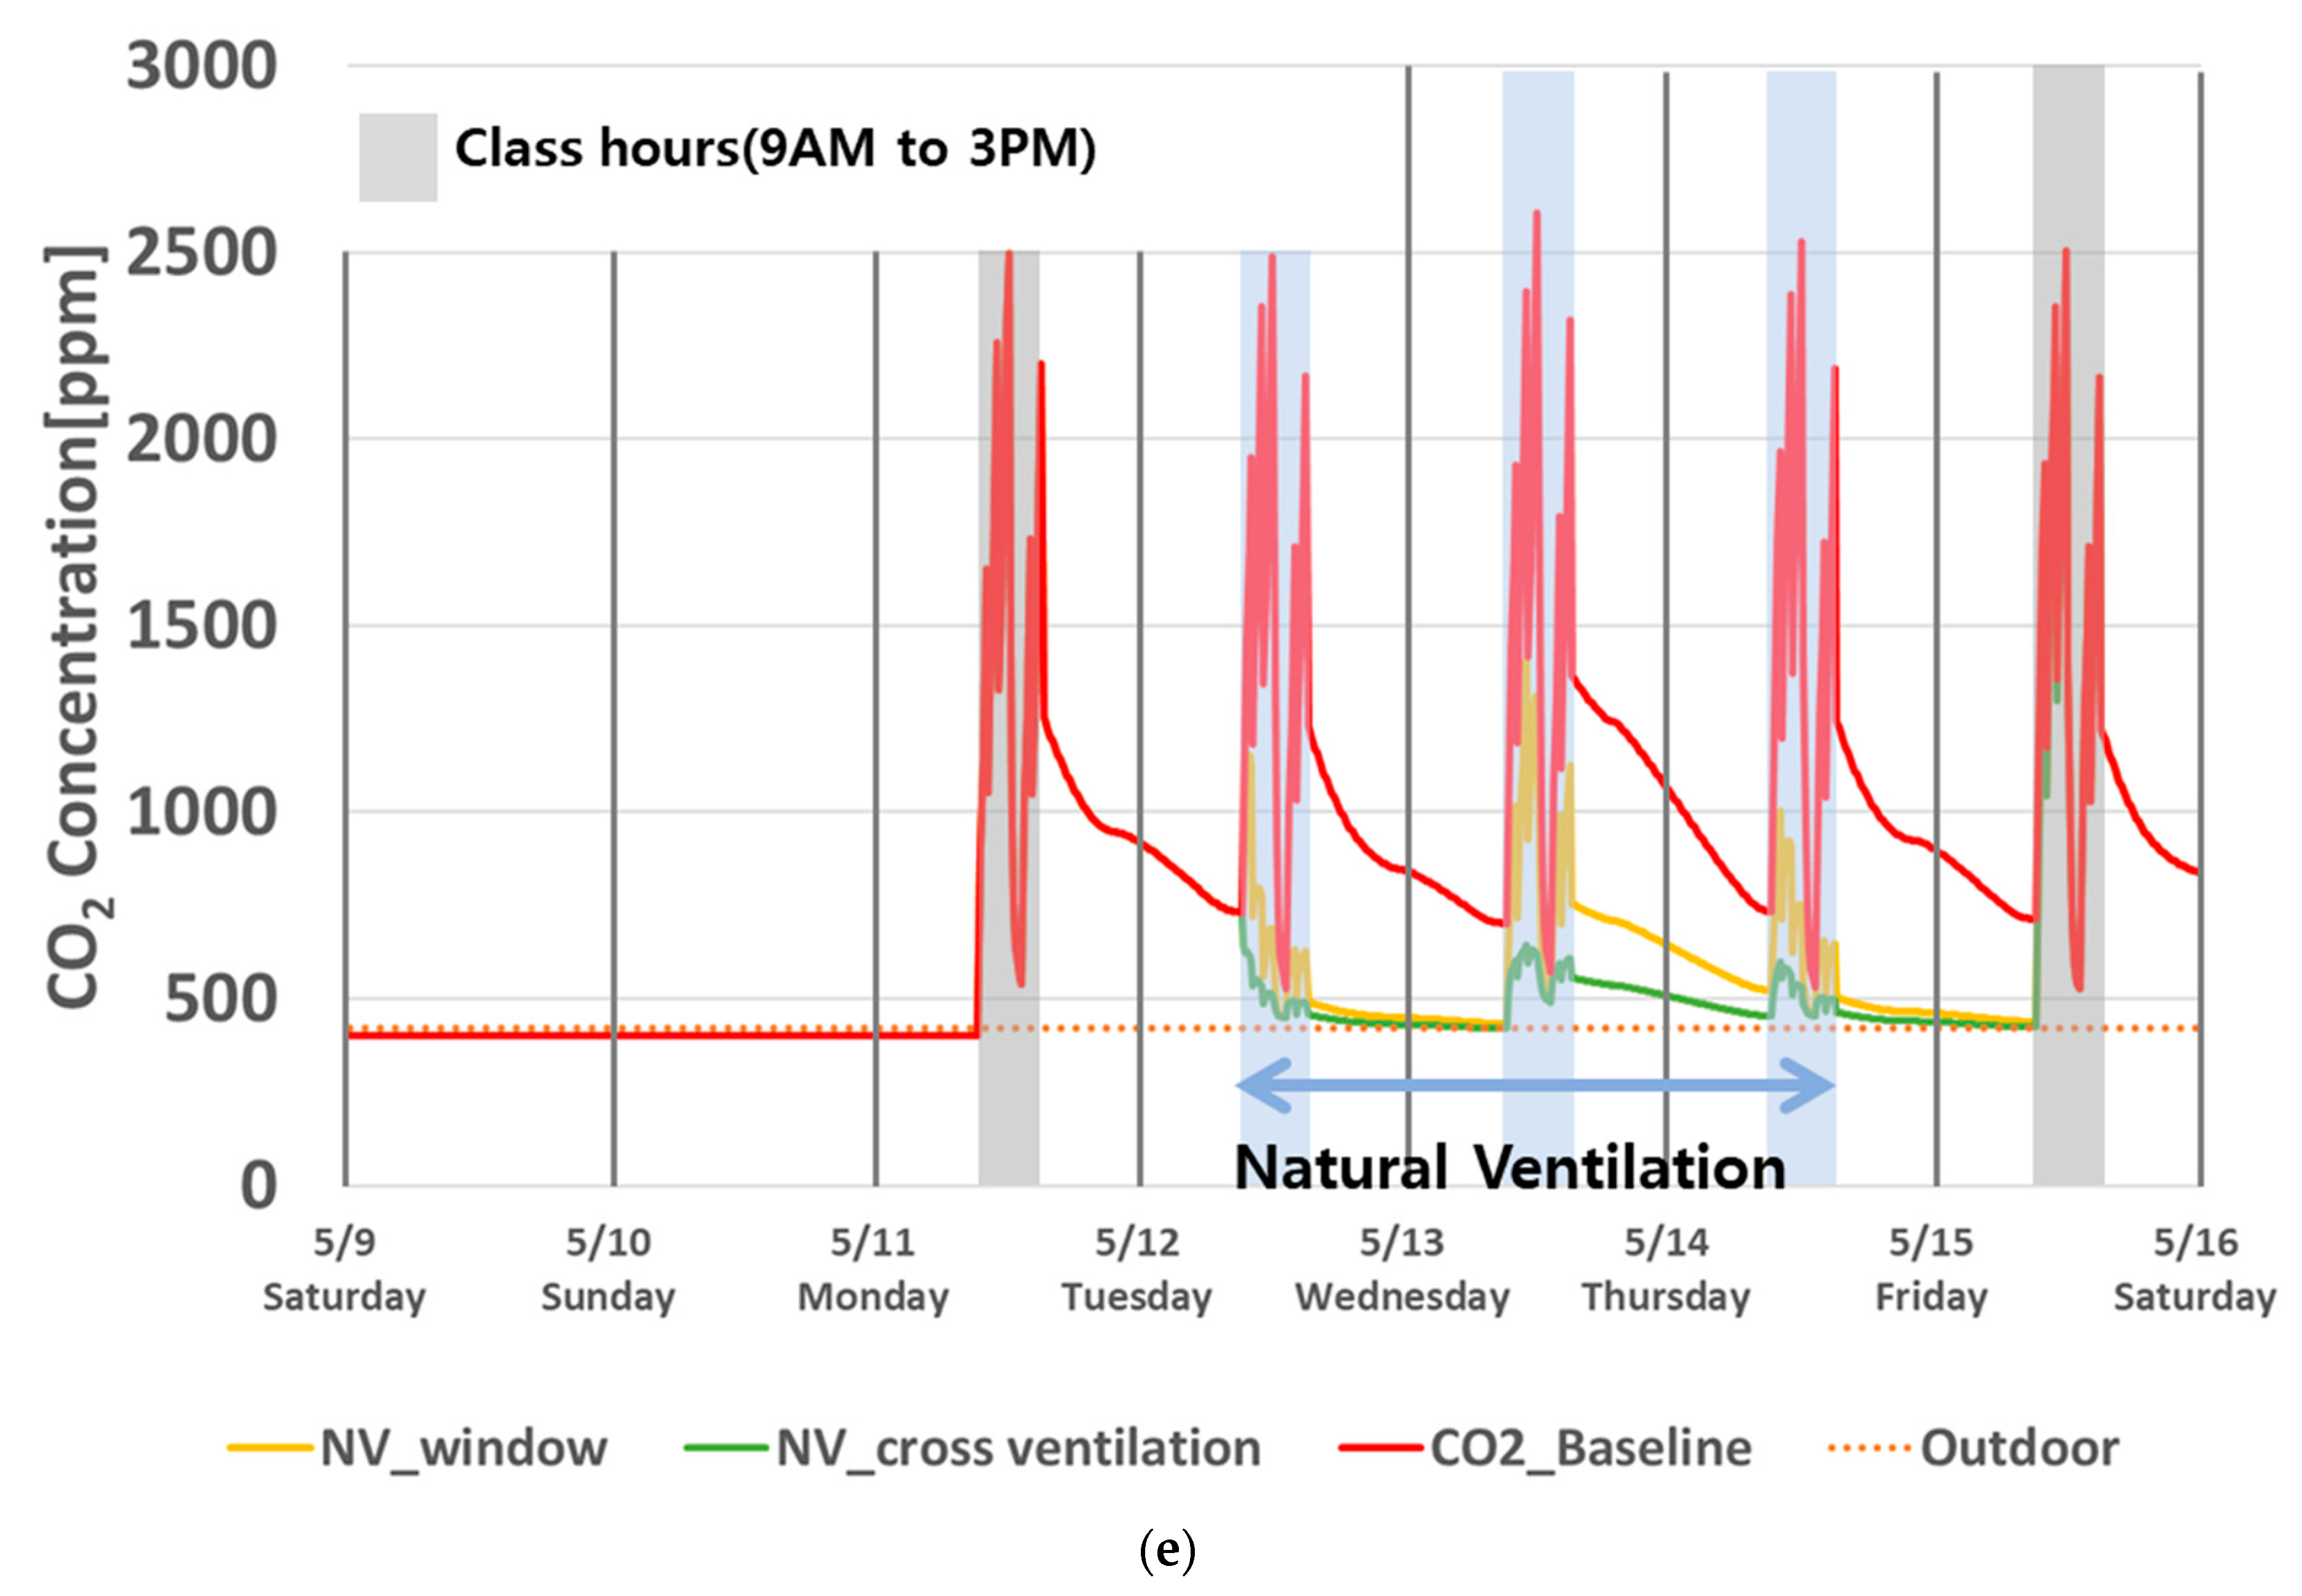
When natural ventilation was introduced, the classroom CO2 concentration dropped to a more manageable level (Figure A1e, Figure A2e and Figure A3e). Moreover, when cross-ventilation, which provides more OA volume, was introduced, the classroom CO2 concentration dropped faster to an even lower level.

3.5. Summary of Case Studies

For each measure, this study analyzed the annual PM2.5 I/O ratio during class and the daily profiles of PM2.5 and CO2 in the worst-case scenario. The results are summarized as follows:
(i) Even if the building retrofit measures to enhance the airtightness of enclosures (B1–B4: window and door replacement and added insulation) were applied, in all three cases, there was no significant change in the annual PM2.5 I/O ratio during class compared to the baseline. This is because ambient PM2.5 in the hallways entered the classroom every break time (e.g., 10 min recess for every 1 h class) and 1 h of lunchtime when the door was left open; it made the classroom PM2.5 concentration during class almost as high as the hallway concentration, regardless of the decreased infiltration and penetration through the retrofitted envelope.
During class hours (9 a.m. to 3 p.m.) in the worst-case scenario, in all three cases, the classroom PM2.5 concentration profiles did not significantly differ from the baselines either. However, it was apparently visible that only when the existing door was replaced with a first-grade airtight door (B2b), less or far less mass of ambient PM2.5 in the hallways flowed into the classroom when the door was closed, which made the PM2.5 concentration profiles after class far lower than the baselines.
(ii) When ventilation and filtration measures in operation with ERV and AP (S1–S3) were applied, in all three cases, there was a significant decrease in the annual PM2.5 I/O ratio during class compared to the baseline because ERV and AP filtered out the existing PM2.5 from indoor air and/or incoming PM2.5 from outdoor air. In the worst-case scenario of all three cases, the classroom PM2.5 concentration with S1–S3 was significantly lower than that of the baseline, even if the classroom door was left open. Moreover, it dropped to nearly zero when the door was closed. The classroom CO2 concentration dropped when ERVs were operating (S1, S2). As the supply volume of ERV increased, the classroom CO2 concentration decreased more quickly. As the supply volume of ERV and AP and their filter efficiency increased, the classroom PM2.5 concentration decreased more quickly.
(iii) Natural ventilation introduced during class hours (Nwin) when the daily average outdoor PM2.5 was lower than 35 μ/m3 maintained the classroom PM2.5 concentration at the outdoor level. It also dropped the classroom CO2 concentration to significantly lower than the baseline. Cross-ventilation, which introduces more OA volume (NCV), made such drops even faster.

4. Discussion and Conclusions

4.1. Discussion

Based on the analysis of case studies, practical recommendations when selecting appropriate retrofit, ventilation, and filtration measures and operations for reasonable balance between IAQ and the energy performance of the Korean classroom are described as follows:
(i) The airflows and penetrations from hallways to classrooms should also be secured, as contaminants in hallways may move into classrooms.
When external windows and entrance doors in the hallway are left open for a prolonged time, the hallway environment is likely to be the same as the outdoor environment in terms of contaminants, temperature, and humidity. Depending on the outdoor window pressure and direction, either airflow path (1): outdoors→classroom→hallway or airflow path (2): hallway→classroom→outdoors can be created. In the case of airflow path (2), ambient contaminants from outdoors may eventually flow into the classroom via the hallway. In particular, if classrooms are located on the ground or near-ground floors, and a downwind is flowing through the school façade as in the test cases, it is likely to create an airflow path (2).
When classroom external windows are replaced and insulation is added to the envelope, the envelope airtightness is greatly enhanced, which can prevent the infiltration and contaminant penetration via the airflow path (1). However, if the airflow path (2) is created, the classroom IAQ could become even worse because the classroom contaminant flowing in from the hallway is hardly discharged outdoors and is thus trapped in the classroom.
To prevent this backflow contamination, (i) the hallway openings should be closed all the time, (ii) air-conditioning and mechanical filtration should operate for the hallway, or (iii) a more airtight enclosure between the classroom and hallway should be fabricated. The opening of windows is a maintenance issue that is dependent on personnel training, which may not be reliable [27], and the installation of an HVAC system in the school hallway is neither legally compulsory in Korea nor economically feasible due to limited budgets. Currently, a more practically feasible solution seems to be to replace the classroom doors and hallway-side windows with performance products with high airtightness and insulation. Additionally, it would reduce the exfiltration of the air-conditioned air of the classroom, infiltration of the untreated air of the hallway, and heat exchange between classroom and hallway, hence decreasing the energy demand of the classroom.
(ii) When the airtightness of classroom enclosures is enhanced, mechanical ventilation and filtration should be in operation.
Increasing the airtightness of the entire classroom enclosure may prevent contaminants that have already entered the classroom from being discharged through exfiltration, although it prevents the infiltration and penetration of ambient contaminants from outdoors. Additionally, letting classroom doors be open during access hours, breaks, and lunchtimes may accelerate hallway contaminants entering the classroom.
The airtight enclosure must be accompanied by mechanical ventilation and filtration, particularly when all apertures are closed; filtration methods such as ERV and AP lower the contaminant concentration by removing the contaminant mass, and ventilation methods such as ERV dilute the contaminant concentration and CO2 by delivering fresh air into the enclosed classroom.
When a mechanical ventilation system introduces fresh yet unconditioned OA into the classroom, ventilation heat loss and the resulting ventilation system load increase are disadvantages from the viewpoint of energy performance. Moreover, it may consume more energy if only a cooling system (without a separate dehumidifier) is used to control the OA humidity during a hot and humid summer, such as in Korea. However, as many other relevant studies have indicated, a ventilation system with heat recovery can mitigate the ventilation heat loss issue. Specially, ventilation systems with enthalpy recovery (e.g., ERV) can make the humidity control of the OA more feasible while consuming less energy.
If the ventilation system cannot be installed for some reason, such as limited budget or space, AP must be alternatively operated. Although AP cannot control CO2, it can immediately remove the incoming contaminant mass (as shown in Figure A1b, Figure A2b and Figure A3b) and thus prevent further accumulation for the situation in which occupants frequently open the doors and windows for fresh air.
(iii) Improving the filtration capacity with a high-efficiency filter can be an alternative solution when mechanical ventilation needs to run at a reduced volume.
As ventilation and filtration systems are designed to fully function at the rated condition, they should be operated at the rated flowrate to supply sufficient fresh air to the entire classroom. That is, obstacles blocking the air outlet should be removed to induce sufficient circulation, and filters should be periodically cleaned/replaced.
In real classrooms, however, noise or disturbance due to a large ventilation volume may annoy students and teachers. Or there could be an urgent need to reduce the air volume for some reason. In this case, improving the filtration capacity by installing a high-efficiency filter can be an alternative solution to control indoor contaminant levels (as shown in cases of S2: replace ERV filter), as long as ventilation systems operate at a reasonably reduced flowrate.
(iv) Natural ventilation should be introduced only when the outdoor conditions are desirable and should be supplemented with high-capacity AP to maintain stable indoor concentrations.
Natural ventilation, which does not consume fan or cooling energy, has been the only cooling measure for old schools without AC,. Therefore, it has been perceived as environmentally friendly and fair [47], and thus some school users prefer natural ventilation to mechanical ventilation. Unfortunately, the domestic school health act also recommends opening the classroom door for ventilation when they can’t open windows due to higher outdoor concentration [35].
However, natural ventilation should be introduced only when the outdoor conditions are desirable (e.g., average PM2.5 concentration ≤35 μg/m3, 22 °C ≤ temperature ≤ 28 °C, 40% ≤ relative humidity ≤60%). Warnings to occupants that opening windows and doors can bring unwanted contaminants into classrooms are vital. Alternatively, informing occupants of the onsite availability of natural ventilation using a smart device could be a good practice to raise their awareness.
In addition, even if occupants are informed that the outdoor conditions are good for natural ventilation at a certain moment, the outdoor environment is beyond human control. Therefore, it is desirable to continuously remove contaminants by operating APs in case uncontrollable contaminants instantaneously pass by via opened windows and doors (as shown in Figure A1b, Figure A2b and Figure A3b where the classroom PM2.5 concentration was significantly lower than the baseline, even if the classroom door was left open).
(v) Mechanical ventilation and filtration should operate independently from the enforced energy demand reduction policy.
Indeed, some IAQ concerns over the enforced demand reduction policy may rise in the off-season. The domestic demand reduction policy focuses more on saving cooling and heating energy in the peak season. However, there seems to be no need to control any HVAC systems in the off-season, because all HVAC systems must be turned off per the policy.
For an example of the interlocking controls between VRF and ERV, which aimed at a coordinated operation, strong interlocking does not provide mechanical ventilation during the off-season when VRFs are off. In contrast, a lack of interlocking control (probably to save energy cost) does not provide mechanical ventilation even if VRFs are turned on, unless occupants are aware and manually turn the ERV on.
Although mechanical ventilation and filtration consume some energy depending on the situation, they are powerful measures in controlling IAQ. Therefore, they should operate independently (probably according to setpoint concentration of indoor contaminant), rather than being under the control of the enforced energy demand reduction policy.

4.2. Limitations and Future Studies

While this study analyzed the IAQ impacts of the selected building retrofit, ventilation, and filtration measures and operations based on real classroom surveys and calibrated simulations, they have yet to be validated in a field test. Additionally, their energy savings need to be quantitively assessed. In the future study, energy performance of the abovementioned recommendations (Section 4.1) will be firstly assessed via simulations. Then, the energy savings and PM2.5 profiles of the selected measures can be physically measured when they are implemented in a real school.
It should be noted that HVAC adjustment and recommissioning can alleviate excessive energy issues despite prolonged operation hours and extra fan powers such as mentioned in [26]. That means that HVAC adjustment and recommissioning without installing an extra device can be a good school retrofit measure to balance energy savings and IAQ, which should also be dealt with in a future study.

Author Contributions

Conceptualization, S.H.K., H.K.; investigation, H.J.S., S.H.K.; data curation, H.J.S.; writing, H.J.S., S.H.K., H.K.; supervision, S.H.K.; funding acquisition, S.H.K. All authors have read and agreed to the published version of the manuscript.

Funding

This study was supported by the Research Program funded by the Seoul National University of Science and Technology.

Data Availability Statement

No data is available.

Conflicts of Interest

The authors declare no conflict of interest.

Appendix A. PM2.5 and CO2 Profiles when Measures are Applied to Each Case
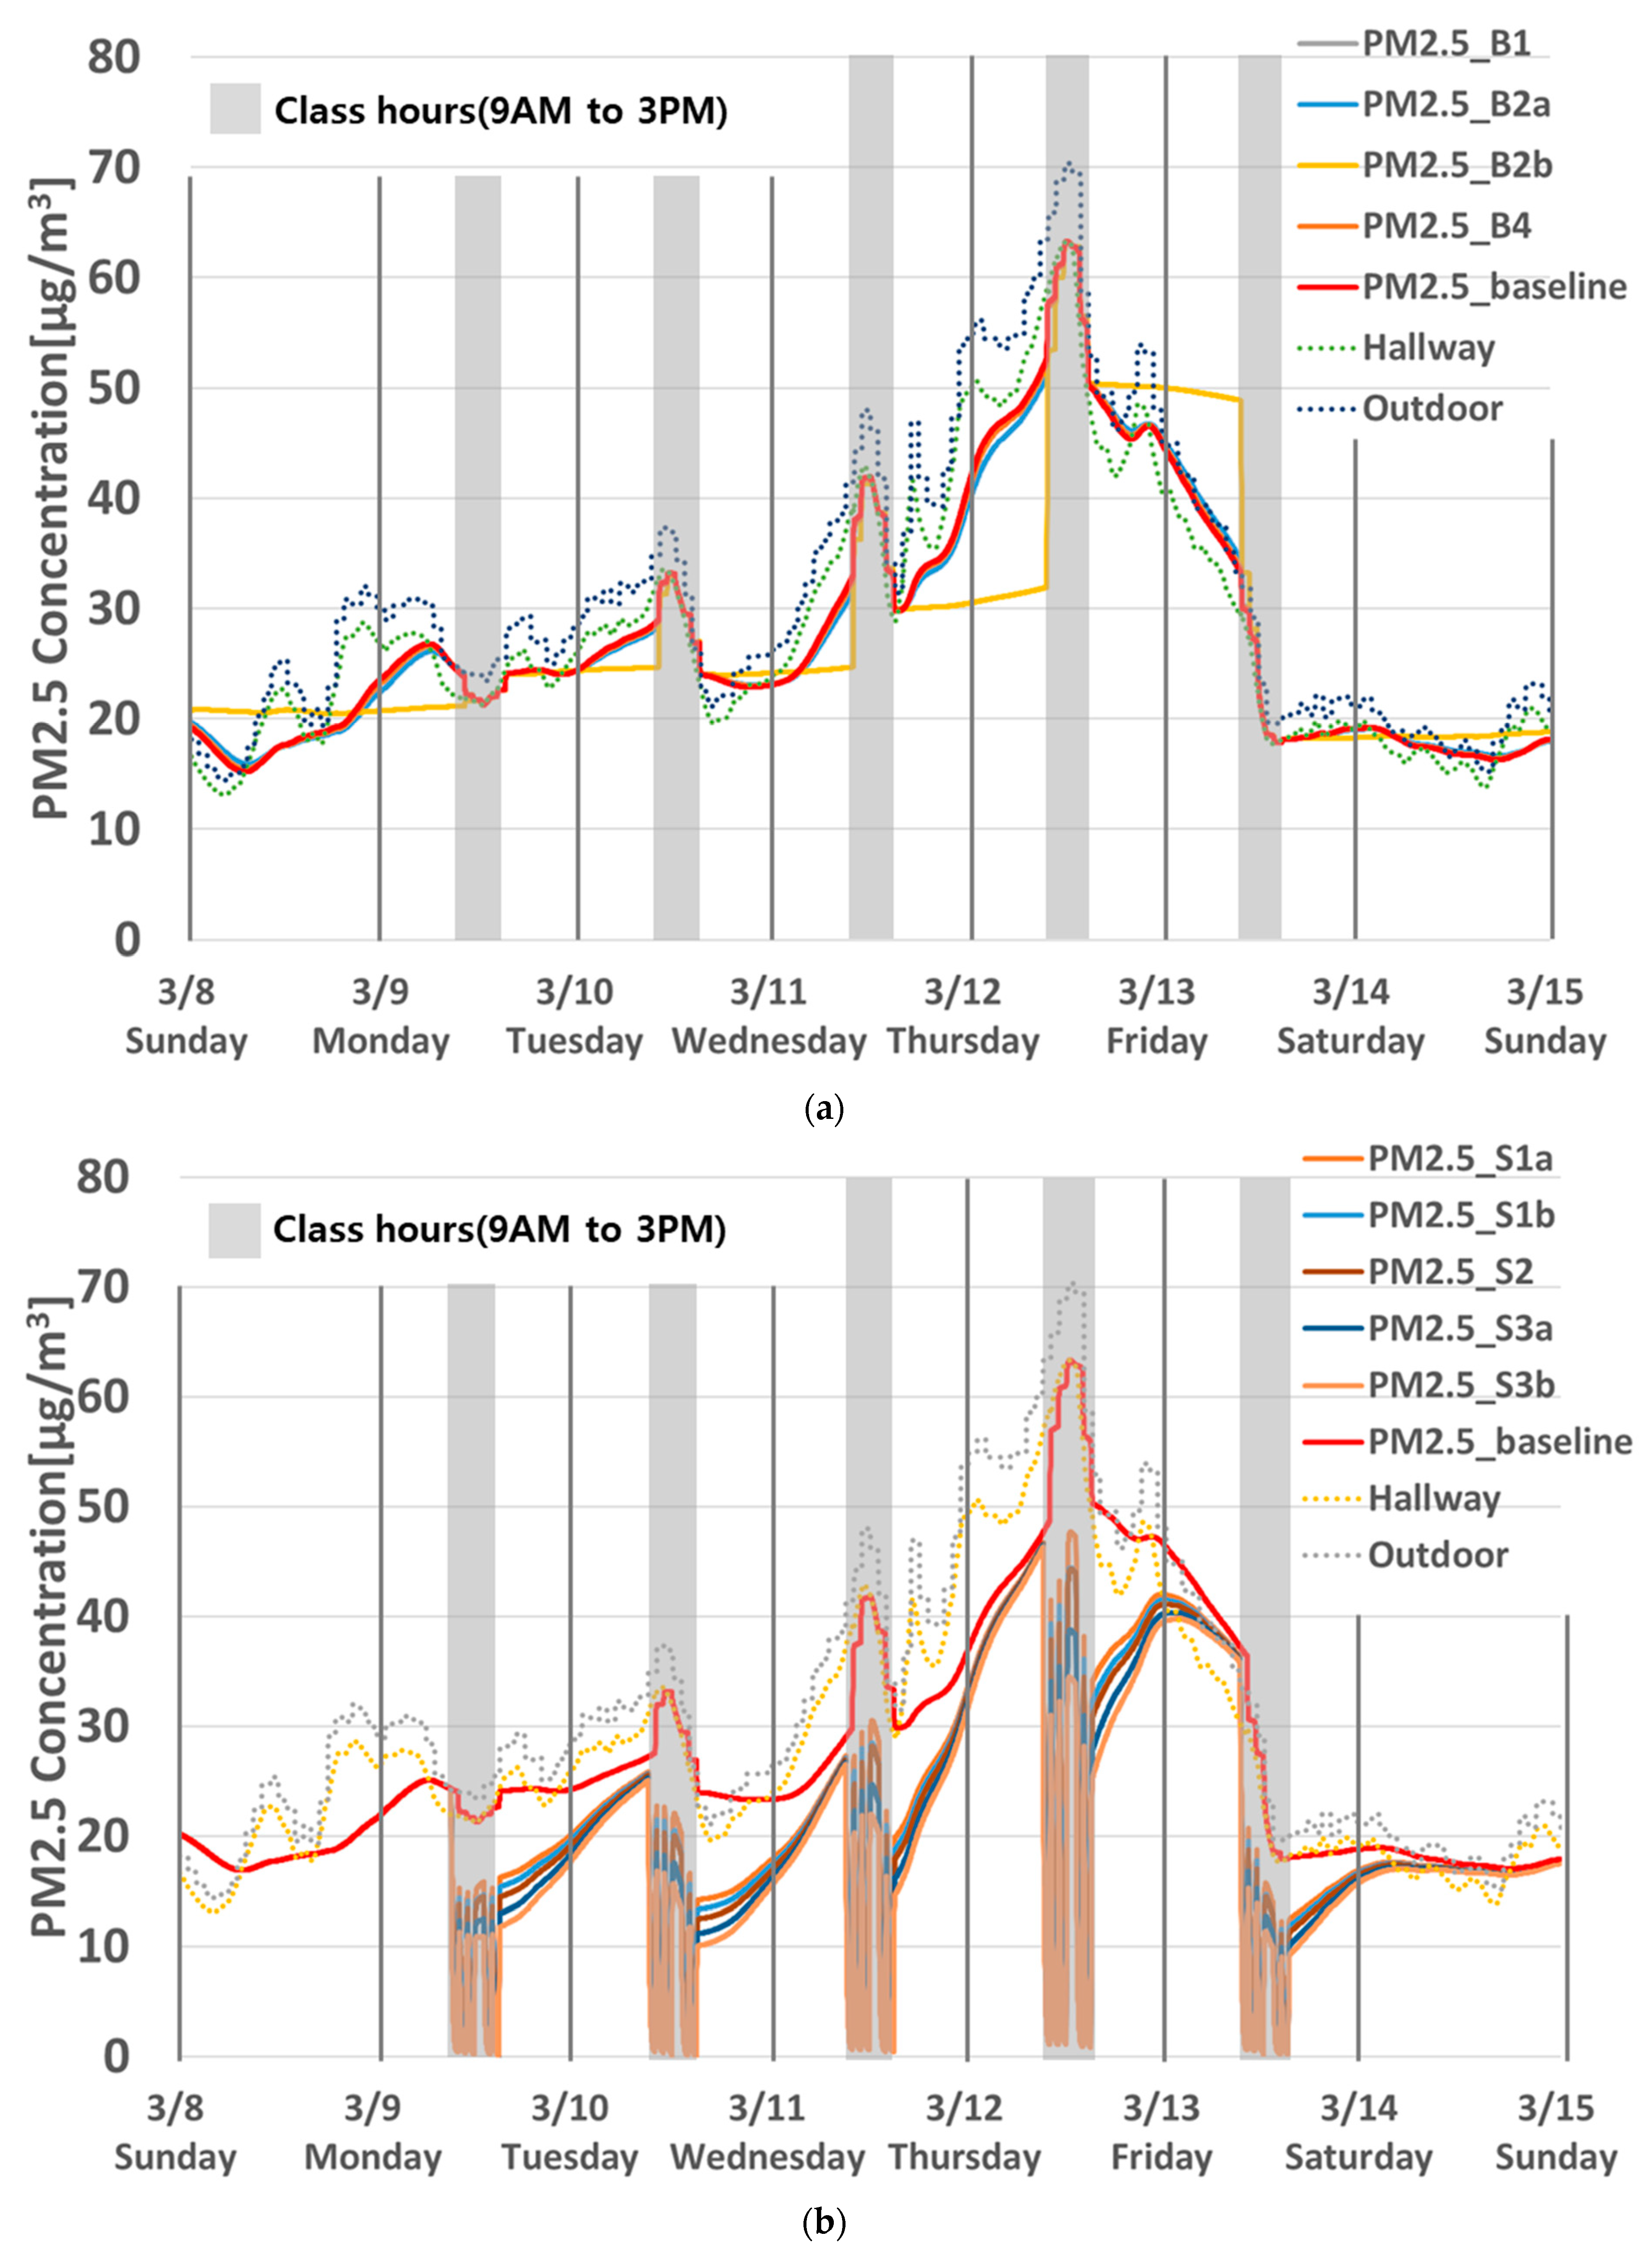
Figure A1. (a) PM2.5 profile at the worst week when building retrofit measures (B1, B2, B4) were applied to Case D. (b) PM2.5 profile at the worst week when system measures (S1, S2, S3) were applied to Case D. (c) CO2 profile at the worst week when system measures (S1, S2, S3) were applied to Case D. (d) PM2.5 profile from 12 to 14 May when natural and cross ventilations were introduced in Case D. (e) CO2 profile from 12 to 14 May when natural and cross ventilations were introduced in Case D.
Buildings 13 01033 g0a1aBuildings 13 01033 g0a1bBuildings 13 01033 g0a1c
Figure A2. (a) PM2.5 profile at the worst week when building retrofit measures (B1, B2, B3, B4) were applied to Case I. (b) PM2.5 profile at the worst week when system measures (S1, S2, S3) were applied to Case I. (c) CO2 profile at the worst week when system measures (S1, S2, S3) were applied to Case I. (d) PM2.5 profile from 12 to 14 May when natural and cross ventilations were introduced in Case I. (e) CO2 profile from 12 to 14 May when natural and cross ventilations were introduced in Case I.
Buildings 13 01033 g0a2aBuildings 13 01033 g0a2bBuildings 13 01033 g0a2c
Figure A3. (a) PM2.5 profile at the worst week when building retrofit measures (B1, B2, B4) were applied to Case M. (b) PM2.5 profile at the worst week when system measures (S1, S2, S3) were applied to Case M. (c) CO2 profile at the worst week when system measures (S1, S2, S3) were applied to Case M. (d) PM2.5 profile from 12 to 14 May when natural and cross ventilations were introduced in Case M. (e) CO2 profile from 12 to 14 May when natural and cross ventilations were introduced in Case M.
Buildings 13 01033 g0a3aBuildings 13 01033 g0a3bBuildings 13 01033 g0a3c

References

  1. Fisk, W.J. The ventilation problem in schools: Literature review. Indoor Air 2017, 27, 1039–1051. [Google Scholar] [CrossRef] [PubMed] [Green Version]
  2. Hu, M. Assessment of effective energy retrofit strategies and related impact on indoor environmental quality: A case study of an elementary school in the state of Maryland. J. Green Build. 2017, 12, 38–55. [Google Scholar] [CrossRef]
  3. Eliopoulou, E.; Mantziou, E. Architectural Energy Retrofit (AER): An alternative building’s deep energy retrofit strategy. Energy Build. 2017, 150, 239–252. [Google Scholar] [CrossRef]
  4. Chen, C.; Zhao, B.; Zhou, W.; Jiang, X.; Tan, Z. A methodology for predicting particle penetration factor through cracks of windows and doors for actual engineering application. Build. Environ. 2012, 47, 339–348. [Google Scholar] [CrossRef]
  5. Cong, X.C.; Zhao, J.J.; Jing, Z.; Wang, Q.G.; Ni, P.F. Indoor particle dynamics in a school office: Determination of particle concentrations, deposition rates and penetration factors under naturally ventilated conditions. Environ. Geochem. Health 2018, 40, 2511–2524. [Google Scholar] [CrossRef]
  6. Lv, Y.; Wang, H.; Wei, S.; Wu, T.; Liu, T.; Chen, B. The experimental study on indoor and outdoor penetration coefficient of atmospheric fine particles. Build. Environ. 2018, 132, 70–82. [Google Scholar] [CrossRef]
  7. Liu, D.-L.; Nazaroff, W.W. Modeling pollutant penetration across building envelopes. Atmos. Environ. 2001, 35, 4451–4462. [Google Scholar] [CrossRef] [Green Version]
  8. Liu, D.L.; Nazaroff, W.W. Particle penetration through building cracks. Aerosol Sci. Technol. 2003, 37, 565–573. [Google Scholar] [CrossRef] [Green Version]
  9. Jo, H.H.; Nam, J.; Choi, J.; Yang, S.; Kang, Y.; Kim, S. Building retrofit technology strategy and effectiveness evaluation for reducing energy use by indoor air quality control. Build. Environ. 2022, 216, 108984. [Google Scholar] [CrossRef]
  10. Mocová, P.; Mohelníková, J. Indoor Climate Performance in a Renovated School Building. Energies 2021, 14, 2827. [Google Scholar] [CrossRef]
  11. Gil-Baez, M.; Barrios-Padura, Á.; Molina-Huelva, M.; Chacartegui, R. Natural ventilation systems in 21st-century for near zero energy school buildings. Energy 2017, 137, 1186–1200. [Google Scholar] [CrossRef]
  12. Sadrizadeh, S.; Yao, R.; Yuan, F.; Awbi, H.; Bahnfleth, W.; Bi, Y.; Cao, G.; Croitoru, C.; de Dear, R.; Haghighat, F.; et al. Indoor air quality and health in schools: A critical review for developing the roadmap for the future school environment. J. Build. Eng. 2022, 57, 104908. [Google Scholar] [CrossRef]
  13. Becker, R.; Goldberger, I.; Paciuk, M. Improving energy performance of school buildings while ensuring indoor air quality ventilation. Build. Environ. 2007, 42, 3261–3276. [Google Scholar] [CrossRef]
  14. Stabile, L.; Massimo, A.; Canale, L.; Russi, A.; Andrade, A.; Dell’Isola, M. The effect of ventilation strategies on indoor air quality and energy consumptions in classrooms. Buildings 2019, 9, 110. [Google Scholar] [CrossRef] [Green Version]
  15. Yang, J.; Nam, I.; Yun, H.; Kim, J.; Oh, H.-J.; Lee, D.; Jeon, S.-M.; Yoo, S.-H.; Sohn, J.-R. Characteristics of indoor air quality at urban elementary schools in Seoul, Korea: Assessment of effect of surrounding environments. Atmos. Pollut. Res. 2015, 6, 1113–1122. [Google Scholar] [CrossRef]
  16. Tong, Z.; Chen, Y.; Malkawi, A.; Adamkiewicz, G.; Spengler, J.D. Quantifying the impact of traffic-related air pollution on the indoor air quality of a naturally ventilated building. Environ. Int. 2016, 89, 138–146. [Google Scholar] [CrossRef]
  17. Raysoni, A.U.; Sarnat, J.A.; Sarnat, S.E.; Garcia, J.H.; Holguin, F.; Luèvano, S.F.; Li, W.-W. Binational school-based monitoring of traffic-related air pollutants in El Paso, Texas (USA) and Ciudad Juárez, Chihuahua (México). Environ. Pollut. 2011, 159, 2476–2486. [Google Scholar] [CrossRef] [PubMed]
  18. Gupta, A.; Cheong, K.D. Physical characterization of particulate matter and ambient meteorological parameters at different indoor–outdoor locations in Singapore. Build. Environ. 2007, 42, 237–245. [Google Scholar] [CrossRef]
  19. Merema, B.; Delwati, M.; Sourbron, M.; Breesch, H. Demand controlled ventilation (DCV) in school and office buildings: Lessons learnt from case studies. Energy Build. 2018, 172, 349–360. [Google Scholar] [CrossRef]
  20. Wang, Y.; Zhao, F.-Y.; Kuckelkorn, J.; Spliethoff, H.; Rank, E. School building energy performance and classroom air environment implemented with the heat recovery heat pump and displacement ventilation system. Appl. Energy 2014, 114, 58–68. [Google Scholar] [CrossRef]
  21. Barbosa, F.C.; De Freitas, V.P.; Almeida, M. School building experimental characterization in Mediterranean climate regarding comfort, indoor air quality and energy consumption. Energy Build. 2020, 212, 109782. [Google Scholar] [CrossRef]
  22. Pacitto, A.; Amato, F.; Moreno, T.; Pandolfi, M.; Fonseca, A.; Mazaheri, M.; Stabile, L.; Buonanno, G.; Querol, X. Effect of ventilation strategies and air purifiers on the children’s exposure to airborne particles and gaseous pollutants in school gyms. Sci. Total Environ. 2020, 712, 135673. [Google Scholar] [CrossRef]
  23. Rawat, N.; Kumar, P. Interventions for improving indoor and outdoor air quality in and around schools. Sci. Total Environ. 2023, 858, 159813. [Google Scholar] [CrossRef] [PubMed]
  24. Jain, N.; Burman, E.; Robertson, C.; Stamp, S.; Shrubsole, C.; Aletta, F.; Barrett, E.; Oberman, T.; Kang, J.; Raynham, P.; et al. Building performance evaluation: Balancing energy and indoor environmental quality in a UK school building. Build. Serv. Eng. Res. Technol. 2019, 41, 343–360. [Google Scholar] [CrossRef]
  25. Chan, W.R.; Li, X.; Singer, B.C.; Pistochini, T.; Vernon, D.; Outcault, S.; Sanguinetti, A.; Modera, M. Ventilation rates in California classrooms: Why many recent HVAC retrofits are not delivering sufficient ventilation. Build. Environ. 2020, 167, 106426. [Google Scholar] [CrossRef]
  26. Cai, C.; Sun, Z.; Weschler, L.B.; Li, T.; Xu, W.; Zhang, Y. Indoor air quality in schools in Beijing: Field tests, problems and recommendations. Build. Environ. 2021, 205, 108179. [Google Scholar] [CrossRef]
  27. de Mesquita, P.J.B.; Delp, W.W.; Chan, W.R.; Bahnfleth, W.P.; Singer, B.C. Control of airborne infectious disease in buildings: Evidence and research priorities. Indoor Air 2022, 32, e12965. [Google Scholar] [CrossRef] [PubMed]
  28. ASHRAE. In-Room Air Cleaner Guidance for Reducing COVID-19 in Air in Your Space/Room. 2021. Available online: https://www.ashrae.org/file%20library/technical%20resources/covid-19/in-room-air-cleaner-guidance-for-reducing-covid-19-in-air-in-your-space-or-room.pdf (accessed on 1 April 2023).
  29. Sanguinetti, A.; Outcault, S.; Pistochini, T.; Hoffacker, M. Understanding teachers’ experiences of ventilation in California K-12 classrooms and implications for supporting safe operation of schools in the wake of the COVID-19 pandemic. Indoor Air 2022, 32, e12998. [Google Scholar] [CrossRef]
  30. Korea Institute of Education Facility Safety. Safety Management Manual of Education Facility; KIOES: Seoul, Republic of Korea, 2019. [Google Scholar]
  31. Korea Ministry of Education. Standard Manual of Education Facility Construction; MOE: Sejong, Republic of Korea, 2016.
  32. Seoul Metropolitan Office of Education. Guideline for Green Smart Future Schools in Seoul; SOME: Seoul, Republic of Korea, 2021.
  33. Korea Ministry of Land, Infrastructure and Transport. Design Standards for Efficient Energy Buildings; Notification No. 2022-52; MOLIT: Sejong, Republic of Korea, 2022.
  34. Korean Association of Technology and Standards (KATS). KS F 2292: Test Method of Air Tightness for Windows and Doors. South Korea: Korean Agency for Technology and Standards. 2019. Available online: https://standard.go.kr/KSCI/portalindex.do (accessed on 19 November 2022).
  35. Korea Ministry of Education. Enforcement Rule of the School Health Act. Ordinance of the Ministry of Education; Notification No. 194; MOE: Sejong, Republic of Korea, 2019.
  36. NIST. CONTAM 3.4: Multizone Indoor Air Quality and Ventilation Analysis Computer Program. 2022. Available online: https://www.nist.gov/services-resources/software/contam (accessed on 19 November 2022).
  37. Kyung-Hwan, J.; Dong-Seok, L.; Jae-Hun, J. A Comparison of Measured Entrance Doors’ Data with those of Airtightness Standards. J. Archit. Inst. Korea Plan. Des. 2014, 30, 223–230. [Google Scholar]
  38. Hyun-Kook, S.; Bo-Ra, N.; Yun-Jeong, C.; Jae-Hun, J. The estimation of airtightness and thermal performance according to the sliding window types in residential buildings. J. Korean Inst. Archit. Sustain. Environ. Build. Syst. 2010, 4, 222–227. [Google Scholar]
  39. Korean Institute of Architectural Sustainable Environment and Building Systems. KIAEBS C-1: 2013 Building Airtightness Criteria; KIAEBS: Seoul, Republic of Korea, 2013. [Google Scholar]
  40. Korean Association of Technology and Standards (KATS). KS B 6879: Heat Recovery Ventilators. South Korea: Korean Agency for Technology and Standards. 2020. Available online: https://standard.go.kr/KSCI/portalindex.do (accessed on 19 November 2022).
  41. Korea Ministry of Environment. Environmental Policy Framework Act; Notification No. 32557; MOE: Sejong, Republic of Korea, 2022.
  42. Kweather. IAQ-CW1 Sensor Station. Available online: http://www.airguardk.com (accessed on 19 November 2022).
  43. TEC. Minneapolis Blower Door™ System. Available online: https://energyconservatory.com/products/?categories=11 (accessed on 19 November 2022).
  44. Emmerich, S.J.; Nabinger, S.J.; Gupte, A.; Howard-Reed, C. Validation of CONTAMW predictions for tracer gas in a townhouse. In Proceedings of the 8th International IBPSA Conference, Eindhoven, The Netherlands, 11–14 August 2003; IBPSA: Eindhoven, The Netherlands, 2003; pp. 299–306. [Google Scholar]
  45. American Society for Testing and Materials (ASTM). Standard Guide for Statistical Evaluation of Indoor Air Quality Models (D5157-91); American Society for Testing and Materials (ASTM): West Conshohocken, PA, USA, 1991. [Google Scholar]
  46. Korea Meteorological Administration, Korean Weather Data. Available online: https://www.weather.go.kr/m/eng/index.jsp (accessed on 19 November 2022).
  47. Mohamed, S.; Rodrigues, L.; Omer, S.; Calautit, J. Overheating and indoor air quality in primary schools in the UK. Energy Build. 2021, 250, 111291. [Google Scholar] [CrossRef]
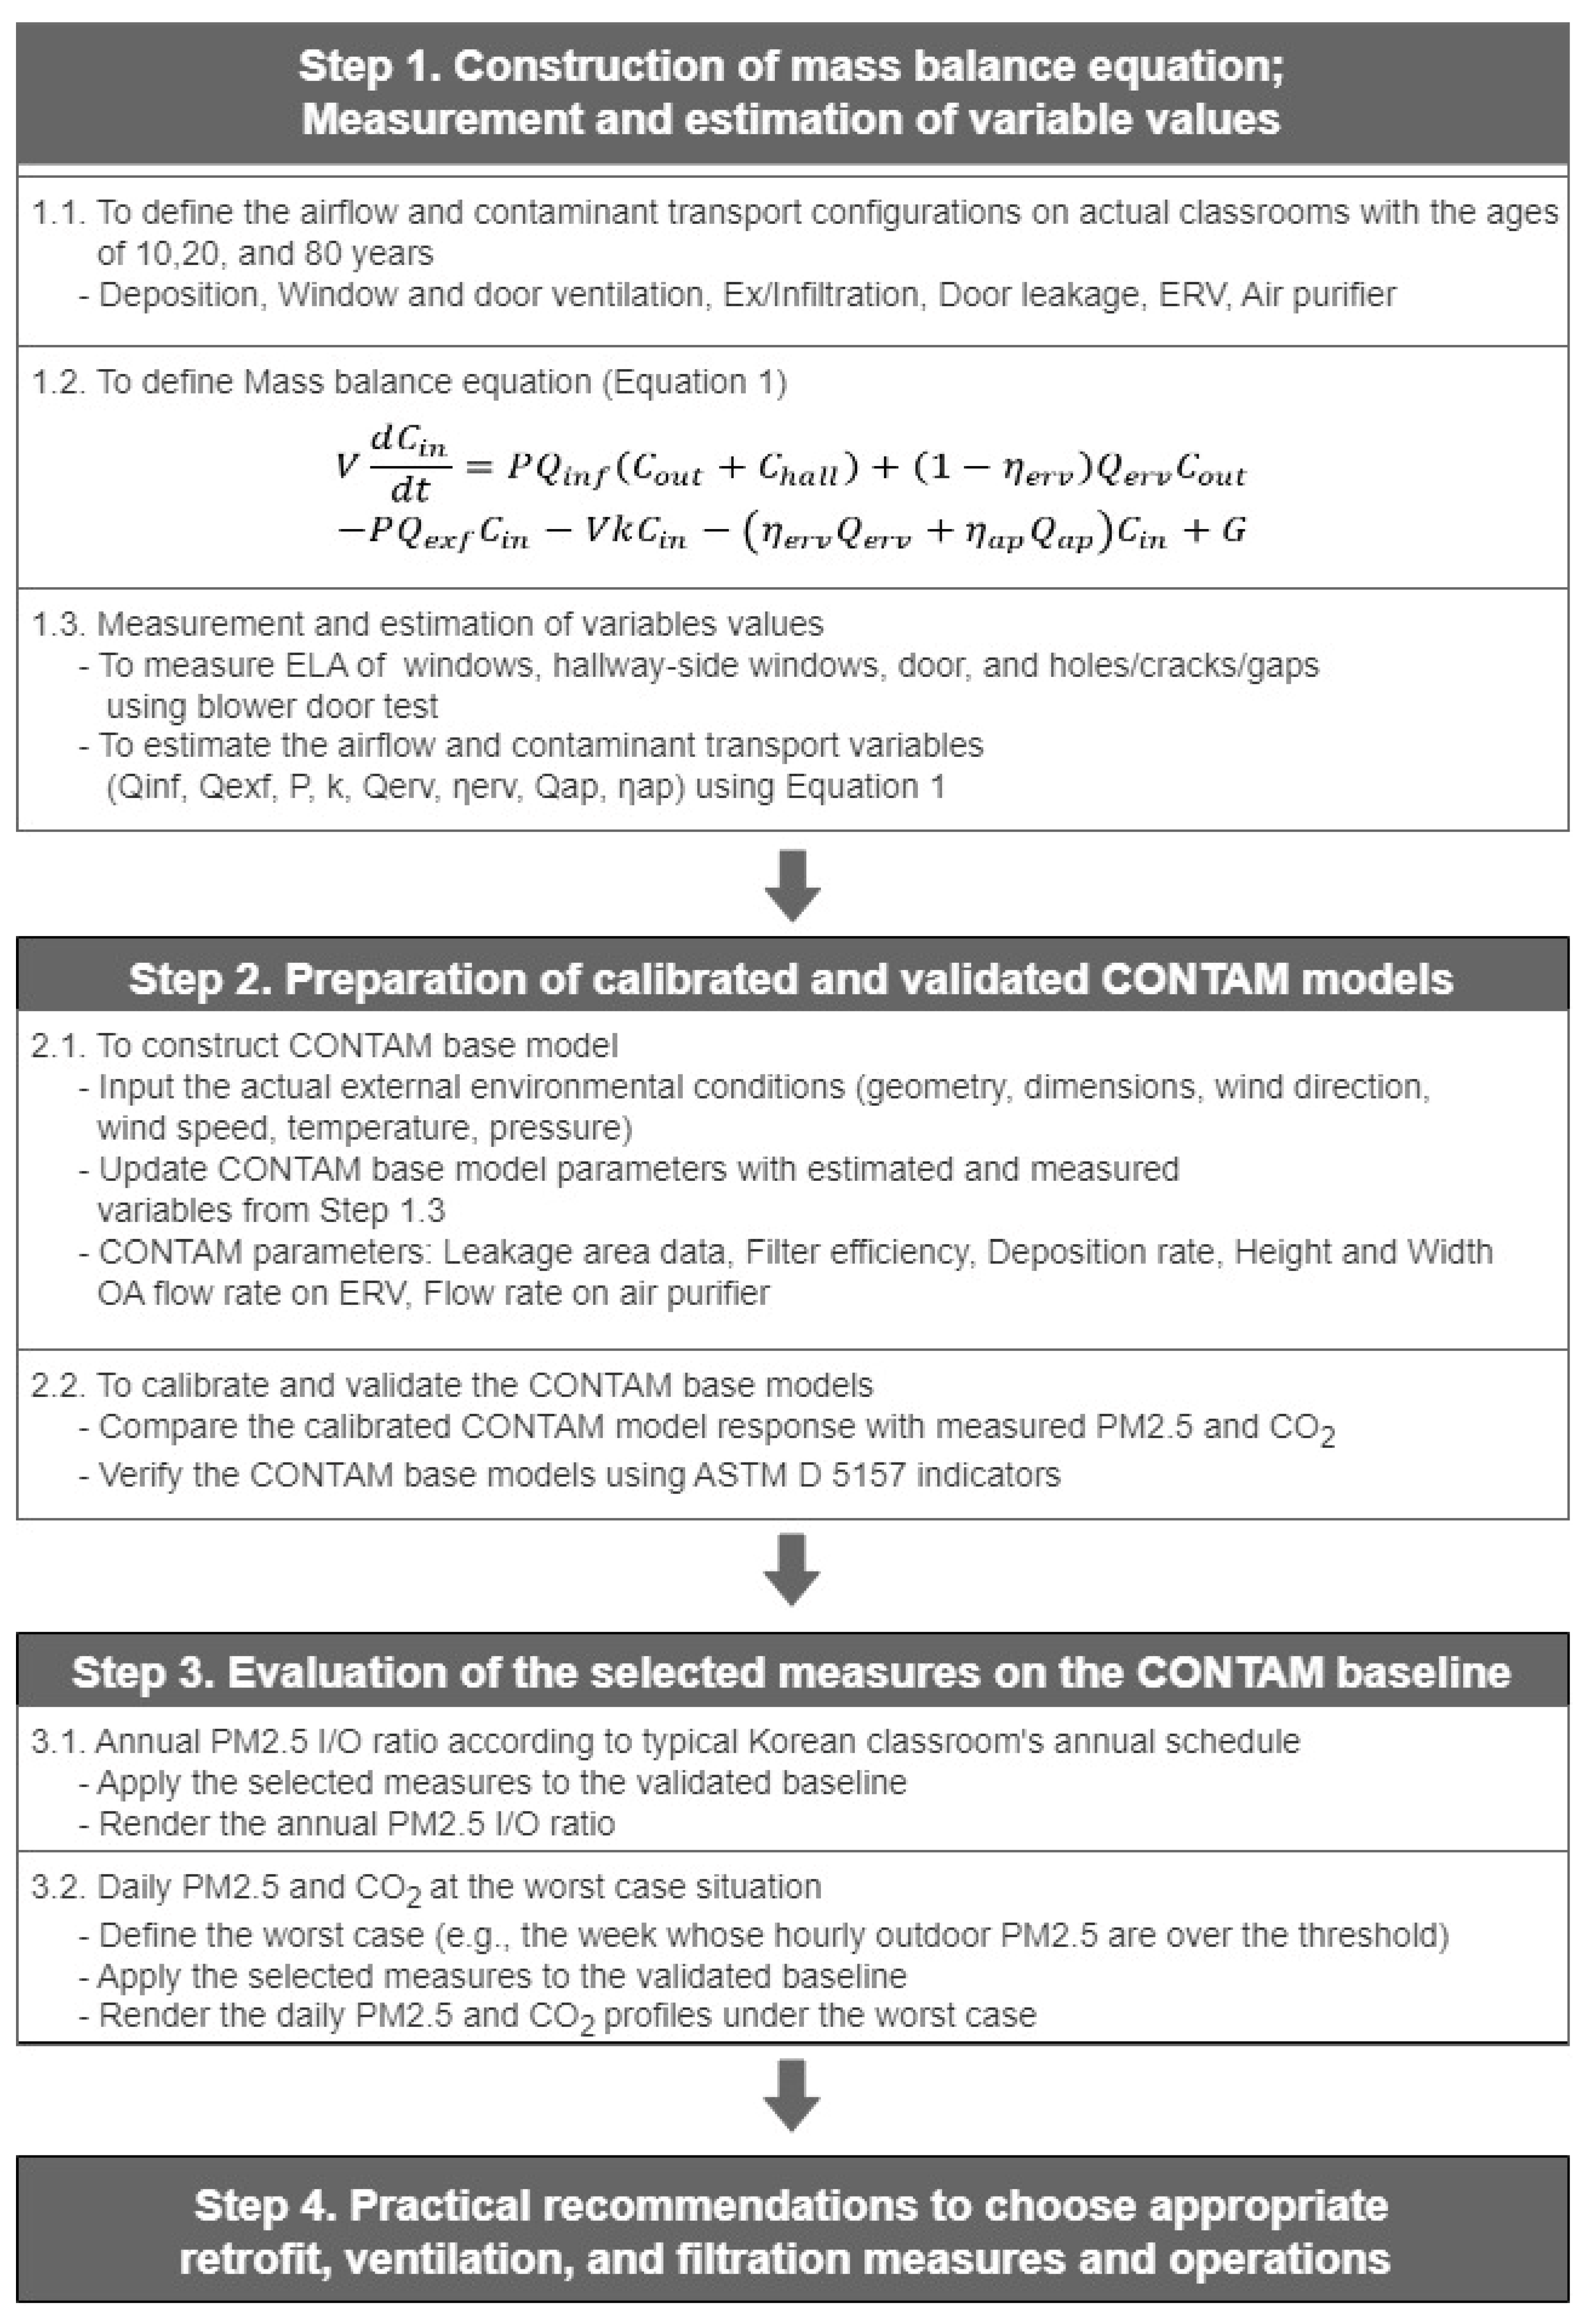
Figure 1. Flow of the study.
Buildings 13 01033 g001
Figure 2. Airflow and contaminant transportation in typical domestic classroom (either overhead ERVs or floor-standing ERVs are installed).
Buildings 13 01033 g002
Figure 3. (a) Case D classroom (2.7 m ceiling height) (measured from 14 to 15 July in 2021). (b) Case I classroom (2.5 m ceiling height) (measured from 26 April to 12 May in 2021). (c) Case M classroom (2.6 m ceiling height) (measured from 24 January to 2 February in 2022).
Buildings 13 01033 g003
Figure 4. (a) CONTAM baseline of Case D (all windows and doors closed; neither ERV nor AP in operation). (b) CONTAM baseline of Case I (all windows and doors closed; neither ERV nor AP in operation). (c) CONTAM baseline of Case M (all windows and doors closed; neither ERV nor AP in operation).
Buildings 13 01033 g004aBuildings 13 01033 g004b
Figure 5. (a) CO2 decay scenario of Case D. (b) CO2 decay scenario of Case I. (c) CO2 decay scenario of Case M. (d) PM2.5 decay scenario of Case D. (e) PM2.5 decay scenario of Case I. (f) PM2.5 decay scenario of Case M. (g) Door open scenario of Case D. (h) Door open scenario of Case I. (i) Door open scenario of Case M. (j) Cross-ventilation scenario of Case D. (k) Cross-ventilation scenario of Case I. (l) Cross-ventilation scenario of Case M. (m) ERV operation scenario of Case I. (n) ERV operation scenario of Case M. (o) AP operation scenario of Case D. (p) AP operation scenario of Case I. (q) AP operation scenario of Case M.
Buildings 13 01033 g005aBuildings 13 01033 g005b
Figure 6. (a) Annual PM2.5 I/O ratio in Case D. (b) Annual PM2.5 I/O ratio in Case I. (c) Annual PM2.5 I/O ratio in Case M. (* Natural ventilation was introduced when the daily average outdoor PM2.5 was lower than 35 μ/m3).
Buildings 13 01033 g006
Table 1. Most frequently chosen building measures for domestic classroom retrofits.
Building MeasuresMajor AdvantagesMajor Weaknesses
Insulation added to exterior walls (form-board, loose-fill, sprayed-form insulation)
  • Reduce energy demands by increasing thermal resistance (e.g., ≤0.24 W/m2 of U-value *)
  • Reduce air leaks by sealing and caulking gaps and cracks, and applying primer before installing insulation
  • Enhanced fireproofing
  • Unexpected air and water leaks and contaminant inflows, if not properly shielded, filled, or continuously covered (i.e., construction defect)
  • Some form and fiberglass insulation may off-gas
  • Loose-fill insulation with high perm rating may transport moisture toward the structure
Exterior performance windows
  • Increase thermal resistance of glazing; reduce thermal breaks of frame (e.g., ≤1.50 W/m2 of U-value *)
  • Reduce air leaks by enclosed frameset and weatherstripping (e.g., ≤1.0 m3/h per unit area @dP 10 Pa **)
  • Unwanted air and contaminant inflows, if the gap between window set and wall is not properly sealed and weather-stripped (i.e., construction defect)
  • Only for exterior windows, while interior and transom windows have lower priority
Exterior performance doors
  • Increase thermal resistance of glazing; reduce thermal breaks of frame (e.g., ≤1.50 W/m2 of U-value *)
  • Reduce air leaks by enclosed frameset (e.g., ≤1.0 m3/h per unit area @dP 10 Pa **)
  • Often barrier-free doors let air and water leaks and contaminants in, if there is no or low sill
  • Drains installed together may decrease air tightness
  • Only for exterior doors, not classroom doors
Heated micro-cement, or hardwood floors with insulation
  • Reduce energy demands by increasing thermal resistance (e.g., ≤0.81 W/m2 of U-value *)
  • Less deposition and resuspension of contaminants
  • Heated floor requires separate hot water loop, boilers, and independent controls
Acoustic ceiling tiles
  • Plenum reduces direct heat again and loss over the space
  • Hidden inter-walls over the ceiling are reinforced before new ceiling, thus reducing air leaks and penetration between classrooms
  • Inter-walls over the ceiling often contain gaps and cracks if they are not treated properly
* Effective as of 2022, in the case of the schools in Seoul [33]. ** KS F 2292 certified airtight first grade window set [34].
Table 2. Most frequently chosen system measures for domestic classroom retrofits.
System MeasuresMajor AdvantagesMajor Weaknesses
VRF system
  • High coefficient of performance (COP)
  • Comparatively convenient installation
  • Can be under the enforced demand reduction controls
  • Frequent electricity peaks in summer
  • Lower heating efficiency in severe winter
Package air conditioner (PAC)
  • High COP (cooling only)
  • Convenient installation without outdoor unit
  • Can be under the enforced demand reduction controls
  • Frequent electricity peaks in summer
Electric heater
  • Clean and comfort radiant heating
  • Convenient installation and least maintenance
  • High heating cost
  • Frequent electricity peaks in winter
ERV system
  • Provides humidity-controlled fresh air while saving air-conditioning energy
  • Reduces condensation and filters out contaminants
  • Can be under the enforced demand reduction controls
  • Can be noisy (>55 dB) when installed exposed to indoor
  • Sophisticated interlock controls with VRF required
Air purifier (AP)
  • Filters out contaminants in the recirculated air
  • Can be an alternative when mechanical ventilation is not feasible
  • No CO2 control
  • Fresh air still required
  • Independent controls (i.e., need to be manually operated by occupants)
Table 3. Selected building retrofit measures.
Building MeasuresActionsDescription and Remark
B1To replace external windowsTo reduce air leakage and penetration of the outdoor contaminants through the window perimeterSystem window set with the first-grade airtight (infiltration ≤ 1.0 m3/hm2 at dP 10 Pa [34]; effective leakage area (ELA) ≤ 0.593 cm2 per unit window area)
B2To replace classroom doorsTo reduce air leakage and penetration of the hallway contaminants through the door perimeter(a) Economy rail sliding door (the airtight 30th-grade [37]; infiltration ≤ 30.0 m3/hm2 at dP 10 Pa [34]; ELA ≤ 17.791 cm2 per unit door area)
(b) System door set with the airtight first-grade (infiltration ≤ 1 m3/hm2 at dP 10 Pa [34]; ELA ≤ 0.593 cm2 per unit door area)
B3To replace hallway-side windows in the classroomTo reduce air leakage and penetration of the hallway contaminants through the window perimeter(a) PVC double-pane window set (the airtight sixth-grade [38]; infiltration ≤ 6.0 m3/hm2 at dP 10 Pa [34]; ELA ≤ 3.439 cm2 per unit window area)
(b) System window set with the first-grade airtight (infiltration ≤ 1.0 m3/hm2 at dP 10 Pa [34]; ELA ≤ 0.593 cm2 per unit window area)
B4To increase the airtightness of the classroom enclosureTo reduce air leakage and penetration of the ambient contaminants by caulking/sealing/gasketing/taping the cracks and gaps of brick/masonry walls, slab, penetrating wires/ducts, power inlet, vent, drains, etc.3.0 ACH50 that corresponds to the airtightness of a high-energy-performance residential building [39]; ELA ≤ 0.091 cm2 per unit room air volume
Table 4. Selected system ventilation and filtration measures.
System MeasuresActionsDescription and Remark
S1To install new ERVsTo provide the required ventilation rate of OA (typically 800 CMH for 25 occupants) with 80% filter efficiency(a) Silent operation at 600 CMH
(b) Normal operation at the rated 800 CMH
S2To replace the existing ERV filterTo replace the existing filter with MERV 15 [40]95% filter efficiency
S3To install new APsTo provide the air filtration using HEPA filters for at least 150% of the standard classroom area [35] (a) Single AP: 900 CMH with 99% filter efficiency (for 170% of the standard classroom area)
(b) Dual APs: 600 CMH*2EA with 99% filter efficiency (for 220% of the standard classroom area)
Table 5. Natural ventilation during class hours.
Natural VentilationActionsDescription and Remark
NwinNatural ventilation by opening windowsTo introduce the outdoor air by opening windowsAverage daily PM2.5 concentration ≤ 35 μg/m3; 22 °C ≤ outdoor temperature ≤ 28 °C
NcvCross-ventilationTo introduce a through outdoor airflow by opening windows and doors(The same as above)
Table 6. Estimated and measured airflow and contaminant transport variables of classroom.
VariablesCase DCase ICase M
λinf (1/h)0.20.10.47
λexf (1/h)0.30.10.47
PPM2.510.40.9
kPM2.500.250.2
Qerv (m3/h)-641.2 (Rated: 800 CMH)690.4 (Rated: 800 CMH)
ηerv-0.60 (Rated: 0.80)0.75 (Rated: 0.80)
Qap (m3/h)414 (Rated: 650 CMH)405 (Rated: 650 CMH)622 (Rated: 650 CMH)
ηap0.70 (Rated: 0.85)0.70 (Rated: 0.85)0.80 (Rated: 0.85)
ELA of south windows155.3 cm2 (69.330 cm2/m2)-3.6 cm2 (1.667 cm2/m2)
ELA of east windows230.6 cm2 (102.946 cm2/m2)383.1 cm2 (85.513 cm2/m2)-
ELA of hallway-side windows-36.6 cm2 (10.007 cm2/m2)-
ELA of door150 cm2 (46.875 cm2/m2)676.2 cm2 (160.904 cm2/m2)169.8 cm2 (35.375 cm2/m2)
ELA of holes/cracks/gaps968.6 cm2 (6.726 cm2/m3; 32 ACH50)347.8 cm2 (2.058 cm2/m3; 9.8 ACH50)432.1 cm2 (2.223 cm2/m3; 10.6 ACH50)
Table 7. Updating the corresponding CONTAM parameters with the estimated and measured variables.
VariablesCorresponding CONTAM Parameters
ELA of window, door, and hole/cracks/gapsAirflow path element → One-way flow using power law type → Leakage area data
PAirflow path element → One-way flow using power law type → Filter → Constant efficiency filtration model → Filter efficiency
kSource/sink element → Deposition rate sink model → Deposition rate
Opened window, opened doorAirflow path element → Two-way flow type → One-opening → Height and width
Q e r v Simple air handling system → Minimum OA flow
η e r v Simple air handling system → Outdoor air filter → Constant efficiency filtration model → Filter efficiency
Q a p Duct Segment Properties → Duct flow element → Constant volume flow → Design maximum flow rate
η a p Simple air handling system → Recirculation air filter → Constant efficiency filtration model → Filter efficiency
Table 8. ASTM D5157 accuracy and bias criteria for calibrated Case D base model.
ScenarioRabNMSEFBFS
CO2 decay0.9921.16131.650.010.040.30
PM2.5 decay0.9810.993.360.020.27 *0.15
Door open0.920.49 **11.4 **0.43 **0.121.12 **
Window open0.81 *0.73 *9.60.010.070.01
Cross-ventilation0.970.57 **22.6 **0.070.110.96 **
* Slightly overrated or underrated; ** seriously overrated or underrated.
Table 9. ASTM D5157 accuracy and bias criteria for calibrated Case I base model.
ScenarioRabNMSEFBFS
CO2 decay0.971.29 **535.4 *0.010.010.54
PM2.5 decay0.991.37 **26.3 **0.010.070.62 *
ERV operation0.970.9811.70.200.41 **0.01
AP operation0.970.953.10.010.000.03
Door open0.89 *0.8925.2 **0.42 **0.63 **0.80 **
Window open0.990.868.40.020.090.29
Cross-ventilation0.980.843.50.030.040.32
* Slightly overrated or underrated; ** seriously overrated or underrated.
Table 10. ASTM D5157 accuracy and bias criteria for calibrated Case M base model.
ScenarioRabNMSEFBFS
CO2 decay0.981.09128.50.060.200.15
PM2.5 decay0.991.217.30.030.070.39
ERV operation0.991.035.50.040.180.07
AP operation0.991.012.60.010.090.03
Door open0.980.783.80.050.100.47
Window open0.990.838.20.020.070.37
Cross-ventilation0.97480.57 **21.00.230.29 *0.98 **
* Slightly overrated or underrated; ** seriously overrated or underrated.
Table 11. Annual schedule applied to CONTAM models.
Winter VacationSpring#1Spring#2Spring#3Summer VacationFall#1Fall#2Fall#3
1/1–2/283/1–4/254/26–5/265/27–6/307/1–8/319/1–10/510/6–11/1311/14–12/31
Hour0–99–1515–240–99–1515–240–99–1515–240–99–1515–240–99–1515–240–99–1515–240–99–1515–240–99–1515–24
Set point temperature-162016162016302630-302630162016122012
Classes? *NoYesNoYesNoYesNoYesNoYesNoYesNo
Natural ventilation? **NoNoNoYesNoNoNoNoNoYesNoNoNo
Heating or cooling?NoHeatingNoNoNoCoolingNoCoolingNoNoNoHeatingNo
* Classroom doors open every access hour, break, and lunchtime; ** only when average outdoor PM2.5 ≤ 35 μg/m3.
Disclaimer/Publisher’s Note: The statements, opinions and data contained in all publications are solely those of the individual author(s) and contributor(s) and not of MDPI and/or the editor(s). MDPI and/or the editor(s) disclaim responsibility for any injury to people or property resulting from any ideas, methods, instructions or products referred to in the content.