Abstract
Starting from considerations on the high seismic vulnerability of nonstructural elements, and at the same time the scarce consideration of their performance at the different stages of the design and assessment process, this paper proposes a very simple and ready-to-use seismic classification scheme for nonstructural elements. The proposed approach is based on a limited set of information, which may take advantage of the availability of a numerical model of the building and its results, although it may also rely on code formulations and evaluations of seismic performance from the literature. The different seismic classes are assigned to nonstructural elements by quantifying their expected seismic performance by means of fragility curves. This classification may be applied to newly designed nonstructural elements to help identify the best typology for the site and building of interest, and also for existing nonstructural elements that are already installed in existing buildings. In the latter case, the classification may help in defining a prioritization scheme for interventions required to make nonstructural elements safer for the building of concern. The feasibility of the proposed procedure is demonstrated by its application to two case studies, referring to existing buildings located at different seismicity sites.
1. Introduction
The idea of identifying criteria for the seismic classification of nonstructural elements arises from a series of considerations. Recent seismic events that occurred in Italy and worldwide highlighted once more the very high vulnerability of nonstructural elements, which are often damaged even by medium-low seismicity events and for seismic intensity levels lower than those associated with structural damage [1,2,3,4,5,6]. This can cause large reconstruction costs and impact on post-earthquake usability.
This aspect is even more relevant in the case of strategic buildings, such as hospitals or police stations, whose operational condition is fundamental in the aftermath of an earthquake, not only for the life-safety of occupants, but also to address the immediate post-event emergency.
There are unfortunate cases of buildings for which the structural damage was rather limited but the damage to nonstructural elements was such as to make them unusable. A recent example regards some of the buildings of the San Salvatore hospital in L’Aquila (e.g., [7,8]), which were declared unusable after the 2009 event due to nonstructural damage, in a time in which their operation would have been strategic for the affected area (Figure 1). Another recent example is the Amandola hospital, which suffered significant nonstructural damage during the 2016–2017 Central Italy seismic sequence [9].
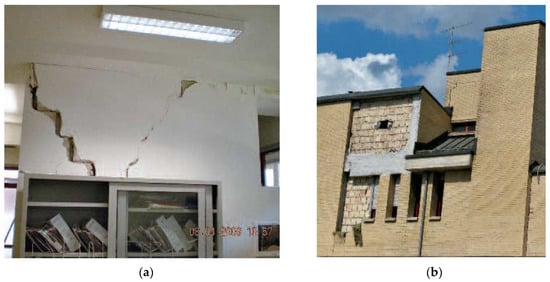
Figure 1.
Examples of nonstructural damage detected in the San Salvatore hospital in L’Aquila after the 2009 event (pictures from [7]): (a) damage to internal partitions; (b) collapse of masonry veneers outside one of the hospital buildings.
Despite these considerations, seismic engineering has been traditionally focusing on the responses of structural systems and damage to structural elements, overlooking the fact that a given performance target can be reached only if the entire “building system” is able to adequately respond in case of an earthquake. The collapse of architectural, mechanical, or plant elements can significantly hinder the seismic performance of the entire building, making it unusable and not guaranteeing sufficient safety.
In the framework of performance-based earthquake engineering, similarly to most existing seismic codes worldwide, performance criteria for structural behavior are defined with reference to different limit states. Nevertheless, the indications specific for nonstructural elements are at most qualitative, apart from the requirement to check the structure to be sufficiently rigid by imposing that interstory displacements do not exceed predefined thresholds. This approach can be appropriate for drift-sensitive nonstructural elements (e.g., infills) only, and in general it can be stated that the attention on nonstructural elements and systems is not sufficient.
The seismic vulnerability of structures and buildings has been widely studied, both via the statistical elaboration of post-earthquake damage data [10,11,12,13,14,15] and via numerical approaches [16,17]. On the other hand, the analysis of the seismic vulnerability of nonstructural elements still requires specific studies, also because the economic loss associated with nonstructural damage plays a relevant role in the overall cost evaluation.
Several efforts have been recently made to better characterize the seismic responses of nonstructural elements by means of both experimental tests [18,19,20] and numerical analyses [21,22]. At the same time, the results and information available in the literature have been organized and collected into databases.
The development of specific testing protocols for the different typologies of nonstructural elements will help defining qualification procedures, allowing the designer to select the best characteristics of the different elements, depending on the structural typology and required performance [23]. For these reasons, testing protocols to be adopted for static and dynamic tests on building elements have been recently proposed (e.g., [24,25,26]).
The Idea of Introducing a seismic classification scheme for nonstructural elements was firstly suggested by the increasing attention to the energy performance of buildings, which resulted in Italy in the introduction of the requirement of an energy classification for both for new and existing buildings. At the same time, there has been in Italy in the last years significant funding for the upgrading of existing buildings, with reference in most cases to energy efficiency and in some cases to structural strengthening or seismic retrofitting. It is, however, evident that the significant investment required to improve the energy efficiency of an existing building (e.g., with replacement of external cladding, partitions, and fixtures) would be dramatically lost if smart and efficient nonstructural elements are not able to withstand extreme loads, such as seismic actions.
This context inspired the idea of proposing a seismic classification scheme for nonstructural elements based on a quantitative evaluation of their seismic performance. There is, however, the need to distinguish between newly designed nonstructural elements, for which a seismic classification would allow the engineer to design elements with seismic performance levels appropriate for the characteristics of the building and the seismic hazard at the site, and nonstructural elements already installed in a building. In the latter case, a classification system would not be oriented to their seismic design for a given performance level, but rather it could aim at evaluating their seismic capacity and establishing possible prioritization criteria for seismic upgrading of the different typologies of elements within the building. So far, the choice of a given typology of nonstructural elements (e.g., fixtures) has been traditionally driven by architectural and energy considerations, without any attention or knowledge of the expected seismic performance.
This work presents and proposes a seismic classification scheme based on the use of appropriately selected fragility curves and targeted for application in existing buildings. After a very brief state-of-the-art overview on similar existing procedures, the proposed scheme is discussed and its feasibility is shown by applying it to two case studies.
2. Literature Approaches for Classifying Nonstructural Elements
Few procedures have been recently proposed for the classification of seismic risk of structures. Among these, it is worth mentioning the seismic risk classification scheme currently in force in Italy, which allows one to access the tax benefits of the so-called Sismabonus [27,28]. This addresses the building as a whole and assigns the risk classes considering the most critical of two parameters, i.e., a safety index and the average expected annual loss. In particular, the safety index is defined based on the ratio of the maximum peak ground acceleration capacity of the structure and the acceleration demand corresponding to a life safety condition, i.e., the acceleration value that would be used for designing a new building. The average expected annual loss is calculated as the area below the curve obtained by associating earthquakes with different probabilities of exceedance and the corresponding expected loss, in terms of the percentage of the reconstruction cost. The role of this parameter in characterizing the seismic vulnerability of buildings has been discussed in the literature (e.g., [29,30]).
Similarly, in the international context, alternative classification approaches were proposed, such as the FEMA P-58 guidelines [30,31] and the Resilience-Based Earthquake Design Initiative (REDiTM) Rating System [32]. These methods are mostly focused on the seismic risk of structural elements, whereas nonstructural elements are not explicitly tackled.
The literature referring to nonstructural elements is indeed rather limited, although consideration of their performance would be crucial for enhanced safety and to prevent the possible loss of functionality of the building. Filiatrault et al. [33] proposed a framework for the application of direct displacement-based seismic design to nonstructural building elements, to be applied mainly to acceleration-sensitive elements suspended or anchored at a single location (floor) in the supporting structure and for which damage is the result of excessive displacements (e.g., piping systems, cable trays, suspended ceilings, etc.). However, the proposed seismic design strategy for nonstructural elements requires detailed knowledge of the cyclic behaviors of a multitude of nonstructural typologies commonly used in buildings, and this type of information is currently not available.
Sullivan et al. [34] proposed a seismic classification scheme for nonstructural elements in terms of interstory drift ratio and peak floor acceleration. A specific type of nonstructural element would be classified according to its critical drift (or acceleration) capacity, established relative to the two limits indicated for both serviceability and ultimate limit states (defined consistently with limits enforced by the New Zealand code). The class is assigned based on the critical capacity of the element, i.e., the capacity leading to the most unfavorable class, between the two considered limit states. This approach aligns well with the code-based limit state checks employed in the New Zealand context and offers a clear and simple way to rate the nonstructural element performance for practitioners. A possible critical point consists of the definition of the limits corresponding to the two limit states for different nonstructural element groups, also due to the need to ensure the comparability of the expected performances of all nonstructural elements examined. If indeed drift-based limits are set too conservatively and floor acceleration-based limits are not set conservatively by the analyst, then there may be a mismatch in the ratings assigned between nonstructural element groups and the actual performance expected.
An Interesting approach has been recently proposed by O’Reilly and Calvi [35] for quantifying the level of performance or risk of a certain nonstructural element damage level within a given building typology. The seismic risk is quantitatively assessed in terms of the mean annual frequency of exceedance of limit states, which are of interest for nonstructural elements (e.g., life safety, loss of functionality, etc.). The approach is probabilistic and allows one to account for different sources of aleatory and epistemic uncertainty, but it requires information on seismic hazard and dynamic characteristics of both the nonstructural element and the structure in which it is installed.
The scheme of the proposed method utilizes detailed relationships to describe the structural response in a probabilistic manner, in addition to the available nonstructural elements’ fragility functions determined from experimental testing.
A tentative classification scheme was proposed by O’ Reilly and Calvi [35] using the values of the mean annual frequency of exceedance of specific damage states, creating a scoring system to classify the performance into a letter-based system. This is in line with the approach proposed in the Sismabonus guidelines, with the significant difference that Sismabonus considers the performance of a building as a whole, whereas this classification scheme only refers to nonstructural elements within a building. This approach may lead the way for the development of a nonstructural element performance classification system, whereby manufacturers can associate a given level of certified seismic performance to their product (for a range of structural typologies and locations), similar to what is currently done for the energy classification of buildings via CasaClima in Italy [36].
Although setting the limits assigned to the different rating levels appears to be a complex and debatable issue, probably requiring further research and discussion, the approach proposed by O’ Reilly and Calvi [35] seems more robust and complete than other existing approaches based on demand/capacity ratios, as included in several codes.
Recently, Merino et al. [37] also proposed a seismic classification procedure for nonstructural elements, which is, however, based on the results of shaking table tests of the element of interest, performed following an expressly defined testing protocol.
3. Proposed Classification Method
The proposed classification method for nonstructural elements is based on the use of fragility curves and it was developed with reference to nonstructural elements installed in an existing building. In most practical cases, it is not feasible or it is not economically sustainable to perform experimental tests on the different nonstructural elements of an existing building. To overcome this issue, while still providing a quantitative measure of the expected seismic performance, a typological classification of these elements can be adopted and the seismic performance of each typology can be characterized by using fragility curves.
Fragility curves provide the probability of exceeding a selected damage level or limit state as a function of an intensity measure or an engineering demand parameter, representing the severity of the applied seismic input, which is eventually filtered by the structural response. In the case of nonstructural elements, this parameter may be the peak ground acceleration (PGA), while the peak floor acceleration (PFA) may be used for elements that are sensitive to acceleration or the interstory drift ratio (IDR) for elements sensitive to displacement or drift [24]. These curves can be obviously obtained using experimental or numerical tests of the specific nonstructural element typology. However, when this is not the case, fragility curves corresponding to similar building elements can be selected from the literature.
The proposed method associates seismic risk classes to nonstructural elements based on predefined intervals of values of the probability of exceeding a given limit state, according to the scheme reported in Table 1. The selected criterion is somehow analogous to what was proposed, for example, by Calvi et al. [29] for the seismic risk classification of structures based on expected annual losses. Analogies can be found also with the energy efficiency classes currently assigned to buildings according to the guidelines enforced by the DM 26-06 [38], which rate the energy quality of a building by means of the energy requirements for heating, hot water production, and lighting and the corresponding costs.

Table 1.
Proposed seismic risk classes for nonstructural elements in terms of the probability of exceedance (PE).
Table 1 shows that the exceedance probability intervals associated with higher classes are narrower than those associated with lower classes. This is derived from the attempt of encouraging as much as possible the implementation of retrofit interventions aiming at reducing the seismic vulnerability of the different typologies of nonstructural elements. The selection of the intervals reported in the table is the result of an iterative procedure mainly based on expert judgment and calibrated on case study buildings, a couple of which will be introduced in a following section. The adoption of irregularly spaced intervals was aimed at differentiating as much as possible the class associated with nonstructural elements with different expected performance results to be able to identify a hierarchy of intervention priorities. This was also calibrated with reference to sites characterized by different levels of seismicity, as this parameter influences the classification outcome. The proposed intervals could be obviously modified and defined based on a stronger statistical basis, without questioning the general framework of the proposed classification.
To better illustrate the proposed method, Figure 2 shows a graphical example of an evaluation of the seismic class for a generic nonstructural element sensitive to peak floor acceleration, for which a fragility curve is available for a given limit state. Assuming that the PFA evaluated for a suitable level of seismic action selected for assessing the limit state of interest is equal to approximately 0.60 g, the probability of exceedance of the considered limit state can be easily deduced from the fragility curve as equal to approximately 0.40. Therefore, from Table 1, the considered nonstructural element would belong to class C.
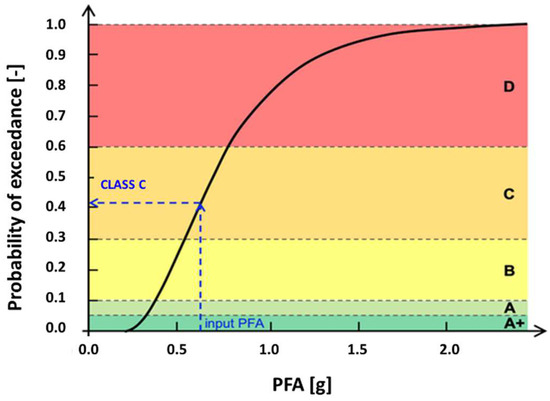
Figure 2.
Graphical representation of seismic risk evaluation for a generic nonstructural element, according to the proposed approach.
In many practical cases, for a given nonstructural typology, different limit states could be of interest, and each of them should be characterized by a specific fragility curve. In addition, some typologies of nonstructural elements could be sensitive to both acceleration and displacement or drift quantities, depending on the type of behavior of interest. An example could be the seismic behavior of the infills, whose in-plane response is mainly governed by interstory drift, whereas the out-of-plane behavior is typically sensitive to acceleration (either PGA or PFA). In these cases, the seismic class evaluation should be performed for each limit state or for each engineering demand parameter of interest and the most unfavorable class should be then assigned to the nonstructural element.
An example is reported in Figure 3, referring to a generic nonstructural element, for which a fragility curve in terms of drift is available for the damage limit state (DLS) and two fragility curves in terms of acceleration are available for both the damage limit state and life safety limit state (LSLS). After assessing the seismic class for each scenario, the most unfavorable one, i.e., class C, is assigned to the element.
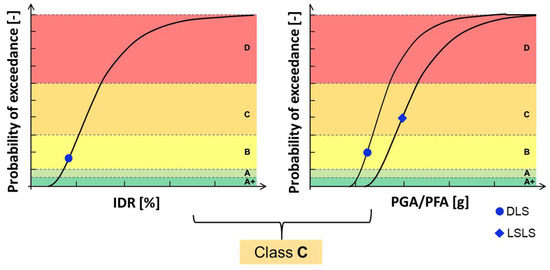
Figure 3.
Example of the application of the seismic risk evaluation for a generic nonstructural element, in case of more than one fragility curve.
When applying the proposed approach to an existing building, nonstructural element typologies of interest need to be identified and appropriate fragility curves need to be selected or derived. To then identify the seismic risk class associated with each nonstructural element, it is necessary to know the seismic input parameter (PGA, PFA, IDR) required to evaluate the probability of exceedance of the limit states of interest and to select the seismic class. The PGA at a given site is readily available by knowing the soil and topographic category. If fragility curves are available for more than one limit state, the seismic Input needs to be evaluated for each limit state of interest using the appropriate description of seismic hazard at the site.
PFA can be evaluated basically with two alternative approaches:
- From the floor acceleration time histories and the corresponding floor spectra, derived from specific numerical analyses of the building of interest;
- From the code floor spectra or other literature formulations using an amplification factor accounting for the height of the floor where the nonstructural element is installed. In this case, the choice of the formulation to be applied depends mainly on the level of information available on the building. Indeed, some formulations require knowledge of the dynamic behavior of the building [39,40], whereas others are very simple and do not need specific information on the considered case study [41,42].
As widely discussed in the literature (e.g., [43,44]), the evaluation of PFA is a complex issue, especially when buildings are irregular or present some peculiar characteristics inducing amplification, as is typical in existing buildings. The seismic demand on nonstructural elements is also influenced by the record selection adopted for defining the seismic demand on the structure (record-to-record variability) and by the level of nonlinearity in the structural behavior. A detailed discussion of this issue is beyond the scope of this manuscript. Although the results of the proposed classification scheme may be affected by the approach adopted for defining the seismic demand on nonstructural elements, the applicability of the proposed approach simply requires the definition of the intensity measure of interest being consistent with the definition adopted in the derivation of fragility curves.
Similarly to PFA, the IDR can be calculated from numerical time history analyses of the building. If a time history analysis of the building of interest is not available, there are two possible approaches for estimating IDR:
- If a modal analysis can be performed, the method by Miranda [45] can be applied to evaluate the IDR at the level of interest, considering only the contribution of the first vibration mode of the structure. This approach will be briefly discussed in the following section with reference to the considered case study buildings;
- If no analysis has been carried out, it is still possible to estimate the IDR according to the Miranda method [45] if several approximations can be deemed applicable: (1) only the contribution of the first vibration mode of the structure is considered; (2) the distribution of masses along the height of the building is assumed to be uniform; (3) the lateral stiffness is assumed to be uniform along the height of the building; (4) the participation factor is computed using an approximate shape function instead of the first vibration mode.
Alternatively, it is still possible to estimate the maximum IDR of the building using the Napolitano et al. [46] approach. This approach allows the evaluation of the maximum IDR value of the building by assuming different distributions of the lateral stiffness along the building height (i.e., uniform, parabolic, linear). The different distribution of the lateral stiffness along the building height is considered by a factor that depends on the number of floors and the distribution of the lateral stiffness on each floor of the building. In particular, this factor is defined as the ratio between the average and the maximum interstory drift.
This approach appears to be easier to use, especially in cases when it is complicated to define a numerical model for existing buildings. However, sometimes, it could probably be very conservative, since it is based on the maximum IDR value of the entire building rather than the IDR value at the level of interest.
4. Examples of the Application of the Proposed Classification Method
The feasibility of the proposed procedure was tested by applying it to an existing case study building, with the aim also of calibrating the probability intervals identifying the different seismic classes.
4.1. Case Study Building
The considered building is a multitenant office building located in northern Italy. It is a reinforced concrete two-story building, with an additional basement level and with a parking area on the flat roof, whose construction finished in 1986. It is characterized by external ceramic panels and large continuous ribbon windows along the four sides (Figure 4a).
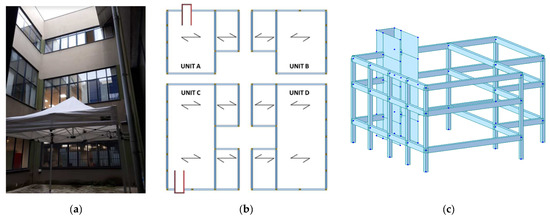
Figure 4.
Case study building: (a) picture of the building exterior from the courtyard; (b) structural scheme of the building, with identification of the four independent units and the direction of spanning of the floors; (c) view of the 3D numerical model of unit A.
The basement of the building hosts technical rooms and laboratories; the first level includes a cafeteria and a gym, whereas the second level is allocated to offices. From a structural point of view, the building is subdivided into four independent units by means of seismic joints (Figure 4b).
A finite element model of the building was constructed with the software Midas Gen, 2022 v.2.1, using “beam” and “shell” elements. Infills were not explicitly modeled, but only considered in terms of mass, neglecting their stiffness contribution according to NTC [47]. Similarly, partitions and false ceilings were also modeled in terms of mass, due to their negligible stiffness contribution. The material parameters, loads, and structural details were defined based on information collected and the simulated design, using manuals and codes from the time of construction of the building (i.e., Santarella [48]).
Figure 4c shows a view of the 3D numerical model of unit A of the considered case study building, whereas Table 2 reports values of the interstory heights and floor masses.
Table 2.
Interstory heights and floor masses of unit A of the considered case study building.
4.2. Modal and Time History Analyses
To identify the dynamic characteristics of the structure, modal analyses were carried out, providing the results summarized in Table 3, referring to unit A of the building. The table reports in particular values of vibration periods and corresponding modal masses and cumulative masses in the three directions for the different modes of unit A.
Table 3.
Results of the modal analysis of unit A of the considered case study building.
Figure 5 shows modal deformations associated with the fundamental mode in the X direction (Figure 5a, mode 1) and with the first mode in the Y direction (Figure 5b, mode 4), identified as the two modes with the highest modal mass in each direction. It should be noted that mode 2 exhibits a significant participant mass in the rotational Z direction. Most likely, this is caused by the effect of stiffness irregularity in the plan caused by the presence of the stairwell.
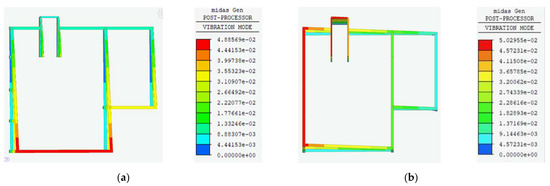
Figure 5.
Modal deformations of unit A: (a) in the X direction (mode 1); (b) in the Y direction (mode 4). The colour scale identifies displacement values.
Time history analyses were carried out to evaluate the amplification of the ground motion induced by the structural response. The selection of accelerograms for time history analyses of buildings is a rather complex aspect, which is widely discussed in the literature (e.g., [49,50,51]), as the record-to-record variability has a significant impact on the results of time history analyses. In this study, the effect of record selection on the results was not explicitly addressed and it was decided to select seven real accelerograms using the software REXELweb v.1 [52], with the spectrum being compatible with the elastic acceleration response spectrum at the site, defined according to NTC [47]. Spectrum compatibility according to the Italian building code requires that the average response spectrum ordinate of the seven selected records, obtained with a damping coefficient of 5%, is not lower by more than 10% or higher by more than 30% than the corresponding spectral ordinate of the reference spectrum, in a range of periods of interest for the building and for the considered return period of the seismic action.
Three return periods were considered, indicated by the Italian code for the assessment of three structural limit states, i.e., the operational limit state (OLS), damage limitation limit state (DLS), and life safety limit state (LSLS), and the corresponding response spectra were defined, assuming soil type B (from Forte et al., [53]) and flat topographic conditions. A nominal life of 50 years was assumed, which is indicated by NTC for ordinary structures, and a class of use of 2, corresponding to buildings with normal crowding, without dangerous substances, and without any essential public or social function. In such cases, the reference period for the seismic action is equal to 50 years.
Table 4 summarizes the values of the parameters defining the elastic response spectrum according to NTC [47] for the seismic actions indicated by the code for the assessment of the three considered structural limit states. Please note that the code also considers a collapse limit; however, this was not further considered in this work, since it refers to a collapse of the building, while the focus of this work was on nonstructural elements. The parameter ag is the peak ground acceleration on rock, while PGA is the value of acceleration at the site, which is assumed to be located on soil type B. F0 is the amplification of the spectrum plateau with respect to PGA and T*c is the corner period indicating the end of the constant acceleration portion of the spectrum.
Table 4.
Parameters defining the elastic response spectrum according to NTC [47] for the considered return periods of the seismic action.
Table 5, Table 6 and Table 7 report the main characteristics of the two-component real records selected for the considered return periods of the seismic action by using the software Rexel. Figure 6 shows the acceleration response spectra of the real accelerograms selected using Rexel and compares their average spectrum (thick blue line) with the reference code spectrum (black continuous line) for the considered limit states.
Table 5.
Characteristics of the real accelerograms selected for a 30-year return period of the seismic action. Mw is the moment magnitude and SF is the scale factor applied to obtain spectrum compatibility.
Table 6.
Characteristics of the real accelerograms selected for a 50-year return period of the seismic action. Mw is the moment magnitude and SF is the scale factor applied to obtain spectrum compatibility.
Table 7.
Characteristics of the real accelerograms selected for a 475-year return period of the seismic action. Mw is the moment magnitude and SF is the scale factor applied to obtain spectrum compatibility.
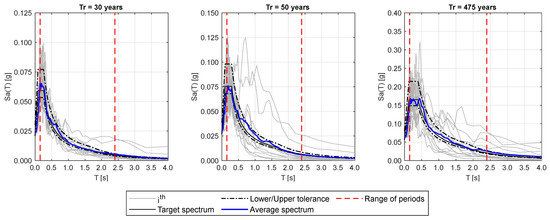
Figure 6.
Acceleration response spectra of the real accelerograms selected using Rexel and comparison of their average spectrum (blue line) with the reference code spectrum (black continuous line) for the considered return periods of the seismic action (Tr).
As already mentioned, accelerograms were selected for the seismic action indicated in the code for assessing three limit states of interest for the structure, identified as the operational limit state (OLS), damage limitation limit state (DLS), and life safety limit state (LSLS), and time history analyses were then carried out to evaluate the amplification at the story level. As discussed in the following, fragility curves describing the seismic performance of nonstructural elements are associated with three nonstructural limit states, identified as the OLS, DLS, and LSLS.
Whereas the definition of operational and damage limit states, referring to nonstructural elements, appears quite trivial, regarding the life safety limit state, it is important to point out that it was defined with reference to occupant safety conditions. This means that a life safety limit state was associated with nonstructural damage conditions threatening the safety of people within the structure. Examples could be the collapse of infills, overturning of massive elements, or even falling of heavy furniture or equipment.
It should be noted that the literature and existing codes do not clearly define the return periods of the seismic action to be adopted for the assessment of nonstructural limit states. The Italian code simply reports a table (Tab. 7.3.III, [47]) in which the assessment of the stability of nonstructural and plant elements is associated with a structural ultimate limit state. Based on these considerations, it was decided to adopt the same seismic action corresponding to structural limit states for the assessment of the corresponding nonstructural limit states, although the authors are aware of the conceptual gap existing on this issue.
In the following, only results obtained for a seismic action with a return period of 475 years will be presented. In particular, Figure 7 shows the floor spectra obtained at the different levels of unit A from analyses with the seven selected records and considering 5% damping. The median (black thick line) and 16/84th percentile (black dashed lines) spectra obtained from the records are also compared with the floor spectra calculated according to NTC [47] and its explanatory commentary [54], Eurocode 8 [42], ASCE 7-16 [55], and the formulation proposed by Vukobratović and Fajfar [39,56]. It should be noted that the levels indicated in the figure correspond to those automatically assigned by the software: level one is positioned at the base of the basement, level two is at the base of the ground story, level three is at the base of the first story, and level four is at the top of the first story.
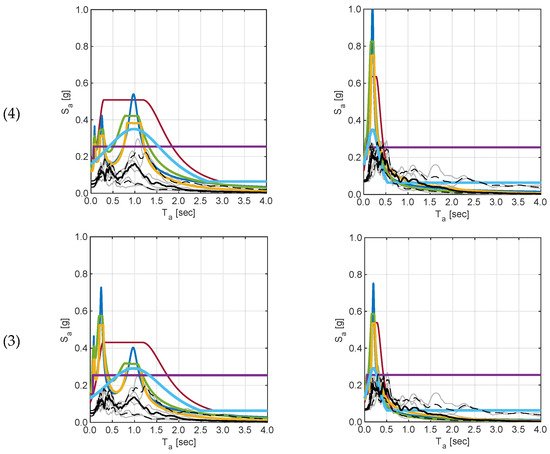
Figure 7.
Comparison of floor spectra obtained for a seismic action with a return period of 475 years for unit A, for the different accelerograms at the different building levels (one level in each row, indicated by numbers), their median (black thick line) and 16/84th percentile (black dashed lines) spectra, and the code floor spectra: (a) direction X; (b) direction Y.
The NTC commentary includes three formulations for the evaluation of floor spectra: a general formulation (GF) described by equation C7.2.3, a simplified formulation (SF) according to equation C7.2.5, and a formulation for framed structures (MRFF) based on equation C7.2.11 [54].
The comparison of the median spectra at the different levels and the corresponding code floor spectra highlights that in most cases, the code spectra envelop the results of numerical analyses in both directions. The fact that the code floor spectra envelop the results obtained from analyses with a limited set of records is somehow expected, as they are defined to account for different sources of variability, including record-to-record variability, structural characteristics (e.g., irregularity, nonlinear behavior, higher mode effects), nonlinear elements properties, and so on, which are not accounted for or not relevant in the analysis of the single considered case study. This is more evident at the higher stories and in the X direction (plots on the left in the figure). In the Y direction, the periods associated with predominant modes are associated with higher modes. For this reason, the code spectra have an amplification range narrower and higher than the one associated with the X direction.
In the X direction at the first (second) level, the EC8 formulation underestimates the seismic demand in the range of periods between 0.08 (0.12) and 0.55 (0.46) seconds, whereas the ASCE 7-16 formulation underestimates it in the range of periods between 0.15 and 0.45 s. In the Y direction, instead, the EC8 and ASCE 7-16 formulations at the first level underestimate the seismic demand for periods greater than 15 s, whereas MRFF underestimate it between 0.4 and 0.80 s. At the higher stories, there is a range of periods, approximately between 0.45 and 1.2 s, for which the GF, SF, and MRFF formulation spectra systematically underestimate the amplification observed in the time history analyses; this does not occur for the Vukobratović and Fajfar formulation. It should be noted that the GF, SF, and Vukobratović and Fajfar formulations are not able to estimate the seismic demand on the nonstructural elements located at level one, i.e., at the base of the basement. Indeed, the mode shape corresponding to the first level is equal to zero.
The results obtained for unit A of the case study building Indicate that depending on the period of the nonstructural element, the seismic demand evaluated with the code formulation could in some cases be on the safe side, although it could be nonconservative for other cases. This suggests that whenever possible, it is better to develop a numerical model of the building of interest in order to evaluate specific floor spectra.
4.3. Selected Fragility Curves for Nonstructural Element Typologies
The main typologies of nonstructural elements located in the case study building were identified. All rooms have suspended false ceilings, constructed using drywall panels and with integrated lighting elements (Figure 8a). Two typologies of partitions are used to separate spaces, either achieved with an aluminum structure and glass panels (Figure 8b) or drywall partitions (Figure 8c). The furniture in the offices and meeting rooms is standard and includes desktops, cupboards, bookshelves, and electronic equipment, such as monitors, printers, and personal computers (Figure 8d). There are vending machines (Figure 8e) and electrical cabinets on each floor (Figure 8f). The air conditioning system includes fan coils (Figure 8g) and there are also elevators (Figure 8h) and obviously piping systems (Figure 8i).
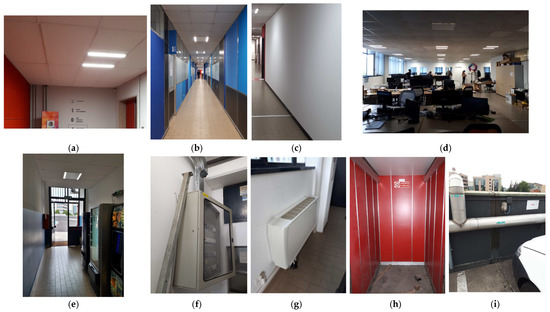
Figure 8.
Examples of nonstructural elements of the case study building: (a) false ceilings with lighting elements X; (b) aluminum-glass partitions; (c) drywall partitions; (d) office furniture; (e) vending machines; (f) electrical cabinets; (g) fan coils; (h) elevator; (i) piping system.
As already mentioned, the seismic performance of these nonstructural elements was defined by means of fragility curves, meaning for each element typology, appropriate fragility curves were selected among those available in the literature for elements with similar characteristics.
The curves refer to the three nonstructural limit states previously introduced and indicated as the OLS, DLS, and LSLS. If literature curves were provided for different limit state definitions, expert judgement was used to identify a reasonable translation into the three considered levels. It is important to recall that some of these nonstructural elements are mainly sensitive to acceleration, and in this case fragility curves in terms of either PGA or PFA were selected. Some elements are instead sensitive to displacement, drift, or both acceleration and displacement, and fragility curves obviously reflect this behavior, being expressed in terms of the IDR.
The following tables report lognormal parameters (median and lognormal standard deviation) defining the fragility curves of the considered nonstructural element typologies, subdivided into the three categories identified by FEMA E-74 [57]: architectural elements (ARCH, Table 8); mechanical, electrical and plumbing elements (MEP, Table 9); and furniture, fixtures, equipment, and contents (FF&E, Table 10).
Table 8.
Median μ and logarithmic standard deviation β values of the lognormal fragility curves for ARCH nonstructural elements, along with the literature sources.
Table 9.
Median μ and logarithmic standard deviation β values of the lognormal fragility curves for MEP nonstructural elements, along with the literature source.
Table 10.
Median μ and logarithmic standard deviation β values of the lognormal fragility curves for FF&E nonstructural elements, along with the literature source.
4.4. Seismic Classes Provided by the Proposed Approach for Two Different Cases
The first part of this section presents an example of the application of the proposed procedure to the nonstructural elements of the upper story of unit A of the considered building. Table 11 reports the values of PGA and PFA corresponding to different return periods of the seismic action, calculated according to the Italian building code. In particular, the values of the PGA are those provided by the code acceleration response spectrum and reported in Table 3, whereas the values of the PFA are derived as the maximum values between the X and Y directions, obtained from numerical analyses for each return period.
Table 11.
PGA values at the site of interest, PFA values of the upper story, and maximum IDR values (among the different levels, the two directions of analysis and the 7 considered accelerograms) of unit A of the case study building.
Results corresponding to higher return periods of the seismic action are not reported, as they are typically not of interest for nonstructural elements. For each considered nonstructural element typology, the seismic class is evaluated as depicted in Figure 2 and Figure 3, and the results are summarized in Table 12.
Table 12.
Seismic risk classes for the nonstructural elements located at the higher level of unit A of the case study building.
It is immediately evident that for the considered case study building, the seismic classification procedure does not allow one to distinguish the performance results of the different nonstructural elements. Indeed, due to the low seismicity level and the limited dynamic amplification of the building, all types of nonstructural elements are in class A+.
To test the proposed approach in a more interesting context and to make sure that it can be useful in defining a priority ranking for retrofitting interventions on the different nonstructural elements, a further example was created by assuming the considered case study building to be located in a medium-high seismicity site, with soil type B. In this case, the input values in terms of the PGA, PFA, and IDR are reported in Table 13. For this second case, the specific numerical results of time–history analyses were not available. Therefore, to avoid assumptions of the dynamic amplification of the building in this case and also to demonstrate the applicability of the proposed approach even in case a numerical model of the building is not available, the PFA was estimated using the MRFF formulation of NTC18 [47] and by applying a factor of 2.0 to the PGA values, i.e., assuming them to be at the upper level of the building.
Table 13.
PGA, PFA, and IDR values considered for the second example of the application of the proposed seismic classification procedure.
The IDR was assessed by considering an approach that follows the methodology developed by Miranda et al. [43] and based on the contribution of the first vibration mode of the structure only. In particular, the IDR of the jth floor is evaluated as:
where uj is equal to the lateral displacement at the jth floor level and hj corresponds to the interstory height. In particular, the lateral displacement at the jth floor level was computed as:
where Γ1 and Φj are the modal participation factor and the mode shape associated with the first vibration mode of the structure, respectively, and Sd is the displacement spectrum ordinate corresponding to the fundamental period of vibration of the building T1. The IDR values obtained for the upper floor are reported in Table 13.
Table 14 reports the seismic classes estimated for each limit state and the final seismic risk class for each nonstructural element, for the case in which the case study building is assumed to be located at a medium-high seismicity site.
Table 14.
Seismic risk classes for the nonstructural elements of the second application case study.
In this case, the proposed approach provides greater variability of the assigned classes, suggesting how the proposed classification scheme may help in assigning priorities to the different nonstructural elements requiring seismic upgrading. Indeed, the elements with a lower seismic class (in this example, class D), i.e., glazed elements and large diameter piping, should be the first to be retrofitted, followed by elements in class C and so on. Nonstructural elements falling in class A+ have a negligible probability of exceedance of the considered limit states, meaning they do not require any seismic retrofitting when installed in the building considered as an example.
This second application example also shows that a given nonstructural element typology could be assigned to different seismic risk classes, depending on the seismic hazard of the site of interest, the dynamic amplification due to the structural response, the dynamic characteristics of the building, and the height at which the element is installed.
5. Conclusions
This work proposes a seismic classification scheme for nonstructural elements installed within a structure. The approach is based on the use of fragility curves, representing the probability of exceeding selected limit states, as a function of a parameter representing the severity of the seismic input. For nonstructural elements, in addition to classical intensity measures such as the peak ground acceleration (PGA), it is quite common to express fragility curves in terms of a parameter incorporating the filter effect of the structure on the input ground motion; typical examples are the peak floor acceleration (PFA) and interstory drift ratio (IDR). These parameters may be evaluated from a numerical model of the building, subjected to time history analyses with accelerograms selected as representative of the seismicity at the site. These analyses directly provide acceleration and displacement time histories at the different building levels, from which the PFA and IDR can be easily obtained. If, however, the limited information on the building and other issues does not allow one to derive a numerical model, it is possible to apply code and literature formulations as briefly discussed in the paper, providing floor spectra and response parameters as a function of a limited number of structural parameters.
The main aim of this paper was to draft a methodological approach that is easy to use and easily scalable to account for the different levels of information available. The approach is somehow analogous to that proposed by O’Reilly and Calvi [35], being based on the use of literature fragility curves to describe the expected seismic performance. In the latter case, the seismic class is defined by considering the mean annual frequency of exceedance, while the proposed approach is based on the probability of exceeding given PGA, PFA, or IDR values. The approach proposed in this paper is simpler, faster, and requires less information on both the nonstructural element and the building in which it is installed. Thanks to its limited complexity, it can be easily implemented in a BIM model of a structure, offering a useful tool for identifying priorities for seismic the retrofitting of nonstructural element typologies.
As discussed in this paper, according to the proposed classification, the assigned seismic class is not a property of a given typology of nonstructural elements, but it depends on the site–building–nonstructural element combination. The reliability of the results depends on the accuracy of the selected fragility curves for describing the expected seismic performance of the nonstructural elements of interest for clearly defined limit states.
Possible further developments of this work could include the integration of fragility curves specifically derived for the nonstructural typologies and limit states of interest, possibly derived from experimental tests. Additionally, parametric studies could allow for the calibration of more robust limits identifying the different seismic risk classes, which were calibrated here on a single case study building.
Author Contributions
Conceptualization, M.R., F.B. and M.Z.; methodology, F.B. and M.R.; data curation, F.B. and M.Z.; validation, F.B. and M.Z.; writing—original draft preparation, M.R. and M.Z.; writing—review and editing, P.D.; supervision, M.R. and P.D.; project administration, M.R. and P.D. All authors have read and agreed to the published version of the manuscript.
Funding
This research was funded by Regione Lombardia, POR FESR 2014–2020, ID 1176156.
Data Availability Statement
The data presented in this study are available on request from the corresponding author.
Acknowledgments
This work was carried out within the Project SAMBA—Smart and Advanced Multitenants Building Automation. The authors would like to thank Roberto Nascimbene for originally conceiving the project and Matteo Tacci for the fruitful discussions at the initial stages of the work.
Conflicts of Interest
The authors declare no conflict of interest. The funders had no role in the design of the study; in the collection, analyses, or interpretation of data; in the writing of the manuscript; or in the decision to publish the results.
References
- Taghavi, S.; Miranda, E. Response Assessment of Nonstructural Building Elements; PEER Report 2003-05; Pacific Earthquake Engineering Research Center, University of California: Berkeley, CA, USA, 2003.
- Dhakal, R.P. Damage to Non-Structural Components and Contents in 2010 Darfield Earthquake. Bull. New Zealand Soc. Earthq. Eng. (BNZSEE) 2010, 43, 404–411. [Google Scholar] [CrossRef]
- Miranda, E.; Mosqueda, G.; Retamales, R.; Pekcan, G. Performance of Nonstructural Components during the 27 February 2010 Chile Earthquake. Earthq. Spectra 2012, 28, 453–471. [Google Scholar] [CrossRef]
- Baird, A.; Tasligedik, A.S.; Palermo, A.; Pampanin, S. Seismic Performance of Vertical Nonstructural Components in the 22 February 2011 Christchurch Earthquake. Earthq. Spectra 2014, 30, 401–425. [Google Scholar] [CrossRef]
- Magliulo, G.; Ercolino, M.; Petrone, C.; Coppola, O.; Manfredi, G. The Emilia Earthquake: Seismic Performance of Precast Reinforced Concrete Buildings. Earthq. Spectra 2014, 30, 891–912. [Google Scholar] [CrossRef]
- Perrone, D.; Calvi, P.M.; Nascimbene, R.; Fischer, E.C.; Magliulo, G. Seismic Performance of Non-Structural Elements during the 2016 Central Italy Earthquake. Bull. Earthq. Eng. 2019, 17, 5655–5677. [Google Scholar] [CrossRef]
- Casarotti, C.; Pavese, A.; Peloso, S. Seismic Response of the San Salvatore Hospital of Coppito (L’Aquila) during the 6th April 2009 Earthquake. Eff. Struct. Infrastruct. 2009, 3, 159–172. [Google Scholar]
- Price, H.J.; De Sortis, A.; Schotanus, M. Performance of the San Salvatore Regional Hospital in the 2009 L’Aquila Earthquake. Earthq. Spectra 2012, 28, 239–256. [Google Scholar] [CrossRef]
- Santarsiero, G.; Di Sarno, L.; Giovinazzi, S.; Masi, A.; Cosenza, E.; Biondi, S. Performance of the Healthcare Facilities during the 2016–2017 Central Italy Seismic Sequence. Bull. Earthq. Eng. 2019, 17, 5701–5727. [Google Scholar] [CrossRef]
- Rota, M.; Penna, A.; Strobbia, C.L. Processing Italian Damage Data to Derive Typological Fragility Curves. Soil Dyn. Earthq. Eng. 2008, 28, 933–947. [Google Scholar] [CrossRef]
- Rosti, A.; Del Gaudio, C.; Rota, M.; Ricci, P.; Di Ludovico, M.; Penna, A.; Verderame, G.M. Empirical Fragility Curves for Italian Residential RC Buildings. Bull. Earthq. Eng. 2021, 19, 3165–3183. [Google Scholar] [CrossRef]
- Rosti, A.; Rota, M.; Penna, A. Empirical Fragility Curves for Italian URM Buildings. Bull. Earthq. Eng. 2021, 19, 3057–3076. [Google Scholar] [CrossRef]
- da Porto, F.; Donà, M.; Rosti, A.; Rota, M.; Lagomarsino, S.; Cattari, S.; Borzi, B.; Onida, M.; De Gregorio, D.; Perelli, F.L.; et al. Comparative Analysis of the Fragility Curves for Italian Residential Masonry and RC Buildings. Bull. Earthq. Eng. 2021, 19, 3209–3252. [Google Scholar] [CrossRef]
- Zuccaro, G.; Perelli, F.L.; De Gregorio, D.; Cacace, F. Empirical Vulnerability Curves for Italian Mansory Buildings: Evolution of Vulnerability Model from the DPM to Curves as a Function of Accelertion. Bull. Earthq. Eng. 2021, 19, 3077–3097. [Google Scholar] [CrossRef]
- Lagomarsino, S.; Cattari, S.; Ottonelli, D. The Heuristic Vulnerability Model: Fragility Curves for Masonry Buildings. Bull. Earthq. Eng. 2021, 19, 3129–3163. [Google Scholar] [CrossRef]
- Rota, M.; Penna, A.; Magenes, G. A Methodology for Deriving Analytical Fragility Curves for Masonry Buildings Based on Stochastic Nonlinear Analyses. Eng. Struct. 2010, 32, 1312–1323. [Google Scholar] [CrossRef]
- Simoes Dias Maio, R.; Tsionis, G. Seismic Fragility Curves for the European Building Stock: Review and Evaluation of Existing Fragility Curves; Publications Office of the European Union: Ispra, Italy, 2016. [Google Scholar] [CrossRef]
- Retamales, R.; Davies, R.; Mosqueda, G.; Filiatrault, A. Experimental Seismic Fragility of Cold-Formed Steel Framed Gypsum Partition Walls. J. Struct. Eng. 2013, 139, 1285–1293. [Google Scholar] [CrossRef]
- Prota, A.; Zito, M.; D′Angela, D.; Toscano, G.; Ceraldi, C.; Fiorillo, A.; Magliulo, G. Preliminary Results of Shake Table Tests of a Typical Museum Display Case Containing an Art Object. Adv. Civ. Eng. 2022, 2022, 3975958. [Google Scholar] [CrossRef]
- Jun, S.C.; Lee, C.H.; Bae, C.J.; Lee, K.J. Shake-Table Seismic Performance Evaluation of Direct- and Indirect-Hung Suspended Ceiling Systems. J. Earthq. Eng. 2020, 26, 4833–4851. [Google Scholar] [CrossRef]
- Rahmanishamsi, E.; Soroushian, S.; Maragakis, E.M. Analytical Model for the In-Plane Seismic Performance of Cold-Formed Steel-Framed Gypsum Partition Walls. Earthq. Eng. Struct. Dyn. 2016, 45, 619–634. [Google Scholar] [CrossRef]
- Blasi, G.; Perrone, D.; Aiello, M.A.; Pecce, M.R. Seismic Performance Assessment of Piping Systems in Bare and Infilled RC Buildings. Soil Dyn. Earthq. Eng. 2021, 149, 106897. [Google Scholar] [CrossRef]
- Zito, M.; Nascimbene, R.; Dubini, P.; D’Angela, D.; Magliulo, G. Experimental Seismic Assessment of Nonstructural Elements: Testing Protocols and Novel Perspectives. Buildings 2022, 12, 1871. [Google Scholar] [CrossRef]
- Zito, M.; D’Angela, D.; Maddaloni, G.; Magliulo, G. A Shake Table Protocol for Seismic Assessment and Qualification of Acceleration-Sensitive Nonstructural Elements. Comput.-Aided Civ. Infrastruct. Eng. 2022. [Google Scholar] [CrossRef]
- Perrone, D.; Brunesi, E.; Dacarro, F.; Peloso, S.; Filiatrault, A. Seismic Performance of Non-Structural Elements Seismic Assessment and Qualification of Non-Structural Elements in Europe: A Critical Review. In Proceedings of the 4th International Workshop on the Seismic Performance of Non-structural Elements (SPONSE), Pavia, Italy, 22–23 May 2019. [Google Scholar] [CrossRef]
- Lanese, I.; Bazzini, M.; Bolognini, D.; Brunesi, E.; Dacarro, F.; Dubini, P.; Grottoli, L.; Peloso, S.; Rizzo Parisi, E.; Rota, M. New Testing Protocol for Acceleration-and-Drift-Sensitive Non-Structural Elements through the Innovative 9-DOFs Multi-Story Dynamic Testing Facility. In Proceedings of the 5th International Workshop on Seismic Performance of Non-Structural Elements (SPONSE), Palo Alto, CA, USA, 5–7 December 2022. [Google Scholar]
- Ministero delle Infrastrutture e dei Trasporti. DM 28-02: Linee Guida per La Classificazione Del Rischio Sismico Delle Costruzioni; Italy. 2017. Available online: https://www.mit.gov.it/normativa/decreto-ministeriale-numero-58-del-28022017 (accessed on 9 March 2023). (In Italian)
- Cosenza, E.; Del Vecchio, C.; di Ludovico, M.; Dolce, M.; Moroni, C.; Prota, A.; Renzi, E. The Italian Guidelines for Seismic Risk Classification of Constructions: Technical Principles and Validation. Bull. Earthq. Eng. 2018, 16, 5905–5935. [Google Scholar] [CrossRef]
- Calvi, G.M.; Sullivan, T.J.; Welch, D.P. A Seismic Performance Classification Framework to Provide Increased Seismic Resilience. In Perspectives on European Earthquake Engineering and Seismology; Ansal, A., Ed.; Geotechnical, Geological and Earthquake Engineering; Springer: Cham, Switzerland, 2014; Volume 34, pp. 361–400. [Google Scholar] [CrossRef]
- FEMA P-58-1. Seismic Performance Assessment of Buildings Volume 1—Methodology. Technical Report, December 2018. Available online: https://femap58.atcouncil.org/reports (accessed on 3 March 2023).
- FEMA P-58-2. Seismic Performance Assessment of Buildings Volume 2—Implementation Guide. Technical Report, December 2018. Available online: https://femap58.atcouncil.org/reports (accessed on 3 March 2023).
- Arup. The Resilience-Based Earthquake Design Initiative (REDiTM) Rating System. 2013. Available online: https://www.redi.arup.com/ (accessed on 10 March 2023).
- Filiatrault, A.; Perrone, D.; Merino, R.J.; Calvi, G.M. Performance-Based Seismic Design of Nonstructural Building Elements. J. Earthq. Eng. 2021, 25, 237–269. [Google Scholar] [CrossRef]
- Sullivan, T.; Dhakal, R.; Stanway, J. A Framework for the Seismic Rating of Non-Structural Elements in Buildings. In Proceedings of the 17th World Conference on Earthquake Engineering, Sendai, Japan, 13–18 September 2020. [Google Scholar]
- O′Reilly, G.J.; Calvi, G.M. A Seismic Risk Classification Framework for Non-Structural Elements. Bull. Earthq. Eng. 2021, 19, 5471–5494. [Google Scholar] [CrossRef]
- Agenzia CasaClima. Certificato Energetico CasaClima. 2019. Available online: https://www.agenziacasaclima.it/it/certificazione-edifici/certificato-energetico-casaclima-1281.html (accessed on 6 March 2023). (In Italian).
- Merino, R.J.; Perrone, D.; Filiatrault, A.; Nascimbene, R. A Seismic Classification Procedure for Non-Structural Building Elements Based on Shake-Table Qualification Testing. In Proceedings of the 3rd European Conference on Earthquake Engineering and Seismology, Bucharest, Romania, 4–9 September 2022. [Google Scholar]
- Applicazione Delle Metodologie Di Calcolo Delle Prestazioni Energetiche e Definizione Delle Prescrizioni e Dei Requisiti Minimi Degli Edifici; Ministero dello Sviluppo Economico: Rome, Italy, 2015. (In Italian)
- Vukobratović, V.; Fajfar, P. Code-Oriented Floor Acceleration Spectra for Building Structures. Bull. Earthq. Eng. 2017, 15, 3013–3026. [Google Scholar] [CrossRef]
- Degli Abbati, S.; Cattari, S.; Lagomarsino, S. Theoretically-Based and Practice-Oriented Formulations for the Floor Spectra Evaluation. Earthq. Struct. 2018, 15, 565–581. [Google Scholar] [CrossRef]
- Petrone, C.; Magliulo, G.; Manfredi, G. Seismic Demand on Light Acceleration-Sensitive Nonstructural Components in European Reinforced Concrete Buildings. Earthq. Eng. Struct. Dyn. 2015, 44, 1203–1217. [Google Scholar] [CrossRef]
- EN 1998–1:2004; Eurocode 8: Design of Structures for Earthquake Resistance-Part 1: General Rules, Seismic Actions and Rules for Buildings. Comité Européen de Normalisation (CEN): Brussels, Belgium, 2004.
- Vukobratović, V.; Ruggieri, S. Floor Acceleration Demands in a Twelve-Storey RC Shear Wall Building. Buildings 2021, 11, 38. [Google Scholar] [CrossRef]
- Ruggieri, S.; Vukobratović, V. Acceleration demands in single-storey RC buildings with flexible diaphragms. Eng. Struct. 2023, 275 Pt A, 115276. [Google Scholar] [CrossRef]
- Miranda, E. Approximate Seismic Lateral Deformation Demands in Multistory Buildings. J. Struct. Eng. 1999, 125, 417–425. [Google Scholar] [CrossRef]
- Napolitano, R.; Bilotta, A.; Cosenza, E. Seismic Lateral Deformations Demand in Conceptual Design of Reinforced Concrete Framed Structures. J. Build. Eng. 2022, 45, 103565. [Google Scholar] [CrossRef]
- Ministero delle Infrastrutture e dei Trasporti. Aggiornamento Delle “Norme Tecniche per Le Costruzioni” Decreto 17 Gennaio; Ministero delle Infrastrutture e dei Trasporti: Rome, Italy, 2018; Volume 20, pp. 23–35. (In Italian)
- Santarella, L. Prontuario Del Cemento Armato, 34th ed.; HOEPLI: Milano, Italy, 1988. (In Italian) [Google Scholar]
- Corigliano, M.; Lai, C.G.; Rota, M.; Strobbia, C.L. ASCONA: Automated Selection of COmpatible Natural Accelerograms. Earthq. Spectra 2012, 28, 965–987. [Google Scholar] [CrossRef]
- Rota, M.; Zuccolo, E.; Taverna, L.; Corigliano, M.; Lai, C.G.; Penna, A. Mesozonation of the Italian Territory for the Definition of Real Spectrum-Compatible Accelerograms. Bull. Earthq. Eng. 2012, 10, 1357–1375. [Google Scholar] [CrossRef]
- Penna, A.; Mouyiannou, A.; Rota, M.; Magenes, G. Issues on the Use of Time-History Analysis for the Design and Assessment of Masonry Structures. In Proceedings of the 4th ECCOMAS Thematic Conference on Computational Methods in Structural Dynamics and Earthquake Engineering (COMPDYN 2013), Kos Island, Grecia, 12–14 June 2013. [Google Scholar]
- Iervolino, I.; Galasso, C.; Cosenza, E. REXEL: Computer Aided Record Selection for Code-Based Seismic Structural Analysis. Bull. Earthq. Eng. 2010, 8, 339–362. [Google Scholar] [CrossRef]
- Forte, G.; Chioccarelli, E.; De Falco, M.; Cito, P.; Santo, A.; Iervolino, I. Seismic Soil Classification of Italy Based on Surface Geology and Shear-Wave Velocity Measurements. Soil Dyn. Earthq. Eng. 2019, 122, 79–93. [Google Scholar] [CrossRef]
- Istruzioni per l’applicazione Dell’«Aggiornamento “Norme Tecniche per Le Costruzioni”» Di Cui al Decreto 17 Gennaio 2018; Ministero delle Infrastrutture e dei Trasporti: Rome, Italy, 2019; Volume 11, pp. 23–35. (In Italian)
- ASCE 7-16; Minimum Design Loads and Associated Criteria for Buildings and Other Structures. American Society of Civil Engineers (ASCE): Reston, VA, USA, 2016; pp. 1–889.
- Vukobratović, V.; Fajfar, P. A Method for the Direct Estimation of Floor Acceleration Spectra for Elastic and Inelastic MDOF Structures. Earthq. Eng. Struct. Dyn. 2016, 45, 2495–2511. [Google Scholar] [CrossRef]
- FEMA E-74. Reducing the Risks of Nonstructural Earthquake Damage—A Practical Guide. 2012. Available online: https://www.fema.gov/emergency-managers/risk-management/earthquake/training/fema-e-74 (accessed on 10 March 2023).
- Retamales, R.; Davies, R.; Mosqueda, G.; Filiatrault, A. Experimental Seismic Fragility Assessment of Light Gauge Steel Studded Gypsum Partition Walls. In Proceedings of the 9th U.S. National and 10th Canadian Conference on Earthquake Engineering, Toronto, ON, Canada, 25–29 July 2010. [Google Scholar]
- O’Brien, W.C.; Memari, A.M.; Kremer, P.A.; Behr, R.A. Fragility Curves for Architectural Glass in Stick-Built Glazing Systems. Earthq. Spectra 2012, 28, 639–665. [Google Scholar] [CrossRef]
- Mattei, S.; Bedon, C. Analytical Fragility Curves for Seismic Design of Glass Systems Based on Cloud Analysis. Symmetry 2021, 13, 1541. [Google Scholar] [CrossRef]
- Soroushian, S.; Rahmanishamsi, E.; Jenkins, C.; Maragakis, E.M. Fragility Analysis of Suspended Ceiling Systems in a Full-Scale Experiment. J. Struct. Eng. 2019, 145, 04019005. [Google Scholar] [CrossRef]
- Petrone, C.; Magliulo, G.; Manfredi, G. Shake Table Tests on Standard and Innovative Temporary Partition Walls. Earthq. Eng. Struct. Dyn. 2017, 46, 1599–1624. [Google Scholar] [CrossRef]
- Soroushian, S.; Zaghi, A.E.; Maragakis, M.; Echevarria, A.; Tian, Y.; Filiatrault, A. Analytical Seismic Fragility Analyses of Fire Sprinkler Piping Systems with Threaded Joints. Earthq. Spectra 2015, 31, 1125–1155. [Google Scholar] [CrossRef]
- Soroushian, S.; Zaghi, A.E.; Maragakis, E.M.; Echevarria, A.; Tian, Y.; Filiatrault, A. Seismic Fragility Study of Fire Sprinkler Piping Systems with Grooved Fit Joints. J. Struct. Eng. 2015, 141, 04014157. [Google Scholar] [CrossRef]
- Di Sarno, L.; Magliulo, G.; D’Angela, D.; Cosenza, E. Experimental Assessment of the Seismic Performance of Hospital Cabinets Using Shake Table Testing. Earthq. Eng. Struct. Dyn. 2019, 48, 103–123. [Google Scholar] [CrossRef]


Disclaimer/Publisher’s Note: The statements, opinions and data contained in all publications are solely those of the individual author(s) and contributor(s) and not of MDPI and/or the editor(s). MDPI and/or the editor(s) disclaim responsibility for any injury to people or property resulting from any ideas, methods, instructions or products referred to in the content. |
© 2023 by the authors. Licensee MDPI, Basel, Switzerland. This article is an open access article distributed under the terms and conditions of the Creative Commons Attribution (CC BY) license (https://creativecommons.org/licenses/by/4.0/).