Article

Stability Analysis of the Foundation Pit and the Twin Shield Tunnels during Adjacent Construction

1
Key Laboratory of Urban Underground Engineering of the Education Ministry, Beijing Jiaotong University, Beijing 100044, China
2
School of Civil Engineering, Beijing Jiaotong University, Beijing 100044, China
3
Research Institute of Highway Ministry of Transportation, Beijing 100088, China
*
Author to whom correspondence should be addressed.
Buildings 2023, 13(4), 1000; https://doi.org/10.3390/buildings13041000
Submission received: 19 February 2023 / Revised: 31 March 2023 / Accepted: 5 April 2023 / Published: 10 April 2023
(This article belongs to the Section Construction Management, and Computers & Digitization)

Abstract

:
Due to the rapid development of urban rail transit and the development and use of underground space, foundation pit construction near existing subway tunnels is becoming increasingly common. When adjacent foundation pit projects are being constructed, it is difficult to avoid the influence on existing subway tunnels, which threatens the safe operation of subway tunnels. Thus, this study focused on the stability of the adjacent construction of foundation pits and twin shield tunnels. The finite element limit analysis (FELA) method was used to analyze the influences of construction scheme and relative position of the twin shield tunnels and adjacent foundation pit on the global stability of adjacent construction. Based on the research results, the guidance and design for the construction scheme and relative position are provided. The stability analysis on the foundation pit during the construction process is performed. The criteria of adjacent influential partition are proposed, and the influence of various input parameters (c/γD, φ, L/D and C/D) on the global stability of adjacent construction is discussed, respectively. A new design equation of safety factor of global stability of adjacent construction is obtained by curve fitting.

1. Introduction

Ground traffic is becoming more and more crowded, and the underground rail traffic has developed greatly. With large-scale construction of underground projects, many foundation pits adjacent to the existing tunnels will inevitably appear during the urban development process (Zucca and Valente [1]). Therefore, the interaction between foundation pit and adjacent tunnels has become an important problem to be studied urgently.
Many scholars have studied the stability of foundation pits and tunnels in recent years. At present, there are three main methods for stability analysis of the foundation pit and shield tunnel, including the limit equilibrium method, limit analysis method and numerical simulation method. In terms of the limit equilibrium method, Jancsecz and Steiner [2] proposed a wedge failure model of tunnel, which corresponded to a uniform stratum and applied limit equilibrium method to calculate the collapse pressure. Anagnostou [3] focused on the shear resistance provided by the lateral slip surfaces of failure model of tunnel and proposed a new failure mechanism based on the so-called slices method. Zhang et al. [4] proposed a dual failure mechanism of tunnel on the basis of the limit equilibrium method. The failure model was composed of two parts: the rotation failure area (lower area) and the gravity failure area (upper area). Terzaghi [5] first adopted the limit equilibrium to perform stability analysis on foundation pits. Bjerrum and Edie [6] presented an evaluation method to analyze the local stability of deep foundation pits. A calculation formula for the bearing capacity of foundation pits was proposed.
In terms of the limit analysis method, Davis et al. [7] focused on the circular tunnel in soft clay and analyzed the tunnel stability. For collapse and blow-out cases of tunnel face, the upper and lower bound solutions of tunnel stability were derived. Leca and Dormieux [8] conducted stability analysis on the tunnel face in dry sand, and three 3D cone-shaped failure mechanisms were proposed. Soubra et al. [9] proposed a new improved failure mechanism on the basis of research of Leca and Dormieux. In the new failure mechanism composed of several rigid truncated cones, the slip surface of failure model can develop more freely. Mollon et al. [10,11] proposed a 3D failure model by using the spatial discretization technique. Zhang et al. [12] proposed a new three-dimensional failure model consisting of four truncated cones on which a distributed force acts, and the influences of different factors on the face stability have been investigated based on the limit analysis [13,14,15,16,17,18]. Su et al. [19] proposed a simplified failure mechanism of foundation pits and performed stability analysis on a foundation pit. Chang [20] derived the formula to perform stability analysis on a foundation pit based on the Prandtl failure mechanism of the bearing capacity method. Zou [21] also adopted the simplified velocity field to construct a simplified Prandtl failure mechanism.
With respect to the numerical simulation method, Chen et al. [22,23] studied the failure mechanism and the limit support pressure of the tunnel in the shallow dry sand stratum through the use of the software PFC3D and FLAC3D. Ukritchon and Keawsawasvong [24] used the software PLAXIS 3D to perform stability analysis on tunnel face in a clay layer in which the cohesion changes linearly with the depth of stratum. Goh [25] proposed the concept of judging the instability of a foundation pit based on the displacement of nodes by applying the strength reduction method to finite element analysis.
In addition, Sloan [26,27] proposed a novel method called finite element limit analysis for assessing geotechnical stability. The finite element limit analysis combines the generality of finite element method with the rigorousness of limit analysis theory. Furthermore, Graettinger et al. [28], Lyamin and Sloan [29] and Krabbenhoft et al. [30,31] proposed a faster nonlinear programming formulation for the finite element limit analysis method. The finite element limit analysis has been widely used to study the stability of foundation pits and tunnels for the past few years [32,33,34,35,36,37,38].
Although many scholars have analyzed the stability of tunnels and foundation pits, there are still many problems that have not been fully investigated. The mutual effect between tunnel and adjacent foundation pit is still a significant issue to be addressed. Some scholars used theoretical analysis methods to study the effect of foundation pit construction on adjacent existing tunnel deformation [39,40,41,42,43,44,45], and some scholars analyzed the changes in the tunnel displacement field and stress field during the foundation pit construction through the use of numerical simulation method [46,47,48,49,50]. Existing studies mainly performed analysis on the effects of foundation pit construction on the deformation of existing tunnels, but research on the interaction of the foundation pit and the adjacent tunnels during the simultaneous construction is fairly rare.
Based on the Shenzhen Metro Line 6 and Changgong Road project, this paper studies the global stability of adjacent construction of a foundation pit and double shield tunnel by finite element limit analysis (FELA). Firstly, the influence of interaction between the twin tunnels structure and foundation pit structure on global stability of adjacent construction was analyzed. The influence of the construction scheme of a foundation pit on the global stability of adjacent construction was analyzed, and the influence of the buried depth of the twin shield tunnels and the horizontal distance between the foundation pit and the twin tunnels were analyzed, respectively. Secondly, the variation in foundation pit stability during the construction process was investigated. The influence of excavation depth on the stability of foundation pits and the axial force of foundation pit support were analyzed. Thirdly, three criteria of adjacent influence zoning were put forward, and, according to the three criteria, the safety risk grade zoning of adjacent construction of the twin shield tunnels and foundation pit was obtained. Finally, the influences of various input parameters (c/γD, φ, L/D and C/D) were analyzed, respectively, and a new design equation for the safety factor containing c/γD, φ, L/D and C/D was obtained by curve fitting method on the basis of the analysis results.

2. Problem Statement

2.1. Engineering Background

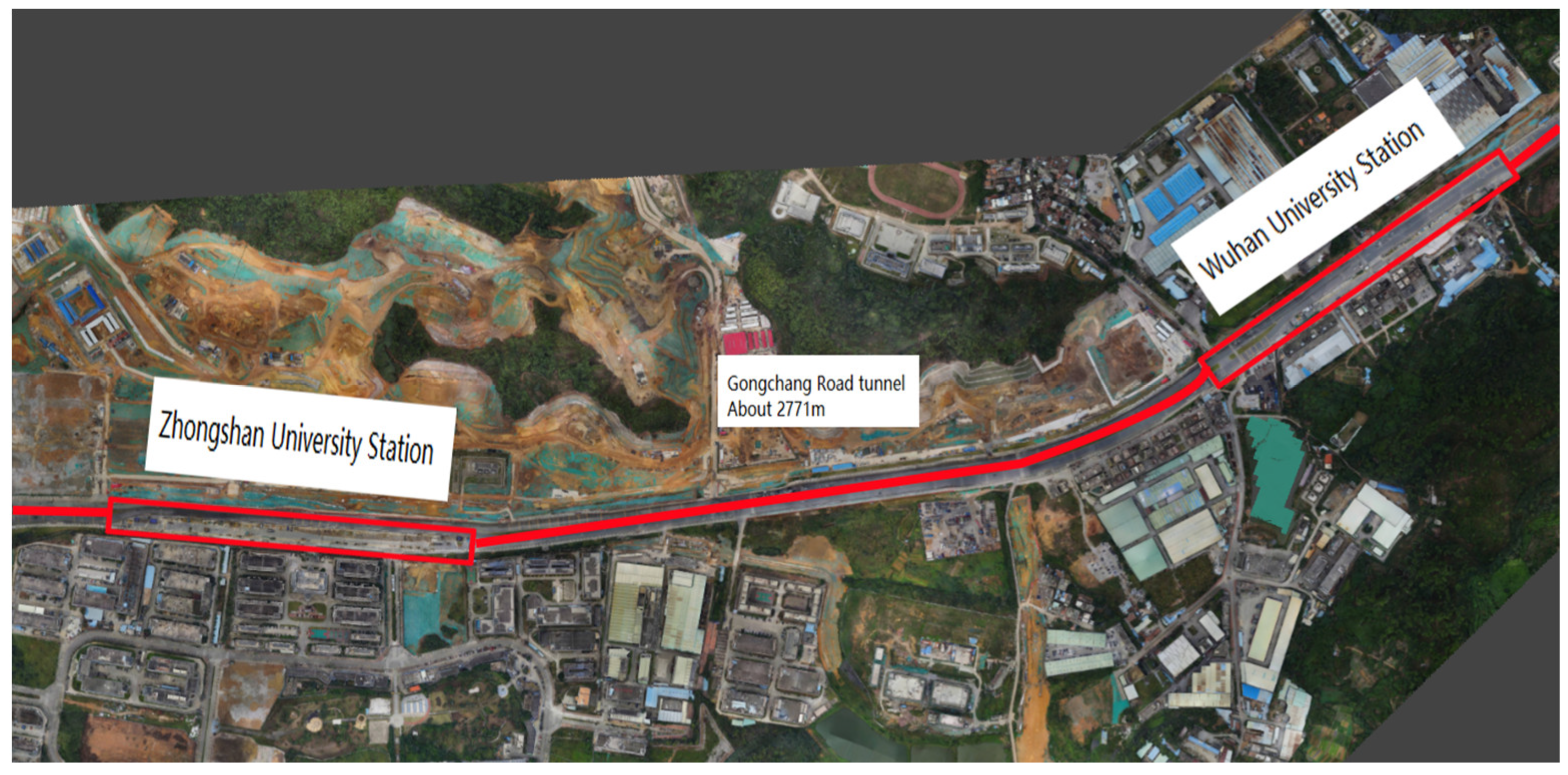
In this engineering case, the foundation pit corresponds to the Gongchang Road tunnel project and the twin shield tunnels correspond to the branch line project of Subway Line 6 in Shenzhen. The starting point of the Gongchang Road tunnel project is located on the west side of the intersection of Guangqiao Road (K0 + 000) and the project ends at Dongguan (K3 + 559.691). The open-cut method is adopted for construction, and the construction site of the foundation pit can be viewed in Figure 1. The depth and width of the foundation pit are 7–23.5 m and 29 m, respectively.
The branch line project of Metro Line 6 is adjacent to the open-cut project site, and the twin shield tunnels are parallel to the direction of the main channel of the open-cut foundation pit. The minimum distance between open-cut tunnels and shield tunnels for long-distance parallel construction is 5.5 m, and the parallel construction length is 1.67 km. The two projects are constructed in parallel over a long distance with small spacing, and the adjacent construction is located in the dense urban transportation area, as shown in Figure 2. The surrounding environment is complex and the construction space is narrow. Therefore, the construction risk is high and the interaction between the foundation pit and the twin shield tunnels is complex.

2.2. Finite Element Limit Analysis

As a powerful numerical technique, finite element limit analysis (FELA) is adopted to analyze the global stability of adjacent construction of the foundation pit and the twin shield tunnels in this study [51]. The finite element limit analysis is on the basis of a perfect plastic material respected associated flow law and considers the concepts of classical plasticity theorem [52] to calculate upper and lower bound solutions through the use of finite element discretization and mathematical programming.
In the limit analysis, the soil is assumed to be ideal plastic body, which has the following three assumptions:
(1) The material presents ideal plasticity.
(2) The plastic strain rates and the stress obey the equation σ ˙ i j ˙ i j p = 0 .
(3) The geometric deformation of the body under the limit load is very small.
In the limit analysis, the geometric deformation of the body can increase constantly under a constant value load. This constant value load named collapse load or plastic limit load is a good approximation to the actual load. The upper and lower bound theorem can be used to provide upper and lower bound estimates of the plastic limit load.
The lower bound theorem: If an equilibrium distribution of stress σ i j E covering the whole body can be found that balances the applied loads Ti on the stress boundary AT and σ i j E is everywhere below yield f σ i j E < 0 , then the body at the loads Ti and Fi will not collapse.
The upper bound theorem: If a compatible mechanism of plastic deformation ˙ i j p * , u ˙ i p * is assumed that satisfies the condition u ˙ i p * = 0 on the displacement boundary Au, then the loads Ti and Fi determined by equating the rate at which the external forces work to the rate of internal dissipation will be either higher or equal to the actual limit load.
A T T i u ˙ i p * d A + V F i u ˙ i p * d V V D ˙ i j p * d V = V σ i j p * ˙ i j p * d V
The bounding estimates of plastic limit load can be obtained on the basis of upper and lower bound theorem. For a large number of practical problems in soil mechanics, a close approximate value to the limit load with an error limit can be obtained. In this article, finite element limit analysis is used to study the stability of practical engineering project of Subway Line 6 and Gongchang Road in Shenzhen.
In the upper bound analysis, the soil is discretized into six-node triangular elements. Each node in the model is associated with a vector of two unknown velocities, and each element is associated with a vector of three unknown stresses and an unknown non-negative plastic multiplier rate. Due to the discontinuity of velocity on the boundary between all inter-elements, multiple nodes may have the same coordinates, but each node is unique to one element. The upper bound calculation is transformed into a non-linear programming problem. A special case of non-linear programming is called second-order conic programming (SOCP) [30,31], in which nodal velocities, element stresses and plastic multipliers are all unknown. The objective function to calculate the minimum value is the internal power dissipation minus the power of the fixed external forces. In order to meet the requirements of the upper-bound theorem, the unknowns are constrained by the flow rule, the velocity boundary conditions and the yield condition.
In the lower bound analysis, the soil is discretized into three-node triangular elements. Each node in the model is associated with a vector of three unknown stresses, and each element is associated with a vector of two unknown body forces. Due to the stress discontinuity on the boundary between all inter-elements, there may be multiple nodes sharing the same coordinates, but each node is unique to an element. The lower bound calculation is also obtained by transforming into SOCP [30,31] and solving, where the nodal stresses and body forces of the element are the unknowns, and the maximum value of solving the objective function corresponds to the failure load. The unknowns are subject to multiple constraints, including equilibrium equality constraints for each continuum element, equilibrium equality constraints for each discontinuity, stress boundary conditions and a yield condition inequality constraint for each node.
Compared with the limit analysis, the mathematical optimization used in the FELA method makes it powerful and efficient. Therefore, in this article, finite element limit analysis is used to study the stability of practical engineering project of Subway Line 6 and Gongchang Road in Shenzhen.

2.3. Strength Reduction Analysis

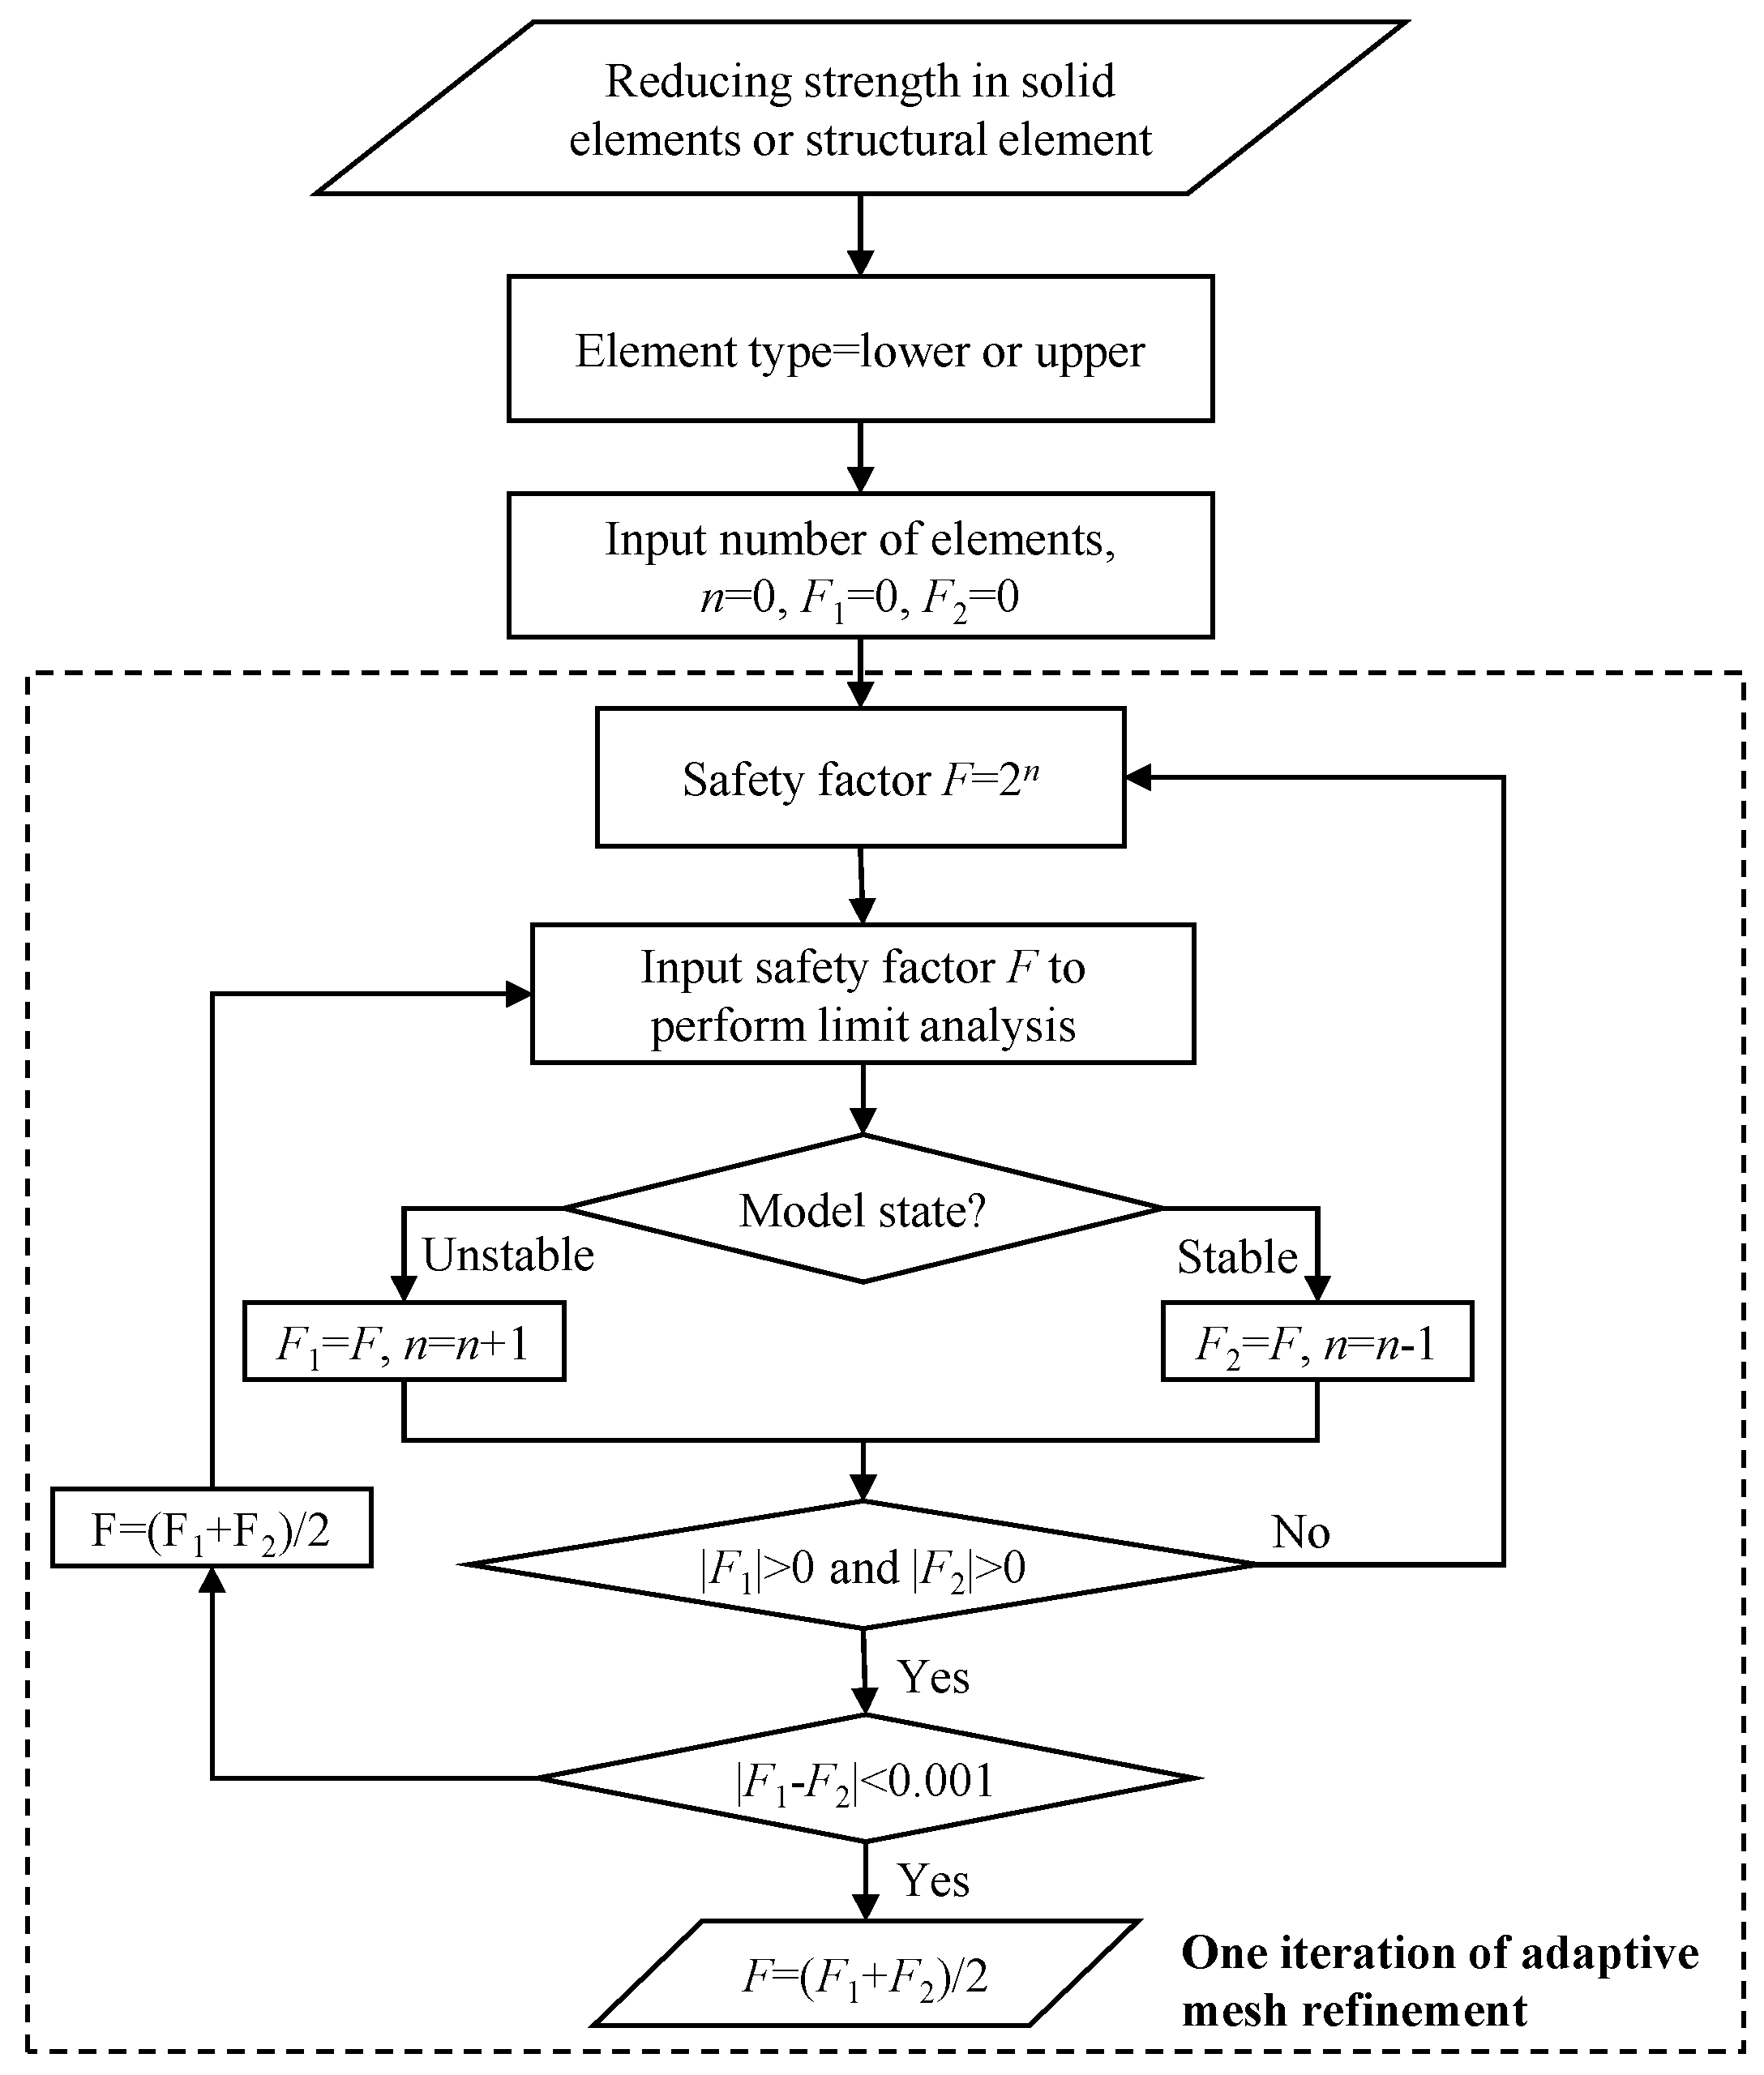
The strength reduction analysis combined with finite element limit analysis consists of a series of limit analysis calculations in which each limit analysis calculation is based on the model state (stable or unstable) obtained from the previous analysis to determine whether the material strength parameters in the next limit analysis are reduced or increased. Thus, the safety factor F is defined to judge whether the model state is stable or unstable. When the factor is greater than 1, the model state is stable, and the material in the model requires additional strength to prevent collapse when the factor is less than 1. In this paper, two different reduction methods are used:
(1) In the calculation, the strength of the solid elements is reduced, and all other parameters remain unchanged. The safety factor of model stability is defined as:
F = c c r e d = tan φ tan φ r e d
where c is cohesion of geotechnical material, cred is cohesion of geotechnical material when failure occurs after reduction, tanφ is the tangent of friction angle of geotechnical material and tanφred is the tangent of friction angle of geotechnical material when failure occurs after reduction.
(2) In the calculation, the strength of the structural elements is reduced, and all other parameters remain unchanged. The safety factor of model stability is defined as:
F = σ 0 σ 0 , r e d
where σ0 is yield strength of construction material and σ0,red is yield strength of construction material when failure occurs after reduction.
Figure 3 shows flow diagram of the strength reduction analysis to calculate safety factor.

2.4. Numerical Model

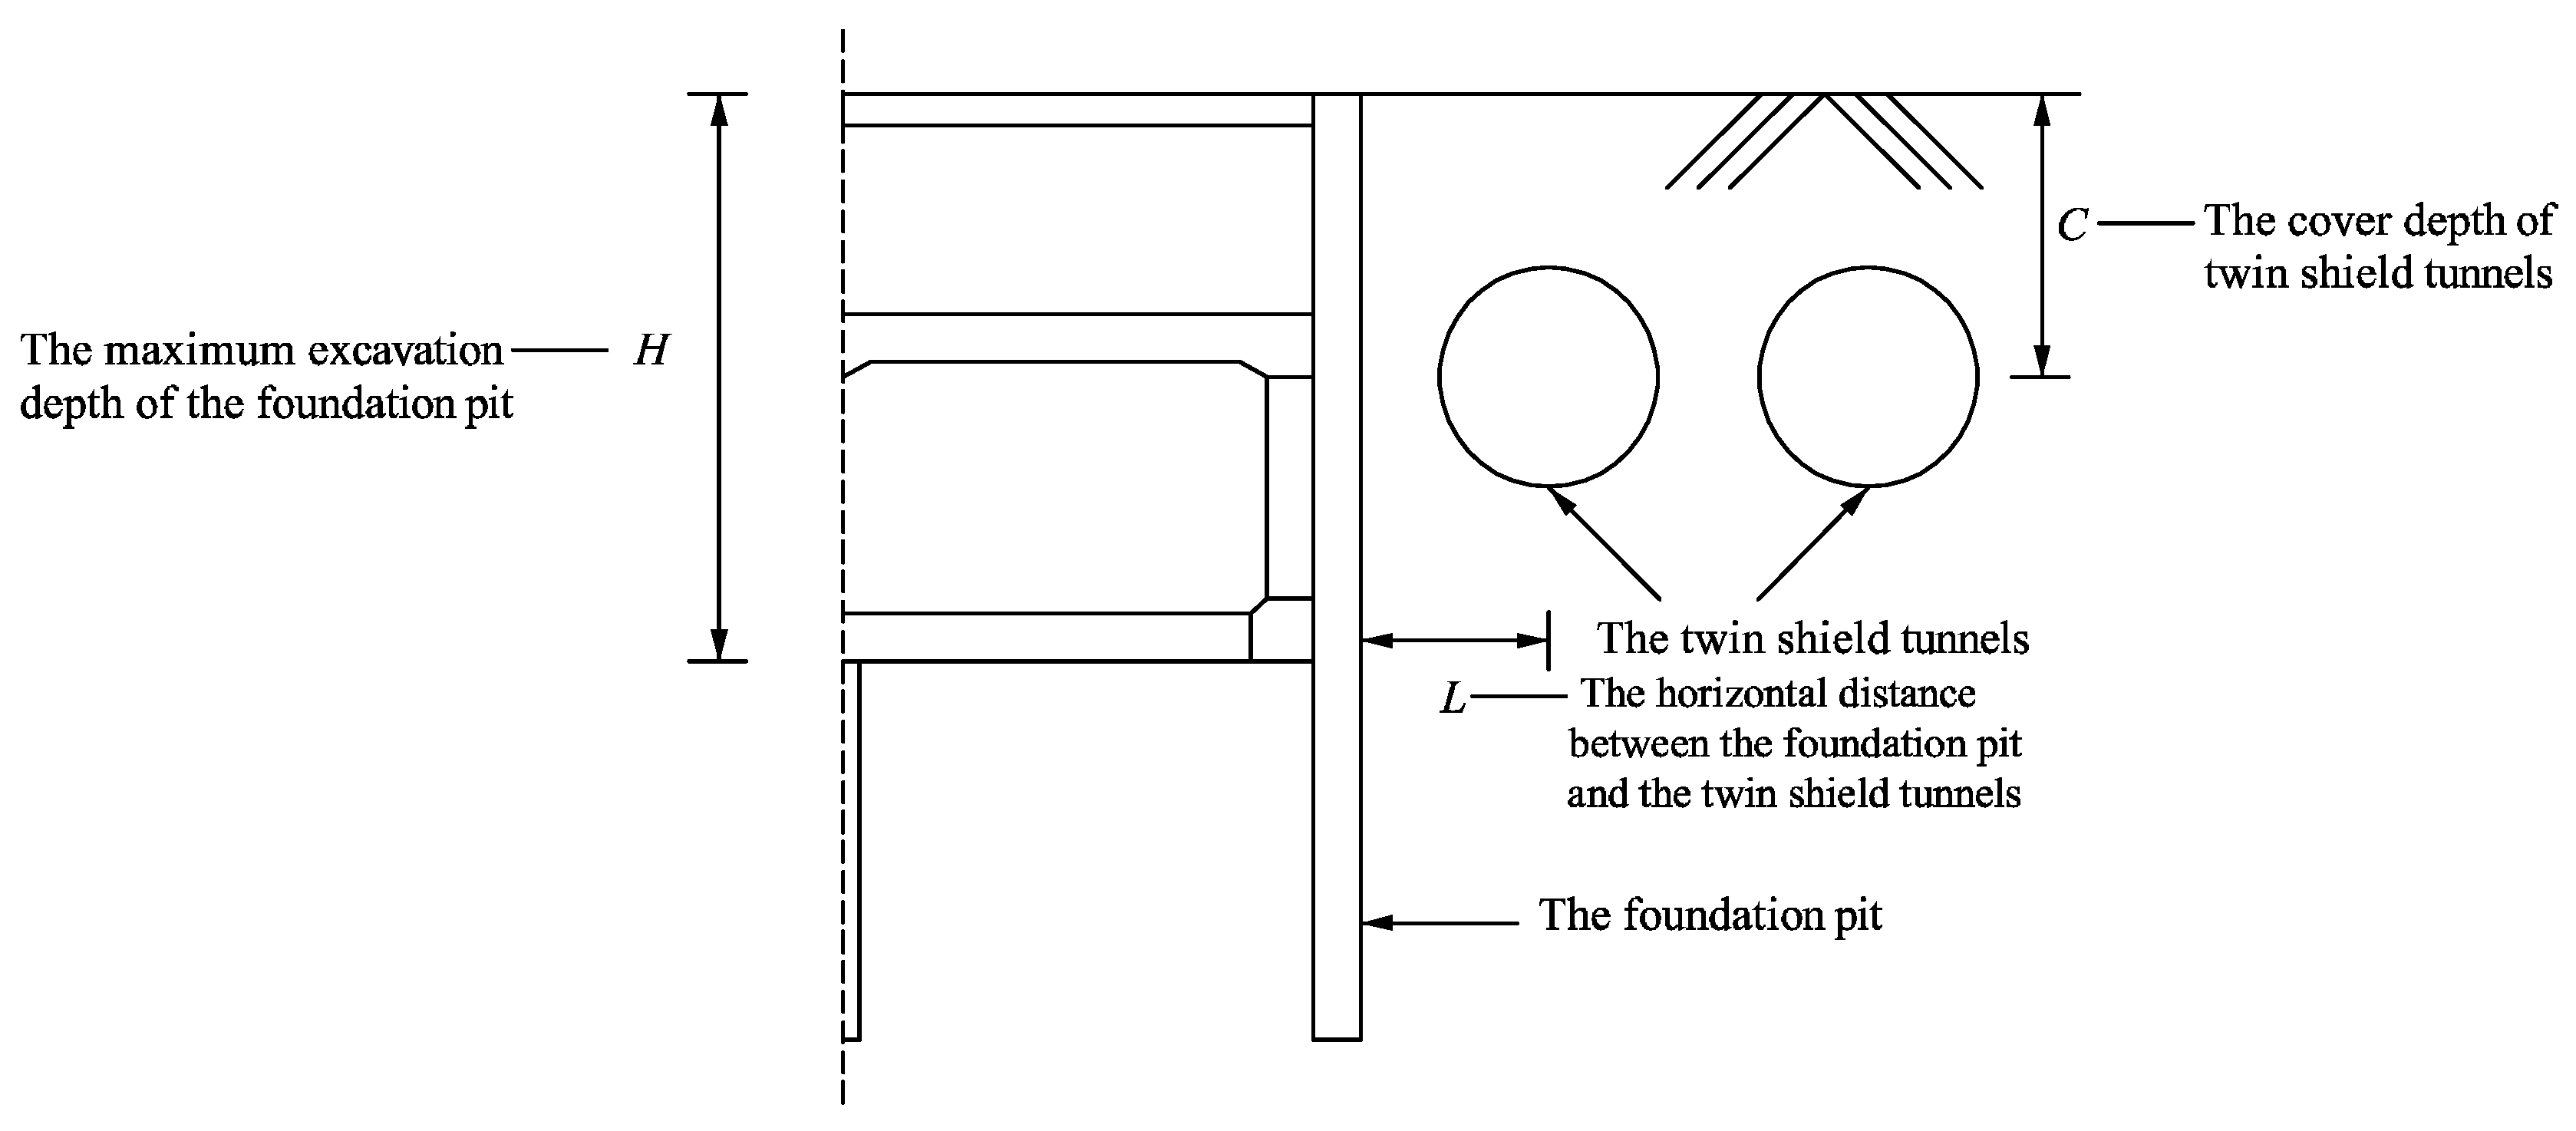
This paper uses the FELA software OptumG2 to establish a two-dimensional numerical model for the selected section K2 + 500. The K2 + 500 section belongs to the region where the twin shield tunnels are parallel to the direction of the main channel of the foundation pit, which is selected for analyzing the global stability of adjacent construction. The open-cut highway tunnel is a two-way six-lane highway tunnel, and, in the selected section, foundation pit has a width of 29.0 m and a height of 10.1 m. External diameter of tunnel is 6.7 m and thickness of lining is 350 mm. The supporting structure is simplified as an underground diaphragm wall for simulation based on the principle of equivalent stiffness and adjusted according to the actual situation. The thickness of the underground diaphragm wall in this model is taken as 800 mm. The relevant parameters of each structure and the type of soil layer refer to the data provided in the sectional view of the supporting structure, as shown in Figure 4. This paper aims to study the global stability of adjacent construction of the foundation pit and the twin shield tunnels; only half of foundation pit adjacent to twin shield tunnels has been analyzed in the numerical simulation, as shown in Figure 5. The geometrical parameters of the adjacent construction include the horizontal distance L between twin tunnels and foundation pit and cover depth C of twin shield tunnels. In the numerical simulation, the two-dimensional numerical model has dimensions of approximately 4.5 H × 11.5 H in the horizontal and vertical directions, respectively (H is maximum excavation depth of foundation pit in selected section). Model boundaries are large enough to ensure that the plastic yielding zone is comprised in the field and avoid intersecting with boundaries of model. The displacement of the bottom boundary is completely fixed and the normal displacement of the four vertical boundaries is fixed.
In this paper, the plates are used to simulate the concrete supporting and the solid elements are used to simulate soil. Concrete support and steel support are simulated by the connectors. The parameter values of each material are provided in Table 1, Table 2 and Table 3.
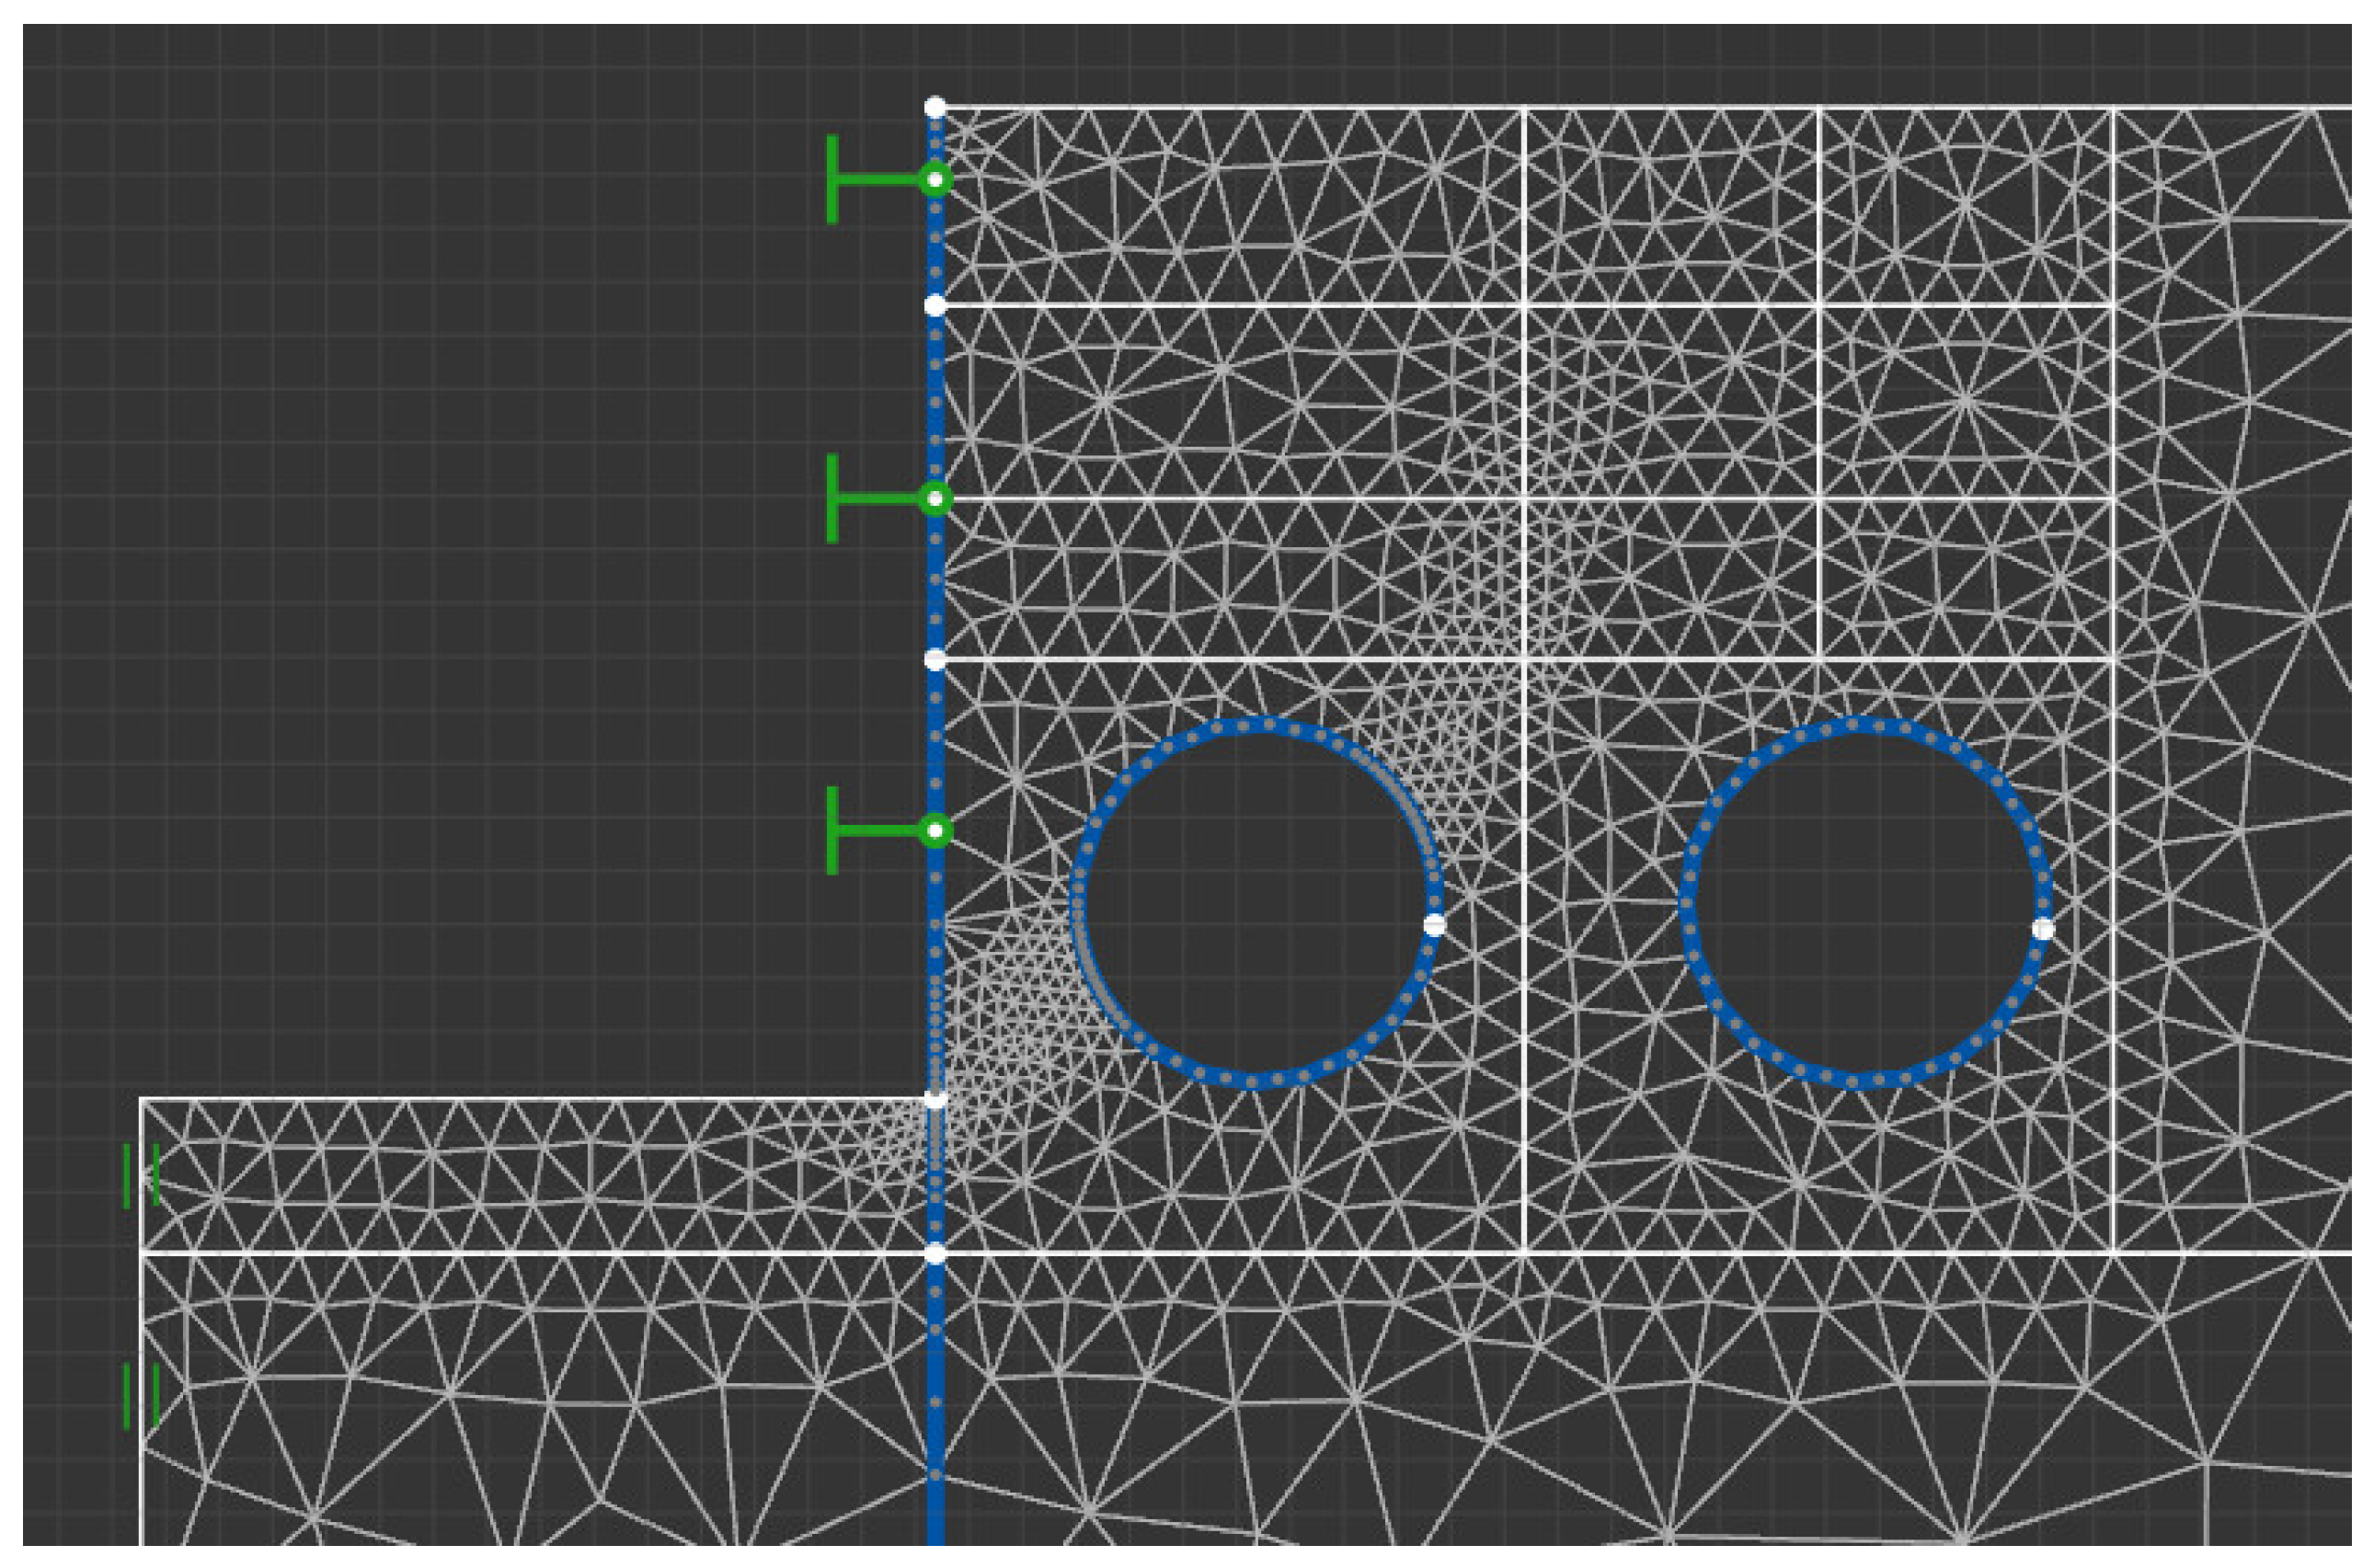
Limit analysis is the most useful method to obtain the tight bounding estimates on plastic limit load. For finite element limit analysis, the size of ‘gap’ between upper and lower bounds depends strongly upon the discretization mesh used. The adaptive mesh refinement is a formidable function of finite element limit analysis software OptumG2, which can be used for upper limit analysis and lower limit analysis to calculate strict bounding estimates. The adaptive mesh refinement is carried out by controlling the shear dissipation in this paper. Based on the direct measures of the contributions from each element to the shear dissipation, the elements that make large contributions to the shear dissipation and are thus in need of refinement are identified, and these elements are replaced successively by finer meshes to optimize the upper and lower bounds in the iterations. All analyses used five iterations of mesh adaptivity in order to obtain sufficiently strict upper and lower bounds. In Figure 6, after five iterations of mesh adaptivity, the newly generated mesh completely reveals accurately the potential sliding surface in adjacent construction of the foundation pit and the twin shield tunnels. Different colors represent different structures and soil in this figure. The blue structures show the underground diaphragm wall and shield tunnels, respectively. The green structures show the first concrete support and the second and third steel supports. The white lines represent the model grids simulating soil ground.

3. Stability Analysis of the Adjacent Construction of Foundation Pit and Twin Shield Tunnels

3.1. Interaction between Twin Tunnels Structure and Foundation Pit Structure

This section mainly studies the interactions between twin tunnels and foundation pit. First, numerical model parameters are assigned according to Table 1, Table 2 and Table 3, and then the global stability of twin tunnels and foundation pit is analyzed through the strength reduction method. In the calculation, the strength of the structural elements of twin tunnels and foundation pit is reduced. The bounding estimates of safety factor of global stability are calculated through the use of upper method of limit analysis and lower method of limit analysis. Influences of relative position between twin tunnels and foundation pit on global stability of adjacent construction of twin tunnels and foundation pit will be analyzed.

3.1.1. Influence of the Construction Scheme of the Foundation Pit

In this section, the global stability of the foundation pit and the twin shield tunnels during the foundation pit construction is analyzed. The whole process of numerical simulation has seven stages in total, which includes (1) the balance of initial ground stress, (2) the excavation of the twin shield tunnels and the application of the tunnel supporting structure, (3) the application of the maintenance structure of the foundation pit, (4) the first excavation of the foundation pit and application of the first horizontal support (approximately 1.4 m below the ground surface), (5) the second excavation of the foundation pit and application of the second horizontal support (approximately 7.2 m below the ground surface), (6) the third excavation of the foundation pit and application of the third horizontal support (approximately 13.5 m below the ground surface) and (7) the last excavation of the foundation pit (approximately 13.5 m below the ground surface).
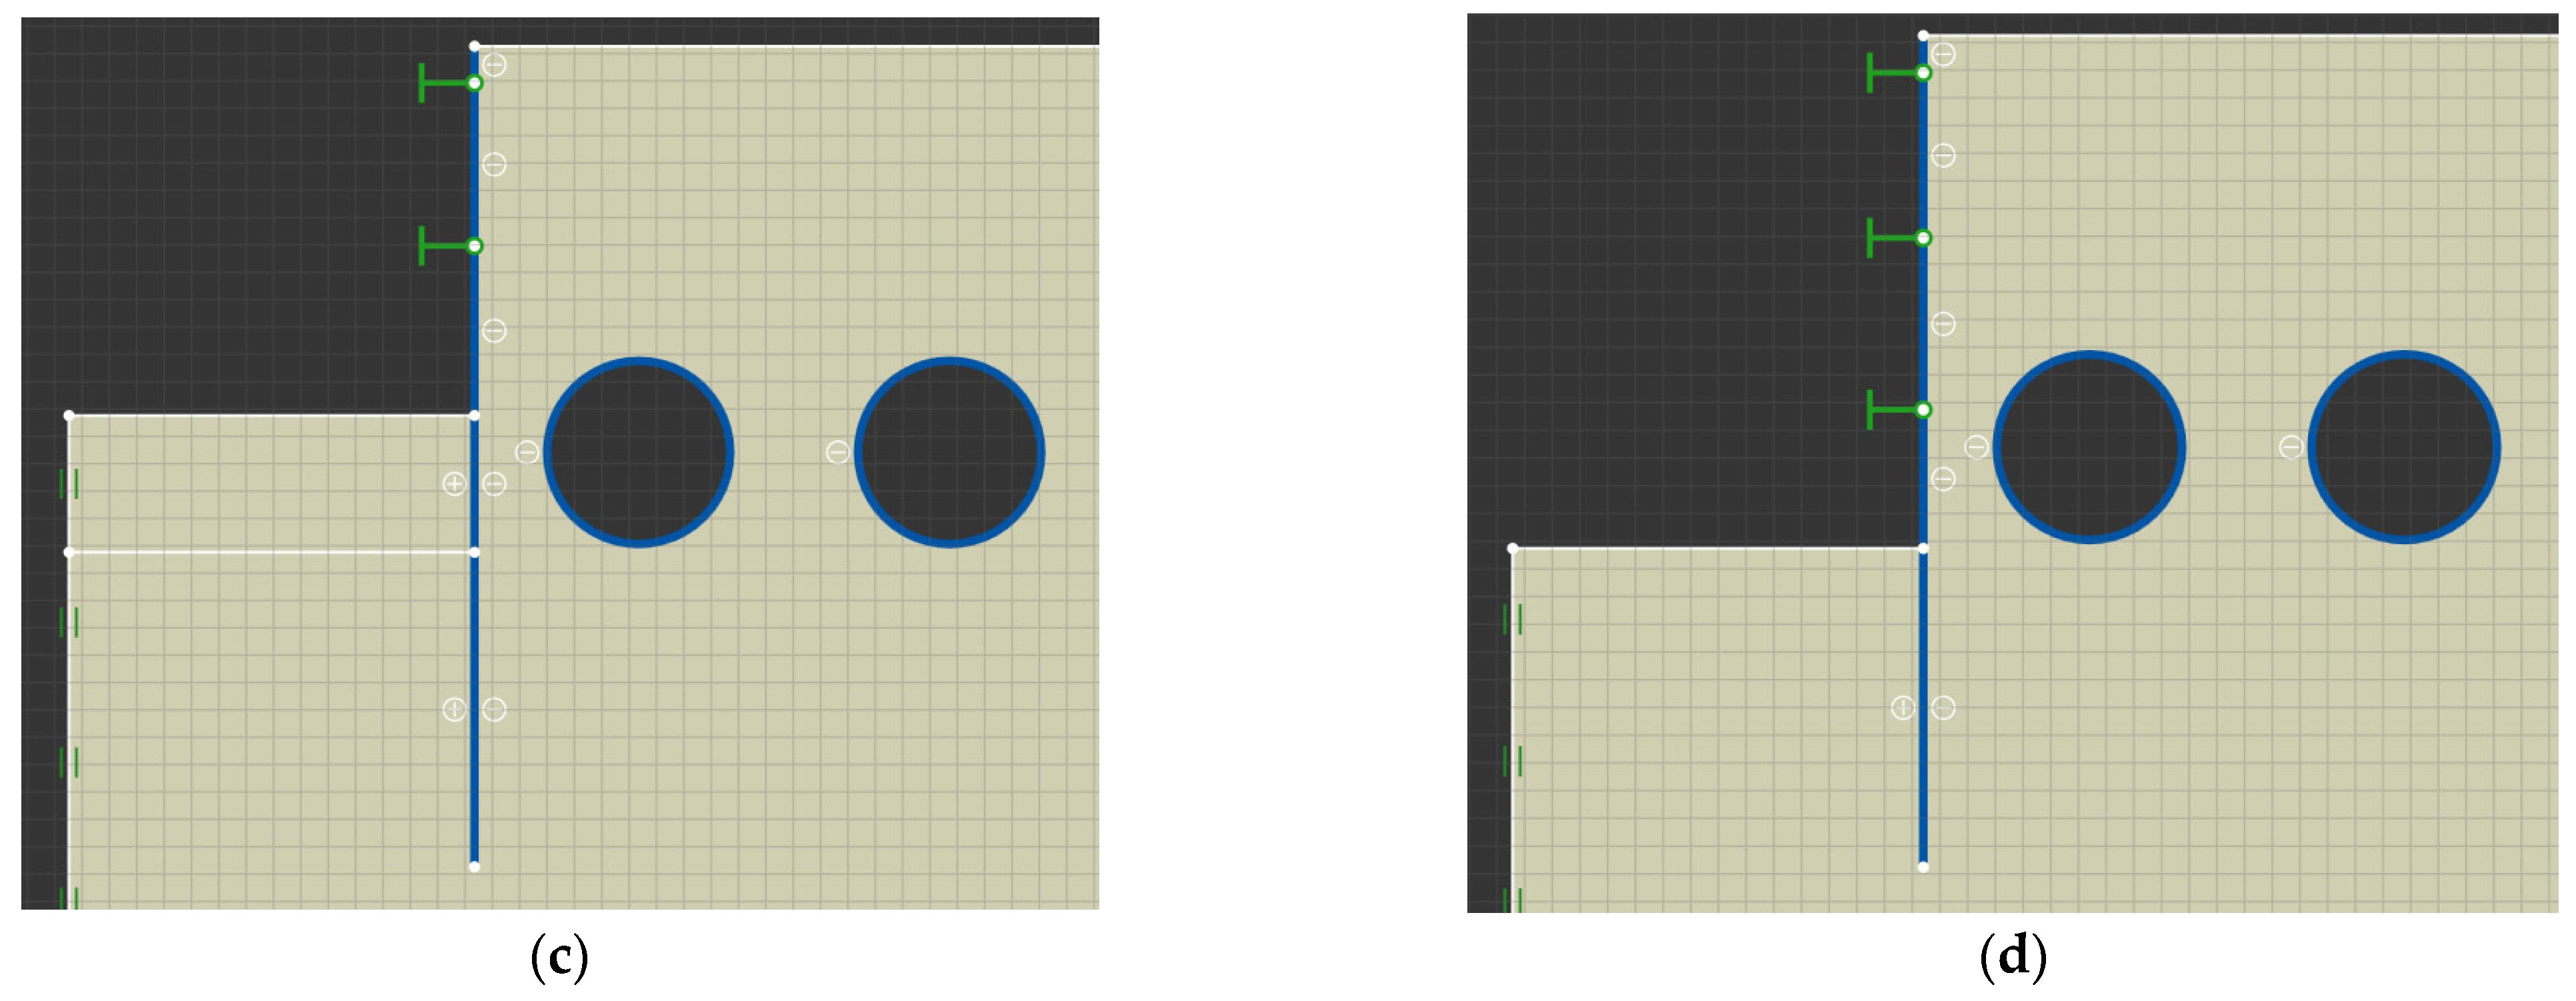
In this paper, four representative stages are chosen to analyze the influence of the construction scheme of the foundation pit on the global stability of the adjacent construction. The four representative steps of foundation pit construction are performed as follows: (1) Excavate to 0.08 H and apply the first concrete support, (2) Excavate to 0.4 H and apply the second steel support, (3) Excavate to 0.75 H and apply the third steel support, (4) Excavate to 1.0 H, the bottom of the foundation pit. Further, the construction scheme of the foundation pit is presented in Figure 7. Different colors represent different structures and soil in this figure. The blue structures show the underground diaphragm wall and shield tunnels, respectively. The white lines show the first concrete support, the second and third steel supports, the bottom of the foundation pit and the ground surface, respectively.
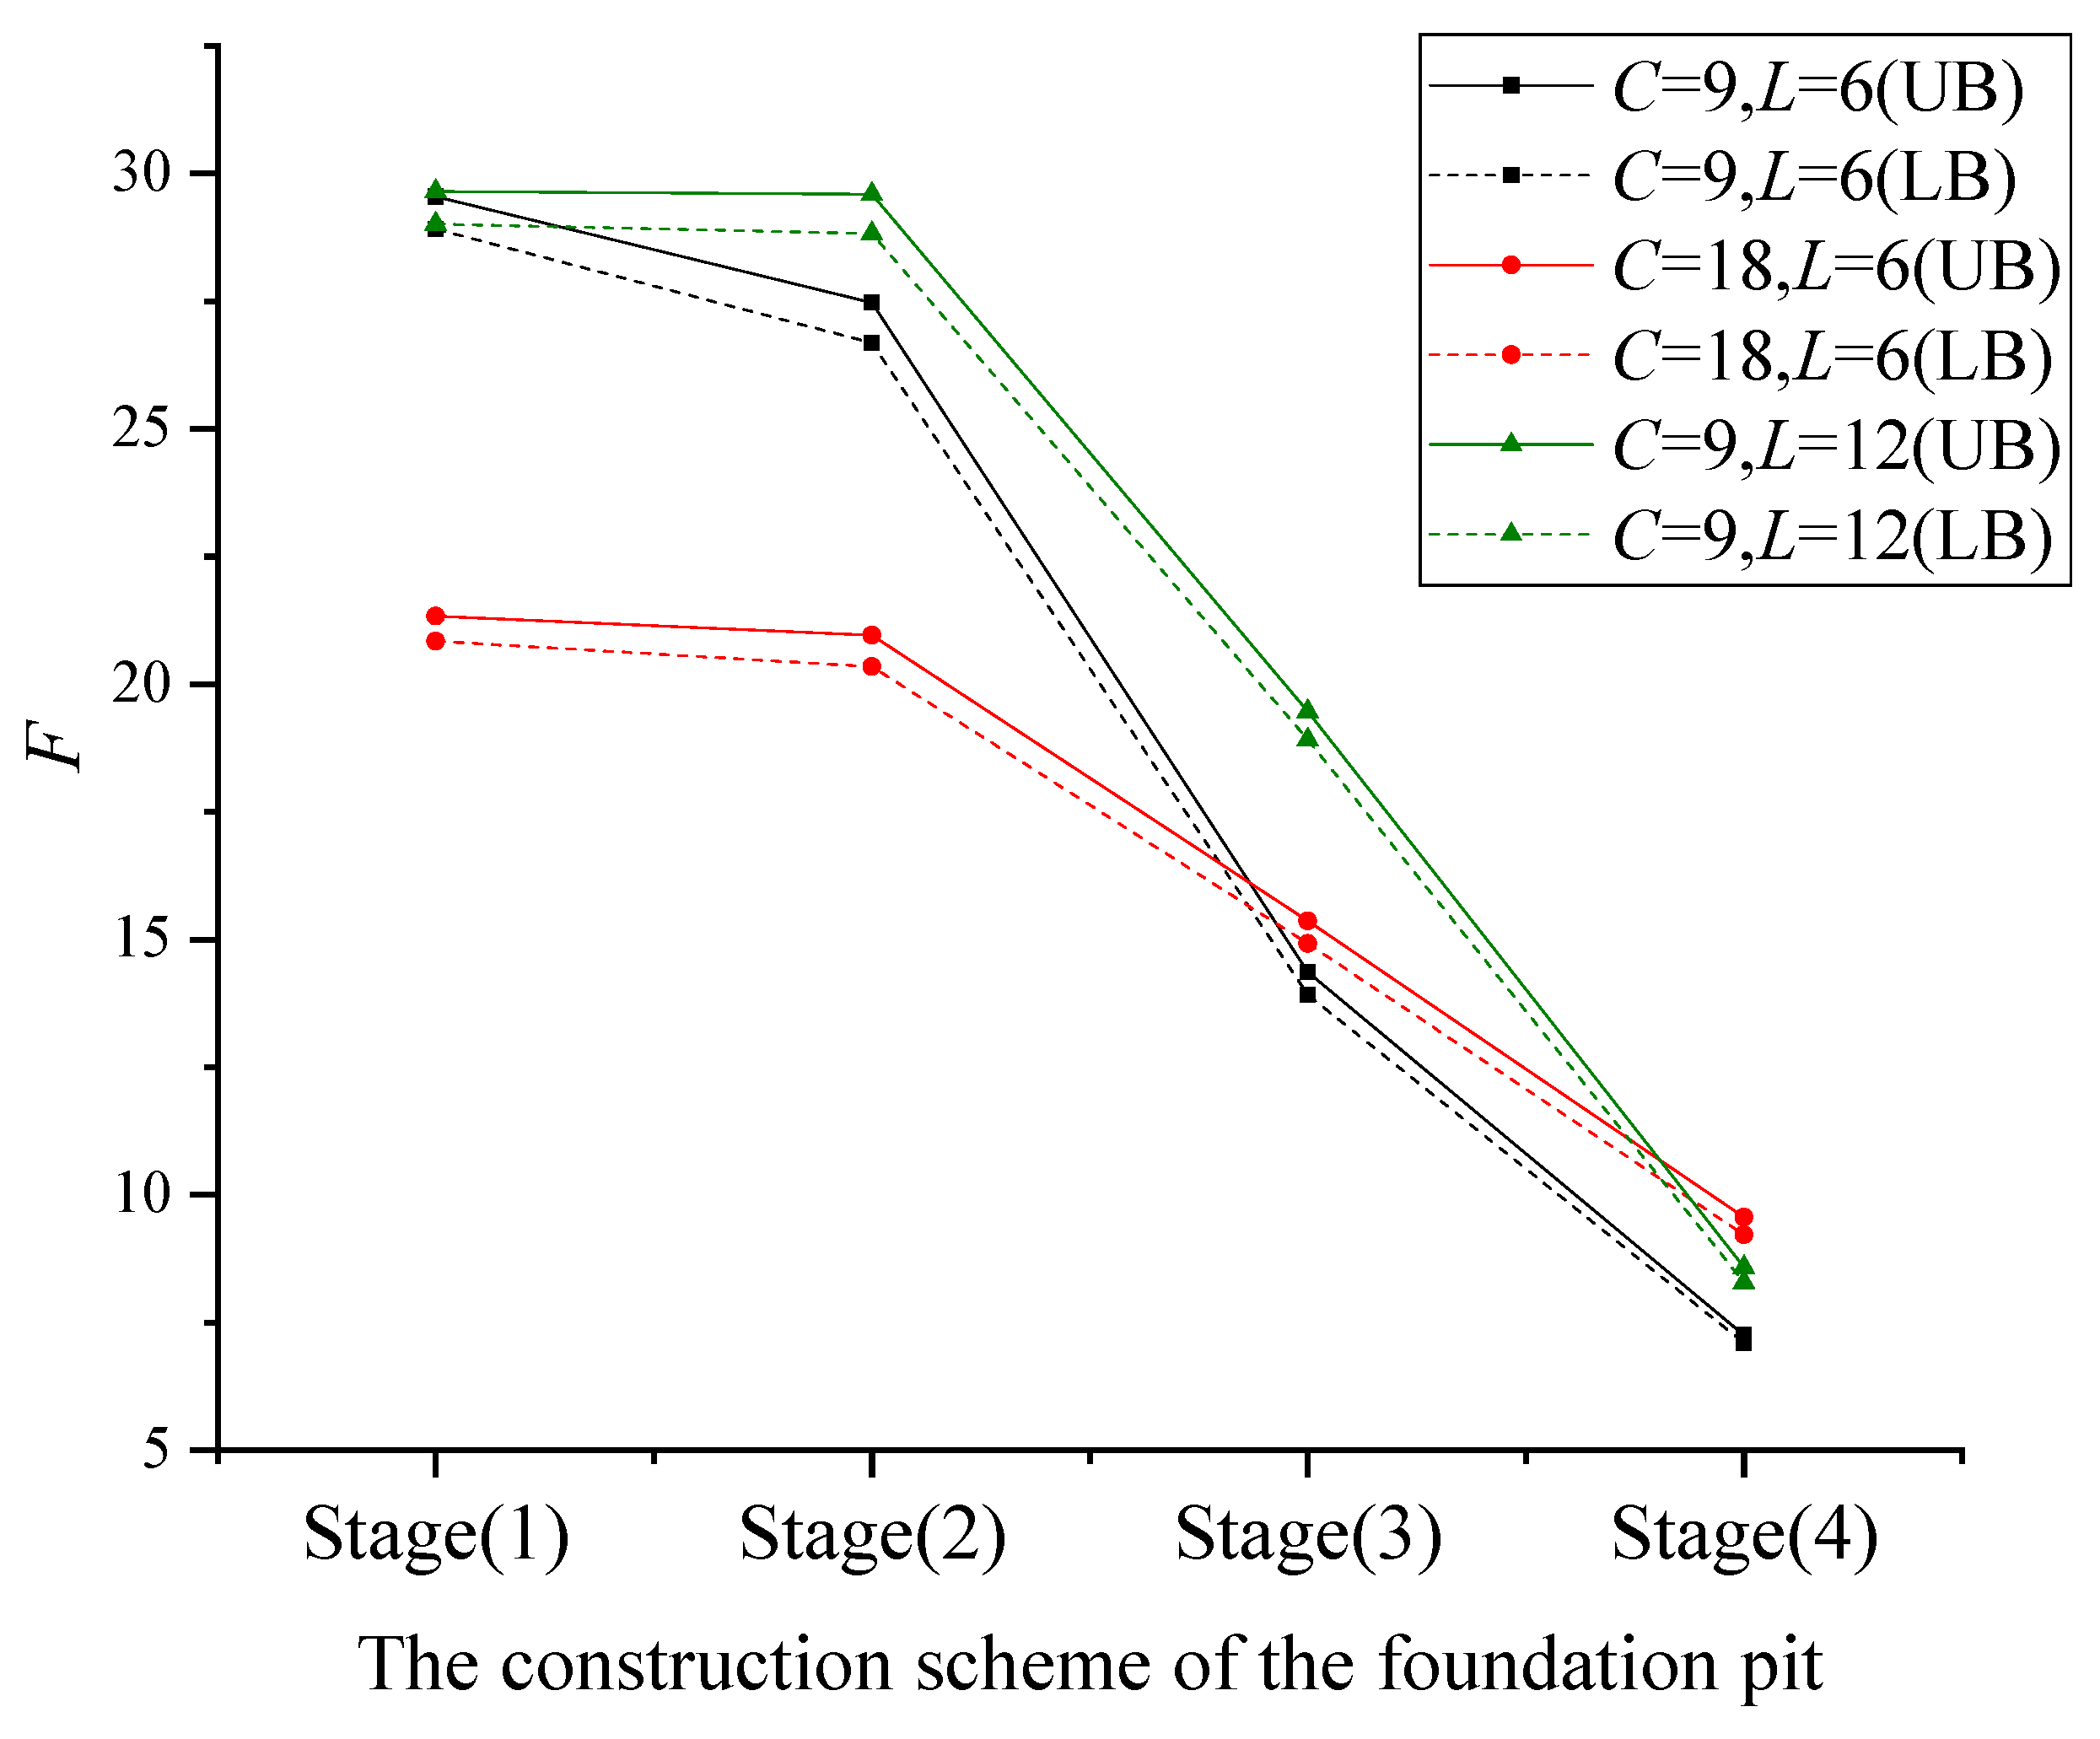
The bounding estimates of safety factor of global stability under four stages are obtained through strength reduction analysis and are presented graphically in Figure 8. It can be seen from Figure 8 that the safety factor of global stability decreases with change in stages during foundation pit construction, which means that the global stability also continues to decrease during construction process of foundation pit.
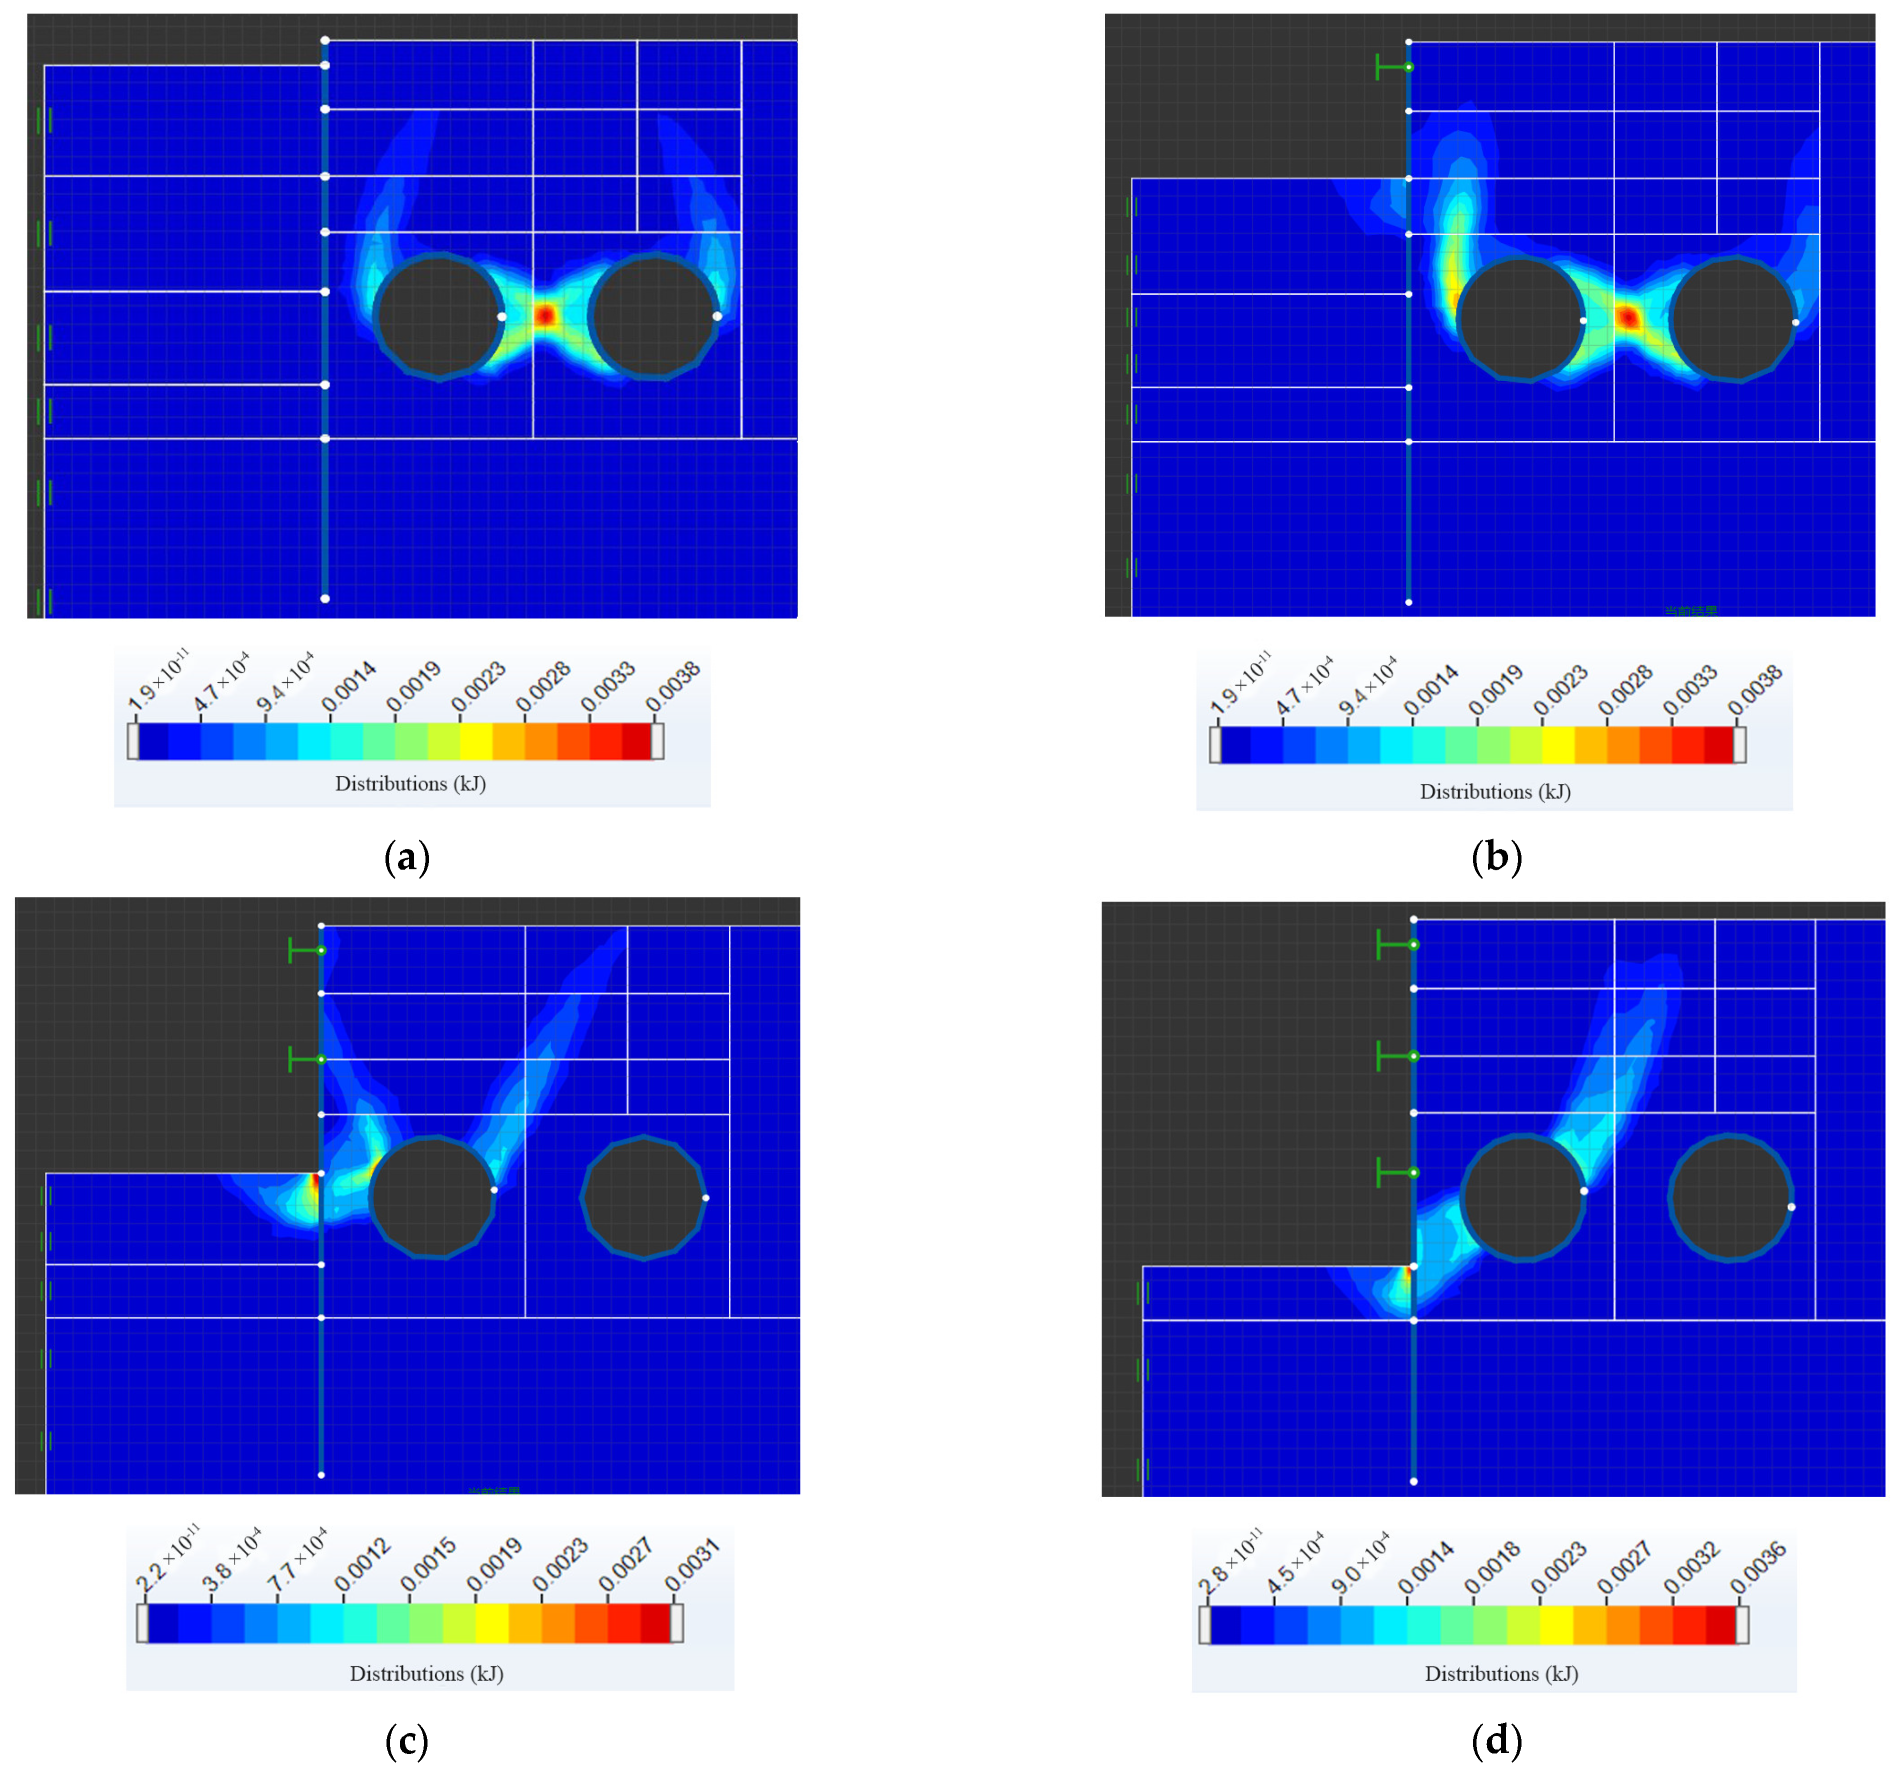
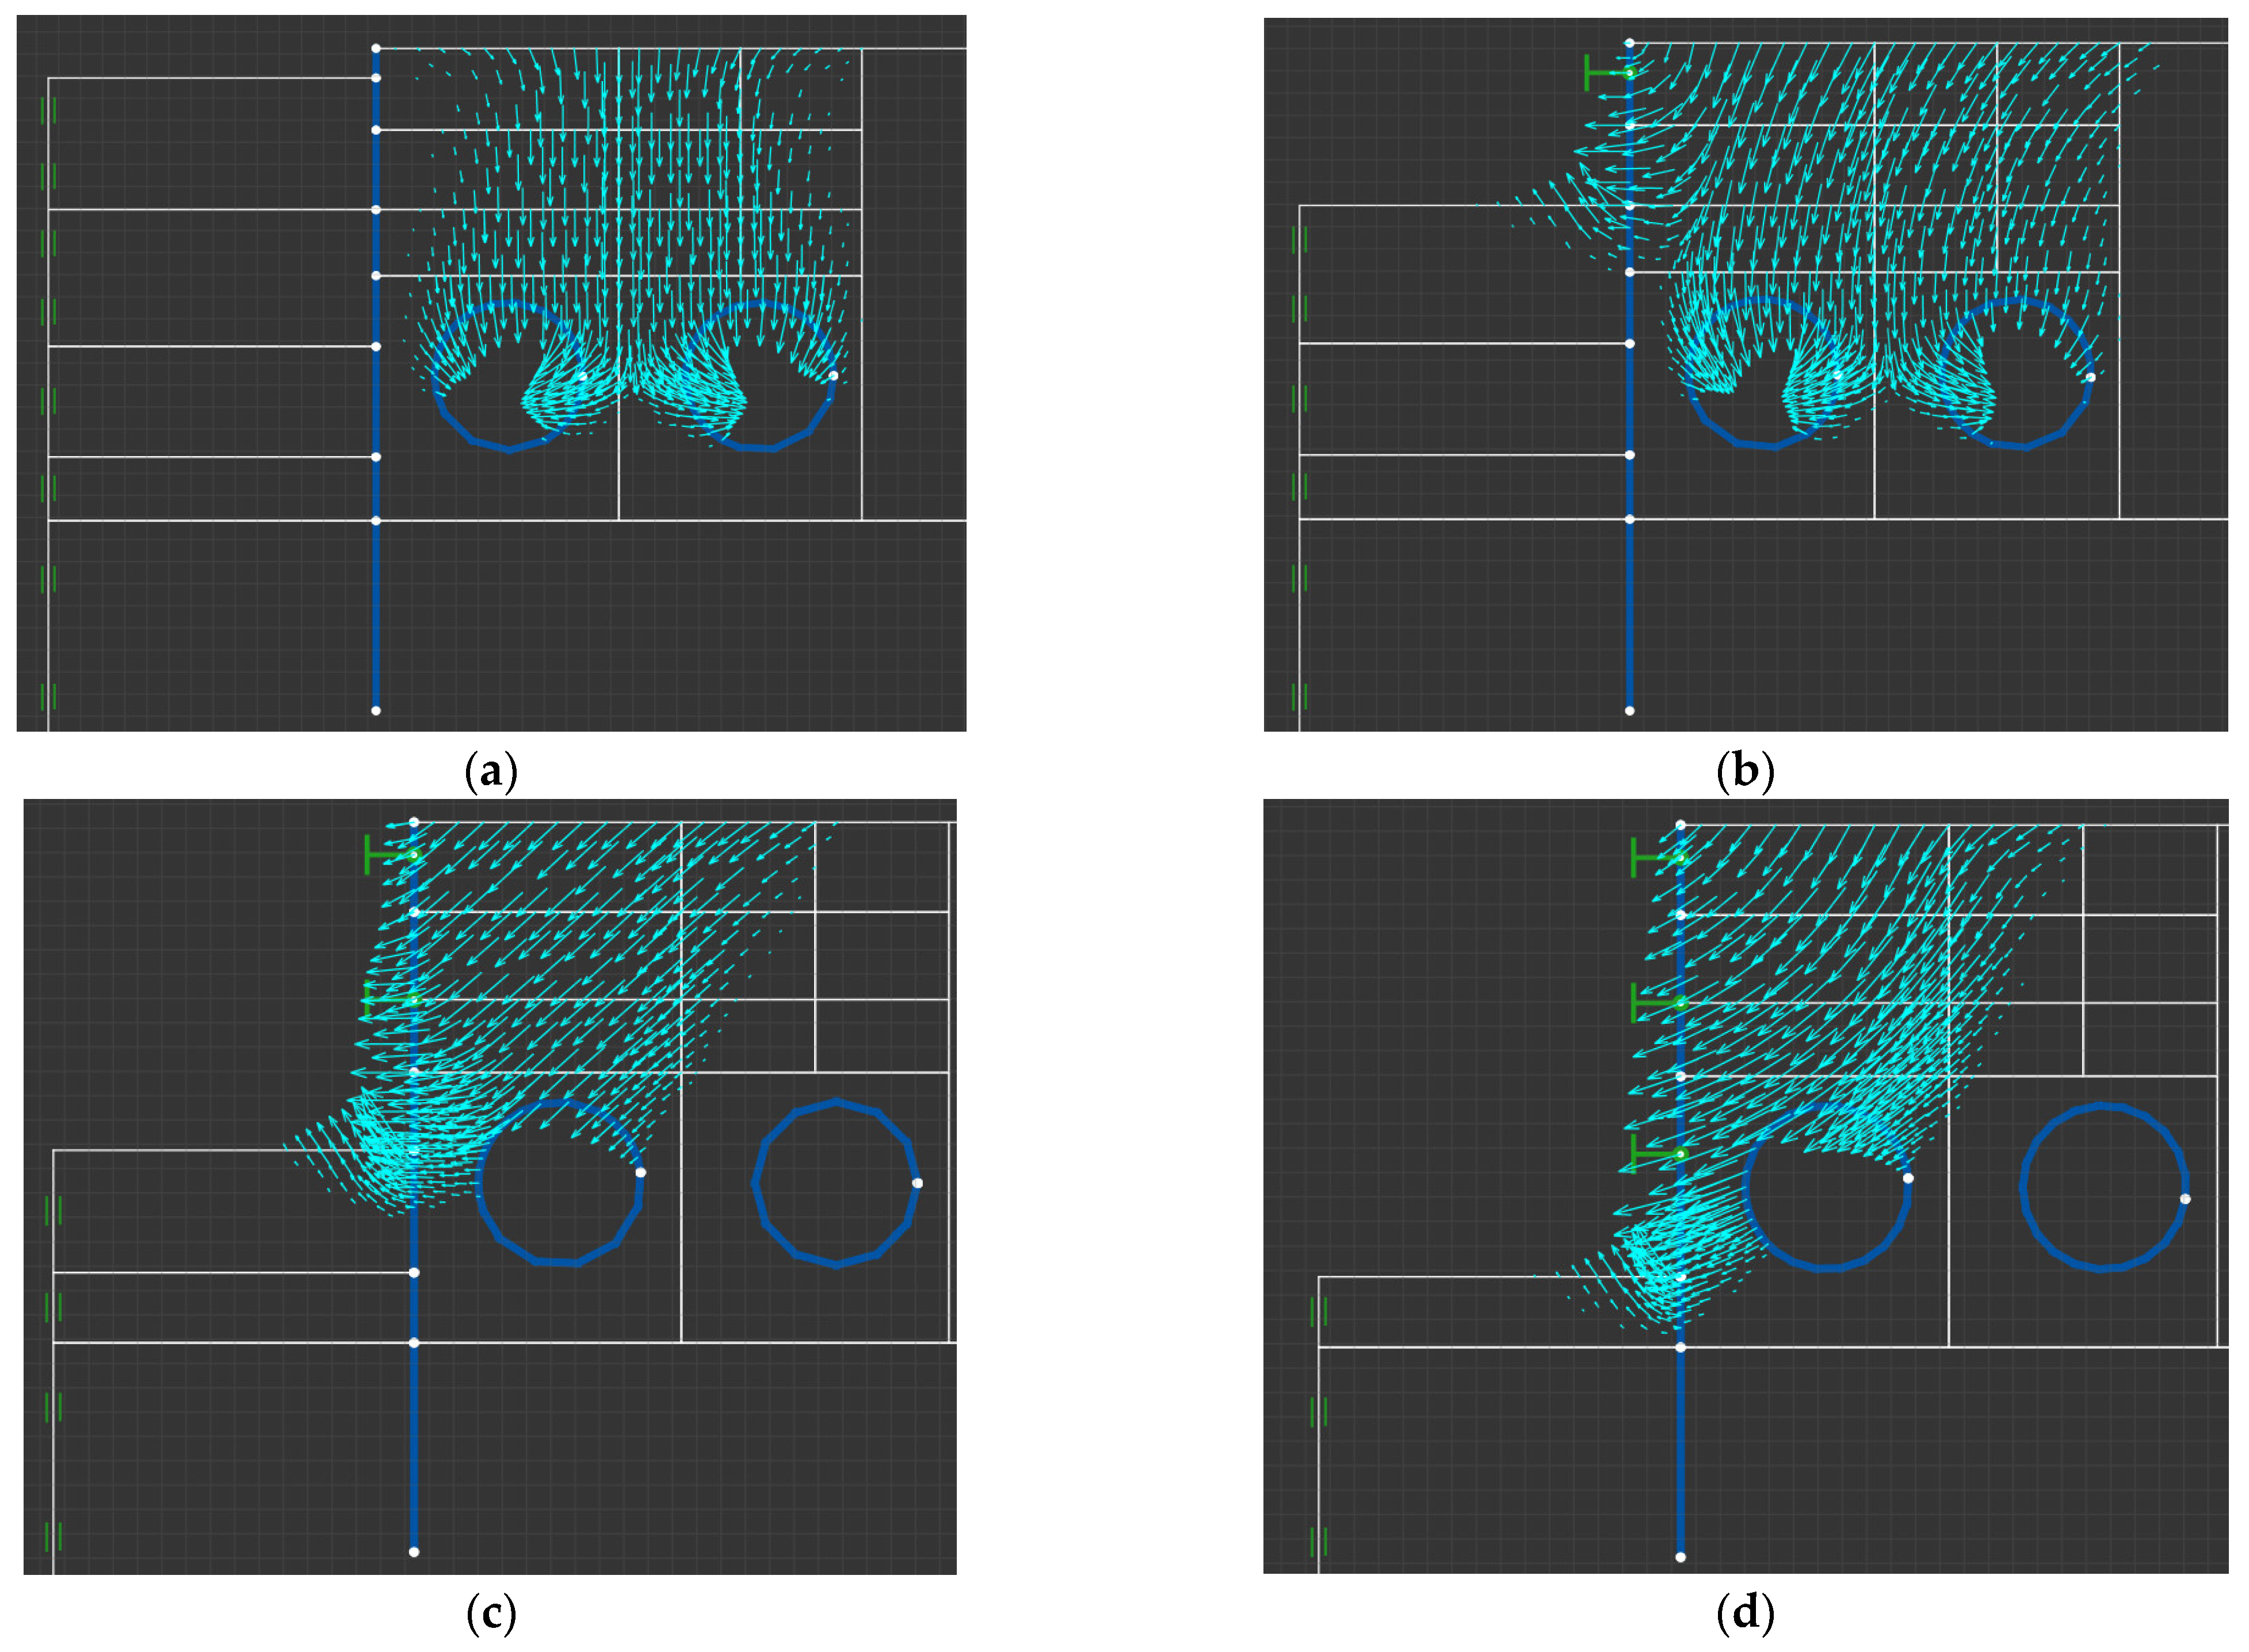
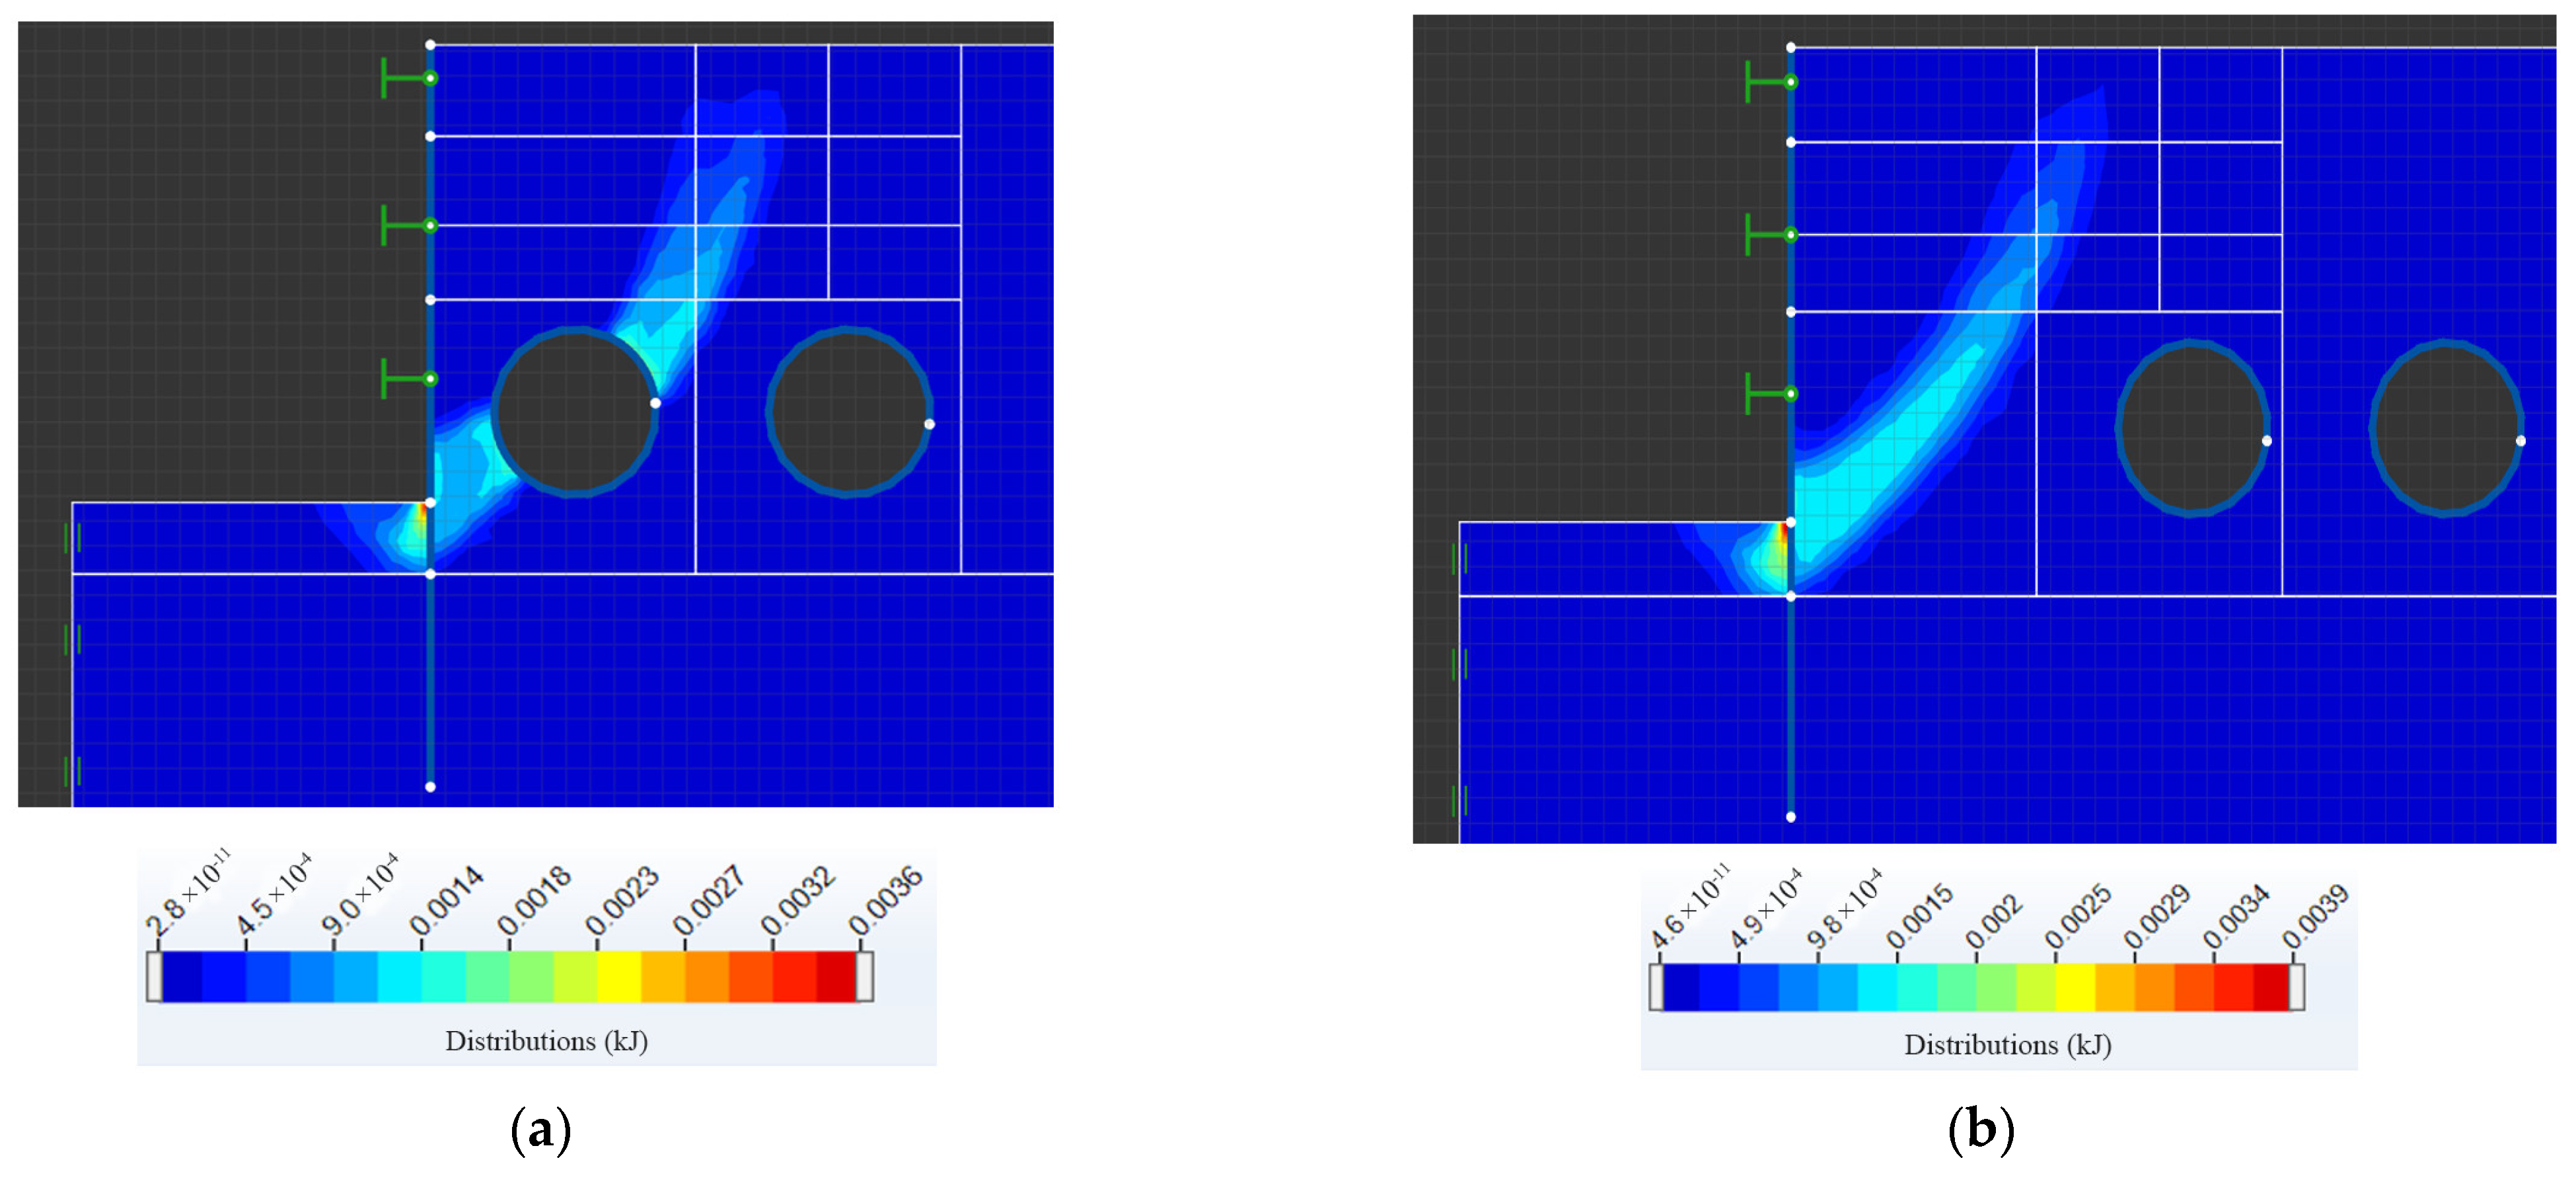
The global failure mechanism of adjacent construction of the foundation pit and the twin shield tunnels changes accordingly with the construction stage. In Figure 9, the blue structures show the underground diaphragm wall and shield tunnels, respectively. The different colors of the shear dissipation contours represent the value of the shear dissipation energy. The shear dissipation energy is larger when the color of the shear dissipation contours is more approximate to red. As shown in Figure 9a, due to the shallow excavation depth, structure of foundation pit is relatively stable when the foundation pit construction reaches the stage (1). After reduction in strength of structural element, the twin shield tunnels collapsed first. As shown in Figure 9b, the structure of the foundation pit also begins to lose stability when the foundation pit construction reaches stage (2). It can be seen from Figure 9c,d that the foundation pit collapses first under the deep excavation depth and the left one of twin shield tunnels is also influenced by the failure of foundation pit, and the incremental displacement vector under each stage shown in Figure 10 depicts the deformation of surrounding soil of adjacent construction, and the incremental displacement vector represented by the green arrows corresponds well to the failure mechanism under the four stages.
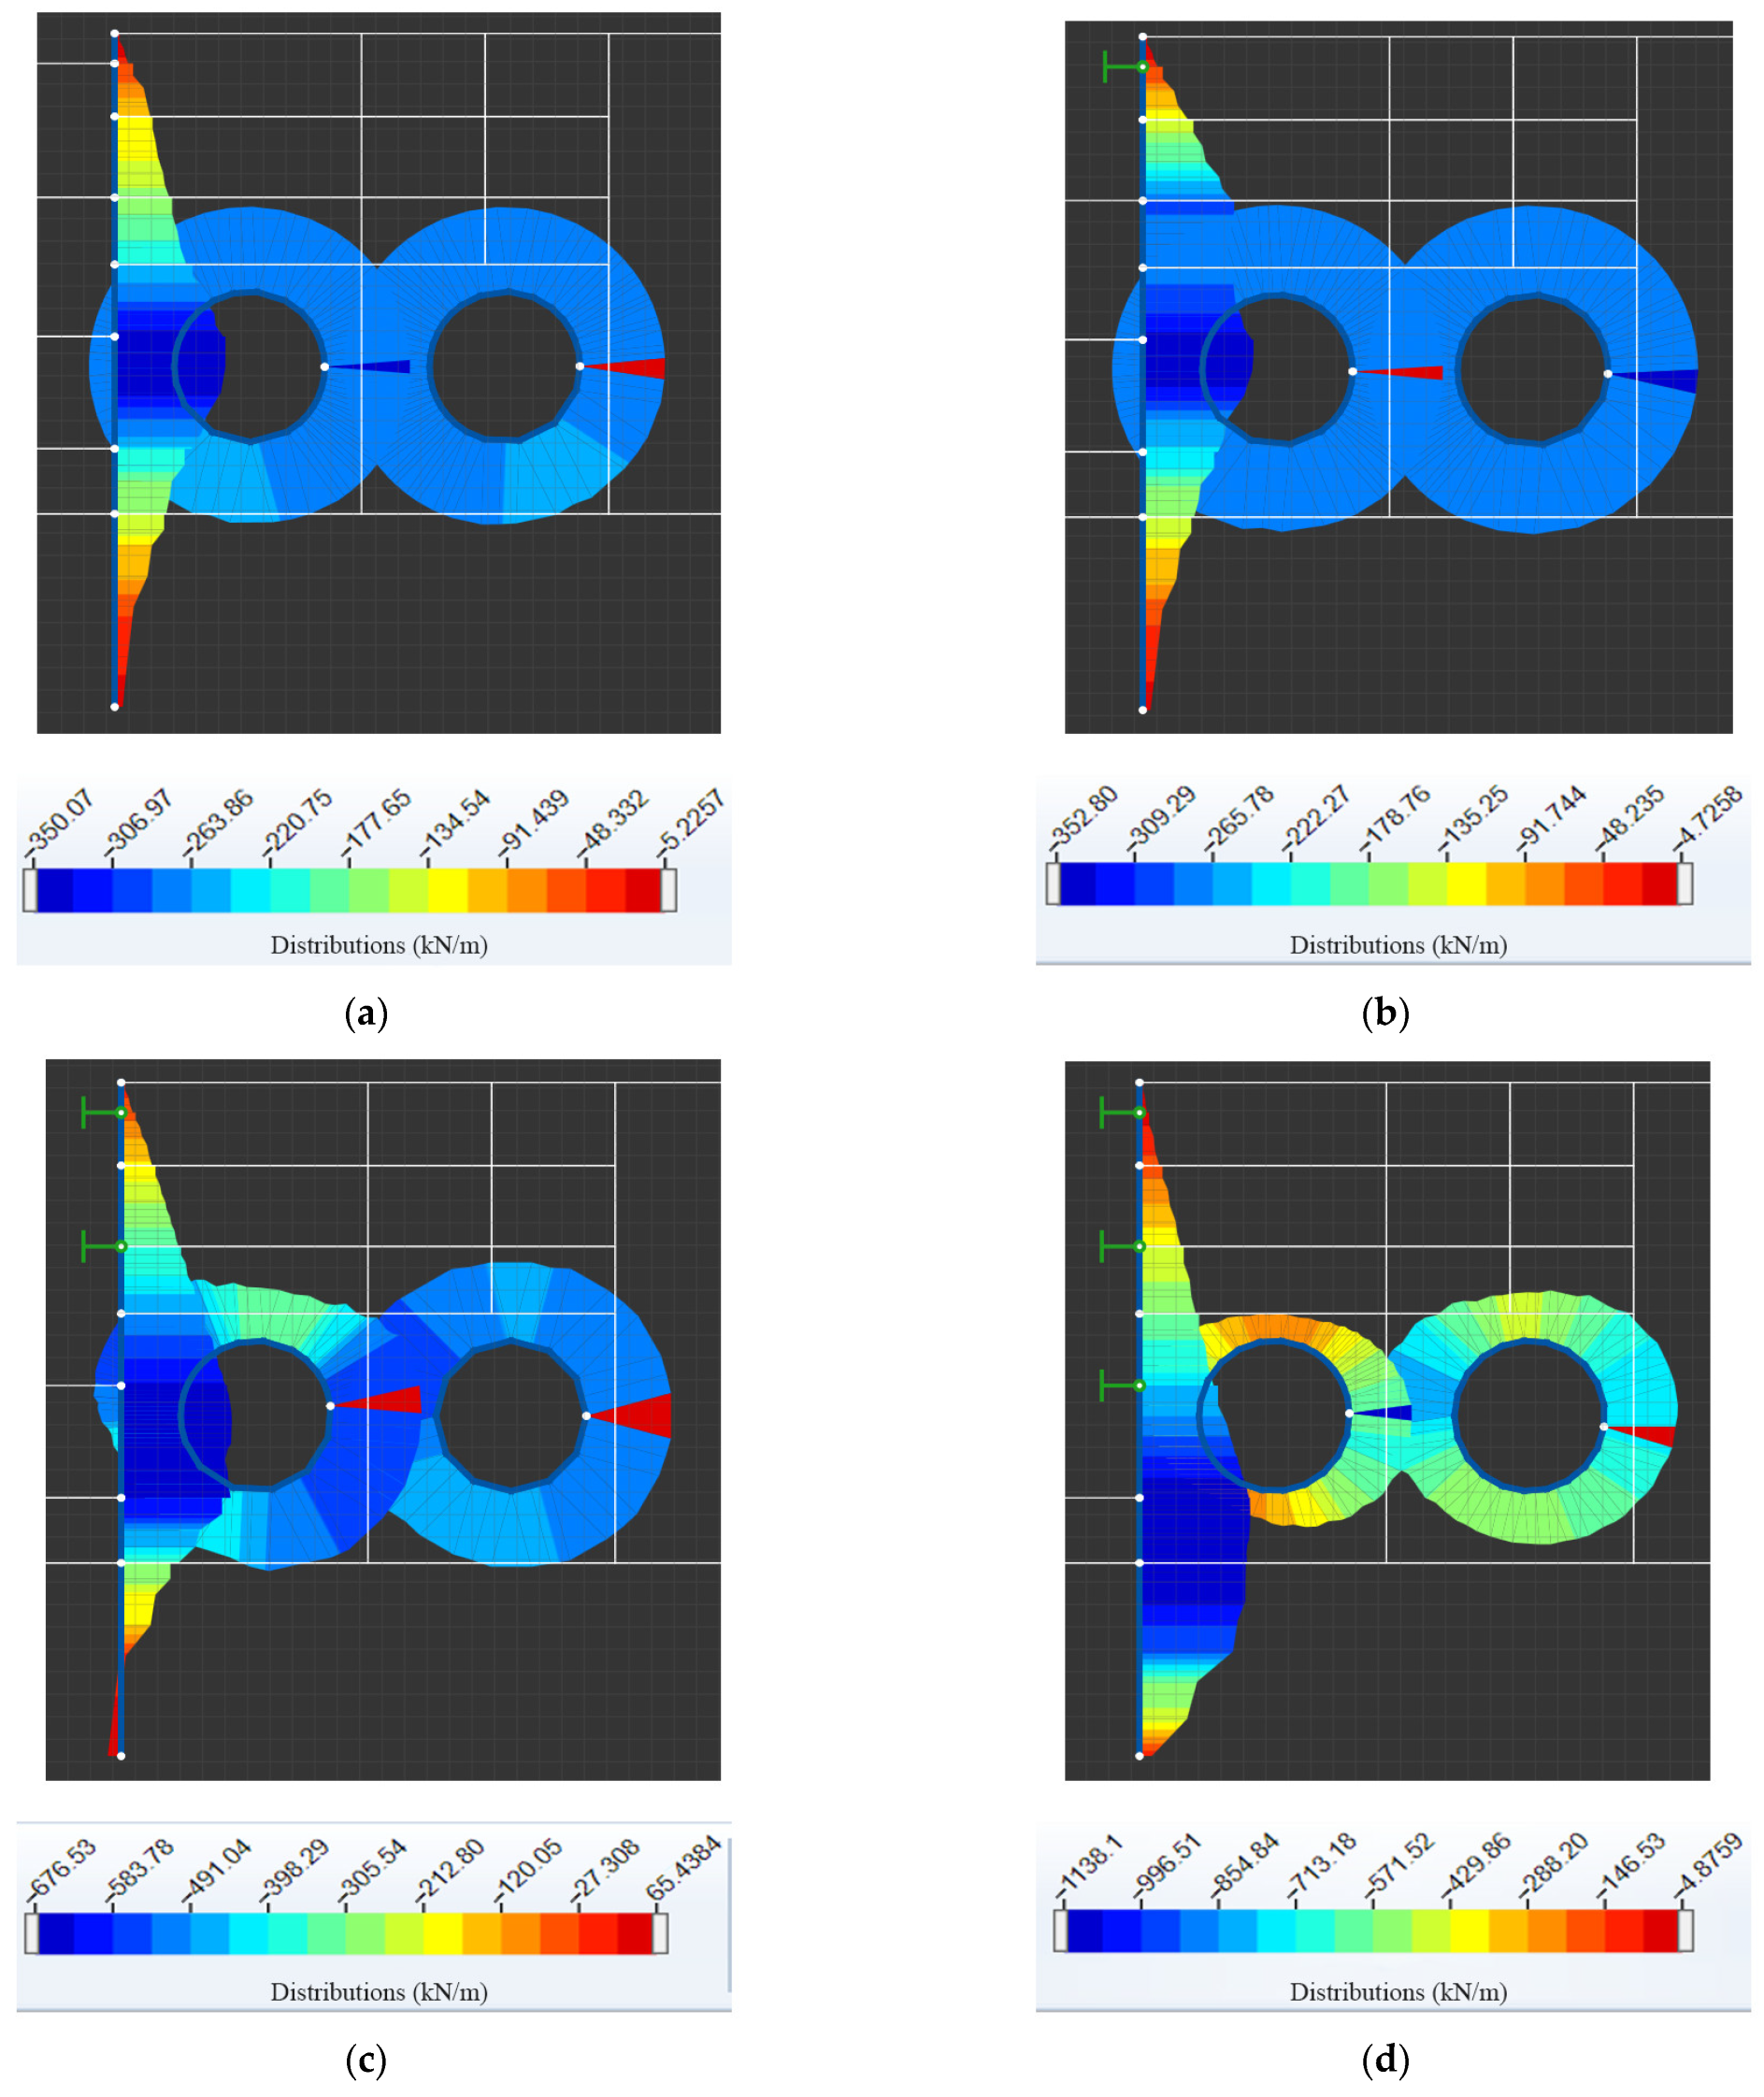
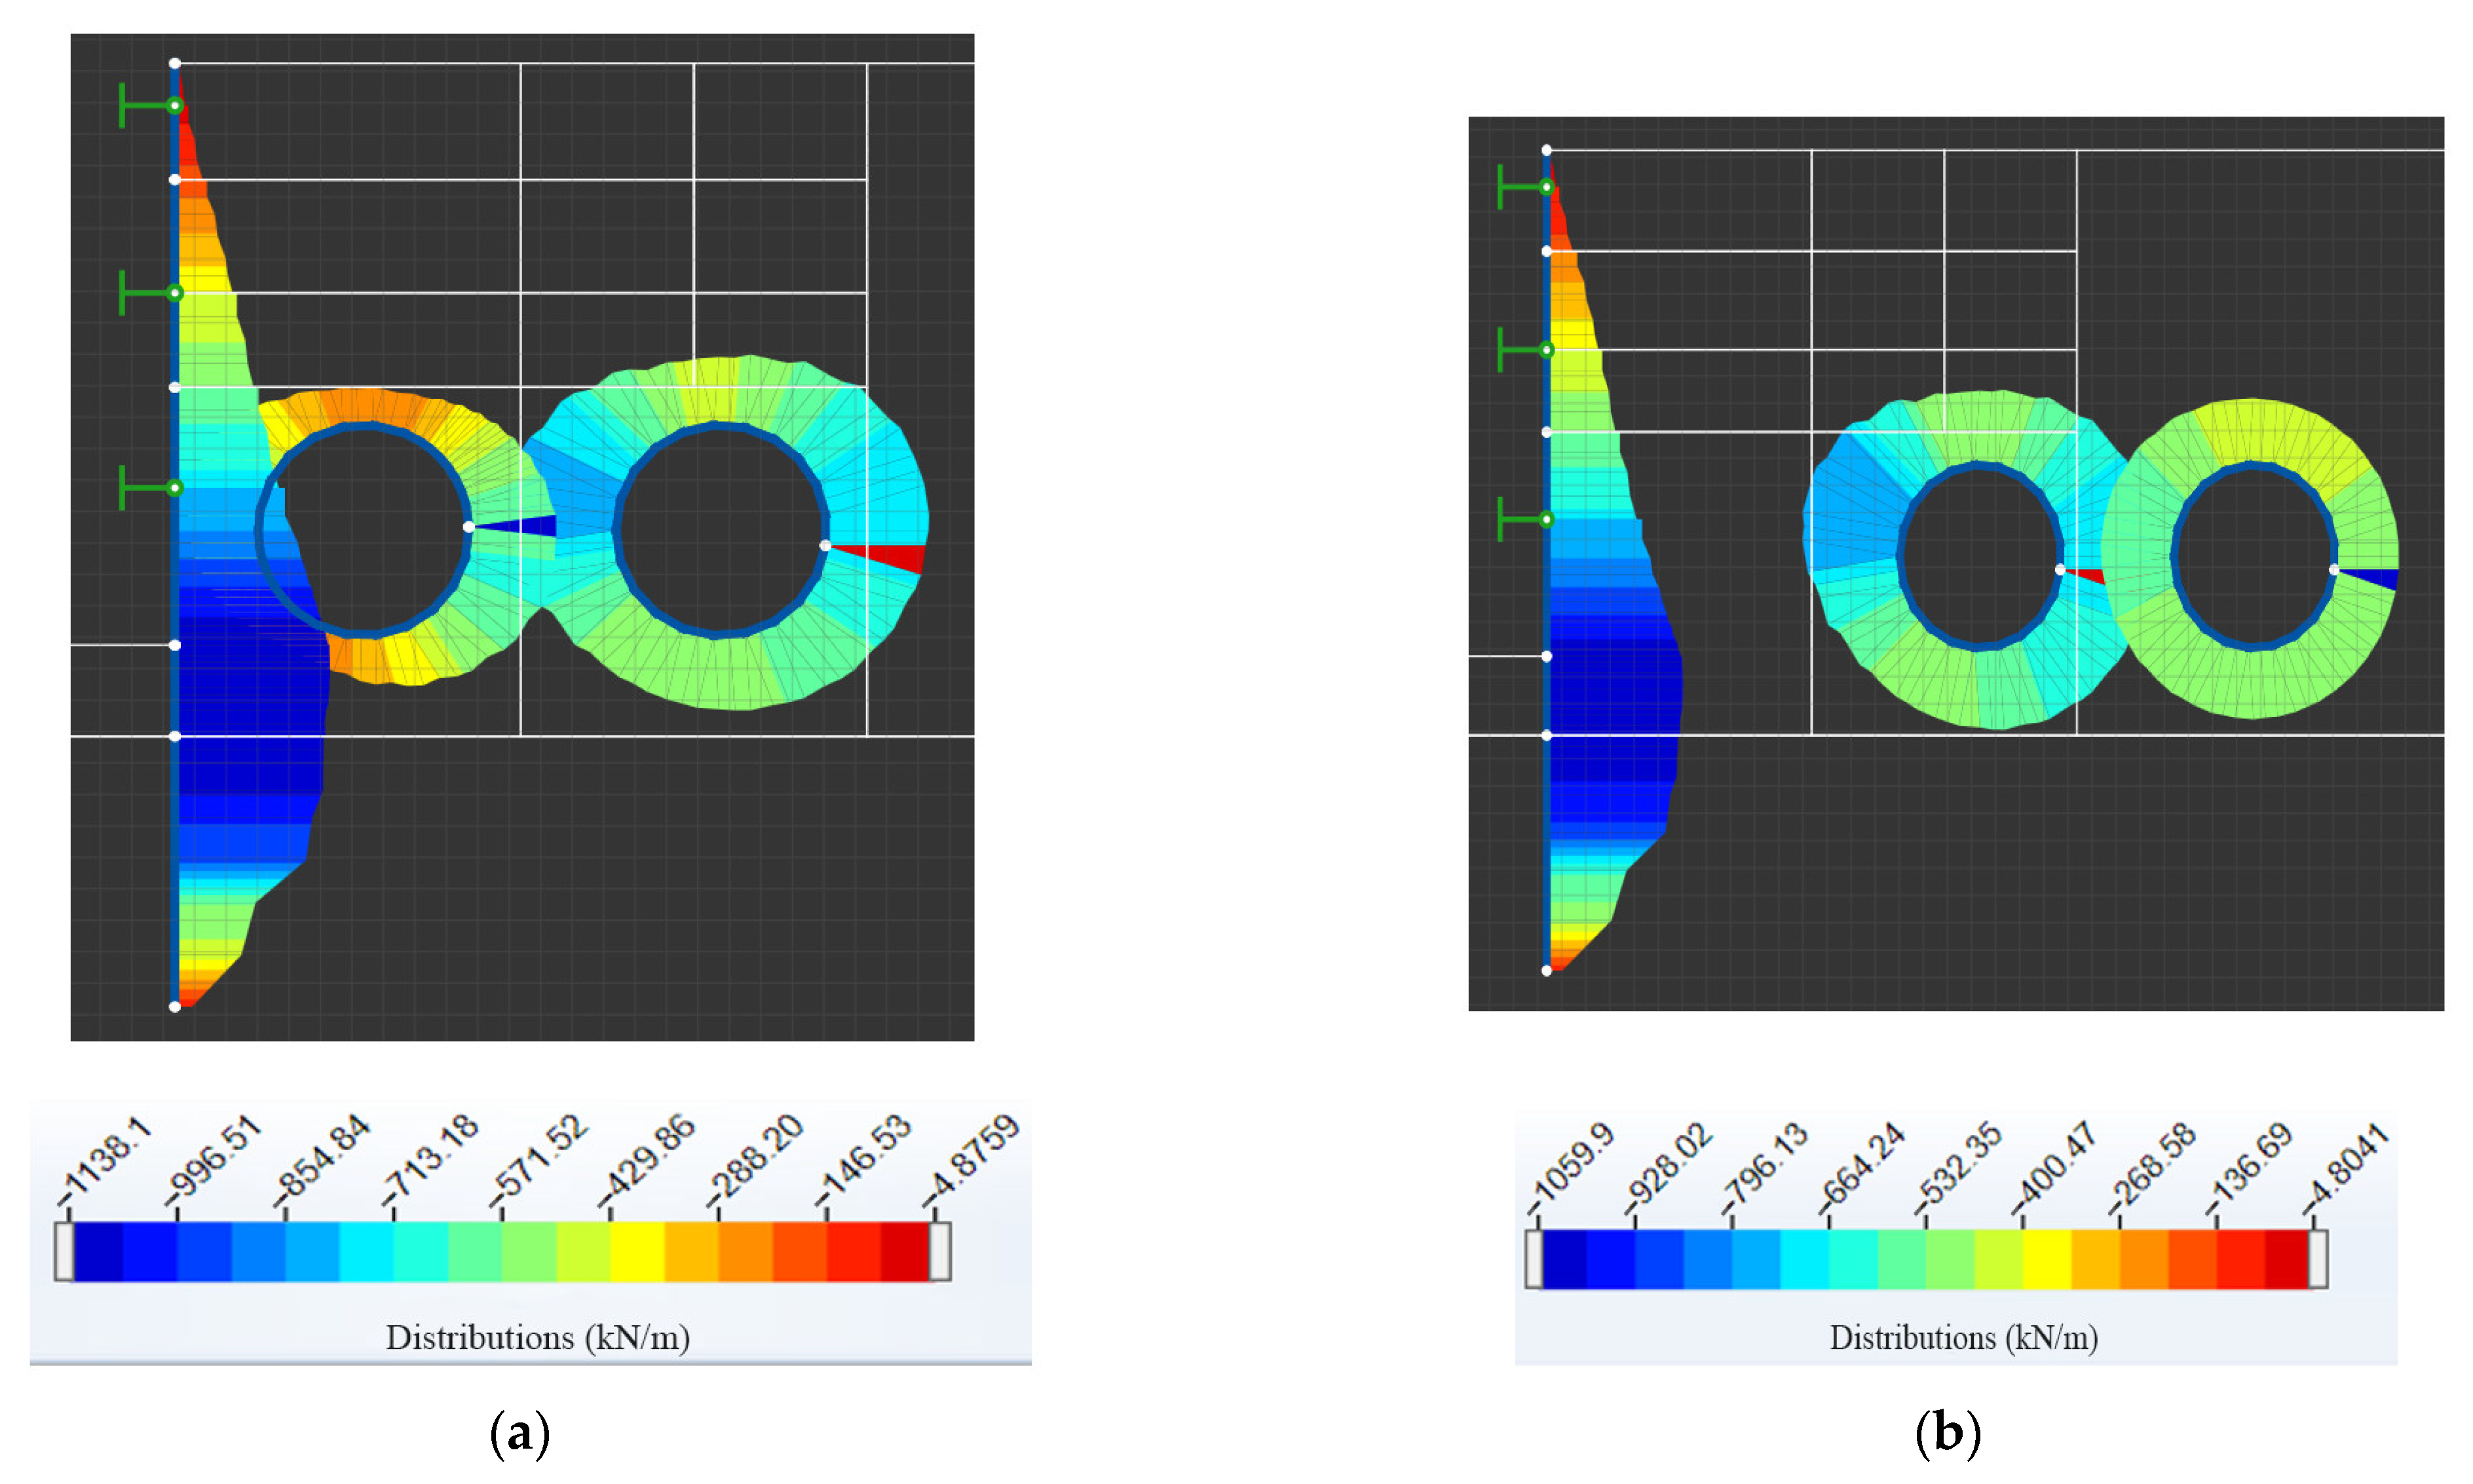
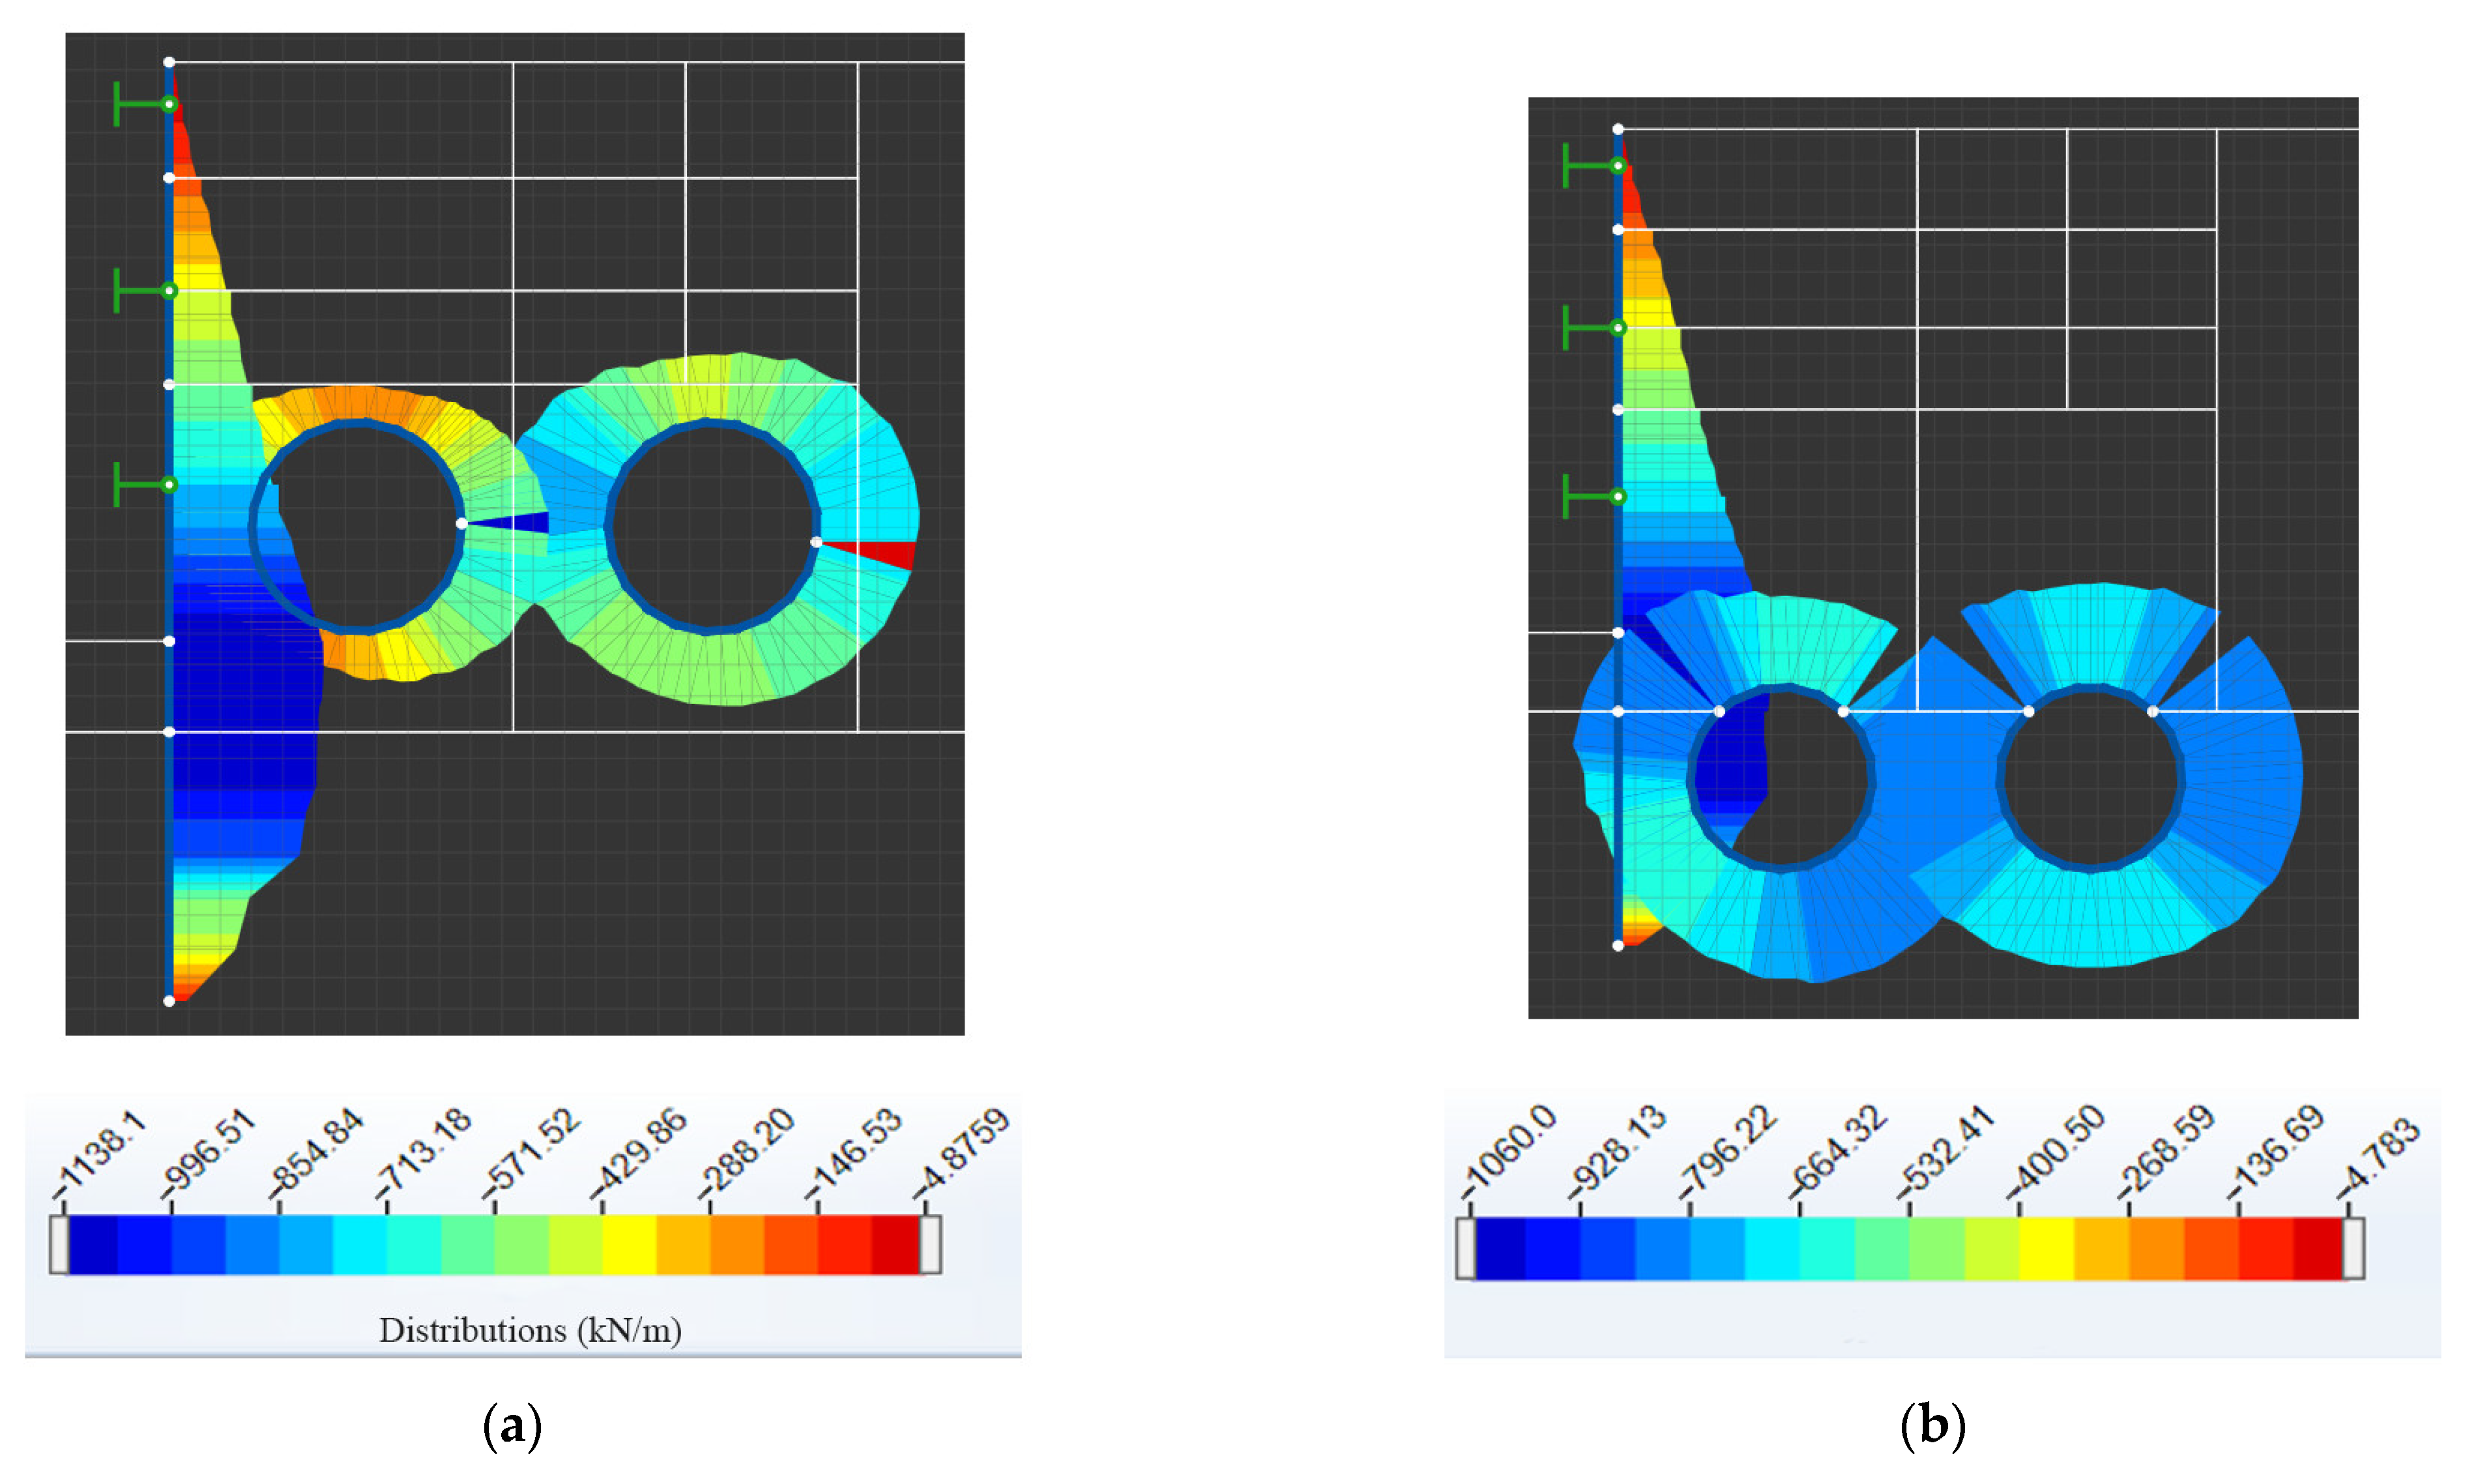
In Figure 11, the different colors of the axial force diagram represent the value of the axial force. The absolute value of the axial force is larger when the color of the shear dissipation contours is more approximate to blue. As can be seen from Figure 11, axial force of the enclosure structure in each stage increases with the increase in excavation depth. The axial force of enclosure structure in stage 1 and stage 2 is mainly affected by twin shield tunnels. From the beginning of stage 3, the axial force is greatly influenced by the excavation itself, and the position of the extreme value of axial force gradually progresses downward. The maximum axial force occurs in stage 4.

3.1.2. Influence of Relative Position between Twin Tunnels and Foundation Pit

Different relative positions between twin tunnels and foundation pit were adopted to study their influence on the global stability. A total of 24 groups of relative positions were considered in this paper. Six horizontal distances L (6 m, 0.33 H; 9 m, 0.50 H; 12 m, 0.67 H; 18 m, 1.0 H; 24 m, 1.33 H; 36 m, 2.0 H) and four cover depths C (9 m, 0.5 H; 18 m, 1.0 H; 27 m, 1.5 H; 36 m, 2.0 H) are selected for relative positions between twin tunnels and foundation pit; 24 groups of relative positions are provided in Table 4.

Influence of Horizontal Distance L on Global Stability

Influence of the horizontal distance L between twin tunnels and foundation pit on global stability is analyzed in this section. In the following paragraphs, the influence of horizontal distance L on safety factor of global stability and global failure mechanism under four stages of the foundation pit construction are investigated, respectively.
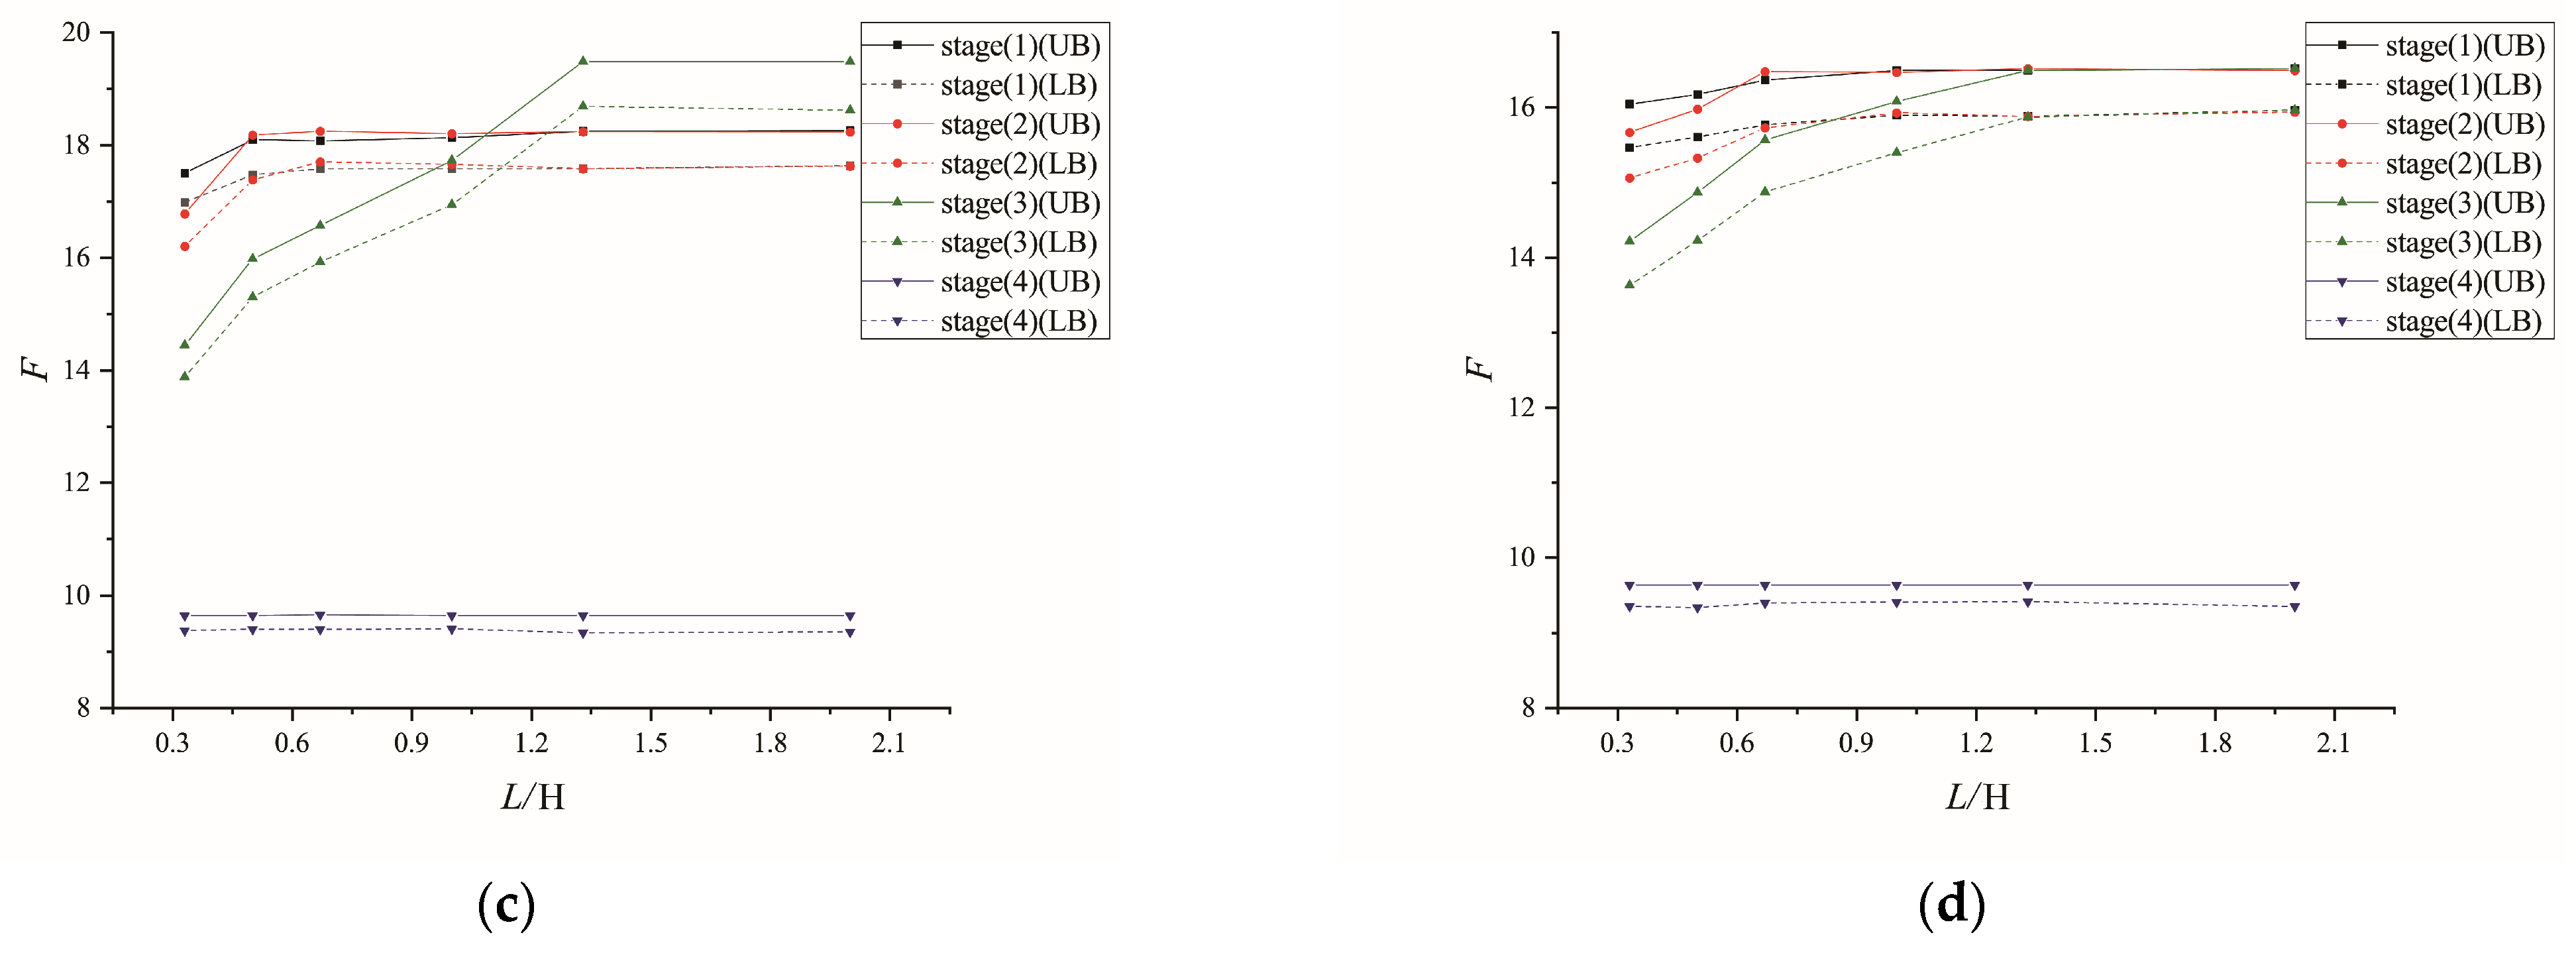
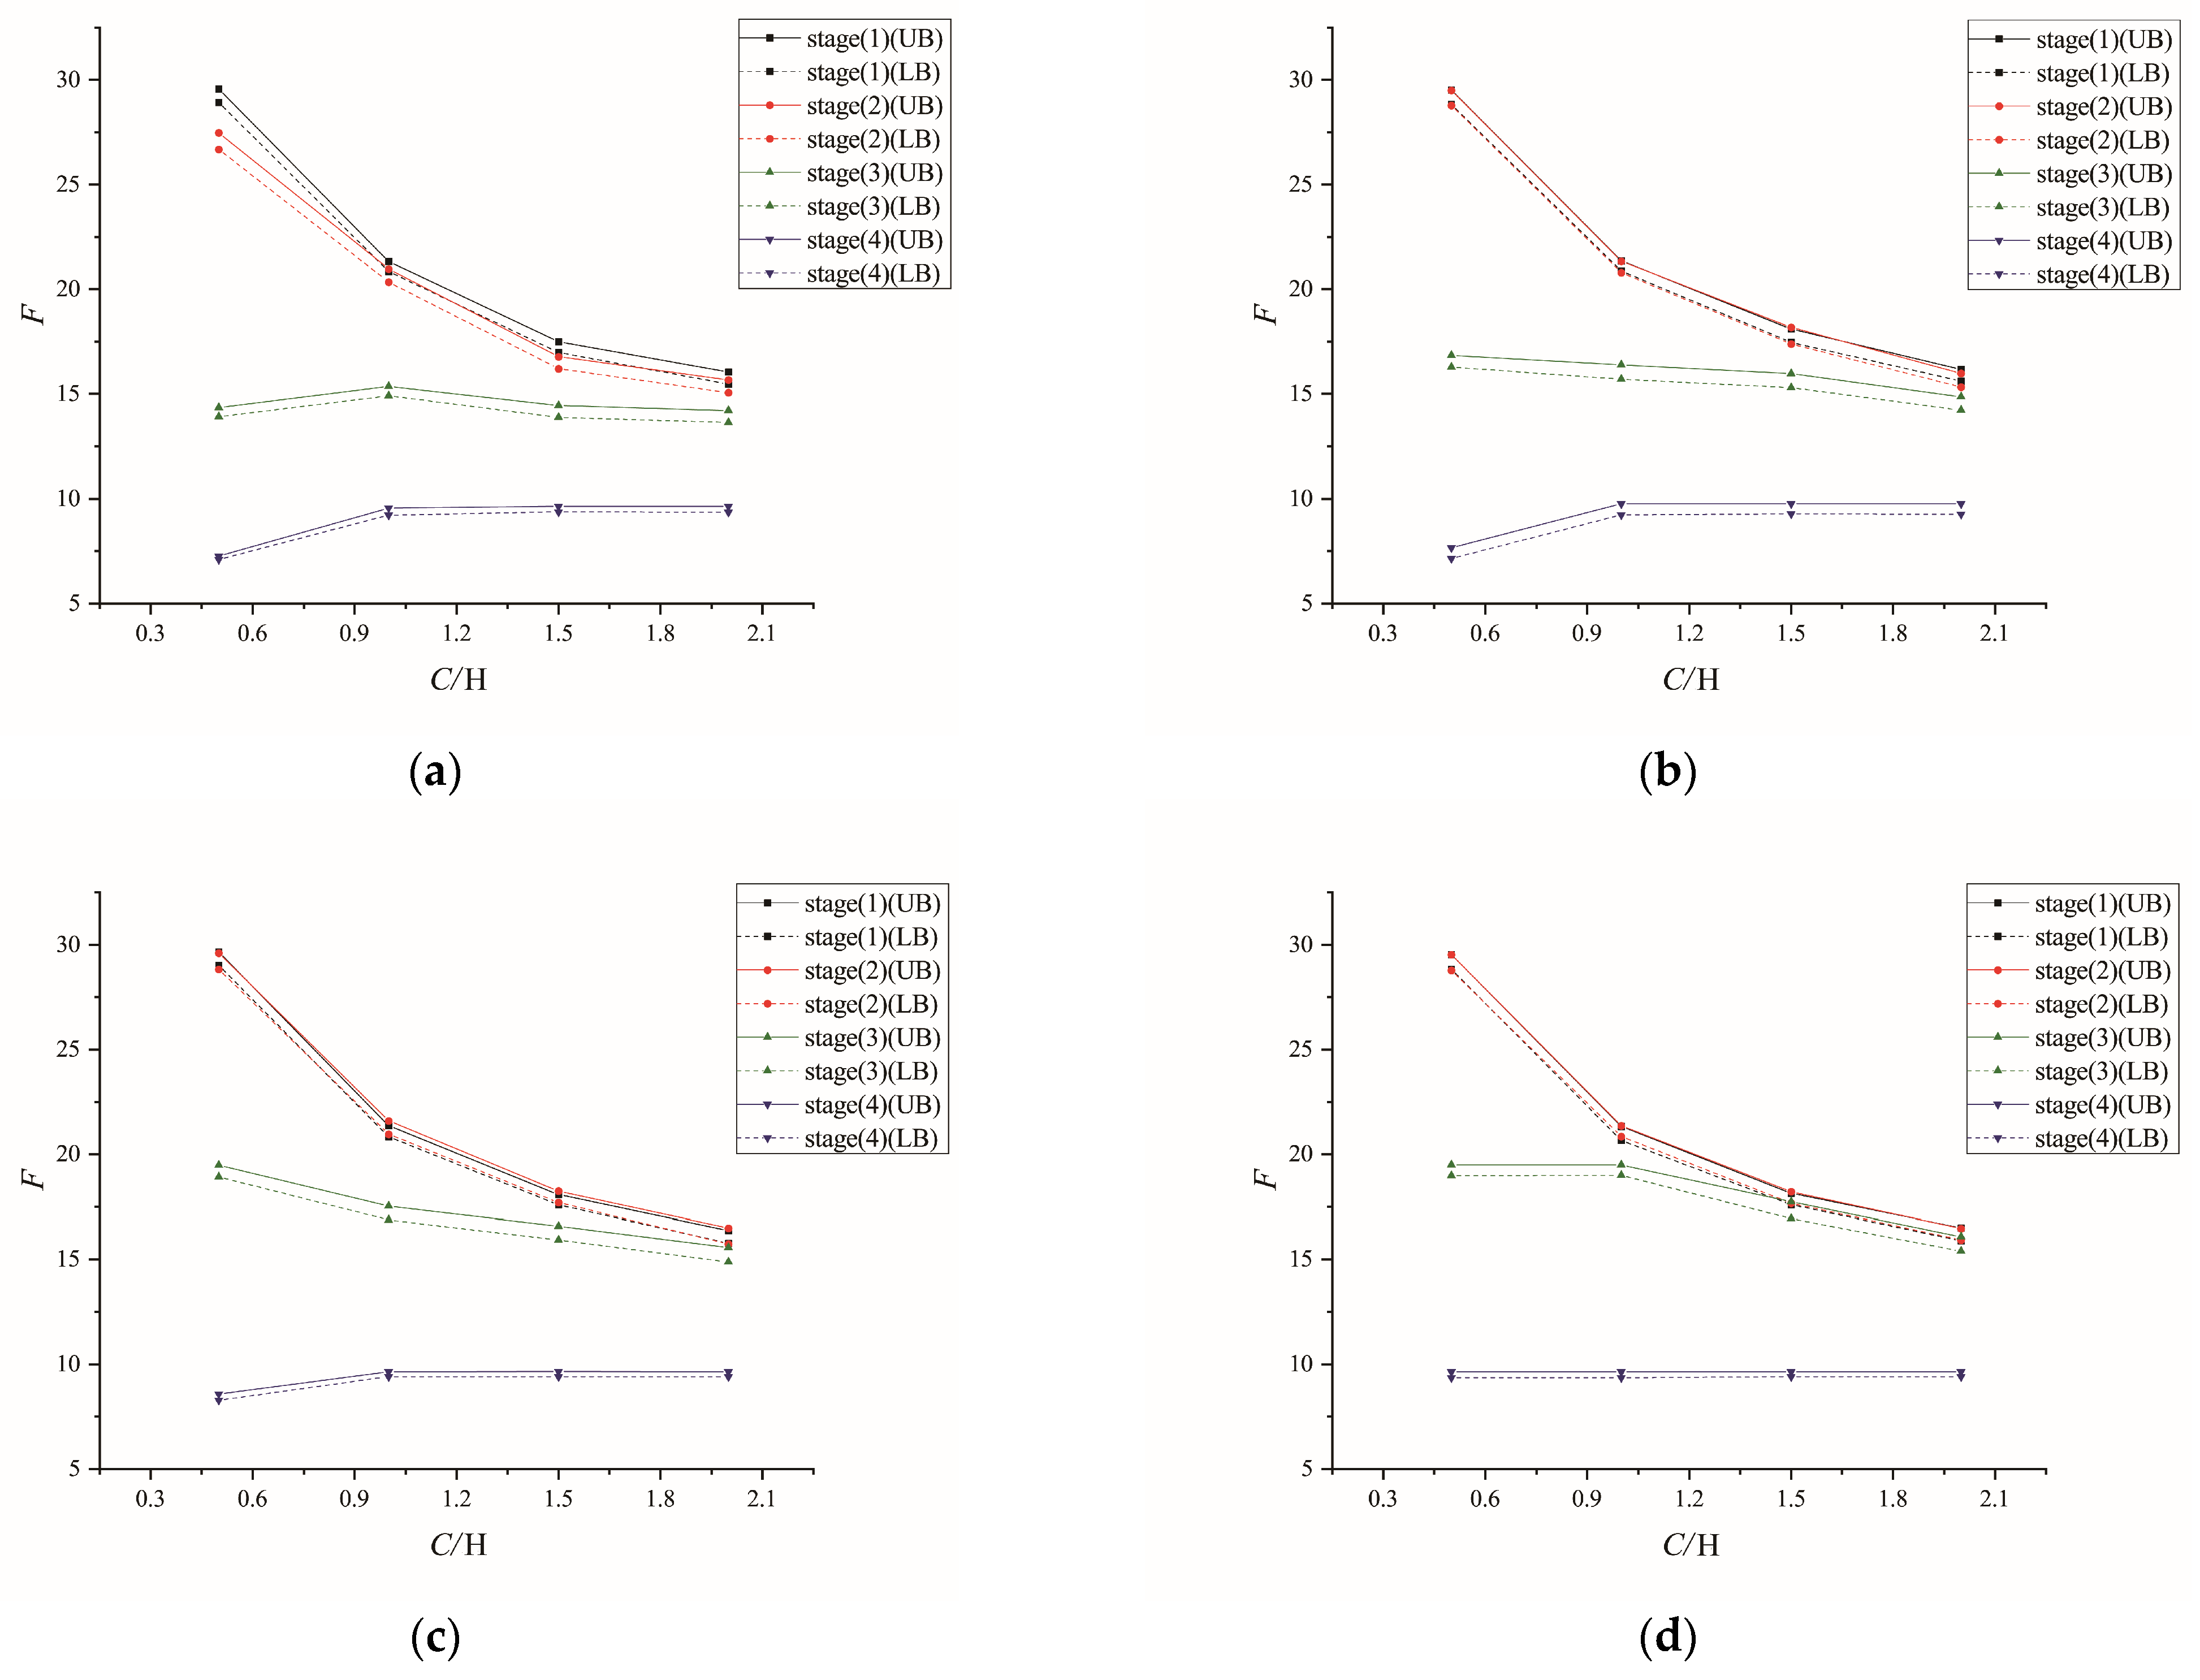
Curves of safety factor of global stability versus the horizontal distance L between twin tunnels and foundation pit under different cover depth C of the twin shield tunnels are presented in Figure 12. As shown in Figure 12, safety factors of global stability under four stages all increase with L when horizontal distance L is less than 1.33 H. When horizontal distance L increases to 1.33 H, safety factors of global stability under four stages all begin to stabilize. As horizontal distance L increases to 0.5 H, curves of safety factor of stage (1) and stage (2) under different cover depth C of the twin shield tunnels are all basically stable, and safety factors of stage (1) and stage (2) are basically the same when the curves of the safety factor remain stable. Although there is a difference in the curves of the safety factor between different cover depth C of the twin shield tunnels, the curves of the safety factor under stage (3) and stage (4) are all basically stable when the horizontal distance L increases to 1.0 H.
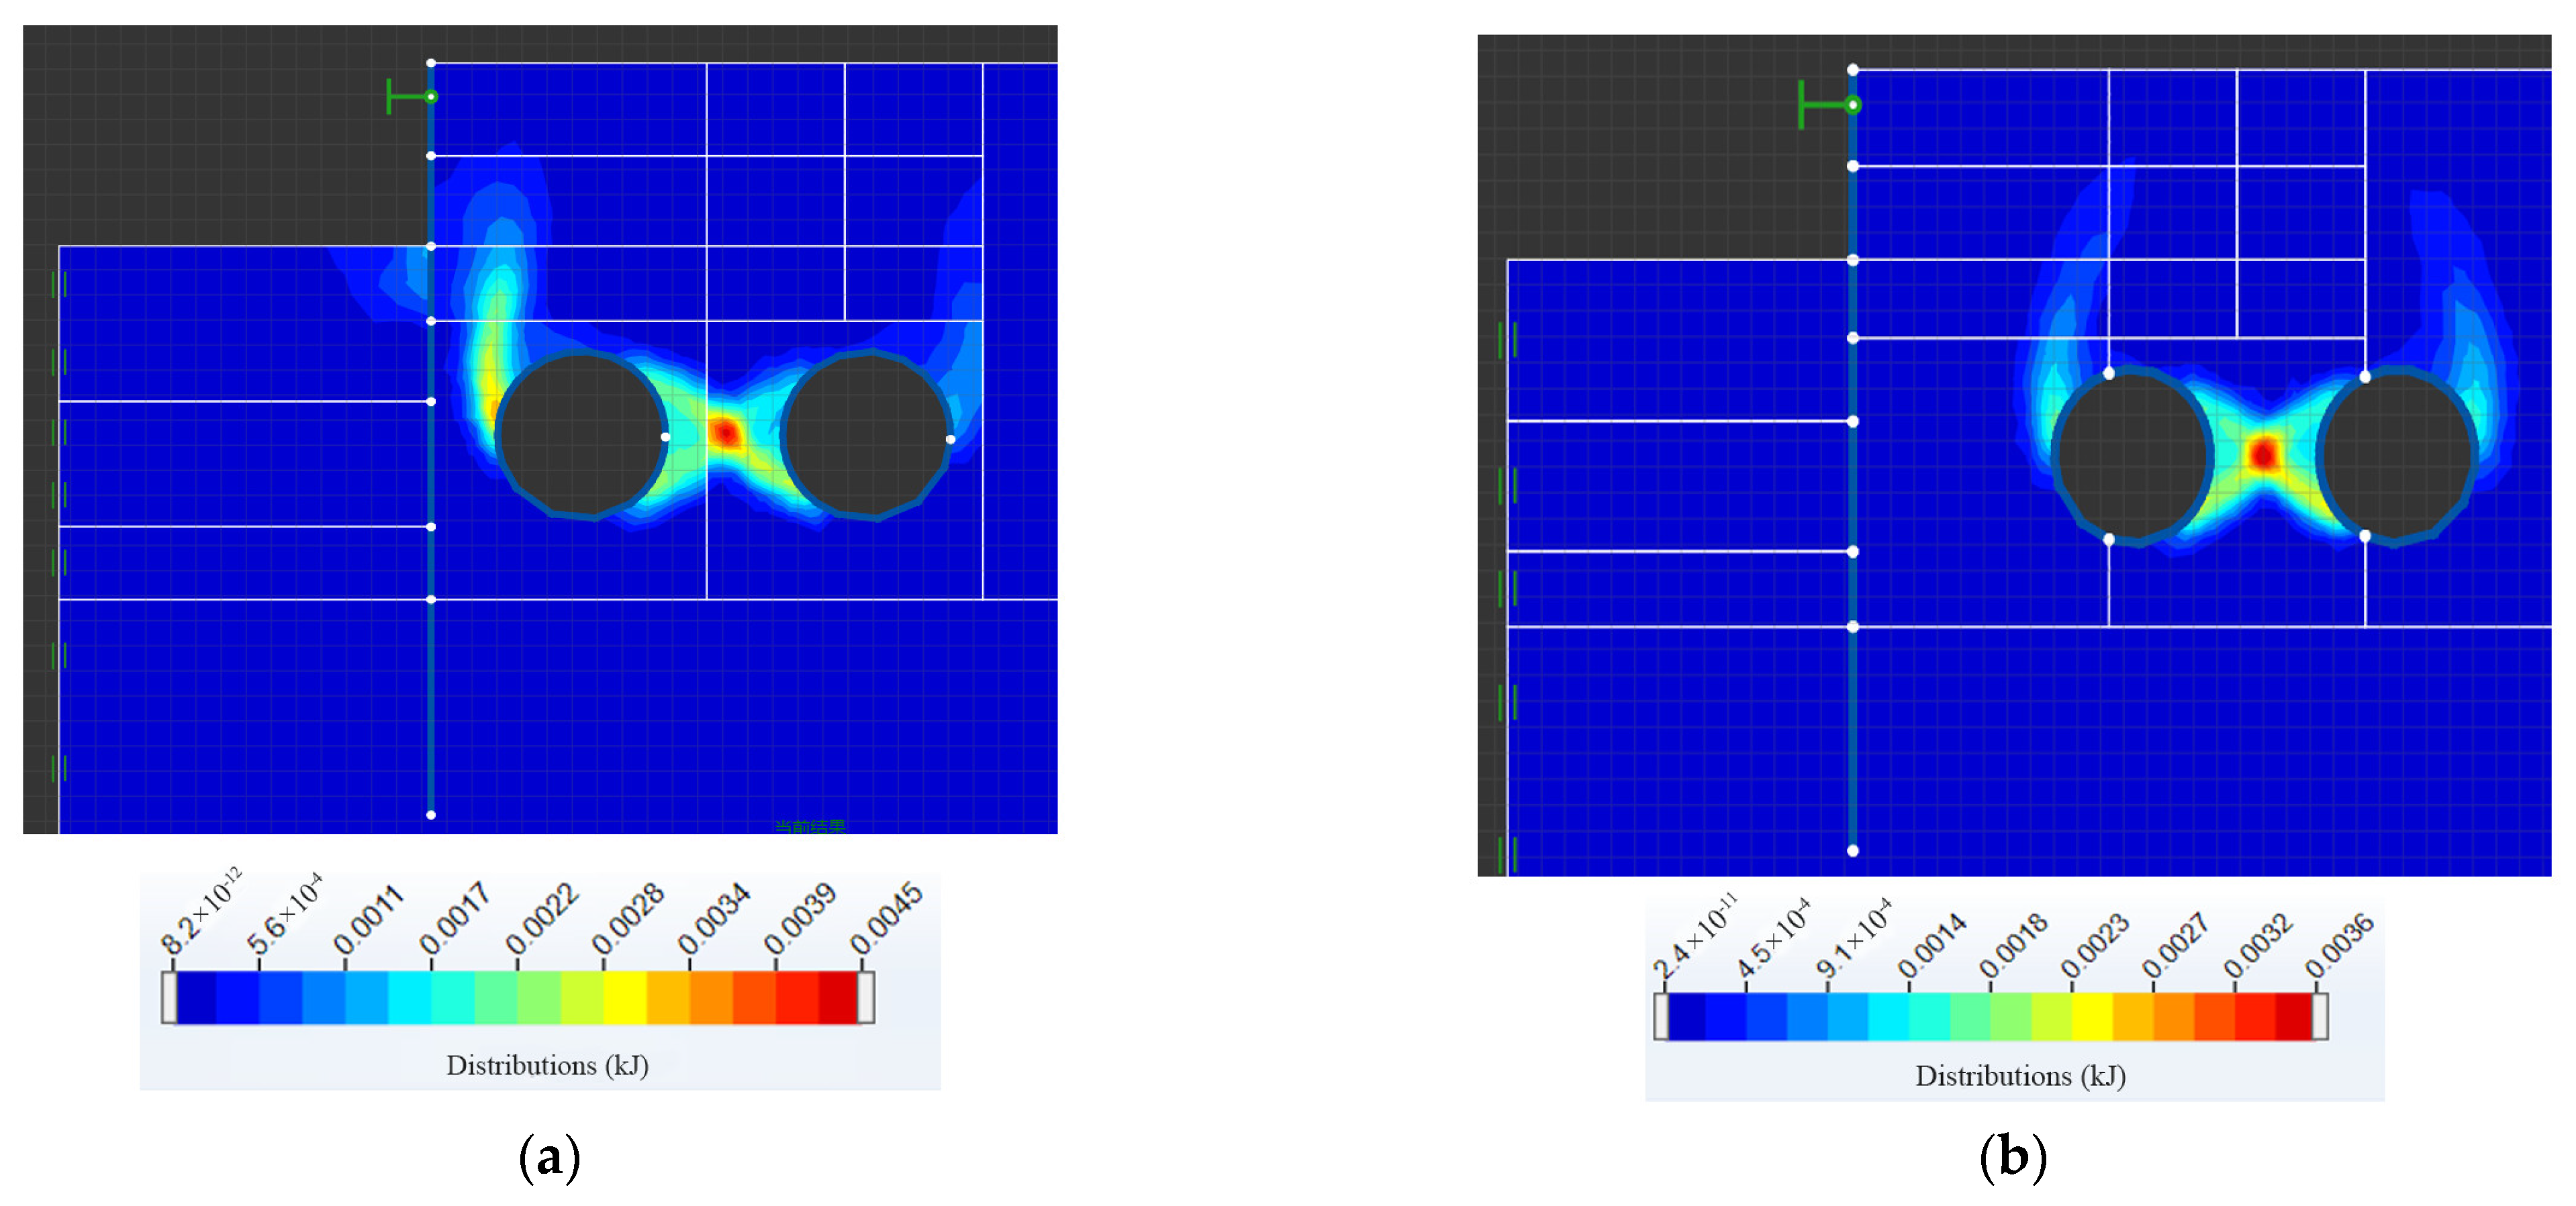
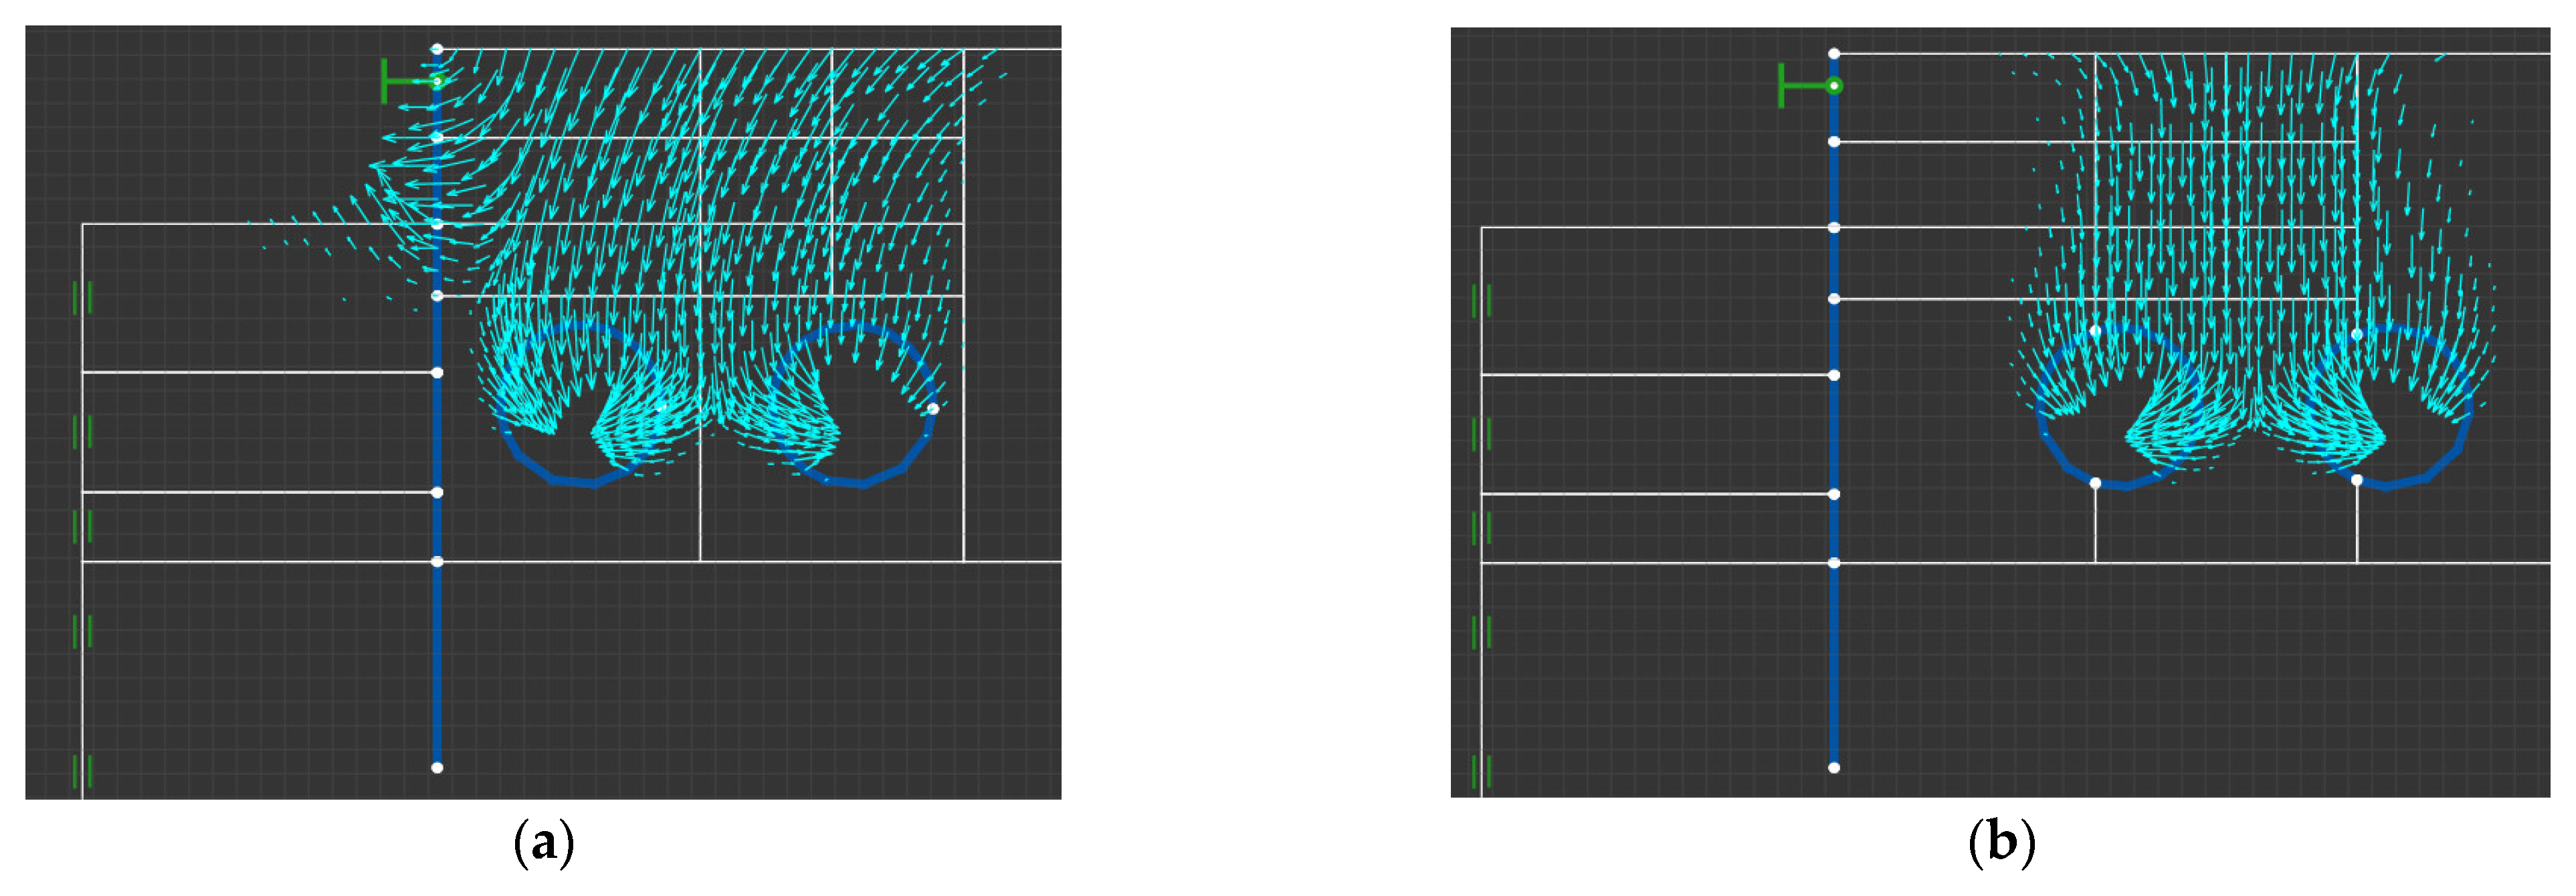
According to the analysis in Section 3.1.1 above, the failure mechanisms under stage (1) and stage (2) are relatively similar. The twin shield tunnels collapse first under stage (1) and stage (2). As horizontal distance L increases, foundation pit will be outside failure zone of twin shield tunnels. In the following figures, the blue structures show the underground diaphragm wall and shield tunnels, respectively. The different colors of the shear dissipation contours represent the value of the shear dissipation energy. The shear dissipation energy is larger when the color of the shear dissipation contours is more approximate to red. Besides, the green arrows represent the incremental displacement vectors of soils. Taking stage (2) as an example, the shear dissipation contours in Figure 13 and the incremental displacement vector in Figure 14 show that the stability of the twin shield tunnels will no longer be affected by the foundation pit as L increases to 0.5 H. In this case, global stability problem has been completely transformed into the stability problem of the twin shield tunnels. Different from stage (1) and stage (2), according to the analysis in Section 3.1.1 above, the foundation pit collapses first under stage (3) and stage (4). Taking stage (4) as an example, the shear dissipation contours in Figure 15 and the incremental displacement vector in Figure 16 show that the twin shield tunnels have been completely outside the failure zone of the foundation pit when the horizontal distance L increases to 1.0 H, and the global stability problem has been completely transformed into the stability problem of the foundation pit.
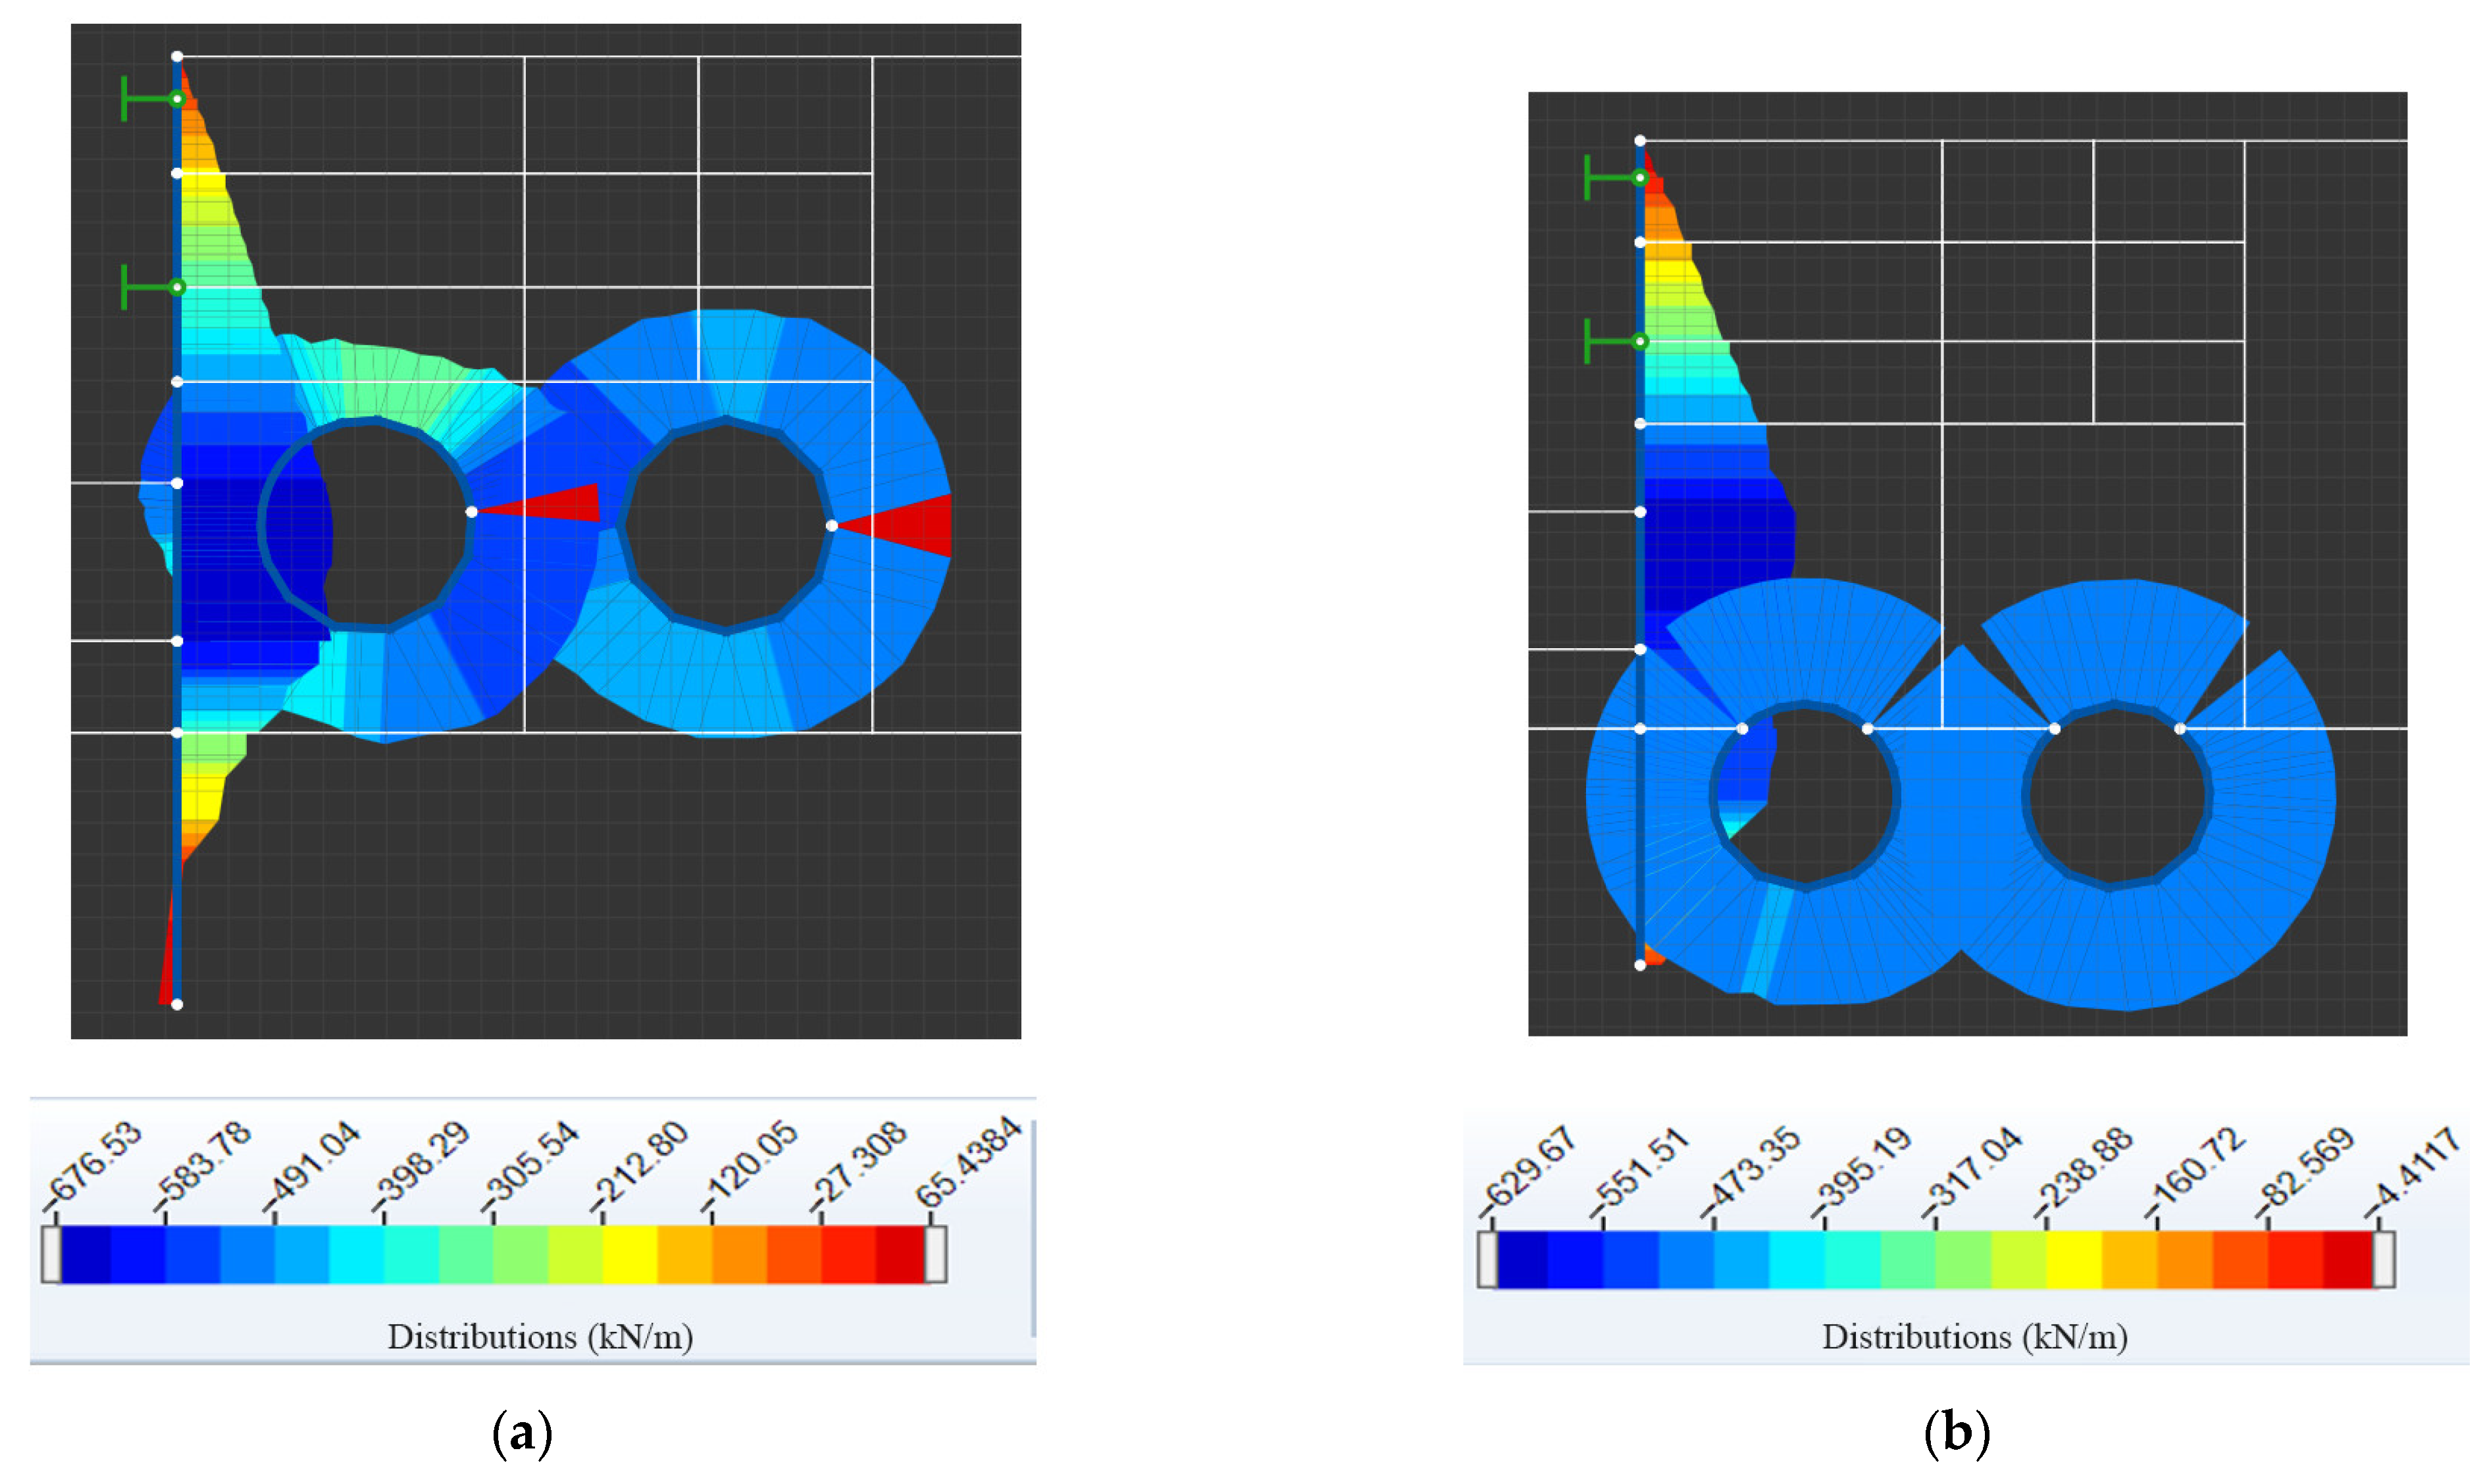
In Figure 17 and Figure 18, the different colors of the axial force diagram represent the value of the axial force. The absolute value of the axial force is larger when the color of the shear dissipation contours is more approximate to blue. According to Figure 17, at stage 2, L = 0.33 H, the failure mode is mainly the joint failure of the enclosure structure and shield tunnel segments. The maximum value of axial force in each working condition appeared near the enclosure structure. As can be seen from Figure 18, in stage 4, the extreme value of axial force of the enclosure structure appeared at the elevation of the bottom plate, and the extreme value of stress gradually decreased with the increase in the distance between them. The extreme axial force of the enclosure structure in stage 4 is 2.6–3.9 times higher than in stage 2.
Therefore, taking into account changing trends of safety factor under the four stages, it is safer to select 1.0 H as the horizontal distance L in the actual project. In this case, the interaction between twin tunnels and foundation pit can be better avoided, which also ensures the full use of underground space.

Influence of Cover Depth C of Twin Shield Tunnels on the Global Stability

Influence of cover depth C of twin shield tunnels on the global stability is analyzed in this section. In the following paragraphs, the influence of cover depth C on safety factor of global stability and global failure mechanism under four stages of the foundation pit construction are investigated, respectively.
Curves of safety factor of global stability versus the cover depth C of the twin shield tunnels under different horizontal distance L are presented graphically in Figure 19. It can be clearly seen from Figure 19 that safety factor of global stability under stage (1) and stage (2) significantly decrease versus increase in cover depth. Due to the shallow excavation depth, the twin shield tunnels collapse first under stage (1) and stage (2). The cover depth C has a great influence on tunnel stability. It can be clearly seen from Figure 19 that the safety factor of global stability under stage (3) is significantly lower than that of stage (2) when C is 0.5 H. However, as C increases, the safety factor of global stability under stage (2) and stage (3) gradually approaches. Different from the complex situation of stage (3), the foundation pit collapses first under stage (4). As shown in Figure 19, the safety factor of the global stability in the case of stage (4) increases with cover depth C when C is 0.5 H. When C increases to 1.0 H, the curves of the safety factor of the global stability under different horizontal distance L have entered a stable state. Then, it will no longer be affected by changes in C.
As cover depth C increases, the global failure mechanism under stage (3) changes accordingly. In the following figures, the blue structures show the underground diaphragm wall and shield tunnels, respectively. The different colors of the shear dissipation contours represent the value of the shear dissipation energy. The shear dissipation energy is larger when the color of the shear dissipation contours is more approximate to red. Besides, the green arrows represent the incremental displacement vectors of soils. As shown by Figure 20 and Figure 21, the foundation pit collapses first when C is 0.5 H, and, when the cover depth C increases to 1.0 H, the twin shield tunnels collapse first, and the change in failure mechanism corresponds well to the curves of safety factor under stage (3) mentioned above. It can be seen from Figure 22 and Figure 23 that the twin shield tunnels are in the failure zone of the foundation pit under stage (4) when the cover depth C is 0.5 H, and, when the cover depth C increases to 1.0 H, the twin shield tunnels will be outside the failure zone of the foundation pit under any horizontal distance L.
In Figure 24 and Figure 25, the different colors of the axial force diagram represent the value of the axial force. The absolute value of the axial force is larger when the color of the shear dissipation contours is more approximate to blue. According to Figure 24, at stage 3, C = 0.5 H in the limit state; the failure form is mainly the joint failure of the enclosure structure and shield tunnel segments. With the increase in the buried depth of shield tunnel, the axial force of the enclosure structure also decreases. According to Figure 25, at stage 4, no matter how deep the tunnel is buried, the axial force and shearing force extremum of the enclosure structure all appear at the elevation of the bottom plate. In addition, the shallower the tunnel buried depth, the greater the axial force extremum of the structure.
Therefore, considering the changing trends in curves of the safety factor under the four stages, it is safer to select 1.0 H as the cover depth C of the twin shield tunnels in the actual project. When the cover depth C is 1.0 H, the interaction between twin tunnels and foundation pit can be better avoided, which also ensures that the twin shield tunnels do not have to bear excessive soil pressure.

3.2. Stability Analysis of the Foundation Pit

In this section, the part of the foundation pit in the adjacent construction is studied. The stability of foundation pit is analyzed through the strength reduction method because the foundation pit instability accidents are mostly caused by the low shear strength of the soil at the bottom of the foundation pit. In the calculation, the strength of the solid elements is reduced. The bounding estimates of safety factor of foundation pit stability are calculated through the use of upper limit analysis and lower limit analysis. In the calculation method of reducing the strength of solid elements, the basal stability of foundation pit is not affected by the position of twin tunnels. Therefore, a random position (C = 9 m, L = 6 m) among the above 24 groups of relative positions is chosen to perform basal stability analysis on foundation pit.

3.2.1. Safety Factor of Foundation Pit

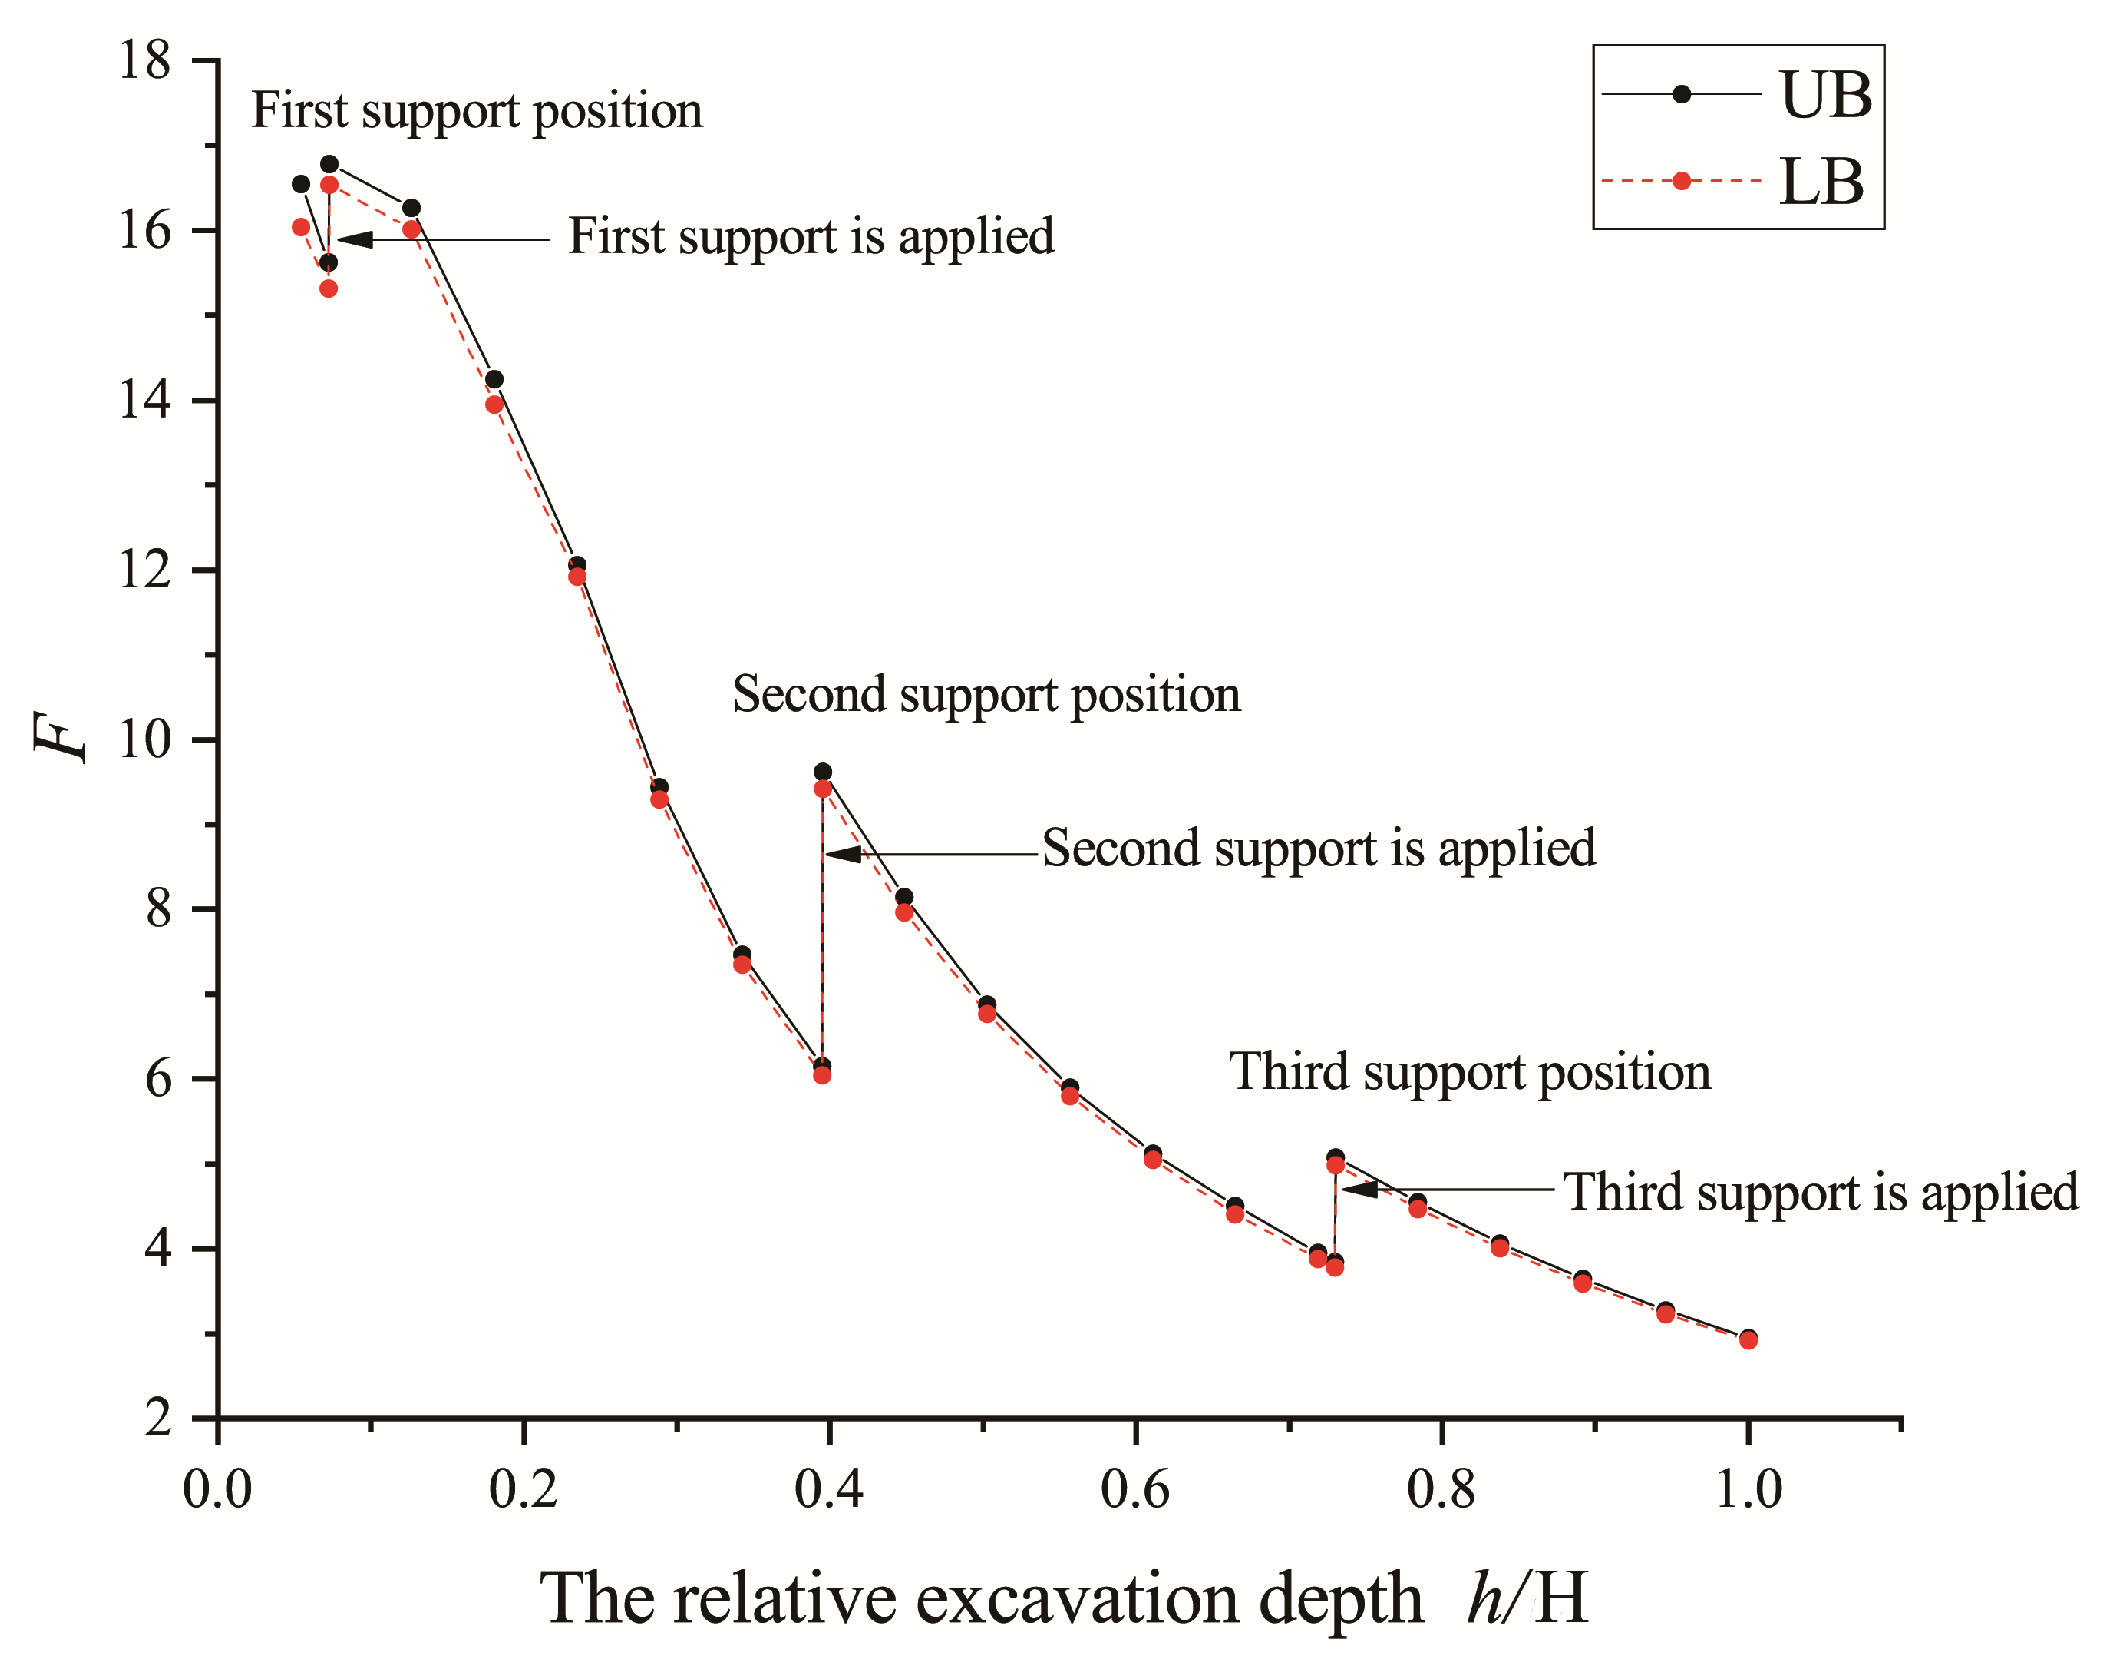
In this section, the variation in foundation pit stability during foundation pit construction is analyzed. Safety factors of foundation pit at different relative excavation depths h/H are obtained through strength reduction method. As shown in Figure 26, safety factor decreases with the increase in relative excavation depth h/H. When the excavation reaches the position of three supports, foundation pit stability has been temporarily improved by supports application. Therefore, it can be seen in Figure 26 that there will be an improvement in safety factor after supports are applied. However, after each improvement, safety factor will continue to decrease with increase in relative excavation depth h/H.

3.2.2. Axial Force of the Supports of the Foundation Pit

In this section, the variation in the axial force of the supports of the foundation pit during the foundation pit construction are analyzed. Bounding estimates of axial force of supports under different relative excavation depths are obtained through strength reduction method.
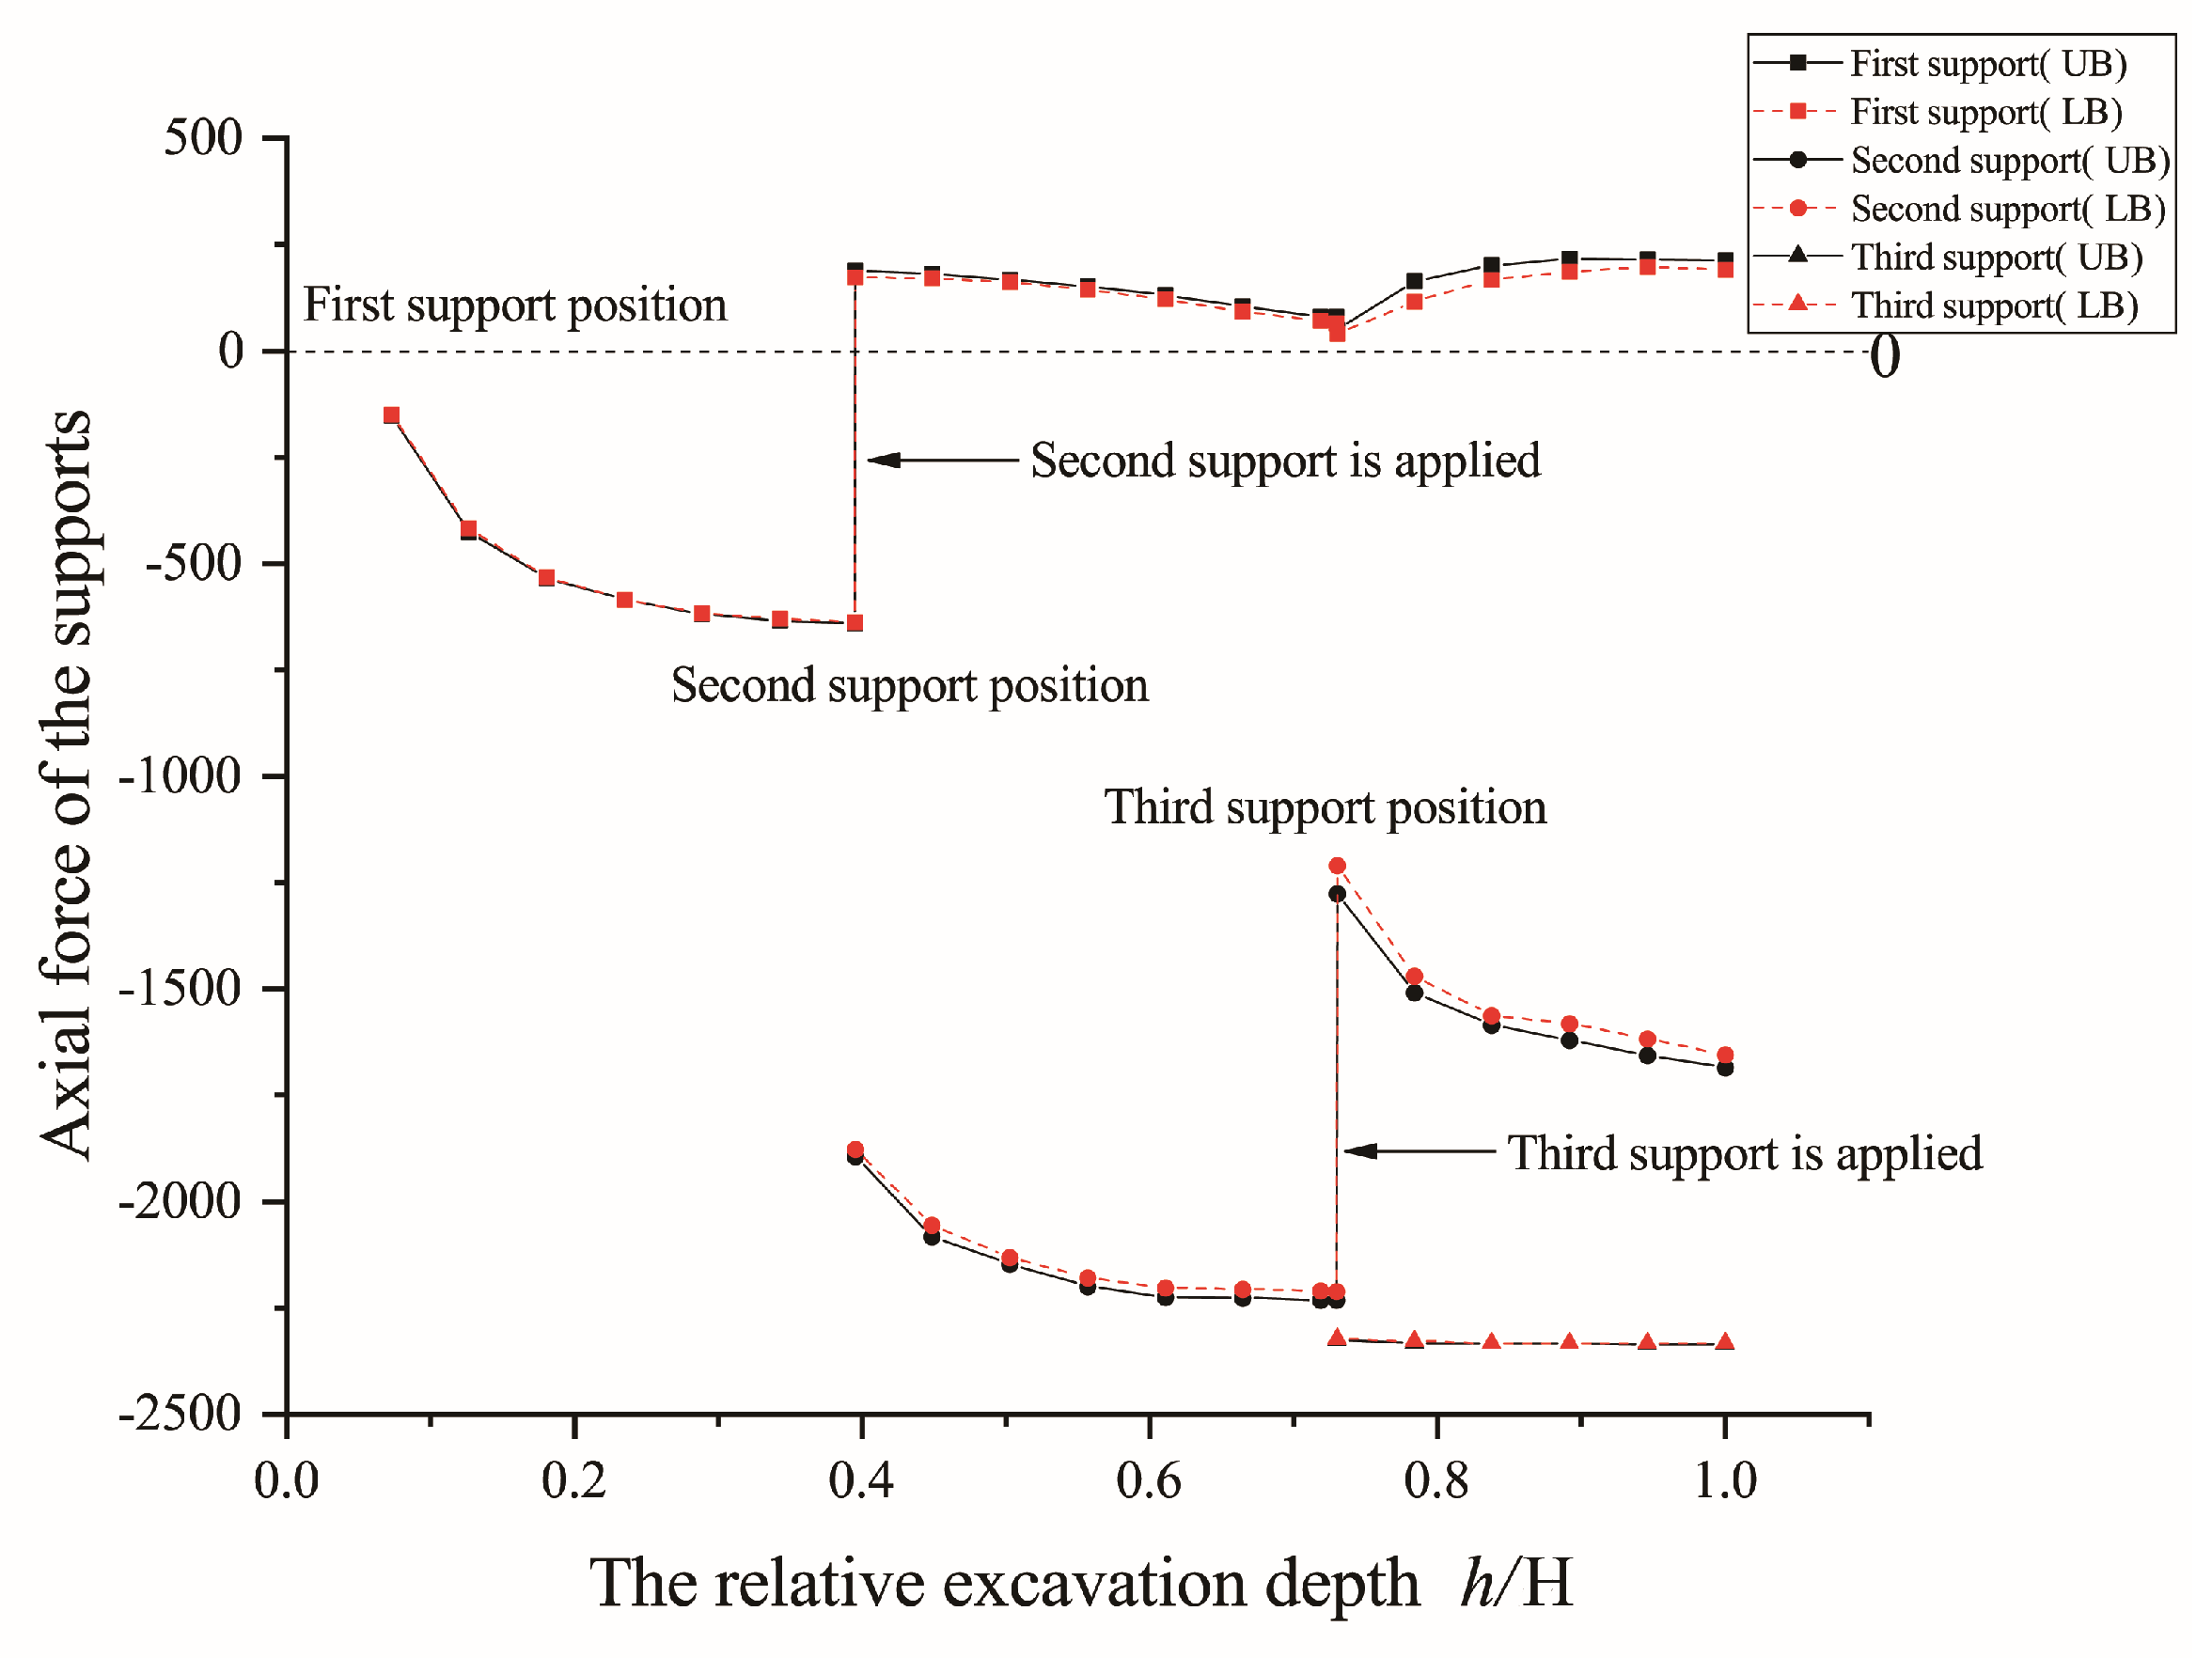
Figure 27 shows the curves of the axial force of three supports versus the relative excavation depth h/H. In the figure, the signs of the axial force of the supports are set as positive when the support is under tension in the axial direction and negative when the support is under compression in the axial direction. The pressure on the structure increases with the relative excavation depth h/H after the application of the first support. When the excavation reaches the position of the second support, the axial force of the first support increases abruptly with the application of the second support, and the structure changes from compression to tension. The tension force on the structure will slightly decrease versus increase in h/H. The newly applied second support will bear higher compression, and the pressure on the second support will continue to increase with the relative excavation depth h/H. When the excavation reaches the position of the third support, the axial forces of the other two supports have changed abruptly with the application of the third support. It can be seen in Figure 27 that the tension on the first support and the compression on the second support have been all reduced to varying degrees. The newly applied third support will bear higher pressure and the tension or compression on the three supports will all continue to increase with the relative excavation depth h/H.

4. Adjacent Influential Partition

4.1. Adjacent Influential Partition Based on Safety Factor

In order to effectively complete the adjacent influential partition for adjacent construction of twin tunnels and foundation pit, this paper refers to the analysis of global stability of twin tunnels and foundation pit in Section 3.1 and considers the numerical simulation results. Based on the expert scoring method, the criteria of adjacent influential partition based on safety factor are obtained, divided into four zones: Ⅰ (Very Safe), Ⅱ (Safe), Ⅲ (Dangerous) and Ⅳ (Very Dangerous). The specific criteria of adjacent influential partition are shown in Table 5:
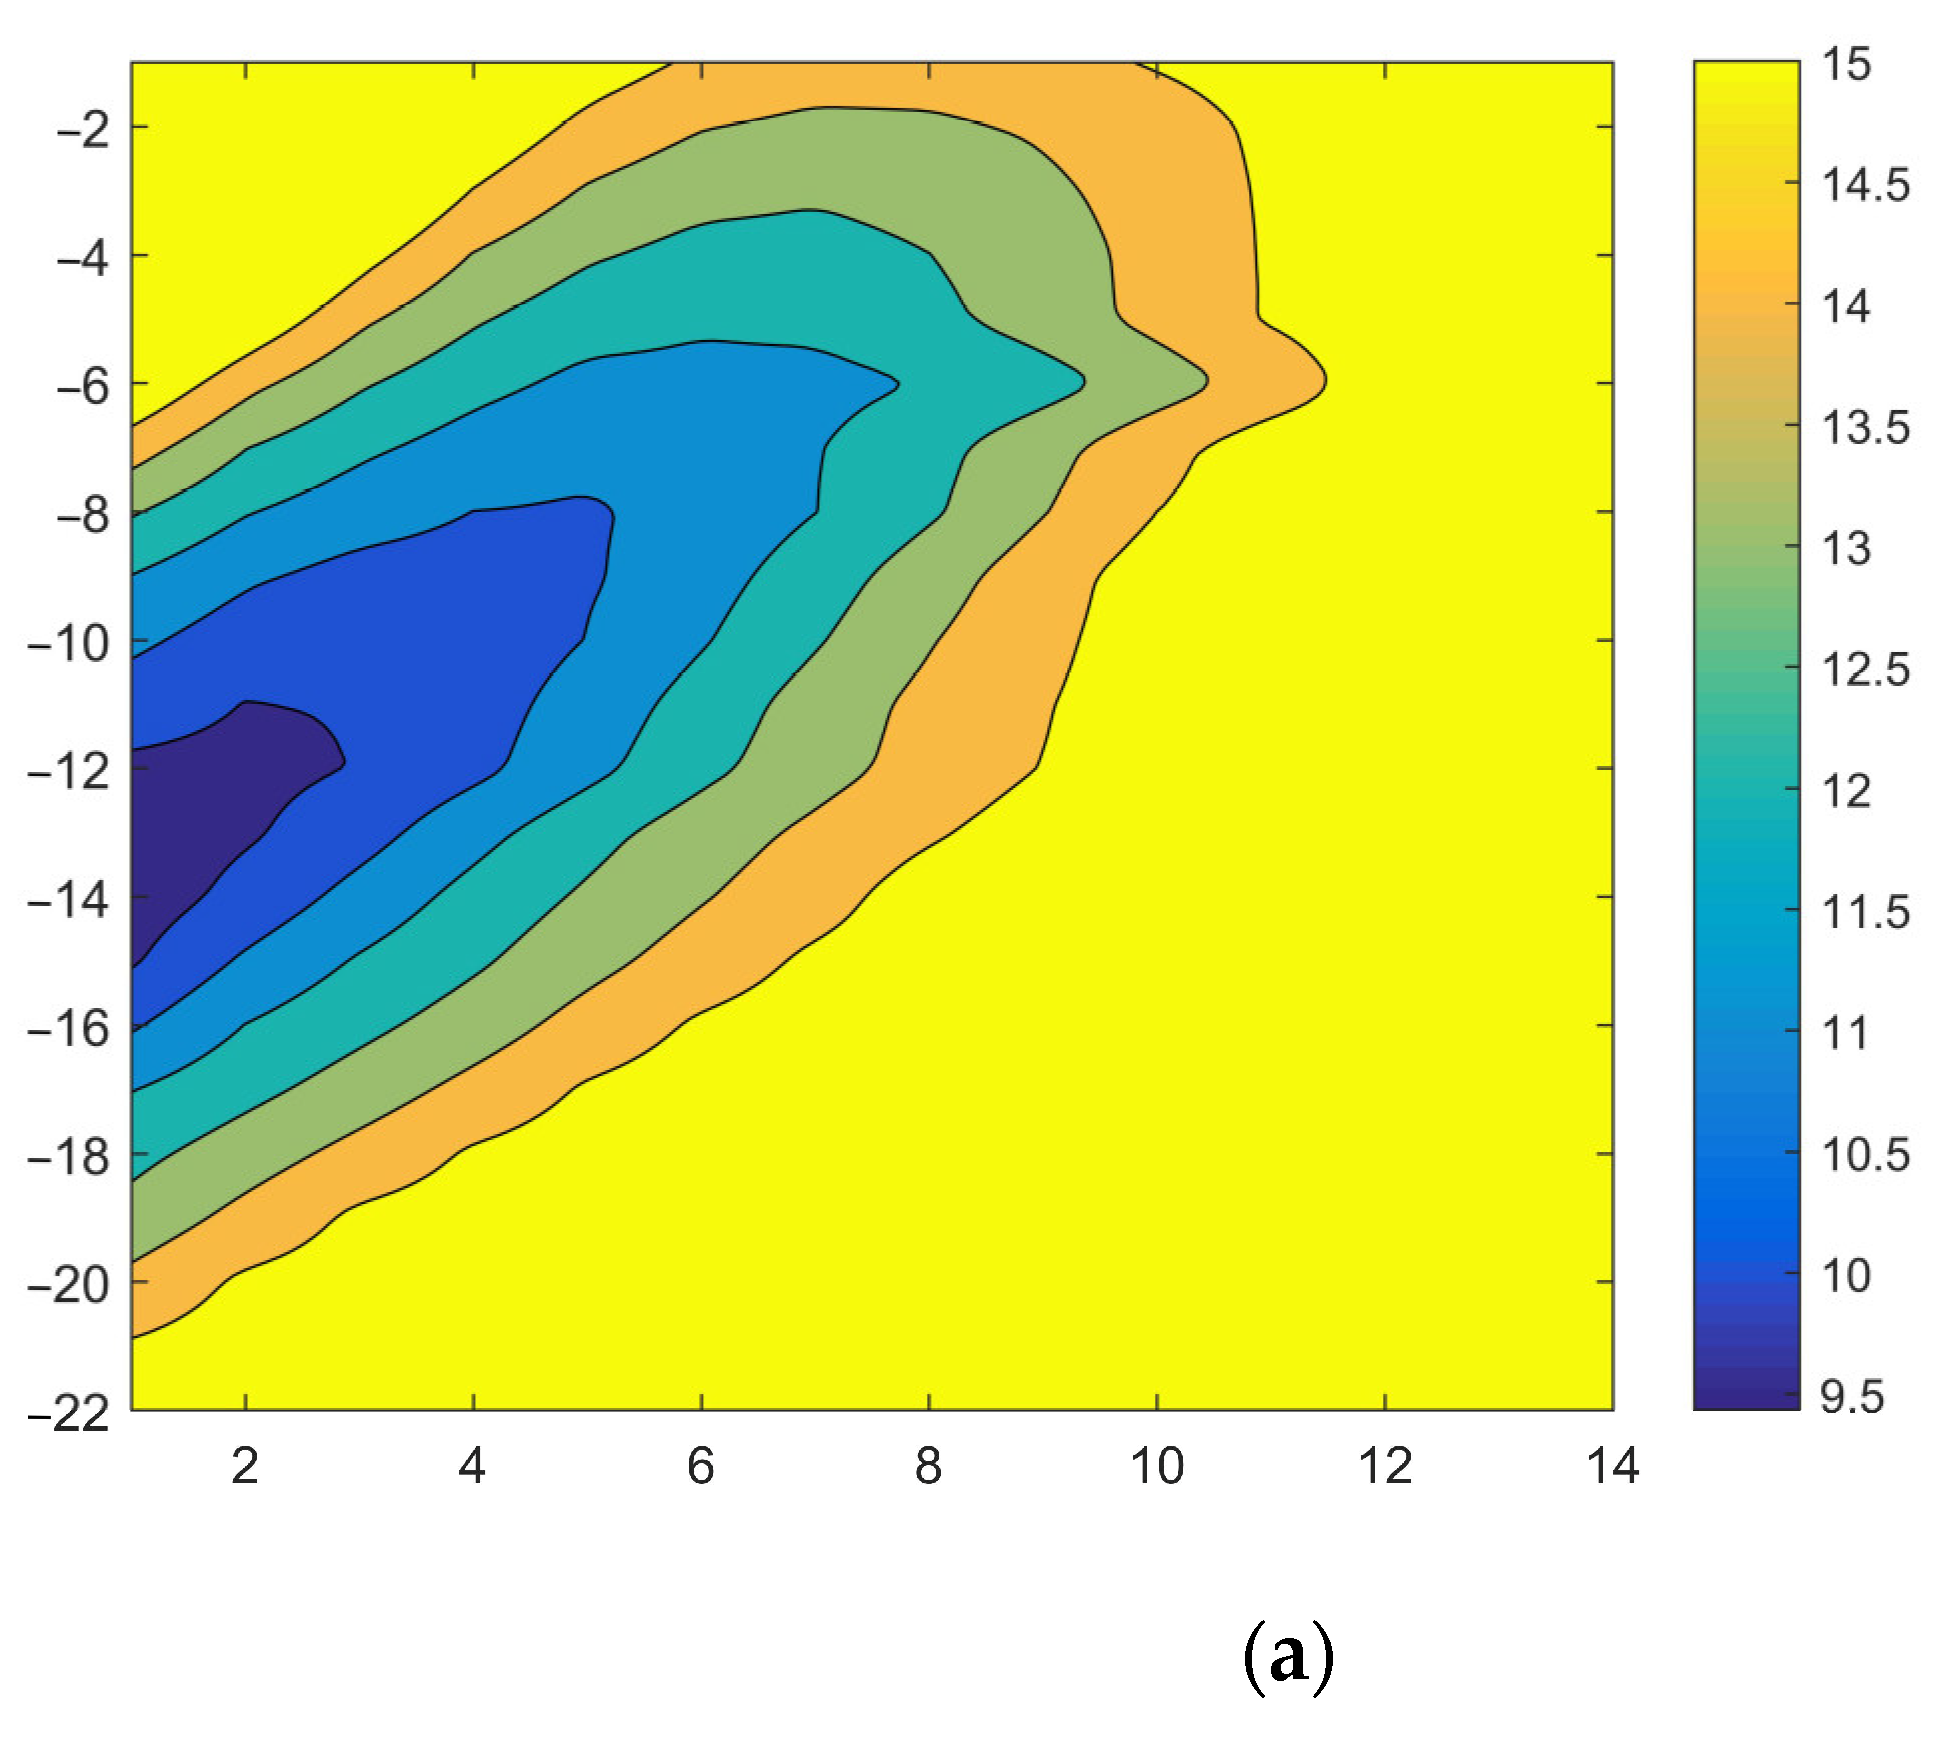
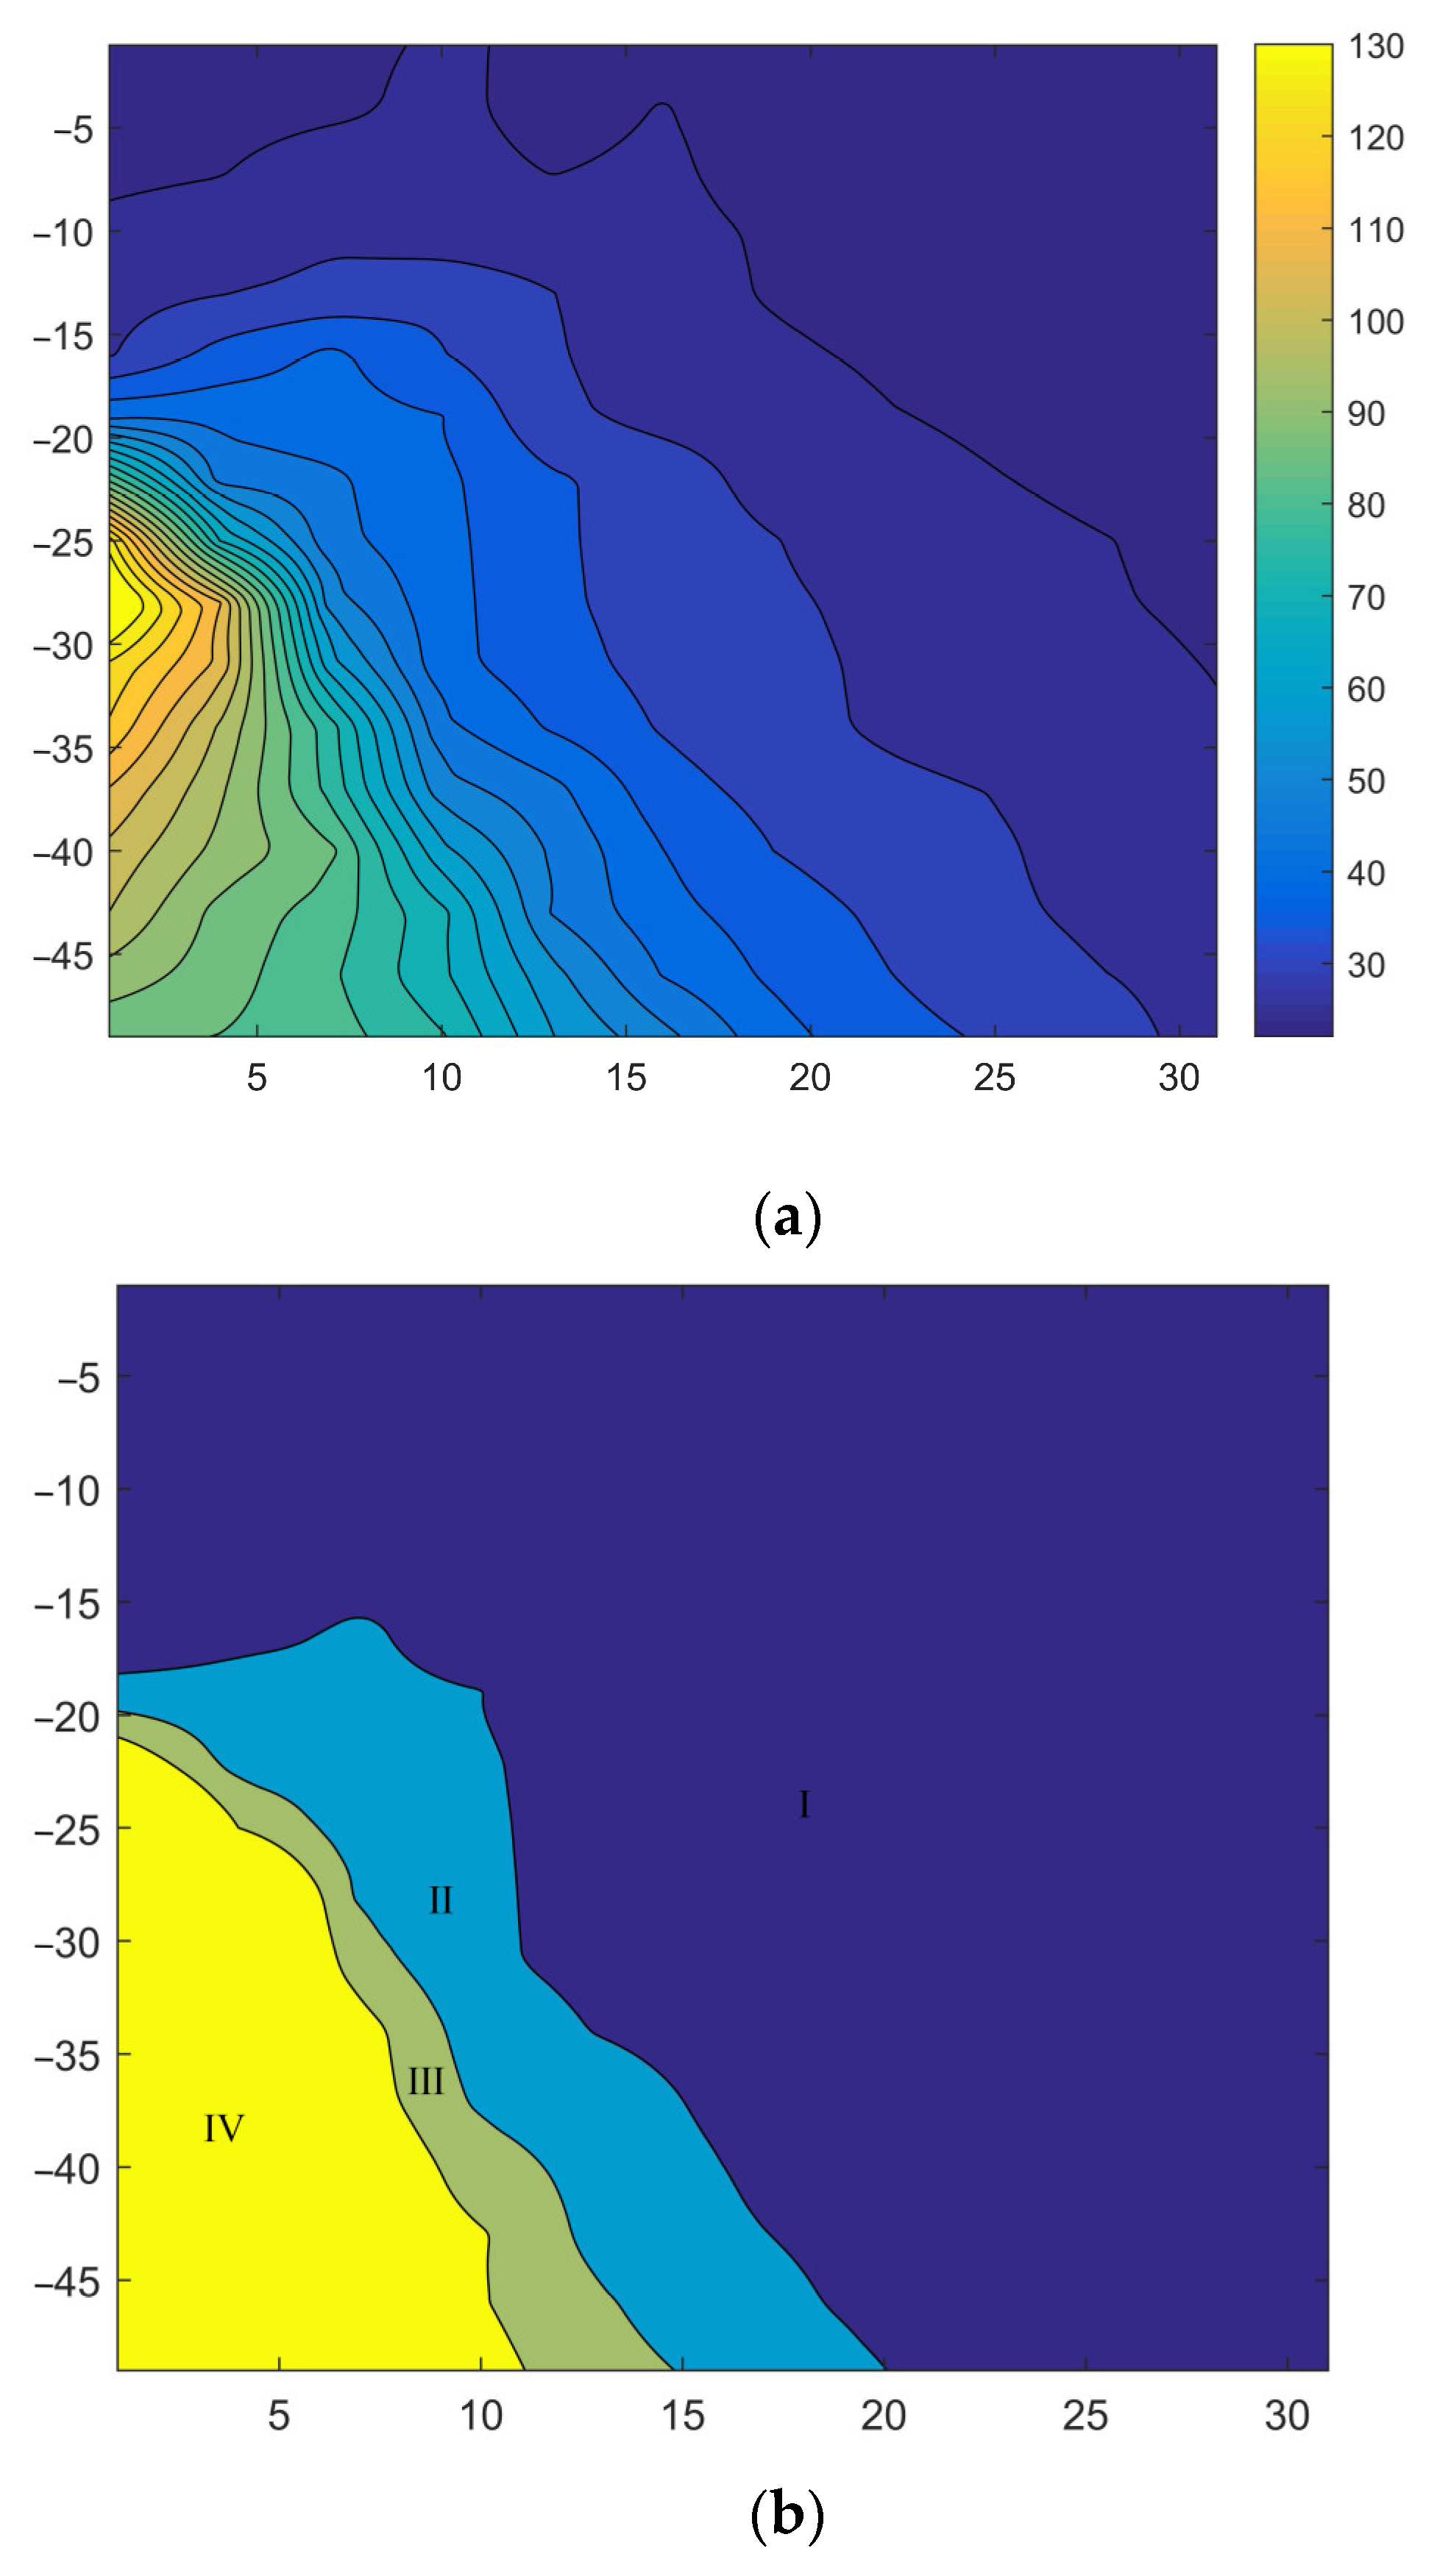
The most dangerous condition, stage (4), is chosen in this section, and the safety factor of global stability of twin tunnels and foundation pit is analyzed through the strength reduction method. In the calculation, the strength of the structural elements of twin tunnels and foundation pit is reduced. The bounding estimates of safety factor of global stability are calculated through the use of upper and lower methods of limit analysis. Since the differences between the computed UB and LB results are small, within 5% of their average, their average values are taken as the approximate solution of the problem. By extracting and analyzing the safety factors of global stability of adjacent construction under different working conditions, the variation rule of the safety factor is obtained, as shown in Figure 28a. In Figure 28a, X axis (horizontal axis) represents the horizontal distance between the left shield tunnel and the concrete supporting of foundation pit, and Y axis (vertical axis) represents the buried depth of the twin tunnels. The variation rule of safety factor under different relative positions between the twin tunnels and foundation pit is described by XY coordinates.
As can be seen from Figure 28a, when the buried depth of the twin tunnels is relatively low, that is, less than 12 m, with the increasing horizontal distance between the left shield tunnel and the concrete supporting of foundation pit, the variation in safety factor generally shows a trend of decreasing first and then increasing. When the buried depth of the twin tunnels is more than 12 m, it can be seen from Figure 28a that, with the increase in the buried depth of the twin tunnels, the safety factor decreases rapidly and the safety factor at the position of adjacent foundation pit is the lowest safety factor under the same buried depth of twin tunnels, and, with the increasing horizontal distance between the twin tunnels and foundation pit, the overall change in the safety factor shows an increasing trend. When the buried depth of twin tunnels continues to increase, the safety factor of adjacent construction will increase continuously until the buried depth reaches 22 m and the safety factor of adjacent construction reaches the maximum value. The variation trend is caused by the distribution of shear band. The closer the position of the twin tunnels is to the shear band of the foundation pit, the smaller the safety factor of the adjacent construction will be. According to the numerical calculation results in Figure 28a and based on the criteria of adjacent influential partition in Table 5, the boundary range between zones Ⅰ, Ⅱ, Ⅲ and Ⅳ of adjacent construction of twin tunnels and foundation pit can be obtained, as shown in Figure 28b.

4.2. Adjacent Influential Partition Based on Displacement Data

In engineering construction, since the displacement is intuitive and easy to monitor, the safety state of construction can be judged by analyzing the change in displacement data. Thus, in foundation pit and tunnel construction, displacement data are often used to monitor indicators, such as surface settlement, horizontal displacement of the concrete supporting, etc. When there are important buildings near the construction, or structures sensitive to displacement, such as bridges, houses, railways or roads, displacement data are used as one of the main monitoring indicators in the design and construction stage, and different risk levels are set according to different displacement limits.
At present, 30 mm is often used as the control limit of surface settlement in tunnel construction in standard and conventional design. In foundation pit construction, according to the excavation depth of foundation pit and the requirements of the surrounding environment protection, the range of 30 mm to 50 mm will be used as the control limit of the surface settlement and the horizontal displacement of the concrete supporting. However, this index was no more suitable for the adjacent construction nowadays. Especially when the adjacent construction is located on soft surrounding rock, the stratum deformation and surface settlement can be very large.
Therefore, in order to effectively complete the adjacent influential partition for adjacent construction of twin tunnels and foundation pit, this article refers to the technical code for monitoring measurement of subway engineering (DB11490–2007) combined with the results of numerical simulation. Through the expert scoring method, criteria of adjacent influential partition applicable to formation conditions in this article are obtained, divided into four zones: Ⅰ (Very Safe), Ⅱ (Safe), Ⅲ (Dangerous) and Ⅳ (Very Dangerous), and the specific criteria of adjacent influential partition are shown in Table 6 below:
By extracting and analyzing the maximum surface settlement under different working conditions, the variation rule of the maximum surface settlement is obtained, as shown in Figure 29a. In Figure 29a, X axis (horizontal axis) represents the horizontal distance between the left shield tunnel and the concrete supporting of foundation pit, and Y axis (vertical axis) represents the buried depth of the twin tunnels. The variation rule of the maximum surface settlement under different relative positions between the twin tunnels and foundation pit is described by XY coordinates.
It can be seen from Figure 29a that, when the buried depth of the twin tunnels is relatively low, that is, less than 20 m, with the increasing horizontal distance between the left shield tunnel and the concrete supporting of foundation pit, the variation in maximum surface settlement generally shows a trend of increasing first and then decreasing. This trend is caused by the distribution of surface settlement around the foundation pit. The distribution of surface settlement around the foundation pit is related to the excavation method, the physical and mechanical properties of the surrounding soil layer and the type of supporting. In the model calculation of this paper, the supporting of the foundation pit is set with three internal supports, and the embedded depth is deep. In the initial stage of foundation pit construction, there is no large deformation for the supporting, and, in the subsequent construction, the supporting had enough stiffness to meet the deformation requirements of the foundation pit. Therefore, only large deformation occurred on the bottom of foundation pit compared with other positions. The maximum surface settlement outside foundation pit is located at a certain distance from the supporting. With the increasing horizontal distance between the twin tunnels and foundation pit, the surface settlement increases first and then decreases, presenting a groove distribution form. Therefore, in the case of the same buried depth of twin tunnels, when the twin tunnels are constructed at a certain distance from the supporting of the foundation pit, the surface settlement of adjacent construction is the largest. However, it can also be seen in Figure 29a that, at the position where the surface settlement reaches its maximum, the contour line of cloud diagram of surface settlement presents a ‘double peak shape’, which is caused by the construction of twin tunnels. The distribution form of surface settlement caused by the construction of single tunnel is close to an inverted normal distribution curve, while, for twin tunnels, the surface settlement can be regarded as the superposition of surface settlement caused by two single tunnels’ construction, respectively. Therefore, in Figure 29a, when the buried depth is less than 20 m, the contour line of cloud diagram of presents a ‘double peak shape’.
However, when the buried depth of twin tunnels is more than 20 m, that is, the buried depth of twin tunnels exceeds the excavation depth of foundation pit, it can be seen from Figure 29a that surface settlement near the foundation pit increases rapidly to the maximum value of the surface settlement of the adjacent construction under the same buried depth of twin tunnels. With the increasing horizontal distance between the twin tunnels and foundation pit, the overall change in surface settlement shows a decreasing trend. When the buried depth of twin tunnels exceeds the excavation depth of foundation pit, the surface settlement of the adjacent construction increases with the buried depth of twin tunnels until the buried depth reaches 30 m; that is, the embedding depth of supporting, the surface settlement of the adjacent construction reaches the maximum.
According to the numerical calculation results in Figure 29a and based on the criteria of adjacent influential partition in Table 6, the boundary range between zones Ⅰ, Ⅱ, Ⅲ and Ⅳ of adjacent construction of twin tunnels and foundation pit can be obtained, as shown in Figure 29b. Thus the adjacent influential partition based on displacement is provided. The zone I represents the safest zone and the zone IV presents the most dangerous zone. And the safety degrees of the zones II and III are between the zones I and IV.
By extracting and analyzing the maximum horizontal displacement of supporting under different working conditions, the variation rule of the maximum horizontal displacement of supporting is obtained, as shown in Figure 30a. In Figure 30a, X axis (horizontal axis) represents the horizontal distance between the left shield tunnel and the concrete supporting of foundation pit, and Y axis (vertical axis) represents the buried depth of the twin tunnels. The variation rule of the maximum horizontal displacement of supporting under different relative positions between the twin tunnels and foundation pit is described by XY coordinates.
It can be seen from Figure 30a that, similar to the variation rule shown in Figure 29a above, when the buried depth of twin tunnels is less than 20 m, with the increasing horizontal distance between the twin tunnels and foundation pit, the variation in the maximum horizontal displacement of supporting generally shows a trend of increasing first and then decreasing. When the buried depth of twin tunnels exceeds the excavation depth of the foundation pit, it can also be seen in Figure 30a that the horizontal displacement of supporting near the foundation pit increases rapidly to the maximum value under the same buried depth of twin tunnels. With the increasing horizontal distance between the twin tunnels and foundation pit, the overall change in horizontal displacement of supporting shows a decreasing trend. At the same time, the horizontal displacement of supporting of adjacent construction increases with buried depth of twin tunnels until the buried depth of twin tunnels reaches 30 m, that is, the embedding depth of supporting, and the horizontal displacement of supporting of adjacent construction reaches the maximum value. However, different from the cloud diagram of variation in the maximum surface settlement, the ‘double peak shape’ effect produced by twin tunnels has little influence, which is only reflected when the buried depth of twin tunnels is less than 10 m.
According to the numerical calculation results in Figure 30a and based on the criteria of adjacent influential partition in Table 6, the boundary range between zones Ⅰ, Ⅱ, Ⅲ and Ⅳ of adjacent construction of twin tunnels and foundation pit can be obtained, as shown in Figure 30b. Thus the adjacent influential partition based on horizontal displacement of supporting is provided. The zone I represents the safest zone and the zone IV presents the most dangerous zone. And the safety degrees of the zones II and III are between the zones I and IV.

4.3. Safety Risk Analysis of Adjacent Construction of Twin Tunnels and Foundation Pit

Based on the analysis above, we can find that the influencing factors for the adjacent construction can be classified into the following two parts: the buried depth of twin tunnels and the horizontal distance between the twin tunnels and foundation pit, which are regarded as the main risk factors. The safety factors of adjacent construction, maximum surface settlement and maximum horizontal displacement of supporting are listed as three risk indexes, and the final safety risk grade of adjacent construction is obtained based on the risk grade division of the three risk indexes.
In order to provide a more intuitive risk analysis, this study numbers risk level, risk index and risk factors and finally obtains T (risk level), A1 (maximum surface settlement), A2 (maximum horizontal displacement of supporting), A3 (safety factor of adjacent construction), X1 (buried depth of twin tunnels), X2 (horizontal distance between the twin tunnels and foundation pit). To obtain the value of risk level T under different working conditions, this study combines the adjacent influential partition mentioned above and calculates the risk level results through the results of three risk indicators. The weight of each risk indicator is set as Qi, and the level of each risk indicator is Ai, i = 1~3. The calculation formula of risk level T is shown as Equation (4).
T = i 3 Q i × A i = Q 1 × A 1 + Q 2 × A 2 + Q 3 × A 3
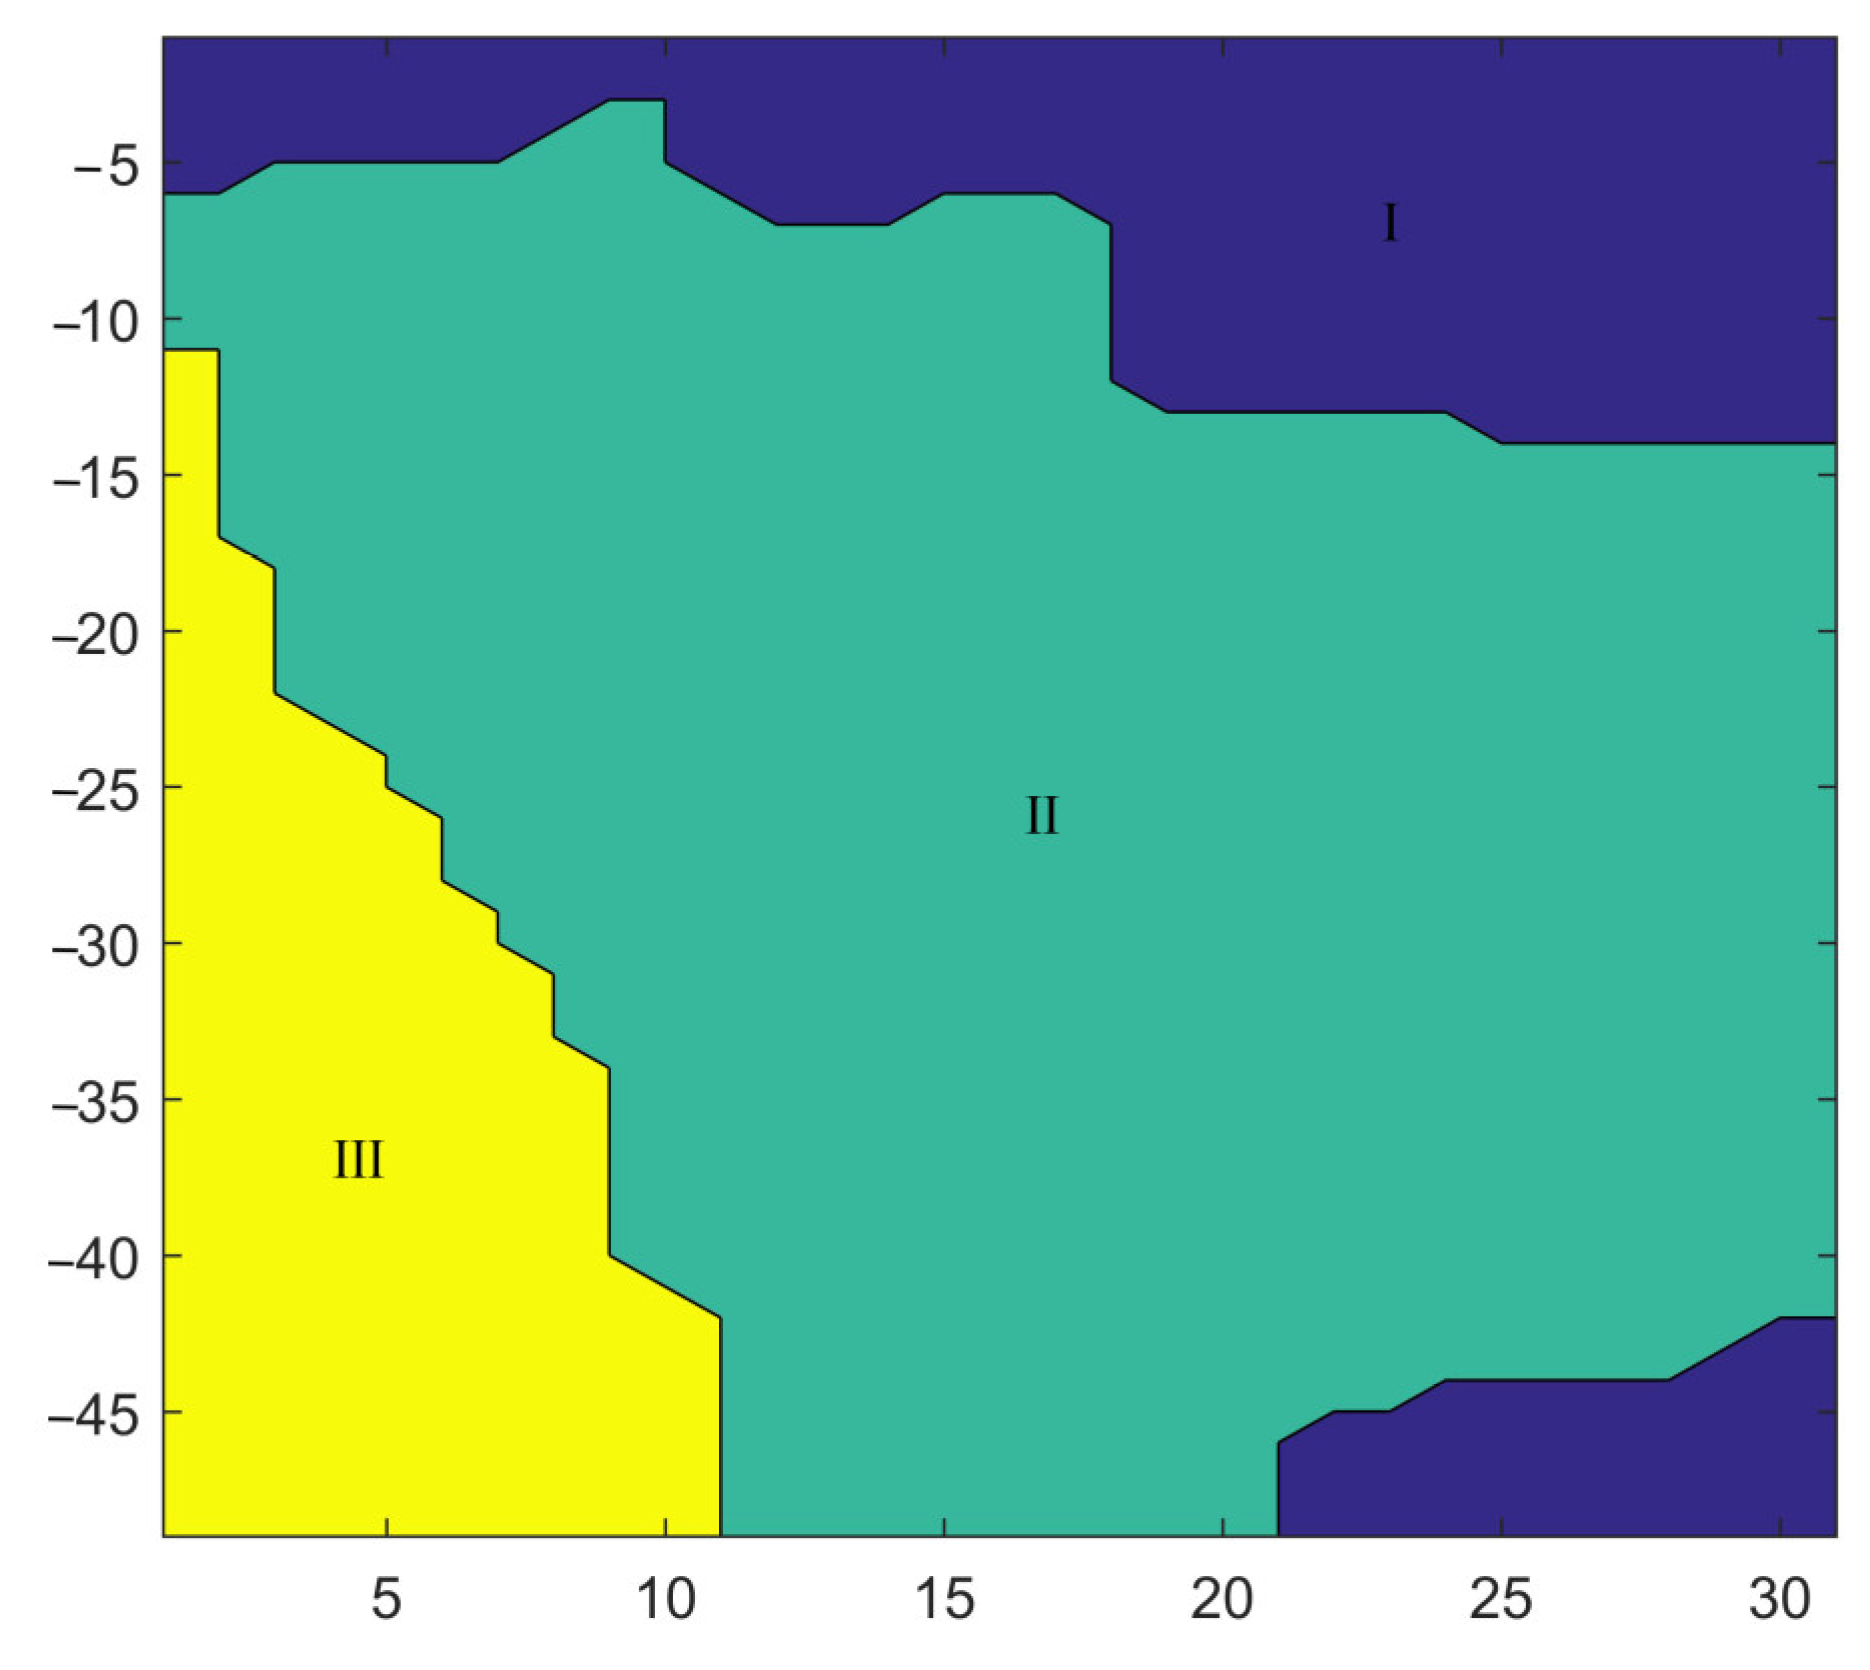
This paper considers that each indicator has the same impact on the risk level; that is, the weight of the three risk indicators is around 0.33, and the final safety risk level can be calculated. The corresponding safety risk level partition results are shown in Table 7. According to the calculation results in Table 7, a schematic diagram of safety risk level partition of adjacent construction can be obtained, as shown in Figure 31. For zone III (dangerous range) represented by yellow color, when the buried depth of the twin tunnels is 10 m to 25 m, the distance between the tunnel and the adjacent foundation pit is less than 5 m. The zone I shown by dark blue represents the safest zone and the safety degrees of the zones II represented by green color is between the zones I and III.

5. Design Equation for Safety Factor of Adjacent Construction

5.1. Influence of Input Parameter on the Global Stability of Adjacent Construction

In this section, the influence of various input parameters on the global stability of adjacent construction of twin tunnels and foundation pit is analyzed. The most dangerous condition, stage (4), is chosen in this section. The upper and lower bounds of the safety factor of global stability under different conditions are obtained through strength reduction method. In the calculation, the strength of the structural elements is reduced. The safety factor of global stability is presented graphically in Figure 32, Figure 33, Figure 34 and Figure 35 to show the influence of all considered input parameters (c/γD, φ, L/D and C/D).
Figure 32 shows the influence of c/γD on the safety factor, and curves of the upper and lower bounds of the safety factor under different φ are drawn in the figure. The data in the figure show that there is a nonlinear relationship between c/γD and the safety factor F. With the increase in c/γD, the safety factors under five different φ will all increase nonlinearly.
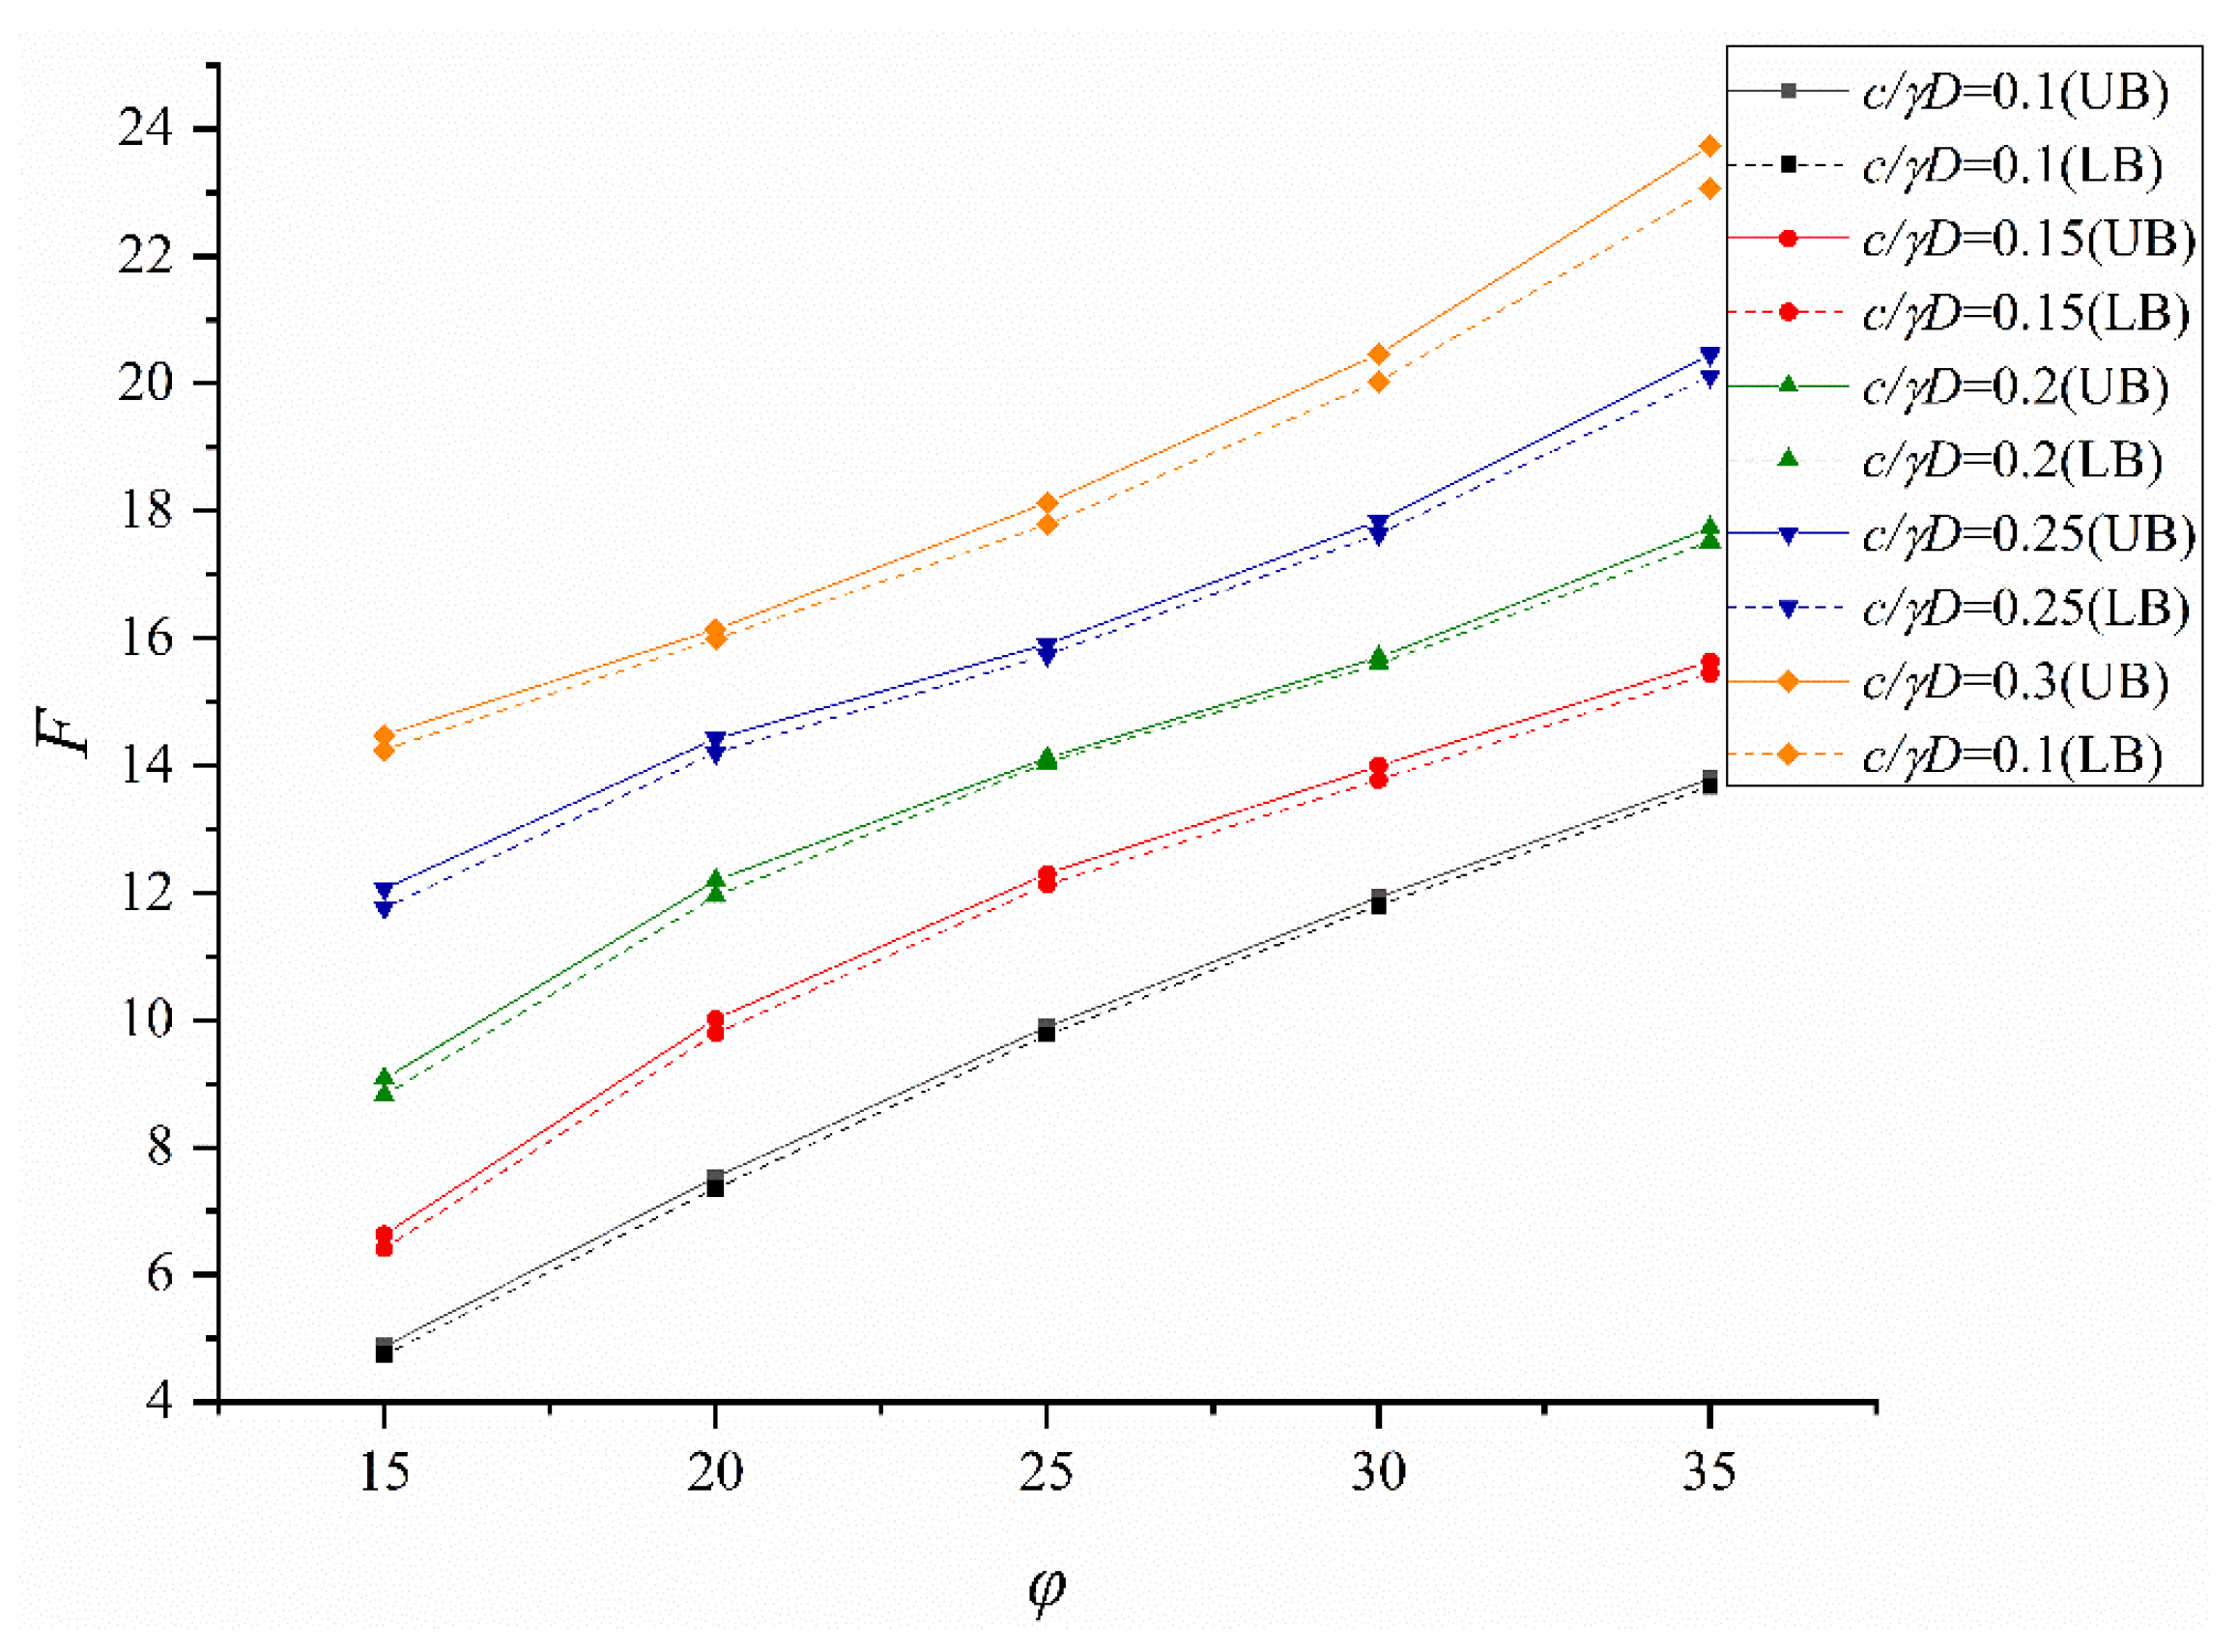
Figure 33 shows the influence of φ on the safety factor, and curves of the upper and lower bounds of the safety factor under different c/γD are drawn in the figure. The data in the figure show that there is a nonlinear relationship between φ and the safety factor F. With the increase in φ, the safety factors under five different c/γD will all increase nonlinearly.
Figure 34 shows the influence of C/D on the safety factor, and curves of the upper and lower bounds of the safety factor under different c/γD are drawn in the figure. The data in the figure show that there is a nonlinear relationship between C/D and the safety factor F. With the increase in C/D, the safety factors under five different c/γD will first increase and then decrease, presenting a parabolic shape as a whole.
Figure 35 shows the influence of L/D on the safety factor, and curves of the upper and lower bounds of the safety factor under different c/γD are drawn in the figure. The data in the figure show that there is a nonlinear relationship between L/D and the safety factor F. With the increase in L/D, the safety factor under five different c/γD will first increase and then decrease, presenting a parabolic shape as a whole.

5.2. Design Equation

In this section, a curve fitting method is employed to develop an approximate expression for the safety factor of global stability of adjacent construction. Based on the analysis results of the images in Figure 32, Figure 33, Figure 34 and Figure 35, the safety factor of global stability of adjacent construction depends on a set of dimensionless parameters, namely c/γD, φ, L/D and C/D. In this study, the dimensionless technique can be used to show that the safety factor of global stability of adjacent construction can be expressed by a set of four dimensionless variables.
F = f ( c γ D , φ , L D , C D )
According to Figure 32, Figure 33, Figure 34 and Figure 35, the functional relationship between a single parameter and the safety factor of global stability can be obtained by analyzing the influence of parameters c/γD, φ, L/D and C/D on the safety factor of global stability. In order to obtain the bounding estimates of safety factor that are closer to the real solutions, the differences between the UB and LB results calculated by finite element limit analysis in the previous section are small, within 5% of their average. Therefore, their average values can be taken as the approximate solution of the problem. Several trial and error attempts of curve fitting technique on the average computed bound solutions of safety factor are performed to determine an appropriate mathematical expression. It is found that the safety factor is well correlated with the quadratic functions of parameters c/γD, φ, L/D and C/D, as shown below.
F = A 1 + A 2 ( c γ D ) + A 3 ( c γ D ) 2
F = B 1 + B 2 ( φ ) + B 3 ( φ ) 2
F = C 1 + C 2 ( L D ) + C 3 ( L D ) 2
F = D 1 + D 2 ( C D ) + D 3 ( C D ) 2
where Ai, Bi, Ci and Di are the coefficients obtained by curve fitting method under the condition that only the functional relationship between a single parameter and the safety factor is considered.
Combined with the four equations above, with the help of MATLAB software, a new design equation containing c/γD, φ, L/D and C/D four parameters can be derived.
After several trial and error attempts of curve fitting technique on the data, the study first determines the appropriate mathematical expression containing c/γD and φ two parameters.
F = G 1 + G 2 ( c γ D ) + G 3 ( φ ) + G 4 ( c γ D ) 2 + G 5 ( φ ) 2 + G 6 ( c γ D ) ( φ )
where Gi is the coefficient obtained by curve fitting method under the condition that only the functional relationship between c/γD and φ and the safety factor is considered.
In this way, Equation (10) is used to fit the data extracted from case groups under different relative positions between the twin tunnels and foundation pit, respectively, and the fitting parameters and goodness of Equation (10) obtained are summarized in Table 8.
It can be observed from Table 8 that the value of Gi changes with L/D and C/D. Further regression analysis shows the functional relationship between two parameters L/D and C/D and Gi, as shown below.
G i = a i + b i ( L D ) + c i ( C D ) + d i ( L D ) 2 + e i ( C D ) 2 + f i ( L D ) ( C D )
where ai, bi, ci, di, ei and fi are the fitting parameters of Equation (11) obtained by curve fitting method, which are summarized in Table 9.
Therefore, a new design equation containing c/γD, φ, L/D and C/D can be obtained by combining Equations (10) and (11).
F = G 1 + G 2 ( c γ D ) + G 3 ( φ ) + G 4 ( c γ D ) 2 + G 5 ( φ ) 2 + G 6 ( c γ D ) ( φ )
G 1 = a 1 + b 1 ( L D ) + c 1 ( C D ) + d 1 ( L D ) 2 + e 1 ( C D ) 2 + f 1 ( L D ) ( C D )
G 2 = a 2 + b 2 ( L D ) + c 2 ( C D ) + d 2 ( L D ) 2 + e 2 ( C D ) 2 + f 2 ( L D ) ( C D )
G 3 = a 3 + b 3 ( L D ) + c 3 ( C D ) + d 3 ( L D ) 2 + e 3 ( C D ) 2 + f 3 ( L D ) ( C D )
G 4 = a 4 + b 4 ( L D ) + c 4 ( C D ) + d 4 ( L D ) 2 + e 4 ( C D ) 2 + f 4 ( L D ) ( C D )
G 5 = a 5 + b 5 ( L D ) + c 5 ( C D ) + d 5 ( L D ) 2 + e 5 ( C D ) 2 + f 5 ( L D ) ( C D )
G 6 = a 6 + b 6 ( L D ) + c 6 ( C D ) + d 6 ( L D ) 2 + e 6 ( C D ) 2 + f 6 ( L D ) ( C D )

6. Conclusions

Through the use of finite element limit analysis (FELA), the global stability of adjacent construction of twin shield tunnels and foundation pits was analyzed. The influences of the construction scheme and the relative position between twin tunnels and foundation pits on global stability of adjacent construction were analyzed. The influence of cover depth C of twin shield tunnels and horizontal distance L between twin tunnels and foundation pits were also analyzed, respectively. The variation in the stability of the foundation pit during the construction process was investigated. Three criteria of adjacent influential partition were proposed and the boundary ranges between zones Ⅰ, Ⅱ, Ⅲ and Ⅳ of adjacent construction of twin shield tunnels and foundation pit were obtained. The influences of various input parameters (c/γD, φ, L/D and C/D) on the global stability of adjacent construction were discussed, respectively. Based on the analysis results, a new design equation containing c/γD, φ, L/D and C/D can be obtained by curve fitting method. The conclusions are provided as follows:
(1) This paper adopted finite element limit analysis combined with strength reduction method to study the stability of adjacent construction and the influence of various parameters (horizontal distance L, cover depth C and relative excavation depth h/H) on the stability of adjacent construction.
(2) During foundation pit construction, the global stability of adjacent construction decreases and the global failure mechanism gradually changes from failure of the twin shield tunnels to failure of the foundation pit. The global stability increases with L and C and becomes basically stable when L or C reaches 1.0 H. Foundation pit stability decreases with an increase in h/H and will be improved by application of supports. It is safer to select 1.0 H as the horizontal distance L in the actual project. In this case, the interaction between twin tunnels and a foundation pit can be better avoided, which also ensures the full use of underground space.
(3) When the buried depth of twin tunnels increases, the safety factor of adjacent construction will continue to increase until the buried depth reaches 22 m, and the safety factor of adjacent construction will reach the maximum. The horizontal displacement of supporting of a foundation pit increases with buried depth of twin tunnels until the buried depth of twin tunnels reaches 30 m, that is, the embedding depth of supporting, and the horizontal displacement of supporting of foundation pit reaches the maximum value.
(4) The safety factors of adjacent construction, maximum surface settlement and maximum horizontal displacement of supporting are listed as three risk indexes, and the final safety risk grade of adjacent construction is obtained based on the risk grade division of the three risk indexes. For zone III (dangerous range), when the buried depth of the twin tunnels is 10 m to 25 m, the distance between the tunnel and the adjacent foundation pit is less than 5 m.
(5) The safety factor of global stability will increase nonlinearly with an increase in c/γD and φ, and it will first increase and then decrease with an increase in C/D and L/D, presenting a parabolic shape as a whole. Based on the influence of parameters (c/γD, φ, L/D and C/D), a new equation for predicting the safety factor of global stability is obtained by the curve fitting method.

Author Contributions

Methodology, W.L.; supervision, W.L.; writing—original draft preparation, X.Z.; software, M.M.; conceptualization, L.W.; writing—review and editing, L.W.; formal analysis, Y.W.; investigation, Y.W. All authors have read and agreed to the published version of the manuscript.

Funding

This research was funded by the National Natural Science Foundation of China (Grant No. 51978042) and the China Postdoctoral Science Foundation (2022M710339).

Data Availability Statement

The data presented in this study are available on request from the corresponding author.

Conflicts of Interest

The authors declare no conflict of interest.

References

  1. Zucca, M.; Valente, M. On the limitations of decoupled approach for the seismic behaviour evaluation of shallow multi-propped underground structures embedded in granular soils. Eng. Struct. 2020, 211, 110497. [Google Scholar] [CrossRef]
  2. Jancsecz, S.; Steiner, W. Face support for a large mix-shield in heterogeneous ground conditions. In Proceedings of the 7th International Symposium on Tunnelling ’94, London, UK, 5–7 July 1994; p. 531. [Google Scholar]
  3. Anagnostou, G. The contribution of horizontal arching to tunnel face stability. Geotechnik 2012, 35, 34–44. [Google Scholar] [CrossRef]
  4. Zhang, Z.X.; Liu, C.; Huang, X. Numerical analysis of volume loss caused by tunnel face instability in soft soils. Environ. Earth Sci. 2017, 76, 563. [Google Scholar] [CrossRef]
  5. Terzaghi, K. Arching in Ideal Soils. In Theoretical Soil Mechanics; John Wiley & Sons Inc.: Hoboken, NJ, USA, 1943; pp. 66–76. [Google Scholar]
  6. Bjerrum, L.; Eide, O. Stability of strutted excavations in clay. Géotechnique 1956, 6, 32–47. [Google Scholar] [CrossRef]
  7. Davis, E.H.; Gunn, M.J.; Mair, R.J.; Seneviratine, H.N. The stability of shallow tunnels and underground openings in cohesive material. Géotechnique 1980, 30, 397–416. [Google Scholar] [CrossRef]
  8. Leca, E.; Dormieux, L. Upper and lower bound solutions for the face stability of shallow circular tunnels in frictional material. Géotechnique 1990, 40, 581–606. [Google Scholar] [CrossRef] [Green Version]
  9. Soubra, A.-H.; Dias, D.; Emeriault, F.; Kastner, R. Three-dimensional face stability analysis of circular tunnels by a kinematical approach. In Proceedings of the GeoCongress 2008: Characterization, Monitoring, and Modeling of GeoSystems, New Orleans, LA, USA, 9–12 March 2008; pp. 894–901. [Google Scholar]
  10. Mollon, G.; Dias, D.; Soubra, A.-H. Face Stability Analysis of Circular Tunnels Driven by a Pressurized Shield. J. Geotech. Geoenvironmental Eng. 2010, 136, 215–229. [Google Scholar] [CrossRef] [Green Version]
  11. Mollon, G.; Dias, D.; Soubra, A.-H. Rotational failure mechanisms for the face stability analysis of tunnels driven by a pressurized shield. Int. J. Numer. Anal. Methods Geomech. 2011, 35, 1363–1388. [Google Scholar] [CrossRef] [Green Version]
  12. Zhang, C.; Han, K.; Zhang, D. Face stability analysis of shallow circular tunnels in cohesive-frictional soils. Tunn. Undergr. Space Technol. 2015, 50, 345–357. [Google Scholar] [CrossRef]
  13. Li, W.; Zhang, C. Face Stability Analysis for a Shield Tunnel in Anisotropic Sands. Int. J. Geomech. 2020, 20, 04020043. [Google Scholar] [CrossRef]
  14. Li, W.; Zhang, C.; Zhang, X. Stability analysis of the tunnel face in the cohesive-frictional soils considering the arch effect and rotational mechanism. J. Chin. Inst. Eng. 2018, 41, 697–709. [Google Scholar] [CrossRef]
  15. Li, W.; Zhang, C.; Zhu, W.; Zhang, D. Upper-bound solutions for the face stability of a non-circular NATM tunnel in clays with a linearly increasing undrained shear strength with depth. Comput. Geotech. 2019, 114, 103136. [Google Scholar] [CrossRef]
  16. Li, W.; Zhang, C.; Tan, Z.; Ma, M. Effect of the seepage flow on the face stability of a shield tunnel. Tunn. Undergr. Space Technol. 2021, 112, 103900. [Google Scholar] [CrossRef]
  17. Zhang, C.; Li, W.; Zhu, W.; Tan, Z. Face stability analysis of a shallow horseshoe-shaped shield tunnel in clay with a linearly increasing shear strength with depth. Tunn. Undergr. Space Technol. 2020, 97, 103291. [Google Scholar] [CrossRef]
  18. Tu, S.; Li, W.; Zhang, C.; Chen, W. Effect of inclined layered soils on face stability in shield tunneling based on limit analysis. Tunn. Undergr. Space Technol. 2023, 131, 104773. [Google Scholar] [CrossRef]
  19. Su, S.F.; Liao, H.J.; Lin, Y.H. Base stability of deep excavation in anisotropic soft clay. J. Geotech. Geoenvironmental Eng. 1998, 124, 809–819. [Google Scholar] [CrossRef]
  20. Chang, M.-F. Basal Stability Analysis of Braced Cuts in Clay. J. Geotech. Geoenvironmental Eng. 2000, 126, 276–279. [Google Scholar] [CrossRef]
  21. Zou, G.-D. Analysis of stability against upheaval of deep excavation by an upper limit method. Yantu Lixue Rock Soil Mech. 2004, 25, 1873–1878. [Google Scholar]
  22. Chen, R.P.; Tang, L.J.; Ling, D.S.; Chen, Y.M. Face stability analysis of shallow shield tunnels in dry sandy ground using the discrete element method. Comput. Geotech. 2011, 38, 187–195. [Google Scholar] [CrossRef]
  23. Chen, R.-p.; Li, J.; Kong, L.-g.; Tang, L.-j. Experimental study on face instability of shield tunnel in sand. Tunn. Undergr. Space Technol. 2013, 33, 12–21. [Google Scholar] [CrossRef]
  24. Ukritchon, B.; Yingchaloenkitkhajorn, K.; Keawsawasvong, S. Three-dimensional undrained tunnel face stability in clay with a linearly increasing shear strength with depth. Comput. Geotech. 2017, 88, 146–151. [Google Scholar] [CrossRef]
  25. Goh, A.T.C. Assessment of basal stability for braced excavation systems using the finite element method. Comput. Geotech. 1990, 10, 325–338. [Google Scholar] [CrossRef]
  26. Sloan, S.W. Lower bound limit analysis using finite elements and linear programming. Int. J. Numer. Anal. Methods Geomech. 1988, 12, 61–77. [Google Scholar] [CrossRef]
  27. Sloan, S.W. Upper bound limit analysis using finite elements and linear programming. Int. J. Numer. Anal. Methods Geomech. 1989, 13, 263–282. [Google Scholar] [CrossRef]
  28. Graettinger, A.J.; Lee, J.; Reeves, H.W. Upper bound limit analysis using linear finite elements and non-linear programming. Int. J. Numer. Anal. Methods Geomech. 2002, 26, 181–216. [Google Scholar] [CrossRef]
  29. Lyamin, A.V.; Sloan, S.W. Lower bound limit analysis using non-linear programming. Int. J. Numer. Methods Eng. 2002, 55, 573–611. [Google Scholar] [CrossRef]
  30. Krabbenhoft, K.; Lyamin, A.V.; Hjiaj, M.; Sloan, S.W. A new discontinuous upper bound limit analysis formulation. Int. J. Numer. Methods Eng. 2005, 63, 1069–1088. [Google Scholar] [CrossRef]
  31. Krabbenhøft, K.; Lyamin, A.V.; Sloan, S.W. Formulation and solution of some plasticity problems as conic programs. Int. J. Solids Struct. 2007, 44, 1533–1549. [Google Scholar] [CrossRef] [Green Version]
  32. Ukritchon, B.; Keawsawasvong, S. A new design equation for drained stability of conical slopes in cohesive-frictional soils. J. Rock Mech. Geotech. Eng. 2018, 10, 358–366. [Google Scholar] [CrossRef]
  33. Ukritchon, B.; Keawsawasvong, S. Stability of unlined square tunnels in Hoek-Brown rock masses based on lower bound analysis. Comput. Geotech. 2019, 105, 249–264. [Google Scholar] [CrossRef]
  34. Keawsawasvong, S.; Ukritchon, B. Stability of unsupported conical excavations in non-homogeneous clays. Comput. Geotech. 2017, 81, 125–136. [Google Scholar] [CrossRef]
  35. Keawsawasvong, S.; Ukritchon, B. Undrained basal stability of braced circular excavations in non-homogeneous clays with linear increase of strength with depth. Comput. Geotech. 2019, 115, 103180. [Google Scholar] [CrossRef]
  36. Shiau, J.; Al-Asadi, F. Revisiting Broms and Bennermarks’ original stability number for tunnel headings. Géotechnique Lett. 2018, 8, 310–315. [Google Scholar] [CrossRef] [Green Version]
  37. Shiau, J.; Al-Asadi, F. Two-dimensional tunnel heading stability factors Fc, Fs and F. Tunn. Undergr. Space Technol. 2020, 97, 103293. [Google Scholar] [CrossRef]
  38. Shiau, J.; Al-Asadi, F. Three-Dimensional Analysis of Circular Tunnel Headings Using Broms and Bennermark’s Original Stability Number. Int. J. Geomech. 2020, 20, 06020015. [Google Scholar] [CrossRef]
  39. Liang, R.; Xia, T.; Huang, M.; Lin, C. Simplified analytical method for evaluating the effects of adjacent excavation on shield tunnel considering the shearing effect. Comput. Geotech. 2017, 81, 167–187. [Google Scholar] [CrossRef]
  40. Liang, R.; Wu, W.; Yu, F.; Jiang, G.; Liu, J. Simplified method for evaluating shield tunnel deformation due to adjacent excavation. Tunn. Undergr. Space Technol. 2018, 71, 94–105. [Google Scholar] [CrossRef]
  41. Sun, H.; Chen, Y.; Zhang, J.; Kuang, T. Analytical investigation of tunnel deformation caused by circular foundation pit excavation. Comput. Geotech. 2019, 106, 193–198. [Google Scholar] [CrossRef]
  42. Wei, G.; Zhang, X.-H.; Lin, X.-B.; Hua, X.-X. Variations of transverse forces on nearby shield tunnel caused by foundation pits excavation. Yantu Lixue Rock Soil Mech. 2020, 41, 635–644 and 654. [Google Scholar] [CrossRef]
  43. Zhang, Z.-G.; Zhang, M.-X.; Wang, W.-D. Two-stage method for analyzing effects on adjacent metro tunnels due to foundation pit excavation. Yantu Lixue Rock Soil Mech. 2011, 32, 2085–2092. [Google Scholar]
  44. Zhou, Z.-L.; Chen, S.-G.; Chen, L.; Tu, P. Analysis of uplift deflection of subway tunnel due to adjacent pit excavation. Yantu Gongcheng Xuebao Chin. J. Geotech. Eng. 2015, 37, 2224–2234. [Google Scholar] [CrossRef]
  45. Zong, X. Study of longitudinal deformation of existing tunnel due to above excavation unloading. Yantu Lixue Rock Soil Mech. 2016, 37, 571–577 and 596. [Google Scholar] [CrossRef]
  46. Chen, R.; Meng, F.; Li, Z.; Ye, Y.; Ye, J. Investigation of response of metro tunnels due to adjacent large excavation and protective measures in soft soils. Tunn. Undergr. Space Technol. 2016, 58, 224–235. [Google Scholar] [CrossRef] [Green Version]
  47. Yanhua, H.; Wenhai, Y.; Qifen, W. Reserch on the influence of new shield tunnel to adjacent existing tunnel. In Proceedings of the 2012 International Conference on Sustainable Energy and Environmental Engineering, ICSEEE 2012, Guangzhou, China, 29–30 December 2012; pp. 2985–2989. [Google Scholar]
  48. Huang, H.; Huang, X.; Helmut, S.F. Numerical analysis of the influence of deep excavation on underneath existing road tunnel. Tumu Gongcheng Xuebao China Civ. Eng. J. 2012, 45, 182–189. [Google Scholar]
  49. Mahajan, S.; Ayothiraman, R.; Sharma, K.G. A Parametric Study on Effects of Basement Excavation and Foundation Loading on Underground Metro Tunnel in Soil. Indian Geotech. J. 2019, 49, 667–686. [Google Scholar] [CrossRef]
  50. Zheng, G.; Liu, Q.-C.; Deng, X. Numerical analysis of effect of excavation on underlying existing metro tunnel and deformation control. Yantu Lixue Rock Soil Mech. 2013, 34, 1459–1468+1477. [Google Scholar]
  51. SLOAN, S.W. Geotechnical stability analysis. Géotechnique 2013, 63, 531–571. [Google Scholar] [CrossRef] [Green Version]
  52. Drucker, D.C.; Prager, W.; Greenberg, H.J. Extended Limit Design Theorems for Continuous Media. Q. Appl. Math. 1952, 9, 381–389. [Google Scholar] [CrossRef] [Green Version]
Figure 1. Construction site of the foundation pit under different stages.
Buildings 13 01000 g001
Figure 2. Geomorphic map near construction site.
Buildings 13 01000 g002
Figure 3. Flow diagram of the strength reduction analysis.
Buildings 13 01000 g003
Figure 4. Sectional view of the supporting structure.
Buildings 13 01000 g004
Figure 5. Schematic diagram of relative position between the foundation pit and the twin shield tunnels.
Buildings 13 01000 g005
Figure 6. Final adaptive meshes of adjacent construction after five iterations.
Buildings 13 01000 g006
Figure 7. The construction scheme of the foundation pit: (a) Stage (1) (h = 0.08 H), (b) Stage (2) (h = 0.4 H), (c) Stage (3) (h = 0.75 H) and (d) Stage (4) (h = 1.0 H).
Buildings 13 01000 g007aBuildings 13 01000 g007b
Figure 8. The safety factor of the global stability under each stage.
Buildings 13 01000 g008
Figure 9. Shear dissipation contours under each stage: (a) Stage (1) (h = 0.08 H), (b) Stage (2) (h = 0.4 H), (c) Stage (3) (h = 0.75 H) and (d) Stage (4) (h = 1.0 H).
Buildings 13 01000 g009
Figure 10. Incremental displacement vector under each stage: (a) Stage (1) (h = 0.08 H), (b) Stage (2) (h = 0.4 H), (c) Stage (3) (h = 0.75 H) and (d) Stage (4) (h = 1.0 H).
Buildings 13 01000 g010
Figure 11. Axial force diagram under each stage: (a) Stage (1) (h = 0.08 H), (b) Stage (2) (h = 0.4 H), (c) Stage (3) (h = 0.75 H) and (d) Stage (4) (h = 1.0 H).
Buildings 13 01000 g011
Figure 12. Influence of L on the safety factors F of global stability under different cover depth C of twin shield tunnels: (a) C = 0.5 H, (b) C = 1.0 H, (c) C = 1.5 H and (d) C = 2.0 H.
Buildings 13 01000 g012aBuildings 13 01000 g012b
Figure 13. Shear dissipation contours under different horizontal distance L in stage (2): (a) L = 0.33 H and (b) L = 0.5 H.
Buildings 13 01000 g013
Figure 14. Incremental displacement vector under different horizontal distance L in stage (2): (a) L = 0.33 H and (b) L = 0.5 H.
Buildings 13 01000 g014
Figure 15. Shear dissipation contours under different horizontal distance L in stage (4): (a) L = 0.33 H and (b) L = 1.0 H.
Buildings 13 01000 g015
Figure 16. Incremental displacement vector under different horizontal distance L in stage (4): (a) L = 0.33 H and (b) L = 1.0 H.
Buildings 13 01000 g016
Figure 17. Axial force diagram under different horizontal distance L in stage (2): (a) L = 0.33 H and (b) L = 0.5 H.
Buildings 13 01000 g017
Figure 18. Axial force diagram under different horizontal distance L in stage (4): (a) L = 0.33 H and (b) L = 1.0 H.
Buildings 13 01000 g018
Figure 19. Influence of C on the safety factors F of global stability under different horizontal distance L: (a) L = 0.33 H, (b) L = 0.5 H, (c) L = 0.67 H and (d) L = 1.0 H.
Buildings 13 01000 g019
Figure 20. Shear dissipation contours under different cover depth C of the twin shield tunnels in stage (3): (a) C = 0.5 H and (b) C = 1.0 H.
Buildings 13 01000 g020
Figure 21. Incremental displacement vector under different cover depth C of the twin shield tunnels in stage (3): (a) C = 0.5 H and (b) C = 1.0 H.
Buildings 13 01000 g021
Figure 22. Shear dissipation contours under different cover depth C of the twin shield tunnels in stage (4): (a) C = 0.5 H and (b) C = 1.0 H.
Buildings 13 01000 g022
Figure 23. Incremental displacement vector under different cover depth C of the twin shield tunnels in stage (4): (a) C = 0.5 H and (b) C = 1.0 H.
Buildings 13 01000 g023
Figure 24. Axial force diagram under different cover depth C of the twin shield tunnels in stage (3): (a) C = 0.5 H and (b) C = 1.0 H.
Buildings 13 01000 g024
Figure 25. Axial force diagram under different cover depth C of the twin shield tunnels in stage (4): (a) C = 0.5 H and (b) C = 1.0 H.
Buildings 13 01000 g025
Figure 26. Influence of the relative excavation depth h/H on the safety factors F of the foundation pit.
Buildings 13 01000 g026
Figure 27. Influence of the relative excavation depth h/H on axial force of the supports of foundation pit.
Buildings 13 01000 g027
Figure 28. Adjacent influential partition based on safety factor: (a) cloud diagram of variation in safety factor and (b) schematic diagram of adjacent influential partition.
Buildings 13 01000 g028aBuildings 13 01000 g028b
Figure 29. Adjacent influential partition based on surface settlement: (a) cloud diagram of variation in the maximum surface settlement and (b) schematic diagram of adjacent influential partition.
Buildings 13 01000 g029
Figure 30. Adjacent influential partition based on horizontal displacement of supporting: (a) cloud diagram of variation in the maximum horizontal displacement of supporting and (b) schematic diagram of adjacent influential partition.
Buildings 13 01000 g030
Figure 31. Schematic diagram of safety risk level partition of adjacent construction.
Buildings 13 01000 g031
Figure 32. Influence of c/γD on the safety factors F of the global stability of adjacent construction under different φ (C/D = 1, L/D = 1).
Buildings 13 01000 g032
Figure 33. Influence of φ on the safety factors F of the global stability of adjacent construction under different c/γD (C/D = 1, L/D = 1).
Buildings 13 01000 g033
Figure 34. Influence of C/D on the safety factors F of the global stability of adjacent construction under different c/γD (φ = 25°, L/D = 1).
Buildings 13 01000 g034
Figure 35. Influence of L/D on the safety factors F of the global stability of adjacent construction under different c/γD (φ = 25°, L/D = 1).
Buildings 13 01000 g035
Table 1. The parameters of plates.
MaterialUnit Weight γ (kg/m3)Cohesion c (kPa)Friction
Angle φ (°)
Elasticity Modulus E (MPa)Poisson’s Ratio v
Mohr–Coulomb19002220220.3
Table 2. The parameters of solid elements.
NameMaterialUnit Weight γ (kg/m3)Elasticity Modulus E (GPa)Poisson’s Ratio vArea (m2)
SupportingC302500300.30.8
LiningC50250034.50.20.35
Table 3. The parameters of connectors.
NameMaterialElasticity Modulus E (GPa)Area (m2)Interval (m)
Steel supportQ2352000.02983
Concrete supportC30300.649
Table 4. The relative positions between the foundation pit and the twin shield tunnels.
The Horizontal Distance between the Foundation Pit and the Twin
Tunnels L (m)
The Cover Depth of the Twin Shield Tunnels C(m)
C = 9C = 18C = 27C = 36
L = 6(C = 9, L = 6)(C = 18, L = 6)(C = 27, L = 6)(C = 36, L = 6)
L = 9(C = 9, L = 9)(C = 18, L = 9)(C = 27, L = 9)(C = 36, L = 9)
L = 12(C = 9, L = 12)(C = 18, L = 12)(C = 27, L = 12)(C = 36, L = 12)
L = 18(C = 9, L = 18)(C = 18, L = 18)(C = 27, L = 18)(C = 36, L = 18)
L = 24(C = 9, L = 24)(C = 18, L = 24)(C = 27, L = 24)(C = 36, L = 24)
L = 36(C = 9, L = 36)(C = 18, L = 36)(C = 27, L = 36)(C = 36, L = 36)
Table 5. Criteria of adjacent influential partition based on safety factor.
ZoneSafety Factor
>15
12.5~15
10~12.5
<10
Table 6. Criteria of adjacent influential partition based on displacement.
ZoneSurface Settlement (mm)Horizontal Displacement of the
Concrete Supporting (mm)
>70>70
55~7055~70
40~5540~55
<40<40
Table 7. Safety risk level partition of adjacent construction.
Buried Depth of Twin TunnelsZone Ⅰ
(Very Safe)
Zone Ⅱ
(Safe)
Zone Ⅲ
(Dangerous)
Zone Ⅳ
(Very Dangerous)
1–2 m1 m–31 m---
3 m1 m–8 m, 11 m–31 m9 m–10 m--
4 m1 m–7 m, 11 m–31 m8 m–10 m--
5 m1 m–2 m, 11 m–31 m3 m–10 m--
6 m12 m–14 m, 18 m–31 m1 m–11 m, 15 m–17 m--
7 m–10 m19 m–31 m1 m–18 m--
11 m–12 m19 m–31 m3 m–18 m1 m–2 m-
13 m25 m–31 m3 m–24 m1 m–2 m-
14 m–17 m-3 m–31 m1 m–2 m-
18 m–22 m-4 m–31 m1 m–3 m-
23 m-5 m–31 m1 m–4 m-
24 m–25 m-6 m–31 m1 m–5 m-
26 m–28 m-7 m–31 m1 m–6 m-
29 m–30 m-8 m–31 m1 m–7 m-
31 m–33 m-9 m–31 m1 m–8 m-
34 m–40 m-10 m–31 m1 m–9 m-
41 m-11 m–31 m1 m–10 m-
42 m-12 m–31 m1 m–11 m-
43 m30 m–31 m12 m–29 m1 m–11 m-
44 m29 m–31 m12 m–28 m1 m–11 m-
45 m24 m–31 m12 m–23 m1 m–11 m-
46 m–49 m22 m–31 m12 m–21 m1 m–11 m46 m–49 m
Table 8. Fitting parameters and goodness of Equation (11) in various case groups.
Case G1G2G3G4G5G6R2
C/D = 1
L/D = 1−7.09238.110.593120.2−0.07628−0.0029840.9914
L/D = 1.252.5755.915−0.0741238.290.83740.007510.9898
L/D = 1.512.27−38.4−0.7481.262.1520.018720.9884
L/D = 1.7526.33−109.8−1.639165.54.2380.033220.9789
L/D = 227.59−159.1−1.494249.65.3830.028170.9822
C/D = 1.5
L/D = 1−1.68123.750.222319.630.10610.0020440.9937
L/D = 1.256.567−9.775−0.368345.331.1790.011930.9938
L/D = 1.516.57−58−1.07495.12.7480.024380.9918
L/D = 1.7528.19−115.2−1.829164.34.4720.036970.9837
L/D = 225.89−162.6−1.354257.95.4180.025660.985
C/D = 2
L/D = 15.269−8.658−0.265241.010.99750.0095470.9977
L/D = 1.2510.44−35.73−0.676567.682.0160.017640.9984
L/D = 1.521.45−91.72−1.391139.33.6770.030070.9872
L/D = 1.7528.42−156.6−1.634235.35.3940.031470.9807
L/D = 223.23−160.2−1.148265.35.2820.022020.9849
C/D = 2.5
L/D = 17.646−33.05−0.480769.931.8350.01450.9983
L/D = 1.2522.47−98.93−1.4691473.940.031380.9842
L/D = 1.527.11−154.8−1.543233.95.3560.029910.9804
L/D = 1.7522.72−157.8−1.124260.15.2640.021660.984
L/D = 222.33−152.6−1.114265.75.0480.02190.9834
C/D = 3
L/D = 127.76−131.6−1.769180.65.0750.035320.9783
L/D = 1.2525.24−136.3−1.494184.25.3510.028940.9699
L/D = 1.522.16−147.8−1.134236.65.2040.021910.9821
L/D = 1.7522.09−147.9−1.121247.15.120.021760.9824
L/D = 222.81−149.5−1.171262.15.010.023020.9825
Table 9. Optimal value of the constants for the new design equation of safety factor.
Giaibicidieifi
G1−125.1120.235.04−19.81−20.760.4592
G2524.9−422.2−150.434.8988.45−7.31
G39.081−8.883−2.581.6531.4650.01583
G4−338.2238.294.7531.27−64.8915.7
G5−15.8714.934.139−1.812−2.8420.3708
G6−0.14860.15480.04369−0.03064−0.02454−0.0006089
Disclaimer/Publisher’s Note: The statements, opinions and data contained in all publications are solely those of the individual author(s) and contributor(s) and not of MDPI and/or the editor(s). MDPI and/or the editor(s) disclaim responsibility for any injury to people or property resulting from any ideas, methods, instructions or products referred to in the content.