Abstract
In this study, the physiological and thermal responses of 54 healthy elderly adults during horticultural activities with various intensities (low, moderate, and high) in three typical open spaces were investigated through meteorological measurements, questionnaires, and physiological monitoring. Physiological equivalent temperature (PET), blood pressure, heart rate, oxygen saturation, and ear canal temperature were used as physiological evaluation indices. The results showed that: (1) the proportional changes before and after thermal sensation vote (TSV) and thermal comfort vote (TCV) activities were positively correlated with the spatial characteristics and metabolic levels of outdoor activities in summer; (2) physiological indices were almost constant during low-intensity horticultural activities and significantly different before and after moderate-intensity and vigorous-intensity horticultural activities; (3) when the intensity of horticultural activities changed from low to moderate, the neutral PET (NPET) decreased to 25.29 and 26.82 °C, respectively, whereas the NPET increased to 23.97 °C during vigorous intensity; (4) heart rate (HR) and diastolic blood pressure (SBP) were positively correlated with metabolic rate for the elderly; (5) a moderate sky view factor space was more suitable for the elderly to participate in during outdoor horticultural activities in summer.
1. Introduction
By 2050, the proportion of the global elderly population will double from 12% in 2015 [1], and the rate of aging of the global population is increasing at an unprecedented rate [2]. Chronic and non-communicable physical diseases such as cardiovascular diseases, osteoporosis, diabetes, and neurodegenerative diseases are more prevalent in the elderly population [3,4,5,6], which have a significant negative impact on their quality of life [7,8]. According to the WHO’s report (2010), regular physical activity can significantly reduce the risk of disease and provide a variety of health benefits for the elderly [9], and previous studies have revealed that outdoor spaces can be effective in improving sleep quality, enhancing well-being, and reducing physical diseases by providing the elderly with a variety of physical activities [10,11]. The quality of outdoor space can influence not only the motivation of the elderly to engage in outdoor activities [12,13] but also the type and quantity of their activities, and thermal comfort has drawn attention from researchers as an important factor in evaluating the quality of outdoor space [14,15]. Therefore, creating high-quality outdoor thermal comfort conditions is crucial for the elderly to take part in various outdoor activities.
Horticultural activity is increasingly gaining popularity as an outdoor activity to enhance the physical and mental health of the elderly. It not only improves the socialization and participation of the elderly in outdoor activities [16,17], but also has a significant impact on their physiological relief [18,19,20]. It mostly reflects an increase in cognitive ability [21], physical flexibility, and hand-eye coordination [22,23,24], as well as a decline in chronic diseases including cardiovascular disease and obesity [25]. Additionally, studies have revealed that elderly people who engage in horticultural activities have significantly lower systolic and diastolic blood pressure, higher HDL cholesterol concentrations (HDL cholesterol helps to reduce the risk of cardiovascular disease), and lower concentrations of the oxidative stress product RAGE, which is linked to aging-related diseases such as cardiovascular disease, diabetes, and various inflammatory conditions [26]. Therefore, it is urgent to determine the physiological relieving effect of horticultural activities on the elderly.
Previous studies have shown differences in physical and mental health alleviation effects of horticultural activities on the elderly [27]. Participants were in a better emotional state when transplanting plants compared to soil-filling gardening activities [28], and there were differences in the cognitive level and emotional state of older adults in several gardening activities, such as flower arrangement, transplanting, leaf cleaning, and sowing [29]. Different levels of horticultural activities result in varying metabolic rates [30], and different metabolic rates may contribute to variations in physiological indices (e.g., ear canal temperature, blood pressure (BP), and heart rate (HR)) [27,29], thereby affecting individual thermal responses [31,32]. Tu et al. found that various horticultural activities result in distinct physiological and mental states [27]. Some studies pointed that volunteers had better emotional states while transplanting plants (flowering and non-flowering pansies) compared to soil filling, and that transplanted flowering plants had higher positive emotions than non-flowering plants [28]. Furthermore, it was noticed that, among the horticultural activities of flower arrangement, transplanting, leaf cleaning, and sowing, the activities of flower arrangement, transplanting, and leaf cleaning had a better positive effect on the volunteer’s emotional states, whereas transplanting, leaf cleaning, and sowing were more effective at boosting the cognitive level of the elderly [29]. However, most previous studies have focused on the effects of horticultural activities on the physical and mental health of the elderly, but few studies have established the relationship between horticultural activities and the thermal responses of the elderly, and there is a lack of research on the effects of horticultural activity intensities on the physical activities and thermal responses of the elderly.
In this study, three different intensities of horticultural activities (flower arrangement, transplanting and planting, and laying crushed stone) were selected in an urban park in Xi’an, China. Using physical measurements (temperature (Ta), humidity (RH), wind speed (Va), solar radiation (G), etc.), physiological measurements (blood pressure, HR, ear canal temperature, oxygen saturation (SpO2)), and questionnaires, the physiological and thermal responses of the elderly when participating in different intensities of horticultural activities were investigated. The main primary aims of this study were to: (1) investigate physiological responses to varying levels of horticultural activity in the space; (2) determine the impact of various activity intensities in the space on the thermal responses of the elderly; (3) propose bioclimatic design strategies based on the characteristics of physiological and thermal responses. Our findings were conducive to encouraging the elderly to actively participate in horticultural activities and safeguarding their physical and mental health, and provided theoretical guidelines for the selection of outdoor horticultural activities for the elderly in summer.
2. Methods
2.1. Study Area
According to Koppen’s climate classification, Xi’an is located at the boundary between a semi-arid (BSk) and humid subtropical climate (Cwa) area [33]. The study area has a humid subtropical climate, with hot and humid summers and cold and dry winters. During the period 2010–2019, the temperature (Ta) in Xi’an reached a maximum of 39.1 and a minimum of −8.4 °C according to meteorological data. The maximum monthly mean Ta occurred in July (28.07 °C) and the minimum in January (0.49 °C), and the annual mean relative humidity (RH) ranged from 53.11 to 73.83% [34].
The field survey was conducted in an urban park in Xi’an, China (108°5′35″ E, 34°16′4″ N). The park covers approximately 5.73 hectares and has rich outdoor activity space types (such as open squares, landscape pavilions, boulevards, lakes, etc.). This urban park is an ideal place to study the thermal responses and physiological effects of different intensities of horticultural activities on the elderly in outdoor open spaces, as it attracts a considerable number of residents, including a large proportion of senior citizens. Three open spaces with different spatial characteristics and typical activities were selected based on the accessibility and frequency of usage by the elderly: open square, tree shade space, and pavilion shade space (Figure 1). We took fish-eye photos of the study area and then input them into the software (Rayman) to calculate the SVF for each measured site (Table 1).
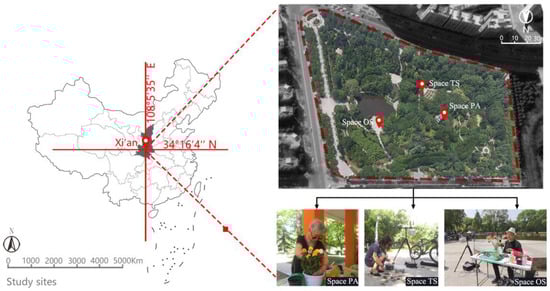
Figure 1.
Site locations and measured spaces.

Table 1.
Descriptions of the three open spaces.
2.2. Experimental Design
2.2.1. Types of Horticulture Activities
Based on the pre-test survey, three typical and highly practical gardening activities with low, moderate, and high intensities were selected, namely flower arranging (low intensity, Met = 1.7), transplanting and planting (moderate intensity, Met = 3), and laying crushed stone (vigorous intensity, Met = 4.6) [30,35,36]. In order to ensure the smooth running of the experiment, pre-experiments were conducted for all three horticultural activities to determine the number of various materials (flowering materials, amount of soil and laying crushed stone, etc.) required for the different horticultural activities within the allotted time frame (Figure 2). These three activities were common and easy to carry out in life, and most volunteers were familiar with them.
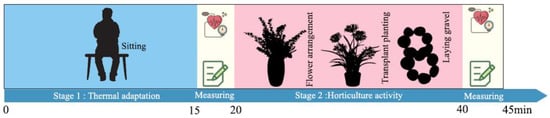
Figure 2.
Details of the experimental procedure.
Flower arrangement: volunteers were required to be seated, mainly using common flowering plants such as carnations, Chinese roses, and roses of similar size and weight, along with the green plant Eucalyptus, and were equipped with scissors and vases of the same caliber size in advance. Before the horticultural activities began, the researcher taught each volunteer the basic methods of flower arrangement so that they could complete their tasks efficiently.
Transplanting and planting: volunteers were required to stand, stoop, and move in a confined area. Flowering plants with a height and crown diameter of 30~40 cm were selected for transplanting (ping pong chrysanthemum, aglaiaodorata, gardenia, bougainvillea, azalea, jasmine, lilac, and hibiscus). The necessary tools for transplanting, such as soil, transplanting pots, and shovels were also provided. Before transplanting, transplanting procedures in detail were explained to volunteers.
Laying crushed stone: volunteers were required to move within a certain range in the squatting place. Depending on their ability, the crushed stones (smooth surface) were selected from 3 to 8 cm in diameter, and volunteers were asked to create their own words and patterns with the stones or follow the reference examples (prepared in advance by the researchers) within the allotted time.
2.2.2. Experimental Procedures
The experiment was conducted on sunny days from 19 to 21 June 2022. A total of 54 volunteers were randomly recruited in the park with different characteristics and were randomly distributed to each measured site. A volunteer could only participate in one gardening activity, with no repeat participation during trails. The experiment was scheduled from 9:30–11:30 am and 2:30–4:30 pm according to the daily activity pattern of the elderly.
Trails were divided into 6 groups, with each group having 18 individuals each day: 3 groups in the morning and 3 groups in the afternoon, each with 3 volunteers. Each group of volunteers was led by the leader to three spaces to perform three types of horticultural activities of low, moderate, and vigorous intensity, respectively. The order of horticultural activities for each day of the experiment was randomly generated.
Each volunteer was accompanied by two leaders to each space and sat for 15 min to adapt to the thermal environment (during this period, the leaders explained the details of the horticultural activities and the precautions to the volunteers). After adapting to the environment, the physiological parameters (blood pressure, blood oxygen, HR, ear canal temperature) were measured and the first questionnaire was completed in approximately 5 min. The horticultural activities were then continued at a predetermined intensity for 20 min. After the horticultural activities, the second measurement of physiological parameters and the questionnaire were completed in 5 min (Figure 2).
2.2.3. Questionnaire Survey
Before and after horticultural activities for the elderly, various indices were measured and collected using physical and mental measurements and questionnaires. The questionnaire was divided into three parts and all questionnaire information was approved by the appropriate ethics committee.
In the first part, we collected personal information including gender, age, height, weight, clothing insulation (clo), and metabolism. Among them, clothing insulation was assessed using a list of clothing selected from ASHRAE Standard 55-2017 for the respondents’ clothing insulation [37]. The metabolic rates for different intensities of horticultural activities were determined by previous standards (flower arrangement: 1.7 Met, transplanting and planting: 3 Met, laying crushed stone: 4.6 Met) [30,35,36] (Figure 3).
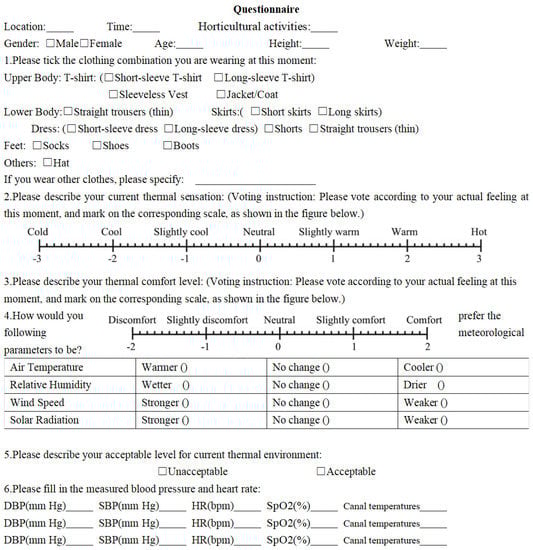
Figure 3.
Questionnaire survey.
The second part of the questionnaire was to investigate the thermal responses of volunteers. The thermal response was described by an ASHRAE 7-level scale, where the thermal preference was expressed using a 3-level scale, thermal comfort was recorded by a 5-level scale, and thermal acceptability voting was assessed using a 2-level scale (Figure 3).
The primary purpose of the third section of the questionnaire was to measure physiological indices. Blood pressure (high and low pressure), SpO2, HR, and ear canal temperature were all averaged three times.
2.3. Measurements
2.3.1. Physiological Measurements
The main physiological parameters collected during the experiment were blood pressure (SBP and DBP), HR, SpO2, and ear canal temperature. Blood pressure and HR were measured using a smart bracelet (OMRON HEM-7211). The researcher wrapped the cuff of the sphygmomanometer around the upper arm of the volunteer at the level of the heart. The volunteers needed to sit up straight and relax during the measurement, and the measurement could be completed approximately40 s after the start of the pressure. The researchers were responsible for reading SBP, DBP, and pulse rate data. SpO2 is an important physiological parameter of the respiratory cycle, representing the oxygen-carrying capacity of hemoglobin, and was detected by an oximeter (PHILIPS DB12). The researcher was responsible for clamping the pulse oximeter to the tip of the volunteer’s forefinger and reading the oxygen data after approximately 6–8 s. We determined the ear canal temperature using an infrared ear thermometer (Thermo Scan*Infrared Ear Thermometer IRT6520, Kaz Europe Sàrl, Mexico). The researcher first set the instrument to the elderly use stage, and then used the thermometer head to measure the infrared heat emitted by the cochlea and surrounding tissues to obtain a temperature reading of the ear canal. Although many studies have demonstrated that measuring human body temperature through the rectum is the most accurate [38,39], applying this type of assessment is challenging. On the other hand, numerous thermal comfort studies have shown that the ear canal temperature can correctly reflect changes in the human body temperature [40,41]. Therefore, the ear canal temperature was used to measure human body temperature in this experiment (Table 2).
Table 2.
Instruments information.
2.3.2. Meteorological Measurements
Meteorological data were obtained through field measurements correspondingly with questionnaires. All instruments were set to record data every minute and were uniformly installed at a height of 1.1 m above the ground. Daily measurements were taken from 9:30 to 17:00. Air temperature (Ta), relative humidity (RH), wind speed (Va), solar radiation (G), and black globe temperature (Tg) were measured in the field. Ta and RH were recorded using a HOBO onset U23-001 logger (ONSET, Bourne, MA, USA) placed in a solar radiation shield. Va was monitored using a Kestrel 5500 (Nielsen-kellerman Co., Boothwyn, PA, USA). Tg was recorded by a Delta OHM HD 2107.2 (Delta OHM, Milan, Italy) and G was measured by an automatic solar radiation logger (JTR05, Jinan, China). The mean radiation temperature (Tmrt) was calculated according to the ISO7726 standard [42] (Table 2).
where D is the globe diameter (D = 0.05 m) and ε is the emissivity (ε = 0.95).
2.4. Thermal Indices and Statistical Analysis
PET was selected as the thermal environment evaluation index for this study because it allows for a comparative assessment of thermal comfort in various environments [43]. In addition, it has the advantages of not relying on subjective evaluation results, being simple to understand, and not being limited by climatic type area. In this study, Ta, RH, Va, Tmrt, and respondents’ attributes (height, weight, age, gender, clothing insulation, and metabolic rate) were input into the Rayman model to calculate the PET [44].
A series of data analyses were performed using SPSS 20.0 software based on the volunteer information collected from the meteorological data measured in the field and from the questionnaire.
3. Results
3.1. Descriptive Analysis
3.1.1. Attributes of Volunteers
Volunteers were recruited based on the following criteria: 60 years old or above, free of chronic and psychological diseases such as dementia, cognitive disorder, depressive disorder, and anxiety disorder, and possessing clear verbal and cognitive abilities to understand the questionnaire correctly and complete the experiment independently [29] (Table 3). All volunteers had lived in the local area for more than one year, were familiar with the local climate, could choose appropriate clothing based on the weather conditions, and could objectively evaluate the outdoor thermal environment.
Table 3.
Respondents’ attribute.
We also explored the relationship between individual factors and thermal sensation using logistic regression. The results showed that gender, age, and BMI had no significant effect on thermal sensation and only clothing insulation (estimate = −4.926, p < 0.005) had a statistically significant difference on thermal comfort (Table 4).
Table 4.
Ordinal logistic regression model regression estimates.
3.1.2. Meteorological Parameters
The OS space had the highest mean Ta (33.8 °C) whereas the PA space had the lowest mean Ta (31.7 °C), which was consistent with the classification of SVF. The PA space had the lowest fluctuation in mean Ta, primarily because the sunlight was covered by the building directly above this space and the trees around the area; hence, this space was minimally affected by sunlight. OS and TS spaces had equal mean Ta variation, which was slightly larger than the PA space. Both OS and TS spaces were open, and the temperature increased under direct sunlight, mostly because neither space was affected by building shade, but reduced when solar radiation decreased. Therefore, the daily temperature variation in OS and TS spaces was greater than in the PA space (Table 5).
Table 5.
Meteorological variables among spaces.
The mean RH was highest in the PA space, whereas it was lowest in the OS space. This difference was the result of the spatial characteristics. The PA space was surrounded by plants, which produced a large amount of water vapor through transpiration, and the low SVF reduced the direct solar radiation, hence lowering water vapor loss. It was noteworthy that, although the WS space was close to the water, this open space was not shaded by trees or buildings, and was exposed to strong solar radiation and wind. Therefore, the mean RH of the WS space was slightly lower than that of the TS space, indicating that the humidification effect of water in this area was insignificant during the summer (Table 5).
The TS and OS spaces had the highest mean Va, which was related to their spatial characteristics. Both spaces had narrow exposed spaces that form ventilation corridors. The PA space had the lowest mean Va, which we attribute to the shading of the surrounding vegetation and poor ventilation (Table 5).
The mean Tg for each space was similar to the mean Ta. The mean Tg was highest in the OS space with the highest SVF. The mean Tg of the semi-shade TS space was greater than that of the PA space, which was due to the PA space receiving more ground long-wave radiation than the TS space during direct sunlight. The PA space had the lowest mean Tg as a result of the intense shadows of the building and surrounding vegetation (Table 5).
The highest mean G value was found in the OS space whereas the lowest was found in the PA space, indicating that the OS space receives more radiation, which is related to the different spatial characteristics (Table 5).
The ANOVA results show significant differences in meteorological variables among all three spaces (Table 6). The differences in meteorological variables between the three spaces suggest that a series of interactions may occur between different spatial patterns under meteorological conditions such as shading, ventilation, short-wave, and long-wave radiation [14].
Table 6.
Analysis of variance (ANOVA) for meteorological variables.
3.2. TSV and TCV
3.2.1. TSV
During the experiment, we measured the TSV before and after three horticultural activities (flower arrangement (FoA), transplanting and planting (TaP), and laying crushed stone (LcS)), and the seasonal characteristics of summer resulted in a TSV distribution dominated by “neutral” (TSV = 0), “slightly warm” (TSV = 1), “warm” (TSV = 2), and “hot” (TSV = 3) (Figure 4).
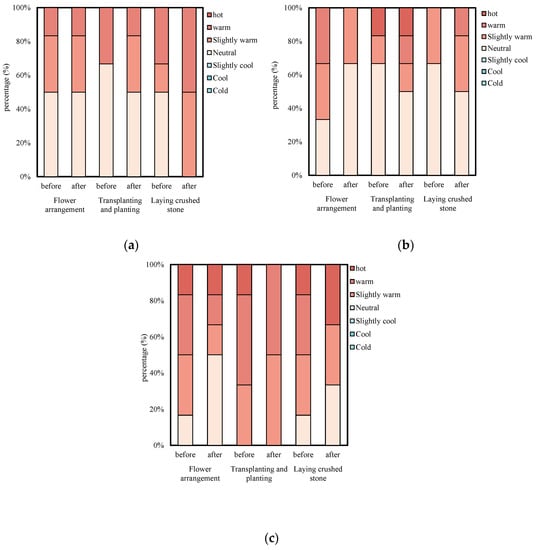
Figure 4.
Percentage change of TSV before and after horticultural activities ((a) PA, (b) TS, and (c) OS).
In the first phase of the experiment (before horticultural activities), the TSVs of the three horticultural activities were similar in the PA and TS spaces, mostly concentrated in “neutral” (TSV = 0). However, the OS space was significantly different from the other two spaces, with volunteers in OS space considering “slightly warm” and “warm” as having the highest proportion. In OS space, volunteers of flower arrangement and laying crushed stone events generally rated "slightly warm" and "warm" the highest, both at 33%, and volunteers of transplanting and planting activities had the highest percentage of “warm”, followed by “slightly warm” (Figure 4). In the second phase of the experiment (after horticultural activities), the TSVs of flower arrangement activities in PA, TS, and OS spaces were similar, mostly distributed in “neutral”; the TSV distribution difference of transplanting and planting activities in the PA space and TS space was not significant, and mostly distributed in “neutral”, whereas most of the volunteers in the OS space considered the highest percentage of “slightly warm” and “warm” as being 50%.The highest percentage of the TSV for laying crushed stone in both the TS and OS spaces was “neutral”, followed by “slightly warm” (Figure 4).
The TSV ratios changed before and after horticultural activities for different activity levels and spaces. There was no significant change in the TSV in the PA space during low-intensity horticultural activities, whereas TSVs in the TS and OS spaces changed similarly, with both “neutral” proportions increasing by 33.33% and “slightly warm” and “warm” proportions decreasing. At moderate intensity, the proportions of “hot” and “neutral” decreased by 16.67% in both OS and TS spaces, whereas the proportions of “slightly warm” and “warm” corresponding to the TSV votes increased by 16.67%. Under the vigorous-intensity horticultural activities, the proportions of “neutral” in the PA and TS spaces decreased by 50 and 16.67%, respectively, whereas the proportion of “neutral” and “hot” in the OS space both increased by 16.67%, and the corresponding proportion of “warm” increased by 33.33% (Figure 5).
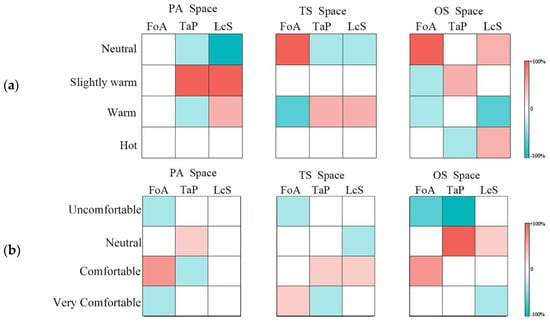
Figure 5.
TSV and TCV changes after three space horticultural activities ((a) TSV and (b) TCV).
3.2.2. TCV
We measured TCVs before and after the three horticultural activities during the experiment, and the results indicated that the distribution of TCVs was mainly concentrated in “uncomfortable”, “neutral”, “comfortable”, and “very comfortable” (Figure 6).
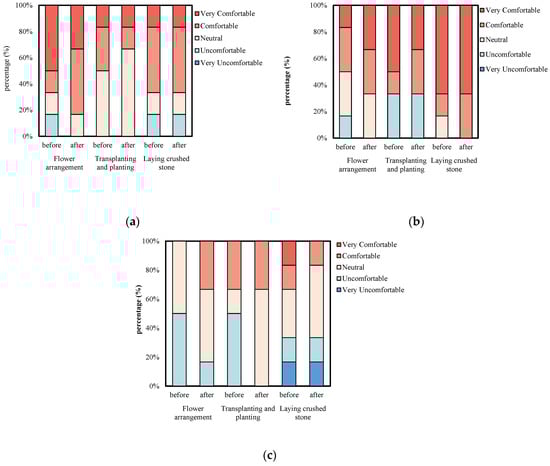
Figure 6.
Percentage change of TCV before and after horticultural activities (a) PA, (b) TS, and (c) OS.
In the first phase of the experiment, among the three horticultural activities in the PA space, the elderly had the highest proportion of “neutral” in flower arrangement and transplanting and planting, and the highest proportion of “comfortable” in laying crushed stone. In the TS space, the elderly had the highest proportion of “neutral” in flower arrangement, with a higher comfort level in laying crushed stone, where“very comfortable” was 66.67%, and the highest percentage of “uncomfortable” was in the transplanting and planting.
In the second phase of the experiment, flower arrangement and laying crushed stone activities in the PA space produced the highest percentage of “comfortable”, followed by “neutral”, while the highest percentage of “neutral” was found in transplanting and planting. Flower arrangement and laying the crushed stone in the TS space had higher comfort levels, where the percentage of “comfortable” and “very comfortable” was the highest, while the comfort level in transplanting and planting activities was significantly different from the other two horticultural activities, with the highest percentage of “uncomfortable”; the three horticultural activities conducted in the OS space had similar and highest percentages of “neutral”.
There were significant differences in TCV proportions between activity levels and spaces before and after horticultural activities. In the low-intensity activity, the proportion of “uncomfortable” significantly decreased in all three spaces, whereas the proportions of “comfortable” and “very comfortable” increased significantly; at the moderate horticultural activity, the comfort level of PA, TS, and OS spaces was closer to “neutral”, and the proportion increased by 50%; at the vigorous intensity, the comfort level of the PA space did not change, whereas the comfort level of the TS space increased significantly, with the proportion of “comfortable” increasing significantly by 16.67%, while the comfort level of the OS space displayed the opposite situation, with the proportion of “very comfortable” decreasing by 16.67%.
3.3. NPET and NPETR
The neutral temperature is the optimal temperature at which people feel neither cold nor hot in the environment [45]. A common definition method of neural temperature is to fit a linear regression line. In other words, the mean TSV (MTSV) is calculated for every 1 °C and then fitted to the linear model [46].To avoid outliers, we set a minimum sample size of two responses in each PET bin; that is, if there is only one vote in a PET bin, it could perhaps not be representative for that particular bin and should thus be excluded. The slopes before and after flower arrangement as well as transplanting and planting both decreased significantly, whereas the effect of laying crushed stone was opposite. The preceding analysis demonstrated that the sensitivity of volunteers to thermal response changes decreased after horticultural activities in general, and the slope decreased after flower arrangement as well as transplanting and planting, indicating that the sensitivity of the elderly to PET decreased after flower arrangement and transplanting and planting; however, it increased after laying crushed stone (Figure 7).
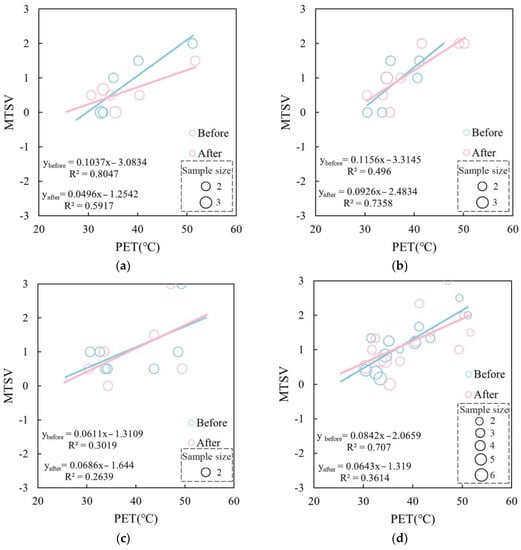
Figure 7.
Correlations between PET and mean TSV at different horticultural activities (flower arrangement (a), transplanting and planting (b), laying crushed stone (c), and total (d)).
The PET at MTSV = 0 is defined as NPET, and the temperature range of the regression model when MTSV is between −0.5 and +0.5 is denoted by NPETR [47]. The activity level showed a negative correlation with neutral temperature, and the NPET generally decreased whereas the NPETR range increased after flower arrangement as well as transplanting and planting; however, laying crushed stone demonstrated the opposite pattern (Table 7).
Table 7.
PET and MTSV equation analyses (BH: before horticulture; AH: after horticulture).
Table 8 shows a clear linear relationship between the MTSV and PET (before horticultural activity: R2 = 0.707; after horticultural activity:R2 = 0.3614). The fitted linear equations indicated a significant increase in MTSV values after horticultural activity for the same PET values during the experiment. As PET increased, MTSVAH gradually approached MTSVBH within a certain range. When PET = 37.53 °C, MTSVAH = MTSVBH.
Table 8.
NPET and NPETR at different horticultural activities.
3.4. Physiological Responses
3.4.1. Physiological Parameters
Based on the measurements, the HR ranged from 52–100 bpm and the ear canal temperature ranged from 35.67–37.4 °C. Under normal conditions, HR fluctuations are no more than 100 bpm and ear canal temperature fluctuations do not usually exceed approximately 1 °C [48]. Therefore, the relative changes in HR and ear canal temperature as mean values were analyzed.
The physiological indicators remained constant before and after the low-intensity horticultural activity (flower arrangement). However, before and after moderate and vigorous intensity horticultural activities (transplanting and planting; laying crushed stone), there were significant differences in SBP, DBP, HR, and SpO2. HR changes were similar to the tendency in systolic blood pressure and SpO2, suggesting that changes in blood pressure (SBP and DBP), HR, and SpO2 were related to the intensity of horticultural activities. Ear canal temperatures, although not statistically different, generally increased with an increasing intensity of horticultural activity (Table 9).
Table 9.
Significance coefficients for paired-sample t-tests of physiological parameters before and after horticultural activities.
Among all three activity levels, SBP and DBP showed a decrease in low-intensity horticultural activities. In both TS and OS spaces, the ΔSBP for moderate and vigorous intensity horticultural activities increased with increasing intensities, whereas the mean ΔSBP value in the PA space was nearly constant. The mean SBP values were generally greater in the TS space than in the PA space at three horticultural levels, and the ΔSBP in the low-intensity horticultural activity was −4.11 mmHg, with a significant decrease in blood pressure, indicating that plant shade space can effectively reduce the change in diastolic blood pressure during low-intensity activities in the PA space; meanwhile, the variation in ΔDBP across spaces was small. The HR changes were similar (almost no change) in various spaces under low-intensity horticultural activities, and the mean ΔHR in the PA space was the smallest under moderate and vigorous intensity horticultural activities. Moreover, the OS space had the highest mean ΔHR, which may be related to the changes in solar radiation during the experiment. The variation inΔSpO2 was similar across spaces, regardless of the intensity, the mean ΔSpO2 always remained OS space > TS space > PA space. However, the Δear canal temperature hardly changed (Figure 8).
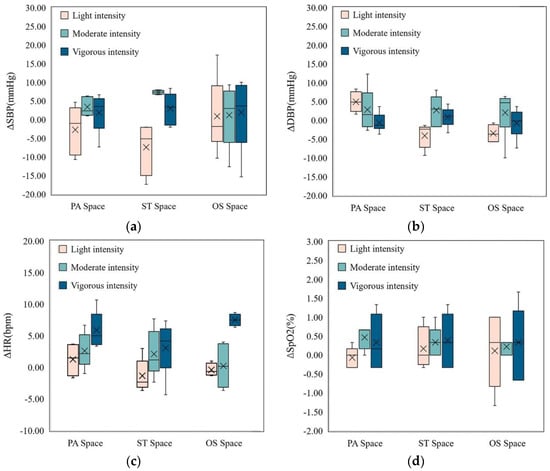
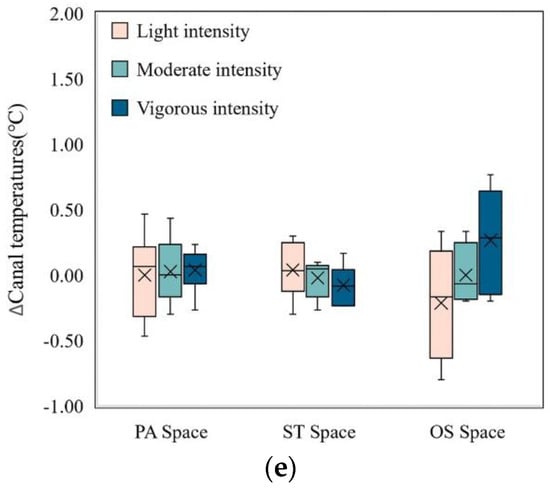
Figure 8.
Box plots of ΔSBP, ΔDBP, and ΔHR among spaces (ΔSBP (a), ΔDBP (b), ΔHR (c), ΔSpO2 (d), and ΔEar canal temperatures (e)).
3.4.2. Physiology and Metabolic Rate
We analyzed the physiological indices before and after three-intensity horticultural activities by a paired samples t-test and found no statistically significant differences in any of the physiological indices at low-intensity horticultural activities, with significant differences in SBP, DBP, SpO2, and HR at moderate to vigorous intensity horticultural activities, which indicated that the changes in SBP, DBP, SpO2, and HR correlated with the intensities of the activities. Nevertheless, there was no significant difference in ear canal temperature (Table 10).
Table 10.
Correlation analysis between physiological parameters and thermal indices.
The relationship between the differences in SBP, DBP, SpO2, HR, and metabolic rate was compared for each participant before and after three activity intensities (Figure 9). ΔSBP and ΔHR increased with an increasing metabolic rate, whereas ΔDBP and ΔSpO2 remained essentially constant. This indicates that the SBP and HR rise with increasing activity levels, whereasSpO2 and DBP do not. As the intensity of the load increases, both the metabolic demand and oxygen uptake increase, resulting in a faster HR and increased blood output, as well as systolic blood pressure [31]. The high slopes of ΔSBP and ΔHR indicate that the changes in HR and diastolic blood pressure reflect metabolic changes and are both positively correlated with metabolism.
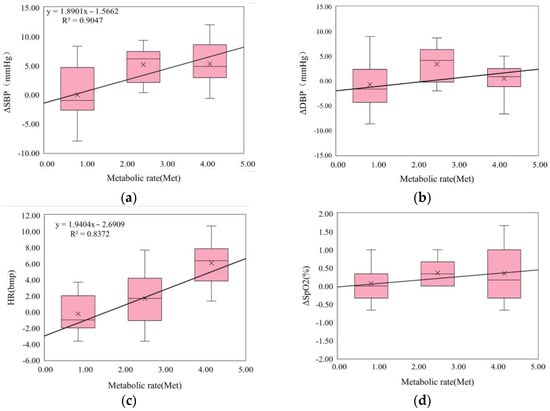
Figure 9.
ΔSBP, ΔDBP,ΔHR, and ΔSpO2 in relation to metabolic rates (ΔSBP (a), ΔDBP (b), ΔHR (c), and ΔSpO2 (d)).
3.5. Relationship between Physiological Parameters and Thermal Comfort
In order to observe the predictive ability of physiological parameters on thermal comfort, we first performed a statistical analysis of physiological indices with a TSV and TCV and found that most physiological parameters were not significant in predicting TCV [49], and we also made a linear plot of HR versus TSV, which showed a good fit of HR with the TSV (R2 = 0.5052) (Figure 10). This indicates that the TSV and TCV are two distinct outdoor thermal comfort dimensions that are predicted by multiple physiological factors and may have excessive individual differences with a limited sample size.
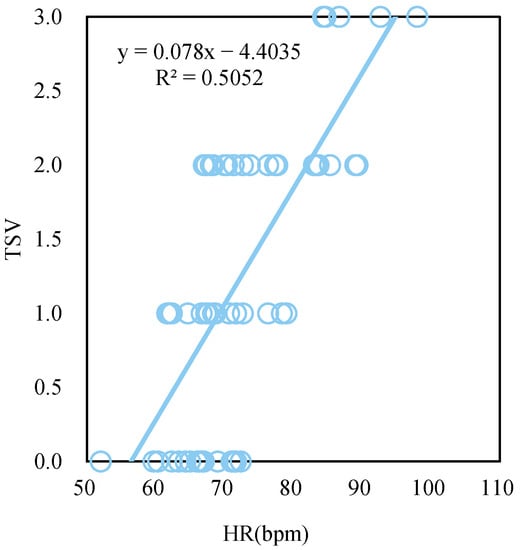
Figure 10.
Relationships between TSV and HR.
HR is the number of heart beats per minute and is also widely used in thermal comfort studies [40,41,49]. Therefore, we calculated the MTSV corresponding to the HR per 1 bmp interval and performed a linear regression between HR and MTSV for horticultural activities at low, moderate, and vigorous intensity levels (Figure 11). The slopes of the regressions were higher after the horticultural activity than before, where the HR was the same before and after horticultural activities at low, moderate, and vigorous intensity levels, indicating that the TSV after horticultural activity was overall higher than the TSV before horticultural activity. It is worth noting that the TSV before and after horticultural activity changed relatively little at low-intensity to moderate-intensity horticultural activity levels, whereas the TSV before and after horticultural activity changed significantly at vigorous intensity levels.
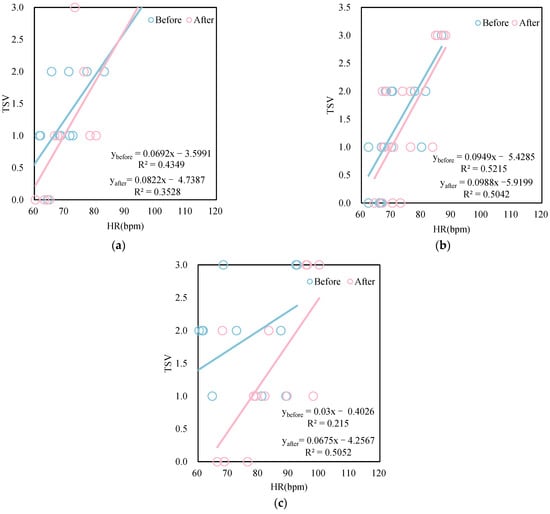
Figure 11.
Relationships between HR and MTSV (light (a), moderate (b), and vigorous (c) intensities).
We analyzed the correlation between PET and physiological indices, and the results revealed that both physiological indices, HR and SpO2, were significantly correlated with PET and that the effect of PET on this was positive (Table 10). Therefore, we believe that increasing PET values increases physiological indices of horticultural activity. Therefore, it is necessary to regulate the thermal indices of the outdoor activity environment to ensure the safety of horticultural activities.
4. Discussion
4.1. Physiological and Thermal Responses
Horticultural activities significantly affected systolic and diastolic blood pressure. Moreover, the elderly demonstrated a general trend of decreasing systolic and diastolic blood pressure and increasing comfort after flower arrangement, as well as transplanting and planting, which was consistent with the former findings that both systolic and diastolic blood pressure decreased after transplanting [50]. In addition, a previous investigation of the physiological response of young individuals to a green environment is supported by the current results [51]. Moreover, it was observed that systolic blood pressure was significantly lower with low-intensity to moderate intensity exercise in the elderly [52]. Blood pressure is considered to be a major indicator of autonomic nervous system activation, and reductions in systolic and diastolic blood pressure indicate that the elderly are in a relaxed and less stressed state after low-intensity to moderate-intensity horticultural activities. This is similar to previous findings suggesting that transplanting and flower arrangement can be effective in relieving stress [53,54].
It was concluded that there were disparities in the changes in several physiological indices before and after horticultural activities, and the HR better reflected the changes in the metabolic rate and thermal response in the elderly. We deduced that there is a significant correlation between HR and TSV, whereas there is no statistically significant difference between ear canal temperature and TSV. Previous studies have also confirmed that HR can accurately reflect changes in thermal response and is one of the alternative indices of exercise [55,56]. Among these physiological indices, changes in HR were transient and occurred immediately after the onset of activity; however, changes in ear canal temperature were delayed [41]. Therefore, this study suggested that HR variations were a better indicator of changes in the human metabolic rate in the elderly before and after horticultural activities rather than ear canal temperature.
4.2. Bioclimatic Design Recommendations
Our findings have implications for the design of outdoor spaces in parks in humid subtropical cities. The design can improve the outdoor thermal environment, change the properties of public spaces, and consequently enhance the thermal comfort of residents. The design is generally optimized through buildings, green vegetation, substrate materials, and water bodies to improve the safety, comfort, and attractiveness of cities in the hot summer [56,57,58].
Our results show that, in hot summer, the OS space with the highest Ta, Tg, G and Tmrt and the lowest RH in high SVF was more likely to have a lower comfort level and a greater thermal response, in addition to being more susceptible to thermal risk. We can install removable awnings, sprinkler irrigation facilities, and deciduous trees to regulate the thermal environment, add sprinkler irrigation facilities to the surrounding grass to achieve cooling and humidifying effects, and replace tall deciduous trees to meet the shade needs of residents. The best choice for humid subtropical cities is deciduous shade because it satisfies both the shade needs of residents in summer and the demand for sunlight in winter, while the vegetation can be used to positively impact the surrounding thermal environment by shading, reflecting short-wave radiation, and transpiration [59,60]. Several studies also clearly indicate that thermal comfort could be improved by 15% through the synergistic cooling effects of trees and sprinklers [61]. This is similar to the results of Martin’s study, which concluded that the combined cooling effect of vegetation and water bodies was obvious (PET is reduced by 7 °C and 2 °C, respectively). Moreover, the cooling effect is intensified when trees are close to water bodies [62]. The PA space was prone to sultry feeling due to the dense planting of trees around the perimeter, resulting in the smallest mean Va in summer, and the perimeter shrubs and evergreen trees should be adequately pruned and deciduous trees should be planted. The semi-shade TS space could be improved by adding structures and sprinklers to increase the thermal environment; for example, adding structures such as corridors covered by deciduous vines. Li et al. compared the shade group, spray group, and shade + spray group, concluding that the combination of shade + spray can reduce the UTCI with maximum efficiency [63] (Table 11; Figure 12).
Table 11.
Bioclimatic design strategies for the three outdoor spaces.
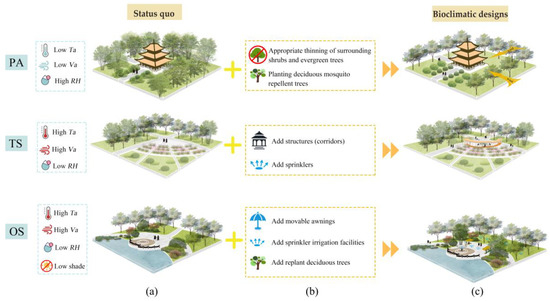
Figure 12.
Bioclimatic design sketches of each space (present situation (a), bioclimatic design strategies (b), and 3D graphs after bioclimatic designs (c)).
Open spaces for physical activity should be designed to facilitate a thermal environment for the activity. People need a cool environment for moderate and vigorous-intensity activities. For the design of outdoor spaces suitable for vigorous-intensity activities, such as semi-open squares, appropriate shade and sprinklers can be added to reduce Ta [64]. The semi-shade TS space can generally accommodate activities of different intensities; nevertheless, their design should pay attention to the openness of the space to ensure ventilation and shade.
4.3. Limitations
Our research has some limitations. First, we focused on healthy elderly adults and did not account for specific elderly groups (elderly people with hypertension or asthma). Second, horticultural activities selected in our experiment were typical, and future studies can explore more sorts of horticultural activities in depth. Third, our study recommended some qualitative bioclimatic design strategies for the measured open spaces, numerical studies are needed to evaluate their suitability. Fourth, future studies could investigate the physiological and thermal comfort differences of the elderly at different ages, combining EEG, skin temperature, and other physiological indices to accurately predict thermal responses for the elderly.
5. Conclusions
For this study, fifty-four volunteers were recruited to participate in horticultural activities of different intensities in three typical open spaces in Xi’an, a cold region of China. Volunteers were asked to measure physiological parameters and fill out subjective thermal response questionnaires while conducting on-site meteorological measurements. Our results show the physiological responses and thermal comfort of the elderly at different levels of horticultural activities in outdoor spaces. The following are the main conclusions:
- (1)
- Changes in the proportions of the TSV and TCV before and after activity were related to spatial characteristics and metabolic levels of outdoor activities in summer. The OS space had a significantly higher discomfort and TSV after vigorous-intensity horticultural activity due to high Ta and G (the proportion of “warm” increased by 33.33% and the proportion of “very comfortable” decreased by 16.67%); whereas the TS space showed little change in thermal responses before and after horticultural activities at three levels.
- (2)
- Before and after the low-intensity horticultural activity (flower arrangement), the physiological indices remained constant. However, there were significant differences in SBP, DBP, HR, and SpO2 before and after moderate and vigorous-intensity horticultural activities (transplanting and planting; laying crushed stone).
- (3)
- HR and diastolic blood pressure can reflect the changes in metabolic rate in the elderly. As the metabolic rate gradually increased, the HR and diastolic blood pressure both increased.
- (4)
- During horticultural activities, the neutral temperature was negatively correlated with the activity intensity, whereas the magnitude of the neutral temperature change was positively correlated with the activity intensity. NPET ranged from 21.45 to 29.73 °C and NPETR from 13.27–29.64 to 24.94–34.56 °C. In addition, the MTSV sensitivity decreased after low-to-moderate-intensity horticultural activities, whereas the opposite occurred after vigorous-intensity horticultural activities.
- (5)
- For the elderly in summer, semi-open spaces (TS spaces) were more suitable for outdoor horticultural activities. However, the PA and OS spaces were only suitable for low-to-moderate-intensity horticultural activities.
Author Contributions
T.Y.: investigation, data curation, writing—original draft. B.H.: conceptualization, methodology, writing—review and editing, supervision. Y.L.: investigation, data curation. Y.W. (Yanbo Wang): investigation, resources. Y.W. (Yayun Wang): investigation. All authors have read and agreed to the published version of the manuscript.
Funding
This research was funded by the National Natural Science Foundation of China (grant number 51708451).
Institutional Review Board Statement
Not applicable.
Informed Consent Statement
Informed consent was obtained from all subjects involved in the study.
Data Availability Statement
The data presented in this study are available on request from the corresponding author upon reasonable request.
Conflicts of Interest
The authors declare no conflict of interest.
Nomenclature
| TSV | Thermal sensation vote | NPET | Neutral PET |
| MTSV | Mean TSV | NPETR | Neutral PET range |
| TCV | Thermal comfort vote | SBP | Systolic blood pressure |
| Ta | Air temperature | DBP | Diastolic blood pressure |
| RH | Relative humidity | HR | Heart rate |
| Va | Wind speed | SpO2 | Blood oxygen saturation |
| G | Global radiation | FoA | Flower arrangement |
| Tg | Globe temperature | TaP | Transplanting and planting |
| Tmrt | Mean radiant temperature | LcS | Laying crushed stone |
| PET | Physiological equivalent temperature |
References
- World Health Organization. Ageing and Health. 2021. Available online: https://www.who.int/news-room/fact-sheets/detail/ageing-and-health (accessed on 24 January 2022).
- United Nations. World Population Ageing. 2017. Available online: https://www.un.org/development/desa/pd/content/world-population-ageing-2017-highlights (accessed on 23 January 2022).
- Egger, G.; Dixon, J. Beyond Obesity and Lifestyle: A Review of 21st Century Chronic Disease Determinants. BioMed Res. Int. 2014, 2014, 731685. [Google Scholar] [CrossRef] [PubMed]
- Srivastava, I.; Thukral, N.; Hasija, Y. Genetics of Human Age Related Disorders. Adv. Gerontol. 2015, 28, 228–247. [Google Scholar] [PubMed]
- Khademi, N.; Babanejad, M.; Asadmobini, A.; Karim, H. The Association of Age and Gender with Risk Factors of Noncommunicable Diseases among Employees in West of Iran. Int. J. Prev. Med. 2017, 8, 9. [Google Scholar] [CrossRef] [PubMed]
- Jaul, E.; Barron, J. Age-Related Diseases and Clinical and Public Health Implications for the 85 Years Old and Over Population. Front. Public Health 2017, 5, 335. [Google Scholar] [CrossRef] [PubMed]
- Lewis, E.D.; Wu, D.; Meydani, S.N. Age-associated alterations in immune function and inflammation. Prog. Neuro-Psychopharmacol. Biol. Psychiatry 2022, 118, 110576. [Google Scholar] [CrossRef] [PubMed]
- Suzman, R.; Beard, J.; Boerma, T.; Chatterji, S. Health in an ageing world—What do we know? Lancet 2015, 385, 484–486. [Google Scholar] [CrossRef]
- World Health Organization. Global Status Report on Noncommunicable Diseases 2010; WHO: Geneva, Switzerland, 2011. Available online: https://apps.who.int/iris/handle/10665/44579 (accessed on 24 January 2022).
- Dahlkvist, E.; Hartig, T.; Nilsson, A.; Högberg, H.; Skovdahl, K.; Engström, M. Garden greenery and the health of older people in residential care facilities: A multi-level cross-sectional study. J. Adv. Nurs. 2016, 72, 2065–2076. [Google Scholar] [CrossRef]
- Berg, M.E.L.V.D.; Winsall, M.; Dyer, S.M.; Breen, F.; Gresham, M.; Crotty, M. Understanding the Barriers and Enablers to Using Outdoor Spaces in Nursing Homes: A Systematic Review. Gerontologist 2020, 60, e254–e269. [Google Scholar] [CrossRef]
- Chodzko-Zajko, W.; Schwingel, A.; Park, C.H. Successful Aging: The Role of Physical Activity. Am. J. Lifestyle Med. 2008, 3, 20–28. [Google Scholar] [CrossRef]
- Ma, X.; Tian, Y.; Du, M.; Hong, B.; Lin, B. How to design comfortable open spaces for the elderly? Implications of their thermal perceptions in an urban park. Sci. Total. Environ. 2021, 768, 144985. [Google Scholar] [CrossRef]
- Mi, J.; Hong, B.; Zhang, T.; Huang, B.; Niu, J. Outdoor thermal benchmarks and their application to climate–responsive designs of residential open spaces in a cold region of China. Build. Environ. 2020, 169, 106592. [Google Scholar] [CrossRef]
- Niu, J.; Xiong, J.; Qin, H.; Hu, J.; Deng, J.; Han, G.; Yan, J. Influence of thermal comfort of green spaces on physical activity: Empirical study in an urban park in Chongqing, China. Build. Environ. 2022, 219, 109168. [Google Scholar] [CrossRef]
- Gardener, M.A.; de Oliveira, F.L. Urban environment cues for health and well-being in the elderly. Cities Health 2020, 4, 117–134. [Google Scholar] [CrossRef]
- Powell, L.; Felce, D.; Jenkins, J.; Lunt, B. Increasing engagement in a home for the elderly by providing an indoor gardening activity. Behav. Res. Ther. 1979, 17, 127–135. [Google Scholar] [CrossRef] [PubMed]
- Machida, D. Relationship between Community or Home Gardening and Health of the Elderly: A Web-Based Cross-Sectional Survey in Japan. Int. J. Environ. Res. Public Health 2019, 16, 1389. [Google Scholar] [CrossRef]
- Veldheer, S.; Tuan, W.-J.; Al-Shaar, L.; Wadsworth, M.; Sinoway, L.; Schmitz, K.H.; Sciamanna, C.; Gao, X. Gardening Is Associated with Better Cardiovascular Health Status Among Older Adults in the United States: Analysis of the 2019 Behavioral Risk Factor Surveillance System Survey. J. Acad. Nutr. Diet 2022. [Google Scholar] [CrossRef]
- Detweiler, M.B.; Sharma, T.; Detweiler, J.G.; Murphy, P.F.; Lane, S.; Carman, J.; Chudhary, A.S.; Halling, M.H.; Kim, K.Y. What Is the Evidence to Support the Use of Therapeutic Gardens for the Elderly? Psychiatry Investig. 2012, 9, 100–110. [Google Scholar] [CrossRef]
- Park, S.-A.; Lee, A.-Y.; Park, H.-G.; Lee, W.-L. Benefits of Gardening Activities for Cognitive Function According to Measurement of Brain Nerve Growth Factor Levels. Int. J. Environ. Res. Public Health 2019, 16, 760. [Google Scholar] [CrossRef]
- Chu, H.-Y.; Chan, H.-S.; Chen, M.-F. Effects of Horticultural Activities on Attitudes toward Aging, Sense of Hope and Hand–Eye Coordination in Older Adults in Residential Care Facilities. Int. J. Environ. Res. Public Health 2021, 18, 6555. [Google Scholar] [CrossRef] [PubMed]
- Ainamani, H.E.; Gumisiriza, N.; Bamwerinde, W.M.; Rukundo, G.Z. Gardening activity and its relationship to mental health: Understudied and untapped in low-and middle-income countries. Prev. Med. Rep. 2022, 29, 101946. [Google Scholar] [CrossRef] [PubMed]
- Zhao, X.; Yu, J.; Liu, N. Relationship between specific leisure activities and successful aging among older adults. J. Exerc. Sci. Fit. 2023, 21, 111–118. [Google Scholar] [CrossRef] [PubMed]
- Park, S.-A.; Lee, A.-Y.; Park, H.-G.; Son, K.-C.; Kim, D.S.; Lee, W.L. Gardening Intervention as a Low- to Moderate-Intensity Physical Activity for Improving Blood Lipid Profiles, Blood Pressure, Inflammation, and Oxidative Stress in Women over the Age of 70: A Pilot Study. HortScience 2017, 52, 200–205. [Google Scholar] [CrossRef]
- Daffu, G.; Del Pozo, C.H.; O’Shea, K.M.; Ananthakrishnan, R.; Ramasamy, R.; Schmidt, A.M. Radical Roles for RAGE in the Pathogenesis of Oxidative Stress in Cardiovascular Diseases and Beyond. Int. J. Mol. Sci. 2013, 14, 19891–19910. [Google Scholar] [CrossRef]
- Tu, P.-C.; Cheng, W.-C.; Hou, P.-C.; Chang, Y.-S. Effects of Types of Horticultural Activity on the Physical and Mental State of Elderly Individuals. Int. J. Environ. Res. Public Health 2020, 17, 5225. [Google Scholar] [CrossRef]
- Yamane, K.; Kawashima, M.; Fujishige, N.; Yoshida, M. Effects of Interior Horticultural Activities with Potted Plants on Human Physiological and Emotional Status. ActaHortic 2004, 639, 37–43. [Google Scholar] [CrossRef]
- Kim, S.-O.; Pyun, S.-B.; Park, S.-A. Improved Cognitive Function and Emotional Condition Measured Using Electroencephalography in the Elderly during Horticultural Activities. Hortscience 2021, 56, 985–994. [Google Scholar] [CrossRef]
- Park, S.-A.; Lee, J.-Y.; Lee, K.-S.; Son, K.-C. Metabolic Costs of Daily Activities in Community-Dwelling Older Adults. Int. J. Gerontol. 2014, 8, 228–229. [Google Scholar] [CrossRef]
- Zhang, Y.; Zhou, X.; Zheng, Z.; Oladokun, M.O.; Fang, Z. Experimental investigation into the effects of different metabolic rates of body movement on thermal comfort. Build. Environ. 2020, 168, 106489. [Google Scholar] [CrossRef]
- He, B.-J.; Zhao, D.; Dong, X.; Xiong, K.; Feng, C.; Qi, Q.; Darko, A.; Sharifi, A.; Pathak, M. Perception, physiological and psychological impacts, adaptive awareness and knowledge, and climate justice under urban heat: A study in extremely hot-humid Chongqing, China. Sustain. Cities Soc. 2022, 79, 103685. [Google Scholar] [CrossRef]
- Peel, M.C.; Finlayson, B.L.; McMahon, T.A. Updated world map of the Köppen-Geiger climate classification. Hydrol. Earth Syst. Sci. 2007, 11, 1633–1644. [Google Scholar] [CrossRef]
- Tian, Y.; Hong, B.; Zhang, Z.; Wu, S.; Yuan, T. Factors influencing resident and tourist outdoor thermal comfort: A comparative study in China’s cold region. Sci. Total Environ. 2022, 808, 152079. [Google Scholar] [CrossRef]
- Park, S.-A.; Lee, K.-S.; Son, K.-C.; Shoemaker, C. Metabolic Cost of Horticulture Activities in Older Adults. J. Jpn. Soc. Hortic. Sci. 2012, 81, 295–299. [Google Scholar] [CrossRef]
- Park, S.-A.; Lee, K.-S.; Son, K.-C. Determining Exercise Intensities of Gardening Tasks as a Physical Activity Using Metabolic Equivalents in Older Adults. Hortscience 2011, 46, 1706–1710. [Google Scholar] [CrossRef]
- American National Standards Institute. Thermal Environmental Conditions for Human Occupancy. In ANSI/ASHRAE Standard; American National Standards Institute: Atlanta, GA, USA, 2017. [Google Scholar]
- Modell, J.G.; Katholi, C.R.; Kumaramangalam, S.M.; Hudson, E.C.; Graham, D. Unreliability of the Infrared Tympanic Thermometer in Clinical Practice. South. Med. J. 1998, 91, 649–654. [Google Scholar] [CrossRef] [PubMed]
- Greenleaf, J.E.; Castle, B.L. External auditory canal temperature as an estimate of core temperature. J. Appl. Physiol. 1972, 32, 194–198. [Google Scholar] [CrossRef]
- Hu, S.; He, M.; Zhang, X.; Guan, H.; Song, P.; Liu, R.; Liu, G. Cold and hot step-changes affecting thermal comfort and physiological indicators in winter. Energy Build. 2021, 254, 111587. [Google Scholar] [CrossRef]
- Tang, T.; Zhou, X.; Zhang, Y.; Feng, X.; Liu, W.; Fang, Z.; Zheng, Z. Investigation into the thermal comfort and physiological adaptability of outdoor physical training in college students. Sci. Total. Environ. 2022, 839, 155979. [Google Scholar] [CrossRef]
- ISO. International Standard 7726, Thermal Environment—Instruments and Methodfor Measuring Physical Quantities; International Standard Organization: Geneva, Switzerland, 1998. [Google Scholar]
- Potchter, O.; Cohen, P.; Lin, T.-P.; Matzarakis, A. Outdoor human thermal perception in various climates: A comprehensive review of approaches, methods and quantification. Sci. Total Environ. 2018, 631–632, 390–406. [Google Scholar] [CrossRef] [PubMed]
- Matzarakis, A.; Rutz, F.; Mayer, H. Modelling radiation fluxes in simple and complex environments—Application of the RayMan model. Int. J. Biometeorol. 2007, 51, 323–334. [Google Scholar] [CrossRef]
- Fanger, P.O. Thermal Comfort Analysis and Applications in Environment Engeering; McGraw-Hill: New York, NY, USA, 1972. [Google Scholar] [CrossRef]
- de Dear, R.; Fountain, M. Field Experiments on Occupant Comfort and Office Thermal Environment in a Hot-Humid Climate. ASHRAE Trans. 1994, 100, 457–474. [Google Scholar]
- Cheung, P.K.; Jim, C. Determination and application of outdoor thermal benchmarks. Build. Environ. 2017, 123, 333–350. [Google Scholar] [CrossRef]
- Fang, Z.; Liu, H.; Li, B.; Du, X.; Baldwin, A. Investigation of the effects of temperature for supplied air from a personal nozzle system on thermal comfort of air travelers. Build. Environ. 2017, 126, 82–97. [Google Scholar] [CrossRef]
- Lam, C.K.C.; Hang, J.; Zhang, D.; Wang, Q.; Ren, M.; Huang, C. Effects of short-term physiological and psychological adaptation on summer thermal comfort of outdoor exercising people in China. Build. Environ. 2021, 198, 107877. [Google Scholar] [CrossRef]
- Hassan, A.; Qibing, C.; Tao, J. Physiological and psychological effects of gardening activity in older adults. Geriatr. Gerontol. Int. 2018, 18, 1147–1152. [Google Scholar] [CrossRef]
- Lee, J.; Park, B.-J.; Tsunetsugu, Y.; Kagawa, T.; Miyazaki, Y. Restorative effects of viewing real forest landscapes, based on a comparison with urban landscapes. Scand. J. For. Res. 2009, 24, 227–234. [Google Scholar] [CrossRef]
- Cornelissen, V.A.; Arnout, J.; Holvoet, P.; Fagard, R.H. Influence of exercise at lower and higher intensity on blood pressure and cardiovascular risk factors at older age. J. Hypertens. 2009, 27, 753–762. [Google Scholar] [CrossRef]
- Lee, M.-S.; Lee, J.; Park, B.-J.; Miyazaki, Y. Interaction with indoor plants may reduce psychological and physiological stress by suppressing autonomic nervous system activity in young adults: A randomized crossover study. J. Physiol. Anthr. 2015, 34, 21. [Google Scholar] [CrossRef]
- Tao, J.; Hassan, A.; Qibing, C.; Yinggao, L.; Li, G.; Jiang, M.; Li, D.; Nian, L.; Bing-Yang, L.; Ziqin, Z. Psychological and Physiological Relaxation Induced by Nature-Working with Ornamental Plants. Discret. Dyn. Nat. Soc. 2020, 2020, 6784512. [Google Scholar] [CrossRef]
- Sadeghi, N.; Tolide-Ie, H.; Ghaderi, F. The relationship between heart rate as an indicator of work hardness and results of dynamometry. Work 2012, 41, 5677–5680. [Google Scholar] [CrossRef] [PubMed]
- Niu, J.; Hong, B.; Geng, Y.; Mi, J.; He, J. Summertime physiological and thermal responses among activity levels in campus outdoor spaces in a humid subtropical city. Sci. Total Environ. 2020, 728, 138757. [Google Scholar] [CrossRef] [PubMed]
- Santamouris, M.; Gaitani, N.; Spanou, A.; Saliari, M.; Giannopoulou, K.; Vasilakopoulou, K.; Kardomateas, T. Using cool paving materials to improve microclimate of urban areas—Design realization and results of the flisvos project. Build. Environ. 2012, 53, 128–136. [Google Scholar] [CrossRef]
- Yang, Y.; Zhou, D.; Wang, Y.; Meng, X.; Gu, Z.; Xu, D.; Han, X. Planning method of centralized greening in high-rise residential blocks based on improvement of thermal comfort in summer. Sustain. Cities Soc. 2022, 80, 103802. [Google Scholar] [CrossRef]
- Zölch, T.; Maderspacher, J.; Wamsler, C.; Pauleit, S. Using green infrastructure for urban climate-proofing: An evaluation of heat mitigation measures at the micro-scale. Urban For. Urban Green 2016, 20, 305–316. [Google Scholar] [CrossRef]
- Chun, B.; Guldmann, J.-M. Impact of greening on the urban heat island: Seasonal variations and mitigation strategies. Comput. Environ. Urban Syst. 2018, 71, 165–176. [Google Scholar] [CrossRef]
- Tseliou, A.; Koletsis, I.; Pantavou, K.; Thoma, E.; Lykoudis, S.; Tsiros, I. Evaluating the effects of different mitigation strategies on the warm thermal environment of an urban square in Athens, Greece. Urban Clim. 2022, 44, 101217. [Google Scholar] [CrossRef]
- Martins, T.A.; Adolphe, L.; Bonhomme, M.; Bonneaud, F.; Faraut, S.; Ginestet, S.; Michel, C.; Guyard, W. Impact of Urban Cool Island measures on outdoor climate and pedestrian comfort: Simulations for a new district of Toulouse, France. Sustain. Cities Soc. 2016, 26, 9–26. [Google Scholar] [CrossRef]
- Li, Y.; Hong, B.; Wang, Y.; Bai, H.; Chen, H. Assessing heat stress relief measures to enhance outdoor thermal comfort: A field study in China’s cold region. Sustain. Cities Soc. 2022, 80, 103813. [Google Scholar] [CrossRef]
- Su, M.; Hong, B.; Su, X.; Liu, A.; Chang, J. How the nozzle density and height of mist spraying affect pedestrian outdoor thermal comfort: A field study. Build. Environ. 2022, 215, 108968. [Google Scholar] [CrossRef]


Disclaimer/Publisher’s Note: The statements, opinions and data contained in all publications are solely those of the individual author(s) and contributor(s) and not of MDPI and/or the editor(s). MDPI and/or the editor(s) disclaim responsibility for any injury to people or property resulting from any ideas, methods, instructions or products referred to in the content. |
© 2023 by the authors. Licensee MDPI, Basel, Switzerland. This article is an open access article distributed under the terms and conditions of the Creative Commons Attribution (CC BY) license (https://creativecommons.org/licenses/by/4.0/).