Abstract
This study investigates the effect of the partial replacement of ordinary Portland cement (OPC) with cement kiln dust (CKD) on the engineering properties of pozzolanic concrete for use in block manufacturing. Ultimately, this could potentially reduce cement consumption and CO2 emissions. The study was carried out on cylindrical concrete samples prepared from five mixtures comprising 71.13% pozzolan and 14.16% water, with 0, 5, 10, 15, or 20% of the OPC fraction (14.71 wt.%) replaced by CKD. The samples were tested for density and compressive strength (UCS) at curing ages of 7, 14, 28, 56, and 91 days; and for voids and water absorption after 28 curing days. Results show that increasing CKD content lowered the voids and increased the water absorption. The 15% CKD sample had the highest UCS, regardless of the curing age. X-ray diffraction analysis confirmed that the phase responsible for hydration, calcium silicate hydrate, was higher in the 15% CKD sample than the control.
1. Introduction
Cement kiln dust (CKD) is an ultrafine byproduct associated with clinker production in the cement industry. It is normally collected by cyclones, baghouses, or electrostatic precipitators. CKD production rates range from 20 to 150 kg/tonne of clinker, depending upon the process used and gas velocities in the kiln [1,2]. Worldwide production of CKD is expected to reach approximately 220 million tonnes by 2030 [3]. Disposal of such huge amounts of CKD represents a challenge because CKD is highly alkaline and fine [4,5]. This amount can neither be completely recycled to the kiln, nor can it be mixed with cement due to its undesirable effects [1,2,3,4,5,6]. Indeed, best management practices in the USA still result in most (68%) CKD being discarded, with only 22% being recycled to the kiln, and 10% being used in different applications [4] in compliance with ASTM D 5050-96 [7]. Hence, CKD is considered an unavoidable solid waste. The generation of CKD is not only a significant economic loss to the cement industry in terms of raw materials and management costs, but it also poses a threat to air and groundwater quality, biodiversity, and human health [1,4,6].
CKD acts as an alkali accelerator for latent hydraulic substances, and as an alkaline activator for different aluminosilicate materials in mortar and concrete. It also facilitates calcium silicate hydrate (C-S-H) gel and stable sulfoaluminate hydrate, ettringite formation, which enhances strength [8,9]. Free lime in CKD increases the formation of C-S-H gel during the pozzolanic reaction, and sulfate increases the formation of ettringite [9]. CKD can be used alone or in combination with other wastes (typically blast furnace slag and fly ash) [8,9] as: a binder for construction and pavement subgrade aggregate stabilization [10,11], and stabilization and solidification of inorganic hazardous wastes [12]; a flocculent for thickening and dewatering sewage sludge [13]; stabilization of clayey soil [14]; heavy metal removal [15]; waste stabilization [16,17]; a source of calcium oxide for ceramic production [18]; and a component of glass, bricks, blocks, and other building materials, and other applications [19,20,21,22,23,24,25,26,27]. Of note, when CKD was added to sand, granite, and magnesite to produce colored glass and glass ceramic materials, the products had a very high hardness (i.e., abrasion resistance) [21]. The modes of action and uses of CKD are reviewed in [3,10,17].
There are considerable researches looking at the potentials of partial replacement of OPC by CKD in the brick industry, in particular. Ghazaly et al. studied the addition of CKD to a concrete mixture to use in masonry with different ratios from 10% to 50%, and confirmed that it is possible to add CKD by 30% to obtain a proper compressive strength [23]. Ahmari and Zhang studied the feasibility of enhancing the physical and mechanical properties and the durability of copper mine tailings (MT)-based geopoymer bricks with cement kiln dust (CKD). The results illustrated that there is a significant enhancement of UCS and durability because of CKD [28]. El-Attar et al. investigated the possibility of using (CKD) as a partial substitute of OPC in the production of solid cement bricks with 0%, 30%, and 50% substitution percentages [29]. The results revealed that about 50% of (CKD) can be used to making economical bricks with reasonable properties. However, the majority of the research focused on concrete bricks other than pozzolanic bricks (blocks); hence, the current research focuses on the possibility of using CKD with pozzolanic bricks (blocks) due to its spread in the kingdom of Saudi Arabia. Pozzolanic concrete blocks are used for construction because natural pozzolans are readily available and abundant in Saudi Arabia. Millions of years ago, 90,000 km2 of the western sector of Saudi Arabia was subjected to volcanic activities that generated huge basaltic flows, called “Harrat” in Arabic [23]. The Harrats in Saudi Arabia have hundreds of scoria cones, with the majority considered pozzolanic materials according to different standards [30].
In accordance with the 2030 vision of the kingdom of Saudi Arabia, the manufacture of pozzolanic concrete masonry blocks recently draws more attention [23,31]. Pozzolanic concrete blocks are used for construction because natural pozzolans are readily available and abundant in Saudi Arabia. The produced pozzolanic blocks are lightweight, durable, and have excellent thermal insulation and compressive strength (UCS) properties. CKD represents a challenge for Saudi Arabia, which is among the highest cement consumers per capita in the world [18] and one of the top ten cement producers, with an annual production rate of 55 million tonnes [26].
Therefore, the objective of this research is to investigate the effect of the partial replacement of ordinary Portland cement (OPC) with CKD on the engineering properties of pozzolanic concrete, with the ultimate goal of decreasing OPC consumption and using waste CKD in a beneficial manner.
2. Materials and Methods
2.1. Materials
2.1.1. Natural Pozzolan
The concrete mixture are comprised of gravel pozzolan [32], OPC and (or) CKD as binders, and water. A 430 kg sample of Saudi natural pozzolans was obtained from a local concrete block factory. The particle size distribution (Figure 1) was determined for three representative samples from the as-received sample using an ELE 80-0200/06 laboratory sieve shaker according to ASTM D6913-17 [33]. The screen apertures that allowed 10, 30, and 60% of the sample to pass (d10, d30, and d60, respectively) estimated by interpolation were 0.24, 1.09, and 3.15 mm, respectively. Based on these values, the uniformity coefficient (d60/d10) and coefficient of curvature (d302/(d10 × d60)) are 13.32 and 1.57, respectively, meaning the natural pozzolan sample is well graded according to ASTM D2487-06 [34]. The as-received sample had a lower gravel content than best practices would recommend for the intended pozzolanic concrete recipes [35,36]. Therefore, the as-received natural sample was sieved into coarse gravel (0.5–12.5 mm), medium-size sand (0.15–0.5 mm), and fines (<0.15 mm) (Figure 2), which were weighed on a KERN TB35K1 electronic laboratory balance; and well homogenized to make the study pozzolan sample containing 84.3 wt.% gravel, 11.9 wt.% sand, and 3.8 wt.% fines [35].
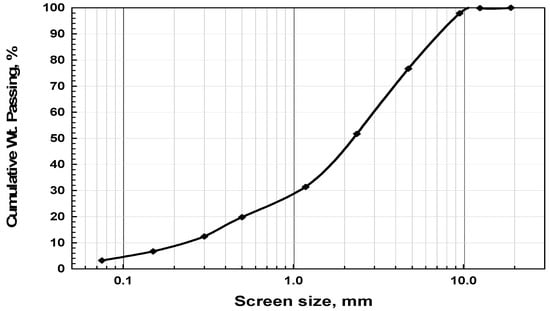
Figure 1.
Particle size distribution of the as-received natural pozzolan.
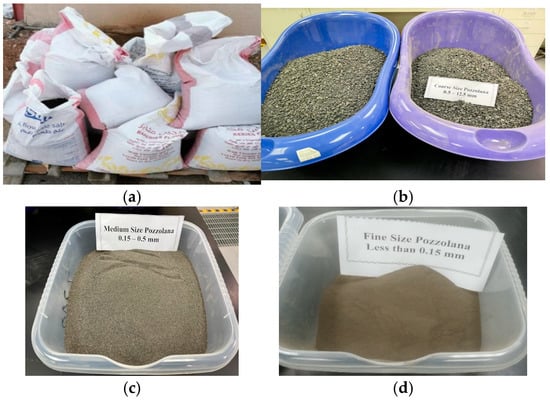
Figure 2.
Pozzolan sample: (a) as-received and (b) coarse, (c) medium, and (d) fine-size fractions.
Chemical analyses showed that the study pozzolan had a SiO2 + Al2O3 + Fe2O3 content of 78.47% and a loss on ignition (LOI) of 3.25 wt.% (Table 1). Thus, it is classified as a class N pozzolan [30] (SiO2 + Al2O3 + Fe2O3 ≥ 70 wt.% and LOI < 10 wt.%).

Table 1.
Chemical composition of the study pozzolan.
2.1.2. Ordinary Portland Cement
The Type 52.5N OPC binder used in this study is manufactured by Al-Safwa Cement Company in western Saudi Arabia, 100 km north of the city of Jeddah. It complies with Saudi Standard SASO GSO 1914/2009 (E) (Table 2) [37], which is largely in accordance with Type-I OPC of ASTM C150-04 [38].

Table 2.
Chemical composition of the study of ordinary Portland cement (OPC) compared to Saudi Standard SASO GSO 1914/2009 (E).
2.1.3. Cement Kiln Dust
The CKD used in this study was obtained from Yanbu Cement Company, a local high-capacity cement producer located 350 km north of Jeddah. The chemical composition of the as-received sample is shown in Table 3.

Table 3.
Chemical composition of the study cement kiln dust (CKD).
2.1.4. Water
Given that the water:cement ratio is a vital parameter in determining the concrete’s engineering properties, the moisture content (1.30 wt.%) and water absorption (4.00 wt.%) of the pozzolan in the saturated-surface-dry state were determined according to ASTM C642–13 [39]. From these values, the amount of water to be added to the recipe to achieve the desired water–cement ratio was calculated. The content of room-temperature (22–23 °C) potable tap water used in the mixtures was held constant at 14.16 wt.% based on industrial data collected from a local pozzolanic concrete block factory, and considering a fresh paste with acceptable coherance and a minimum slump.
2.2. Sample Preparation
The mixtures were designed to investigate the effect of partially replacing OPC with CKD on the engineering properties of pozzolanic concrete for use in manufacturing masonry blocks. Five mixtures were selected (Table 4 and Table 5) based on the results of slump tests [40]. Similar mixtures exist in literature for other applications [35]. In mixtures 1–4, the CKD replacement levels were 5–20%, as shown in Table 5.

Table 4.
Relative contribution of ordinary Portland cement (OPC) cement kiln dust (CKD) to test mixtures.

Table 5.
Composition of mixtures used in this study (i.e., replacement levels from Table 4 × 14.71).
Based on the composition of the selected mixtures, the water–cement ratio ranged from 0.96 to 1.2, considering CKD has null cementitious properties (Table 6). On the other hand, the water–(OPC + CKD) ratio is fixed at 0.96 if CKD is considered to act as a fully cementitious component. This water–cement ratio (0.96) is higher than the typically concrete recommended water–cement ratio to compensate for water adsorbed by pozzolan (4% from the pozzolan mass in the mix). This means an effective water–cement ratio of approximately 0.76 assuming CKD is counted as fully cementitious material.

Table 6.
Parameters for each of the five test mixtures.
To prepare samples from each mixture, mixing and casting stages were implemented in sequence. The amounts of each component sufficient to produce 16 samples from each mixture were weighed and prepared separately. The prepared components were mixed in sequential steps in a drum mixer with a 115 L mixing tank (Figure 3) to form a homogeneous paste. First, the coarse, medium, and fine pozzolan sizes were mixed and homogenized for 15 s. Then, sufficient absorption water was added to completely wet the mixture, which was mixed for 15 s. The OPC and CKD were then added and mixed for a further 15 s. Finally, the remainder of the calculated water was added, and the whole mixture was mixed continuously for 4 min. To maximize mixer efficiency, the occupied volume of the mixer tank was kept at <75% of the total mixer tank volume.
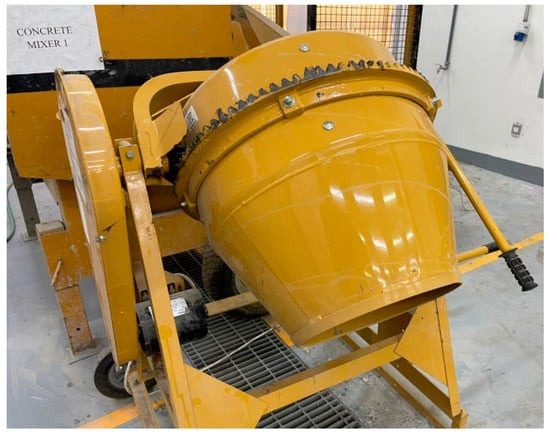
Figure 3.
Drum mixer.
Once homogenization was complete, the paste slump and temperature were measured (Figure 4a,b). Since the prepared concrete mixtures are ultimately intended as manufactured concrete masonry blocks, the uniformity, homogeneity, and workability of the freshly prepared concrete is a key issue. The slump test is a simple, credible standard test that measures the behavior of a freshly compacted concrete cone under the action of gravitational forces. It was conducted according to ASTM C143/ C143M 12 [41] using the Gilson cone. Attention was paid to ensure that all the measured slump values were due to real subsidence; neither shear, nor collapse of the concrete. Thus, it was essential that the concrete paste casted into molds formed in the mold shape with no deformation [35].
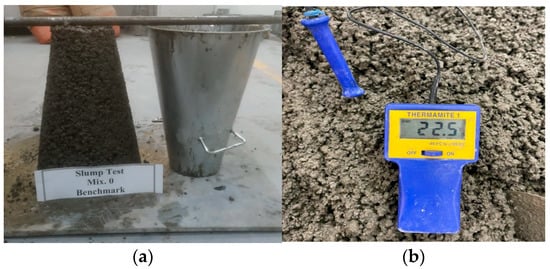
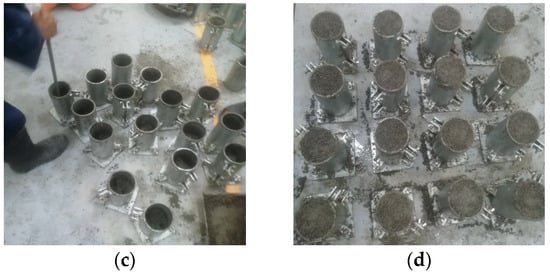
Figure 4.
Concrete paste samples: (a) slump test; (b) temperature measurement; (c) partial mold filling and compaction; and (d) complete mold filling and surface flattening.
Sixteen samples were prepared from each mixture by casting the paste in dry, clean, oil-painted standard cylindrical stainless steel molds with an internal diameter of 100 mm and a height of 200 mm (H/D = 2). Paste casting followed a systematic routine. The paste mixture was distributed among all the molds to fill approximately 33% of the volume, and then compacted 25 times with a steel rod (Figure 4c). This process was repeated with molds approximately 66 and 100% filled. Finally, the upper surface of the sample was made completely flat to avoid any errors in the UCS test results (Figure 4d) [30,35]. Casted samples were demolded after 24 h. The outer surfaces of demolded samples were water-sprayed once per day for three consecutive days. Then, the samples were left at room temperature for 7, 14, 28, 56, or 91 curing days.
2.3. Testing Methodology
2.3.1. Water Adsorption and Voids
Voids affect the engineering properties of freshly prepared or hardened concrete [42]. Therefore, the voids in the hardened pozzolanic concrete samples were experimentally determined according to ASTM C642–13 [39]. One sample from each mixture cured for 28 days was selected for void estimation. Four values were determined: mass of oven-dried sample in air (A); mass of surface-dry sample in air after immersion in water for 48 h (B); mass of surface-dry sample in air after immersion and boiling in water for 5 h (C); and the apparent mass of the sample (water-boiled sample) in water (D). Equation (1) was applied to calculate the volumetric fraction of permeable voids.
Volume of permeable pore space, voids:
% = {(C − A)/(C − D)} × 100
The water absorption of the sample after immersion in cold or boiling water was calculated according to Equations (2) and (3), respectively.
Absorption after immersion:
% = {(B − A)/(A)} × 100
Absorption after immersion and boiling:
% = {(C − A)/(A)} × 100
2.3.2. Compressive Strength
The compressive strength was experimentally measured on samples of mixtures 0–4 on each of the five curing ages using a WALTER + BAIAG compression machine (Figure 5). Three samples for any given UCS test were selected that did not have visible defects that could affect the test results. The test result was calculated as the average of the three measured samples. The standard deviation of each tested set was calculated and considered as a measure for accepting/rejecting the whole test.
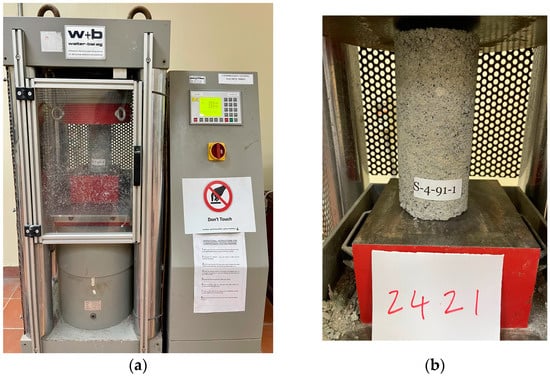
Figure 5.
(a) Uniaxial compression machine with (b) a concrete sample in the testing position.
3. Results and Discussion
3.1. Slump Test
There is an inverse relationship between the proportion of cement in the mixture and the value of the slump: Mix 0 (control) had the lowest slump, and Mix 4 had the highest slump (Figure 6).
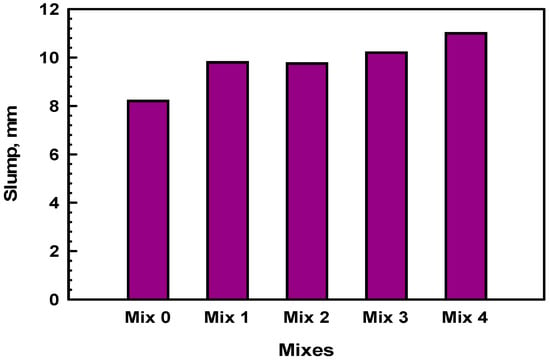
Figure 6.
Slump test results for five pozzolanic concrete mixtures in Table 4.
3.2. Voids and Water Absorption
Table 7 shows that when the samples are immersed in cold water, the absorption is low (maximum value of 14.78% met with the control sample). This may be attributed to the capillary nature of the sample pores that hamper the water absorption [42,43]. Replacing OPC with CKD resulted in a decrease in the cold water adsorption, with mixture 3 (15% CKD) having the lowest absorption 12.26%. The absorption noticed when boiling the samples in water is also the highest in the control sample (26.33%), with mixture 3 (15% CKD) and mixture 4 (20% CKD) having the lowest absorption values, being 25.15% and 24.16%, respectively. The results also show that for all the tested mixtures, the absorption values at hot boiling conditions are approximately twice of their counterpart absorption values for cold soaking conditions. The authors do believe that the lower density of the hot water is one of the main reasons behind this phenomenon as the low density of hot water enhances its propagation in the capillary voids. At the same time, the absorption results of both cold and boiling immersion conditions confirmed that the higher is the CKD, the lower is the absorption. This is possibly due to the interference of the superfine CKD particulates in some of the sample pores; thus, decreasing the voids left for water to be absorbed in. This is confirmed when looking for the volumetric voids fraction measured for the different mixtures. The control sample has the highest voids percentage (38.72%), with mixture 3 (15% CKD) and mixture 4 (20% CKD) having the lowest voids percentage, which are 37.49% and 36.67%, respectively; i.e., the high CKD in the mixture means low voids in the sample.

Table 7.
Results of water absorption (cold and boiled) and voids (in volumetric %) for the different concrete mixtures (28-day cured samples).
To find the relationship between voids, CKD, and absorption (taken binary in various combinations) in the concrete mixtures, the least-square curve fitting method was used. Sample hot and cold water absorption can be expressed as a polynomial function of the sample voids (Figure 7a,b). The hot absorption has a stronger relationship with voids (R2 = 0.9978) than the cold absorption (R2 = 0.6259). The void percent is highly dependent on the CKD% in the mixture (R2 = 0.9953; Figure 7c); hence, absorption strongly depends on the CKD% in the mixture (R2 = 0.9957, Figure 7d). These trends are in agreement with the published literature [43].
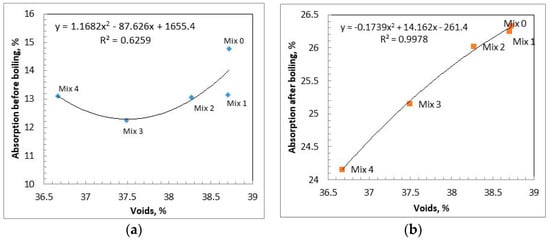
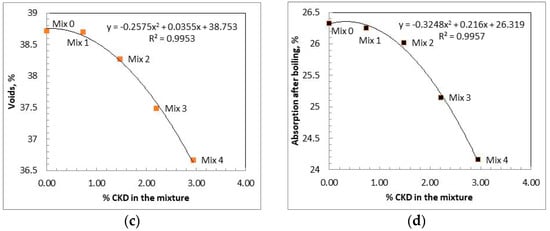
Figure 7.
(a) Cold absorption versus voids, (b) hot absorption versus voids, (c) voids versus CKD % in the whole mixture, and (d) voids versus CKD % in the whole mixture.
3.3. Compressive Strength and Density
The individual compressive strength results for all the tested samples from the different investigated mixtures at different curing ages are shown in Table 8. Table 9 shows the average results of compressive strength for the sets of three samples from the different investigated mixtures at different curing ages together with the standard deviation (σ) of each set of samples. The reported standard deviations for the various tested sets from the different mixtures were not exceeding ±0.72 MPa, which indicates the preciseness and the accuracy of the measurements. Moreover, all the tested sets showed statistically accepted results at an error of ±1σ. Table 9 also shows that the highest compressive strength value obtained, with the 7-day cured samples from the different investigated mixtures being 4.42 MPa (met with Mix 3, 15% CKD). Both samples from the control mix (0% CKD) and Mix 1 (5% CKD), cured for the same age i.e., 7 days, returned the lowest compressive strength value 3.47 MPa. After 14 days curing age, the Mix 3 samples have the highest compressive strength 6 MPa and samples from the control mixture have the lowest compressive strength 4.09 MPa. The same is repeated with the rest of curing ages, i.e., 28, 56, and even the long-term curing (91 days); the compressive strength reaches the highest value at the Mix 3 samples, while the control mixture samples have the lowest compressive strength. This may be attributed to the lower absorption of water in the control samples, which probably generates a localized low water cement ratio [44] as the majority of cement is expected to exist in the voids of the samples due to its high fineness [45,46].

Table 8.
Results of compressive strength measurement for the different considered pozzolanic-concrete mixtures at different curing ages.

Table 9.
Average compressive strength for the different considered pozzolanic-concrete mixtures at different curing ages.
Figure 8 is a pictorial form generated from the data presented in Table 9; considering Figure 8 and the samples prepared from Mix 0 (control mixture), one can notice that at the first 3 curing ages (7, 14, and 28 days), the compressive strength of the samples is continuously increasing reaching a maximum of 5.26 MPa after 28 days curing. At higher curing ages, i.e., 56 and 91 days, the compressive strength of the samples prepared from the same mixture decrease compared to the maximum attained at 28 days. The same figure shows that Mix 1 samples and Mix 2 samples have the same phenomena; i.e., an increase in the samples’ compressive strength measured on samples cured up to 28 days, followed by a decrease at the age of 56 days curing and then, another increase at the 91-day curing age; however, still below the maximum achieved at 28 days curing. On the other hand, samples prepared from Mix 3 and those from Mix 4 returned a different behavior. From one side, the compressive strength of Mix 3 samples is continuously increasing over all the curing ages; i.e., the maximum compressive strength (7.2 MPa) is realized at the longest curing age (91 days). From the other side, the compressive strength of Mix 4 samples is progressively increasing up to 56 days curing time (reaching a maximum of 5.97 MPa after 56 days) and then, decreases at the age of 91 days. It can be concluded that Mix 3 is the best among all the investigated mixtures due to the fact that its samples have the highest compressive strength in the all curing ages, in addition to the continuous increase of the compressive strength for the whole of the considered curing ages.
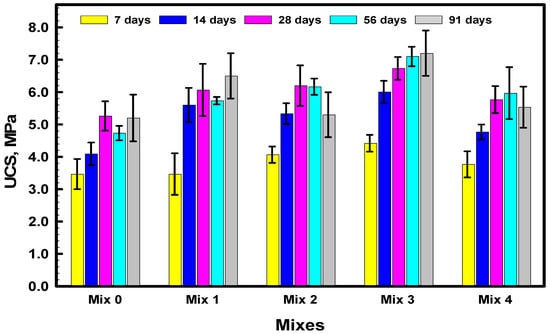
Figure 8.
Compressive strength results of the various sample sets prepared from the different mixtures cured at several curing ages.
As a discrete (point-by-point) comparison, to understand the compressive strength evolution over time within any of the studied mixtures, the percentage increase of UCS of a given mixture at a certain curing age was compared to the starting original UCS met at 7-day curing for the same mixture. This was calculated for any mixture as (UCS value at a given curing age minus the UCS measured for the same mix after 7 days) multiplied by 100, divided by the 7-day UCS for the same mixture. The calculated results are plotted in Figure 9. It shows that Mix 0 samples have a maximum of 51.8% UCS increase (after 28 days) from the UCS of samples prepared from the same mixture and tested after 7 days. Conversely, the UCS of Mix 2 samples increased by 61.5% after 14 days compared to its 7-day UCS; this indicates the fastest stress evolution among all the studied mixtures. Mix 3 shows a continuous stress evolution with a maximum of 62.9% realized after 91 curing days, while Mix 4 samples have a maximum UCS increase of 58.4% reached after 56 days.
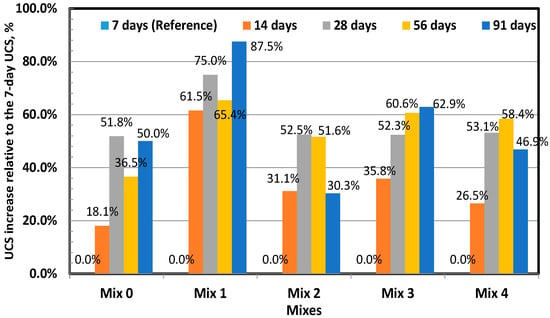
Figure 9.
Compressive strength evolution over curing age within mixtures relative to the starting value after 7-day curing.
To find the relationship between the UCS of the different mixtures samples (mix by mix) versus the UCS of the control samples considering the different curing ages, the least-square curve fitting method was again used. The results are presented in Figure 10. Meanwhile, the mathematical functions together with the coefficient of determination, R2, are listed in Table 10. It shows that the mathematical models for all the mixtures are second-order polynomial equations with the general form shown in Equation (4). The compressive strength of the samples prepared from the different mixtures cured for different ages are related to those of the control samples. The best relation is met with samples prepared from Mix 3 (R2 = 0.9762). The other mixtures, i.e., Mix 1, Mix 2, and Mix 4, have less relation, with determination coefficients of 0.9314, 0.8321, and 0.9414, respectively.
where a, b, and c are the model parameters; y is the compressive strength of samples from a certain mixture at a given curing age in MPa; and x is the compressive strength of the samples from the control mixture at the same curing age in MPa.
Y = ax2 + bx +c
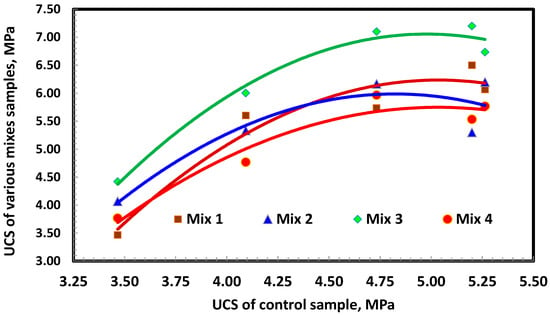
Figure 10.
Relation between the compressive strength of the different mixes samples with the compressive strength of the control samples.

Table 10.
Mathematical models relating UCS of samples from different mixtures and UCS of control samples at different curing ages.
The densities of the entire sets of samples used in UCS tests were determined. For this purpose, each sample was weighed just before being UCS-destructively tested and its volume was calculated according to the average sample dimensions (measured at least three times using a digital Verner). The obtained results for the different mixtures at different curing ages for each test set are presented in Table 11. It shows that the average density of any set is above 1.5 Mg/m3.

Table 11.
Results of density measurement of samples from the different considered pozzolanic-concrete mixtures at different curing ages.
To compare the variation of the samples densities over the different curing ages, box–whisker plots for the different mixtures are used. The plot normally shows the minimum and maximum densities as the start and the end of the lines outside the box, with the box itself drawn from 25th to 75th percentiles. The median and the average are drawn as horizontal lines inside the box. The plot whiskers are drawn from the box to minimum and maximum statistically accepted values. The outliers, if they exist, are plotted as separate points outside the whiskers. Figure 11 shows the whisker–box plots for the densities obtained with samples from the different investigated mixtures. It shows that there are no outliers for all the densities measured for the different studied mixtures (15 samples for each mix). It also shows that starting from Mix 2, the average (red line) and the median (black line) of the density is higher than those of the control mix samples. Mix 3 has the highest average and median densities among all the investigated mixtures. For all the studied mixtures, regardless of the curing age, the sample densities are above 1.5 Mg/m3. This elucidates that the concrete can be used to manufacture concrete blocks as the majority of the standards impose limitations on the block density cured for 28 days to be greater than 1.5 [47,48,49,50,51].
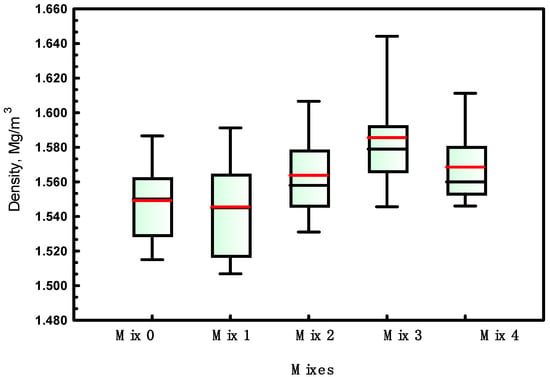
Figure 11.
Box–whisker plot of densities of the different mix samples over the various curing ages.
3.4. XRD of 28-Day Cured Samples from Mix 0 and Mix 3
The hitherto discussed results showed the preference of Mixture 3 (15% CKD) compared to all the investigated mixtures, including the control one. To interpret such findings, 28-day cured samples from the control (Mix 0) and Mix 3 (15%CKD) were X-ray diffracted for their existing phases at the Center of Nanotechnology—King Abdulaziz University. An X-ray diffractometer with a Cu k radiation source (Regaku, Ultima 1V, Tokyo, Japan) was used for this purpose. The measurements were implemented at room temperature considering a scan range (2Ɵ) between 10 and 80 degrees, with a step of 0.05 degrees in a continuous mode operation. Crystallite size and lattice strain of the different phases observed in Mix 0 and Mix 3 were performed using the Williamson-Hall method. Figure 12 shows the measurement profile of the Mix 0 and Mix 3 after 28 days curing age, with major peaks labeled. It depicts that the main phases revealed by the XRD in Mix 0 (0% CKD) and Mix 3 (15% CKD) are Ettringite (hydrous calcium aluminum sulfate, Ca6Al2(SO4)3(OH)12·26H2O), calcium silicate hydrate (C-S-H) 5Ca2 SiO4·6H2O, and portlandite (Ca(OH)2).
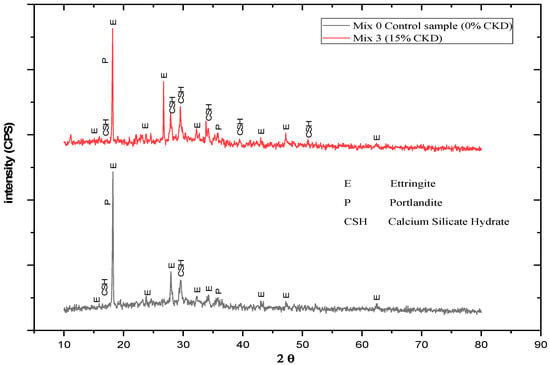
Figure 12.
Qualitative XRD patterns of the 28-day cured samples from Mix 0 and Mix 3.
It is known in the phases of the clinker that the cement tricalcium aluminate C3A has the phenomenon of flash-set as soon as water is added [52]. To prevent this phenomenon, gypsum CaSO4. 2H2O is added to the clinker, and it combines with C3A to form a substance that surrounds C3A and delays the time of water reaching C3A; thus, delaying the setting time of the cement. Therefore, the forming of Ettringite is normal in Mix 0 and Mix 3 because the added OPC contains gypsum [9,52].
As for the second phase, which is calcium silicate hydrate (or C-S-H), it is the main product of hydration of Portland cement and it is produced from the reaction of the silicate phases in cement with water, and is mainly responsible for the strength of cement-based materials [53]. It is clear that this phase exists in Mixture 0 as well as in Mixture 3; however, its appearance in the last mixture was greater (Figure 12) where the number of peaks is more. This is probably the main reason behind the high compressive strength in the mixture 3 (15% CKD) compared to that of Mixture 0 (no CKD added). All the mixtures in all the sample preparation stages, starting from mixing, passing through casting and ending with curing, were conducted in exactly the same conditions. The only difference between the two mixtures is the addition of CKD to Mixture 3, Therefore, CKD is responsible for increasing the strength of the Mixture 3 because it enhanced the formation of the calcium silicate phase hydrate (C-S-H).
Approximately 16–20% of the OPC is converted to portlandite, which has partial water solubility and is chemically reactive especially when exposed to acidic environments; and thus, contributes significantly to the generally poor durability of mortar and concrete [36]. Henceforth, the partial replacement of portlandite with a less chemically reactive cement product yields improved durability, especially with regard to sulfate resistance and alkaline silica reaction [9,54]. The appearance of the portlandite phase in the Mixture 0 and Mixture 3 was equal in the number of peaks; however, based on the fact that was just mentioned, the partial replacement of cement with CKD will partially reduce the formation of the portlandite phase; thus, contributing to increasing the compressive strength, and this was supported by the results of compressive strength tests as was shown in advance.
3.5. Potential Application of the Studied Pozzolanic Concrete in Masonary Block Production
The testing for concrete blocks, either according to standards or literature, are concerned with testing the blocks themselves, but not cylindrical samples [47,48,49,50,51]. These standards usually concentrate on the shape and dimensions of the concrete brick, its water absorption, in addition to the block compressive strength [47,50]. The limitations or threshold value for each test depends mainly on the intended use of the blocks. The maximum water absorption is limited in most standards to be less than 16% [48,49]. This is comparable with the percentage absorption before boiling previously presented in Section 3.2., which is related to voids and water absorption. It shows that all the studied mixtures achieved limitations regarding water absorption as the measured values were 14.78%, 13.14%, 13.07%, 12.26%, and 13.11% for Mix 0, Mix 1, Mix 2, Mix 3, and Mix 4, respectively. The class and grades differ from one standard to the other according to limitations imposed by the standard on both the bricks average strength and density. As an example, the UCS and density limitations in the most recent Indian standard, IS 2185 (PART 1), are tabulated in Table 12 [49]. According to the available variations of both UCS and density, the investigated pozzolanic concrete can be used for producing a variety of class A, B, or C blocks; especially, Mix 3 that can even reach Group II code (A8.5) blocks, which require an average UCS of 7.00 MPa. It is worth mentioning that due to using special molding machines for blocks manufacturing, the compaction stress is much higher compared to the 25-tamping methodology used in this laboratory study; this will improve both the UCS and density for mixtures similar to those investigated in this paper.

Table 12.
Specification of masonry concrete blocks as per Indian standard [49].
4. Conclusions
Based on the results and analyses presented in this paper, it can be generally concluded that adding CKD as a partial substitute for OPC in the concrete mixtures improves their compressive strength; thus, it saves cement consumption and consequently, costs in addition to decreasing the CKD hazardous environmental impacts. Moreover, the following specific conclusions can be drawn:
- (1)
- The higher the percentage of CKD in the mixture, the lower the sample voids; however, the higher is its absorption of water (cold or boiled);
- (2)
- The control samples (0% CKD) usually have the lowest compressive strength compared to samples prepared from mixtures with CKD replaced by OPC, regardless of the curing age;
- (3)
- At any curing age, the highest compressive strength was permanently met with samples from Mix 3 (15% CKD). It reached 7.2 MPa after 91 days curing, compared to 5.2 MPa (after 28-day curing) in the control samples (a 38.5% increase);
- (4)
- The addition of CKD causes a slight increase in the density because it plays the role of filler for voids;
- (5)
- The addition of CKD leads to a slight increase in the value of the slump as well as a result of weak cohesion due to the shortage of cement ratio. This can be explained by the fact that CKD tends to be a filler material and not a cementitious material;
- (6)
- Adding CKD to the concrete mixture reduces the chance of portlandite phase formation, which hampers the durability of concrete;
- (7)
- Adding CKD to the concrete mixture increases and enhances the formation of the calcium silicate hydrate phase, which is responsible for hydration and thus, for the compressive strength of concrete.
Author Contributions
Conceptualization, M.A.H., H.A.M.A. and H.A.S.; formal analysis, M.A.H., H.A.M.A. and H.A.S.; resources, H.M.A. and H.A.S.; data curation, H.A.S., H.A.M.A., H.M.A. and M.A.H.; writing—original draft preparation, H.A.S.; writing—review and editing, H.A.M.A.; visualization, H.A.M.A. and H.A.S.; supervision, H.M.A. and M.A.H.; funding acquisition, H.A.M.A. and H.M.A. All authors have read and agreed to the published version of the manuscript.
Funding
This work was supported by the Deanship of Scientific Research (DSR), King Abdulaziz University, Jeddah, under grant no. D-116-135-1441. The authors, therefore, gratefully acknowledge the DSR’s technical and financial support.
Data Availability Statement
Data are not available on a publicly accessible repository and they cannot be shared under request.
Acknowledgments
This project was funded by the Deanship of Scientific Research (DSR), King Abdulaziz University, Jeddah, under grant no. (D-116-135-1441). The authors, therefore, gratefully acknowledge the DSR’s technical and financial support.
Conflicts of Interest
The authors declare no conflict of interest.
References
- Sreekrishnavilasam, A.; King, S.; Santagata, M. Characterization of fresh and landfilled cement kiln dust for reuse in construction applications. Eng. Geol. 2006, 85, 165–173. [Google Scholar] [CrossRef]
- Adewuyi, S.O.; Ahmed, H.A.M. Grinding Behaviour of Microwave-Irradiated Mining Waste. Energies 2021, 14, 3991. [Google Scholar] [CrossRef]
- Elbaz, A.A.; Aboulfotoh, A.M.; Dohdoh, A.M.; Wahba, A.M. Review of beneficial uses of cement kiln dust (CKD), fly ash (FA) and their mixture. J. Mater. Environ. Sci. 2019, 10, 1062–1073. [Google Scholar]
- Sreekrishnavilasam, A.; Santagata, M. Development of Criteria for the Utilization of Cement Kiln Dust (CKD) in Highway Infrastructures; Final Report (FHWA/IN/JTRP-2005/10); Purdue University: West Lafayette, IN, USA, 2005; pp. 1–278. [Google Scholar]
- Lanzerstorfer, C.; Feichtinger, K. Cement Kiln Dust: Characterization of Dust Collected in Various Fields of Electrostatic Precipitators. Environ. Eng. Sci. 2016, 33, 200–206. [Google Scholar] [CrossRef]
- Devi, K.S.; Lakshmi, V.V.; Alakanandana, A. Impact of Cement Industry on Environment—An Overview. Asia Pac. J. Res. I 2017, LVII, 156–161. [Google Scholar]
- ASTM D 5050-96; Standard Guide for Commercial Use of Lime Kiln Dusts and Portland Cement Kiln Dusts. ASTM International: West Conshohocken, PA, USA, 2002; pp. 1–3.
- Tangri, A. Effect of cement kiln dust and fly ash on clay soil—A review. Mater. Today Proc. 2021, 37, 2439–2440. [Google Scholar] [CrossRef]
- Konsta-Gdoutos, M.S.; Shah, S.P. Hydration and properties of novel blended cements based on cement kiln dust and blast furnace slag. Cem. Concr. Res. 2003, 33, 1269–1276. [Google Scholar] [CrossRef]
- Al-Bakri, A.Y.; Ahmed, H.M.; Hefni, M.A. Cement Kiln Dust (CKD): Potential Beneficial Applications and Eco-Sustainable Solutions. Sustainability 2022, 14, 7022. [Google Scholar] [CrossRef]
- Mohammadinia, A.; Arulrajah, A.; D’Amico, A.; Horpibulsuk, S. Alkali-activation of fly ash and cement kiln dust mixtures for stabilization of demolition aggregates. Constr. Build. Mater. 2018, 186, 71–78. [Google Scholar] [CrossRef]
- Soundararajan, R. The application of cement, flyash, and kiln dust for the stabilization/solidification of inorganic hazardous wastes. In Proceedings of the IEEE Cement Industry Technical Conference, Dallas, TX, USA, 10–14 May 1992. [Google Scholar] [CrossRef]
- Aboulfotoh, A.M.; Dohdoh, A.M. Enhancement of thickening and dewatering characteristics of sewage sludge using cement kiln dust. Desalination Water Treat. 2017, 81, 40–46. [Google Scholar] [CrossRef]
- Sharma, R.K. Laboratory study on stabilization of clayey soil with cement kiln dust and fiber. Geotech. Geol. Eng. 2017, 35, 2291–2302. [Google Scholar] [CrossRef]
- El-Awady, M.H.; Sami, T.M. Removal of Heavy Metals by Cement Kiln Dust. Bull. Environ. Contam. Toxicol. 1997, 59, 603–610. [Google Scholar] [CrossRef] [PubMed]
- Rahman, M.K.; Rehman, S.; Al-Amoudi, O.S.B. Literature Review on Cement Kiln Dust Usage in Soil and Waste Stabilization and Experimental Investigation. Int. J. Res. Rev. Appl. Sci. 2011, 7, 77–87. [Google Scholar]
- Adaska, W.S.P.E.; Taubert, D.H. Beneficial uses of cement kiln dust. In Proceedings of the 2008 IEEE Cement Industry Technical Conference Record, Miami, FL, USA, 18–22 May 2008; pp. 210–228. [Google Scholar] [CrossRef]
- Darweesh, H.H.M. Utilization of cement kiln by-pass dust waste as a source of CaO in ceramic industry. Silic. Ind. 2001, 66, 47–52. [Google Scholar]
- Siddique, R. Cement kiln dust. In Waste Materials and By-Products in Concrete, 1st ed.; Springer: Berlin/Heidelberg, Germany, 2008; pp. 352–378. [Google Scholar]
- Seo, M.; Lee, S.Y.; Lee, C.; Cho, S.S. Recycling of Cement Kiln Dust as a Raw Material for Cement. Environments 2019, 6, 113. [Google Scholar] [CrossRef]
- Amjad, M.A.; Alsayed, S.H. Strength and elasticity of concrete bricks/blocks incorporation White and Red Sand. In Proceedings of the Fourth Saudi Engineering Conference, Riyadh, Saudi Arabia, 5–8 November 1995; Volume II, pp. 217–224. [Google Scholar]
- Al-Refeai, T.O.; Al-Karni, A.A. Experimental Study on the Utilization of Cement Kiln Dust for Ground Modification. J. King Saud Univ. Eng. Sci. 1998, 10, 163–181. [Google Scholar] [CrossRef]
- Ghazaly, M.H.; Almaghrabi, M.N.; Ebrahiem, E.E. A Study on the Reuse of Cement Kiln Dust in the Production of Cement Concerts. Minia J. Eng. Technol. 2012, 31, 63–68. [Google Scholar]
- Al-Harthy, A.S.; Taha, R.; Al-Maamary, F. Effect of cement kiln dust (CKD) on mortar and concrete mixtures. Constr. Build. Mater. 2003, 17, 353–360. [Google Scholar] [CrossRef]
- Sas, W. Application of recycled concrete aggregate in road engineering. Acta Sci. Pol. Archit. 2015, 14, 49–59. [Google Scholar]
- Roychoudhury, J. Saudi Arabian Cement Companies: Upgrading through Leveraging Overcapacity; General Authority for Statistics; KAPSARC: Riyadh, Saudi Arabia, 2020. [Google Scholar]
- Khater, G.A. Use of bypass cement dust for production of glass ceramic materials. Adv. Appl. Ceram. 2006, 105, 107–111. [Google Scholar] [CrossRef]
- El-Attar, M.M.; Sadek, D.M.; Salah, A.M. Recycling of high volumes of cement kiln dust in bricks industry. J. Clean. Prod. 2017, 143, 506–515. [Google Scholar] [CrossRef]
- Ahmari, S.; Zhang, L. Utilization of cement kiln dust (CKD) to enhance mine tailings-based geopolymer bricks. Constr. Build. Mater. 2013, 40, 1002–1011. [Google Scholar] [CrossRef]
- ASTM C618-17; Standard Specification for Coal Fly Ash and Raw or Calcined Natural Pozzolan for Use in Concrete, Book of ASTM Standards. ASTM International: West Conshohocken, PA, USA, 2017.
- Ahmad, A.; Al-Hadhrami, L. Thermal performance and economic assessment of masonry bricks. Therm. Sci. 2009, 13, 221–232. [Google Scholar] [CrossRef]
- Tchamdjou, W.H.J.; Cherradia, T.; Abidia, M.L.; de Oliveira, L.A.P. Influence of different amounts of natural pozzolan from volcanic scoria on the rheological properties of Portland cement pastes. Energy Procedia 2017, 139, 696–702. [Google Scholar] [CrossRef]
- ASTM D6913/D6913M-17; Standard Test Method for Particle-Size Distribution (Gradation) of Soils Using Sieve Analysis. ASTM International: West Conshohocken, PA, USA, 2017.
- ASTM D2487-06; Standard Practice for Classification of Soils for Engineering Purposes (Unified Soil Classification System). ASTM International: West Conshohocken, PA, USA, 2010; pp. 1–12.
- Tikou, B.; Benzaazoua, M. Design and application of underground mine paste backfill technology. Geotech. Geol. Eng. 2007, 26, 147–174. [Google Scholar] [CrossRef]
- Artêmio, F.; Machado, C.J.; Lima, O.A.; Roberto, P.L. A Mix Design Methodology for Concrete Block Units. In Proceedings of the 15th International Brick and Block Masonry Conference, Florianópolis, Santa Caterina, Brazil, 3–6 June 2012. [Google Scholar]
- SASO GSO 1914/2009 (E); Standard Specification for Portland Cement according Gulf Cooperation Standardization Organization. GCC Standardization Organization: Riyadh, Saudi Arabia, 2009.
- ASTM C150-04; Standard Specification for Portland Cement. ASTM International: West Conshohocken, PA, USA, 2004; pp. 1–8.
- ASTM C642-13; Standard Test Method for Density, Absorption, and Voids in Hardened Concrete. ASTM International: West Conshohocken, PA, USA, 2005; pp. 1–3.
- Christensen, G. Modelling the Flow of Fresh Concrete: The Slump Test. Ph.D. Thesis, Princeton University, Princeton, NJ, USA, 1991. [Google Scholar]
- ASTM-C143/C143M-12; Standard Test Method for Slump of Hydraulic Cement Concrete, Annual Book of ASTM Standards. ASTM International: West Conshohocken, PA, USA, 2012.
- Liu, X.W.; Yang, J.B.; Xia, K.Q.; Zhang, P.; Li, Z.G. Capillary Absorption Dynamics for Cementitious Material Considering Water Evaporation and Tortuosity of Capillary Pores. Adv. Mater. Res. 2013, 821–822, 1213–1218. [Google Scholar] [CrossRef]
- Yilmaz, I.; Yildirim, M.; Marschalko, M. Effect of surface void percentage (SVP) on the unconfined compressive strength (UCS) of porous rocks. Q. J. Eng. Geol. Hydrogeol. 2017, 51, 108–112. [Google Scholar] [CrossRef]
- Ezerskiy, V.; Kuznetsova, N.V.; Seleznev, A.D. Justification of the Water-Cement Ratio Decision for Cement Mixtures Using CBPB Wastes. Mater. Sci. Forum 2019, 945, 1009–1015. [Google Scholar] [CrossRef]
- Higginson, E.C. The Effect of Cement Fineness on Concrete; ASTM International: West Conshohocken, PA, USA, 1970. [Google Scholar] [CrossRef]
- Häußler, F.; Hempel, M.; Baumbach, H.; Tritthart, J. Nanostructural investigations of hydrating cement pastes produced from cement with different fineness levels. Adv. Cem. Res. 2001, 13, 65–73. [Google Scholar] [CrossRef]
- ASTM C1437-03; Standard Test Method for Flow of Hydraulic Cement Mortar. ASTM International: West Conshohocken, PA, USA, 2005; pp. 1–2.
- ASTM C230/C 230M-03; Standard Specification for Flow Table for Use in Tests of Hydraulic Cement. ASTM International: West Conshohocken, PA, USA, 2005; pp. 1–7.
- IS: 2185 (Part-I); Indian standard, Specifications for Concrete Masonry. Units, Part-I Hollow and Solid Concrete Block (3rd print). Bureau of Indian Standards: New Delhi, India, 1990; p. 12. Available online: https://civilengineer.co.in/wp-content/uploads/2015/03/IS-2185-PART-1-1979-Concrete-Masonary-blocks-Hollow-and-Solid-1998.pdf (accessed on 13 February 2023).
- ASTM C140-15; Standard Test Methods for Sampling and Testing Concrete Masonry Units and Related Units. ASTM International: West Conshohocken, PA, USA, 2015.
- Bahurudeen, A.; Moorthi, P.V.P. Testing of Construction Materials, 1st ed.; CRC Press: Boca Raton, Fl, USA, 2020; pp. 273–316. [Google Scholar] [CrossRef]
- Black, L.; Breen, C.; Yarwood, J.; Deng, C.-S.; Phipps, J.; Maitland, G.A. Hydration of tricalcium aluminate (C3A) in the presence and absence of gypsum—Studied by Raman spectroscopy and X-ray Diffraction. J. Mater. Chem. 2006, 16, 1263–1272. [Google Scholar] [CrossRef]
- Hu, C.; Han, Y.; Gao, Y.; Zhang, Y.; Li, Z. Property investigation of calcium–silicate–hydrate (C–S–H) gel in cementitious composites. Mater. Charact. 2014, 95, 129–139. [Google Scholar] [CrossRef]
- Wild, S.; Knatib, J.M. Portlandite Consumption in Metakaolin Cement Pastes and Mortars. Cem. Concr. Res. 1997, 27, 137–146. [Google Scholar] [CrossRef]
Disclaimer/Publisher’s Note: The statements, opinions and data contained in all publications are solely those of the individual author(s) and contributor(s) and not of MDPI and/or the editor(s). MDPI and/or the editor(s) disclaim responsibility for any injury to people or property resulting from any ideas, methods, instructions or products referred to in the content. |
© 2023 by the authors. Licensee MDPI, Basel, Switzerland. This article is an open access article distributed under the terms and conditions of the Creative Commons Attribution (CC BY) license (https://creativecommons.org/licenses/by/4.0/).