
Amplification in Mechanical Properties of a Lead Rubber Bearing for Various Exposure Times to Low Temperature


Abstract
:1. Introduction
2. Experimental Program
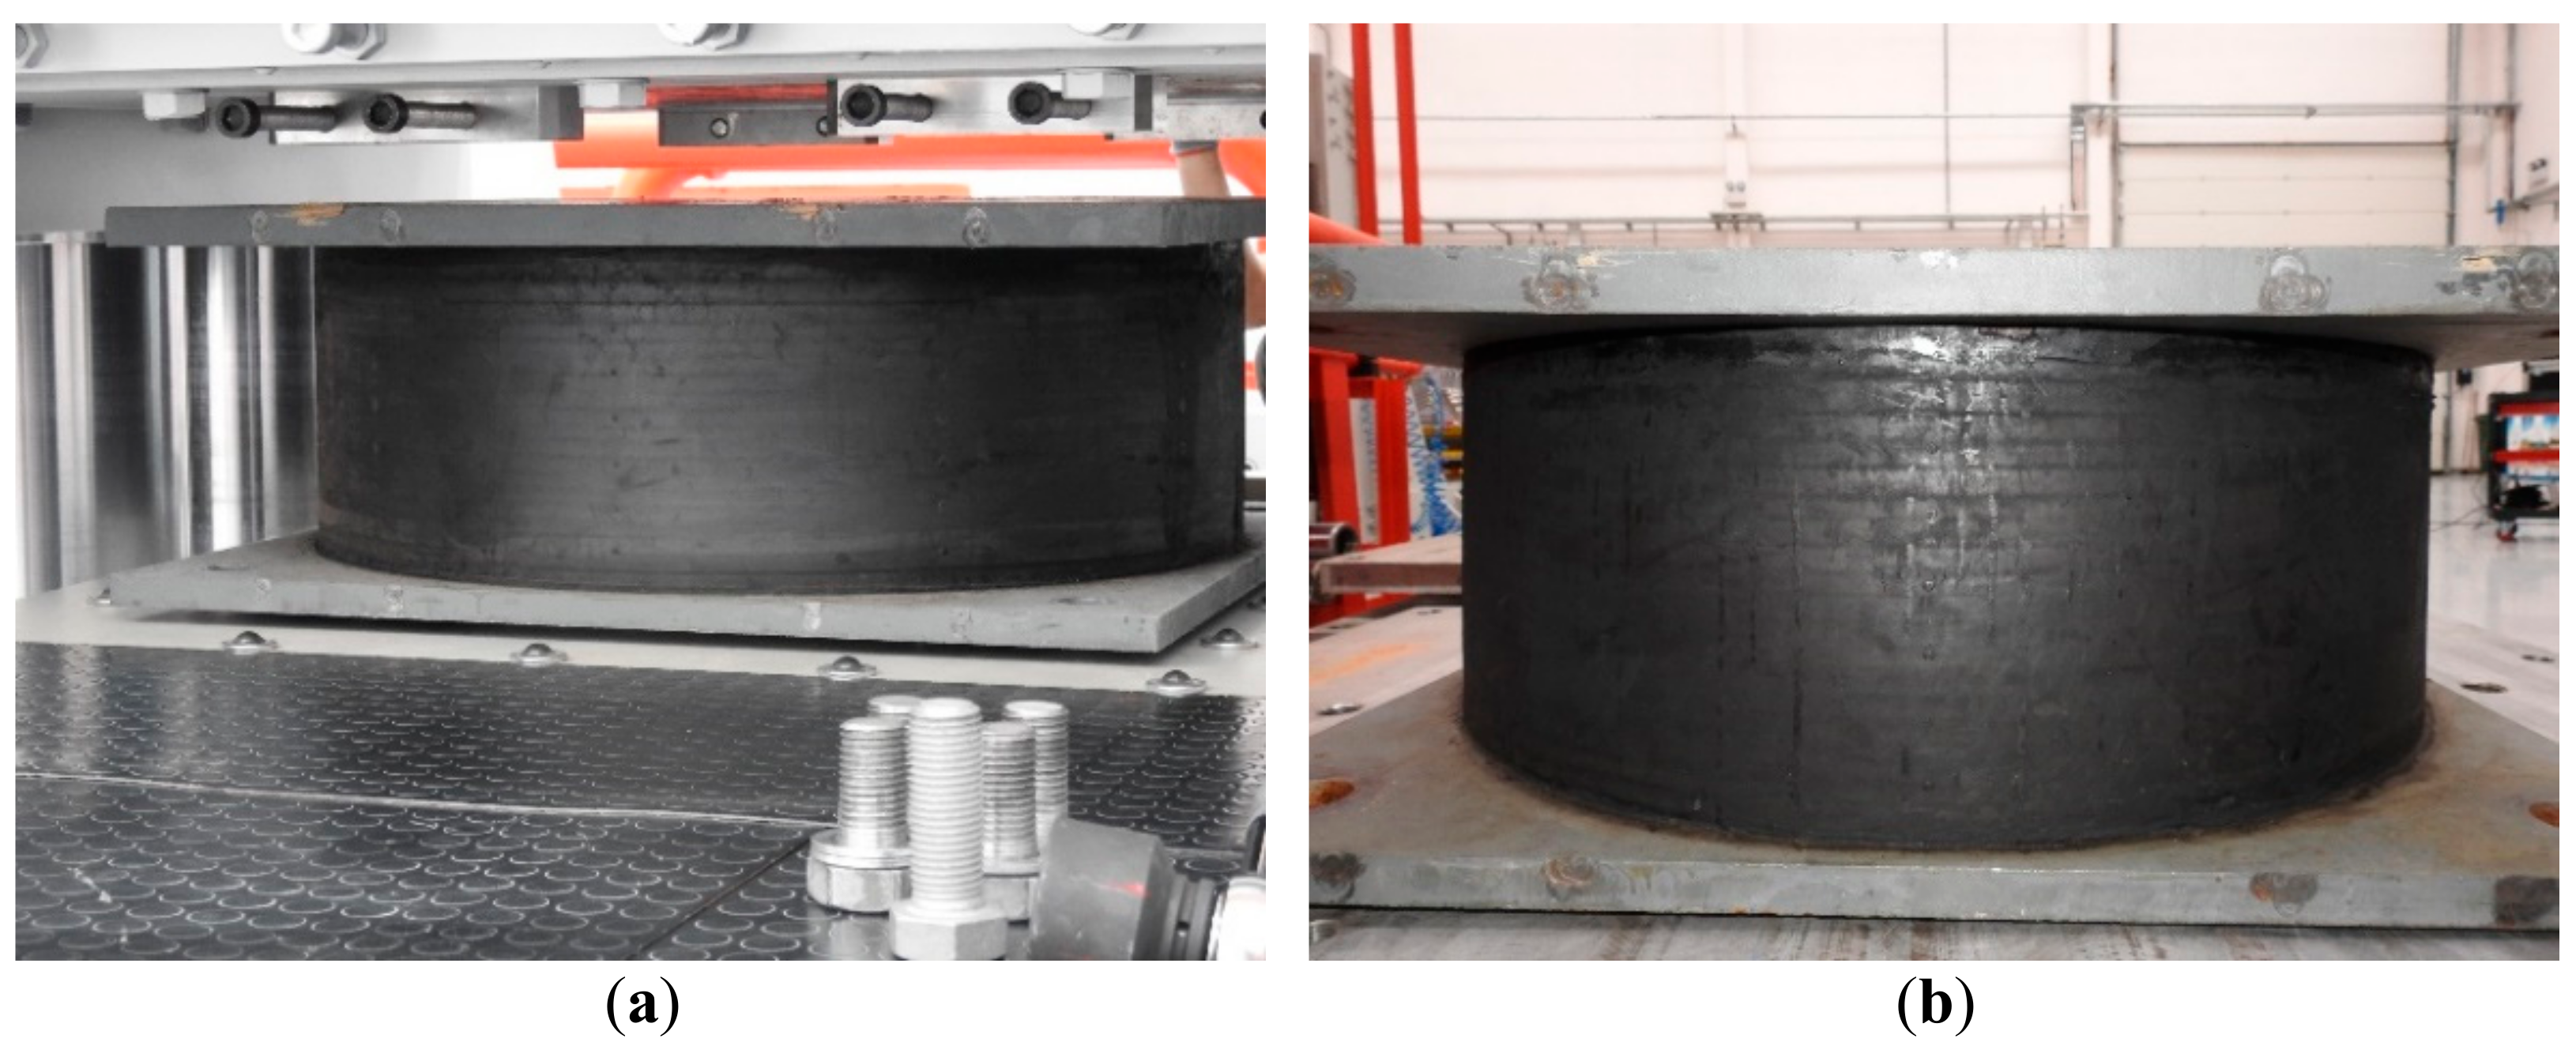
2.1. Test Specimen
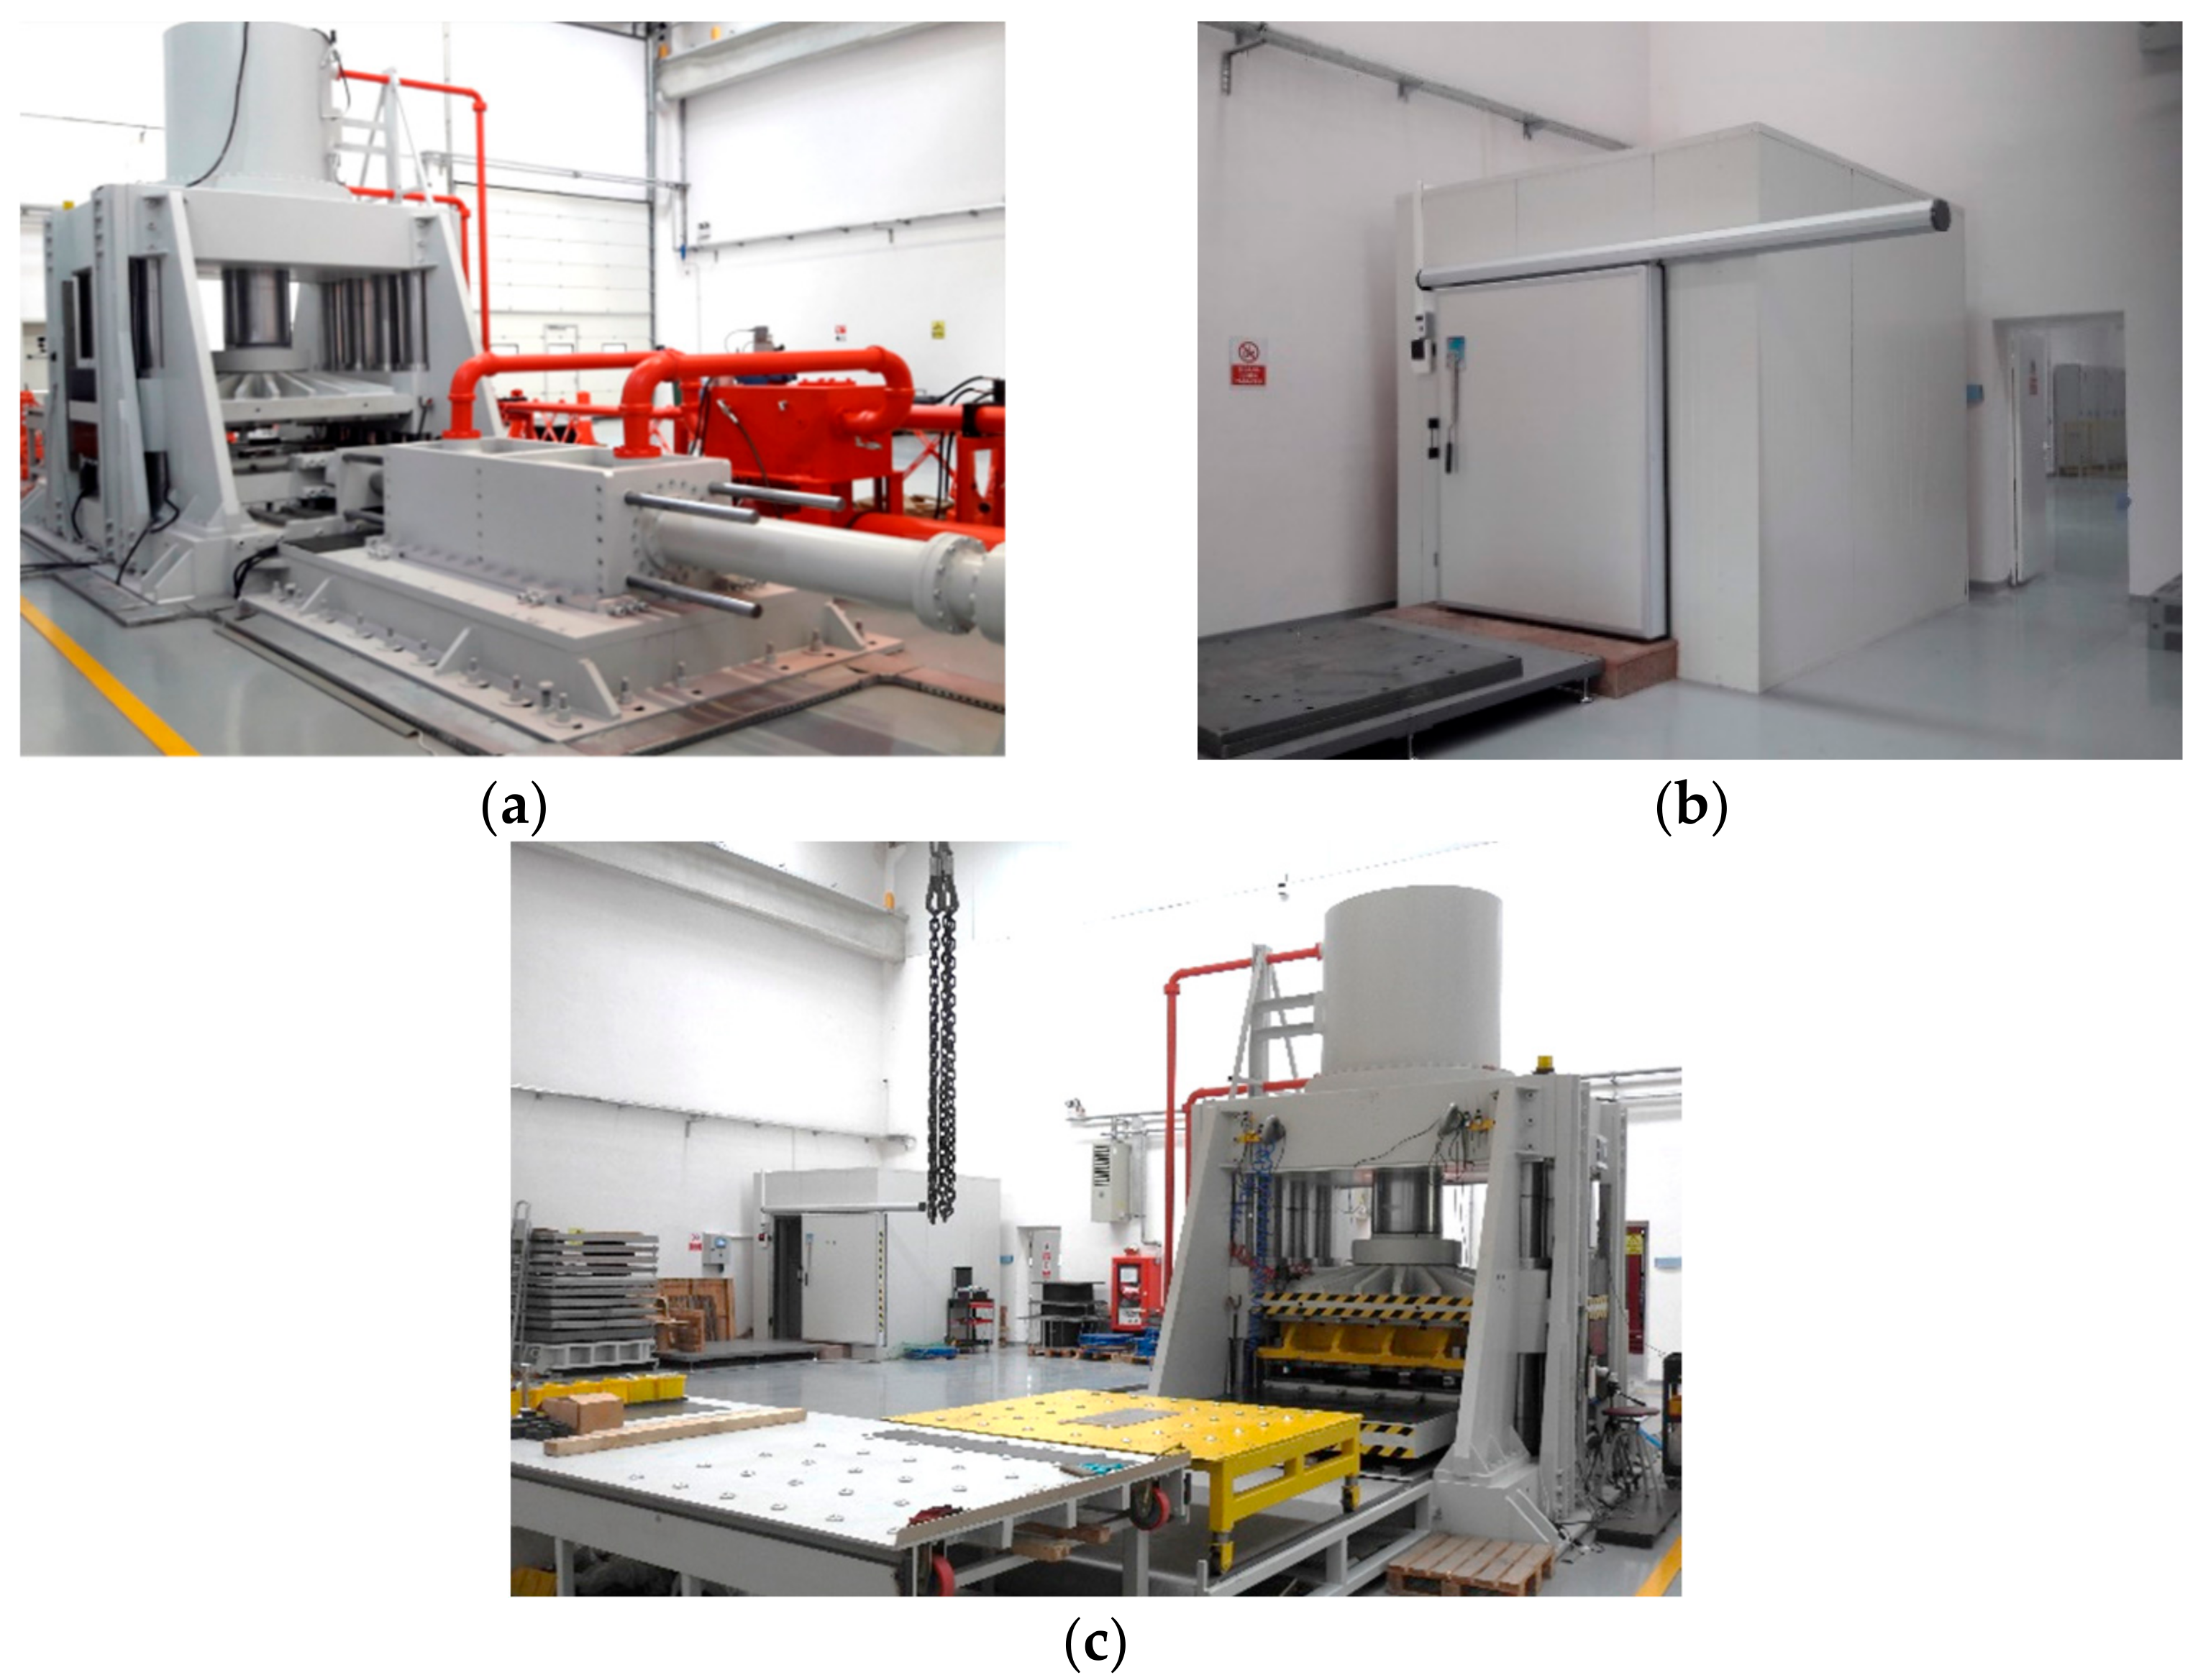
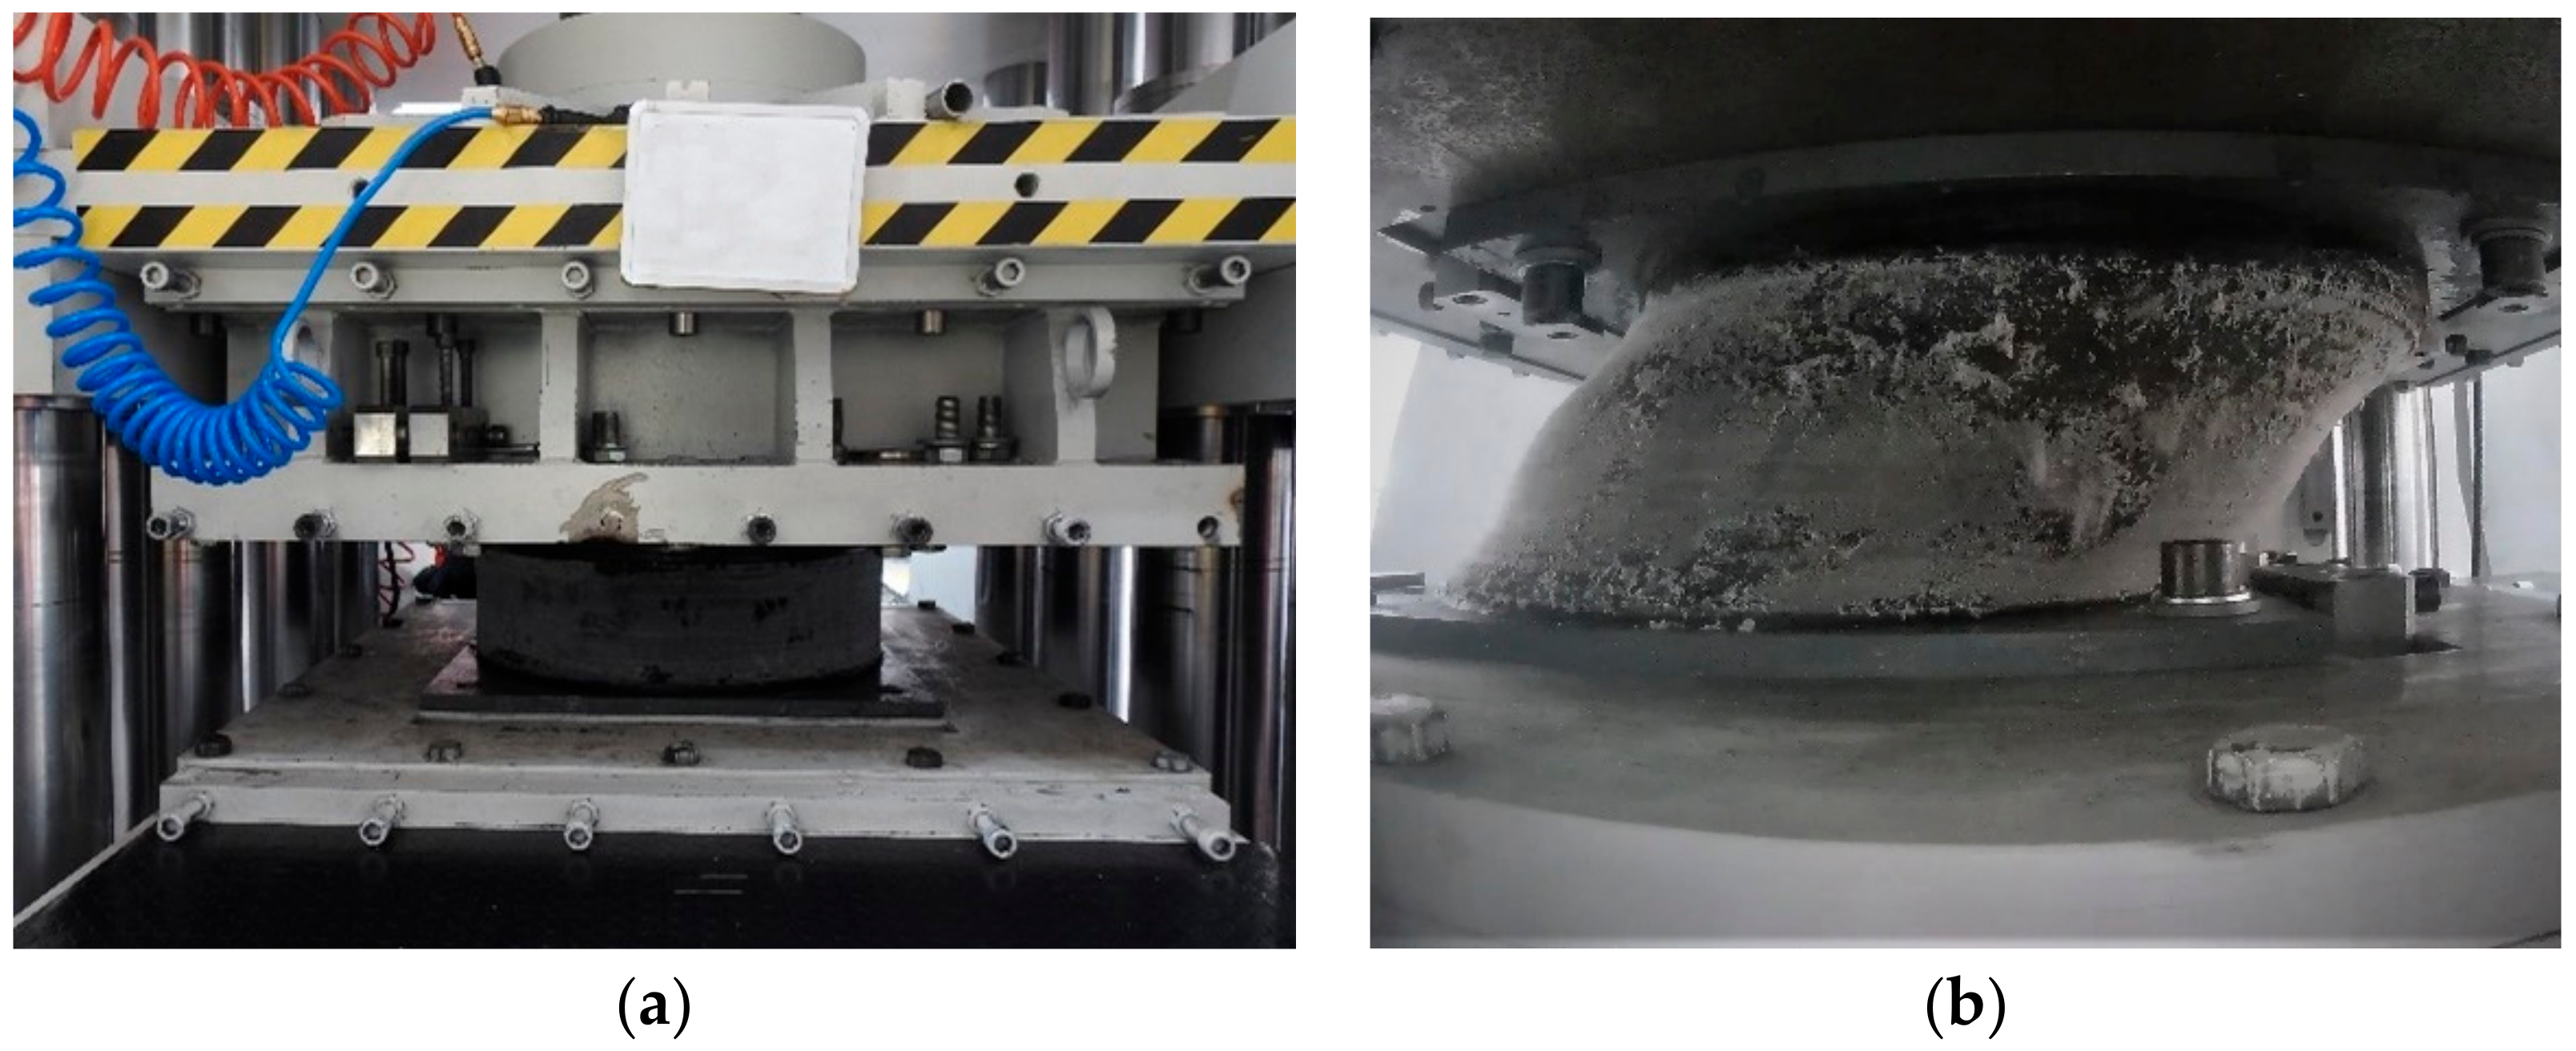
2.2. Test Setup
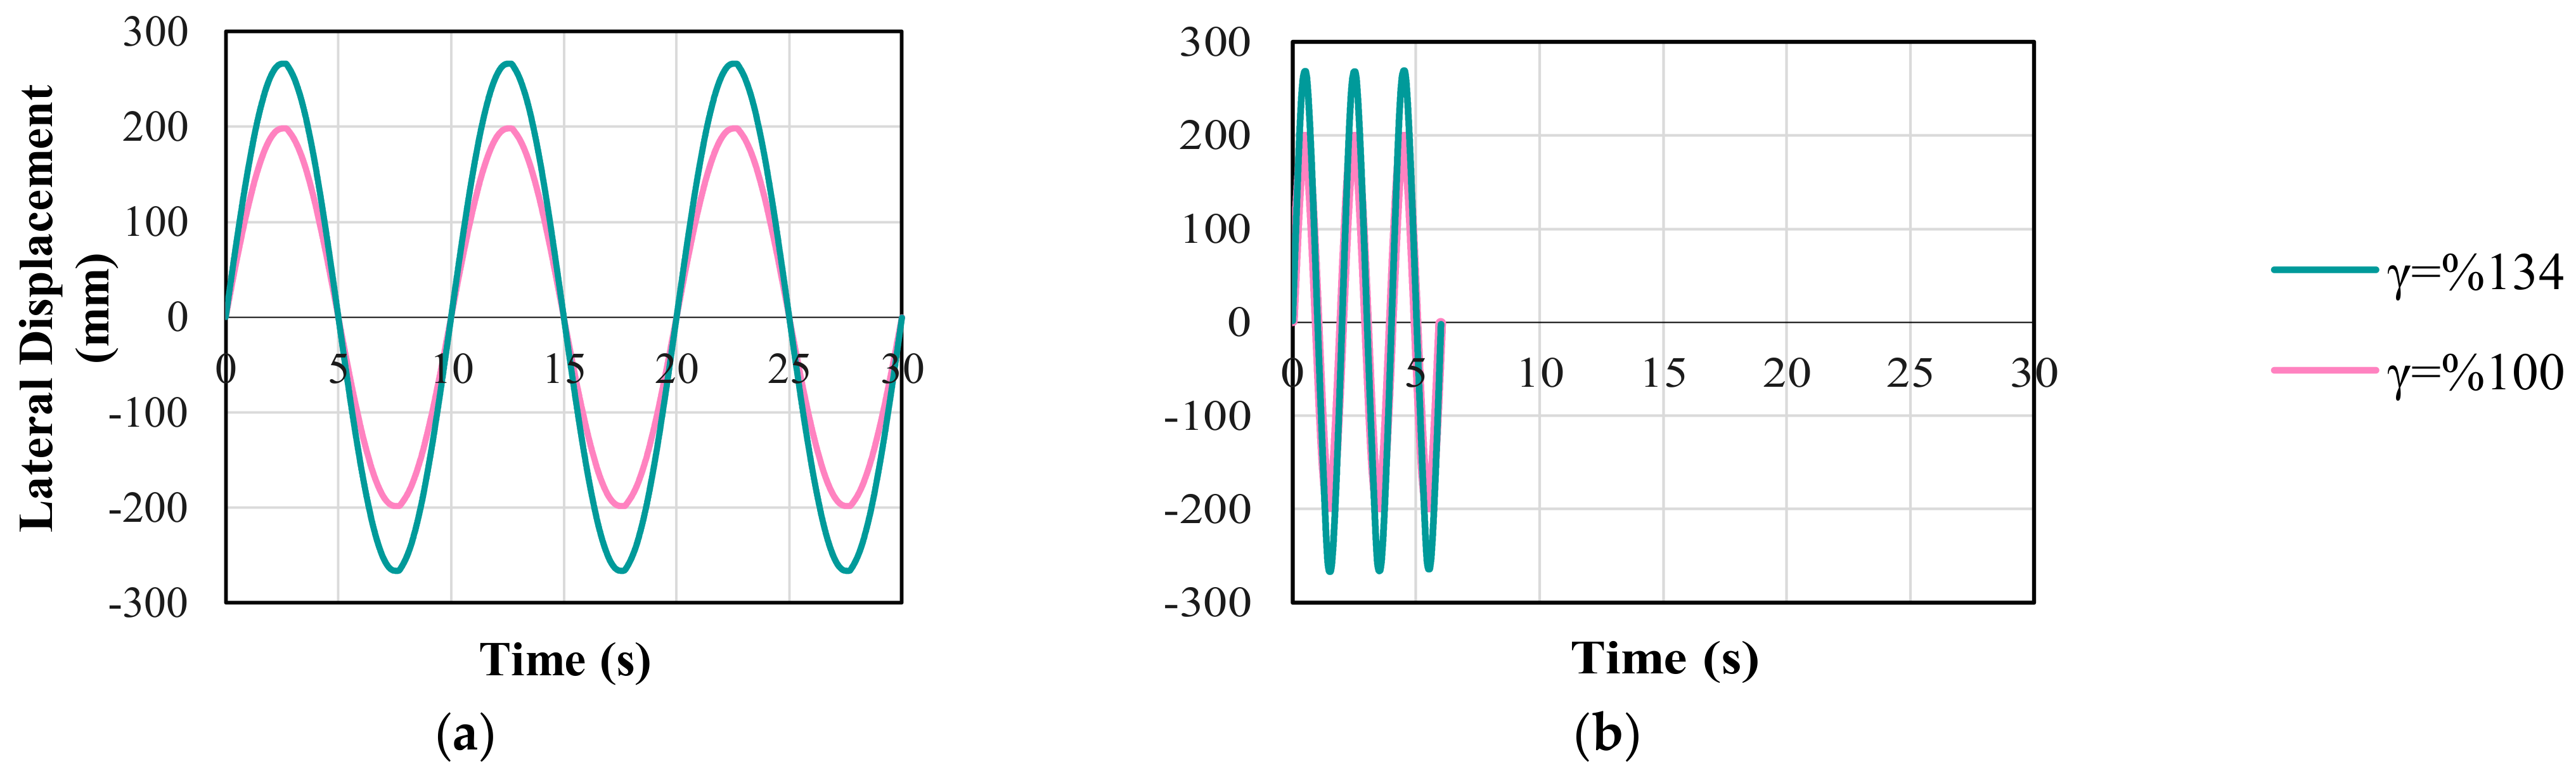
2.3. Test Program and Methodology
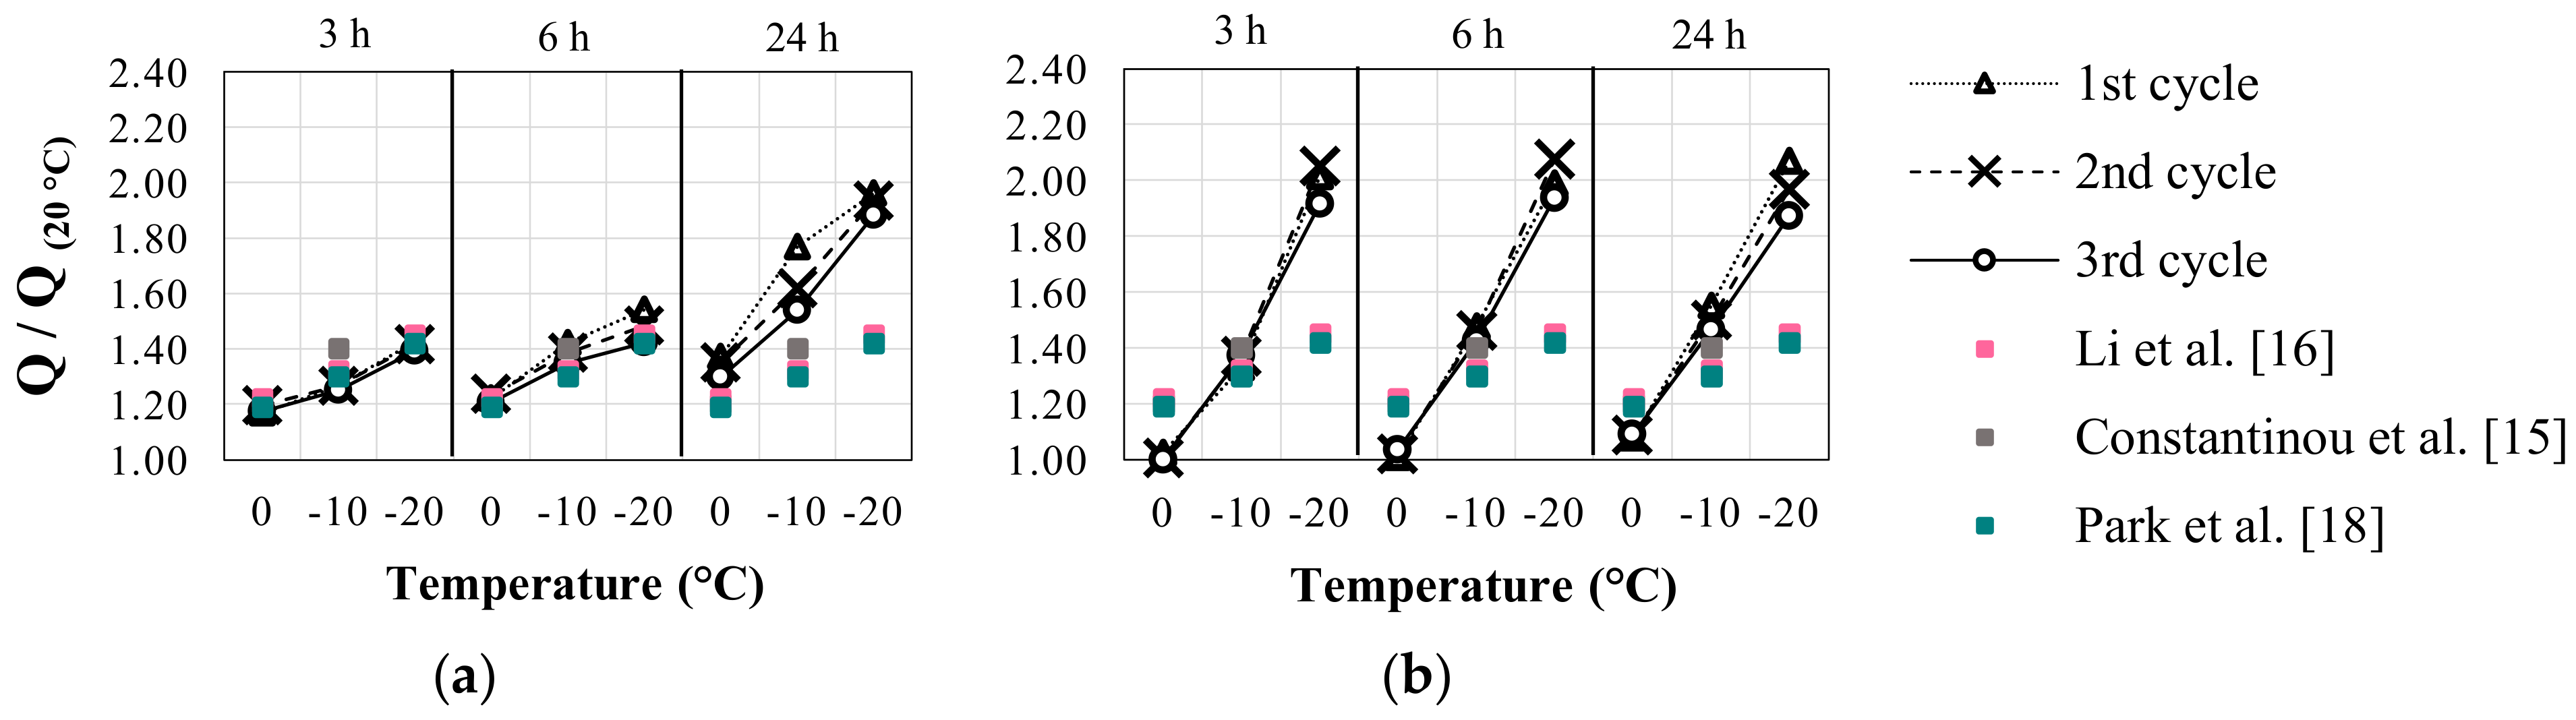
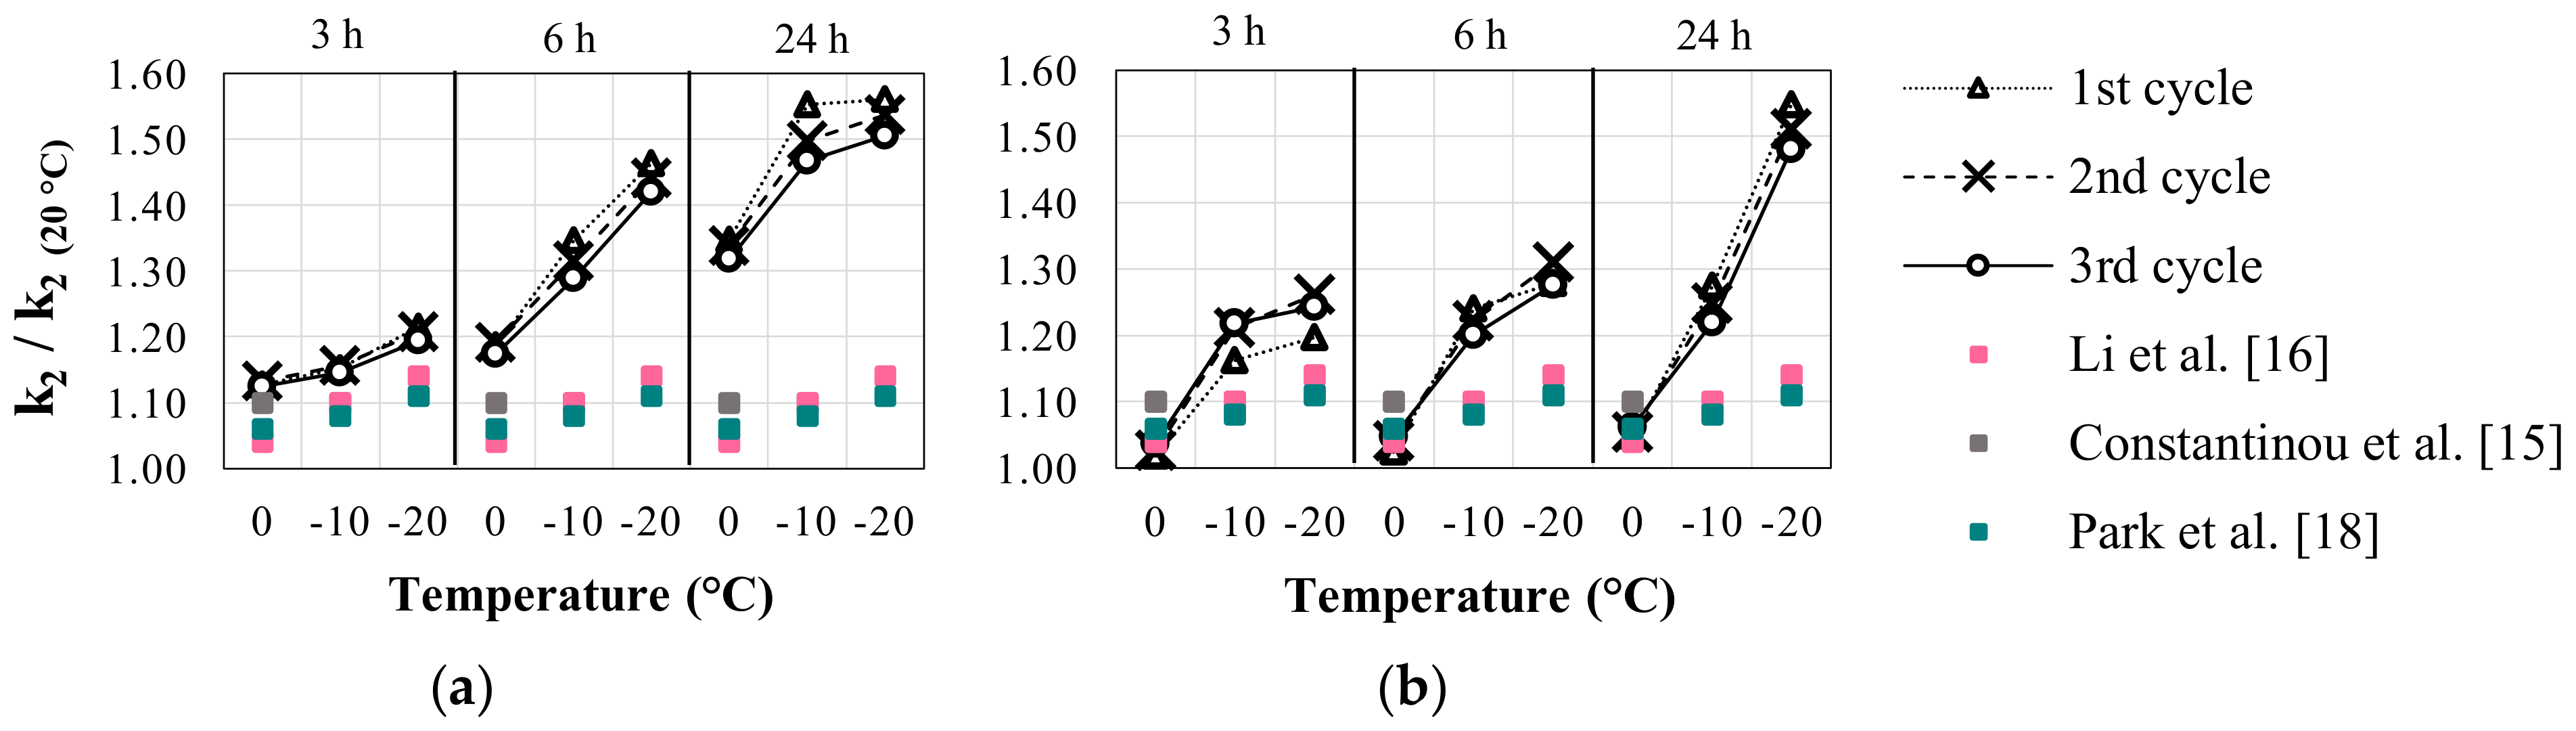
3. Experimental Results
4. Accuracy of the Existing Formulations to Estimate the Amplifications in Isolator Characteristics
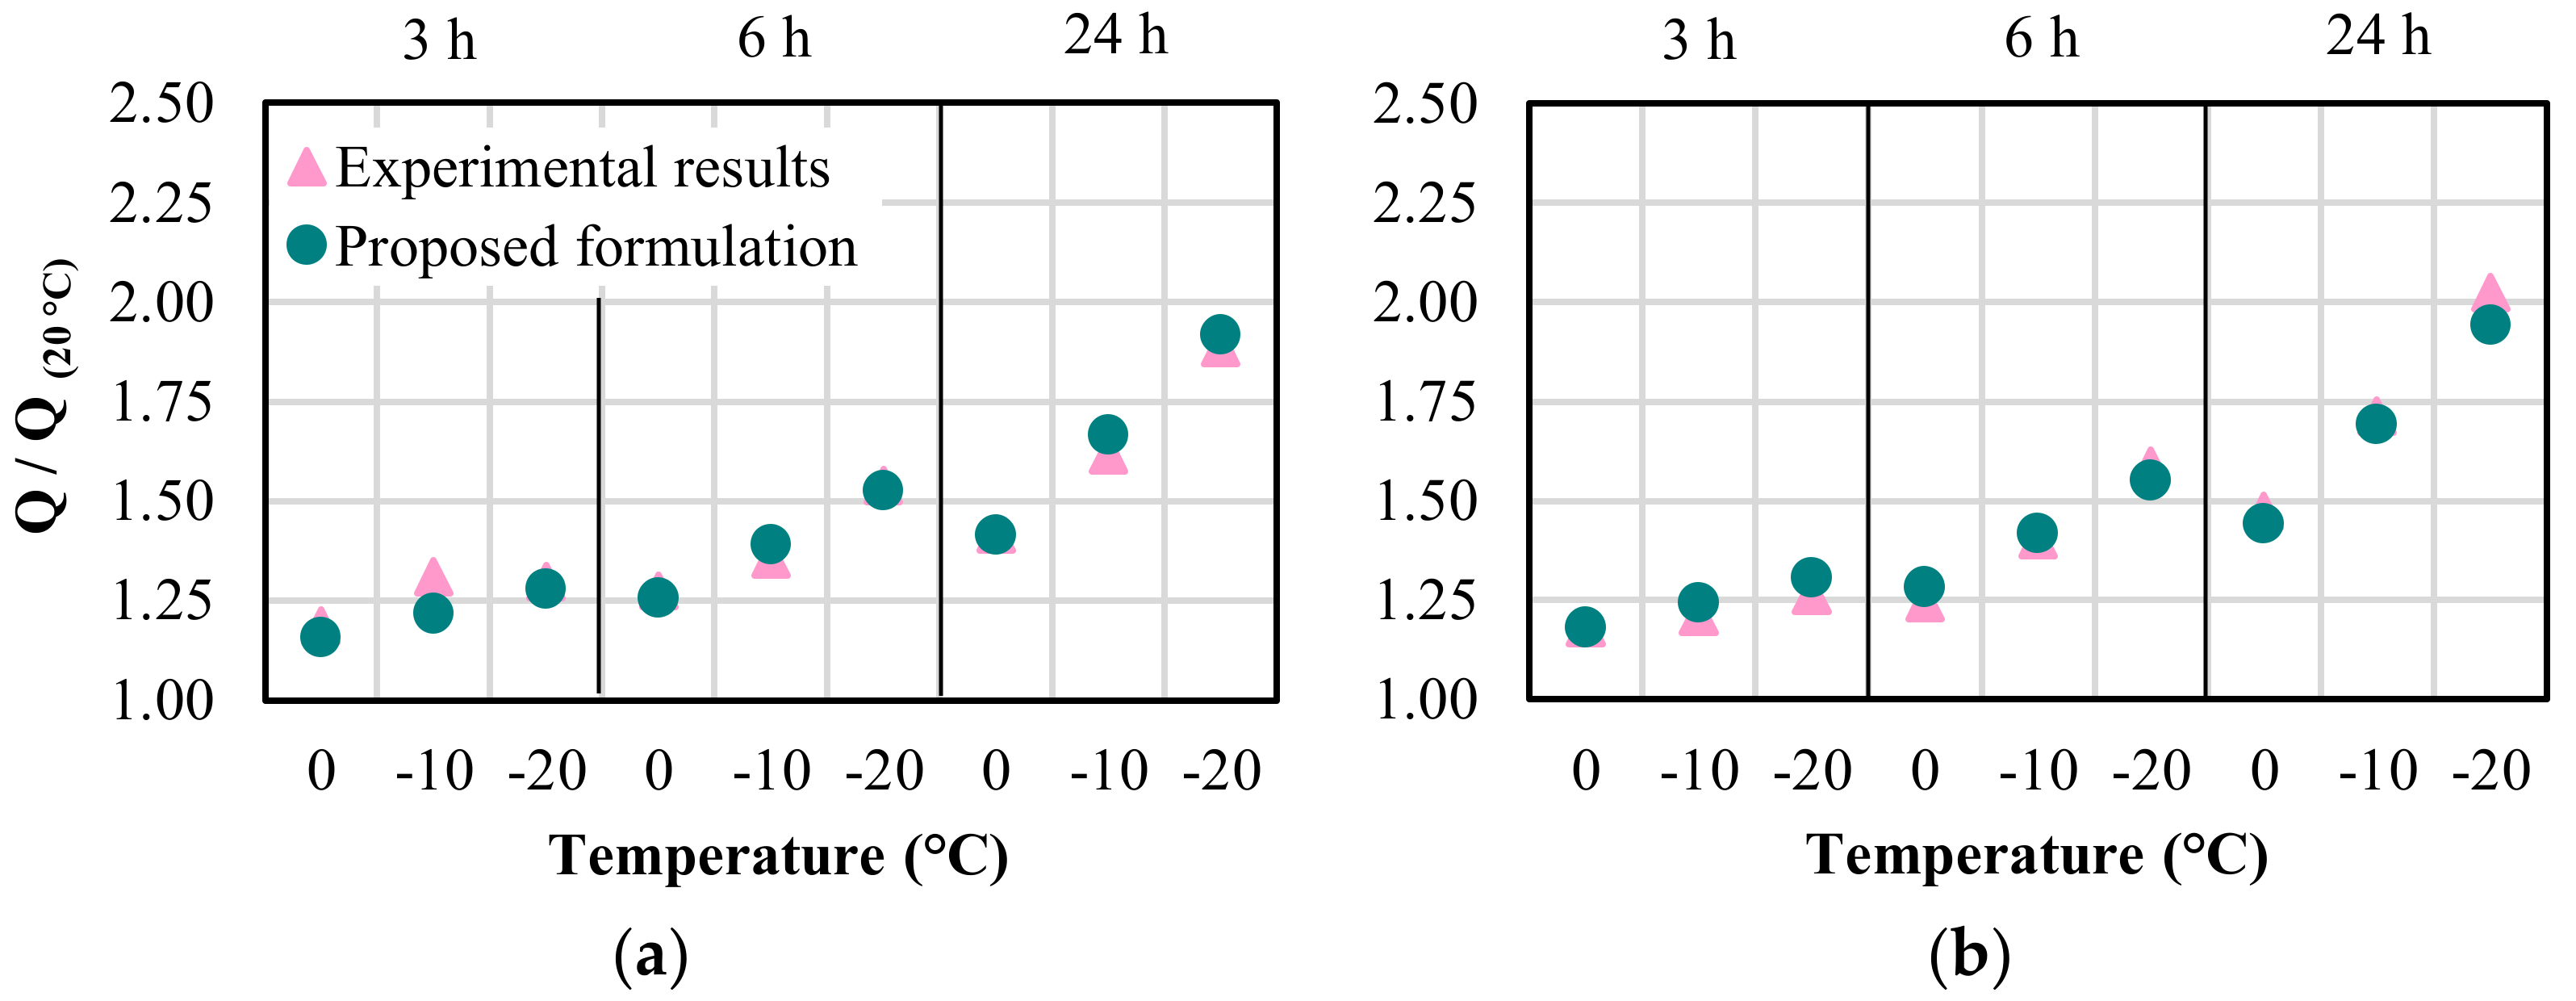
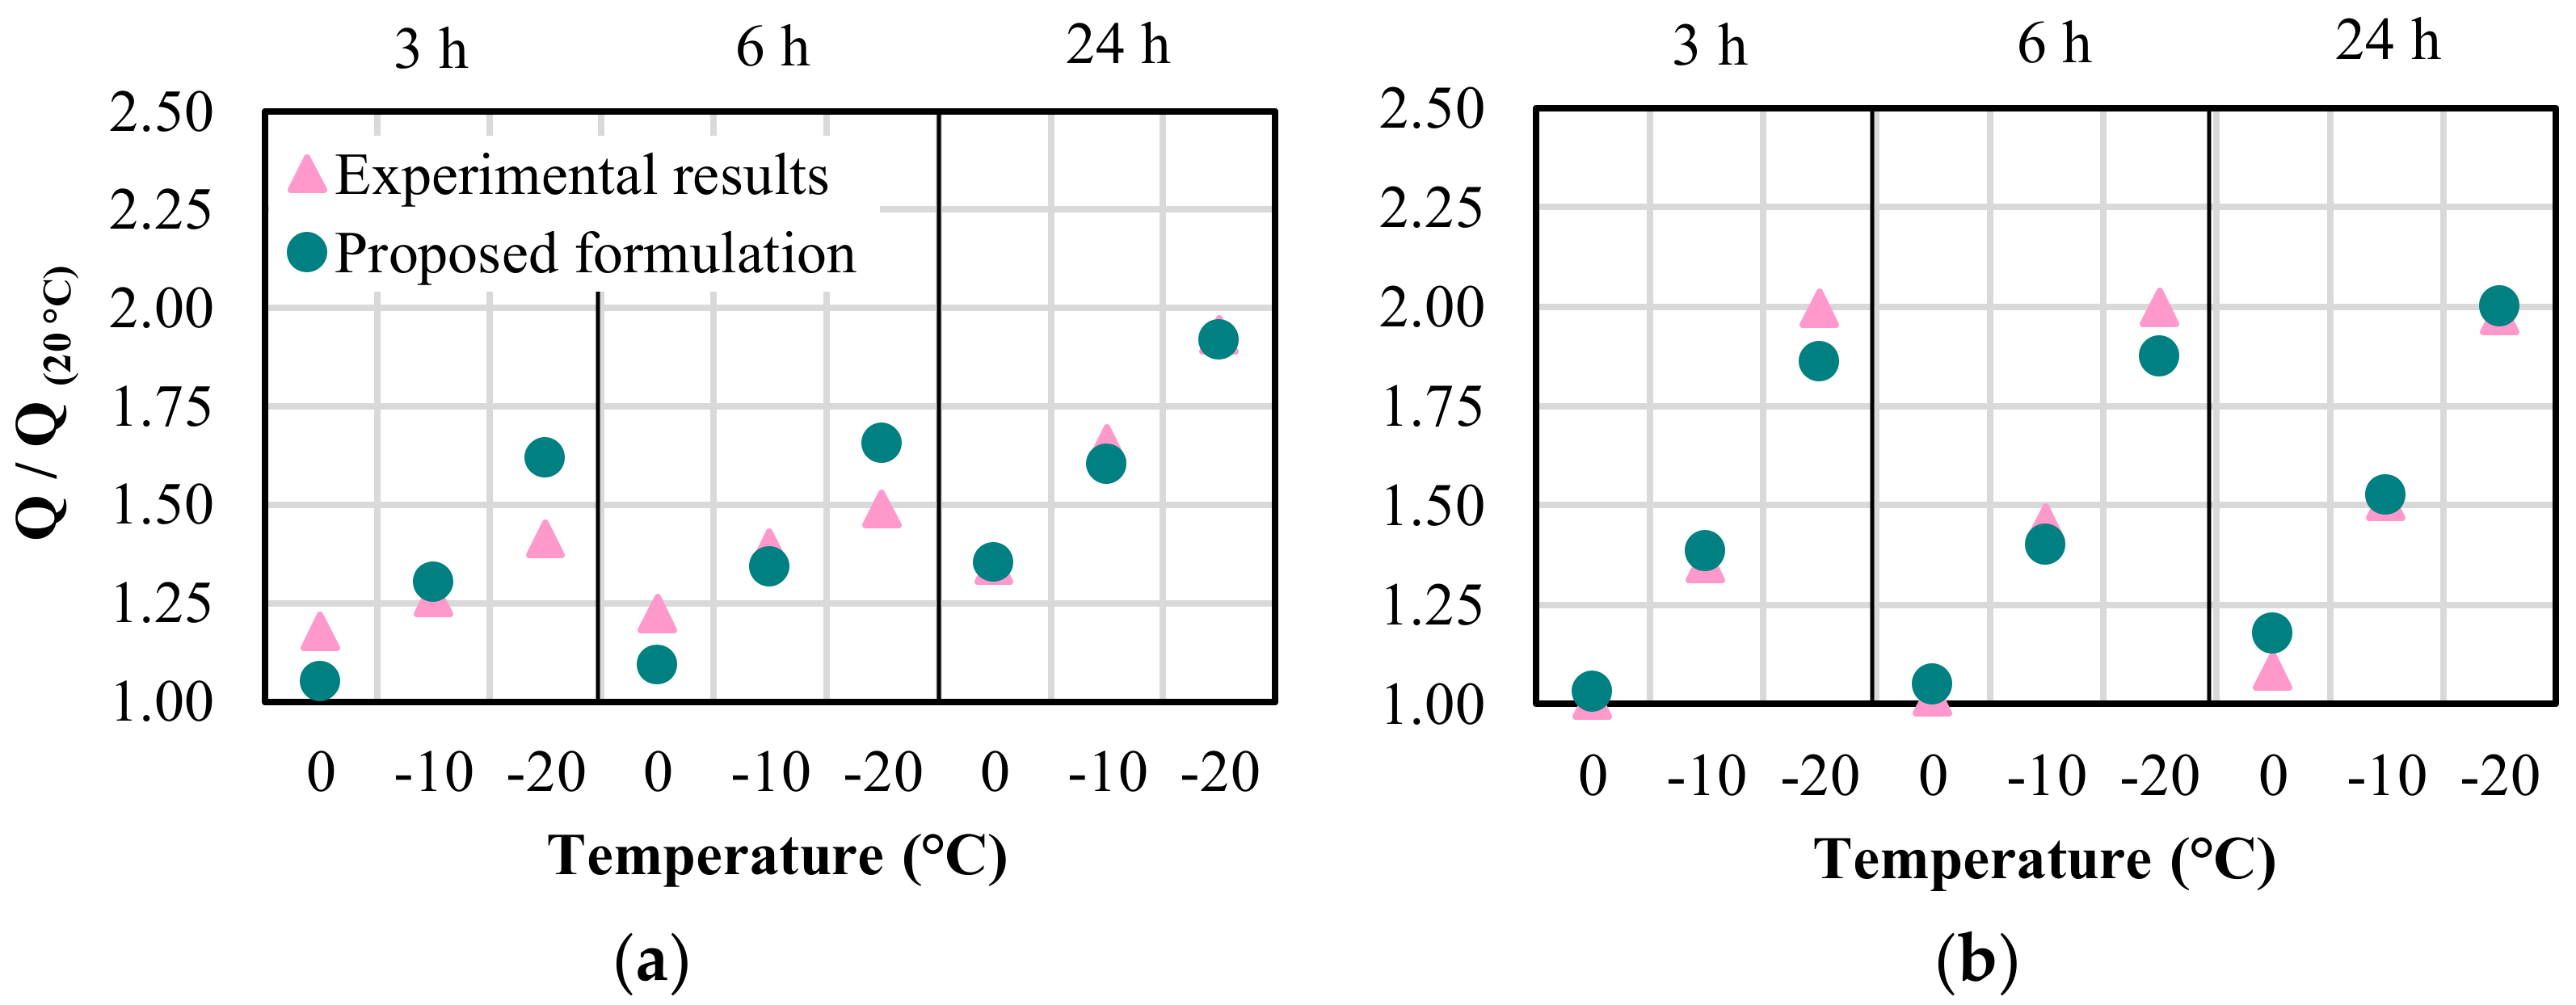
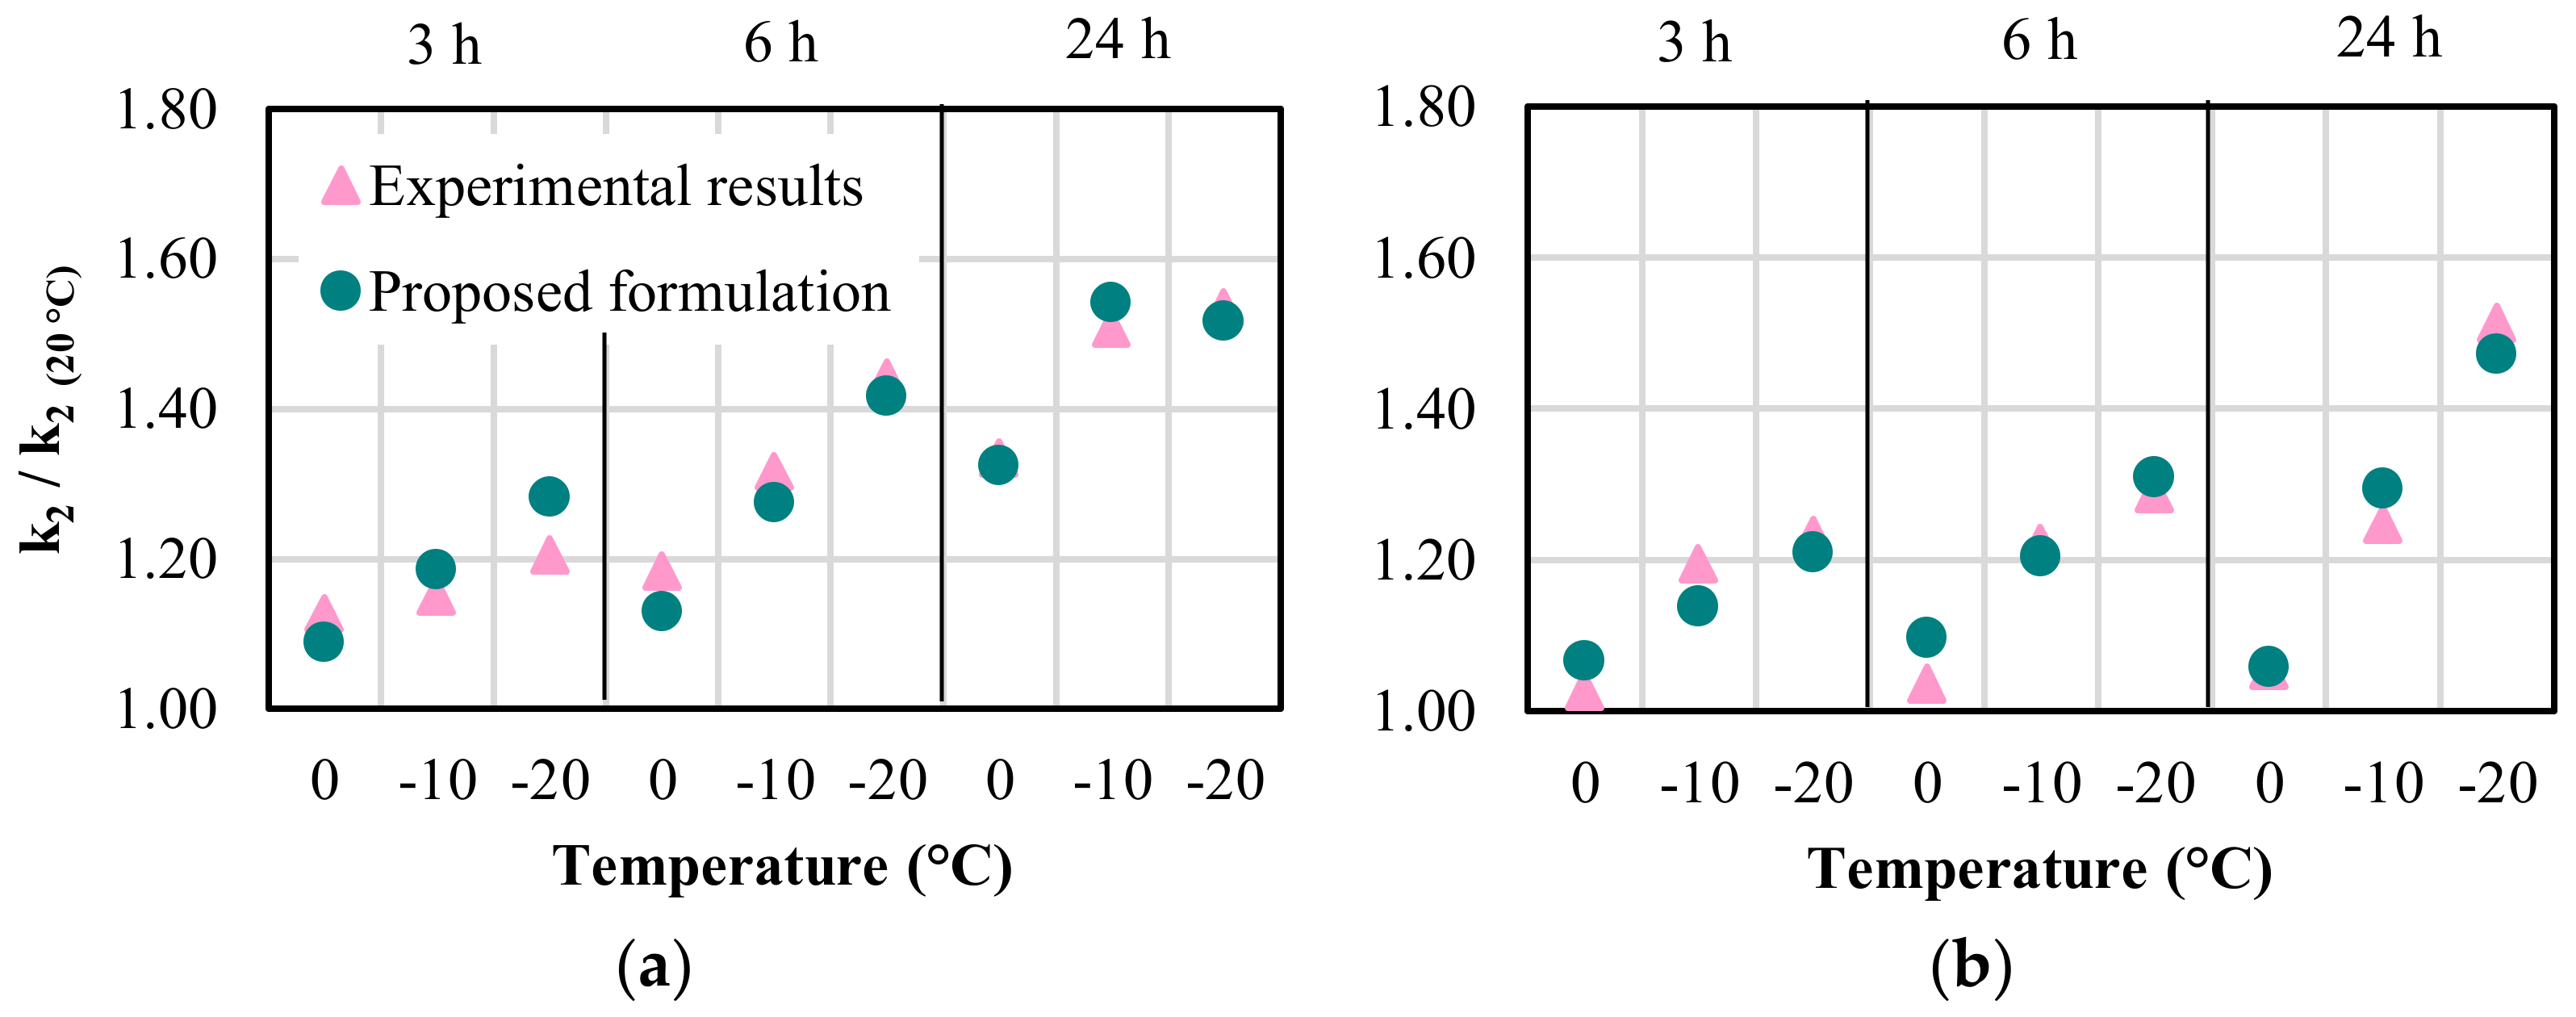
5. Proposed Formulations to Consider Also the Effects of Exposure Time and Loading Frequency
- i.
- Selection of the fitness function: Fitness is a measure that can evaluate the proposed model’s performance. For this problem, the fitness was measured by Equation (3) where R is the selection range, P(ij) is the estimation of the individual program i for fitness case j, and Tj is the target value for fitness case j. The maximum fitness value, fmax = 1000, uses an absolute error of 100 as the selection range, and error precision equals 0.01 with 10 fitness cases [26].
- ii.
- Selection of the set of function: For this problem, exponential and four arithmetic operator function sets are chosen, thus giving F = {+, −, *, /, Exp}.
- iii.
- Selection of the chromosomal architecture: GEP is composed of genes having two domains called the head and tail. The head domain is employed to codify the functions selected to represent the problem. On the other hand, the tail domain acts as a buffer to ensure the formation of only valid structures. For the selected problem, the length of the head (h) needs to be defined. In addition, the length of the tail (t) is a function of h. Three genes per chromosome and h = 7 were used in this study.
- iv.
- Selection of the linking function: GEP consists of two main parameters: chromosomes and expression trees (ETs). ETs are the representations of the genetic information codified in the chromosomes. The ETs can be composed of only one subunit or multi-subunit. Subunits are linked together by the linking function, which can be defined as addition, subtraction, multiplication, and division. In this study, we linked the sub-ETs via addition [26].
- v.
- Selection of the set of genetic operators: GEP takes an initial population and then evolves this population using one or more genetic operators. A combination of all modification operators, namely mutation, inversion, three types of transposition, and three types of recombination, was used in this study [26].
6. Conclusions
- Mechanical properties of the LRB, namely, characteristic strength and post-yield stiffness, increase as the temperature decreases. However, characteristic strength is more sensitive to temperature change than post-yield stiffness. The amplification factors computed for the characteristic strength of the LRB are larger than those obtained for post-yield stiffness and can reach up to two.
- Amplifications in both characteristic strength and post-elastic stiffness are highly sensitive to time of exposure to low temperatures. Longer exposure times resulted in larger amplifications in both properties of the LRB.
- The effect of loading velocity is more pronounced for post-yield stiffness. The amplifications computed for post-yield stiffness are larger in tests with 0.5 Hz frequency compared to those of 0.1 Hz. There is a tendency for amplifications of post-yield stiffness to increase with increasing loading velocity.
- The existing equations proposed to predict the amplifications in the characteristic strength and post-yield stiffness of LRBs at low temperatures are in lack of considering the effects of exposure time, loading frequency, and the amplitude of the motion. The empirical equations proposed in this study have considered all these effects, and their estimations are found to be in good agreement with experimental data.
Author Contributions
Funding
Data Availability Statement
Conflicts of Interest
References
- Skinner, R.I.; Robinson, W.H.; McVerry, G.H. An Introduction to Seismic Isolation; Wiley: New York, NY, USA, 1993. [Google Scholar]
- Naeim, F.; Kelly, J.M. Design of Seismic Isolated Structures: From Theory to Practice; Wiley: New York, NY, USA, 1999. [Google Scholar]
- Pan, P.; Zamfirescu, D.; Nakashima, M.; Nakayasu, N.; Kashiwa, H. Base-isolation design practice in Japan: Introduction to the post-kobe approach. J. Earthq. Eng. 2005, 9, 147–171. [Google Scholar] [CrossRef]
- Roeder, C.W.; Stanton, J.F.; Feller, T. Low-temperature performance of elastomeric bearings. J. Cold Reg. Eng. 1990, 4, 113–132. [Google Scholar] [CrossRef]
- Yakut, A.; Yura, J.A. Parameters influencing performance of elastomeric bearings at low temperatures. J. Struct. Eng. 2002, 128, 986–994. [Google Scholar] [CrossRef]
- Yakut, A.; Yura, J.A. Evaluation of low-temperature test methods for elastomeric bridge bearings. J. Bridge Eng. 2002, 7, 50–56. [Google Scholar] [CrossRef]
- Fuller, K.N.G.; Gough, J.; Thomas, A.G. The effect of low-temperature crystallization on the mechanical behaviour of rubber. J. Polym. Sci. Part B Polym. Phys. 2004, 42, 2181–2190. [Google Scholar] [CrossRef]
- Pınarbası, S.; Akyuz, U. Seismic isolation and elastomeric bearing tests. IMO Tech. J. 2005, 237, 3581–3598. [Google Scholar]
- Pınarbasi, S.; Akyuz, U.; Ozdemir, G. An experimental study on low temperature behavior of elastomeric bridge bearing. In Proceedings of the 10th World Conference on Seismic Isolation, Energy Dissipation and Active Vibrations Control of Structures, Istanbul, Turkey, 28–31 May 2007. [Google Scholar]
- Cardone, D.; Gesualdi, G. Experimental evaluation of the mechanical behavior of elastomeric materials for seismic applications at different air temperatures. Int. J. Mech. Sci. 2012, 64, 127–143. [Google Scholar] [CrossRef]
- Ozturk, H. Effects of Lead Core Heating on the Response of Isolated-Base and Fixed-Base Regular and Irregular Reinforced Concrete Structures. Buildings 2022, 12, 1087. [Google Scholar] [CrossRef]
- Fujii, K.; Mogi, Y.; Noguchi, T. Predicting maximum and cumulative response of a base-isolated building using pushover analyses. Buildings 2020, 10, 91. [Google Scholar] [CrossRef]
- Robinson, W.H. Lead-rubber hysteretic bearings suitable for protecting structures during earthquakes. Earthq. Eng. Struct. Dyn. 1982, 10, 593–604. [Google Scholar] [CrossRef]
- Hasegawa, O.; Shimoda, I.; Ikenaga, M. Characteristic of lead rubber bearing by temperature. In Summaries of Technical Papers of Annual Meeting Architectural Institute of Japan, B-2, Structures II, Structural Dynamics Nuclear Power Plants; Architectural Institute of Japan: Tokyo, Japan, 1997; pp. 511–512. (In Japanese) [Google Scholar]
- Constantinou, M.C.; Whittaker, A.S.; Kalpakidis, Y.; Fenz, D.M.; Warn, G.P. Performance of seismic isolation hardware under service and seismic loading. In Technical Report, MCEER-07-0012, Multidisciplinary Center for Earthquake Engineering Research; State University of New York: Buffalo, NY, USA, 2007. [Google Scholar]
- Li, J.; Ye, K.; Jiang, Y.C. Thermal effect on the mechanical behavior of lead-rubber bearing. J. Huazhong Univ. Sci. Technol. Med. Sci. 2009, 138, 867–876. [Google Scholar]
- Cho, C.B.; Khawk, I.J.; Kim, Y.J. An experimental study for the shear property and the temperature dependency of seismic isolation bearings. J. Earthq. Eng. Soc. Korea 2008, 12, 67–77. [Google Scholar]
- Park, J.Y.; Jang, K.S.; Lee, H.P.; Lee, Y.H.; Kim, H. Experimental study on the temperature dependency of full-scale low hardness lead rubber bearing. J. Comput. Struct. Eng. Inst. Korea 2012, 25, 533–540. [Google Scholar] [CrossRef] [Green Version]
- Mendez-Galindo, C.; Moor, G.; Rassy, S. Lead rubber bearings for seismic isolation of structures in cold climates-new developments. In Proceedings of the 39th IABSE Symposium–Engineering the Future, Vancouver, BC, Canada, 21–23 September 2017; pp. 54–63. [Google Scholar]
- Zhang, R.; Li, A. Experimental study on temperature dependence of mechanical properties of scaled high-performance rubber bearings. Compos. Part B Eng. 2020, 190, 107932. [Google Scholar] [CrossRef]
- Cavdar, E.; Ozdemir, G.; Karuk, V. Modification in response of a bridge seismically isolated with lead rubber bearings exposed to low temperature. IMO Tech. J. 2022, 33, 12553–12576. [Google Scholar]
- EN 15129:2018; Anti-Seismic Devices. European Committee for Standardization (CEN): Brussel, Belgium, 2018.
- Kalpakidis, I.; Constantinou, M.C.; Whittaker, A.S. Modeling strength degradation in lead-rubber bearings under earthquake shaking. Earthq. Eng. Struct. Dyn. 2010, 39, 1533–1549. [Google Scholar] [CrossRef]
- Cramer, N.L. A representation for the adaptive generation of simple sequential programs. In Proceedings of the First International Conference on Genetic Algorithms and Their Applications; Grefenstette, J.J., Ed.; Psychology Press: London, UK, 1985; pp. 183–187. [Google Scholar]
- Koza, J.R. Genetic Programming: On the Programming of Computers by Means of Natural Selection; MIT Press: Cambridge, MA, USA, 1992. [Google Scholar]
- Ferreira, C. Gene Expression Programming, Mathematical Modeling by an Artificial Intelligence (Studies in Computational Intelligence); Springer: Secaucus, NJ, USA, 2002. [Google Scholar]
- Soh, C.K.; Yang, Y. Genetic programming-based approach for structural optimization. J. Comput. Civ. Eng. 2000, 14, 31–37. [Google Scholar] [CrossRef]
- Ashour, A.F.; Alvarez, L.F.; Toropov, V.V. Empirical modelling of shear strength of RC deep beams by genetic programming. Comput. Struct. 2003, 81, 331–338. [Google Scholar] [CrossRef]
- Gandomi, A.H.; Alavi, A.H.; Sahab, M.G.; Arjmandi, P. Formulation of elastic modulus of concrete using linear genetic programming. J. Mech. Sci. Technol. 2010, 24, 1273–1278. [Google Scholar] [CrossRef]
- Chen, H.M.; Kao, W.K.; Tsai, H.C. Genetic programming for predicting a seismic abilities of school buildings. Eng. Appl. Artif. Intell. 2012, 25, 1103–1113. [Google Scholar] [CrossRef]
- Caglar, N.; Demir, A.; Ozturk, H.; Akkaya, A. A simple formulation for effective flexural stiffness of circular reinforced concrete columns. Eng. Appl. Artif. Intell. 2015, 38, 79–87. [Google Scholar] [CrossRef]
- GeneXproTools. Gene Expression Programming Tools. Gepsoft Limited, 2000, 73 Elmtree Drive Bristol BS 13 8NA United Kingdom. Available online: http://www.gepsoft.com (accessed on 8 November 2022).


| Test No | Temperature | Exposure Time (h) | Shear Strain (%) | Frequency (Hz) | Cycle Number |
|---|---|---|---|---|---|
| 1 | 20 °C | - | 100, 134 | 0.1, 0.5 | 3 |
| 2 | 0 °C | 3, 6, 24 | 100, 134 | 0.1, 0.5 | 3 |
| 3 | −10 °C | 3, 6, 24 | 100, 134 | 0.1, 0.5 | 3 |
| 4 | −20 °C | 3, 6, 24 | 100, 134 | 0.1, 0.5 | 3 |
| Temperature (°C) | −20 | −10 | 0 | 20 | |||||||
|---|---|---|---|---|---|---|---|---|---|---|---|
| Exposure Time (h) | 3 | 6 | 24 | 3 | 6 | 24 | 3 | 6 | 24 | - | |
| 100% Shear Strain | k2 (1st cycle), kN/m | 2286 | 2564 | 3054 | 2288 | 2442 | 2748 | 2234 | 2312 | 2518 | 2224 |
| k2 (2nd cycle), kN/m | 2196 | 2525 | 2919 | 2177 | 2368 | 2626 | 2127 | 2236 | 2398 | 2104 | |
| k2 (3rd cycle), kN/m | 2124 | 2404 | 2752 | 2101 | 2262 | 2476 | 2046 | 2143 | 2284 | 2017 | |
| Q (1st cycle), kN | 296 | 344 | 433 | 298 | 310 | 373 | 269 | 291 | 321 | 222 | |
| Q (2nd cycle), kN | 253 | 305 | 373 | 255 | 267 | 319 | 232 | 250 | 280 | 196 | |
| Q (3rd cycle), kN | 224 | 268 | 318 | 224 | 230 | 272 | 206 | 219 | 244 | 178 | |
| 134% Shear Strain | k2 (1st cycle), kN/m | 1941 | 2080 | 2450 | 1914 | 1987 | 2168 | 1908 | 1934 | 2031 | 1822 |
| k2 (2nd cycle), kN/m | 1848 | 1984 | 2270 | 1829 | 1916 | 2062 | 1815 | 1848 | 1936 | 1745 | |
| k2 (3rd cycle), kN/m | 1781 | 1904 | 2158 | 1768 | 1841 | 1973 | 1757 | 1784 | 1858 | 1697 | |
| Q (1st cycle), kN | 297 | 385 | 493 | 282 | 331 | 413 | 272 | 294 | 352 | 226 | |
| Q (2nd cycle), kN | 244 | 306 | 391 | 234 | 272 | 330 | 229 | 240 | 285 | 194 | |
| Q (3rd cycle), kN | 209 | 254 | 320 | 204 | 231 | 276 | 201 | 206 | 240 | 175 | |
| Temperature (°C) | −20 | −10 | 0 | 20 | |||||||
|---|---|---|---|---|---|---|---|---|---|---|---|
| Exposure Time (h) | 3 | 6 | 24 | 3 | 6 | 24 | 3 | 6 | 24 | - | |
| 100% Shear Strain | k2 (1st cycle), kN/m | 2431 | 2928 | 3122 | 2303 | 2694 | 3106 | 2254 | 2373 | 2695 | 2000 |
| k2 (2nd cycle), kN/m | 2251 | 2687 | 2866 | 2155 | 2452 | 2792 | 2113 | 2221 | 2496 | 1865 | |
| k2 (3rd cycle), kN/m | 2158 | 2568 | 2721 | 2070 | 2331 | 2652 | 2033 | 2122 | 2382 | 1808 | |
| Q (1st cycle), kN | 223 | 241 | 307 | 198 | 223 | 277 | 183 | 191 | 215 | 156 | |
| Q (2nd cycle), kN | 185 | 194 | 253 | 166 | 181 | 212 | 156 | 162 | 177 | 131 | |
| Q (3rd cycle), kN | 170 | 174 | 230 | 153 | 165 | 188 | 143 | 147 | 158 | 122 | |
| 134% Shear Strain | k2 (1st cycle), kN/m | 2529 | 2700 | 3271 | 2456 | 2620 | 2693 | 2153 | 2163 | 2214 | 2113 |
| k2 (2nd cycle), kN/m | 2415 | 2506 | 2892 | 2319 | 2337 | 2388 | 1965 | 1990 | 2017 | 1914 | |
| k2 (3rd cycle), kN/m | 2275 | 2333 | 2707 | 2227 | 2197 | 2230 | 1897 | 1915 | 1943 | 1829 | |
| Q (1st cycle), kN | 477 | 472 | 490 | 315 | 350 | 368 | 243 | 239 | 256 | 237 | |
| Q (2nd cycle), kN | 389 | 393 | 373 | 260 | 277 | 284 | 191 | 193 | 206 | 190 | |
| Q (3rd cycle), kN | 330 | 333 | 322 | 237 | 246 | 253 | 171 | 178 | 188 | 172 | |
| Parameters | Temperature | |||
|---|---|---|---|---|
| 0 °C | −10 °C | −20 °C | ||
| Constantinou et al. [15] | Q | 1.20 | 1.40 | – |
| k2 | 1.10 | 1.10 | – | |
| Li et al. [16] | Q | 1.22 | 1.32 | 1.45 |
| k2 | 1.04 | 1.10 | 1.14 | |
| Park et al. [18] | Q | 1.19 | 1.30 | 1.42 |
| k2 | 1.06 | 1.08 | 1.11 | |
| Loading Frequency | Characteristic Strength |
|---|---|
| 0.1 Hz | |
| 0.5 Hz |
| Loading Frequency | Post-Yield Stiffness |
|---|---|
| 0.1 Hz | |
| 0.5 Hz |
| Loading Frequency | Mechanical Property | Best Fitness |
|---|---|---|
| 0.1 Hz | Q | 930 |
| 0.1 Hz | k2 | 979 |
| 0.5 Hz | Q | 906 |
| 0.5 Hz | k2 | 957 |
Disclaimer/Publisher’s Note: The statements, opinions and data contained in all publications are solely those of the individual author(s) and contributor(s) and not of MDPI and/or the editor(s). MDPI and/or the editor(s) disclaim responsibility for any injury to people or property resulting from any ideas, methods, instructions or products referred to in the content. |
© 2023 by the authors. Licensee MDPI, Basel, Switzerland. This article is an open access article distributed under the terms and conditions of the Creative Commons Attribution (CC BY) license (https://creativecommons.org/licenses/by/4.0/).
Share and Cite
Yasar, C.; Karuk, V.; Kaplan, O.; Cavdar, E.; Ozdemir, G. Amplification in Mechanical Properties of a Lead Rubber Bearing for Various Exposure Times to Low Temperature. Buildings 2023, 13, 478. https://doi.org/10.3390/buildings13020478
Yasar C, Karuk V, Kaplan O, Cavdar E, Ozdemir G. Amplification in Mechanical Properties of a Lead Rubber Bearing for Various Exposure Times to Low Temperature. Buildings. 2023; 13(2):478. https://doi.org/10.3390/buildings13020478
Chicago/Turabian StyleYasar, Cansu, Volkan Karuk, Onur Kaplan, Esengul Cavdar, and Gokhan Ozdemir. 2023. "Amplification in Mechanical Properties of a Lead Rubber Bearing for Various Exposure Times to Low Temperature" Buildings 13, no. 2: 478. https://doi.org/10.3390/buildings13020478
APA StyleYasar, C., Karuk, V., Kaplan, O., Cavdar, E., & Ozdemir, G. (2023). Amplification in Mechanical Properties of a Lead Rubber Bearing for Various Exposure Times to Low Temperature. Buildings, 13(2), 478. https://doi.org/10.3390/buildings13020478