Abstract
To improve urban seismic resilience, a reasonable seismic retrofitting scheme for buildings is required. Urban cities contain a large number of buildings, making it challenging to precisely assess the seismic retrofitting benefits of each one. This paper proposes a cost–benefit assessment framework that takes into account seismic risk, seismic damage, retrofit costs, economic losses, and cost–benefit analyses for the city-scale seismic retrofitting of buildings. The proposed framework adopts readily available building parameters, including the number of stories, construction year, total height, structural type, floor area, and response spectrum for structural design. It makes use of empirical seismic retrofitting models and a newly developed story-level seismic loss assessment method combining the physical mechanism and empirical loss ratios. For city-scale cost–benefit analysis, the framework can strike a good balance between data accessibility, computational workload, level of result details, and result accuracy. It can adapt nimbly to earthquake-induced indirect losses and budgetary constraints on retrofitting. The analysis of 98,618 buildings in Xi’an city, China, is carried out. The findings indicate that, when potential indirect economic loss ratios of buildings are neglected, the retrofitting benefits of unreinforced masonry and old buildings are the most significant.
1. Introduction
Buildings make up the majority of urban areas, and their seismic resistance directly impacts how effectively cities can withstand earthquakes. However, when a city expands and develops, a large number of buildings are built at various times and with varying seismic capacities. Because some buildings were not designed for earthquake resistance during the construction process or their components have degraded due to a lengthy service duration, these buildings have insufficient seismic capacities and are prone to severe damage during earthquakes, resulting in significant economic losses. As a result, it is crucial to conduct reasonable seismic economic loss prediction of urban buildings from a city-scale perspective in order to increase urban resilience.
Adopting retrofitting measures for every building in a city is unrealistic and unnecessary from the standpoint of the economic benefits. The cost of the retrofitting may be greater than the benefit for buildings with low value or buildings that are extremely difficult to retrofit. Moreover, retrofitting can hardly reduce the potential losses caused by earthquakes for buildings that were initially designed with high seismic capacities. Thus, it is necessary to analyze the benefits of retrofitting each building in the city to determine the optimal retrofitting scheme. However, it is challenging to carry out a thorough analysis of each building due to the abundance of urban structures. Therefore, at the city scale, a simple and effective evaluation framework for the retrofitting benefits of urban buildings is required. This framework should be able to preliminarily estimate the retrofit costs of urban buildings and the changes in seismic economic losses before and after retrofitting, identify the buildings that need to be prioritized, and provide a preliminary retrofitting scheme for buildings as a reference for further retrofitting designs. However, few complete frameworks are available due to the challenge of balancing the data accessibility, computational workload, level of result details, and result accuracy at a city scale.
Studies on building seismic retrofitting methods and advanced retrofit cost estimation have been conducted extensively [1,2,3,4,5,6,7,8,9,10,11,12]. Seismic retrofitting can effectively improve the seismic capacities of urban buildings and reduce the direct seismic economic losses. The specific conditions of each building can be taken into account in the detailed analysis. The appropriate retrofitting design can be carried out beforehand, and the specific cost of retrofitting can be estimated based on the retrofitting scheme. However, such a method cannot be used for the thousands of buildings that make up a city. At the scale of urban buildings, the information that is available for each building is limited, and the number of buildings is large. From the perspective of the preliminary formulation of a retrofitting scheme, the cost estimation of each building does not require very high accuracy; thus, simple estimation methods based on macrodata are applicable. For example, Jafarzadeh et al. [13] performed multilinear regression analyses based on the retrofit cost database of 158 reinforced concrete structures in Iran [14], evaluated the influence of the total floor area, number of stories, building lateral resisting system, and building gravity on the retrofit cost and derived a regression equation. Ding [15] collected the retrofitting data of 35 masonry structures in China and investigated the relationship between the total floor area, age, number of stories, and building retrofit cost. The aforementioned findings and pertinent information were all achieved using building macrodata (such as total floor area), which is more easily accessible, providing an essential reference for estimating the retrofit costs of buildings on a city scale.
Based on the level of details in the data required, there are three categories for the seismic economic loss assessment of urban buildings. (1) Prediction based on macrostatistics: Regression analysis is used to predict the seismic economic losses using historical macrodata from previous earthquake events, such as magnitude, intensity, and gross national product. The Prompt Assessment of Global Earthquakes for Response software by the United States Geological Survey is an example of this [16]. Based on the historical data from 217 earthquakes in Mainland China, Cai et al. [17] fitted an estimation equation of direct seismic economic losses. (2) Prediction based on building type: By categorizing the basic attribute information of a building, economic losses under different building characteristics are taken into consideration. Such methods include ATC 13 (ATC, 1985) of the United States [18] and the National Standard of the People’s Republic of China, Post-Earthquake Field Works—Part 4: Assessment of Direct Loss (GB/T 18208.4-2011) [19], which determine the economic loss matrix for different types of buildings under different damage conditions. (3) Component-level prediction: Using the seismic response analysis of the structure, the seismic economic losses at component levels can be determined based on the type, quantity, fragility, and consequence function of components. For example, the seismic performance evaluation method suggested in FEMA P-58 provides a detailed component database [20] and has been extensively used for predicting the seismic economic losses of individual buildings [21,22,23]. Among these three approaches, the prediction based on macrostatistics directly establishes the relationship between earthquake intensity and economic losses. However, it lacks the physical analysis of earthquake damage, which makes it challenging to satisfy the requirements for urban building retrofitting analysis in terms of accuracy. The component-level prediction method requires accurate component data, making it difficult to realize in urban buildings. Prediction based on the building type can provide structural response results. Thus, it is more operable than refined methods and more scientific and accurate than purely empirical approaches.
Based on the aforementioned analysis, a cost–benefit analysis method for city-scale seismic retrofitting of buildings was developed in this study to estimate the cost of urban seismic retrofitting and compare it with the reduction of seismic economic losses before and after retrofitting. The objectives were to evaluate the cost–benefit of seismic retrofitting, identify the maximum benefit of retrofitting investment, and provide a reference for optimizing seismic retrofitting decisions. The proposed framework adopts readily available building parameters, including the number of stories, construction year, total height, structural type, floor area, and response spectrum for the structural design. It makes use of empirical seismic retrofitting models and a story-level seismic loss assessment method that adopts the nonlinear multiple-degree-of-freedom (MDOF) models and empirical loss ratios. The framework is expected to achieve a good balance between data accessibility, computational workload, level of result details, and result accuracy for city-scale seismic retrofitting scheme analysis of buildings.
2. Framework
Figure 1 shows the proposed cost–benefit analysis method for seismic retrofitting of urban buildings. First, the earthquake scenarios at different risk levels were determined based on the site information and earthquake risk of the city. Then, based on the accessible building information, the seismic damage analysis model of urban buildings was established to determine the damage state and economic losses of buildings under different seismic intensities. According to the set earthquake retrofitting objectives, the seismic damage analysis model of buildings after retrofitting was established to calculate the retrofit cost and economic losses of the retrofitted buildings under different earthquake intensities, respectively. The changes in the economic losses of urban buildings before and after retrofitting were calculated, and the final retrofitting investment scheme was determined through cost–benefit analysis.
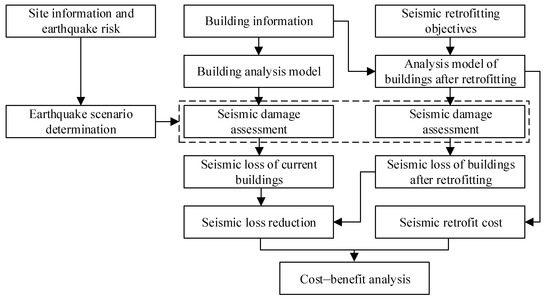
Figure 1.
Proposed cost–benefit analysis framework for city-scale seismic retrofitting scheme of buildings.
In the steps above, a relatively mature process for seismic risk analysis and scenario selection is available, which is outside the scope of this paper. For constructing seismic scenarios or selecting seismic waves to analyze building earthquake damages, the readers can refer to the relevant code. Regarding the seismic damage analysis of buildings, widely used methods include the damage probability matrix method, capacity–demand spectrum curve method, and time–history analysis-based method [18,24,25,26,27,28].
In this study, the time–history analysis method based on the nonlinear multiple-degree-of-freedom model proposed by Lu and Guan [29] was adopted. This method can establish a nonlinear MDOF model of each building based on the available building inventory data, including the number of stories, construction year, total height, structural type, floor area, and response spectrum for structural design. Figure 2a illustrates the MDOF shear model and the MDOF flexural–shear model suggested by Lu and Guan [29]. The MDOF shear models are used for low-rise and multi-story buildings because they exhibit shear deformation modes under earthquakes. Tall buildings and shear wall buildings use MDOF flexural–shear models because these structures usually show flexural–shear deformation modes under earthquakes. The masses of the buildings are concentrated on their corresponding stories, and the nonlinear behavior of the structure is represented by the nonlinear inter-story force–displacement relationships.
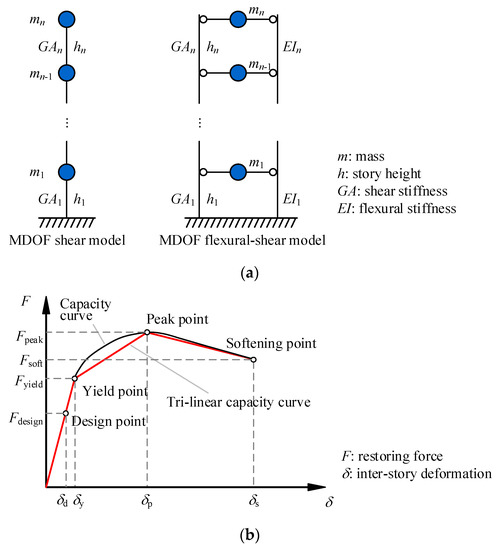
Figure 2.
Brief illustration of the adopted nonlinear MDOF models. (a) MDOF model; (b) inter-story force–displacement relationship.
Considering the limited accessible information for buildings at the city scale, Lu and Guan [29] proposed a parameter determination and damage state determination method for the MDOF shear and flexural–shear models. The trilinear backbone curves are adopted for the inter-story force–displacement relationships, as shown in Figure 2b, and a single parameter pinching model proposed by Steelman and Hajjar [30] is adopted. Firstly, a simulated design procedure is conducted using the aforementioned building inventory data according to the relevant seismic design codes, and the fundamental period and the design point on the backbone curve can be obtained. Then, using related statistics from extensive experimental and analytical results, the yield point, peak point, and softening point on the backbone curve can be further obtained. Five damage states, ranging from none, slight, and moderate to extensive and complete damage, are taken into account [29,31,32,33]. The reliability of the proposed method is further validated by comparing simulation results with actual seismic responses [34].
The MDOF models can significantly reduce the degree of freedoms in the analysis model, finish the seismic damage analysis of urban buildings with little computational workload, and provide the engineering demand parameters (such as the inter-story drift ratio and peak floor acceleration) and damage state of each floor in each building. Thus, these models are adopted in this study.
In terms of retrofit cost, a method for estimating the retrofit cost applicable to urban buildings is presented in Section 3. In terms of economic loss, Section 4 presents a story-level seismic economic loss assessment method based on the available building-type-based prediction method in the code and story-level damage states. Section 5 presents the method for cost–benefit analysis applicable to urban buildings. In Section 6, buildings in the urban area of Xi’an, China, are used as an example for further analysis and discussion.
3. City-Scale Seismic Retrofit Cost Models
When estimating the seismic retrofit cost of a single building, the specific conditions of the building are typically considered, an appropriate retrofitting design is conducted in advance, and the retrofit cost is estimated based on the retrofitting scheme. However, this method does not apply to the preliminary formulation of the plan for city-scale building retrofitting. On the one hand, limited building information is available for city-scale analysis; on the other hand, the preliminary formulation of the building retrofitting plan does not require a very high degree of accuracy in estimating the building retrofit cost. Therefore, easily accessible building characteristics (such as the floor area) should be used as the input to establish a regression model applicable to different structural types and rapidly evaluate building seismic retrofit costs with minimal calculation effort and an acceptable error margin as a reference for analyzing seismic retrofitting investment benefits.
3.1. Frame Structure
The literature covers relatively insufficient databases of frame structure retrofit costs containing a large amount of data [35,36,37,38]. These databases typically do not ensure sufficient universality or applicability in different regions, owing to the amount of data, age, and other reasons [14]. The US Network for Earthquake Engineering Simulation provides a database containing 158 pieces of retrofit cost data (https://datacenterhub.org/resources/252) (accessed on 12 January 2023) [14], and the data in this database were obtained from concrete and steel-framed schools in Iran. Jafarzadeh et al. [13] conducted a multilinear regression based on the data and recommended a simple regression form with the total floor area as a single parameter:
where Cframe is the cost of frame structure retrofitting (unit: 1000 USD), and F is the total floor area (unit: m2). Because the original data were subject to currency conversion based on the 2008 benchmark, the exchange rate between RMB and USD in 2008 (USD 1 = CNY 6.948) was used for conversion in this study.
Furthermore, improving buildings’ seismic precautionary intensity during retrofitting raises the retrofit cost relatively. According to Potangaroa [38] and Jafarzadeh [39], a significant increase in the peak ground acceleration of the design level from 0.08 g to 0.21 g increases the relative cost by 14%. Therefore, considering the Chinese code, the retrofit cost was assumed to increase by 5.38% in this study for every 0.05 g increase in the design basic acceleration of ground motion [15].
An office building [40] of Gansu Eighth Construction Group Co., Ltd. in Tianshui City, Gansu Province, China, was used as an example for calculations to validate the applicability of Equation (1) to Chinese buildings. This building is an eight-story reinforced concrete frame structure with a total floor area of 4568 m2 completed in 2003. The building was designed according to GBJ 11–89 [41]. The design basic acceleration was 0.10 g at the time. Because of the subsequent revisions to the code, the design basic acceleration after retrofitting was 0.30 g, and the actual retrofit cost was CNY 1,683,300. According to Equation (1), the retrofit cost was CNY 1,290,229. As the design basic acceleration was increased by 0.20 g, the retrofit cost was CNY 1,290,229 × (1 + 4 × 5.38%) = CNY 1,567,886, and the relative error with the actual result was 6.9%, indicating the applicability of the above method.
The frame structures defined in this database included bare steel frame with infill unreinforced masonry walls, concrete frame, concrete frame with shear walls, dual system, one-way steel braced frame, and two-way steel braced frame structures. Jafarzadeh et al. [13] demonstrate that these structures have no significant impact on the retrofit cost; hence, the above model will be adopted for frame structures and frame–shear wall structures in this study.
3.2. Masonry Structure
Ding [15] collected data on the retrofitting of 35 masonry structures from several provinces in China. The total amount of data in this database is small, but it applies to masonry structures in China. Ding [15] derived Equation (2) based on a multilinear regression:
where Cmasonry is the retrofit cost of masonry structures (unit: CNY 10,000), NS is the number of building stories, A is the age (unit: year), and F is the total floor area (unit: m2).
However, Equation (2) might have negative values. As observed in studies on relevant data, the total floor area is the most significantly related factor to the retrofit cost among all attribute data types. However, the age and the number of stories are not significantly correlated with the retrofit cost. Therefore, the regression form derived by Jafarzadeh et al. [13] was used to regress Equation (3) again according to the database in Ding [15]. Similarly, if the design basic acceleration of buildings is increased during seismic retrofitting, the retrofit cost should be increased by 5.38% for every 0.05 g increase.
Figure 3 shows the fitting effect. The root mean squares of the absolute error of the proposed method and Ding’s method [15] are 21.8 and 18.9 (unit: CNY 10,000), respectively. The proposed method’s root mean square of the relative error is 28.1%, while Ding’s method’s is 31.0% [15]. The aforementioned findings demonstrate that the proposed method has comparable prediction performance to Ding [15]. However, the proposed method has a more succinct form with just one variable and can guarantee that the predicted retrofit cost is consistently positive. Thus, the following will use the proposed method.
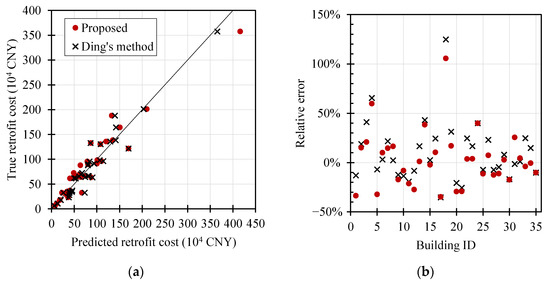
Figure 3.
Comparison of different regression models. (a) Prediction results; (b) relative error.
4. Story-Level Seismic Loss Analysis of Buildings
Economic losses caused by earthquakes differ by region. In this study, the Chinese code was used as an example, but the proposed method is universal in theory. According to the Classification of Earthquake Damage to Buildings and Special Structures (GB/T 24335-2009) [42] and the US HAZUS Report [43], structural damages are classified into five states ranging from light to heavy: none, slight, moderate, extensive, and completely damaged. According to China’s Post-Earthquake Field Works—Part 4: Assessment of Direct Loss (GB/T 18208.4-2011) [19], the direct economic losses of buildings should have a loss ratio conforming to local characteristics based on the structure type and building damage state according to the range of the building loss ratio in Table 1. Generally, the corresponding median value in the Code is selected by default.

Table 1.
Loss ratio of buildings (in percentage) [19].
The maximum inter-story drift ratios at each story of the same building are not the same, owing to the dynamic properties of the building, and the damage states of different stories typically differ. For example, the shear deformation mode of frame structures is dominant during earthquakes, and the first story usually undergoes the maximum inter-story drift ratio and damage. Therefore, if the building loss ratio is determined based on the overall state of damage to the building, the predicted seismic economic losses might be relatively high. Therefore, this study proposes to determine the economic losses of each story based on the story-level damage state obtained via seismic damage analysis and to calculate the direct economic losses of the entire building. For each building, the above process can be explicitly expressed as follows:
where L is the total direct economic loss of the building, Li is the direct economic loss of the ith story of the building, N is the number of stories of the building, RCi is the replacement cost of the ith story of the building, LRi is the loss ratio of the ith story of the building, RC is the total replacement cost of the building, and LR is the overall loss ratio of the building.
Moreover, if the overall damage of the building reaches the complete damage level, the building cannot be repaired regardless of the damage state of each floor. In this case, the direct seismic economic losses of the building should be calculated based on its replacement cost, that is, the overall loss ratio is 100%.
As expressed by Equation (4), the key to solving the problem is determining the economic loss ratio of each building story. According to GB/T 18208.4-2011 [19], the loss ratio value listed in Table 1 is in a somewhat broad range. For example, the difference between the upper and lower limits of the loss ratio of reinforced concrete and masonry buildings under extensive damage exceeds 50%, which is far from accurate for estimating the seismic economic losses of buildings. Compared with the discrete index of the building story damage state, the calculation values of engineering demand parameters are continuous, which reflects the seismic response of building structures more accurately. Therefore, a more precise value of the story loss ratio was determined in this study using the interpolation method based on the engineering demand parameters obtained from the nonlinear time–history analysis. The engineering demand parameters include the peak acceleration of each floor, the inter-story drift ratio, and the residual drift of the building. Because the inter-story drift ratio is critical for evaluating the damage state of a structure, the inter-story drift ratio of each story was used to calculate the linear interpolation calculation of the loss ratio, as expressed by Equation (6):
where DSi is the damage state of the ith story, and and are the upper and lower limits of the loss ratio, respectively, corresponding to the damage state DSi, which can be obtained from Table 1. and are the upper and lower limits of the inter-story drift ratio, respectively, corresponding to the damage state DSi, which can be determined from [29]. is the inter-story drift ratio of the ith story. As mentioned above, if the overall damage state of the building reaches the complete damage state, the loss ratio of all the stories should be 100%.
5. Cost–Benefit Analysis Method
To analyze the benefit of each building after retrofitting, the retrofitting objectives of each building are first determined. The benefit–cost ratio (BCR) is then calculated based on the obtained retrofit cost and benefit of each building.
5.1. Setting of Building Retrofitting Objectives
The seismic retrofitting of a building can improve its seismic capacity, minimize its seismic damage, and thus reduce seismic losses. However, capacity changes could be quite different as a result of various seismic retrofitting strategies. For example, Carofilis et al. [2] compared the pushover curves of one reinforced concrete school building before and after retrofitting. Two retrofit alternatives were considered. The seismic resistance of the building was significantly raised after retrofitting but to different extents. The peak strength was increased by 5–15% with the first alternative and by 32–88% with the second one. When city-scale buildings are analyzed, it is impossible to separately formulate the retrofitting objectives of each building in detail at the initial assessment stage because of the large number of buildings. Therefore, based on the improvement of the seismic capacity of actual cases after retrofitting, the retrofitting objectives of this study are assumed based on the following principles:
- After retrofitting, unreinforced masonry structures reach the seismic capacity of reinforced masonry structures.
- The design basic acceleration values for the frame, frame–shear wall, shear wall, and reinforced masonry structures shall be adjusted according to Table 2. In Table 2, the first line indicates the six groups of design basic acceleration grades specified in Code for Seismic Design of Buildings (GB50011-2010 (2016)) [44], and the second line indicates the design basic acceleration after retrofitting.
Table 2. Design basic acceleration of ground motion for structures before and after retrofitting.
The first principle is suggested with the knowledge that: (1) unreinforced masonry structures typically exhibit lower seismic capacity than reinforced masonry structures with the same floor area and height, as a result of the lack of sufficient seismic design details; and (2) seismic design details will be taken into account and added to the unreinforced masonry structures during the retrofitting process. The second principle uses a simplified premise to show how structures after retrofitting have improved their seismic capacity. It should be noted that in actual situations, the administrators can first determine these retrofitting objectives. Then, for the purpose of developing numerical models, the corresponding seismic capacity improvement for each building can be determined.
5.2. Cost–Benefit Analysis of Urban Building Retrofitting
For the seismic retrofitting of buildings, the main direct cost comes from building retrofitting. However, because the retrofit cost may include costs other than the direct cost, the coefficient α is used. The total retrofit cost, C, can be expressed as follows:
where CR is the direct retrofit cost calculated using the method presented in Section 3, and α is the cost amplification factor set according to the actual demand. When a new retrofitting technique is adopted, the value of α may be lower than 1, indicating that the new technique is more cost-effective than the traditional approach.
The economic benefit of seismic retrofitting is generally expressed by reducing seismic losses before and after retrofitting. In a broad sense, seismic losses include casualties, direct economic losses, and indirect economic losses. However, human life cannot be measured in terms of money, so it is difficult to express the reduction in casualties monetarily. The direct economic loss caused by an earthquake mainly refers to the loss attributed to the destruction of buildings during the earthquake. The indirect economic loss caused by an earthquake involves the indirect impact of the earthquake on the social economy, such as the economic input required for earthquake relief, the shutdown and reduction of production by enterprises after the earthquake, and the decreased benefits from investments. Indirect economic losses involve an extended space–time span and cannot be easily and comprehensively estimated.
Moreover, some potential seismic losses cannot be quantified in currency. Therefore, this study temporarily did not consider the factors of casualties in calculating retrofitting benefits. The changes in direct economic losses before and after retrofitting, on the other hand, were adopted as the standard retrofitting benefits, reflecting the reduction in indirect economic losses in the amplification factor, β. Equation (8) can be used to express the retrofitting benefit, B:
where L0 and LR are the direct economic losses before and after retrofitting, respectively, calculated using the method described in Section 4, and β is the profit amplification coefficient, set according to the actual demand.
Based on the above costs and benefits, BCR was adopted as the evaluation index to analyze retrofitting decisions.
Generally, a decision is expected to benefit investors if BCR exceeds 1.0. Otherwise, the implementation of the decision is not economically reasonable. As expressed by Equation (9), it is unnecessary to determine α and β separately in actual operation but only , as follows.
BCR’ is the newly defined benefit–cost ratio. If , the decision can be considered beneficial. Because the potential indirect economic losses and gains may be significant, is typically less than 1.
6. Case Study of Xi’an City
Urban buildings in Xi’an were selected for case analysis to describe the proposed method. First, the nonlinear time–history analysis of buildings with different earthquake intensity levels was conducted using existing geographic information system data of urban buildings, and the seismic economic losses of the buildings were calculated using the obtained story-level damage states and engineering demand parameters. Finally, the retrofit cost was estimated for buildings of different structural types, and the cost–benefit analysis of retrofitting at different earthquake intensity levels was performed to make retrofitting decisions regarding buildings in the area.
6.1. Basic Information
As illustrated in Section 2, Section 3, Section 4 and Section 5, the seismic performance analysis and the retrofit cost analysis for each building need the number of stories, construction year, total height, structural type, floor area, and response spectrum for structural design.
In this study, 98,618 buildings in the urban area of Xi’an were selected. Relevant administrations provided the GIS data for these buildings. These data include the number of stories, construction year, and outline coordinates of these buildings. The floor area was calculated on the basis of the outline coordinates. The response spectrum for structural design was determined according to the design code [44]. To determine the total height of each building, the story height was assumed to be 3 m. The structural type was determined using the machine-learning-based method proposed by Xu et al. [45].
The structural types of buildings are divided into four categories: frame structures, frame–shear wall/shear wall structures, unreinforced masonry structures, and reinforced masonry structures, recorded as FRM, FSW, URM, and RM, respectively. Figure 4 shows the construction year and number of stories distributions for different structural types. Regarding the structural type, there were 42,186 unreinforced masonry buildings, 29,592 frame structures, 17,529 reinforced masonry structures, and 9,311 frame–shear wall/shear wall structures in the Xi’an urban area. In terms of construction years, 96.5% of the buildings in the Xi’an urban area were built after 2000; however, only 0.1% were constructed before 1990, and the different structural types had similar construction year distributions. In terms of the number of stories, the urban buildings in Xi’an city were mainly low-rise buildings, and 60,500 buildings had three stories or below, accounting for 61.3% of the total number of buildings. Only 7279 buildings had 12 stories and above, which were mainly frame–shear wall structures.
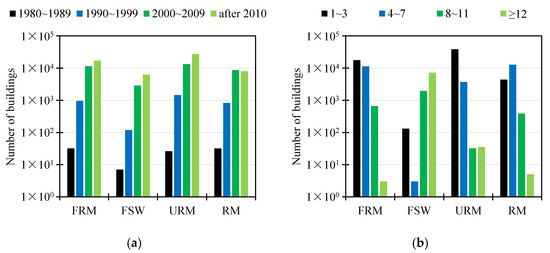
Figure 4.
Basic details of the case-study buildings. (a) Distribution of construction year; (b) distribution of number of stories.
6.2. Earthquake Scenario Determination
The required earthquake scenarios for analysis are usually determined by the administrators or stakeholders. For the seismic performance assessment of buildings, at least three different types of methods can be used, including intensity-based, scenario-based, and time-based assessment methods [20]. The intensity-based assessment method evaluates the probable performance of a building under the assumption that it is subjected to a specified earthquake shaking intensity. The scenario-based assessment method evaluates the probable performance of a building assuming that it is subjected to an earthquake scenario with a specific magnitude that occurs at a specific location in relation to the building site. The time-based assessment method evaluates the probable performance of a building over a given time period (such as 1 year, 30 years, or 50 years) considering all earthquakes that could occur in that time period and the probability of occurrence associated with each earthquake. The administrators or stakeholders should first select one of the three assessment methods according to their needs. Then, the corresponding earthquake motions can be selected or generated.
In this case, the intensity-based assessment method was adopted. According to the response spectrum specified in GB50011-2010 (2016) [44], seven groups of ground motions were selected from the Pacific Earthquake Engineering Research Center database [46]. Table 3 lists the basic information, and Figure 5 shows a comparison of normalized response spectra. The peak accelerations of the seven groups of ground motions were adjusted to 0.7, 2.0, and 4.0 m/s2, corresponding to service-level earthquakes (SLEs), design-based earthquakes (DBEs), and maximum-considered earthquakes (MCEs). It should be noted that numerous ground motion selection methods have been suggested by researchers from various perspectives in order to make the analysis results more realistic. However, the effectiveness of different ground motion selection methods is outside the scope of this study. As a result, the seismic design code [44] was followed when selecting ground motions for this study. The ground motions that matched the required response spectrum for design were adopted. According to GB50011-2010 (2016) [44], when the number of selected ground motions is not less than seven, the averaged seismic performance of the buildings under all ground motions at each intensity level will be adopted. The uncertainties induced by different earthquakes were not discussed in this case.
Table 3.
Information about selected motions.
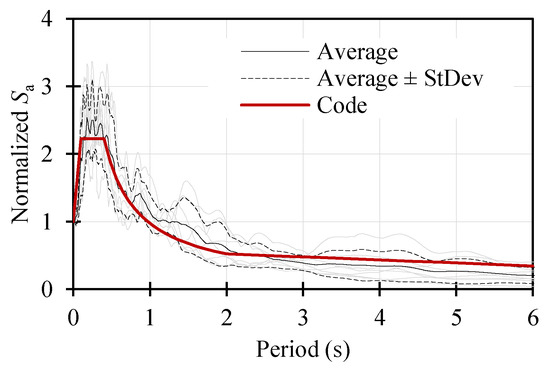
Figure 5.
Normalized response spectra of selected motions.
6.3. Seismic Damage Analysis
6.3.1. Damage State
Based on the building information presented in Section 6.1 and the ground motion input in Section 6.2, the nonlinear time–history analysis method of buildings proposed by Lu and Guan [29] was used to analyze the original and post-retrofitted building models and determine the damage state and loss ratio of each building before and after retrofitting. According to Section 5, the retrofitting objectives of this case are as follows:
- After retrofitting, unreinforced masonry structures reach the seismic capacity of reinforced masonry structures.
- The design basic accelerations of the frame structures, frame–shear wall/shear wall structures, and reinforced masonry structures are increased from 0.20 g to 0.30 g.
As illustrated in Section 2, a simulated design procedure using the corresponding design codes is used to obtain the parameters of the nonlinear MDOF models. Therefore, the models for buildings after retrofitting can be updated based on the aforementioned retrofitting objectives. For unreinforced masonry structures, the seismic design process for reinforced masonry structures with the same floor area, number of stories, and height will be used to recalculate their backbone curves. For frame structures, frame–shear wall/shear wall structures, and reinforced masonry structures, their response spectra for seismic design will be updated so that the corresponding earthquake intensity of DBEs equals 0.30 g instead of 0.20 g. Then, their backbone curves will be updated following the simulated design procedure using the updated response spectra.
For each earthquake intensity level, the seismic performance of each building under each ground motion was analyzed and recorded. The urban building damage proportions were investigated, and average proportions were calculated. Figure 6 shows the average damage state distributions of the original and retrofitted buildings at different earthquake intensity levels. When all buildings were retrofitted, the overall seismic capacity of the buildings improved significantly. Under SLEs, the percentage of buildings with basically no damage increased from 60.0% to 95.8%. Under DBEs, the percentage of slightly damaged and almost intact buildings increased from 65.8% to 84.3%. Under MCEs, the percentage of severely damaged and collapsed buildings decreased from 41.8% to 0.3%. However, it is unrealistic to retrofit all buildings, so the retrofitting benefits of each building were analyzed further.
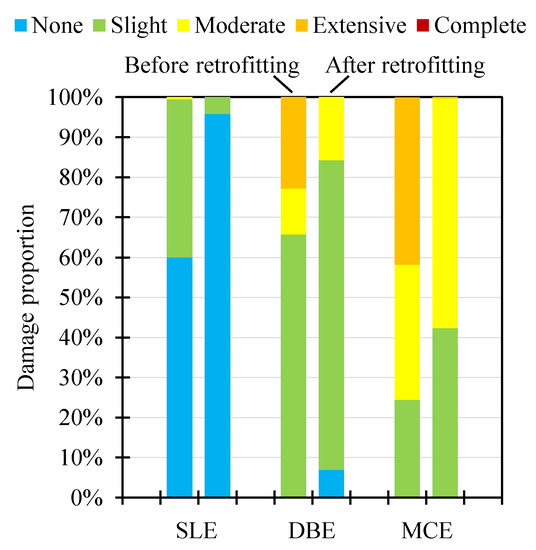
Figure 6.
Average damage percentages of buildings under earthquakes.
Figure 7 shows the average damage state distribution of each building type at each earthquake intensity level. The seismic capacity of URM was the weakest among the four types of structures, and the retrofitting effect of URM was the most significant based on the percentage of the damage state after retrofitting. Under SLEs, the percentage of “none damage” increased 73.2% after retrofitting. Under DBE, the ratio of “none damage” and “slight damage” increased from 26.7% to 63.3% after retrofitting. Under MCE, the proportion of “extensive damage” and “complete damage” decreased from 97.5% to 0.03% after URM retrofitting. Currently, retrofitting URM is the most effective from the perspective of damage state change. Next, the retrofitting scheme was determined from the perspective of a cost–benefit analysis.
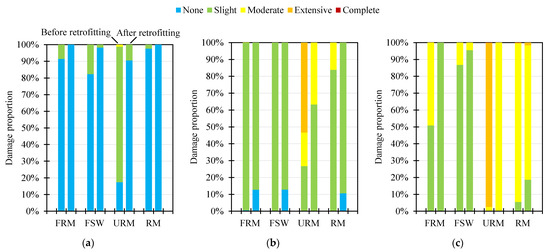
Figure 7.
Average damage proportions of buildings under earthquakes. (a) SLE; (b) DBE; (c) MCE.
6.3.2. Seismic Loss
The replacement cost of a building must be calculated first to determine its overall economic loss. When analyzing the seismic loss of city-scale buildings, it is difficult to precisely obtain the detailed cost data of all buildings in the region. Thus, the construction and installation cost is mainly used as the replacement cost of urban buildings. The construction and installation cost is influenced by the region and construction time and are counted and released annually by the Research Institute of Standards and Norms Ministry of Housing and Urban–Rural Development in China. The statistical data are categorized according to the number of stories in the building: 1–6 stories, 7–17 stories, and more than 18 stories.
The case area in this study was Xi’an city. According to the housing cost information released by the Construction Engineering Cost Information Network (http://www.cecn.org.cn/) (accessed on 12 January 2023), the latest available data on Xi’an come from the statistical results of the first half of 2021. The construction and installation cost per unit area of buildings with 7–17 stories was CNY 2546/m2, whereas that with more than 18 stories was CNY 2755/m2. Because of the lack of information on the construction and installation costs of buildings with 1–6 stories, the costs were estimated according to the national residential construction and installation costs within the same period.
In the first half of 2021, the construction and installation cost of 1–6-story buildings was CNY 1857/m2, whereas that of 7–17-story buildings was CNY 2120/m2. Assuming that the ratio of the construction and installation cost between 1–6-story buildings and 7–17-story buildings was close in different places, the construction and installation cost of the 1–6-story buildings in Xi’an should be 1857/2120 × 2546 = CNY 2230/m2 within the same period.
Hence, the average economic loss of each building at various earthquake levels can be calculated using the approach presented in Section 4. Figure 8 shows the absolute economic losses before and after retrofitting. Figure 9 and Figure 10 present the proportions of the economic losses for different structural types and completion years, respectively, with the total losses. Figure 11 shows the ratio between the total loss of each structural type and the corresponding total replacement cost of the structural type. Figure 12 shows the ratios between the total losses of structures at different completion years and the corresponding total replacement costs of structures.
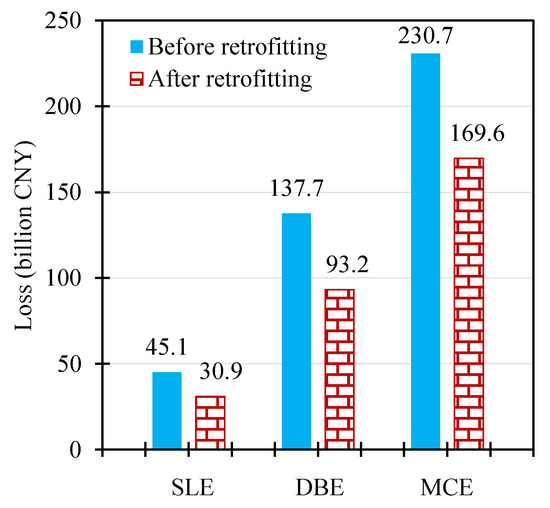
Figure 8.
Average total seismic losses of buildings under earthquakes.
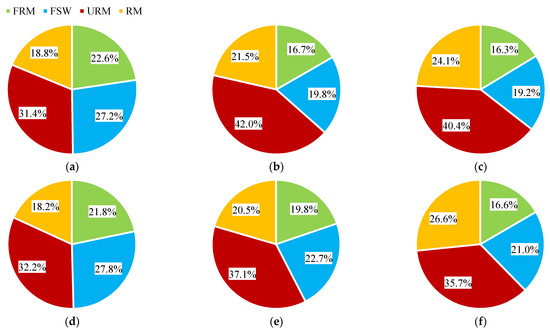
Figure 9.
Seismic loss compositions of buildings of different structural types. (a) SLE before retrofitting; (b) DBE before retrofitting; (c) MCE before retrofitting; (d) SLE after retrofitting; (e) DBE after retrofitting; (f) MCE after retrofitting.
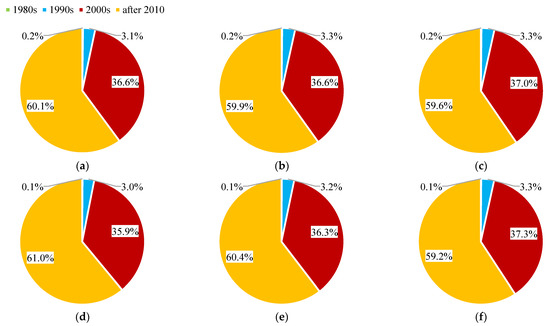
Figure 10.
Seismic loss compositions of buildings of different construction years. (a) SLE before retrofitting; (b) DBE before retrofitting; (c) MCE before retrofitting; (d) SLE after retrofitting; (e) DBE after retrofitting; (f) MCE after retrofitting.
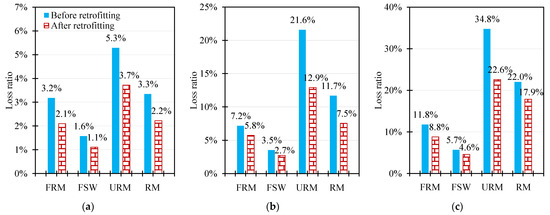
Figure 11.
Seismic loss ratios of buildings of different structural types. (a) SLE; (b) DBE; (c) MCE.
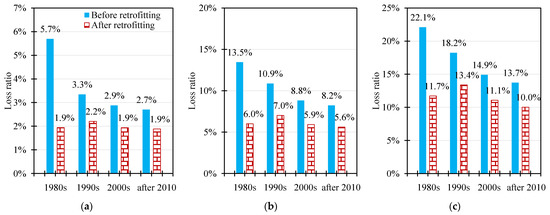
Figure 12.
Seismic loss ratios of buildings with different construction years. (a) SLE; (b) DBE; (c) MCE.
After retrofitting, the economic losses of the buildings at the SLE, DBE, and MCE levels decreased by 31.4%, 32.3%, and 26.5%, respectively (Figure 8). Before and after retrofitting, different structural types and completion years contributed to an unchanged proportion of economic losses (Figure 9 and Figure 10). The economic losses caused by URM were relatively the largest, accounting for 31.4%–42.0%, whereas the economic losses of FRM, FSW, and RM were close, accounting for 16.3%–27.8%. The buildings constructed after 2010 contributed to the most economic losses because their total number is the largest (Figure 10), accounting for 59.7% of the total (Figure 4).
Under earthquakes of the same intensity level, the loss ratio of URM was the highest, whereas that of FSW was the lowest (Figure 11 and Figure 12). The older the building, the higher the loss ratio. After retrofitting, the average loss ratios of URM, RM, FRM, and FSW under MCEs could be controlled within 25%, 20%, 10%, and 5%, respectively. However, the average loss ratios of the buildings at different construction years were not lower than 10%. Based on the economic losses presented in this section and the basic information about buildings in Section 6.1, unreinforced masonry structures had the highest number, contributing the most to economic losses. However, the economic losses after retrofitting decreased significantly; hence, the retrofitting of unreinforced masonry structures should be considered specifically. Moreover, the old buildings were few, contributing less significantly to the overall economic loss, but their loss ratios were relatively high, and priority should be given to them in the case of limited retrofit costs.
6.4. City-Scale Building Retrofitting Decision
Section 6.3 describes the preliminary recommended scheme for building retrofitting in terms of structural type and construction time. To obtain more detailed analysis results, the method proposed in Section 3 can be used to calculate the retrofit cost of each building. In addition, the average value of the BCR’ of each building at different earthquake intensity levels can be calculated using Equations (7)–(10), and the median BCR’ value of each building type at different earthquake intensity levels can be computed (Table 4). Overall, the retrofitting benefit increases with increasing earthquake intensity.
Table 4.
Median of average BCR’ of each structural type under earthquakes.
After comprehensively considering the variations in the retrofit cost and economic loss, the retrofitting benefits of all buildings under SLEs were low (0.05–0.07). Under the DBE and MCE, the retrofitting benefit of URM was the most significant. Under the MCE, the median value of the average BCR’ of all URM buildings in the case of seven ground motions reached 0.63, that is, the average BCR’ of 50% URM buildings under the MCE exceeded 0.63. Under the MCE, the average BCR’ median values of FRM and RM were close (approximately 0.21). The average BCR’ median value of FSW was relatively minimum (0.13).
Assuming that each building has the same threshold value, the proportion of the number of buildings that required retrofitting and the corresponding retrofit cost for various structures were obtained under different thresholds (Table 5). In actual decision making, a city manager can first determine the earthquake level to be resisted within this retrofitting period based on the survey, estimate the potential minimum acceptable based on the building function and other factors, determine the preliminary retrofitting scheme based on the retrofitting budget and the relevant calculation results in Table 5, and formulate a detailed retrofitting plan for the specific building to be fortified.
Table 5.
Number of buildings requiring retrofitting and corresponding retrofit costs at different values.
For example, assuming that the urban buildings were mainly affected by DBEs, the retrofitting budget was CNY 1 × 10⁹, considering that should not be less than 0.5. First, the buildings with higher BCR’ values should be fortified to satisfy the budget requirements. When the impact of DBEs was considered, the total retrofit cost of all 72 buildings with BCR’ ≥ 0.7 was CNY 9.5 × 10⁷, and the total retrofit cost of all 1,302 buildings with BCR’ ≥ 0.6 was CNY 1.3 × 10⁹ (Table 5). Therefore, if the retrofitting budget is CNY 1 × 10⁹, approximately 1000 buildings, mainly URM, should be fortified, and the specific buildings can be determined according to the actual BCR’ ranking, which is not repeated here.
The potential indirect economic losses of special or important buildings will be significant, that is, their value of β will be high. Hence, their corresponding values will be somewhat low, and such buildings should be retrofitted first.
7. Discussion
In this section, the advantages and limitations of the proposed framework will be discussed. The whole framework includes five parts: seismic risk, seismic damage, retrofit costs, economic losses, and cost–benefit analyses. If more effective analysis methods are available, each part can be further improved. For example, when design details for typical important buildings are available, the refined finite element model can also be used for a separate analysis of these buildings.
The major advantage of the proposed framework is that, when combined with the models used in the framework, the data accessibility, computational workload, level of result details, and result accuracy can be well balanced, which is a crucial rule when conducting city-scale analysis. Most of the parameters used throughout the entire process are easily accessible. For the seismic risk analysis, if specific seismic microzonation data are not available, corresponding seismic design codes can be adopted. The ground motion inputs can then be selected from freely accessible resources such as the NGA-West 2 Database (https://ngawest2.berkeley.edu/) (accessed on 12 January 2023), K-NET (https://www.kyoshin.bosai.go.jp/) (accessed on 12 January 2023), RAII-UAM (http://aplicaciones.iingen.unam.mx/AcelerogramasRSM/Inicio.aspx) (accessed on 12 January 2023), and others. For the seismic damage and loss analysis models used in this study, the required parameters for each building are the number of stories, construction year, total height, structural type, floor area, and response spectrum for structural design. Most of them are commonly included in a city’s GIS data. The methods mentioned in Section 6.1 can help determine missing data, such as the structural type and the total height. For seismic retrofit cost analysis, the models illustrated in Section 3 only require the total floor area of each building. Even though the form is very simple, the accuracy is sufficient for this kind of city-scale analysis. As was mentioned in Section 1, Jafarzadeh et al. [13] carried out multilinear regression analyses with seven parameters and investigated the efficiency of 14 regression models. Their results indicate that all regression models show similar performance, while the model in Equation (1) is the simplest. In terms of the retrofit cost model for masonry structures, the analysis in Section 3 shows that the proposed model with just one variable exhibits accuracy comparable to that of the model in [15], which has three parameters.
It should be noted that the seismic damage, seismic loss, and seismic retrofit cost models used in this study were selected because they are capable of striking a good balance between the data accessibility, computational workload, level of result details, and result accuracy. The total time cost of the entire framework comes from the seismic damage analysis. The modeling of nonlinear MDOF models can be automatically finished using well-developed programs [34]. The nonlinear MDOF models can provide story-level damage and loss results in a very short amount of time while ensuring the accuracy of the analysis results. Although more accurate than MDOF models, refined finite element models cannot be used for all buildings in a city-scale analysis. According to Xiong et al. [32], the time cost of a nonlinear MDOF model is approximately 1/30320 that of a refined finite element model. This makes it possible to update the required earthquake scenario cases quickly and provide the analysis results in a very short amount of time.
The proposed framework is also applicable to various cities. The seismic codes always cover every city in their own nations, making it possible to determine the seismic risk. As illustrated in Section 2, the seismic damage and loss assessment methods are based on physics-driven models. This implies that they can be widely adopted in various cities [29,34]. Noting that the seismic retrofit model is empirical, it should first be validated before being applied to different regions, as illustrated in Section 3.
The framework can be further improved from the following perspectives:
- The analysis results should only be regarded as initial advice for the administrators. Although the framework can flexibly adjust to a manager’s needs and adapt to budgetary constraints and indirect losses, more in-depth analyses are required for further retrofit planning.
- To make the framework more adaptable to different cities and nations, more accurate seismic retrofit cost models that are not entirely empirical are required. The influence of different retrofitting techniques on the cost should be considered.
- Section 5 provides very simplified retrofitting objectives for each building. Even though the framework enables administrators to determine various retrofitting objectives for different buildings, and the MDOF models allow backbone curve adjustments, the seismic capacity adjustment principle is still unclear. After retrofitting, the fundamental period, stiffness distribution along the height, and strength of the structure will all be significantly changed. In addition, the improvement in seismic capacity of a building may vary greatly when using different retrofitting techniques. Thus, more research is needed to determine the retrofitting objectives for city-scale analysis.
8. Conclusions
The seismic retrofitting of buildings is necessary to increase urban seismic resilience. However, because of the abundance of urban buildings, it is challenging to accurately assess the seismic retrofitting benefits of each building within acceptable modeling and computational workloads. This study proposed a cost–benefit analysis framework for city-scale seismic retrofitting of buildings. First, the urban earthquake scenario was determined by analyzing seismic hazards or making use of pertinent specifications. The story-level seismic damage and loss for each building before and after retrofitting were then analyzed using nonlinear MDOF models, based on the building inventory data and the established seismic retrofitting objectives. Empirical models were used to assess the retrofit costs. Then, a comparison was made between the economic loss variations for buildings before and after retrofitting. The final retrofitting investment scheme was decided after conducting the cost–benefit analysis.
The proposed framework shows the following advantages:
- The framework uses readily available building parameters as well as story-level physical and empirical analysis models, which can significantly reduce the modeling and computational workload and improve the level of result details. Therefore, the proposed framework can strike a good balance between data accessibility, computational workload, level of result details, and result accuracy.
- Depending on the available data, alternative models can be used to replace each component of this framework. When the design details of several important buildings are available, the refined finite element model can also be used for them.
- The empirical seismic retrofit model is validated as being appropriate for the buildings in the case study region. Due to the use of physics-driven models, the proposed framework can be used for a variety of cities.
- The proposed seismic retrofitting benefit analysis for city-scale buildings can adapt to budgetary constraints and indirect losses and flexibly adjust in response to a city manager’s needs.
Finally, the cost–benefit analysis of 98,618 buildings in Xi’an city, China, was successfully completed using the proposed framework. The results indicate that the retrofitting benefits of unreinforced masonry and old buildings are most significant when the potential indirect economic loss ratios of buildings are neglected.
To further improve the framework, an in-depth study of more accurate seismic retrofit cost models that are not entirely empirical and can account for the influence of different retrofitting techniques is needed. Further research is also necessary to determine retrofitting objectives for city-scale analysis in a manner that is more realistic and flexible.
Author Contributions
Conceptualization, Z.X. and Y.T.; methodology, Y.T. and Z.X.; software, Y.T.; formal analysis, Y.T., J.R. and M.Q.; resources, J.R. and M.Q.; data curation, Y.T. and J.R.; writing—original draft preparation, Y.T. and J.R.; writing—review and editing, Z.X. and M.Q.; supervision, Z.X.; project administration, Z.X. and Y.T.; funding acquisition, Y.T. and Z.X. All authors have read and agreed to the published version of the manuscript.
Funding
This research was funded by the National Key Research and Development Program of China, grant number 2022YFC3803003; the National Natural Science Foundation of China, grant number 51978049, 52208457; and Beijing Municipal Natural Science Foundation, grant number 8212011.
Data Availability Statement
The data are not publicly available due to privacy.
Acknowledgments
The authors would like to acknowledge the financial supports by the National Key Research and Development Program of China (2022YFC3803003), the National Natural Science Foundation of China (51978049, 52208457), and Beijing Municipal Natural Science Foundation (8212011).
Conflicts of Interest
The authors declare no conflict of interest.
References
- Cao, X.Y.; Shen, D.; Feng, D.C.; Wang, C.L.; Qu, Z.; Wu, G. Seismic retrofitting of existing frame buildings through externally attached sub-structures: State of the art review and future perspectives. J. Build. Eng. 2022, 57, 104904. [Google Scholar] [CrossRef]
- Carofilis, W.; Perrone, D.; O’Reilly, G.J.; Monteiro, R.; Filiatrault, A. Seismic retrofit of existing school buildings in Italy: Performance evaluation and loss estimation. Eng. Struct. 2020, 225, 111243. [Google Scholar] [CrossRef]
- Ferreira, T.M.; Mendes, N.; Silva, R. Multiscale seismic vulnerability assessment and retrofit of existing masonry buildings. Buildings 2019, 9, 91. [Google Scholar] [CrossRef]
- Formisano, A.; Massimilla, A.; Di Lorenzo, G.; Landolfo, R. Seismic retrofit of gravity load designed RC buildings using external steel concentric bracing systems. Eng. Fail. Anal. 2020, 111, 104485. [Google Scholar] [CrossRef]
- Giannuzzi, D.; Ballarini, R.; Huckelbridge Jr, A.; Pollino, M.; Valente, M. Braced ductile shear panel: New seismic-resistant framing system. J. Struct. Eng. 2014, 140, 04013050. [Google Scholar] [CrossRef]
- Katakalos, K.; Manos, G.; Papakonstantinou, C. Seismic retrofit of R/C T-beams with steel fiber polymers under cyclic loading conditions. Buildings 2019, 9, 101. [Google Scholar] [CrossRef]
- Maio, R.; Estêvão, J.M.C.; Ferreira, T.M.; Vicente, R. Cost-benefit analysis of traditional seismic retrofitting strategies integrated in the renovation of stone masonry buildings. Eng. Struct. 2020, 206, 110050. [Google Scholar] [CrossRef]
- Papavasileiou, G.S.; Charmpis, D.C.; Lagaros, N.D. Optimized seismic retrofit of steel-concrete composite buildings. Eng. Struct. 2020, 213, 110573. [Google Scholar] [CrossRef]
- Valente, M.; Milani, G. Alternative retrofitting strategies to prevent the failure of an under-designed reinforced concrete frame. Eng. Fail. Anal. 2018, 89, 271–285. [Google Scholar] [CrossRef]
- Vitiello, U.; Ciotta, V.; Salzano, A.; Asprone, D.; Manfredi, G.; Cosenza, E. BIM-based approach for the cost-optimization of seismic retrofit strategies on existing buildings. Autom. Constr. 2019, 98, 90–101. [Google Scholar] [CrossRef]
- Vona, M.; Flora, A.; Carlucci, E.; Foscolo, E. Seismic retrofitting resilience-based for strategic RC buildings. Buildings 2021, 11, 111. [Google Scholar] [CrossRef]
- Fung, J.F.; Sattar, S.; Butry, D.T.; McCabe, S.L. The total costs of seismic retrofits: State of the art. Earthq. Spectra 2021, 37, 2991–3014. [Google Scholar] [CrossRef] [PubMed]
- Jafarzadeh, R.; Wilkinson, S.; González, V.; Ingham, J.M.; Ghodrati Amiri, G. Predicting seismic retrofit construction cost for buildings with framed structures using multilinear regression analysis. J. Constr. Eng. Manag. 2014, 140, 04013062. [Google Scholar] [CrossRef]
- Jafarzadeh, R.; Ingham, J.M.; Wilkinson, S. A seismic retrofit cost database for buildings with a framed structure. Earthq. Spectra 2014, 30, 625–637. [Google Scholar] [CrossRef]
- Ding, M.S. Research on the Reinforcement Decision-making System of Urban Architecture and Program Implementation. Master’s Thesis, Xi’an University of Architecture and Technology, Xi’an, China, 2016. (In Chinese). [Google Scholar]
- Wald, D.J.; Jaiswal, K.S.; Marano, K.D.; Bausch, D.B.; Hearne, M.G. PAGER—Rapid Assessment of an Earthquake’s Impact. U.S. Geological Survey Fact Sheet 2010–3036; U.S. Geological Survey: Reston, VA, USA, 2010. Available online: https://pubs.usgs.gov/fs/2010/3036/pdf/FS10-3036.pdf (accessed on 12 January 2023).
- Cai, Y.J.; Lin, J.Q.; Liu, J.L.; Chen, Y.; Huang, X.K.; Lin, Q.L. Study on the rapid evaluation method for direct economic loss of earthquake based on Bayesian model. Earthq. Eng. Eng. Dyn. 2015, 35, 144–150. (In Chinese) [Google Scholar] [CrossRef]
- Applied Technology Council. Earthquake Damage Evaluation Data for California (ATC-13); Applied Technology Council: Redwood City, CA, USA, 1985. [Google Scholar]
- Standardization Administration of the People’s Republic of China. Post-Earthquake Field Works—Part 4: Assessment of Direct Loss (GB/T 18208.4-2011); Standards Press of China: Beijing, China, 2012. (In Chinese) [Google Scholar]
- Applied Technology Council. Seismic Performance Assessment of Buildings Volume 1-Methodology (FEMA P-58-1), 2nd ed.; Federal Emergency Management Agency: Washington, DC, USA, 2018. Available online: https://www.atcouncil.org/docman/fema/246-fema-p-58-1-seismic-performance-assessment-of-buildings-volume-1-methodology-second-edition?category_access=1 (accessed on 12 January 2023).
- Tian, Y.; Lu, X.; Lu, X.Z.; Li, M.K.; Guan, H. Quantifying the seismic resilience of two tall buildings designed using Chinese and US codes. Earthq. Struct. 2016, 11, 925–942. [Google Scholar] [CrossRef]
- Xu, Z.; Zhang, H.; Lu, X.Z.; Xu, Y.; Zhang, Z.; Li, Y. A prediction method of building seismic loss based on BIM and FEMA P-58. Autom. Constr. 2019, 102, 245–257. [Google Scholar] [CrossRef]
- Cremen, G.; Baker, J.W. A Methodology for Evaluating Component-Level Loss Predictions of the FEMA P-58 Seismic Performance Assessment Procedure. Earthq. Spectra 2019, 35, 193–210. [Google Scholar] [CrossRef]
- D’ayala, D.; Meslem, A.; Vamvatsikos, D.; Porter, K.; Rossetto, T.; Crowley, H.; Silva, V. Guidelines for Analytical Vulnerability Assessment of Low/Mid-Rise Buildings: Methodology; Vulnerability Global Component Project: Pavia, Italy, 2014. [Google Scholar]
- Hori, M.; Ichimura, T. Current state of integrated earthquake simulation for earthquake hazard and disaster. J. Seismol. 2008, 12, 307–321. [Google Scholar] [CrossRef]
- Lu, X.Z.; Tian, Y.; Guan, H.; Xiong, C. Parametric sensitivity study on regional seismic damage prediction of reinforced masonry buildings based on time-history analysis. Bull. Earthq. Eng. 2017, 15, 4791–4820. [Google Scholar] [CrossRef]
- Lu, X.Z.; Tian, Y.; Wang, G.; Huang, D. A numerical coupling scheme for nonlinear time history analysis of buildings on a regional scale considering site-city interaction effects. Earthq. Eng. Struct. Dyn. 2018, 47, 2708–2725. [Google Scholar] [CrossRef]
- Tian, Y.; Lu, X.Z.; Huang, D.; Wang, T. SCI effects under complex terrains: Shaking table tests and numerical simulation. J. Earthq. Eng. 2022, 1–24. [Google Scholar] [CrossRef]
- Lu, X.Z.; Guan, H. Earthquake Disaster Simulation of Civil Infrastructures: From Tall Buildings to Urban Areas, 2nd ed.; Springer: Singapore, 2021. [Google Scholar] [CrossRef]
- Steelman, J.S.; Hajjar, J.F. Influence of inelastic seismic response modeling on regional loss estimation. Eng. Struct. 2009, 31, 2976–2987. [Google Scholar] [CrossRef]
- Xiong, C.; Lu, X.Z.; Lin, X.C.; Xu, Z.; Ye, L.P. Parameter determination and damage assessment for THA-based regional seismic damage prediction of multi-story buildings. J. Earthq. Eng. 2017, 21, 461–485. [Google Scholar] [CrossRef]
- Xiong, C.; Lu, X.Z.; Guan, H.; Xu, Z. A nonlinear computational model for regional seismic simulation of tall buildings. Bull. Earthq. Eng. 2016, 14, 1047–1069. [Google Scholar] [CrossRef]
- Xiong, C.; Lu, X.Z.; Lin, X.C. Damage assessment of shear wall components for RC frame–shear wall buildings using story curvature as engineering demand parameter. Eng. Struct. 2019, 189, 77–88. [Google Scholar] [CrossRef]
- Lu, X.Z.; Cheng, Q.L.; Xu, Z.; Xu, Y.J.; Sun, C.J. Real-time city-scale time-history analysis and its application in resilience-oriented earthquake emergency responses. Appl. Sci. 2019, 9, 3497. [Google Scholar] [CrossRef]
- Federal Emergency Management Agency. Typical Costs for Seismic Rehabilitation of Existing Buildings, Volume I: Summary (FEMA 156), 2nd ed.; Federal Emergency Management Agency: Washington, DC, USA, 1994.
- Federal Emergency Management Agency. A Benefit-Cost Model for the Seismic Rehabilitation of Hazardous Buildings, Volume I: A User’s Manual (FEMA 227); Federal Emergency Management Agency: Washington, DC, USA, 1992.
- Hopkins, D.C.; Stuart, G. Strengthening Existing New Zealand Buildings for Earthquake: An Analysis of Cost Benefit Using Annual Probabilities. In Proceedings of the 2003 Pacific Conference on Earthquake Engineering, Christchurch, New Zealand, 13–15 February 2003. [Google Scholar]
- Potangaroa, R. The Seismic Strengthening of Existing Buildings for Earthquakes. Master’s Thesis, Victoria University, Wellington, New Zealand, 1985. [Google Scholar]
- Jafarzadeh, R. Seismic Retrofit Cost Modelling of Existing Structures. Ph.D. Thesis, The University of Auckland, Auckland, New Zealand, 2012. Available online: http://hdl.handle.net/2292/19550 (accessed on 12 January 2023).
- Si, X.P. High Intensity Zone Seismic Strengthening of Reinforced Concrete Frame Structure Plan Study Selection Method. Master’s Thesis, Lanzhou Jiaotong University, Lanzhou, China, 2014. (In Chinese). [Google Scholar]
- Ministry of Construction of the People’s Republic of China. Specifications for Antiseismic Construction Design (GBJ 11-89); China Architecture & Building Press: Beijing, China, 1989. (In Chinese)
- Standardization Administration of the People’s Republic of China. Classification of Earthquake Damage to Buildings and Special Structures (GB/T 24335-2009); Standards Press of China: Beijing, China, 2009. (In Chinese) [Google Scholar]
- Federal Emergency Management Agency. Hazus Earthquake Model Technical Manual (Hazus 5.1); Federal Emergency Management Agency: Washington, DC, USA, 2022. Available online: https://www.fema.gov/flood-maps/tools-resources/flood-map-products/hazus/user-technical-manuals (accessed on 12 January 2023).
- Ministry of Housing and Urban-Rural Development of the People’s Republic of China. Code for Seismic Design of Buildings (GB 50011-2010); China Architecture & Building Press: Beijing, China, 2016. (In Chinese)
- Xu, Z.; Wu, Y.; Qi, M.Z.; Zheng, M.; Xiong, C.; Lu, X.Z. Prediction of structural type for city-scale seismic damage simulation based on machine learning. Appl. Sci. 2020, 10, 1795. [Google Scholar] [CrossRef]
- Chiou, B.; Darragh, R.; Gregor, N.; Silva, W. NGA project strong-motion database. Earthq. Spectra 2004, 24, 23–44. [Google Scholar] [CrossRef]


Disclaimer/Publisher’s Note: The statements, opinions and data contained in all publications are solely those of the individual author(s) and contributor(s) and not of MDPI and/or the editor(s). MDPI and/or the editor(s) disclaim responsibility for any injury to people or property resulting from any ideas, methods, instructions or products referred to in the content. |
© 2023 by the authors. Licensee MDPI, Basel, Switzerland. This article is an open access article distributed under the terms and conditions of the Creative Commons Attribution (CC BY) license (https://creativecommons.org/licenses/by/4.0/).