Abstract
The flexural performances of a solid reinforced concrete (RC) T-beam and three RC T-beams with circular openings subjected to the ISO-834 standard fire were experimentally studied. The failure mode, fire resistance, time-deflection curve, and mid-span deflection recovery of the RC T-beams were analyzed by considering the factors such as the bottom chord depth and the stirrup status (refers to whether the stirrups were cut off when drilling). The results showed that the fire resistance of the RC T-beam with a 220 mm bottom chord was almost the same as that of the solid beam and both failed in ductile modes; however, the fire resistance of the RC T-beam with a 100 mm bottom chord was 18.9% lower than that of the solid beam and failed in a brittle mode. Whether the stirrups of the pure bending section were cut off when drilling had little effect on the fire resistance of the RC T-beam. Numerical simulations were also validated to study the mechanical properties influenced by the bottom chord depth. Finally, a simplified method of high precision was proposed to deduce flexural capacities of RC T-beams with circular openings under fire.
1. Introduction
In recent years, the auxiliary equipment (such as power supply, water supply, and gas supply equipment, etc.) has increased significantly with the building’s functional requirements. As a result, RC beams with openings became more and more popular. The cast-in-place RC T-beam is formed by digging out the concrete in the tensile area that plays little role in the flexural performance, which can not only save the concrete materials but also reduce the dead load and improve the spanning capacity.
The bearing behaviors of the RC beams with web openings at room temperature were widely investigated. After a series of experimental investigations on the continuous RC beams with large rectangular openings [1,2,3,4,5], Mansur et al. [1] found that larger deflections and smaller collapse loads would happen to the beams with openings in the higher bending moment areas [2,3,4,5]. Tan et al. [6] suggested the design procedure for RC beams with large web openings. Meanwhile, Aykac et al. [7] discovered that diagonal reinforcements around the openings can effectively prevent premature failure due to Vierendeel truss action, according to the experimental tests on nine RC beams with regular square or circular web openings.
Moreover, Barney et al. [8] found that the shear capacity was not reduced if the openings were located beyond the required embedment length based on the tests of eighteen full-scale prestressed T-beams with rectangular openings. Kennedy et al. [9] proposed that all the shear was carried by the top chord after the bottom chord cracked. Mansur identified two shear failure modes, labeled as “beam-type” failure and “frame-type” failure, respectively [10], and then developed design equations for RC beams with web openings under the combined action of torsion, bending, and shear [11]. Tan et al. [12] found that the use of diagonal reinforcement was an effective method for controlling cracks. Yang et al. [13] revealed that the failure of the beams was caused by the protruding diagonal cracks at the opening corners.
Over the last few years, it has become more and more popular to study RC beams with openings by finite element (FE) simulation and different strengthening measures. Hassan et al. [14] found that the integral stiffness of the opening area is significantly improved by gluing fiber-reinforced polymer (FRP) sheets and part of the stiffness loss due to openings was restored. Osman et al. [15] proposed a simplified formula for the shear strength of RC beams with circular openings based on experimental and numerical analysis. Sayed et al. [16] found that the effect of the opening diameters on the shear performance of RC beams was greater than the openings number. Jabbar et al. [17] concluded that the shear capacity of the RC beams with circular openings was better than that with other shape openings. Furthermore, Nie et al. [18,19,20,21,22] held to the opinion that larger web openings can reduce the flexural capacity of T-beams and the carbon fiber reinforced polymer (CFRP) sheets were required for refraining from brittle to ductile failure mode.
Fire is one of the most frequent disasters [23]. The high temperature seriously reduces the performance of materials and challenges the safety of RC structures [24,25,26,27]. The thermal physical properties of concrete and reinforcement under fire can be found in the previous literature [28,29], including the compressive strength, elastic modulus, tensile strength, constitutive law, expansion, creep, and transient thermal strain of concrete [30,31,32,33,34,35,36,37,38,39] and reinforcement [40,41,42,43,44,45,46,47,48] under high temperature. EI-Hawary et al. [49] and Choi et al. [50] focused on the effect of concrete cover depth on the fire resistance of RC beams. Meanwhile, Ožbolt et al. [51] studied the fire resistance of RC beams by taking into account the failure mode and temperature field of members. Youssef et al. [52] paid more attention to the influence of different factors on the shear strength of RC beams under fire. Only a few researchers have studied the fire resistance of RC beams during heating and cooling phases, for instance, Cai et al. [53] and Bratina et al. [54] used generalized beam-column elements and strain-based plane beam elements to verify the thermal inertia of concrete.
Although many achievements have been made, the research on the bearing performance of RC T-beams with openings under fire is still very limited. Both high temperatures and openings are aggressive to the bearing capacity of concrete beams, which will affect the overall safety of the structure when a fire occurs. Therefore, it is necessary to study the fire resistance of RC beams with openings.
In this paper, four full-scale RC T-beams were tested under fire by the control of the ISO-834 standard fire curve [55]. The failure mode, fire resistance, temperature field, and deformation capacity of the specimens were studied. The finite element method (FEM) was also conducted to discover the minimum depth of the bottom chord corresponding to the ductile failure. Simplified equations were developed for the flexural capacity of the RC T-beams with circular web openings.
2. Experimental Program
2.1. Material Properties
The mix proportion of the concrete is shown in Table 1. The mass density, water-binder ratio, percentage of sand, and slump of the concrete were 2441.5 kg/m3, 0.45, 39.7%, and 120 mm, respectively. The compressive strength fcu and moisture content ω of the concrete at 28 days and 330 days were measured [56] because fire tests were conducted 330 days after the finish of the pouring. The moisture content of concrete can be obtained by weighing the pieces of concrete before and after drying (105 °C for 7 days) after the compressive strength test of the concrete due to the reason that the spalling behavior of high-strength concrete is significantly affected by high temperature [57,58]. The compressive strength fcu and moisture content ω at 28 days and fire tests are shown in Table 2. The compressive strength of concrete increases with time, but the moisture content stayed relatively stable.

Table 1.
Details of mix proportion.
Table 2.
Compressive strength and moisture content of concrete.
The reinforcement cage of the web consisted of HRB400 longitudinal reinforcements, HRB400 supplementary reinforcements, and HPB300 stirrups with diameters of 25 mm, 12 mm, and 10 mm. HPB300 stirrups and supplementary reinforcement of four corners with diameters of 10 mm and 8 mm were used to form the reinforcement cage of the flange. The mechanical properties of reinforcements were tested [59] and shown in Table 3.
Table 3.
Material properties of the reinforcements.
2.2. Description of Specimens
As shown in Figure 1, four full-scale RC T-beams labeled as T1~T4 were designed and fabricated with the dimensions 200 mm × 400 mm for the web and 600 mm × 100 mm for the flange. The length of the specimen was 6500 mm, with an effective span of 5700 mm. The shear span ratio was 4.07. The depth of the concrete cover was 20 mm (the distance from the outer surface of the stirrup to the concrete surface). The stirrup in the shear span area was densified. The spacing of the stirrup densification area was 100 mm while the spacing of the non-densified area was 200 mm. The distances of the opening centers and supports of T2, T3, and T4 were 2850 mm, 2750 mm, and 2850 mm, respectively. The detailed test parameters of each specimen are shown in Table 4.
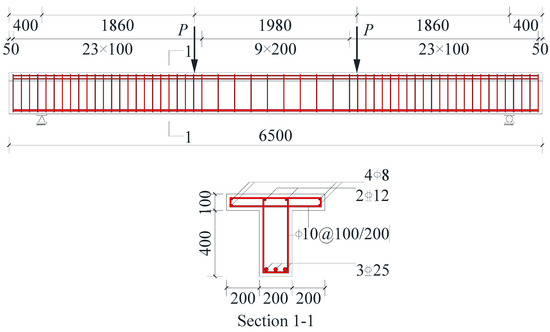
Figure 1.
Details of specimens (note: all dimensions are in mm).
Table 4.
Details of specimens.
2.3. Location and Size of Circular Openings
After the water curing at room temperature, the circular openings were achieved by the diamond drilling of the RC T-beams according to the design requirements, as shown in Figure 2 and Figure 3. Circular openings with diameters of 180 mm were drilled in the mid-span area of T1~T4 because it is the more common opening diameter in practical engineering. The concentrated load p was considered during fire tests. The mid-span area is the pure bending section, where the shear force is the minimum and the bending moment is the maximum.
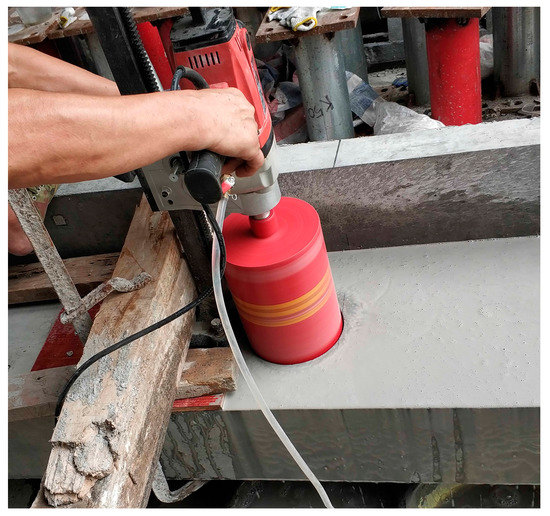
Figure 2.
Circular openings instrument.
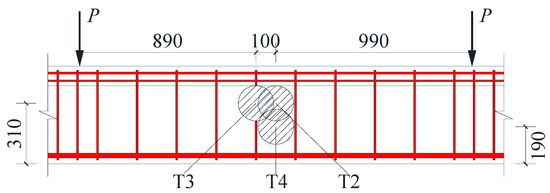
Figure 3.
Details of circular openings (note: all dimensions are in mm).
2.4. Test Setup and Procedure
After natural curing for approximately 330 days, T1~T4 were subjected to fire tests in the horizontal furnace of the fire-resistance laboratory of Huaqiao University. The loading device is shown in Figure 4. Constant load heating and ISO-834 standard fire curve [55] were utilized for the fire test. The formula is:
where T is the average environmental temperature in the furnace after t minutes of the ignition (°C); T0 is the initial temperature in the furnace (°C); t is the heating time of the fire test (min).
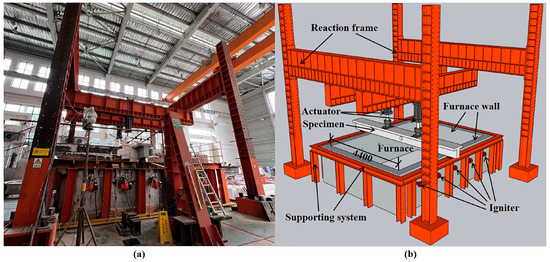
Figure 4.
Test setup and loading diagram: (a) photo, and (b) illustrative picture.
The length of the fire section was 4400 mm, as shown in Figure 4. The load under fire was evaluated according to 60% of the actuator load corresponding to the flexural capacity calculated at normal temperature [60], namely, the design load ratio of the fire test was 0.6. The flexural capacity at room temperature is 281.2 kN·m, so the load under fire was 90.7 kN (p = 90.7 kN). The loading process was divided into three stages; each stage was 30 kN for 5 min. Meanwhile, two steel blocks were placed at two points of concentrated forces to prevent the adverse effects of stress concentration.
Based on the popular prescriptive approach [61,62,63,64], it was considered that the specimen reached the fire resistance when the mid-span deflection of the specimen was L/20 (285 mm) and unloaded two actuators immediately.
2.5. Temperature and Displacement Measurement
In the fire test, the furnace temperature was measured by 6 S-type ceramic thermocouples located on the furnace wall. The temperatures of the reinforcements and concrete inside the specimen were measured every second by K-type sheathed thermocouples fixed with iron wires in their respective positions before the pouring.
The thermocouples of T1 were set at the mid-span section. Meanwhile, the thermocouples of T2~T4 were set at the section with a circular opening and the section without a circular opening (the distance between them is 240 mm). The specific locations of the thermocouple inside specimens are shown in Figure 5, indicating that measuring points 3 and 6 of T1 and measuring points 4, 6, 10, and 12 of T2~T4 were used to measure the temperature of the reinforcements.
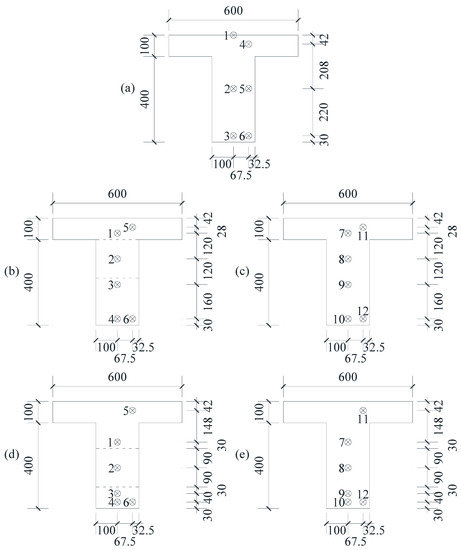
Figure 5.
Locations of the thermocouples (note: all dimensions are in mm): (a) mid-span section of T1, (b) section with a circular opening of T2 and T3, (c) section without a circular opening of T2 and T3, (d) Section with a circular opening of T4, and (e) section without a circular opening of T4.
It was critical to obtain the displacement of the specimens. To measure the support settlement, the deformation at the loading points, and the mid-span deflection of the specimen, two linear variable differential transformers (LVDTs) with a range of 300 mm, four LVDTs with a range of 500 mm, and an LVDT with a range of 500 mm were arranged at two supports, both sides of two loading points, and mid-span of the specimen, respectively. The specific locations of LVDTs are shown in Figure 6.
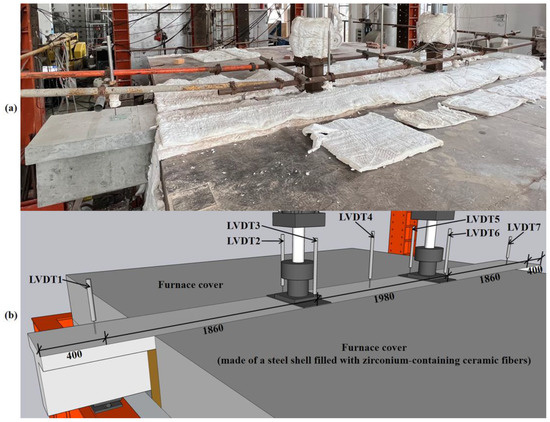
Figure 6.
Locations of the LVDTs (note: all dimensions are in mm): (a) photo, and (b) illustrative picture.
Both the thermocouples and the LVDTs were connected to the computer through the isolated measurement pods (IMP) and the ZY-35954U data collector, and the ZY-SCADA acquisition software was utilized for recording the temperature and displacement data required in the fire tests.
3. Test Results and Discussion
3.1. Experimental Observations and Failure Modes
The experimental phenomena of T1~T3 during the fire tests were similar. No cracks were found on the top of the flange after loading. There was steam at the junction of the furnace cover and the flange after 10 min. After 30 min, a little moisture appeared in the mid-span area on the top of the flange, but no water vapor emerged. After 45 min, the water outflow area on the top of the flange became larger and began to evaporate, and the mid-span deflection was obvious. After 60 min, part of the water outflow area on the top of the flange evaporated to dryness, but there was no significant change in the water outflow area in the mid-span area. After 90 min, the water outflow area on the top of the flange continued to decrease, and the mid-span area dried up, cracking occurred in the concrete, and the mid-span deflection increased. After 120 min, the water on the entire top surface of the flange was completely dried.
The experimental phenomenon of T4 before 103 min was mainly the same as that of T1~T3. With a sound noise at 103 min, the concrete surface in the mid-span was peeled; meanwhile, the reaction frame vibrated, the specimen suffered a brittle failure in the end, and there was still some water on the top of the flange that did not evaporate. It can be seen from Figure 7 that all three longitudinal reinforcements at the bottom of the beam were broken. The reason for the brittle failure of T4 is that the depth of the bottom chord was too small, which caused the temperature of the three longitudinal reinforcements to rise quickly, and the strength decreased sharply, subsequently.
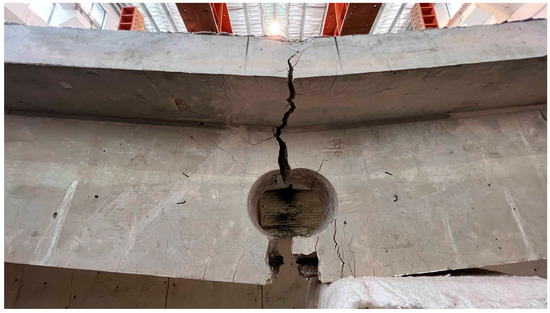
Figure 7.
The mid-span of T4 after the fire test.
The next day, the specimens cooled to room temperature and were lifted out of the furnace, and no obvious cracks were found on the top surface of the specimens, except T4. The fire exposed sides of the specimens turned gray-yellow, and the concrete in the non-fired areas was heavy gray. There were two very clear demarcation lines on each side of the web where the fire was exposed and the non-fire at the end, and the final failure modes of each specimen are shown in Figure 8.
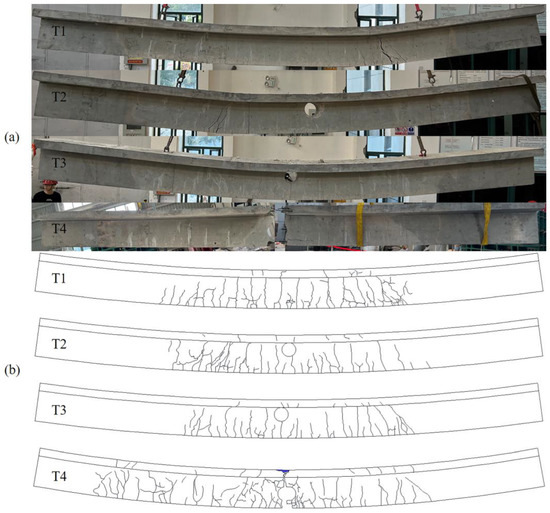
Figure 8.
Failure modes of T1~T4: (a) photos, and (b) sketch maps.
3.2. Temperature of the Furnace and Measuring Points
During the fire test, the temperature rise curves of the measuring points T2-2, T3-2, and T4-2, the corresponding furnace temperatures, and ISO-834 standard fire curves are shown in Figure 9. The initial temperature of each measuring point was slightly different. Nevertheless, this difference (the maximum difference of 20 °C) was mainly negligible by comparison with the maximum temperature of the furnace (over 1000 °C). As can be seen from Figure 9:
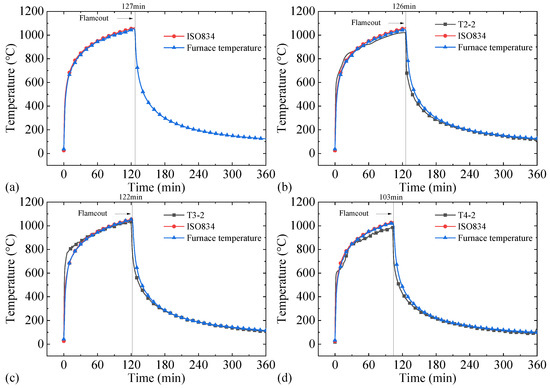
Figure 9.
Comparison of the temperatures of measuring points 2, ISO-834 standard fire curve, and furnace temperature over time: (a) T1, (b) T2, (c) T3, and (d) T4.
- (1)
- The temperature change was first fast and then slow; the average temperature of the furnace was in good agreement with the ISO-834 standard fire curve, indicating that the horizontal furnace of the fire-resistance laboratory of Huaqiao University met the requirements in national standard [61]. In general, the furnace heating curves measured in the fire tests can simulate real fire conditions.
- (2)
- The average furnace temperatures at the beginning of T1, T2, T3, and T4 were 38 °C, 37 °C, 42 °C, and 32 °C, respectively. Furthermore, the furnace was turned off at 127 min, 126 min, 122 min, and 103 min for T1, T2, T3, and T4, reaching maximum furnace temperatures of 1060 °C, 1057 °C, 1056 °C, and 1032 °C, respectively.
- (3)
- The temperatures of T2-2, T3-2, and T4-2 match well with the measured furnace temperature.
It can be found that the temperatures of T2-2, T3-2 and T4-2 match well with the measured furnace temperature.
The measuring points temperature versus time relationships are shown in Figure 10. The data of T1-3, T2-3, T2-9, T3-5, T4-4, and T4-9 were not collected due to broken thermocouples. The number of the measuring points in the picture is consistent with the number of the thermocouples in Figure 5. As can be seen from Figure 10:
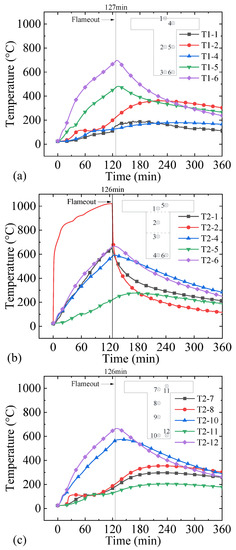
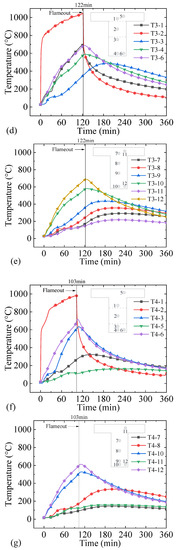
Figure 10.
Measuring points temperature versus time relationships: (a) T1-1~T1-6, (b) T2-1~T2-6, (c) T2-7~T2-12, (d) T3-1~T3-6, (e) T3-7~T3-12, (f) T4-1~T4-6, and (g) T4-7~T4-12.
- (1)
- Because point 6 of T1; point 4, point 6, point 10, and point 12 of T2 and T3; point 6, point 10, and point 12 of T4 measured the temperatures of longitudinal reinforcements, they reached the highest temperature almost immediately after flameout and then cooled down at a fast rate. The temperatures of points on sections with openings were higher than those on sections without openings. The temperatures of T2-4, T2-6, T3-4, T3-6, and T3-6 were 18 °C, 5 °C, 8 °C, 6 °C, and 105 °C higher than those of T2-10, T2-12, T3-10, T3-12, and T3-12, respectively.
- (2)
- The temperatures of points such as T2-1, T3-1, and T4-3 close to the fire exposed sides dropped quickly after the flameout, while the temperatures of some points such as point 7, point 8, and point 9 in sections without openings of T2~T4, far away from the fire exposed sides, showed the thermal inertia of concrete apparently and did not fall immediately.
- (3)
- There were “temperature plateaus” [65] with different lengths around 100 °C in the temperature rise curves of the measuring points, which was due to the fact that the heat was continuously carried away by the water evaporation inside the concrete. The closer the measuring point was to the fire exposed side, the faster the concrete heated up and the moisture inside the concrete evaporated. As a result, the length of the temperature plateau was a significant positive correlation with the distance between the measuring point and the fire exposed side.
3.3. Fire Resistance and Deformation of Specimens
The mid-span deflection versus time relationships of T1~T4 are shown in Figure 11. As can be seen from Figure 11:
Figure 11.
Mid-span deflection versus time relationships of T1~T4.
- (1)
- The mid-span deflections of the specimens increased with time in general. The actuator was stopped at the same time as the flame was turned off, and then the mid-span deflections of T1~T3 rebounded by 13.7 mm, 20.1 mm, and 23.4 mm, subsequently. However, the mid-span deflection of T4 could not be rebounded due to the rupture of three longitudinal reinforcements. The bending stiffness of T1~T4 decreased sequentially. The mid-span deflections of T1~T4 at the flameout moment were 285.2 mm, 285.6 mm, 285.0 mm, and 285.6 mm, respectively. The mid-span deflections of T1~T4 at the end of fire tests were 224.7 mm, 222.4 mm, 219.4 mm, and 287.8 mm, respectively. Except that no recovery happened to T4, the recovery ratios of T1~T3 were 21.2%, 22.1%, and 23.0%, respectively. The deformation recovery ability still performed well for the RC T-beam with a circular opening under the premise that the depth of the bottom chord was 220 mm.
- (2)
- The fire resistances of T1~T4 were 127 min, 126 min, 122 min, and 103 min, respectively. Compared with T1, the fire resistances of T2 and T4 were reduced by 0.8% and 18.9%, respectively. The fire resistance was reduced with the depth of the bottom chord. When the depth was 100 mm, the failure mode of the RC T-beam with a circular opening under fire changed from ductile failure to brittle failure.
- (3)
- Compared with T1, the fire resistance of T3 was reduced by 3.9%. The fire resistance was influenced by the cutting off of stirrups on the premise that the depth of the bottom chord was 220 mm, but no brittle failure occurred.
- (4)
- After the actuator load was applied, the mid-span deflections of T1~T4 were 11.8 mm, 15.2 mm, 19.4 mm, and 15.2 mm, respectively. Compared with T1, the mid-span deflections of T2~T4 after the loading increased by 28.8%, 64.4%, and 28.8%, respectively, which showed that both drilling an opening and cutting off the stirrups could increase the mid-span deflection of the RC T-beam.
The mid-span deflection versus temperature relationships of longitudinal reinforcements of T1~T4 are shown in Figure 12. The data of T1-3 and T4-4 were not available due to the damages during the test. As can be seen from Figure 12:
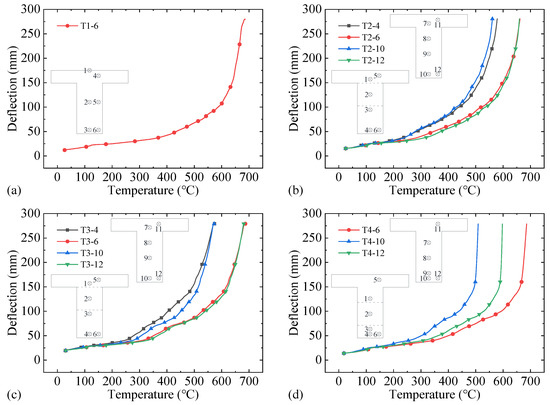
Figure 12.
Mid-span deflection versus temperature relationships of longitudinal reinforcements: (a) T1, (b) T2, (c) T3, and (d) T4.
- (1)
- For T1, the mid-span deflection increased rapidly after the temperature of longitudinal reinforcement at the beam bottom beyond 600 °C until the fire resistance.
- (2)
- For T2~T4, the mid-span deflection increased rapidly after the temperatures of T2-4, T2-10, T3-4, T3-10, and T4-10 reached 500 °C and the temperatures of T2-6, T2-12, T3-6, T3-12, T4-6, and T4-12 reached 600 °C until the fire-resistance, which could be since points 4 and 10 were close to the beam bottom while points 6 and 12 were close to the beam bottom and the web side.
In summary, after the temperature of the longitudinal reinforcements exceeded 600 °C, the deformation was accelerated. Table 5 shows the temperatures of the longitudinal reinforcements at the failure time, which was higher at the section with an opening than that without an opening.
Table 5.
The temperatures of the longitudinal reinforcements at the failure time.
4. Numerical Simulation
4.1. Finite Element Modeling
Based on the method of sequentially coupled thermal–mechanical analysis, a numerical simulation was conducted to analyze the mechanical properties of four specimens under fire. The temperature field of the specimen was calculated first, and then the results were imported into the T-beam thermal–mechanical coupling model.
The thermal properties of the concrete and reinforcement suggested by Eurocode 2 [66], consisting of the thermal elongation, mass density, specific heat, and thermal conductivity, are illustrated in Figure 13 and Figure 14a,b, where the effect of the moisture content (2.32%) of the concrete on its specific heat was considered, and the mass density of the reinforcement was 7850 kg/m3 under fire [66]. The convection factors of the fire exposed and unexposed sides were taken as 25 W/(m2·°C) and 9 W/(m2·°C), and the emissivity related to the concrete surface was taken as 0.7 [66]. The heating curve agreed with the ISO-834 standard fire curve [55], and the cooling curve adopted the measured furnace temperature. The element types of the concrete and reinforcement were an eight-node linear heat transfer brick (DC3D8) and a two-node heat transfer link (DC1D3), and the grid size was 30 mm and 50 mm, respectively. The length of the fire section was 4400 mm by considering the fire test.
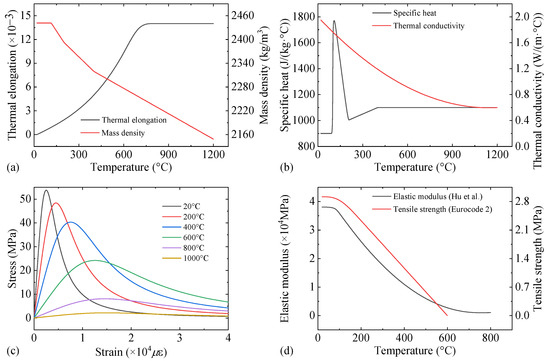
Figure 13.
Thermal and physical properties of the concrete: (a) the thermal elongation and mass density, (b) the specific heat and thermal conductivity, (c) the stress–strain relationships, and (d) the elastic modulus and tensile strength.
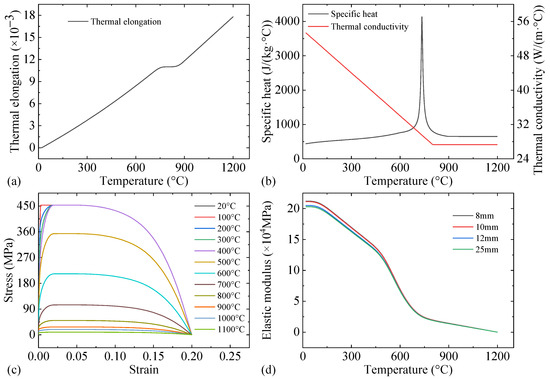
Figure 14.
Thermal and physical properties of the reinforcement: (a) the thermal elongation, (b) the specific heat and thermal conductivity, (c) the stress–strain relationship, and (d) the elastic modulus.
The concrete damaged plasticity (CDP) model [67] was utilized for simulating the plastic behavior of the concrete under fire. The five plastic parameters of the CDP model are composed of the dilation angle, the eccentricity, the ratio of the biaxial initial yield compressive stress to the uniaxial initial yield compressive stress, the ratio of the second invariant of deviatoric stress tensor on the tensile meridian to that on the compressive meridian, and the viscosity parameters, which were taken as 30°, 0.1, 1.16, 0.667, and 0.005, respectively. The Poisson ratios of the concrete and reinforcement under fire were 0.2 [68] and 0.3 [69], respectively. As shown in Figure 13 and Figure 14c,d, the stress–strain relationships of the concrete and reinforcement under fire adopted the expression suggested by Eurocode 2 [66], where the longitudinal reinforcement with a diameter of 25 mm was taken as an example to show the stress–strain relationship of the reinforcement. The elastic modulus of the concrete and reinforcement under fire were given by Hu et al. [36] and Eurocode 2 [66]. The element types of concrete and reinforcements were an eight-node linear brick with reduced integration and hourglass control (C3D8R) and a two-node linear three-dimensional truss (T3D2) with grid sizes of 30 mm and 50 mm, respectively, and the reinforcements were embedded in the concrete. Consistent with the experiment, the steel blocks set at the supports and loading points were 200 mm × 200 mm × 20 mm and 600 mm × 200 mm × 20 mm, respectively, and the steel blocks tied with the specimen. Both the movable and fixed hinge support were applied directly on the midline of the steel pads at both ends. The FE model of the T-beam with a circular opening is shown in Figure 15.
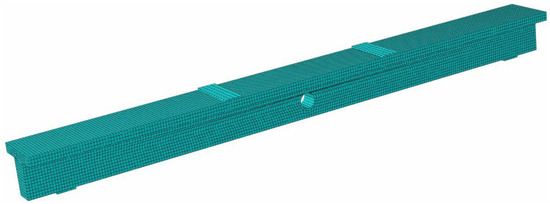
Figure 15.
FE model of the T-beam with a circular opening.
4.2. Validation of Numerical Modeling and Analysis
Taking T3 as an example, the comparison between the simulation results and the test results of the temperature field is shown in Figure 16. The coupled thermal–mechanical analysis can reasonably reflect the thermal conductivity and high-temperature mechanical properties of the RC T-beam with a circular opening. There was no “temperature plateau” in the heating curve of all concrete measuring points in the simulation results near 100 °C because the effect of moisture migration in concrete on temperature was not considered.
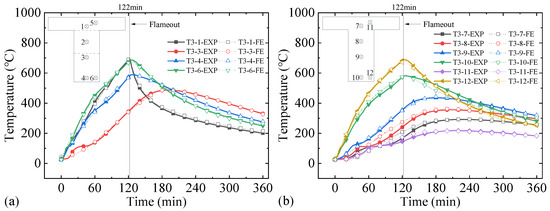
Figure 16.
Comparison of simulation results and experimental results of the temperature field over time: (a) the section with a circular opening of T3, and (b) the section without a circular opening of T3.
The simulation results and the test results of the mid-span deflection of T1~T4 are compared in Figure 17. The average value of ratios of the experimental and simulated results for the fire resistance was 1.02. It could be found that the simulated results matched well with the experimental results of the mid-span deflection at the fire resistance.
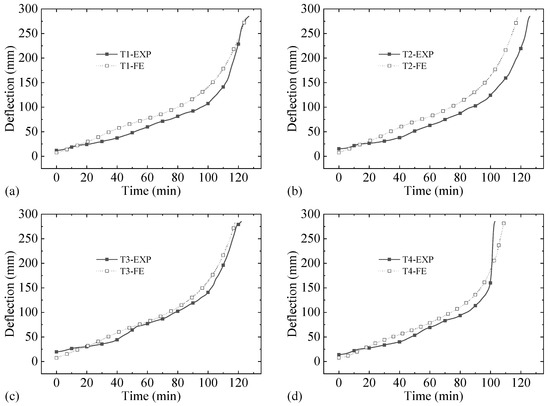
Figure 17.
Comparison of experimental and simulated results for fire resistance: (a) T1, (b) T2, (c) T3, and (d) T4.
4.3. Numerical Results and Discussion
As mentioned before, the RC T-beam with a circular opening suffered brittle failure under fire when the depth of the bottom chord was 100 mm. Nevertheless, the failure mode would transfer into ductile failure while the depth was 220 mm. According to the FE model established, as shown in Table 6, 11 numerical models with an opening diameter of 180 mm were achieved with the variable of the bottom chord depth.
Table 6.
Parameters of supplementary models for the RC T-beam with a circular opening under fire.
As can be seen from the simulation results of mid-span deflection during the fire and fire resistance shown in Figure 18 and Table 7, the fire resistances and mid-span deflection developments near the failure of T4 and T5 were significantly shorter and faster than the other FE models, indicating they exhibited a more obvious brittleness. Such behavior was very dangerous in the later period of the fire test. As the previous test showed that the brittle failure caused by the broken longitudinal reinforcements occurred in T4, a similar failure was likely to occur in T5.
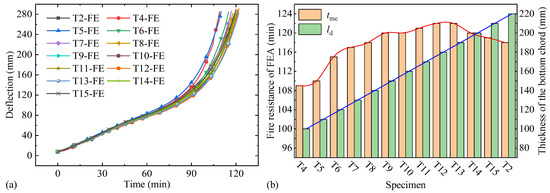
Figure 18.
Simulation results of T5~T15: (a) mid-span deflection versus time relationships and (b) fire resistances.
Table 7.
Simulation results for the fire resistance of the RC T-beam with a circular opening under fire.
Within the range of 100~190 mm of the bottom chord depth, the fire resistance of FE models increased with the increase in the bottom chord depth. Wherein, the fire resistance of the 190 mm bottom chord was 13 min more than the 100 mm bottom chord, mainly because the temperature of longitudinal reinforcements gradually decreased with the increase in the bottom chord depth. In addition, for the same bottom chord depth increment, the fire resistance increment was most of 5 min when the bottom chord depth increased from 110 mm to 120 mm. This may be because the longitudinal reinforcements did not break when the fire resistance was reached with a 120 mm bottom chord.
After the bottom chord depth exceeded 190 mm, the fire resistance decreased owing to the invasion of the circular opening into the concrete in the compressive zone. For the same diameter of the circular opening, the greater the bottom chord depth, the more the circular opening weakened the concrete in the compressive zone.
Moreover, simulation results of the development of the tensile strength, von Mises stress of middle longitudinal reinforcement, together with the mid-span deflection of T3~T6 during the fire, are shown in Figure 19. It can be concluded from Figure 19 that for T4 and T5 with bottom chord depths of 100 mm and 110 mm, the von Mises stresses of mid-span longitudinal reinforcements were zero when the mid-span deflections reached 285 mm. The fractures of longitudinal reinforcements resulted in brittle failures in the FE models.
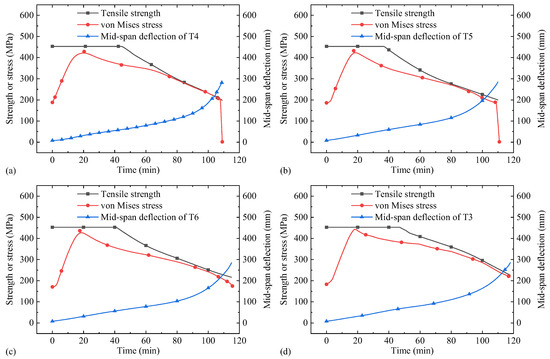
Figure 19.
Simulation results of the tensile strength, von Mises stress of middle longitudinal reinforcement, and mid-span deflection of T3~T6 during the fire: (a) ld = 100 mm, (b) ld = 110 mm, (c) ld = 120 mm, and (d) ld = 220 mm.
For FE models with bottom chord depths greater than 120 mm (T3 and T6 are taken as examples in Figure 19), the von Mises stresses of mid-span longitudinal reinforcements were not zero when their mid-span deflections reached 285 mm. The reinforcements were not broken. The ductile failure happened to the FE models when the fire resistances were overcome. The analysis herein also showed that it can be determined whether the longitudinal reinforcement would be broken under fire by utilizing the finite element analysis (FEA) software to analyze whether the stress of the longitudinal reinforcement was zero.
As a consequence, there was a minimum distance between the bottom of the circular opening and the beam bottom to avoid the brittle failure caused by the fracture of the longitudinal reinforcement under fire. For the specimens in this study, the value was 120 mm.
The design load ratio is a key parameter of the fire test. To investigate the effect of the design load ratio on the fire resistance of the RC T-beam with a circular opening, twelve FE models of T1~T4 were achieved under the design load ratio of 0.3, 0.5, and 0.7. The simulation results of mid-span deflection versus time relationships and the fire resistances of T1~T4 under different design load ratios are presented in Figure 20 and Table 8. It can be seen from Figure 20 and Table 8 that the fire resistance of the RC T-beam with a circular opening decreased as the design load ratio increased since the stress of the reinforcement in the tensile zone increased with the rise in the design load, making it easier to reach its tensile strength under fire. Compared to the design load ratio of 0.3, the fire resistances of T1~T4 under the design load ratio of 0.5, 0.6, and 0.7 were reduced by 22.5%, 29.8%, 34.3%, and 27.5%, 33.7%, 39.3%, and 27.5%, 33.7%, 39.3%, and 34.3%, 38.8%, 44.9%, respectively, showing that the effect of the design load ratio on the fire resistance limit of the RC T-beam with a circular opening was significant.
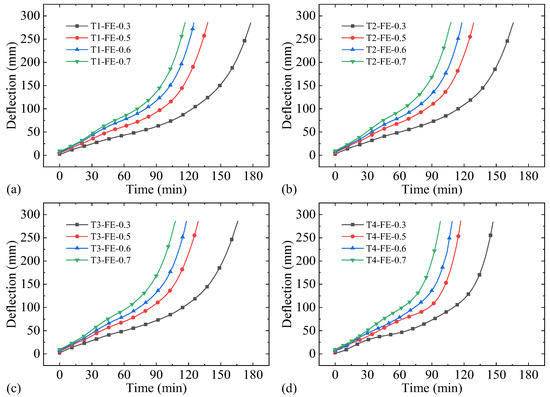
Figure 20.
Simulation results of mid-span deflection versus time relationships of T1~T4 under different design load ratios: (a) T1, (b) T2, (c) T3, and (d) T4.
Table 8.
Simulation results of the fire resistances of T1~T4 under different design load ratios.
5. Simplified Calculation of the Flexural Capacity of the RC T-Beam with a Circular Opening under Fire
The section with a circular opening was taken as the control section for analysis because its sectional flexural capacity was the lowest in the RC T-beam with a circular opening. The 300–800 °C isotherm method [70] was used as a simplified method to calculate the flexural capacity of the section with a circular opening of the RC T-beam. The simulation results of the 300 °C and 800 °C isotherms of T1~T4 were depicted in Figure 21a. To utilize the temperature profiles of Eurocode 2 [66] to determine the specific distributions of 300 °C and 800 °C isotherms, the section with a circular opening of the RC T-beam was divided into three parts to refer to the temperature profile, respectively, as illustrated in Figure 21b: the flange, the top chord, and the bottom chord. The flange, the top chord of the web, and the bottom chord of the web can be equivalent to a slab exposed on one side, a rectangular beam exposed on three sides, and a rectangular beam exposed on four sides, respectively. It should be noted that there was a special case when the circular opening top was aligned with the flange bottom (Case 2 in Figure 21b), in which case part II was treated as part I. Additionally, the solid T-beam can be divided into two parts similar to part I and part II of case 1 in Figure 21b. Each part of case 2 and the solid T-beam should be treated according to the equivalent method to the corresponding part of case 1.
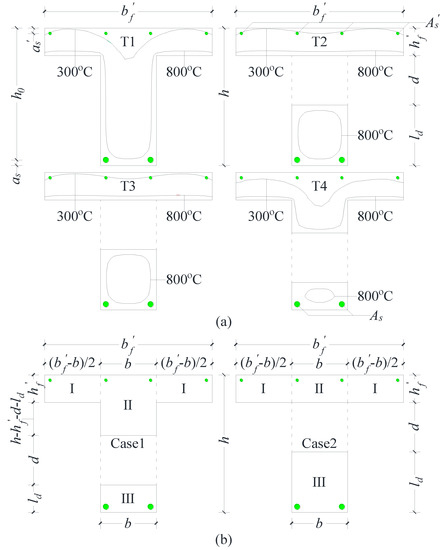
Figure 21.
300 °C and 800 °C isotherms and partitions of the section with a circular opening of the RC T-beam: (a) the simulated sectional temperature fields of T1~T4 when they reached fire resistances, and (b) two cases of the separated regions of the section with a circular opening.
According to the 300–800 °C isotherm method [70], it is assumed that the total areas within the 300 °C isotherm were retained, total areas outside the 800 °C isotherm were neglected, and the width between the 300 °C and 800 °C isotherms was halved. The simplified equivalent details of the temperature field on the section with a circular opening of the RC T-beam are portrayed in Figure 22. In fact, the concrete of the tensile zone did not work under high temperature because of its cracking, and the tensile force in the tensile zone was borne by the longitudinal reinforcement. Accordingly, only the reinforcement was drawn in the tensile zone after equivalence.
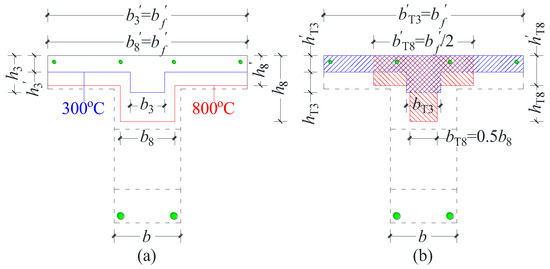
Figure 22.
Simplified equivalent model of temperature field on the section with a circular opening of the RC T-beam: (a) the effective temperature contour, and (b) the equivalent of the section with a circular opening.
In Figure 23a, and were the width and depth of the flange of the approximate T-shape corresponding to the 300 °C isotherm, and were the width and depth of the web of the approximate T-shape corresponding to the 300 °C isotherm, respectively. and were the width and depth of the flange of the approximate T-shape corresponding to the 800 °C isotherm, and were the width and depth of the web of the approximate T-shape corresponding to the 800 °C isotherm, respectively.
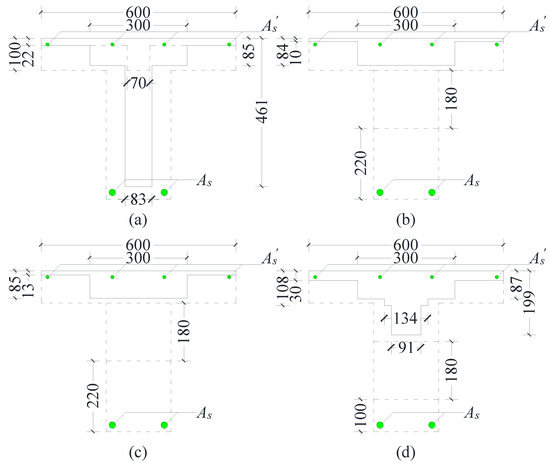
Figure 23.
Equivalent sectional temperature fields when specimens reached fire resistances: (a) T1, (b) T2, (c) T3, and (d) T4.
In Figure 23b, and were the width and depth of the flange of the T-shape corresponding to the 300 °C isotherm in the equivalent section, and were the width and depth of the web of the T-shape corresponding to the 300 °C isotherm in the equivalent section, respectively. and were the width and depth of the flange of the T-shape corresponding to the 800 °C isotherm in the equivalent section, and were the width and depth of the web of the T-shape corresponding to the 800 °C isotherm in the equivalent section, respectively.
According to the method described previously, the sectional temperature fields of RC T-beams with circular openings could be obtained by the look-up table of isotherm in Eurocode 2 [66]. The equivalent sectional temperature fields that reached fire resistances of T1~T4 are pictured in Figure 23.
For the strength of the concrete in the reduced cross-section method, the compressive strength and elastic modulus at room temperature of the concrete were adopted as those of the concrete in the effective section. For the strength of the reinforcement in the reduced cross-section method, the temperature of the reinforcement under fire can be determined by checking the isotherm or FE results of the temperature field, and then the yield strength of the reinforcement under fire can be determined according to the temperature. The reduction coefficient of yield strength of hot-rolled reinforcement under high temperature suggested by the Institution of Structural Engineers (ISE) [71] was adopted. On this basis, the high-temperature flexural capacity of the cross-section was determined using the room-temperature calculation method [60].
The actuator loads at the fire resistances were regarded as the measured failure load of T1~T4. Table 9 shows the temperatures of the longitudinal reinforcements at the failure time by using the method of the look-up table of isotherm. The flexural capacities calculated by using the temperature results of the method of the look-up table of isotherm and the simulation are given in Table 10. These values illustrated that the simplified method can be adopted for the effective prediction of the flexural capacity of the RC T-beam with a circular opening in the fire safety analysis.
Table 9.
The temperatures of the longitudinal reinforcements at the failure time by using the method of the look-up table of isotherm.
Table 10.
Comparison of calculated and experimental values of flexural capacity.
6. Conclusions
The bearing behavior of the RC T-beam with a circular opening under fire was investigated in this paper. One solid RC T-beam and three RC T-beams with circular openings were tested under the design load ratio of 0.6. The test parameters included the drilling of the circular opening, the status of stirrups, and the depth of the bottom chord. A sequentially coupled thermal–mechanical model based on the test results was developed for further investigating the influence of the depth of the bottom chord on the fire resistance and failure mode. Finally, the reduced cross-section method was applied to calculate the flexural capacity of the RC T-beam with a circular opening under fire. The main conclusions are concluded as follows:
- (1)
- In the case of a 100 mm bottom chord and an uncut stirrup, the fire resistance of the RC T-beam with a circular opening was 18.9% lower than the normal RC T-beam, and brittle failure occurred. The fire resistance of the RC T-beams with an uncut stirrup and a cutting stirrup were 0.8% and 4.0% lower than the normal RC T-beam, respectively, both failing in ductile mode. Consequently, an opening at the appropriate location would ensure that the fire resistance of the RC T-beam remained almost constant.
- (2)
- The FE model can simultaneously simulate the temperature field of the RC T-beams with a circular opening at high temperature and the mechanical response of the beams under concentrated load, which can provide a helpful reference for applying static load levels on the RC T-beams with a circular opening under fire.
- (3)
- FE models indicated that brittle failure of the specimen under fire can be avoided with a reasonable depth of the bottom chord. For the case of the specimens in this study, the depth of the bottom chord should be ensured to be no less than 120 mm. The parametric analysis illustrated that the fire resistance decreased with the increasing design load ratio.
- (4)
- Within the parameter range of this study, the 300–800 °C isotherm method was demonstrated to be a good method for calculating the flexural capacity of the RC T-beam with a circular opening under fire. By evaluating the relationship between the flexural capacity and the internal force of the section of the RC T-beam after the creating of the opening, the suitability of the opening location can be assessed.
Author Contributions
Conceptualization, Y.X.; data curation, X.J.; formal analysis, W.Z.; funding acquisition, Y.X.; investigation, X.J., Y.X. and D.Z.; methodology, Y.X.; project administration, Y.X.; software, X.J.; supervision, Y.X.; validation, X.J.; visualization, X.J.; writing—original draft, X.J.; writing—review and editing, Y.X., W.Z. and D.Z. All authors have read and agreed to the published version of the manuscript.
Funding
This research was funded by the National Natural Science Foundation of China (52178484, 51778247) and the Natural Science Foundation of Fujian Province (2020J01059).
Data Availability Statement
The data presented in this study are available on request from the corresponding author.
Acknowledgments
The authors would also like to thank the technical staff of the fire-resistance laboratory of College of Civil Engineering of Huaqiao University for their help.
Conflicts of Interest
The authors declare no conflict of interest.
References
- Mansur, M.A.; Tan, K.H.; Lee, S.L. Collapse loads of R/C beams with large openings. J. Struct. Eng. 1984, 110, 2602–2618. [Google Scholar] [CrossRef]
- Mansur, M.A.; Lee, Y.F.; Tan, K.H.; Lee, S.L. Tests on RC continuous beams with openings. J. Struct. Eng. 1991, 117, 1593–1606. [Google Scholar] [CrossRef]
- Mansur, M.A.; Tan, K.H.; Lee, Y.F.; Lee, S.L. Piecewise linear behavior of RC beams with openings. J. Struct. Eng. 1991, 117, 1607–1621. [Google Scholar] [CrossRef]
- Mansur, M.A.; Huang, L.M.; Tan, K.H.; Lee, S.L. Deflections of reinforced concrete beams with web openings. ACI Struct. J. 1992, 89, 391–397. [Google Scholar] [CrossRef]
- Mansur, M.A.; Tan, K.H.; Weng, W. Analysis of reinforced concrete beams with circular openings using strut-and-tie model. Struct. Eng. Mech. Comput. 2001, 1, 311–318. [Google Scholar] [CrossRef]
- Tan, K.H.; Mansur, M.A. Design procedure for reinforced concrete beams with large web openings. ACI Struct. J. 1996, 93, 404–411. [Google Scholar] [CrossRef]
- Aykac, B.; Kalkan, I.; Aykac, S.; Egriboz, Y.E. Flexural behavior of RC beams with regular square or circular web openings. Eng. Struct. 2013, 56, 2165–2174. [Google Scholar] [CrossRef]
- Barney, G.B.; Corley, W.G.; Hanson, J.M.; Parmelee, R.A. Behavior and design of prestressed concrete beams with large web openings. PCI J. 1977, 22, 32–61. [Google Scholar] [CrossRef]
- Kennedy, J.B.; Abdalla, H. Static response of prestressed girders with openings. J. Struct. Eng. 1992, 118, 488–504. [Google Scholar] [CrossRef]
- Mansur, M.A. Effect of openings on the behaviour and strength of R/C beams in shear. Cem. Concr. Comp. 1998, 20, 477–486. [Google Scholar] [CrossRef]
- Mansur, M.A. Design of reinforced concrete beams with small openings under combined loading. ACI Struct. J. 1999, 96, 675–682. [Google Scholar] [CrossRef]
- Tan, K.H.; Mansur, M.A.; Wei, W. Design of reinforced concrete beams with circular openings. ACI Struct. J. 2001, 98, 407–415. [Google Scholar] [CrossRef]
- Yang, K.H.; Eun, H.C.; Chung, H.S. The influence of web openings on the structural behavior of reinforced high-strength concrete deep beams. Eng. Struct. 2006, 28, 1825–1834. [Google Scholar] [CrossRef]
- Hassan, N.Z.; Sherif, A.G.; Zamarawy, A.H. Finite element analysis of reinforced concrete beams with opening strengthened using FRP. Ain Shams Eng. J. 2017, 8, 531–537. [Google Scholar] [CrossRef]
- Osman, B.H.; Wu, E.; Ji, B. Abdulhameed SS. Shear behavior of Reinforced Concrete (RC) beams with circular web openings without additional shear reinforcement. KSCE J. Civ. Eng. 2017, 21, 296–306. [Google Scholar] [CrossRef]
- Sayed, A.M. Numerical study using FE simulation on rectangular RC beams with vertical circular web openings in the shear zones. Eng. Struct. 2019, 198, 109471. [Google Scholar] [CrossRef]
- Jabbar, D.N.; Al-Rifaie, A.; Hussein, A.M.; Shubbar, A.A.; Nasr, M.S.; Al-Khafajief, Z.S. Shear behaviour of reinforced concrete beams with small web openings. Mater. Today Proc. 2021, 42, 2713–2716. [Google Scholar] [CrossRef]
- Nie, X.F.; Zhang, S.S.; Teng, J.G.; Chen, G.M. Experimental study on RC T-section beams with an FRP-strengthened web opening. Compos. Struct. 2018, 185, 273–285. [Google Scholar] [CrossRef]
- Nie, X.F.; Zhang, S.S.; Chen, G.M.; Yu, T. Strengthening of RC beams with rectangular web openings using externally bonded FRP: Numerical simulation. Compos. Struct. 2020, 248, 112552. [Google Scholar] [CrossRef]
- Nie, X.F.; Zhang, S.S.; Yu, T. Behaviour of RC beams with a fibre-reinforced polymer (FRP)-strengthened web opening. Compos. Struct. 2020, 252, 112684. [Google Scholar] [CrossRef]
- Teng, J.G.; Nie, X.F.; Zhang, S.S. Strengths of RC beams with a fibre-reinforced polymer (FRP)-strengthened web opening. Compos. Struct. 2021, 258, 113380. [Google Scholar] [CrossRef]
- Teng, J.G.; Nie, X.F.; Zhang, S.S. On the FE modelling of RC beams with a fibre-reinforced polymer (FRP)-strengthened web opening. Compos. Struct. 2021, 258, 114161. [Google Scholar] [CrossRef]
- Wu, B.; Tang, G.H. State-of-the-art of fire-resistance study on concrete structures in recent years. J. Build. Struct. 2010, 31, 110–121. (In Chinese) [Google Scholar] [CrossRef]
- Xu, Y.Y.; Wu, B.; Wang, R.H.; Jiang, M.; Luo, Y. Experimental study on residual performance of reinforced concrete beams after fire. J. Build. Struct. 2013, 34, 20–29. (In Chinese) [Google Scholar] [CrossRef]
- Xiong, Y.; Chen, A.; Wu, D.; Zhao, G. Seismic Performance of Composite Shear Walls Filled with Demolished Concrete Lumps and Self-Compacting Concrete after Fire. Buildings 2022, 12, 1308. [Google Scholar] [CrossRef]
- Yang, Z.; Wang, L. Fractal Analysis of Tunnel Structural Damage Caused by High-Temperature and Explosion Impact. Buildings 2022, 12, 1410. [Google Scholar] [CrossRef]
- Abid, S.R.; Abbass, A.A.; Murali, G.; Al-Sarray, M.L.J.; Nader, I.A.; Ali, S.H. Post-High-Temperature Exposure Repeated Impact Response of Steel-Fiber-Reinforced Concrete. Buildings 2022, 12, 1364. [Google Scholar] [CrossRef]
- Lie, T.T. Fire resistance of circular steel columns filled with bar-reinforced concrete. J. Struct. Eng. 1994, 120, 1489–1509. [Google Scholar] [CrossRef]
- Kodur, V.K.R.; Sultan, M.A. Effect of temperature on thermal properties of high-strength concrete. J. Mater. Civ. Eng. 2003, 15, 101–107. [Google Scholar] [CrossRef]
- Bažant, Z.P.; Wang, T.S. Practical prediction of cyclic humidity effect in creep and shrinkage of concrete. Mater. Struct. 1985, 18, 247–252. [Google Scholar] [CrossRef]
- Khoury, G.A.; Dias, W.P.; Sullivan, P.J.E. Deformation of concrete and cement paste loaded at constant temperatures from 140 to 724 °C. Mater. Struct. 1986, 19, 97–104. [Google Scholar] [CrossRef]
- Schneider, U. Concrete at high temperatures—A general review. Fire Saf. J. 1988, 13, 55–68. [Google Scholar] [CrossRef]
- Castillo, C.; Durranil, A.J. Effect of transient high temperature on high-strength concrete. ACI Mater. J. 1990, 87, 47–53. [Google Scholar] [CrossRef]
- Thienel, K.C.; Rostasy, F.S. Strength of concrete subjected to high temperature and biaxial stress: Experiments and modeling. Mater. Struct. 1995, 28, 575–581. [Google Scholar] [CrossRef]
- Hu, H.T.; Dong, Y.L. Experimental research on the transient thermal strain of high strength concrete at elevated temperature. J. Build. Struct. 2002, 23, 32–47. (In Chinese) [Google Scholar] [CrossRef]
- Hu, H.T.; Dong, Y.L. Experimental research on strength and deformation of high-strength concrete at elevated temperature. China Civ. Eng. J. 2002, 35, 44–47. (In Chinese) [Google Scholar] [CrossRef]
- Gawin, D.; Pesavento, F.; Schrefler, B.A. Modelling of hygro-thermal behaviour of concrete at high temperature with thermo-chemical and mechanical material degradation. Comput. Method. Appl. M. 2003, 192, 1731–1771. [Google Scholar] [CrossRef]
- Arioz, O. Effects of elevated temperatures on properties of concrete. Fire Saf. J. 2007, 42, 516–522. [Google Scholar] [CrossRef]
- Xing, W.L.; Shi, X.D.; Ni, J.G. Short-term thermal creep model of concrete based on experiments. Eng. Mech. 2011, 28, 158–163. Available online: https://www.engineeringmechanics.cn/article/id/1578 (accessed on 16 January 2023). (In Chinese).
- Lie, T.T. A procedure to calculate fire resistance of structural members. Fire Mater. 1984, 8, 40–48. [Google Scholar] [CrossRef]
- Dorn, J.E. Some fundamental experiments on high temperature creep. J. Mech. Phys. Solids. 1955, 3, 85–116. [Google Scholar] [CrossRef]
- Harmathy, T.Z. A comprehensive creep model. J. Basic Eng. 1967, 89, 496–502. [Google Scholar] [CrossRef]
- Kodur, V.K.R.; Dwaikat, M. A numerical model for predicting the fire resistance of reinforced concrete beams. Cem. Concr. Comp. 2008, 30, 431–443. [Google Scholar] [CrossRef]
- Hou, X.M.; Zheng, W.Z. Introduction of the main contents of structural fire design in eurocode of design of concrete structures (I)—Effects of actions and design resistance in the fire situation, material properties and fire design method based on tabulated data. Ind. Constr. 2008, 38, 98–103. (In Chinese) [Google Scholar] [CrossRef]
- Felicetti, R.; Gambarova, P.G.; Meda, A. Residual behavior of steel rebars and R/C sections after a fire. Constr. Build. Mater. 2009, 23, 3546–3555. [Google Scholar] [CrossRef]
- Elghazouli, A.Y.; Cashell, K.A.; Izzuddin, B.A. Experimental evaluation of the mechanical properties of steel reinforcement at elevated temperature. Fire Saf. J. 2009, 44, 909–919. [Google Scholar] [CrossRef]
- Wu, B.; Liang, Y.H. Statistic analysis of strengths of concrete and steel bars at elevated temperature. J. Nat. Disasters. 2010, 19, 136–142. (In Chinese) [Google Scholar] [CrossRef]
- Kodur, V.K.R.; Dwaikat, M. Effect of high temperature creep on the fire response of restrained steel beams. Mater. Struct. 2010, 43, 1327–1341. [Google Scholar] [CrossRef]
- El-Hawary, M.M.; Ragab, A.M.; El-Azim, A.A.; Elibiari, S. Effect of fire on shear behaviour of R.C. beams. Comput. Struct. 1997, 65, 281–287. [Google Scholar] [CrossRef]
- Choi, E.G.; Shin, Y.S.; Kim, H.S. Structural damage evaluation of reinforced concrete beams exposed to high temperatures. J. Fire Prot. Eng. 2013, 23, 135–151. [Google Scholar] [CrossRef]
- Ozbolt, J.; Bosnjak, J.; Periskic, G.; Sharma, A. 3D numerical analysis of reinforced concrete beams exposed to elevated temperature. Eng. Struct. 2014, 58, 166–174. [Google Scholar] [CrossRef]
- Youssef, M.A.; El-Fitiany, S.F.; Diab, M.A. Shear capacity of RC beams at elevated temperatures. Mag. Concr. Res. 2015, 67, 1190–1203. [Google Scholar] [CrossRef]
- Cai, J.; Burgess, I.; Plank, R. A generalised steel/reinforced concrete beam-column element model for fire conditions. Eng. Struct. 2003, 25, 817–833. [Google Scholar] [CrossRef]
- Bratina, S.; Saje, M.; Planinc, I. The effects of different strain contributions on the response of RC beams in fire. Eng. Struct. 2007, 29, 418–430. [Google Scholar] [CrossRef]
- ISO 834-1; International Standard, Fire-Resistance Tests—Elements of Building Construction—Part 1: General Requirements. International Organization for Standardization: Geneva, Switzerland, 1999.
- GB/T 50081-2019; Standard for Test Methods of Concrete Physical and Mechanical Properties. Ministry of Housing and Urban-Rural Development of the People’s Republic of China: Beijing, China, 2019. (In Chinese)
- Xiao, J.Z.; König, G. Study on concrete at high temperature in China—An overview. Fire Saf. J. 2004, 39, 89–103. [Google Scholar] [CrossRef]
- Kodur, V. Properties of concrete at elevated temperatures. ISRN Civ. Eng. 2014, 2014, 468510. [Google Scholar] [CrossRef]
- GB/T 228.1-2021; Metallic materials—Tensile testing—Part 1: Method of Test at Room Temperature. State Administration for Market Regulation: Beijing, China, 2021. (In Chinese)
- GB 50010-2010; Code for the Design of Concrete Structures. Ministry of Housing and Urban-Rural Development of the People’s Republic of China: Beijing, China, 2010. (In Chinese)
- GB/T 9978.1-2008; Fire-resistance tests—Elements of building construction—Part 1: General requirements. State Administration for Market Regulation: Beijing, China, 2008. (In Chinese)
- Zhu, H.; Wu, G.; Zhang, L.; Zhang, J.F.; Hui, D. Experimental study on the fire resistance of RC beams strengthened with near-surface-mounted high-Tg BFRP bars. Compos. Part B-Eng. 2014, 60, 680–687. [Google Scholar] [CrossRef]
- Gao, W.Y.; Dai, J.G.; Teng, J.G. Fire resistance design of un-protected FRP-strengthened RC beams. Mater. Struct. 2016, 49, 5357–5371. [Google Scholar] [CrossRef]
- Gao, W.Y.; Dai, J.G.; Teng, J.G. Fire resistance of RC beams under design fire exposure. Mag. Concr. Res. 2017, 69, 402–423. [Google Scholar] [CrossRef]
- Wang, Y.; Duan, Y.K.; Zhang, Y.J.; Zhang, G.Y.; Qiu, C.H.; Yuan, G.L. Experimental study and theoretical analysis of concrete continuous slabs with different spans subject to fire in order. China Civ. Eng. J. 2019, 52, 23–40. (In Chinese) [Google Scholar] [CrossRef]
- EN 1992-1-2:2004:E; Eurocode 2—Design of concrete structures—Part 1-2: General Rules—Structural Fire Design. European Committee for Standardization: Bruxelles, Belgium, 2004.
- Lubliner, J.; Oliver, J.; Oller, S.; Oñate, E. A plastic-damage model for concrete. Int. J. Solids Struct. 1989, 25, 299–326. [Google Scholar] [CrossRef]
- Zhang, B.; Bicanic, N.; Pearce, C.J.; Balabanic, G. Residual fracture properties of normal- and high-strength concrete subject to elevated temperatures. Mag. Concr. Res. 2000, 52, 123–136. [Google Scholar] [CrossRef]
- Cooke, G.M.E. An introduction to the mechanical properties of structural steel at elevated temperatures. Fire Saf. J. 1988, 13, 45–54. [Google Scholar] [CrossRef]
- DBJ/T 15-81-2011; Code for fire resistance design of concrete building structures. Department of Housing and Urban-Rural Development of Guangdong Province: Guangzhou, China, 2011. (In Chinese)
- Institution of Structural Engineers. Design and Detailing of Concrete Structures for Fire Resistance; Institution of Structural Engineers: London, UK, 1978. [Google Scholar]


Disclaimer/Publisher’s Note: The statements, opinions and data contained in all publications are solely those of the individual author(s) and contributor(s) and not of MDPI and/or the editor(s). MDPI and/or the editor(s) disclaim responsibility for any injury to people or property resulting from any ideas, methods, instructions or products referred to in the content. |
© 2023 by the authors. Licensee MDPI, Basel, Switzerland. This article is an open access article distributed under the terms and conditions of the Creative Commons Attribution (CC BY) license (https://creativecommons.org/licenses/by/4.0/).