Abstract
The renovation/modernisation of buildings is one of the most frequently addressed areas in the European Union. It is the basis for the entry into force of Directive 2010/31/EU on the energy performance of buildings. The assessment of renovated buildings has several objectives, characterised by different assessment indicators. To better assess the renovation of buildings and future energy efficiency improvements, natural and computer simulations are used to help make more rational decisions. This work aims to analyse and quantify energy efficiency improvement measures and additional factors based on an existing retrofitted office building using collected, measured, and modelled data. The work is based on measured real building data for the assessment of heat loss of the building and calculating the thermal coefficient of the external envelope. Energy modelling of buildings before and after retrofitting is carried out using simulation, data processing, and analysis software.
1. Introduction
1.1. Energy-Related Building Renovation
A notable portion of the European building stock’s energy consumption is attributed to existing non-residential buildings [1]. The European Union (EU) has a stock of more than 220 million buildings built before 2001, accounting for 85% of all buildings across the EU. By 2050, 85–95% of the buildings we see today will still exist and be a part of the EU’s climate-neutral economy. There is a lack of efficiency in the use of existing buildings [2]. Thirty-six per cent of CO2 emissions in the European Union come from the built environment, making it a strong focus of the EU’s climate change strategy [3]. Therefore, it is essential to improve the energy efficiency of buildings to achieve carbon neutrality by 2050, and the Energy Performance of Buildings Directive (EPBD) is a vital part of this effort. However, the current recast of the EPBD is the first legislative step towards reducing the life-cycle carbon footprint of buildings. This recast is adopted prior to setting carbon benchmarks and establishing a life-cycle carbon trajectory for buildings, which outlines how all building-related carbon emissions can and should be reduced over time. As a further revision of the EPBD is scheduled to be carried out by the end of 2027, this lack of coherence risks creating a lack of coherence between most of the policy instruments that target and affect the different stages of the construction value chain [4].
For energy efficient buildings to become more prevalent, an increased share of renewable energy and energy efficiency will be needed, which will require a significant transformation of construction influenced by EPBD energy-saving targets for new buildings as well as renovations of existing buildings [3]. In Europe, the building stock is not being replaced at a rapid rate; newly built buildings can therefore only play a minor role in developing carbon-neutral building stock. Due to this, the biggest challenge is linked to the existing building stock. Energy renovation will play a key role in reducing carbon emissions as part of the overall solution to climate change [5]. Renovations to existing EU buildings are carried out yearly on only 11% of the existing stock. Only 5% of EU renovation projects have produced energy savings regarding deep renovations [6]. Renovation works rarely address the energy performance of buildings, and only 1% of them are weighted annual energy renovations. EU-wide, only 0.2% of buildings undergo renovations that reduce energy consumption by at least 60%, and in some regions, energy renovation rates are virtually non-existent [2]. Assuming that 2030 will bring new technologies and practices, the Intergovernmental Panel on Climate Change synthesis report already in 2007 identified the building sector as the sector with the most prominent economic mitigation potential [7]. Thus, the construction sector is increasingly adopting digitalisation and modelling tools, changing traditional design processes, and enabling the continuous search for new and better solutions [8].
Lithuania, as well as other Eastern European countries, still has a significant number of unused old industrial facilities from the Soviet era. Typically, these buildings are tall and large, and their façades contain large amounts of glazing. Rather than demolishing these buildings, they are being redeveloped to become residential or administrative buildings [9]. The assessment of renovated buildings has several objectives defined by different assessment indicators. To better assess the renovation of buildings and future energy efficiency improvements, both natural and computer simulations are used to help make more rational decisions.
The analysis of the modernisation process shows that the modernisation of old non-residential buildings is more widespread abroad than in Lithuania. Scientists, researchers and building energy specialists are studying how to improve the energy efficiency of buildings by using natural tests. Computer simulation programmes are being incorporated to try to optimize the smooth functioning of the control processes of the building’s energy systems, thus reducing energy consumption and improving the smooth functioning of the equipment’s potential.
1.2. Literature Review
Building modelling and data validation of retrofitted buildings is essential to optimise the energy performance of existing buildings to find the best optimisation scenarios, both in terms of costs and the environment. However, renovating a building to a higher energy class is a complex and comprehensive process, which does not always result in lower energy performance in the end. This is because not all of the building’s composite parameters are continually assessed before renovation (as the studies discussed suggest, deep energy renovation is not widespread, and parameters such as input peak loads or cooling demand can strongly influence the modelling of the renovation results) [10]. Additionally, we must recognise the fact that, as we move towards a CO2-neutral economy, building renovation must also consider this aspect [11,12]. As noted in the work of the researchers discussed above, improving the energy efficiency of a building (for example, by increasing the insulation of the building envelope) can lead to a significant increase in the CO2 footprint of a building due to embodied energy incorporation [13,14,15]. Digital modelling tools are here to help [16,17], but they need to be used appropriately as the renovation outcome is not 100% accurate due to the large amount of data and the need to understand of that data [18,19]. The Life Cycle Assessment (LCA) approach to the energy-related renovation of buildings is one of the tools to consider environmental impacts. However, there is no single framework that can be applied to the various energy renovation cases of buildings, and researchers have presented different approaches to the application of LCA [20,21,22,23]. Therefore, proper validation of simulation data with actual data is necessary, as this can help achieve the required renovation outcome in the future by considering the available data and the components in advance. This work aims to analyse the energy data of a renovated office building with simulation data, which can help improve the available building models in the future. Moreover, it also contributes to further data simulation modelling as the further increase in the energy efficiency of the building becomes more accurate.
2. Methodology, Research Objects and Actual Energy Data
The methods used in this study were compiled based on the discussed works of scientists and researchers, measurements (which are not presented in this article), actual energy consumption and computer models of the building (Table 1). During the research, first, information is collected about the energy consumption of the buildings of the research objects “D” and “A” (Table 2), and descriptions are obtained of the active building systems used for heating, cooling and air conditioning, and of the architectural solutions of the passive systems of the buildings (heat transfer coefficients, room layout and geometry).

Table 1.
Consistency of research methodology.
Table 2.
Objects of research.
After collecting data about the building, measurements of heat flow and microclimate parameters (indoor and outdoor air temperature) of the external envelopes (walls, glazing, frames, roof) of the “A” building were carried out to specify the values of the heat transfer coefficients, i.e., U-values (W/m2K), which are used for further research. After the tests, models of the three-story administrative buildings “D” and “A” were created with the help of a computer modelling tool. Simulations using the program “DesignBuilder” for dynamic energy modelling of buildings were used to estimate the energy demands of buildings (heat, cooling, ventilation), comfort parameters (indoor and outdoor air temperature, relative humidity), solar radiation, etc., which allows for performing complex modelling at a selected time step. Based on the obtained results from the simulated models, the “MS Excel” program was used to process the data with the implemented functions, and to properly present the results.
The research objects were administrative buildings called “D” and “A”. An existing administrative building was chosen for the study in Kaunas City, Lithuania. The main goal of the building’s modernization is to renew the passive (external envelopes) and active (energy systems and equipment) parts of the building, i.e., to replace the heated walls, roof, and windows with new ones. The building under consideration is a three-story building consisting of 59 rooms. The building has three floors, the total heated area is 2587.81 m2, the height of one floor is 29 m, the whole building height is about 10 m, and the main facade of the building is oriented to the south.
For further analysis, the following assumptions are made:
- That 105 employees worked/are working in buildings “D” and “A”;
- The geometry and layout of premises in the “D” and “A” buildings remain the same.
Figure 1 represents a photo of the “D” building before modernization; the building was built in 1996.
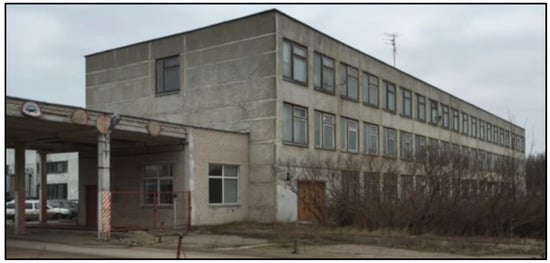
Figure 1.
Building before reconstruction (“D” building).
Building reconstruction works were completed in 2019. Figure 2—a photo of building “A” after modernization is presented:
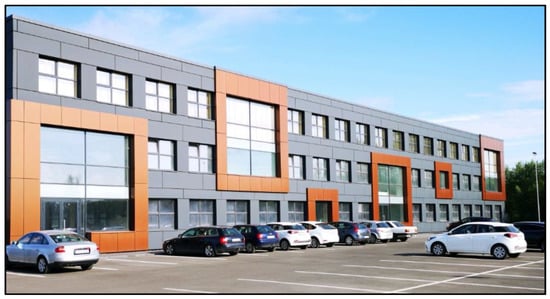
Figure 2.
Building after reconstruction (“A” building).
Two models of the buildings “D” and “A” were created based on the design data and architectural plans of the selected building, energy consumption indicators, natural tests, and computer modelling tools. Based on measured and modelled results, the obtained installed energy-efficiency opportunities were validated with real data.
2.1. Actual Energy Consumption of the “D” Building
Before the retrofitting, the heat needs of the building were supplied by the district heating network. Based on Heat Supplier Company data, 2016, Figure 3 shows the heat consumption before the building was modernised.
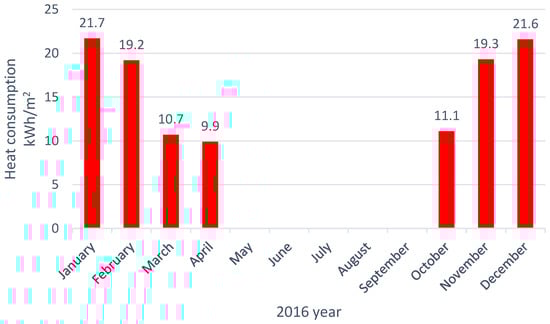
Figure 3.
“D” building heat consumption for space heating (2016).
The building was heated by a radiator heating system before modernisation, with no cooling units, only natural ventilation through the windows. The electricity needs of the “D” building were met from the electricity grid. The electrical appliances and lighting technologies used were inefficient as they consumed large amounts of electricity. The electricity consumption data obtained by Energy Distribution Operator in 2016 are presented in Figure 4.
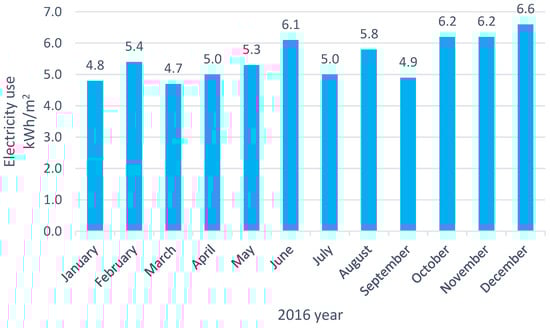
Figure 4.
“D” Electricity consumption of the building (2016 year data).
2.2. Energy System and Actual Energy Data of Building “A”
Each floor of the building is equipped with low-temperature air/water heat pumps which comprise an indoor unit with reversing heating and cooling ability. The heat pump structure contains a circulator, expansion tank, safety valve, plate heat exchanger Freon/water, supplementary electric heater (BUH), and a control module. The structure of the heat pump external unit comprises a compressor, heat exchanger, and a fan. The heat pumps are installed on each floor of the building, with a heating capacity of 16.10 kW per unit and a cooling capacity of 13.12 kW. Electric underfloor heating is also installed on all three floors of the building. The heat pumps have a heating coefficient of performance (COP) = 4.20, and a cooling coefficient of performance (EER) = 2.29.
A rotary ventilation unit (energy efficiency class A) is installed on each floor of the building for ventilation. The supply L = 1647 m3/h capacity, with a static pressure of 310 Pa. The exhaust L = 1427 m3/h capacity, with a static pressure of 200 Pa, with a rotary heat exchanger. The electric input power of the fan drive at maximum flow is 660 W, and for the electric air heater is 7.5 kW. Actual data on the heating, cooling, and ventilation electricity consumption of building “A” in 2020 are presented in Figure 5.
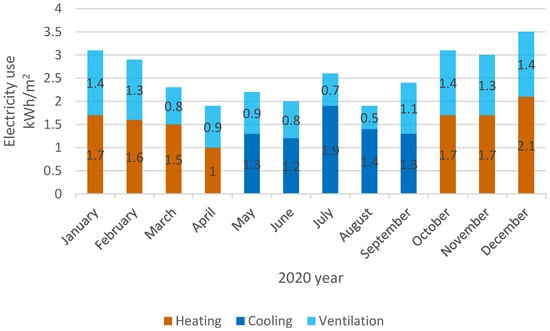
Figure 5.
The building “A”’s annual electricity consumption for heating, cooling and ventilation (2020 data).
It is clear from Figure 5 that the highest energy consumption occurs during the months of the heating season (December, January, etc.), which consists of heating and ventilation components. The month of July, when the consumption of cooling is the highest, is also exceptional.
The building’s electrical system consists of distribution panels and metering devices. Electricity needs are met by a grid-connected solar power plant, also known as an integrated solar power plant. The SolarEgde monitoring software shows the power plant’s production and electricity consumption over time, as well as CO2 savings. The production of the solar power plant in 2020 and the amount of electricity consumed by lighting and other energy-consuming equipment are shown in Figure 6.
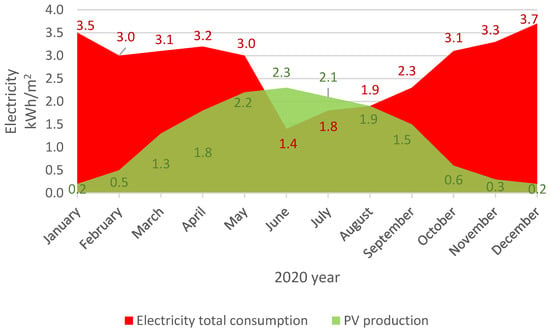
Figure 6.
Electricity use and production after reconstruction (2020 data).
Figure 6 reveals how the installed PV solar power plant covers the total electricity needs of the building. An obvious and common problem is that, as PV is used on-site, only the electricity demand in the middle of summer is usually compensated, while in climatic conditions such as those in Lithuania, the highest energy demand is in the middle of the heating season.
3. Simulation and Validation Results
The building has three floors, a total heated area of 2587.81 m2, a height of 3.3 metres per floor, a total building height of approximately 10 metres, and a width of approximately 16.2 m. The building comprises utility rooms, offices, meeting rooms, toilets, corridors, staircases, and utility rooms. Based on the available design and measured data for buildings “D” and “A”, theoretical models of the buildings were developed using a dynamic simulation programme. A visualisation of the developed “D” model is presented in Figure 7.
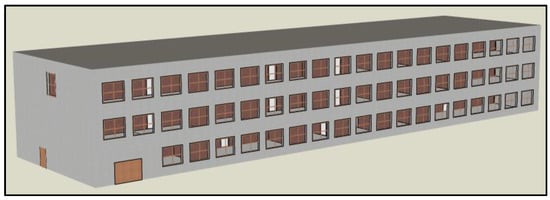
Figure 7.
Visualisation of the “D” building (extract from “DesignBuilder”).
A visualisation of the developed “A” model is presented in Figure 8.
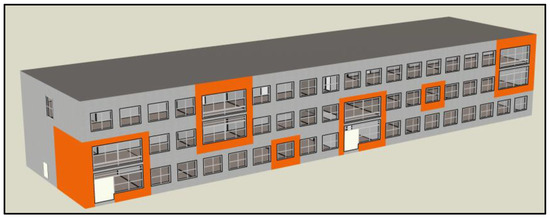
Figure 8.
Visualisation of the “A” building (extract from “DesignBuilder”).
For the energy modelling of the building, the climatic data for the typical meteorological years of Kaunas were entered into the International Weather for Energy Calculations (IWEC), and the International Weather for Energy Calculations (IWEX 2009) database was used. The outdoor air temperature for heating and ventilation was set at −19.9 °C, which is given in the climatic data for Kaunas city during typical meteorological years. For the office building analysed in the study, heat transfer coefficients have been adopted, and the U-values are indicated in Table 3:
Table 3.
Heat transfer coefficients (U-values (W/m2K)).
The internal partitions between rooms in building “D” are “closed”, i.e., made of brick walls, whereas in building “A”, all the internal partitions are glass. Before the reconstruction of the building, the air infiltration was unknown; taking into account the fact that the windows of the building were unchanged from the time of construction, the infiltration was assumed to be equal to 0.5 or n50 = 10 times/h. After modernization, the building underwent a tightness test, during which all the air supply and extraction ducts and other openings of the recuperative ventilation system were sealed. Blowing doors are installed on the first floor in the southeast part of the building. After performing the tightness test, the tightness coefficient of the building was determined to be n50 = 0.8 times/h. According to national regulations, the tightness coefficient for buildings of energy efficiency class A cannot exceed 1.0 times/h.
3.1. Heating
As the air-to-water heat pump installed in building “A” uses electricity, the heat consumption for heating was recalculated by determining the efficiency of the heat pump in the model validation software, assuming that the “determined” SCOP in the simulation software is appropriate and will be used for the recalculation of the thermal energy needs and costs of building “A”. The monthly heat energy consumption presented in Figure 9 gives the accurate equal total result of 113.5 kWh/m2 of the actual and simulated data for building “D”. This allows us to conclude that the model is correct and can be used to analyse the other building parameters before the renovation and to assess the previous state of the building.
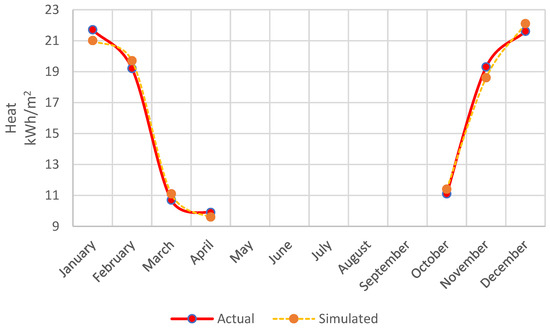
Figure 9.
Validation—actual heat consumption and simulated demand of building “D”.
From the graph in Figure 9 is clear that the validation of heating energy (without heat pumps) succeeded very accurately, and some of the thermal energy discrepancies could be due to the climatic weather conditions and the building’s occupancy rates. The model of building “D” was needed to determine the thermal energy consumption. Once the model was proven correct, it was used as a basis for the other parameters selected for analysis in the work.
Based on the data available for the “A” building for 2020, the actual electricity consumption for heating and ventilation and the results obtained in DesignBuilder, a comparison is presented in Figure 10.
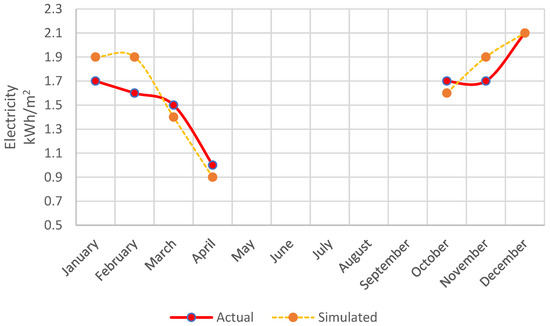
Figure 10.
Validation of electricity consumption for heating of “A” building.
The data presented in the graph show an estimated discrepancy of 4.3% between the measured data obtained for building “A” and the “calibrated” model for building “A”. Therefore, we can say that the model “calibrated” correctly according to the tolerance limits specified in LST EN 15265:2007 up to 15%.
The conversion of electricity consumption into heat energy consumption requires a seasonal heating coefficient of performance (SCOP). In “DesignBuilder”, the seasonal heating coefficient of performance (SCOP) of the heat pump simulated for each month of the heating season ranged from 2.8 to 4.1, with an average SCOP of 3.5 taken for the calculation of the heat input. The SCOP was therefore used to convert the heat energy to annual heat demand for building “A”.
From the monthly thermal energy consumption of buildings “D” and “A” in Figure 9, the annual heat energy demand for construction “D” was 113.5 kWh/m2/year based on measured data and simulation performed in “DesignBuilder”. The thermal energy demand for heating and ventilation in building “A” was 48.47 kWh/m2/year according to the data obtained in the simulation programme and 47.19 kWh/m2/year in building “A” according to the public actual energy consumption. After the systematisation of the data, it was estimated that the savings after the energy system installation were 55.50 kWh/m2/year using the results of the “DesignBuilder” model and 66.94 kWh/m2/year based on actual consumption. To obtain an accurate seasonal thermal performance, it is necessary to conduct in-kind tests and experiments on an operating heat pump.
3.2. Ventilation and Cooling
As the ventilation equipment was only installed in the second model after the renovation, only the performance of this model will be assessed at this stage. Figure 11 shows the post-renovation ventilation demand obtained from the simulation in the software and compares it with the available actual figures.
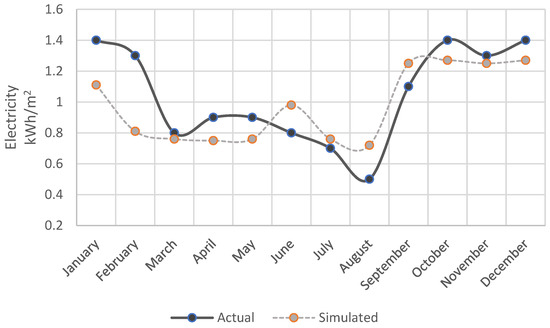
Figure 11.
Validation of actual and simulated electricity demand for ventilation.
Figure 11 shows the electricity consumption for ventilation for each month. The resulting figures are compared with the actual electricity consumption for ventilation. The simulation results show an annual consumption of 11.7 kWh/m2/year for the whole cooling season, compared to 12.5 kWh/m2/year for the actual available data, with a mismatch of 8.04%, due to the climatic data entered in the simulation and the inadequate estimation of the number of occupants.
As the cooling equipment was only installed in the second model, i.e., building “A”, only the performance of this model will be assessed at this stage. Figure 12 shows the monthly cost of the cooling demand after renovation for the installed chiller. This figure reflects the electricity consumption for cooling when needed, i.e., during the summer. The figures obtained are compared with the actual electricity consumption for cooling already available. The simulation results show an annual consumption of 6.31 kWh/m2/year for the whole cooling season and 7.04 kWh/m2/year for the actual data available, with a mismatch of 11.5%, which is influenced by the climatic data (solar radiation, air temperature, cloudiness) entered in to the simulation, as well as by the inadequate estimation of the number of people in the rooms.
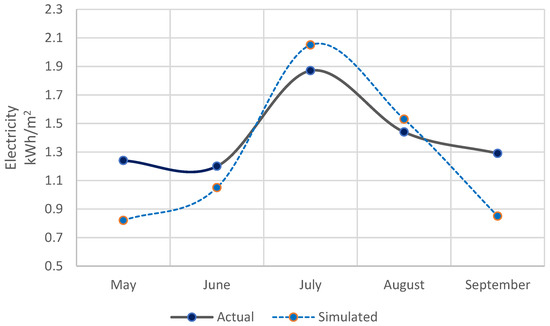
Figure 12.
Validation of the actual and simulated results of electricity for air cooling.
From the results obtained from actual data, it can be seen that for cooling, the most energy is consumed in July, and the least in June, while the simulation results are evenly distributed. This shows that the validation of air cooling demand is sufficiently complex and sensitive. Moreover, the main factor most influencing the result was SEER, i.e., the seasonal cooling efficiency factor, which was obtained during the validation of the model 2.3.
3.3. Summary of the Results
Based on natural tests, it was observed that the renovation of the building’s outer envelope including walls, window frames, glazing, and roof, i.e., insulation of the outer walls and ceiling, and replacement of old windows with new ones, had a significant impact on the energy efficiency of the building. From Figure 13, the results show a reduction of about 72% in the wall heat transfer coefficient, approximately 68% in the roof, and a reduction of 25% in the overall window performance. These reductions resulted in heat energy savings in the building after modernisation (Figure 14).
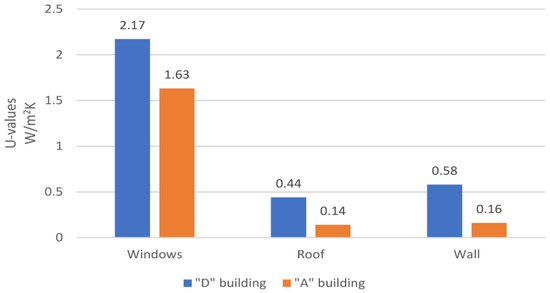
Figure 13.
Changes of the U-values caused by building renovation.
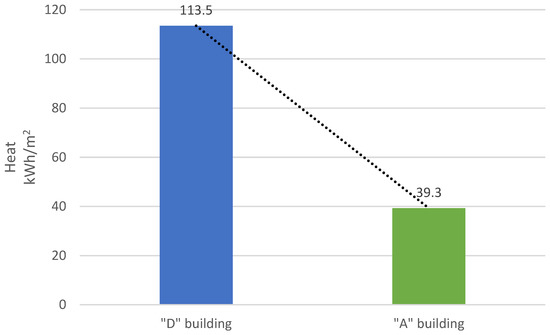
Figure 14.
Heat energy consumption comparison.
It was noted that the indoor temperature changed significantly after the reconstruction of the building. Before modernisation, the indoor temperature did not reach the norm specified in the regulations. It is estimated that the indoor temperature in the “D” building reached 17 °C in the cold season, while in the “A” building, according to measurement, the temperature varied from 20 °C to 23 °C. However, heat savings are nevertheless significant.
The electrical appliances used in the energy class D building were inefficient and consumed a lot of electricity, thus increasing the electricity consumption and costs. In the energy class A building, the retrofitting changed the energy-efficient lighting solutions to new, more efficient technologies such as LED lighting. All appliances were replaced with devices which complied with the regulations of the time, reducing electricity costs.
From Figure 15, it can be seen that even though the building was renovated, the electricity consumption increased; this was due to the installation of the energy system for heating, cooling and ventilation, and was also influenced by the use of computer equipment, especially powerful servers in the building. Using renewable energy generation systems, 105 solar modules have been installed on the roof of the building, and the plant generates around 36 MWh/year, thus meeting part of the electricity consumption cost and reducing CO2 emissions. According to the available total electricity use and the total annual production of the installed power plant, it is estimated that the installed power plant meets about 22% of all electricity needs (Figure 16). Based on this result, further CO2 neutrality of the building can be planned.
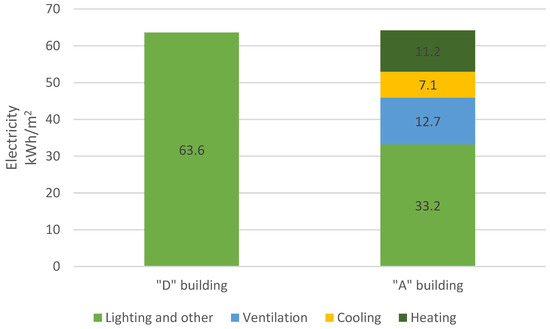
Figure 15.
Electricity consumption comparison.
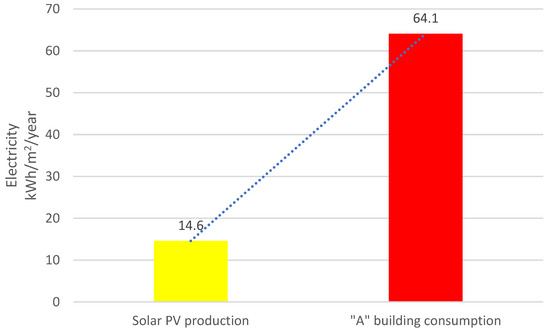
Figure 16.
Solar power plant (PV) generation and total electricity consumption.
The last figure shows that there is still a huge potential to improve energy efficiency, perhaps not by reducing demand, but by increasing the use of renewable energy sources. In order to ensure the production of electricity only from renewable energy sources, one of the recommendations for ensuring electricity needs is to connect the distant solar or wind power plants, which is a very popular measure in Lithuania currently.
4. Discussion and Conclusions
Validation of energy simulation results and actual data is always complex, containing a number of uncertainties and requiring an expert understanding not only of the building’s architecture but especially of the types and operation of indoor climate systems.
Reconstruction (renovation) of a building from a lower energy class (in this case, “D” building) to a higher one (“A” building) does not always reduce the building’s energy needs. In this particular case, the building’s heat demand decreased almost three times, yet the total electricity demand increased. Such an increase is influenced by the installation of additional indoor climate systems and the additional use of other electrical devices (e.g., computer servers).
Validation (verification) of energy simulation results with actual data allows for more confidence in the created models; at the same time, the further increase of the energy efficiency of the building becomes more accurate.
An important question is about the “normalization” of energy demands. This is usually done using degree days (DD), which include temperatures and periods. Nevertheless, for low-energy buildings in particular, solar and internal gains as well as utilization factors are more important. However, the “normalization” of these parameters is complicated, usually not regulated (in individual countries), and it is an area for further research.
One of the key issues in validating the results is the actual SCOP and SEER of the heating and cooling systems for each particular operating period, as they depend on the characteristics of the specific devices. Simulation models allow the entering of variation curves, while actual equipment does not always allow accurate determination of a certain SCOP or SEER, so more accurate measurements of efficiency coefficients are required.
Author Contributions
Conceptualization, K.V.; methodology, K.V.; software, K.V. and M.G.; validation, K.V.; formal analysis, M.G.; writing—original draft preparation, K.V. and M.G.; writing—review and editing, K.V. and M.G.; visualization, K.V. and M.G.; supervision, K.V. All authors have read and agreed to the published version of the manuscript.
Funding
This research received no external funding.
Data Availability Statement
The data presented in this study are available on request from the corresponding author.
Conflicts of Interest
The authors declare no conflict of interest.
References
- Richarz, J.; Henn, S.; Osterhage, T.; Müller, D. Optimal scheduling of modernization measures for typical non-residential buildings. Energy 2022, 238, 121871. [Google Scholar] [CrossRef]
- European Commission. A Renovation Wave for Europe—Greening Our Buildings, Creating Jobs, Improving Lives; European Commission: Brussels, Belgium, 2020. [Google Scholar]
- Clarke, L.; Sahin-Dikmen, M. Unions and the green transition in construction in Europe: Contrasting visions. Eur. J. Ind. Relat. 2020, 26, 401–418. [Google Scholar] [CrossRef]
- BPIE (Buildings Performance Institute Europe). Roadmap to Climate-Proof Buildings and Construction—How to Embed Whole-Life Carbon in the EPBD; BPIE: Brussels, Belgium, 2022. [Google Scholar]
- Terés-Zubiaga, J.; Bolliger, R.; Almeida, M.; Barbosa, R.; Rose, J.; Thomsen, K.; Montero, E.; Briones-Llorente, R. Cost-effective building renovation at district level combining energy efficiency & renewables—Methodology assessment proposed in IEA EBC Annex 75 and a demonstration case study. Energy Build. 2020, 224, 110280. [Google Scholar] [CrossRef]
- Remeikienė, R.; Gasparėnienė, L.; Fedajev, A.; Szarucki, M.; Đekić, M.; Razumienė, J. Evaluation of Sustainable Energy Development Progress in EU Member States in the Context of Building Renovation. Energies 2021, 14, 4209. [Google Scholar] [CrossRef]
- Pachauri, R.K.; Reisinger, A. Climate Change 2007. Synthesis Report. Contribution of Working Groups I, II and III to the Fourth Assessment Report; IPCC: Geneva, Switzerland, 2008. [Google Scholar]
- Lapinskienė, V.; Motuzienė, V. Integrated building design technology based on quality function deployment and axiomatic design methods: A case study. Sustain. Cities Soc. 2021, 65, 102631. [Google Scholar] [CrossRef]
- Valančius, K.; Motuzienė, V.; Paulauskaitė, S. Redeveloping industrial buildings for residential use: Energy and thermal comfort aspects. Energy Sustain. Dev. 2015, 29, 38–46. [Google Scholar] [CrossRef]
- Zeferina, V.; Wood, F.R.; Edwards, R.; Tian, W. Sensitivity analysis of cooling demand applied to a large office building. Energy Build. 2021, 235, 110703. [Google Scholar] [CrossRef]
- Buckley, N.; Mills, G.; Reinhart, C.; Berzolla, Z.M. Using urban building energy modelling (UBEM) to support the new European Union’s Green Deal: Case study of Dublin Ireland. Energy Build. 2021, 247, 111115. [Google Scholar] [CrossRef]
- Brambilla, A.; Salvalai, G.; Imperadori, M.; Sesana, M.M. Nearly zero energy building renovation: From energy efficiency to environmental efficiency, a pilot case study. Energy Build. 2018, 166, 271–283. [Google Scholar] [CrossRef]
- Almeida, M.; Ferreira, M. Cost effective energy and carbon emissions optimization in building renovation (Annex 56). Energy Build. 2017, 152, 718–738. [Google Scholar] [CrossRef]
- Almeida, M.; Ferreira, M.; Barbosa, R. Relevance of Embodied Energy and Carbon Emissions on Assessing Cost Effectiveness in Building Renovation—Contribution from the Analysis of Case Studies in Six European Countries. Buildings 2018, 8, 103. [Google Scholar] [CrossRef]
- Sierra-Pérez, J.; Rodríguez-Soria, B.; Boschmonart-Rives, J.; Gabarrell, X. Integrated life cycle assessment and thermodynamic simulation of a public building”s envelope renovation: Conventional vs. Passivhaus proposal. Appl. Energy 2018, 212, 1510–1521. [Google Scholar] [CrossRef]
- Langevin, J.; Reyna, J.L.; Ebrahimigharehbaghi, S.; Sandberg, N.; Fennell, P.; Nägeli, C.; Laverge, J.; Delghust, M.; Mata, É.; Van Hove, M.; et al. Developing a common approach for classifying building stock energy models. Renew. Sustain. Energy Rev. 2020, 133, 110276. [Google Scholar] [CrossRef]
- Wurm, M.; Droin, A.; Stark, T.; Geiß, C.; Sulzer, W.; Taubenböck, H. Deep Learning-Based Generation of Building Stock Data from Remote Sensing for Urban Heat Demand Modeling. ISPRS Int. J. Geoinf. 2021, 10, 23. [Google Scholar] [CrossRef]
- Vodola, V.; Antonini, E.; Gaspari, J.; Marchi, L. A Methodology for Fast Simulation of Energy Retrofitting Scenarios of Social Building Stock. Sustain. Energy Build. 2022, 2021, 147–157. [Google Scholar]
- Sharif, S.A.; Hammad, A. Simulation-Based Multi-Objective Optimization of institutional building renovation considering energy consumption, Life-Cycle Cost and Life-Cycle Assessment. J. Build. Eng. 2019, 21, 429–445. [Google Scholar] [CrossRef]
- Lasvaux, S.; Favre, D.; Périsset, B.; Bony, J.; Hildbrand, C.; Citherlet, S. Life Cycle Assessment of Energy Related Building Renovation: Methodology and Case Study. Energy Procedia 2015, 78, 3496–3501. [Google Scholar] [CrossRef]
- Gulotta, T.M.; Cellura, M.; Guarino, F.; Longo, S. A bottom-up harmonized energy-environmental models for europe (BOHEEME): A case study on the thermal insulation of the EU-28 building stock. Energy Build. 2021, 231, 110584. [Google Scholar] [CrossRef]
- Allacker, K.; Castellani, V.; Baldinelli, G.; Bianchi, F.; Baldassarri, C.; Sala, S. Energy simulation and LCA for macro-scale analysis of eco-innovations in the housing stock. Int. J. Life Cycle Assess. 2019, 24, 989–1008. [Google Scholar] [CrossRef]
- Mastrucci, A.; Marvuglia, A.; Benetto, E.; Leopold, U. A spatio-temporal life cycle assessment framework for building renovation scenarios at the urban scale. Renew. Sustain. Energy Rev. 2020, 126, 109834. [Google Scholar] [CrossRef]
- STR 1.01.01:1996 Statybos Techninis Reglamentas 1996. Available online: https://e-seimas.lrs.lt/portal/legalAct/lt/TAD/TAIS.31484/javuTpcdXm (accessed on 20 March 2020).
- STR 2.01.02:2016 Pastatų Energinio Naudingumo Projektavimas ir Sertifikavimas 2019. Available online: https://e-seimas.lrs.lt/portal/legalAct/lt/TAD/15767120a80711e68987e8320e9a5185/sEHkqghNMX (accessed on 20 March 2020).


Disclaimer/Publisher’s Note: The statements, opinions and data contained in all publications are solely those of the individual author(s) and contributor(s) and not of MDPI and/or the editor(s). MDPI and/or the editor(s) disclaim responsibility for any injury to people or property resulting from any ideas, methods, instructions or products referred to in the content. |
© 2023 by the authors. Licensee MDPI, Basel, Switzerland. This article is an open access article distributed under the terms and conditions of the Creative Commons Attribution (CC BY) license (https://creativecommons.org/licenses/by/4.0/).