Article

Experimental and Numerical Studies on the Seismic Performance of New Assembled Concrete Frame Beam–Column Joints

1
School of Civil Engineering, Qingdao University of Technology, Qingdao 266000, China
2
School of Civil Engineering, Anhui Jianzhu University, Hefei 230041, China
3
School of Civil Engineering, Shandong Jianzhu University, Jinan 250101, China
*
Authors to whom correspondence should be addressed.
Buildings 2023, 13(2), 329; https://doi.org/10.3390/buildings13020329
Submission received: 26 November 2022 / Revised: 31 December 2022 / Accepted: 3 January 2023 / Published: 22 January 2023
(This article belongs to the Section Building Materials, and Repair & Renovation)

Abstract

:
A new type of assembled concrete beam–column joint based on a bolted connection was proposed, aiming to complete the post-earthquake node repair work by replacing precast beams and bolts. To study the seismic performance of the new beam–column joints, two full-scale components of the new joints were fabricated and subjected to low cyclic loading. The whole process from crack generation to component failure was investigated in detail, and seismic performance indicators such as the hysteresis curve, skeleton curve and stiffness degradation curve were compared and analyzed. Based on the experimental results, ABAQUS finite element software was applied to numerically simulate cast-in-place joints and test joints. Based on the failure mechanism of the new assembled beam–column semi-rigid joints, a stress analysis of semi-rigid joints was carried out. The research results show that the two new joints have good seismic performance and energy dissipation performance. Bolts and precast beams are the main stress components, and the repair of new joints can be completed by replacing bolts, which meets the seismic design concepts of “strong columns and weak beams” and “strong joints and weak components”. The larger the diameter of the bolts, the higher the load capacity and the lower the stiffness degradation rate. The finite element simulation results are high-accuracy and can well reflect the seismic performance of the components. It is found that cast-in-place joints are better in energy dissipation capacity than test joints, but the ultimate bearing capacity of test joints is better than that of cast-in-place joints. Based on the experimental stress characteristics of the nodal core zone, a mechanical analysis model of the nodal core zone of the new assembled concrete beam–column joints is proposed, and shear force calculation equations for the core zone of the new assembled concrete beam–column rigid joints and semi-rigid joints are derived.

1. Introduction

The connection form and seismic performance of assembled beam–column joints are key issues in construction and design at present. As a type of transmission member prone to brittle shear damage, the beam–column joint is a relatively weak link in the structure under seismic loading [1,2]. However, it is also found that the connection problems of prefabricated structures are prominent at this stage, such as joint treatment, grouting, the connection of beam–column nodes, etc., among which the core is the connection of beam–column joints, which directly affects the load-bearing capacity and stability of the seismic performance of the building structure [3,4,5]. There are two typical beam–column connection forms: wet connection and dry connection. As the connection forms of wet connection and cast-in-place joints are similar, they are widely used. However, the dry connection also has many advantages, which are worthy of in-depth study, and the connection forms of beam–column joints are particularly important. The connection form must meet certain design requirements in terms of strength, integrity and assembly efficiency [6,7,8]. Ding Kewei [9,10] et al. conducted full-scale seismic tests on the proposed new beam–column joints and compared the results with existing cast-in-place concrete joints, and found that the new type of joints with bolted connections was equivalent to cast-in-place in seismic performance and energy dissipation. On this basis, it was proposed that new materials (such as cell metal materials) be filled in the beam ends and columns [11,12,13] in the core zone of the joint, and their theoretical research and numerical simulation be carried out. The results showed that filling with a certain amount of new materials can improve the ductility and toughness of the whole structure and enhance its seismic energy dissipation performance. Meanwhile, the wet connection is an important kind of connection of assembled structures. Guan Toshiba et al. [14,15,16,17,18] put forward that UHPC new material should be applied to the post-cast parts, and a full-scale seismic test of the joints was carried out and compared with the cast-in-place joints. The results show that UHPC material can significantly improve the shear-bearing capacity and ductility coefficient of prefabricated joints while reducing the weight of prefabricated structures. Much work has been conducted by some researchers to improve the load-carrying capacity and energy dissipation of new joints, and joint elements with high stiffness have been investigated for improving the stability of precast concrete structures [19,20,21]. However, not much research has been conducted on the assembly efficiency and post-disaster repair efficiency of joints. Oliveira et al. [22] designed a new type of concrete beam–column joint which has about 80% of the flexural strength of a cast-in-place joint. However, because there is no corbel, temporary supports are needed to connect the beams and columns when assembling them. It can be seen that there are many experimental studies and numerical analyses on the seismic performance of dry-type connection beam–column joints of prefabricated concrete structures, which provide new ideas and a scientific basis for the research ideas and technical routes of the new type of dry-type frame concrete beam–column joints based on bolt connection in this paper.
On the other hand, as the industrialization of construction is developing more and more in China, assembled building structures are the way to go in the construction industry to reduce energy consumption and environmental pollution, and the requirements for the building materials themselves are becoming higher and higher. The state recommends the use of high-grade concrete and high-strength steel reinforcement. High-performance concrete has the advantages of high strength, high toughness, low strain rate at high temperatures and adaptability to special environments [23,24,25,26,27,28,29]. Based on this, the new assembled beam–column node components are made of C80 high-strength concrete, which can effectively reduce the cross-sectional size of the columns and save floor space compared with ordinary-strength concrete columns, while the integral strength and stiffness of the structure will also be improved, making it easier to meet the design code requirements of “strong columns and weak beams” [30].
Therefore, this paper proposes a new type of concrete beam–column joint based on a bolt connection, which is a dry connection. The existence of an open corbel not only solves the problems of temporary support and joint installation but also provides good shear-bearing capacity. In this paper, the hysteresis performance, stiffness degradation and energy dissipation capacity of the test joints were analysed; meanwhile, the difference in seismic performance between the cast-in-place and test joints was compared and analysed based on ABAQUS finite element simulation software. Based on the above research, the mechanical analysis of semi-rigid joints was carried out and a method for calculating the shear force in the core zone of the nodes was derived. A strong foundation is laid for the theoretical research and application of a fully prefabricated assembled concrete frame structural system, which has very important socioeconomic significance and good application prospects.

2. Experimental Overview

2.1. Design Principles of Joints

The design of a new type of fabricated beam–column joint specimen meets the requirement of “ensuring that the column at the joint is not destroyed before the beam, and the joint connection has a certain stiffness, a certain deformation and a certain energy dissipation performance”. In other words, in the test process, the beam at the frame joint should yield first or the bolt connection should have large deformation or yield first, and then the beam members should be gradually destroyed in the process of increasing bidirectional alternating deformation, and the precast columns should not be damaged until the end of the test.
(1) Precast beam of the specimen. In the design of precast beams, the stress state of precast beams should be considered, and the difficulty and accuracy of fabrication, hoisting and field installation of precast beams should also be considered. Therefore, in this test, the beam was designed as a T-shaped precast beam with an enlarged end, and holes were reserved on the flange of the T-shaped enlarged end of the beam, which was convenient for installing the through bolts. This design was beneficial for connecting beam–column joints. To compare and analyze the node structure, the precast beam was designed as two joints: S1 with a bolt diameter of 24 mm, and S2 with a bolt diameter of 28 mm.
(2) Precast column of the specimen. Considering that there was a gap between the bolt and the hole, the bolt connection could not bear the shear force, so a corbel was added at the precast column node to bear the shear force. In addition, the corbel not only could bear a large load but also provided convenience for the installation of precast beams. In addition, in an earthquake, if the beam supported by the corbel was damaged, it was easy to replace, thus realizing the purpose of replacing the components with the fabricated structure. In this paper, C80 concrete was used for precast columns, and holes were reserved at the positions corresponding to the holes reserved at the enlarged ends of the beams, which were connected with the beams using bolts to form dry joints.
(3) Bolt design. The bolt connection is the core part of the study and the joint test. The size of the tensile strength of the bolts determines the integrity and stiffness of the joint, so the two specimens in this paper were chosen from Q345 ordinary bolts with different diameters for test research and comparative analysis.
(4) Node installation. According to the actual project, if the beam and column at the node cannot fit together completely, a gap of 20 mm~25 mm should be reserved for easy installation, and later a high-strength grout should be used for grout sealing. To ensure that the bolts are not bonded with the beams and columns in the reserved holes of the beams and columns before the bolts are installed, PVC tubes should be installed on the inner walls of the bolt holes at the corresponding positions of the beams and columns in advance to ensure that the bolts are not in contact with the later grouting materials, thus ensuring that the beam–column joints have a dry connection. See Figure 1 for details.

2.2. Sizing and Reinforcement of Test Specimens

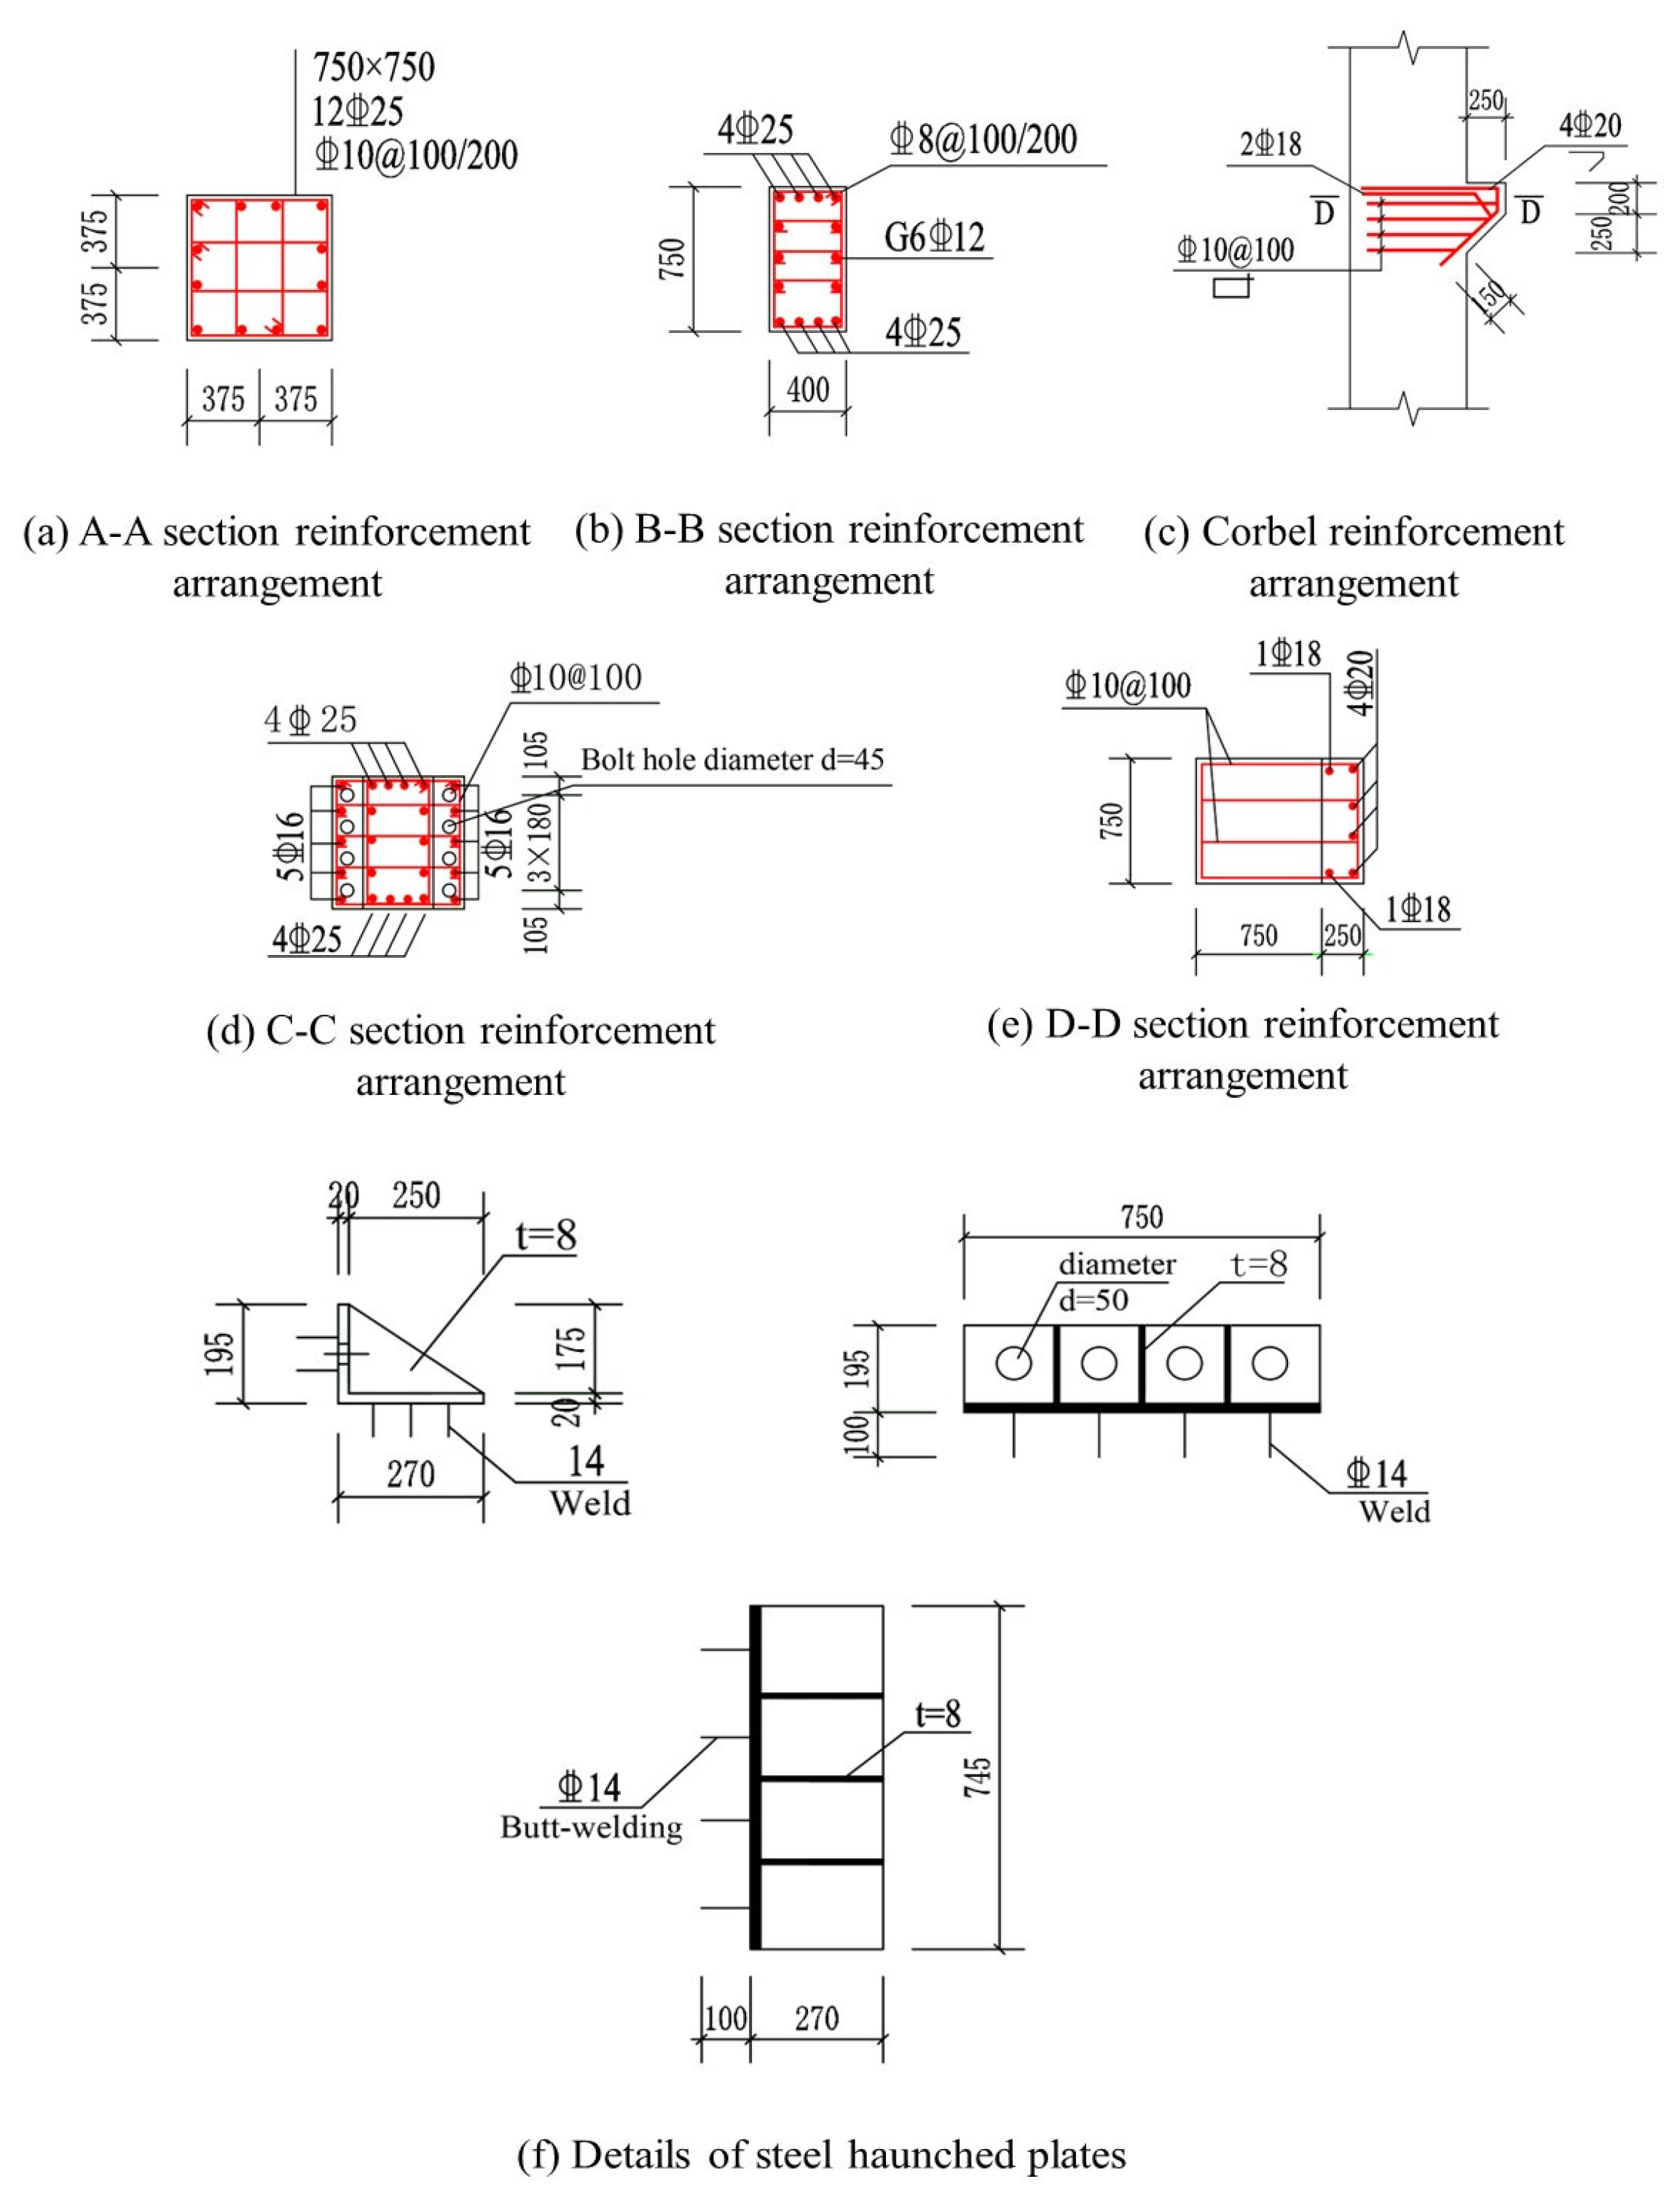
The dimensions of the assembled beam–column joints were designed following the requirements in the code [31]. The integral strength, stiffness and stability of the core zone of the joints were ensured to meet the requirements. The precast columns of both specimens were made of concrete of strength class C80, with a height of 4200 mm and a cross-section of 750 mm × 750 mm. The precast beams were both made of concrete of strength class C40, with a beam length of 3800 mm, a beam cross-section of 400 mm × 750 mm and a beam enlarged end cross-section of 750 mm × 750 mm. The precast beams and columns were connected through the holes reserved at the enlarged end of the beams. Eight bolts of 24 mm (S1) or 28 mm (S2) diameter are used for the connection. The details of the precast specimens are shown in Table 1 and Table 2, with the haunched plate and compression plates made of Q345 steel. The longitudinal reinforcement for the precast columns and beams was HRB400 Grade III steel (symbol ϕ ) with diameters of 25 mm and 22 mm, respectively, with the same reinforcement in both groups. The specific dimensions and reinforcement of the specimens are shown in Figure 2 and Figure 3.
The test specimens were fabricated at the Anhui Key Laboratory of Building Structure and Underground Engineering, Anhui Jianzhu University. A joint seam of 20 mm–25 mm was reserved in the spliced part of the core zone of the connection joint, and the precast beams and precast columns were connected with bolts. See Figure 4 for the specific connection method.
The process for making the new precast concrete frame beam–column joint specimens is shown in Figure 5.

2.3. Material Properties

2.3.1. Mechanical Properties of Concrete

The precast concrete beams and columns were watered and cured under natural conditions for 28 days after casting. Nine test blocks were reserved for each of the two types of concrete, C40 and C80, at the time of casting. The test blocks were of standard size, 150 mm in length, width and height. Under the same curing conditions, three groups of three specimens each were divided during the curing period on day 3, day 7 and day 28. The determination of the standard value of compressive strength fcu,k of concrete cube specimens was carried out following the provisions of the “Regulations for the proportioning design of concrete” [32]. The standard value of axial compressive strength of concrete fck was calculated according to 0.88ac1ac2fcu,k [30]. The correction factor for the concrete strength of the specimen was taken as 0.88; the ratio of prismatic strength to cubic strength ac1 was 0.76 for C50 and below-normal concrete and 0.82 for high-strength concrete C80, with a linear difference in between; the brittle discount factor ac2 was considered for concrete above C40: 1.00 for C40 and 0.87 for high-strength concrete C80, with a linear difference in between. The results are shown in Table 3.

2.3.2. Mechanical Properties of Steel

The longitudinal reinforcement of the precast columns and beams in the test were all Grade 3 steel. Q345 steel plates were used for the compression and haunched steel plates. The mechanical properties of the steel are shown in Table 4.
Before the test, the appearance of the bolts was first checked. The bolt factory certificate and test report were checked to meet the experimental requirements, and three of the bolts were taken for tensile testing. The mechanical properties of the bolts are shown in Table 5.

2.4. Loading Devices and Loading Regimes

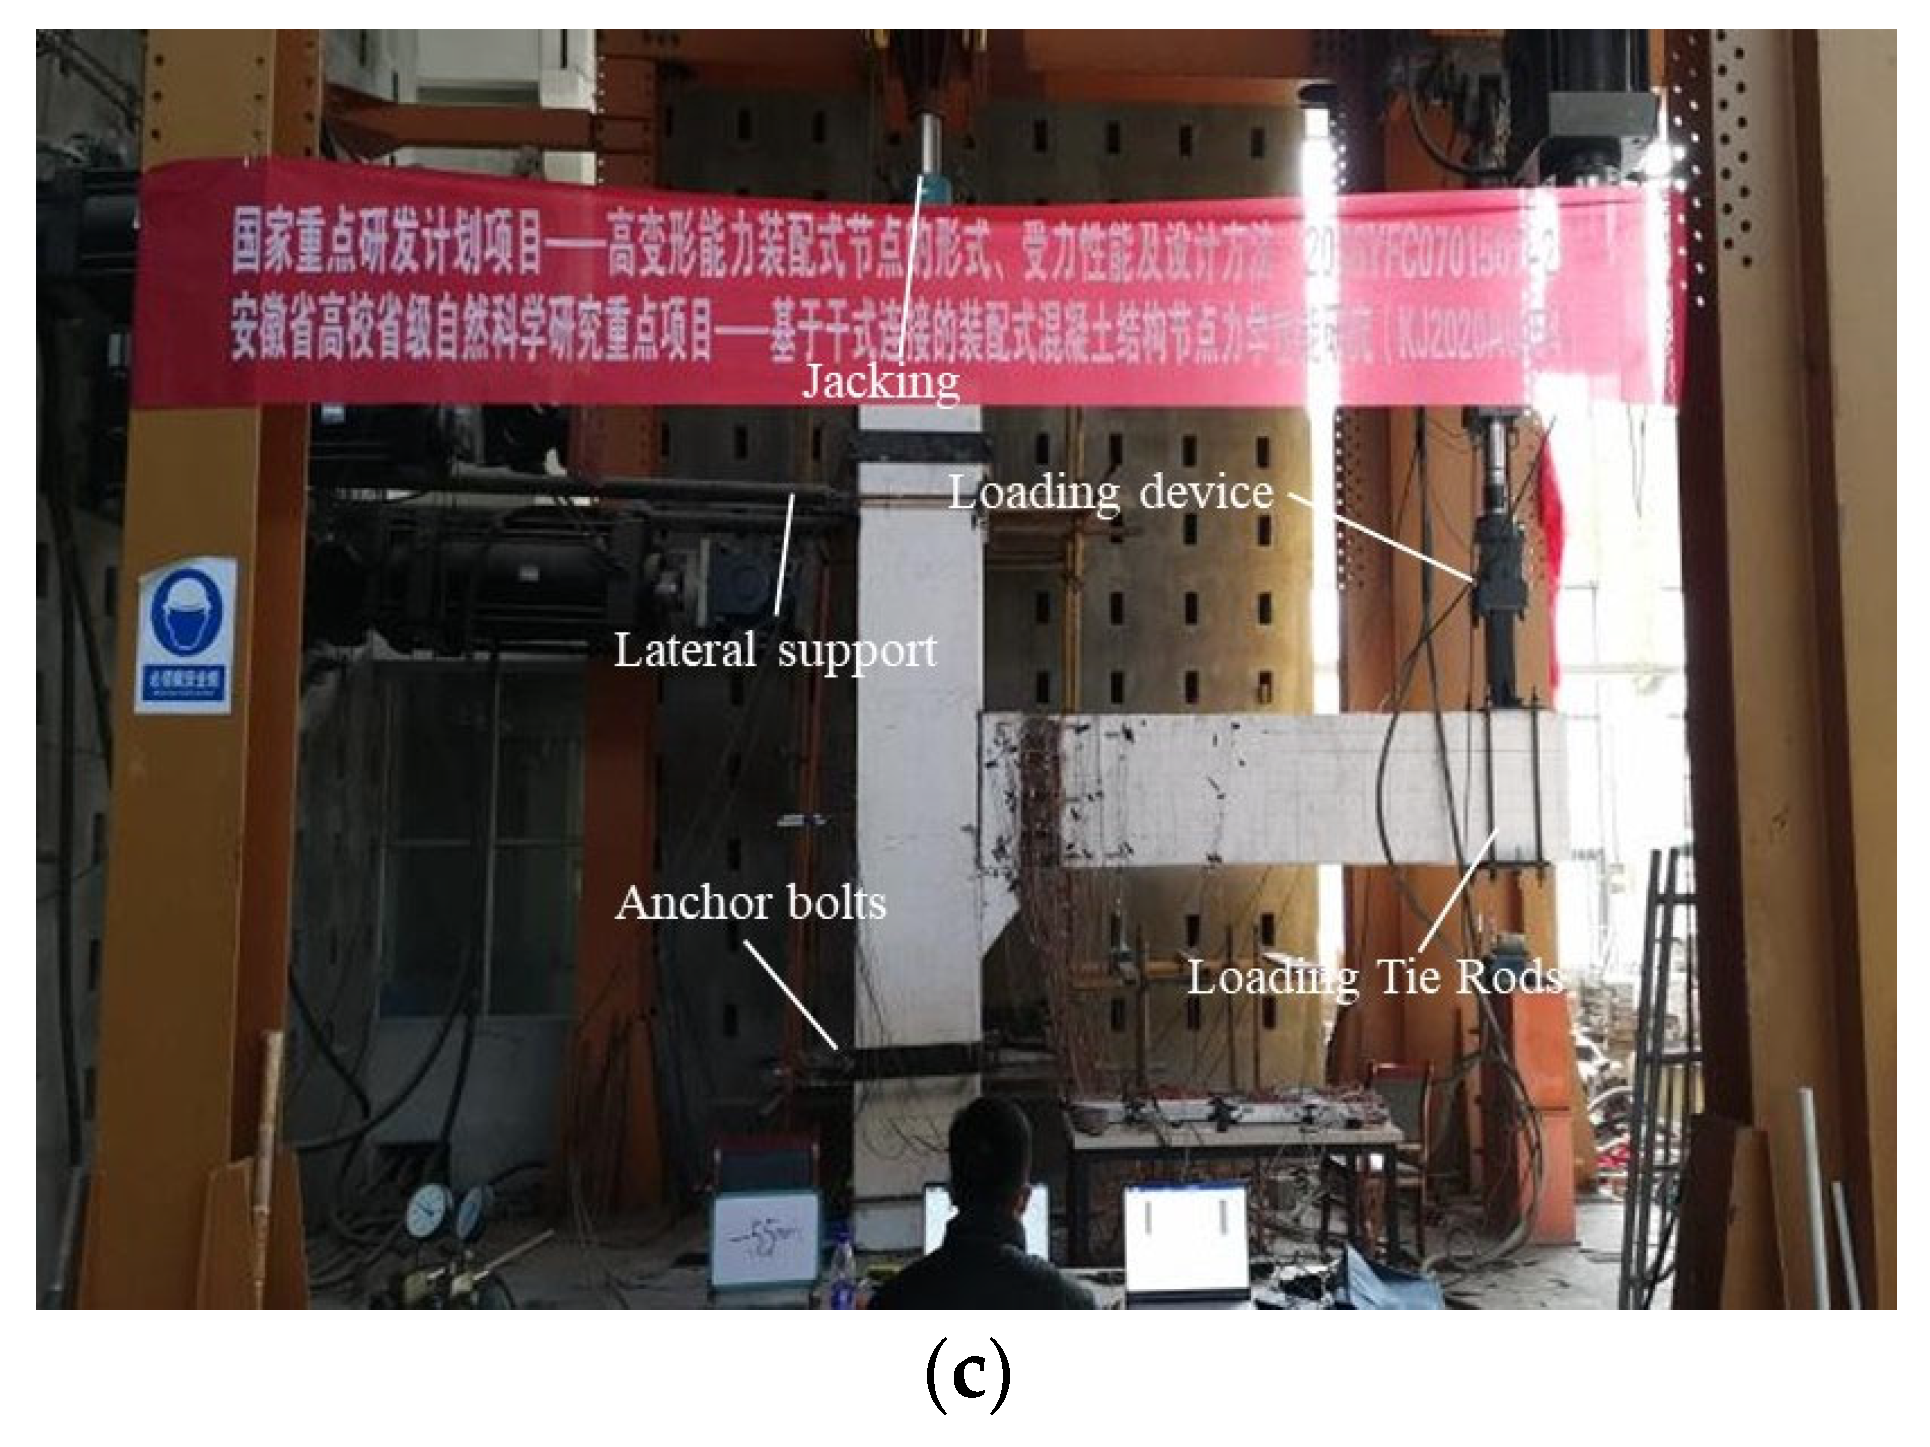
The specimens were assembled, and low-cycle reciprocating loading tests were carried out at the Anhui Provincial Key Laboratory of “Building Structures and Underground Engineering”. The actuator was a ±500 kN electro-hydraulic servo loading system with a displacement stroke of ±150 mm. The vertical load on the column top was applied to utilize a hydraulic jack and the axial pressure ratio of 0.05 was maintained throughout the loading process. The detailed loading equipment is shown in Figure 6.
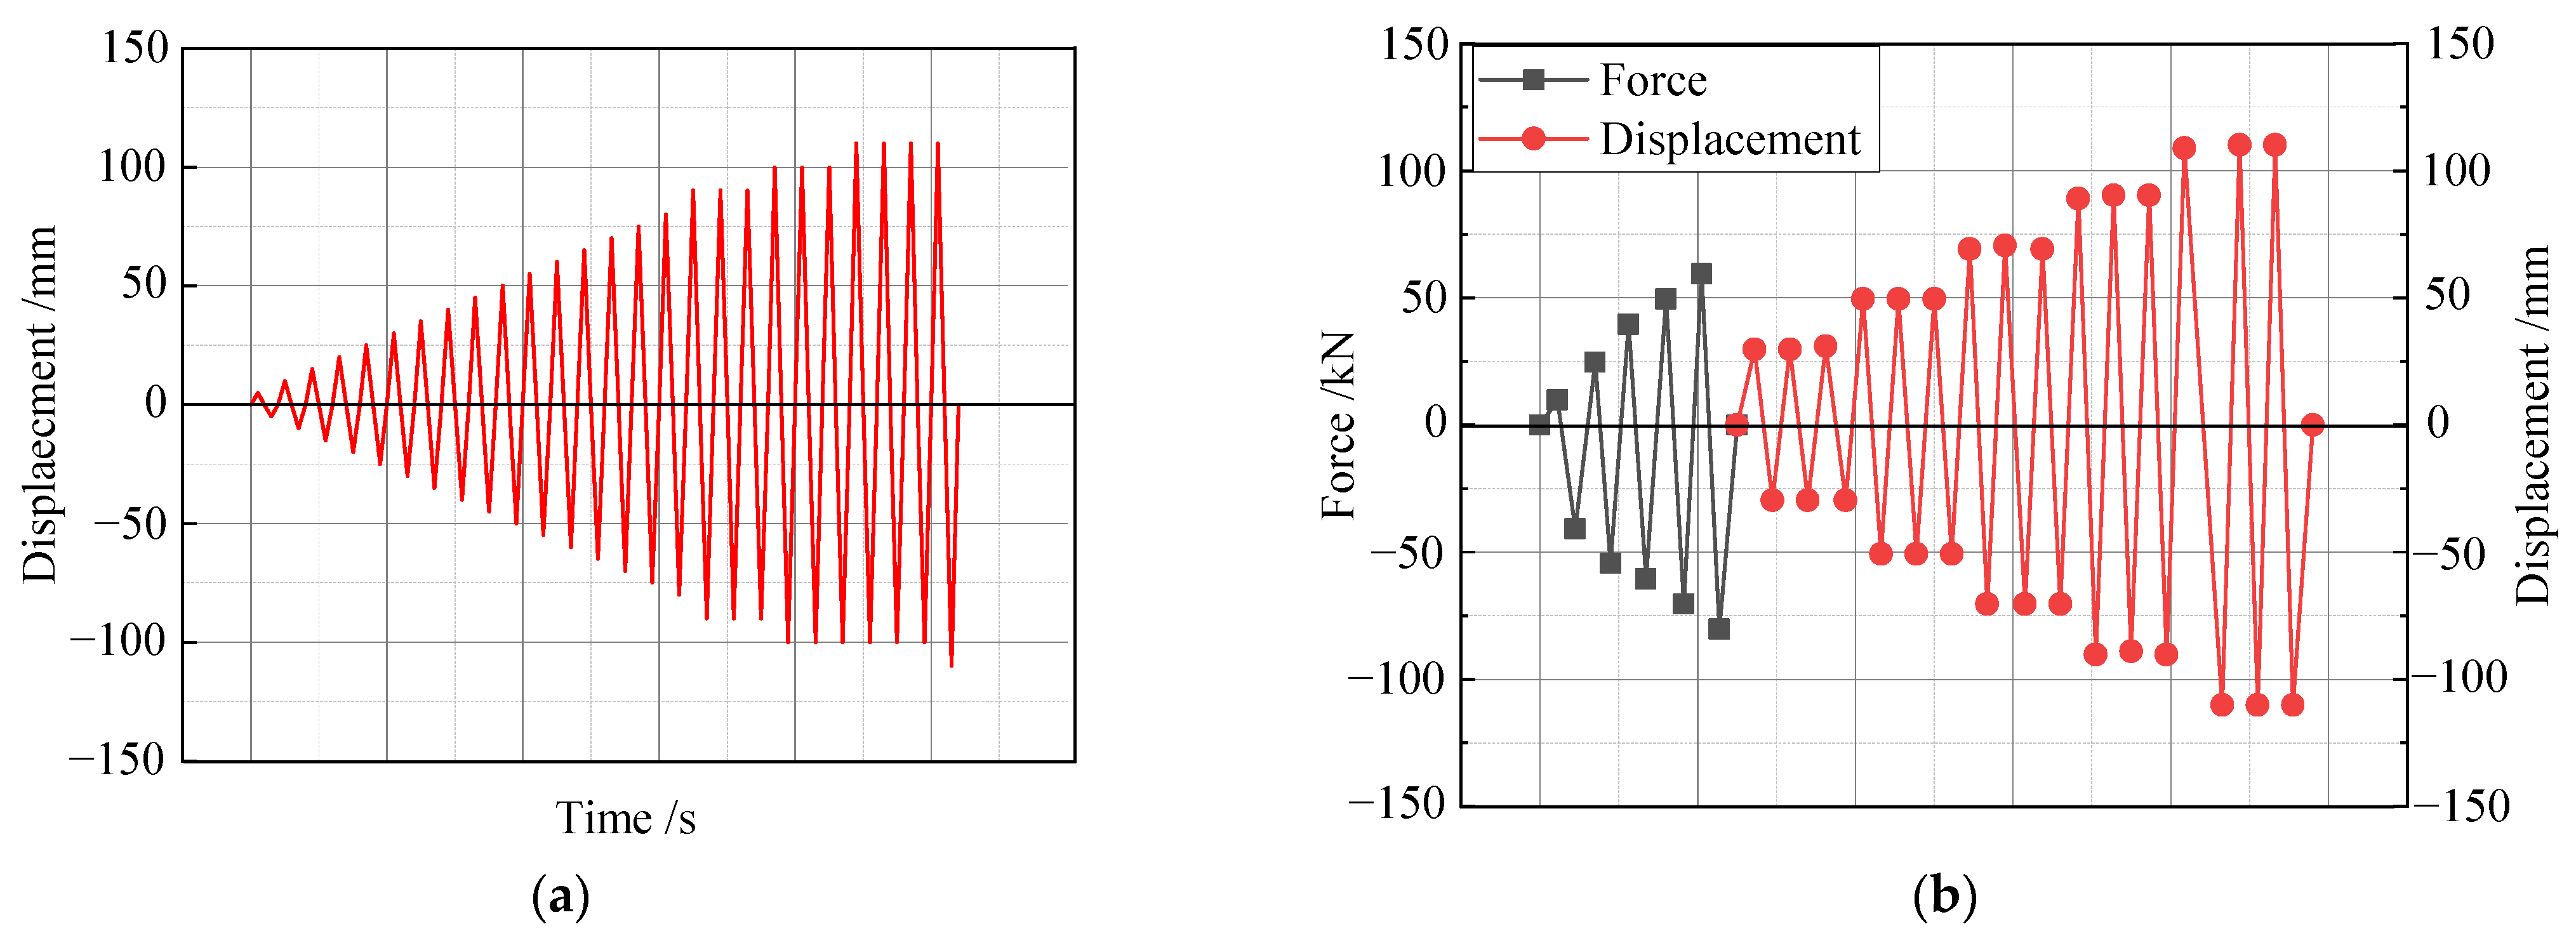
According to the regulations [31], considering that S2 is a connection joint with a large bolt diameter, the force is not well controlled, so the S1 test required a mixed load-displacement loading method, and S2 used the displacement loading method to load the specimen. In the first step, a constant axial force was applied at the top of the column, which was to be kept constant during the test, and the axial force applied in the test was applied according to an axial pressure ratio of 0.05. In the second step, a symmetrical low cyclic loading or displacement was applied to the beam using electro-hydraulic servo actuators. The S1 specimens were loaded in the elastic phase using force controlled and each load was cycled once. At the beginning of loading, the load was applied in increments of 5 kN per stage and after cracks appeared in the components, the load was applied in increments of 10 kN per stage. After yielding, the specimen was displacement controlled, the deformation value was taken as the maximum displacement of the specimen at the time of yielding and the load was controlled by a multiple of this displacement as a grade difference, with each load cycle 3 times. Specimen S2 was loaded using the displacement loading method, with each level of loading being 5 mm, and when it entered the yielding stage, each level of loading was changed to 10 mm and cycled 3 times. Two specimens were loaded until the load capacity dropped below 85% of the ultimate load capacity or until it was unsuitable for further loading. During the loading process, we paid attention to the magnitude of the applied shaft pressure and compensated the pressure appropriately according to the oil-pressure gauge to ensure that the shaft pressure remained constant throughout the loading process. The test loading system is shown in Figure 7.
The first time the specimen reached yield was defined as the displacement ductility factor μ = 1. After entering the displacement control phase, the displacement at the yielded end of the beam was taken as a multiple of the displacement to be loaded step by step, i.e., μ = l, 2, 3, etc. The cycle was repeated 3 times under each level of displacement value until the load-bearing capacity of the specimen dropped below 85% of the ultimate load-bearing capacity or the deformation of the specimen was too large for further loading.

3. Experimental Phenomena and Their Analysis

When a low cycle loading was applied, the actuator loading was defined as positive when pushed downwards and negative when pulled upwards, and the actuator loading displacement was recorded.

3.1. Main Experimental Phenomena

3.1.1. Crack Development in Specimen S1

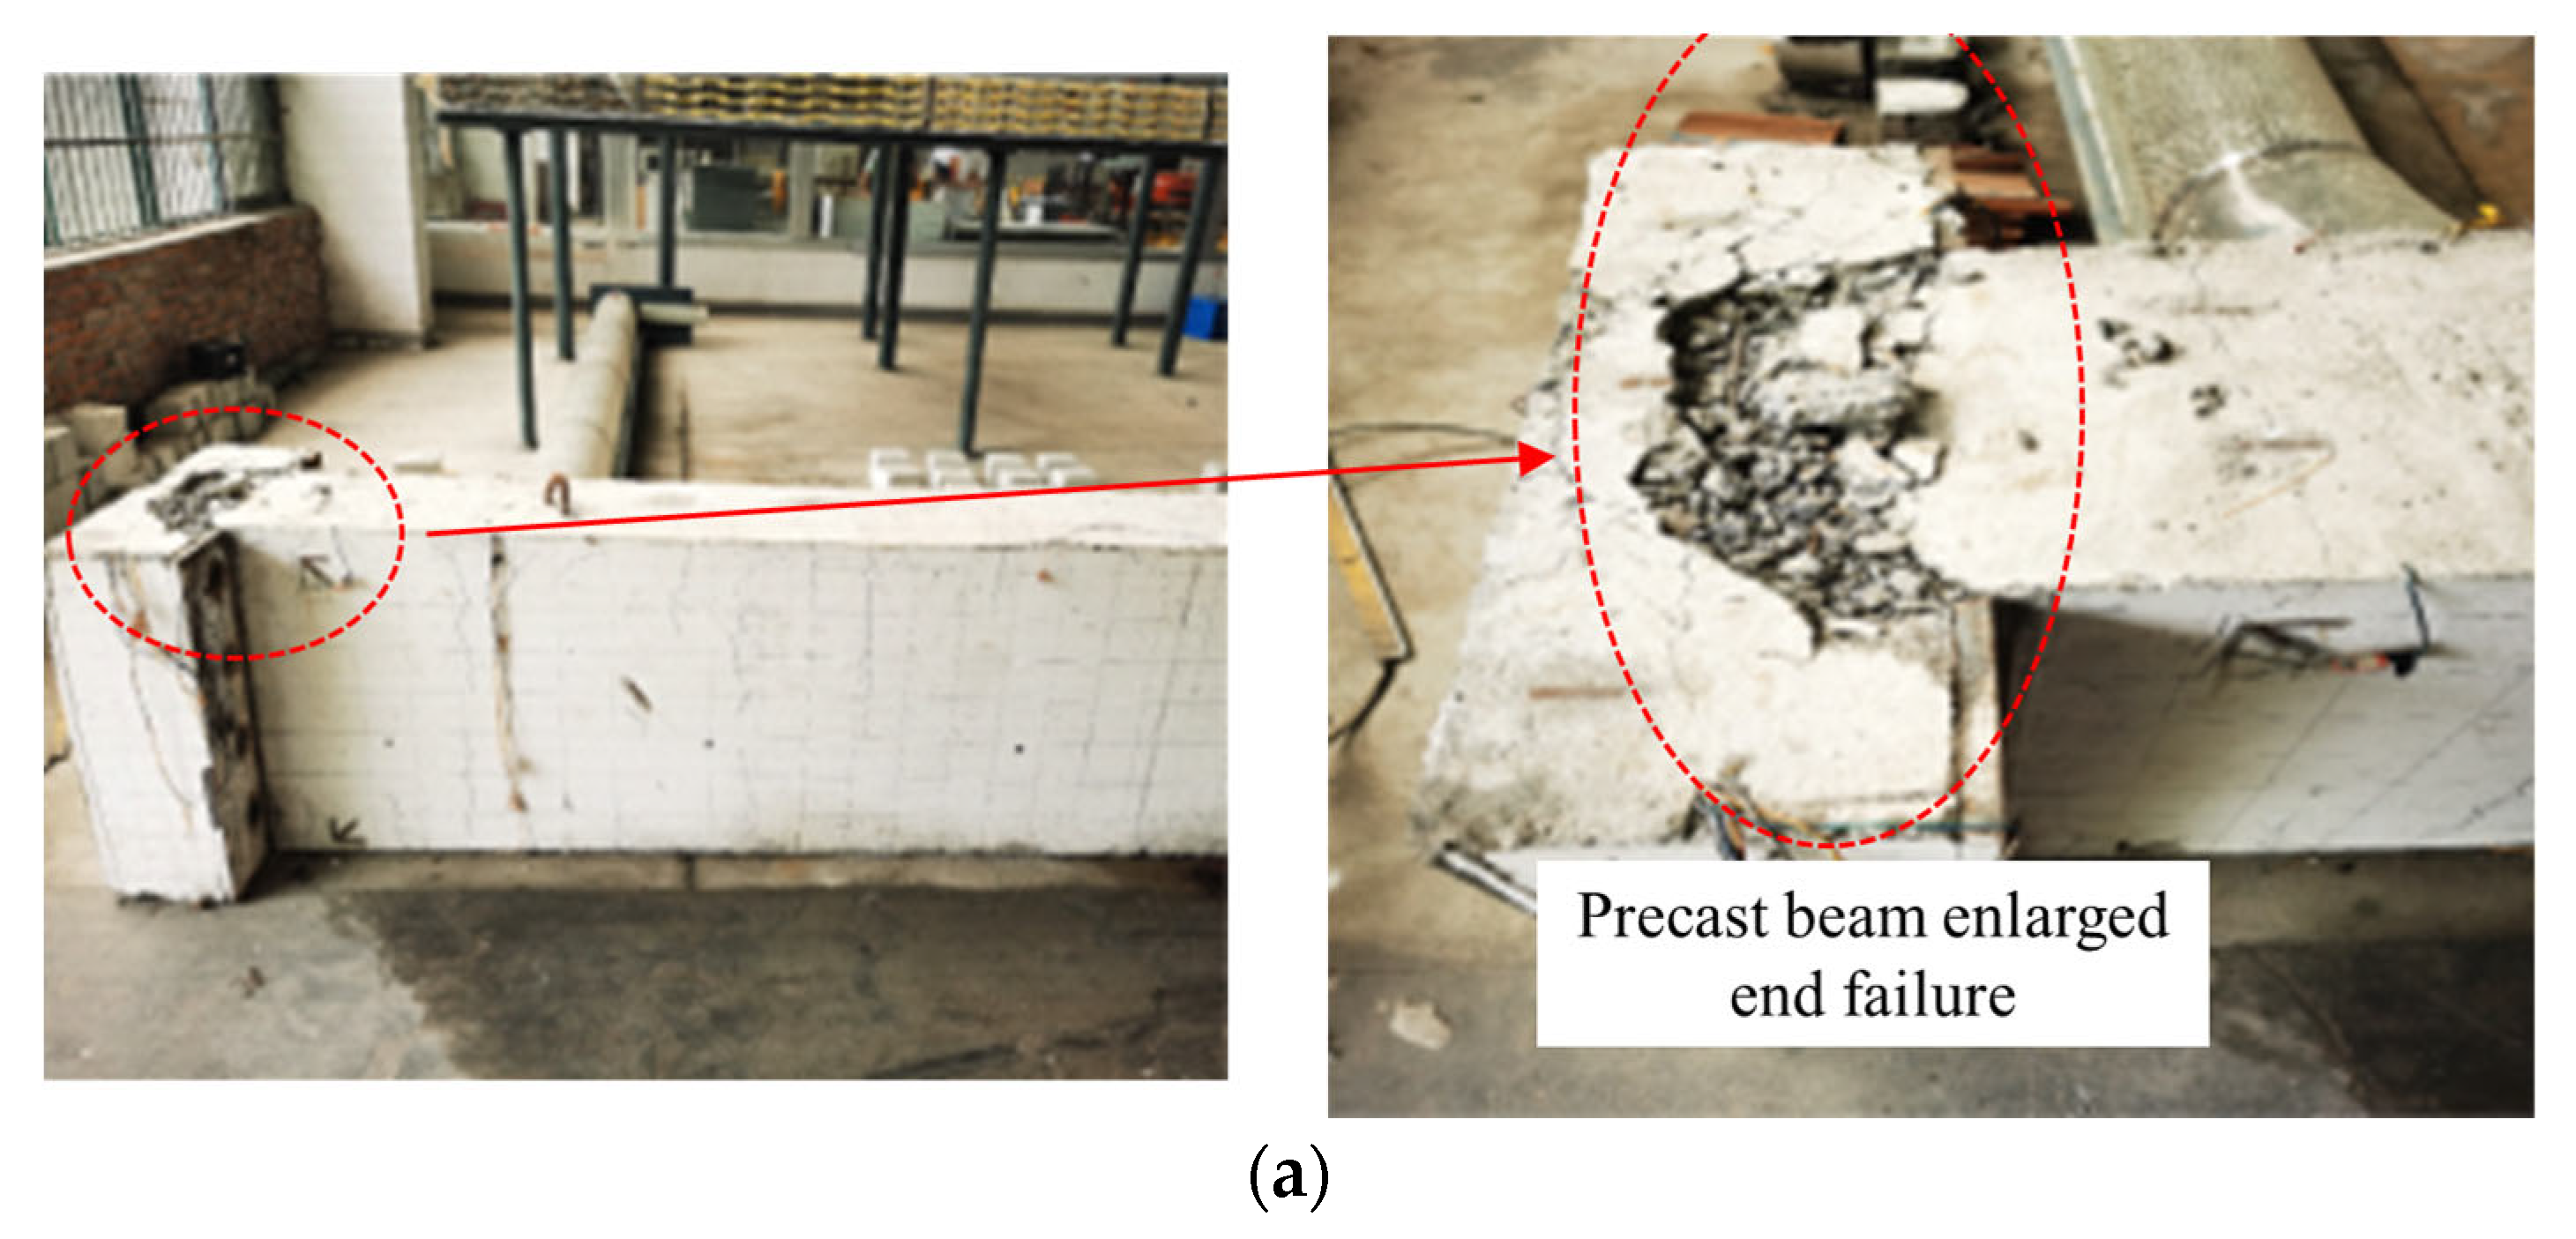
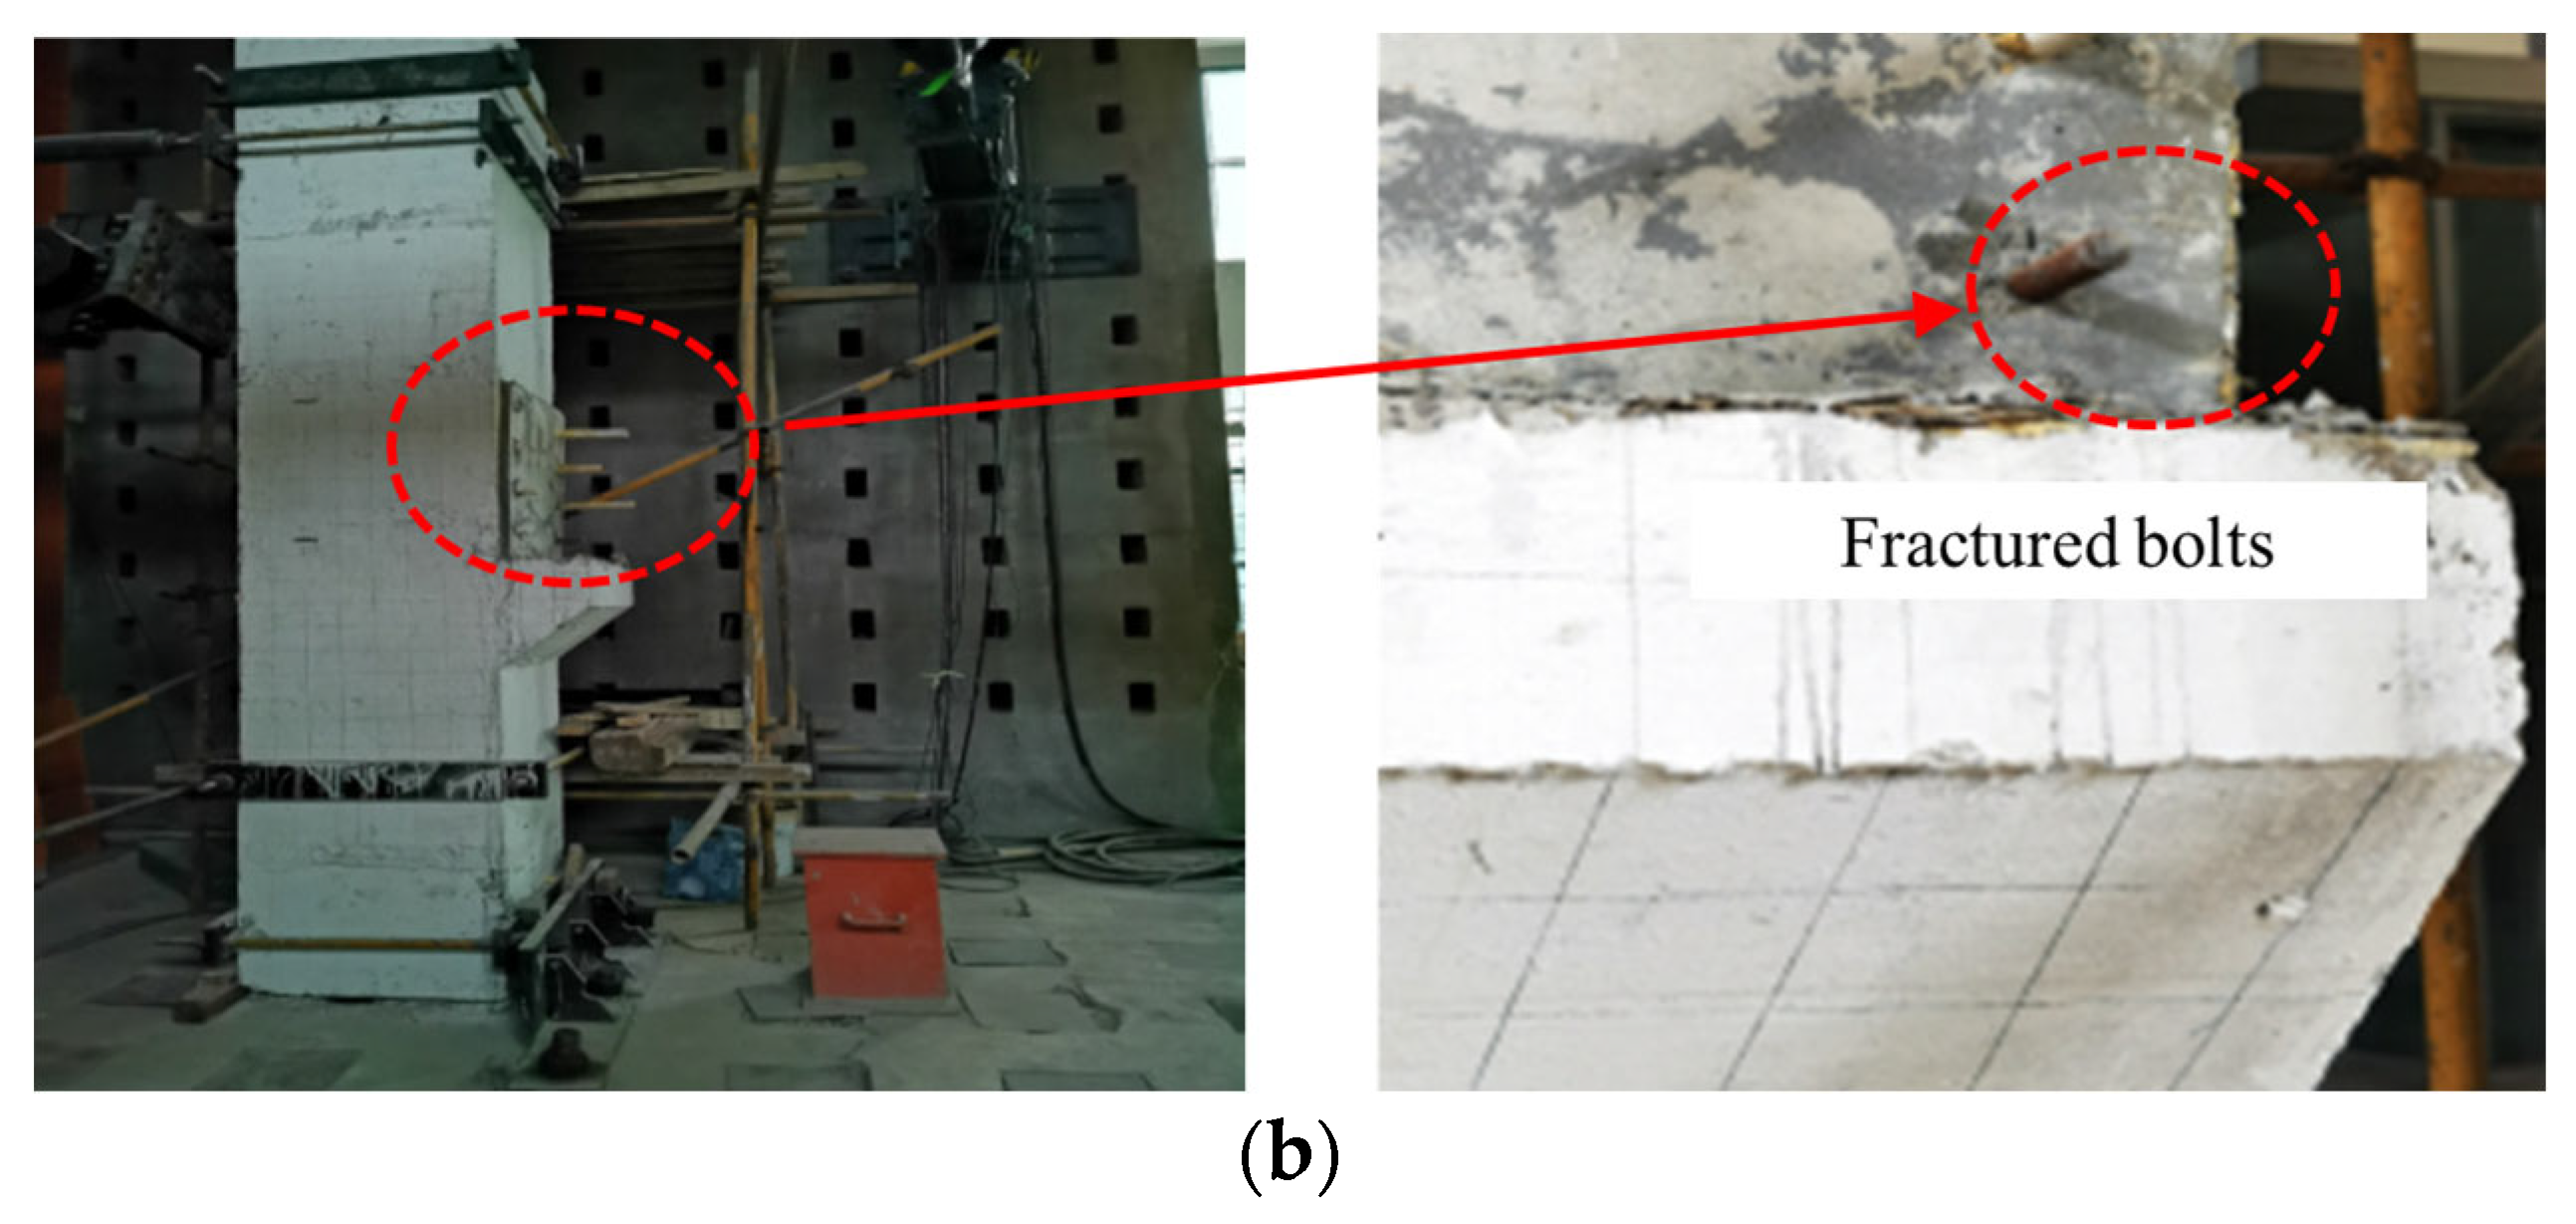
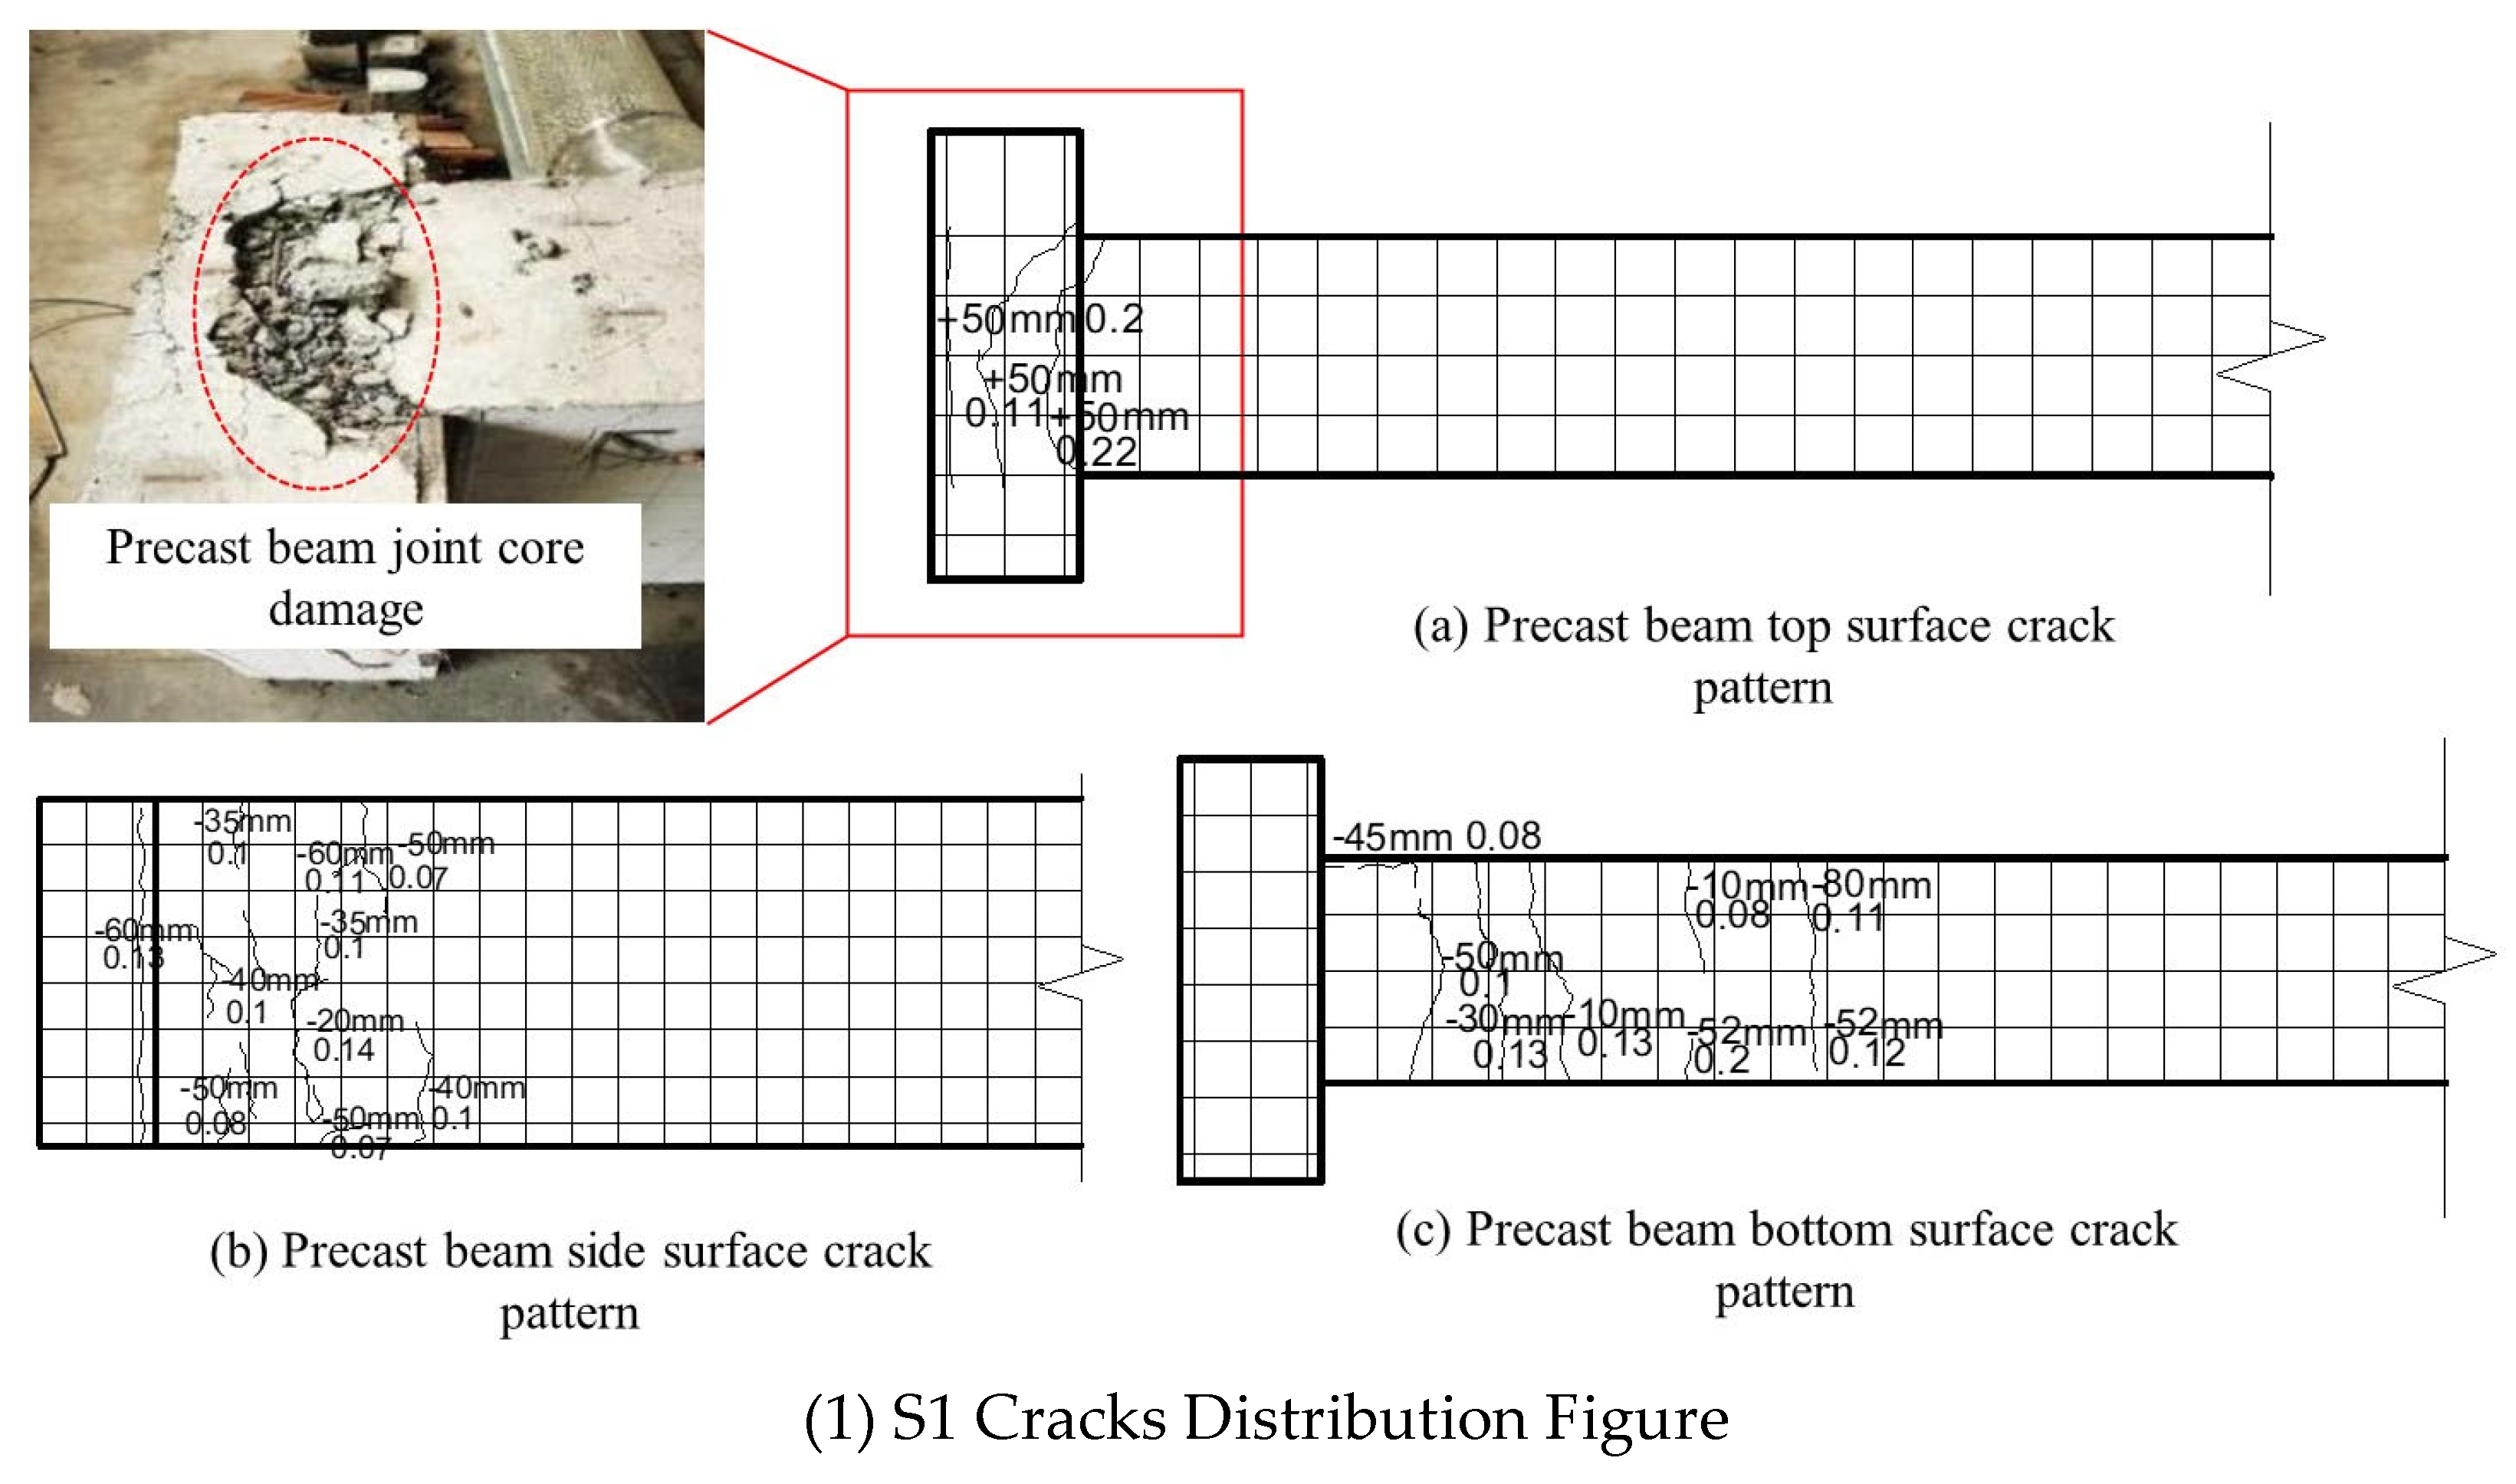
The joint of specimen S1 was bolted with Q345 diameter 24 mm bolts. At the beginning of loading the specimen did not show any obvious phenomena. When the loading reached +20 mm the first crack appeared on the side of the beam at 130 cm from the edge of the column, with a length of 5 cm and a width of 0.1 mm. When the loading reached +50 mm, the displacement meter on the precast beam showed a rapid increase, the strain of the precast beam stressing reinforcement measured with the data-acquisition instrument also increased sharply and the precast beam produced a relatively large displacement deformation. The width of the crack on the upper surface of the enlarged end of the precast beam suddenly increased, with a maximum crack width of 0.18 mm and a depth of 0.1 cm. The width of the crack where the bearing steel plate was connected to the precast column increased to 0.12 cm and the depth increased to 0.1 cm. The strain on the bolted connectors increased sharply. As the load was applied, the deformation of the precast beam remained essentially unchanged, the force gradually increased with time, the stressed reinforcement of the precast beam yielded and the loading mode changed to displacement loading. The maximum crack at the top of the beam was 8 mm when the displacement loading reached +90 mm, and when the displacement loading reached +110 mm, there were many cracks at the end of the beam, and the concrete at the upper part of the enlarged end of the beam had been damaged, while the precast column (including the corbel) was not damaged, conforming to the seismic requirement of “strong column and weak beam”. The final damage diagrams for the joints are shown in Figure 8.

3.1.2. Crack Development in Specimen S2

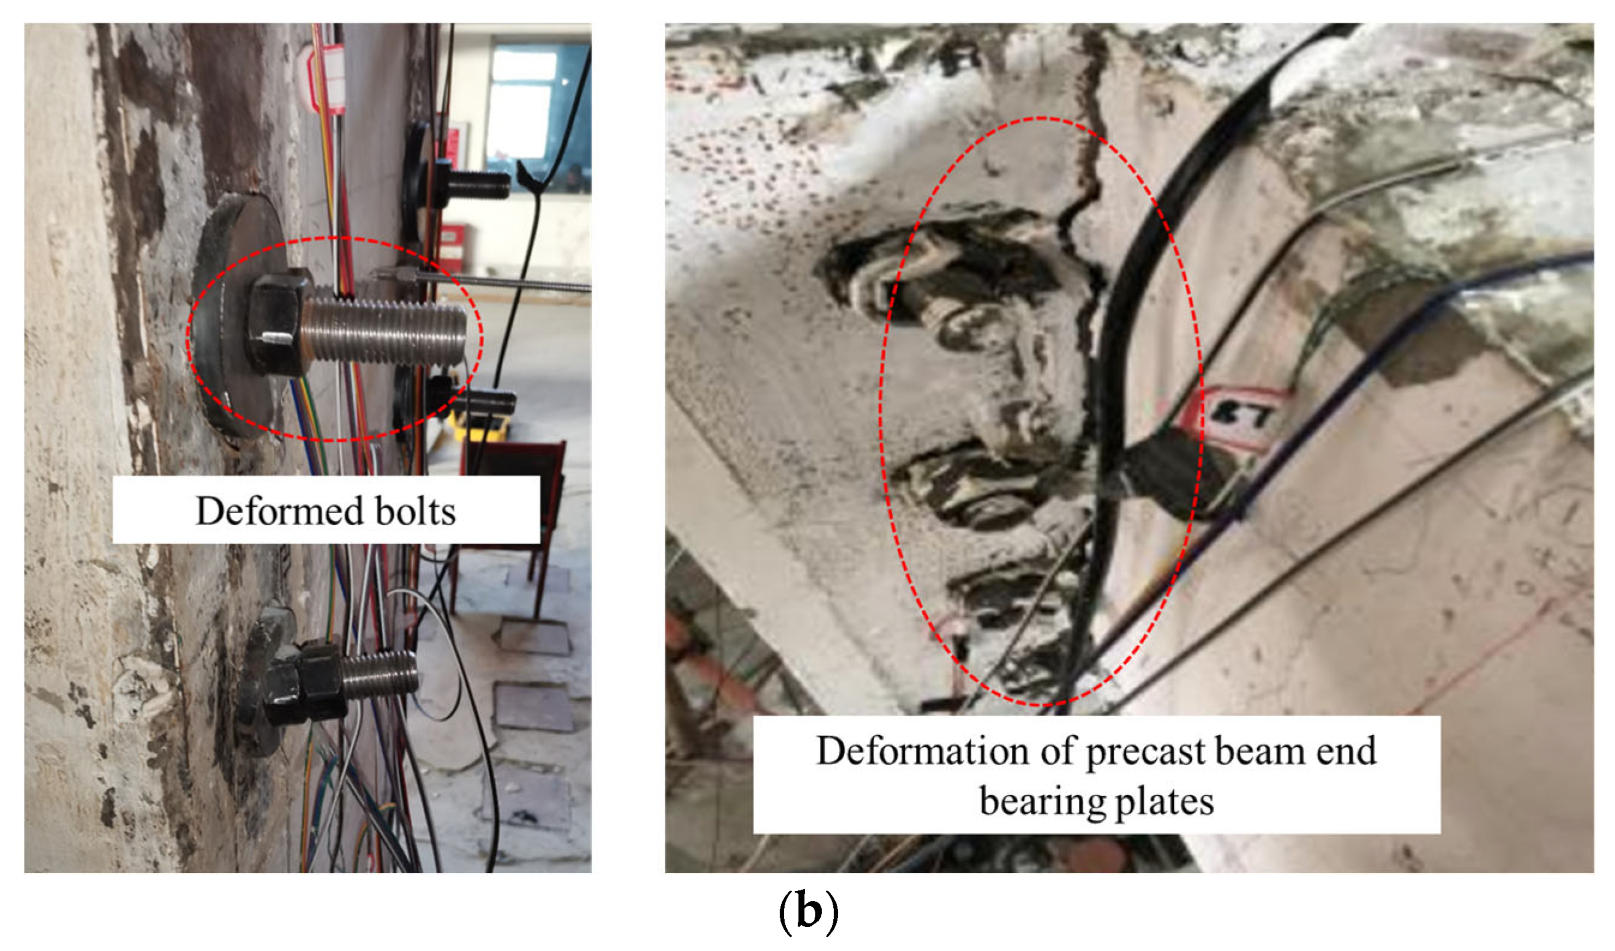
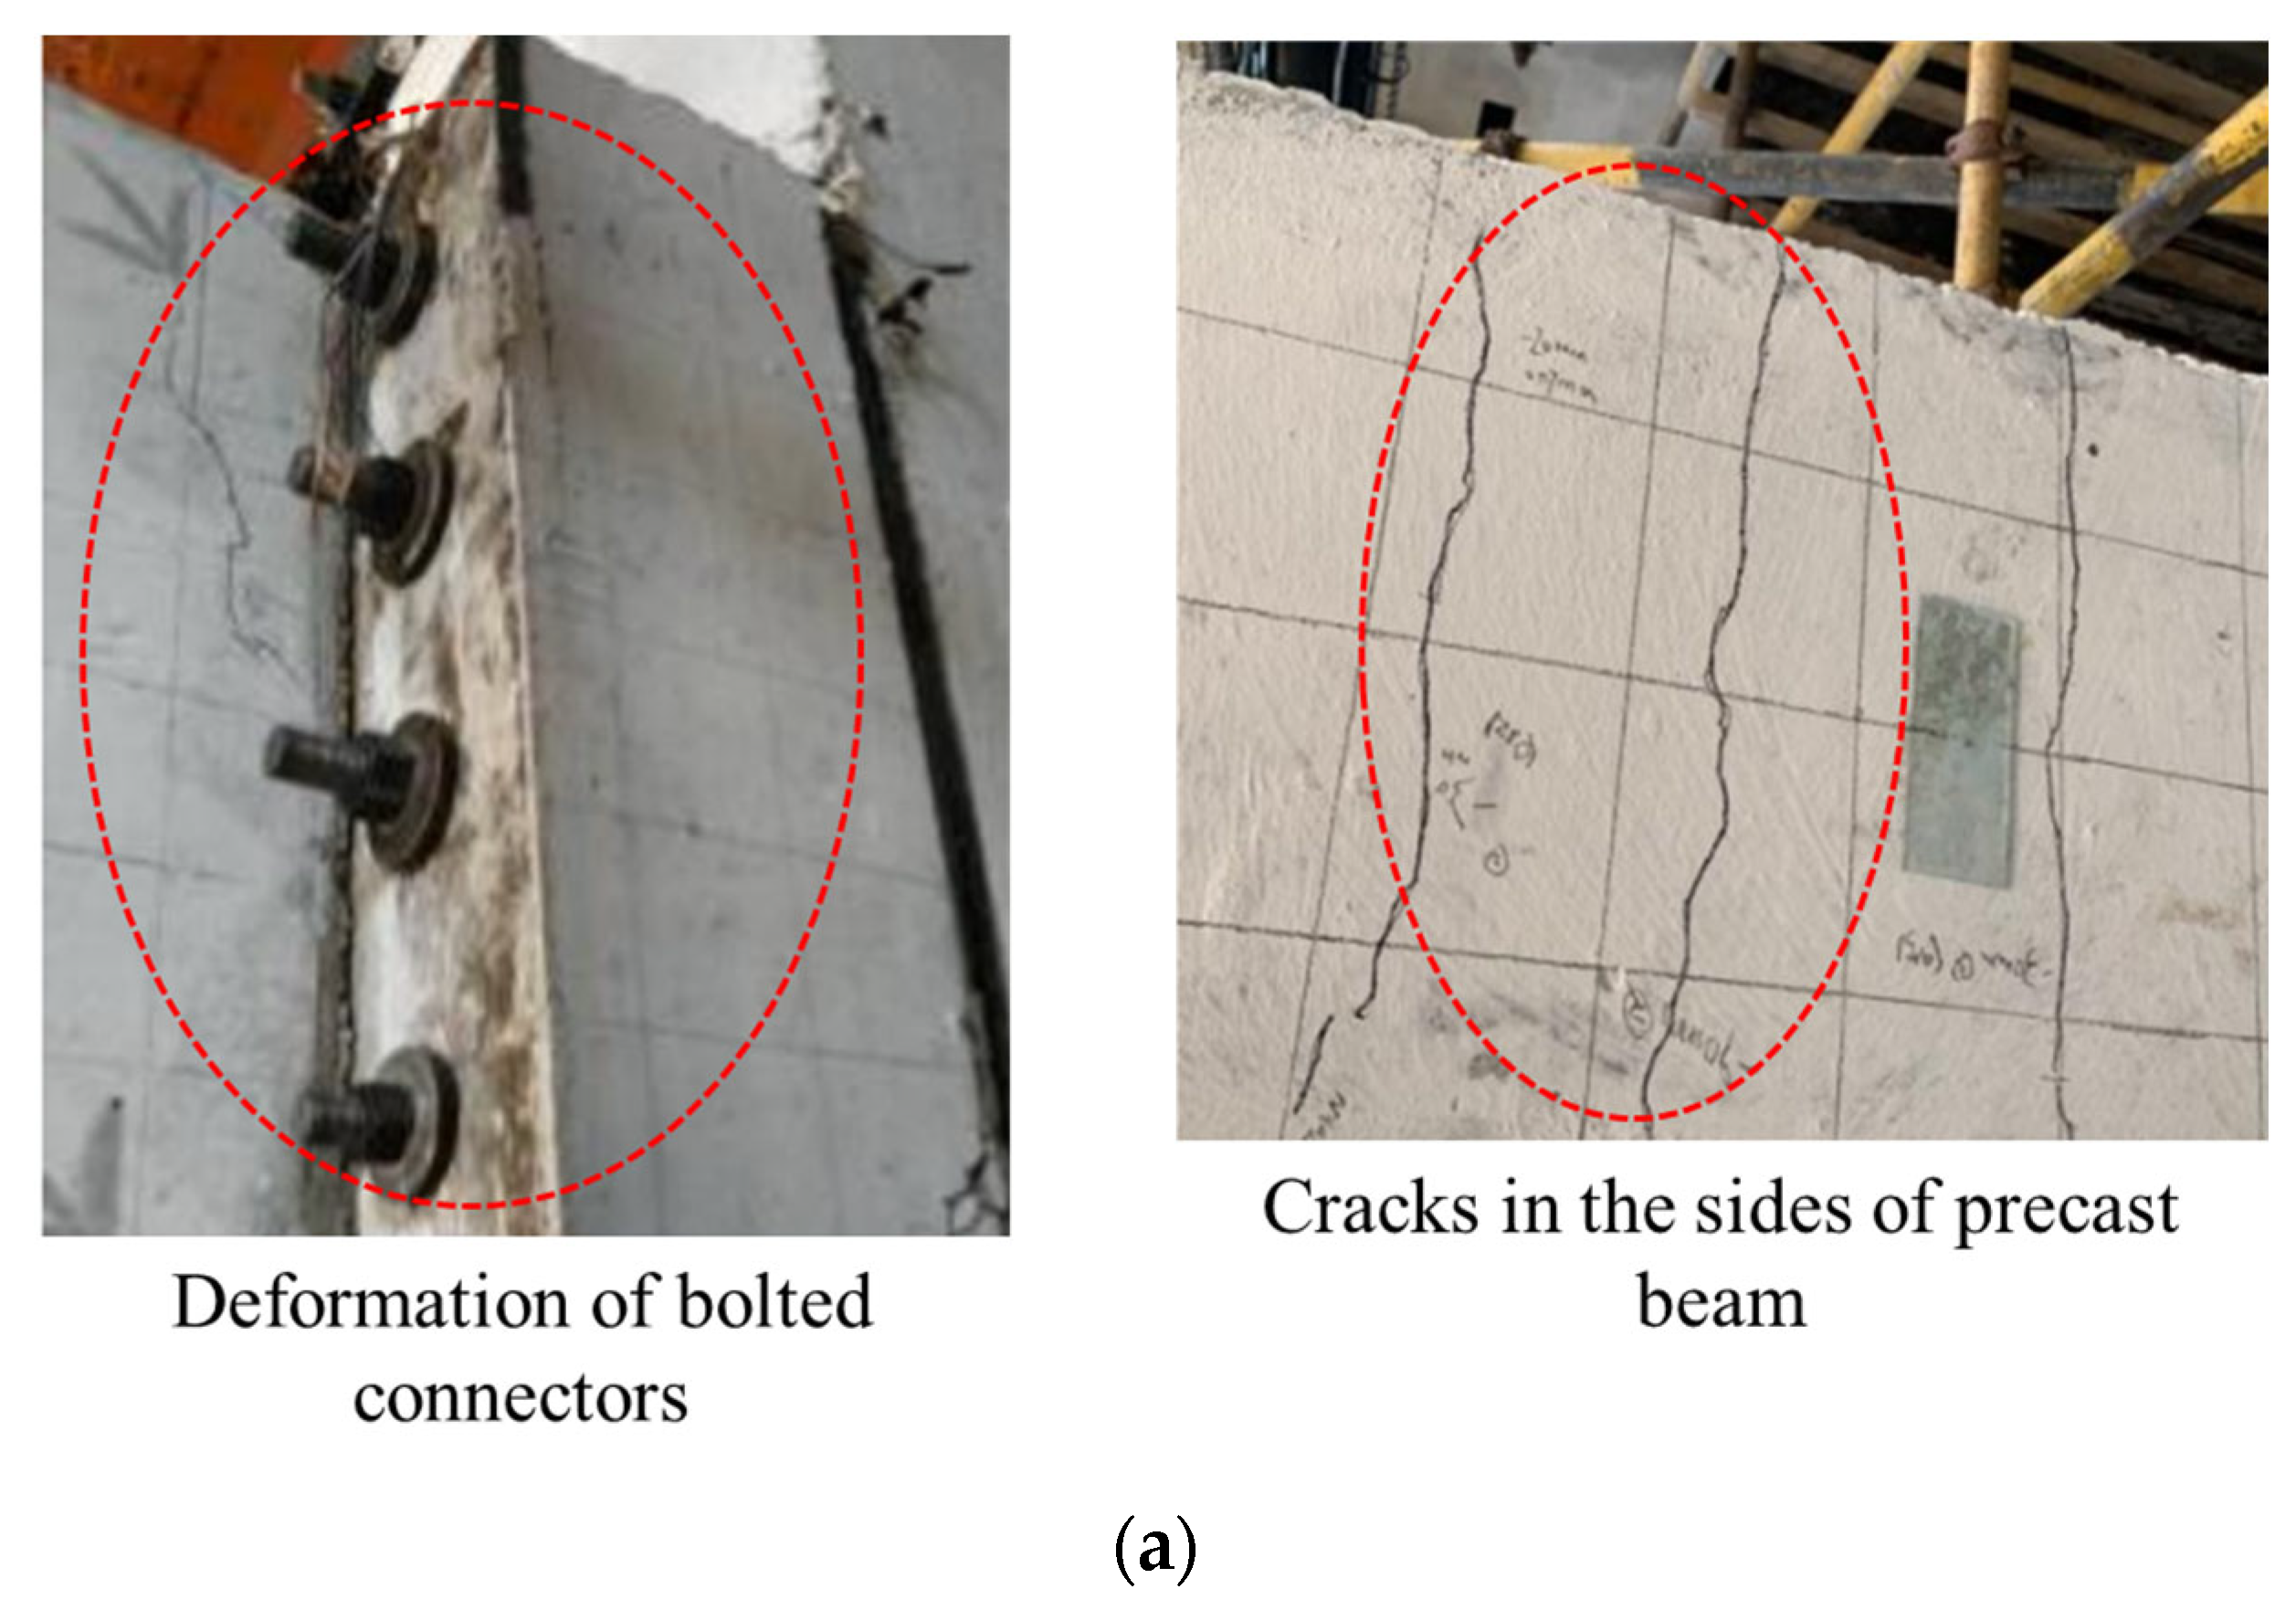
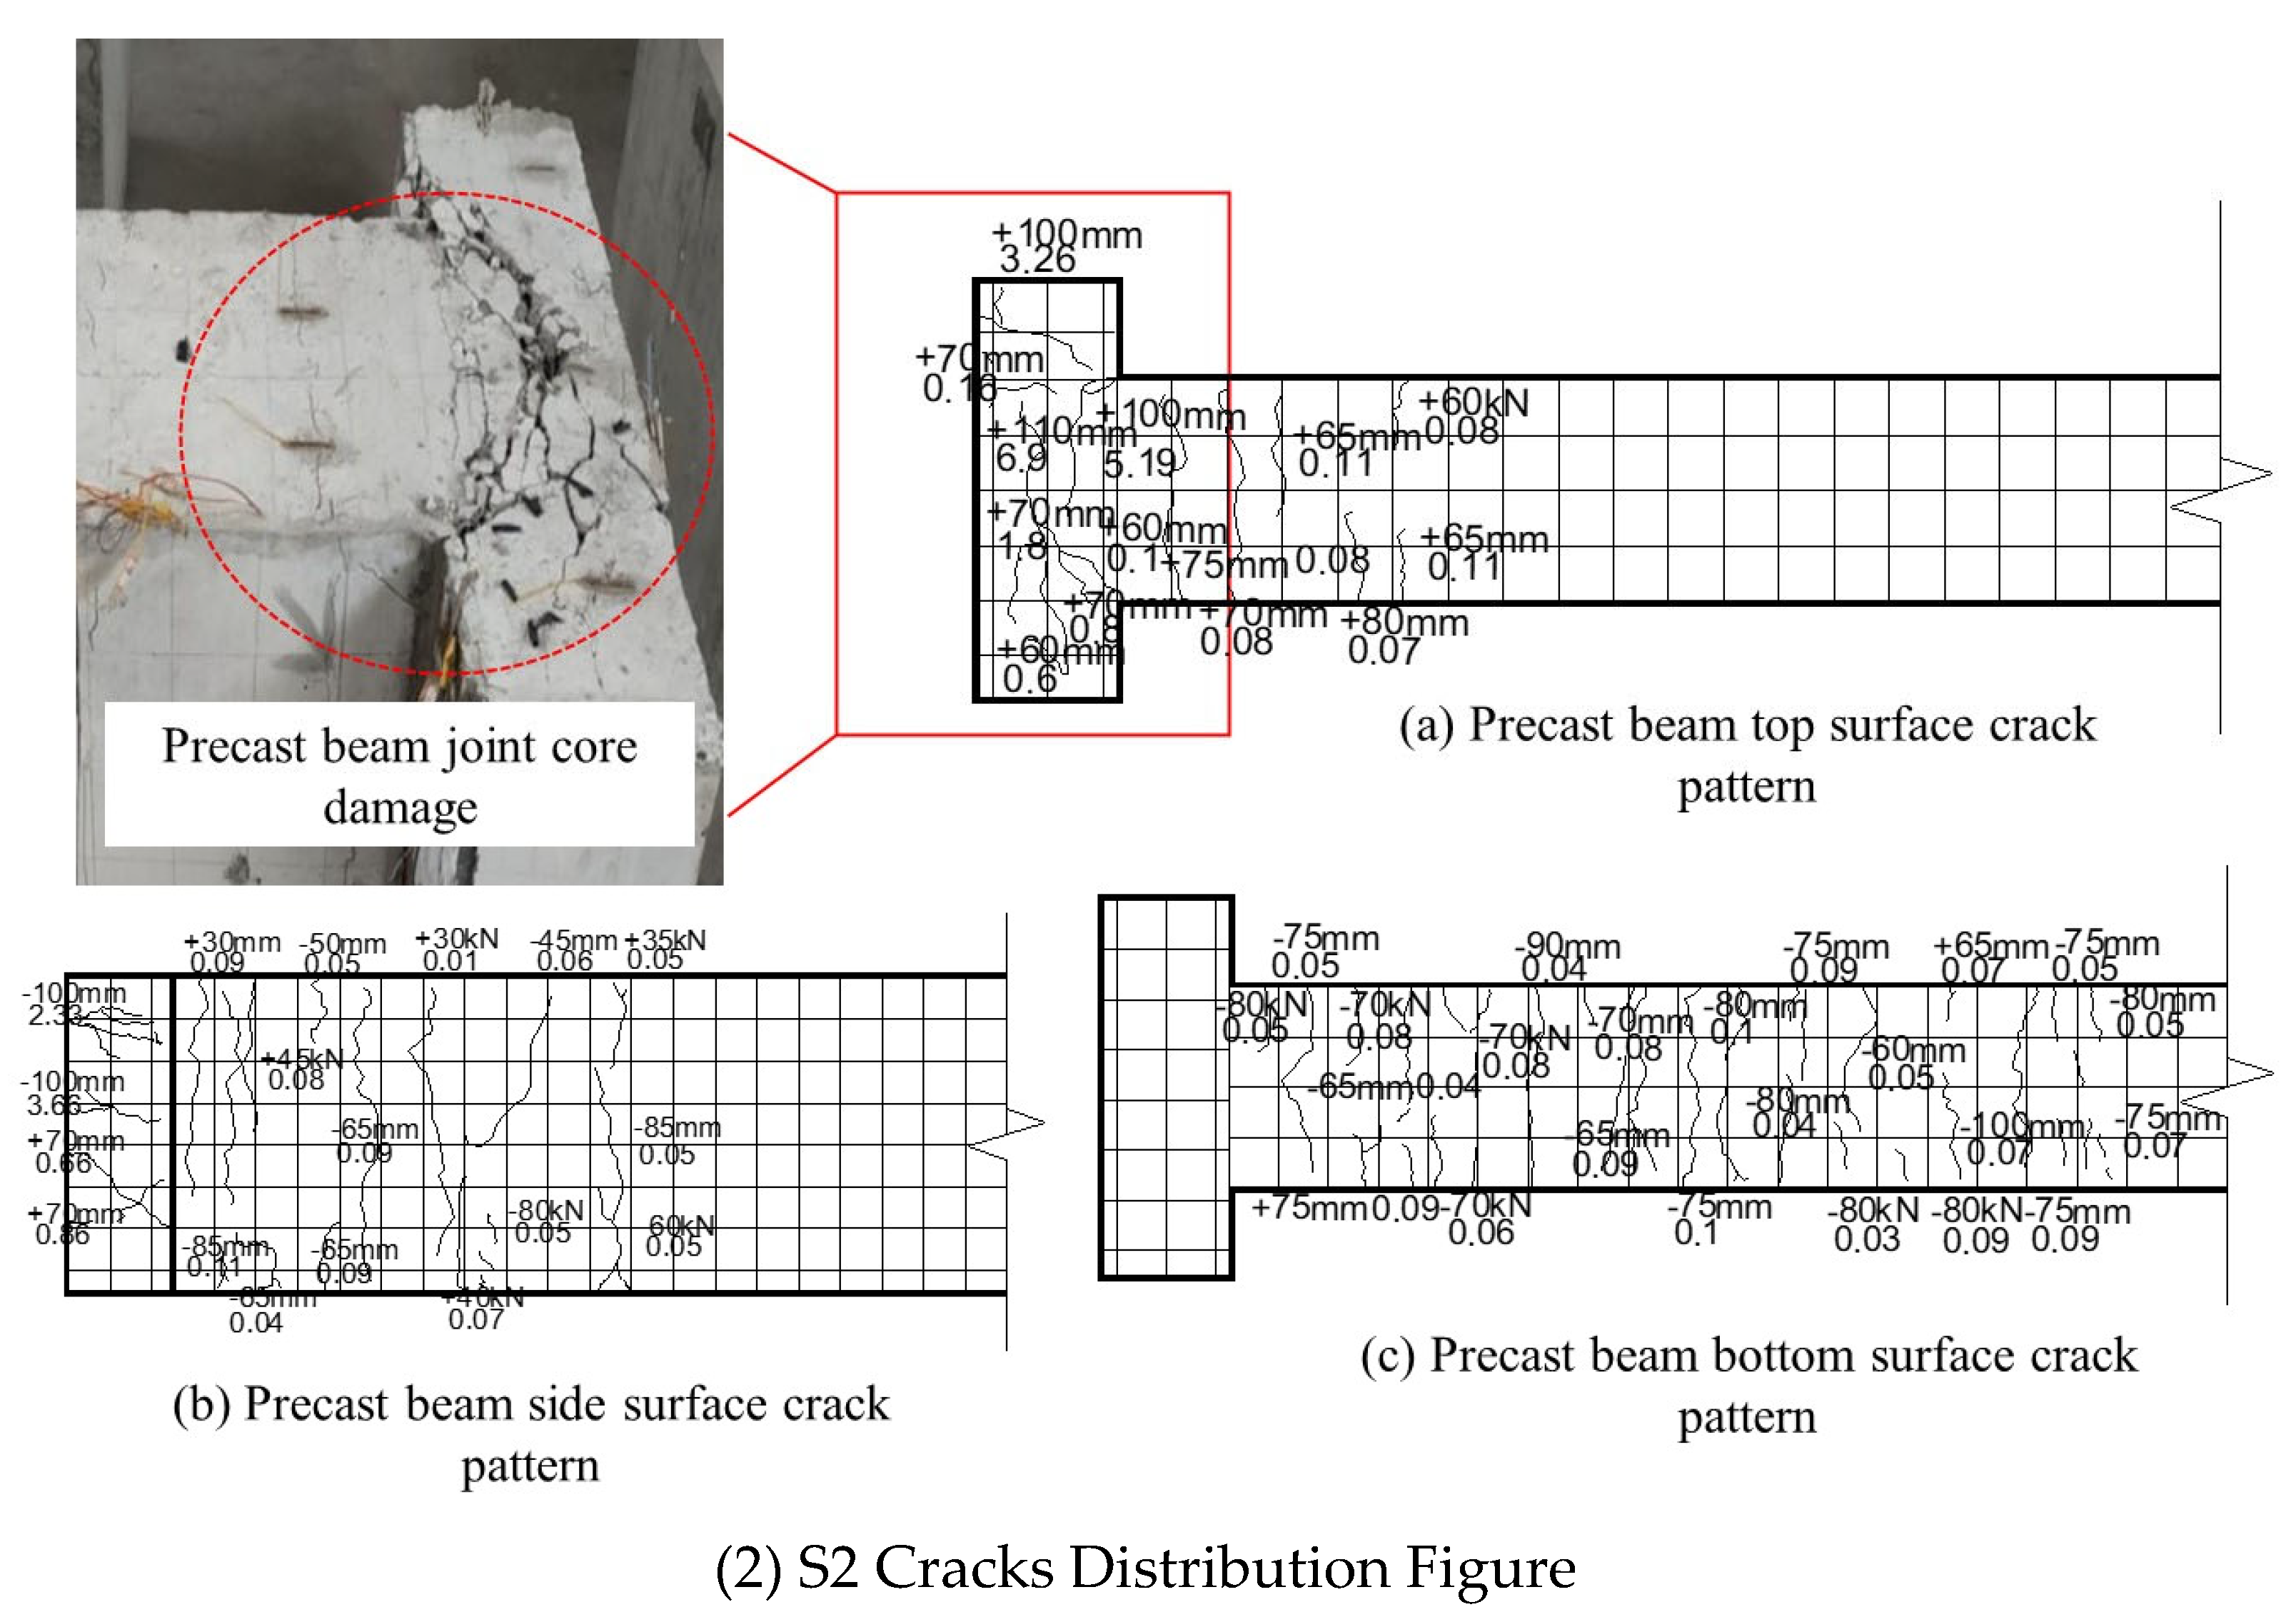
The joint of specimen S2 was bolted with Q345 diameter 28 mm bolts. Loading in the first stage was in force as a control mode. No cracking was evident in specimen S2 when loaded to +20 kN. When loaded to +30 kN, the first crack of 0.1 mm width appeared at the top of the flange at the enlarged end of the beam. When loaded to +60 kN, the maximum crack width at the top of the precast beam was 0.86 mm and the maximum crack width on the south side of the precast beam increased to 0.72 mm with a depth of 0.5 mm. When loaded to −80 kN, the precast beam produced a large deformation and the width of the crack at the intersection of the enlarged end of the precast beam and the precast column continued to increase to 2.76 mm. The strain in the bolt connectors suddenly increased and the stressed reinforcement yielded and turned to displacement loading. The final damage diagrams for the joints are shown in Figure 9.

3.2. Analysis of Experimental Phenomena

As can be seen from Figure 10, the damage forms of S1 and S2 are mostly the same. There are no cracks in the precast column and the corbel, and the final damage was caused by the precast beam and the bolt, which follows the design concept of these new joints. The cracks on the top surface of the precast beam are distributed at the intersection of the enlarged end and the core zone of the joint, and there are almost no cracks far from the core zone of the joint. The bottom surface of the precast beam is cracked near the corbel, but no cracks are produced at the enlarged end. This shows that the presence of the corbel inhibits the generation of cracks in the precast beam to a certain extent and prevents damage to the joint under seismic action. The cracks in the sides of the precast beams are mostly located in the core zone of the joints and there are no cracks in the areas away from the core zone of the joints. The cracks in component S2 are significantly smaller than those in component S1, and the rest of the two joints are intact except for the cracks on the precast beam’s enlarged end surfaces in the core zone of the joints. The main energy-consuming members of the new joint under seismic action are the precast beam and the bolt. When the bolt yielding load is all carried by the bearing plate at the end of the precast beam, the precast beam is damaged and the bolt is damaged after loading. It can be seen that this new joint meets the seismic design concept of “strong column and weak beam”.

3.3. Experimental Results

3.3.1. Load Displacement Curves

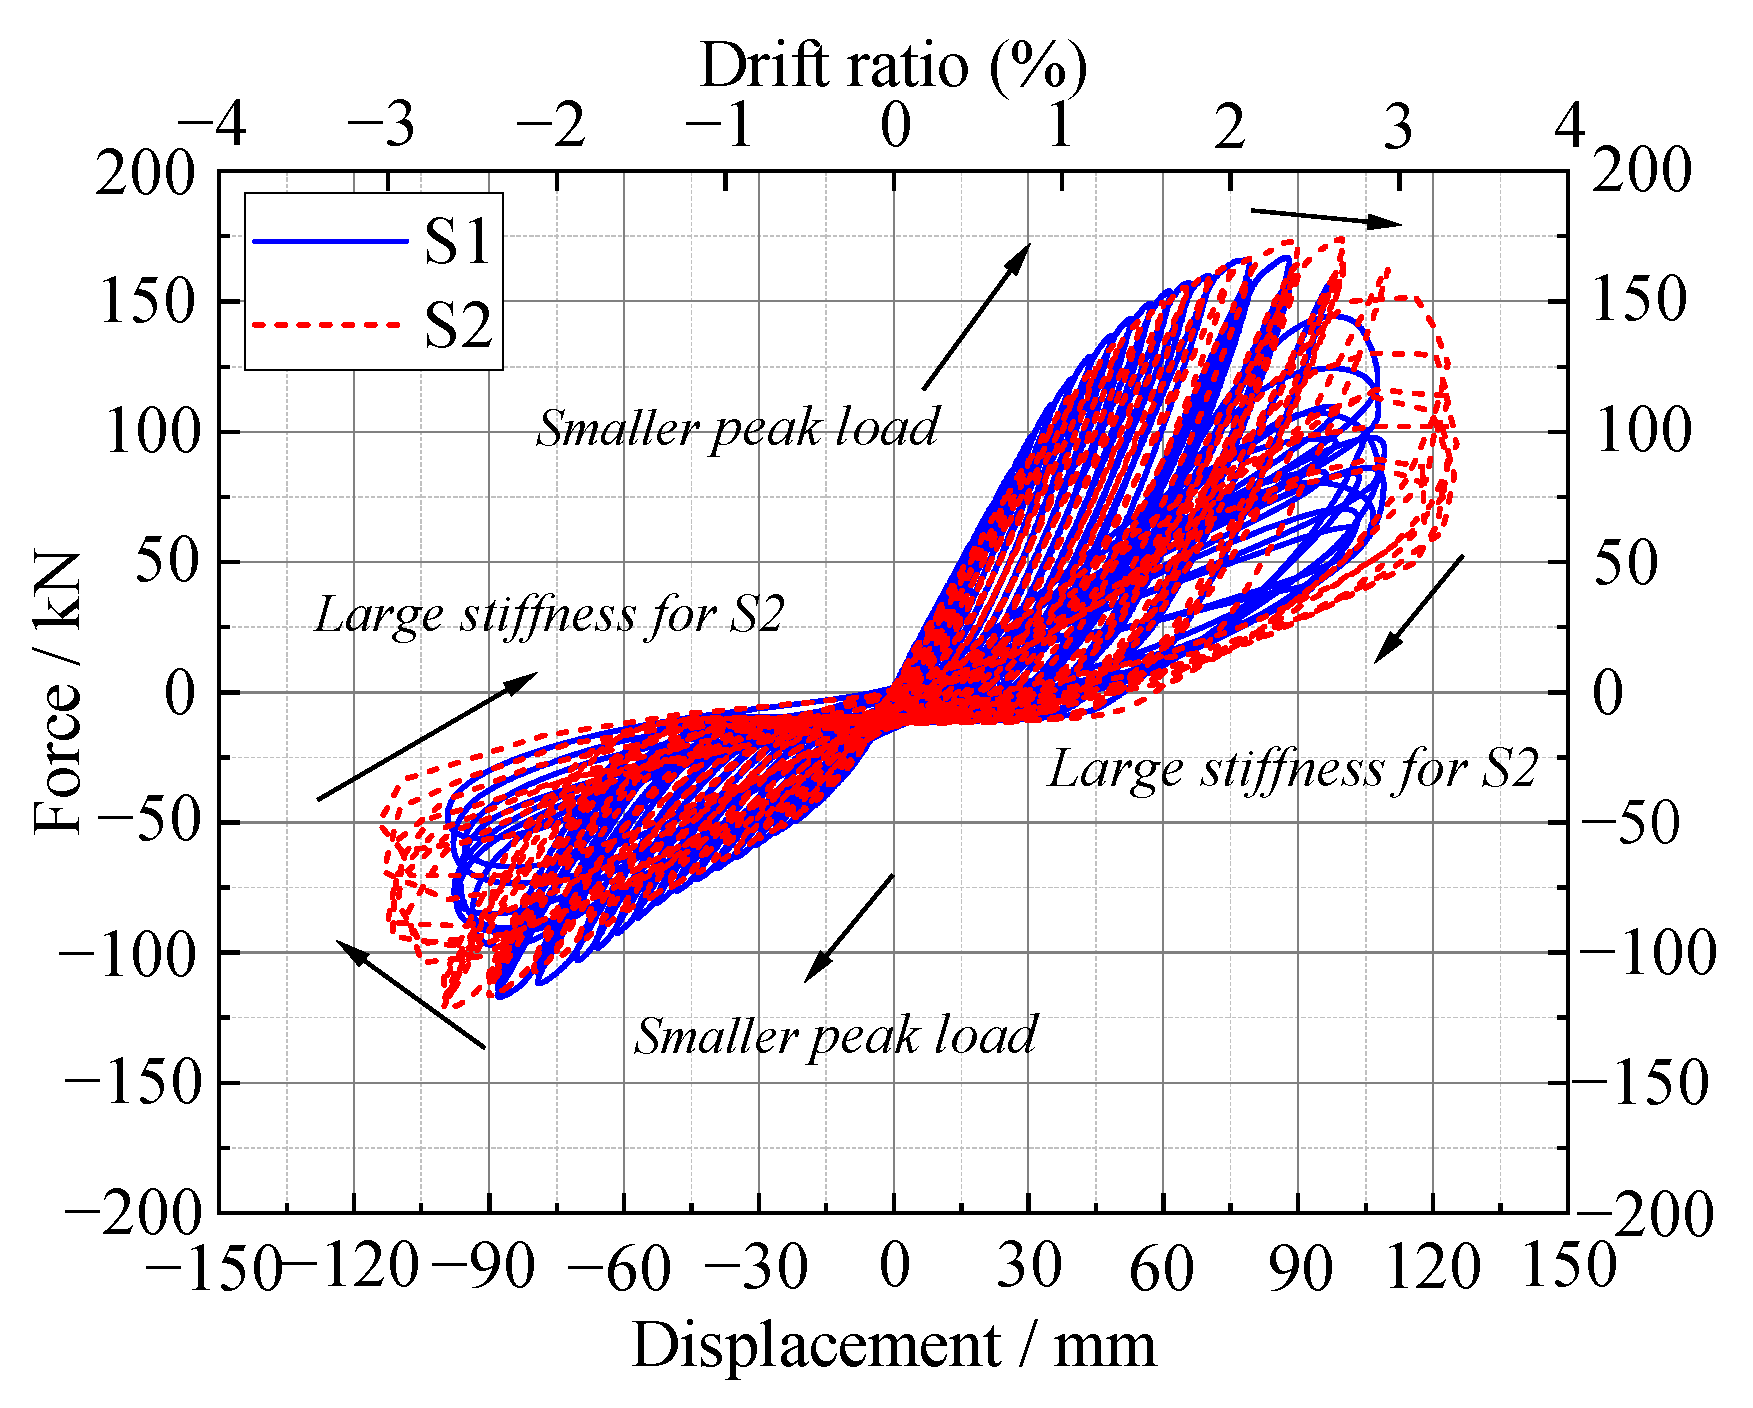
The load-displacement curves for each specimen are shown in Figure 11 (the horizontal coordinates are the actuator position displacement values and the vertical coordinates are the actuator loading values), from which it can be seen that:
  • Comparing the hysteresis curves of S1 and S2, the hysteresis curves are bowed, generally smooth and full. The area of the hysteresis curve increases with the increase in displacement load, which indicates that both S1 and S2 have some plastic deformation capacity and a good energy dissipation capacity. At the same time, the loading force and displacement of the two new joints are approximately linear at the beginning of the loading, when the joints did not crack; with the increase in force, they gradually became non-linear.
  • The hysteresis circle of S2 is significantly larger than that of S1. The ultimate displacements of S2 and S1 are 115.8 mm and 126.6 mm, respectively, and the ultimate displacement of S2 is 9.32% higher than that of S1. This indicates that S2 bolt deformation in the energy dissipation phase is greater than S1, enhancing the energy dissipation performance of the joint. It can be seen that an increase in the bolt diameter of the connector increases the energy dissipation performance of the joint.
  • The hysteresis curves of both S1 and S2 are asymmetrical during reciprocating loading. This is due to the corbel limiting the rotation of the precast beam during negative loading, increasing the stiffness of the joints, decreasing the bolt deformation and reducing the energy dissipation capacity.

3.3.2. Skeleton Curves

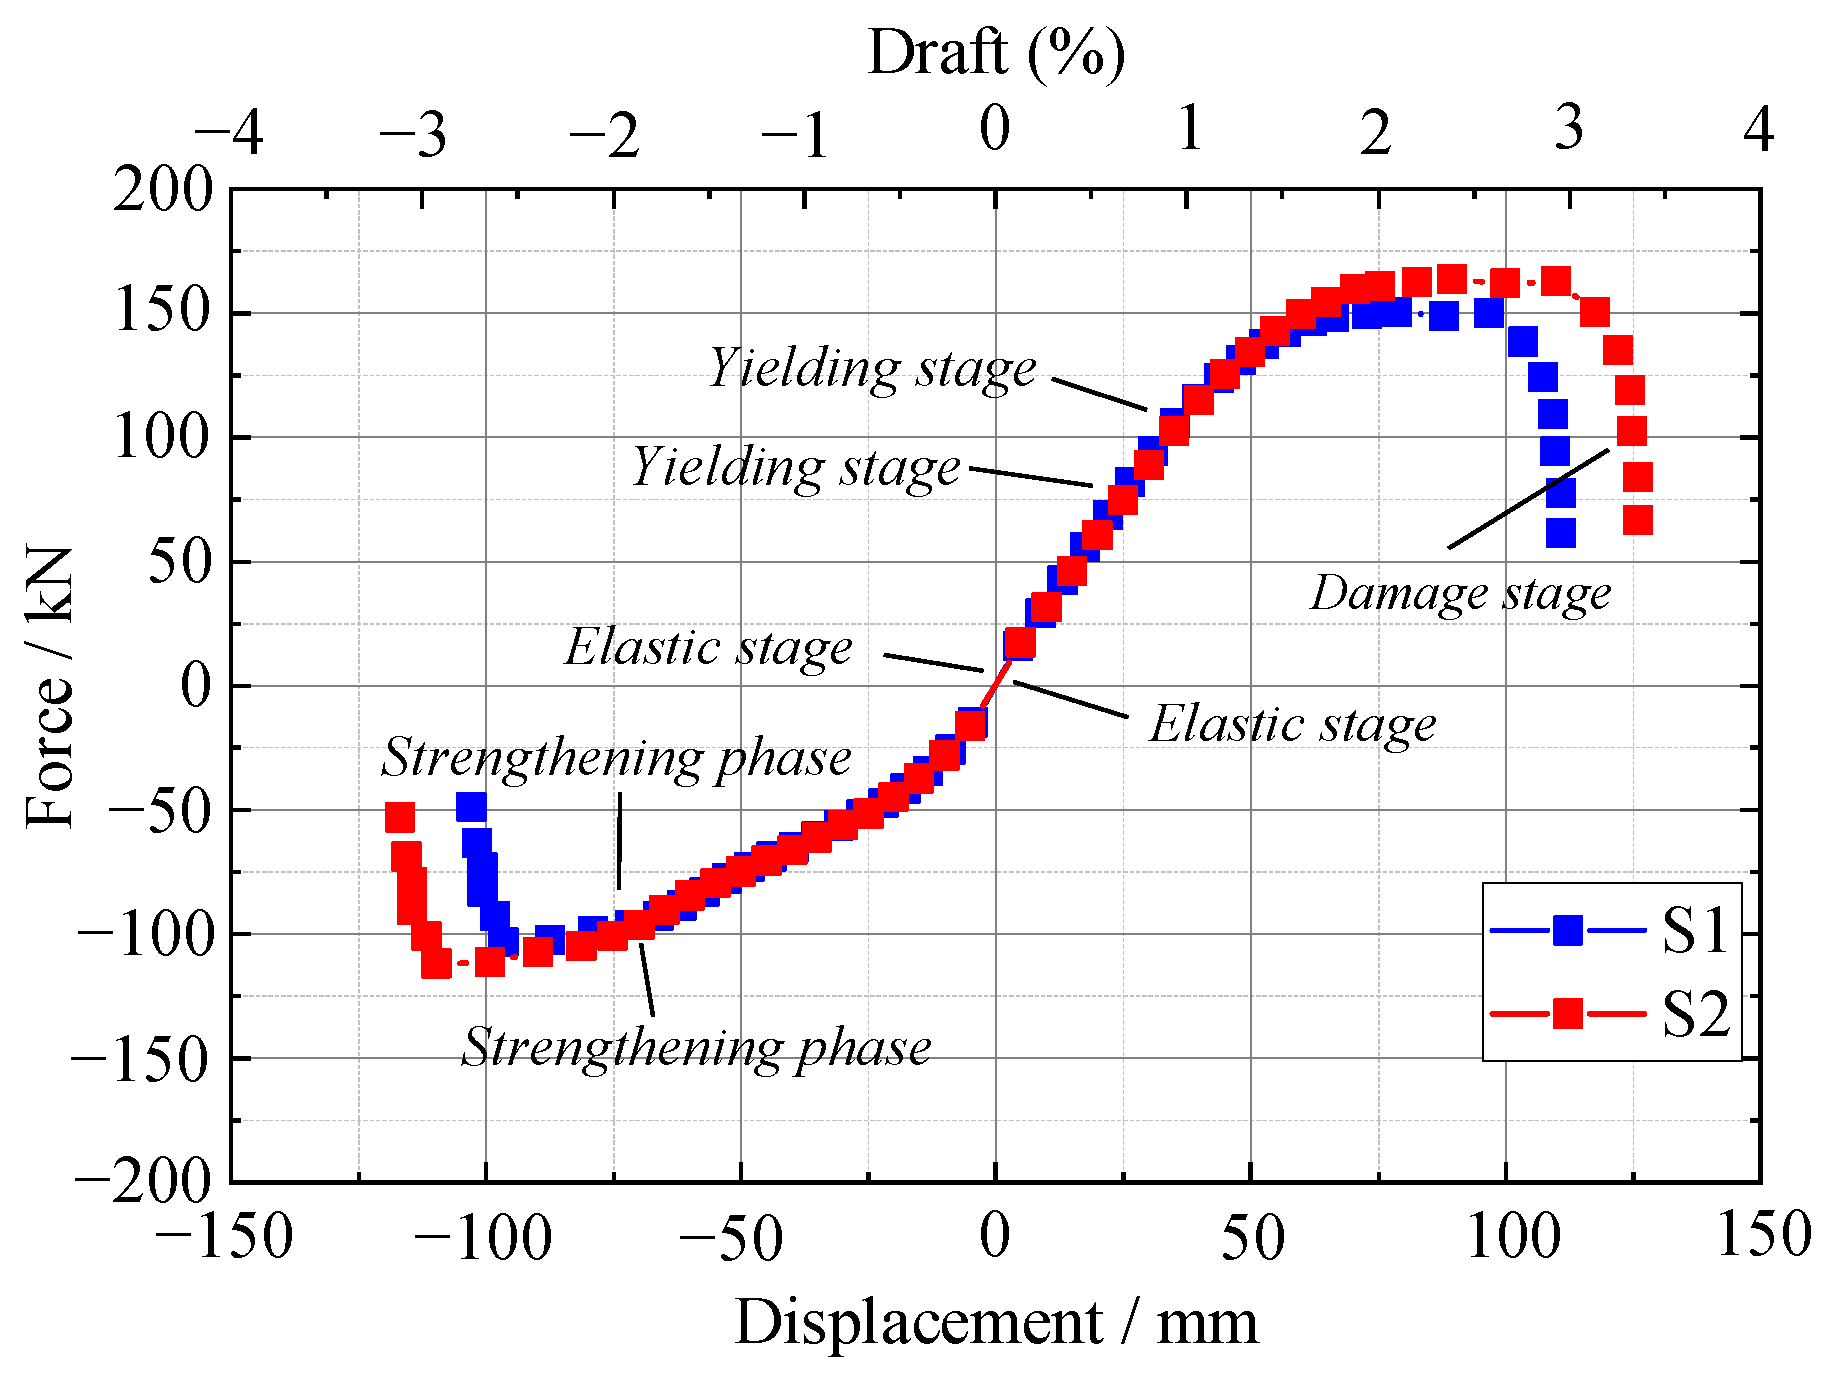
The skeleton curves of S1 and S2 are shown in Figure 12, from which it can be seen that:
  • The two joints in the experimental state go through the elastic phase, the yield phase, the strengthening phase and the damage phase. All maintain good stiffness in the early stages of loading, and the skeleton curves of the specimens all tend to be approximately straight lines, indicating that the components are in the elastic stage with little change in stiffness and displacement. As the load continues to increase, the reinforcement of the precast beam starts to deform and yield and the bolt deformation of specimens S1 and S2 increases. The specimens begin to develop elastoplastic, their skeleton curves gradually shift towards the displacement axis and no longer change linearly, and the stiffness of the specimens gradually degrades.
  • The yield load was Py = 98 kN, ultimate load was Pmax = 148 kN and ultimate damage load was Pu = 151 kN for S1. The yield load was Py = 113 kN, ultimate load was Pmax = 165 kN and ultimate damage load was Pu = 178 kN for S2. It can be seen that the S2 yield load is 39.4% higher, the ultimate load is 11.5% higher and the damage load is 13.2% higher than S1 for the same working conditions. The reason for this is that the S2 bolt diameter is larger than S2, allowing the cracks in the beam to crack and move back, increasing the stiffness and load-carrying capacity of the enlarged end of the precast beam, thus increasing the load-carrying capacity.
  • Specimen S1 has a positive peak load of 151 kN and a negative peak load of 113 kN, a difference of 25.2%. Specimen S2 has a positive peak load of 178 kN and a negative peak load of 121 kN, a difference of 32.02%. The corbel acts as a support for the beam and was not subjected to forces, the load capacity being determined by the structure of the beam itself. The final damage to both S1 and S2 was due to the bolts yielding and cracks in the beam end surfaces, but the load-bearing reinforcement did not yield. It can be seen that the energy consumption of the new joints is primarily based on bolts and cracks produced in the core zone of the joints. No damage occurred to the corbel and columns, compounded by the new joints’ design concept.

3.3.3. Stiffness Degradation Curves

The development of cracks in the specimen during loading, the entry of longitudinal bars and bolts into the elastoplastic working section, and the slip of the bond between reinforced concrete cause damage to the structural components. When damage accumulates to a certain value, residual deformation occurs in the structural components, there is plastic damage that cannot be elastically restored and their stiffness begins to deteriorate. The degradation of the seismic performance of a structural component can be expressed in terms of the cut-line stiffness Ki [31]. Due to the presence of the corbel, there was a constraint on the rotation, making the stiffness different when the forces were applied in the upper and lower directions, so the calculation was carried out in separate directions.
K i = F i X i
where Fi is the load value at the ith positive or negative peak point and
Xi is the displacement value at the ith positive or negative peak point.
The stiffness degradation curves of the specimens are shown in Figure 13. The stiffness degradation curves of the two groups of specimens show a similar trend. The initial stiffness of the specimens is larger and the stiffness degradation rate is slow, indicating that these joints have a strong resistance to lateral movement. As the displacement loading proceeded, the specimens developed cracks and the original cracks continued to develop. The deformation of the bolts at the joints resulted in the enlargement of the cracks at the joints, and the stiffness of the specimens gradually degraded. The degradation rate was faster at the beginning and slowed down at the end, and the curve tended to flatten out. The rate of stiffness degradation of specimen S2 in each displacement stage was less than that of specimen S1, and the stiffness in each displacement stage was greater than that of specimen S1, indicating that increasing the diameter of the bolts had a greater effect on the joints’ stiffness. The residual stiffnesses of specimens S1 and S2 are 1.14 and 1.17, respectively, indicating that the new joints still had a certain load-bearing capacity when they were damaged.

4. Finite Element Simulation Analysis

To further compare and analyse the differences between the test joints and general cast-in-place joints, the finite element simulation software ABAQUS was used in this paper to carry out finite element simulations of the test joints S1 and cast-in-place joints, where the material properties and simulation methods of the cast-in-place joints were kept the same as those of the test joints. The accuracy of the finite element analysis determines whether the finite element simulation results can effectively reflect the seismic performance of the nodal members [33]. To ensure the reliability of unit types, meshing, contact settings, boundary conditions, material parameters and solution methods, the finite member section of this paper refers to the numerical simulation methods of numerous researchers. Liu et al. [34,35] conducted a seismic performance study and numerical finite element simulation of a new inserted beam–column connection. Brunesi et al. [34] introduced the finite element modeling process for bolted joints. Zhou et al. [36] presented various prestressed concrete joints and conducted a parametric study of the joints’ details. Özkılıç et al. [37,38,39,40,41,42] have conducted a large number of experiments and finite element analyses, providing a reference for our finite element parameter settings.

4.1. Concrete Damage Model Theory

4.1.1. Concrete Material Constitutive Relationships

When analyzing the structural properties of concrete in finite element ABAQUS software, the concrete components of the model must be given appropriate constitutive data to achieve accurate and valid results. As a result of various studies and the continuous development of the finite element software itself, ABAQUS software has developed a variety of intrinsic structure model systems, such as plastic damage models and smeared cracking models, which were designed for concrete mechanical performance analysis in different problem situations [43].
The smeared cracking model can consider the weakening of the shear resistance of the cracked surface after cracking by defining a shear modulus reduction factor for the concrete, thus avoiding shear locking. The shear modulus discount factor dc is calculated with the formula:
d c = q c ε d < 0 1 ε d ε max 0 ε d ε max 0 ε d > ε max
where εd is the cracking strain perpendicular to the direction of the crack in the concrete.
εmax is the cracking strain perpendicular to the direction of the concrete crack when the shear modulus of the cracked surface is reduced to zero.
qc is the shear modulus reduction factor after the concrete crack is closed under reciprocating load.

4.1.2. Hysteresis Rules

The smeared cracking model cannot take into account the reciprocating force characteristics such as the unloading stiffness degradation and reloading stiffness recovery of concrete under reciprocating loads. The hysteresis rule is that the compressive unloading is unloaded at the initial elastic stiffness and the reloading path when the stress–strain curve transitions from the compressive zone to the tensile zone points to the historical maximum stress–strain point in tension. The unloading in tension points to the zero-stress point of the previous reload, and the stress–strain curve transitions from the tension zone to the compression zone by the initial elastic stiffness of the reload.
In the plastic damage model, the core of its hysteresis rule assumes that the damage to concrete is in the form of tensile cracking and crushing and that the damage to the concrete after it enters plasticity is divided into tensile and compressive damage, with two separate damage factors used to model the degradation of elastic stiffness caused by the damage. The hysteresis criterion is jointly determined by the damage factor d and the stiffness recovery factor ω.

4.1.3. Yield Criterion and Law of Flow

For the smeared cracking model, the yield surface equation is based on classical elastoplastic theory and is expressed as follows:
F = 3 J 2 + 3 α I 3 τ c
where the τc hardening parameter can be calculated from the uniaxial stress–strain relationship for concrete.
The flow law for the concrete dispersion cracking model is the ordinary associative flow law, and the plastic potential function is the same as the yield surface equation.
For the plastic damage model, the yield surface function is:
F = 1 1 α 3 J 2 + α I 1 + β σ max γ σ max σ c 0
where I1 and J2 are the first invariant of the stress tensor and the second invariant of the partial stress tensor, respectively, and the remaining parameters are calculated as follows:
α = σ b 0 σ c 0 1 2 σ b 0 σ c 0 1
β = σ c 0 σ t 0 1 α 1 + α
γ = 3 1 K c 2 K c 1
where σb0 is the biaxial compressive strength of the concrete; σc0 is the uniaxial compressive strength of the concrete; σt0 is the biaxial tensile strength of the concrete; and Kc is the parameter controlling the shape of the projection of the concrete yield surface on the offset plane.
The flow law for the plastic damage model uses the uncorrelated flow law with a plastic potential function of:
G = λ σ t 0 tan ϕ 2 + 1.5 ρ 2 + 3 ξ tan ϕ
where ρ = (2J2)0.5; ϕ is the expansion angle of the concrete yield surface in the strengthening process, taking a value range of 37° to 42°; and λ is the eccentricity of the concrete plastic potential function, which can be taken as 0.1.
For the seismic finite element analysis of the new assembled beam–column joints in this paper, the concrete constitutive model was based on the plastic damage model. The experimental parameters were calculated concerning the test specimens of the same concrete batch.

4.2. Finite Element Model

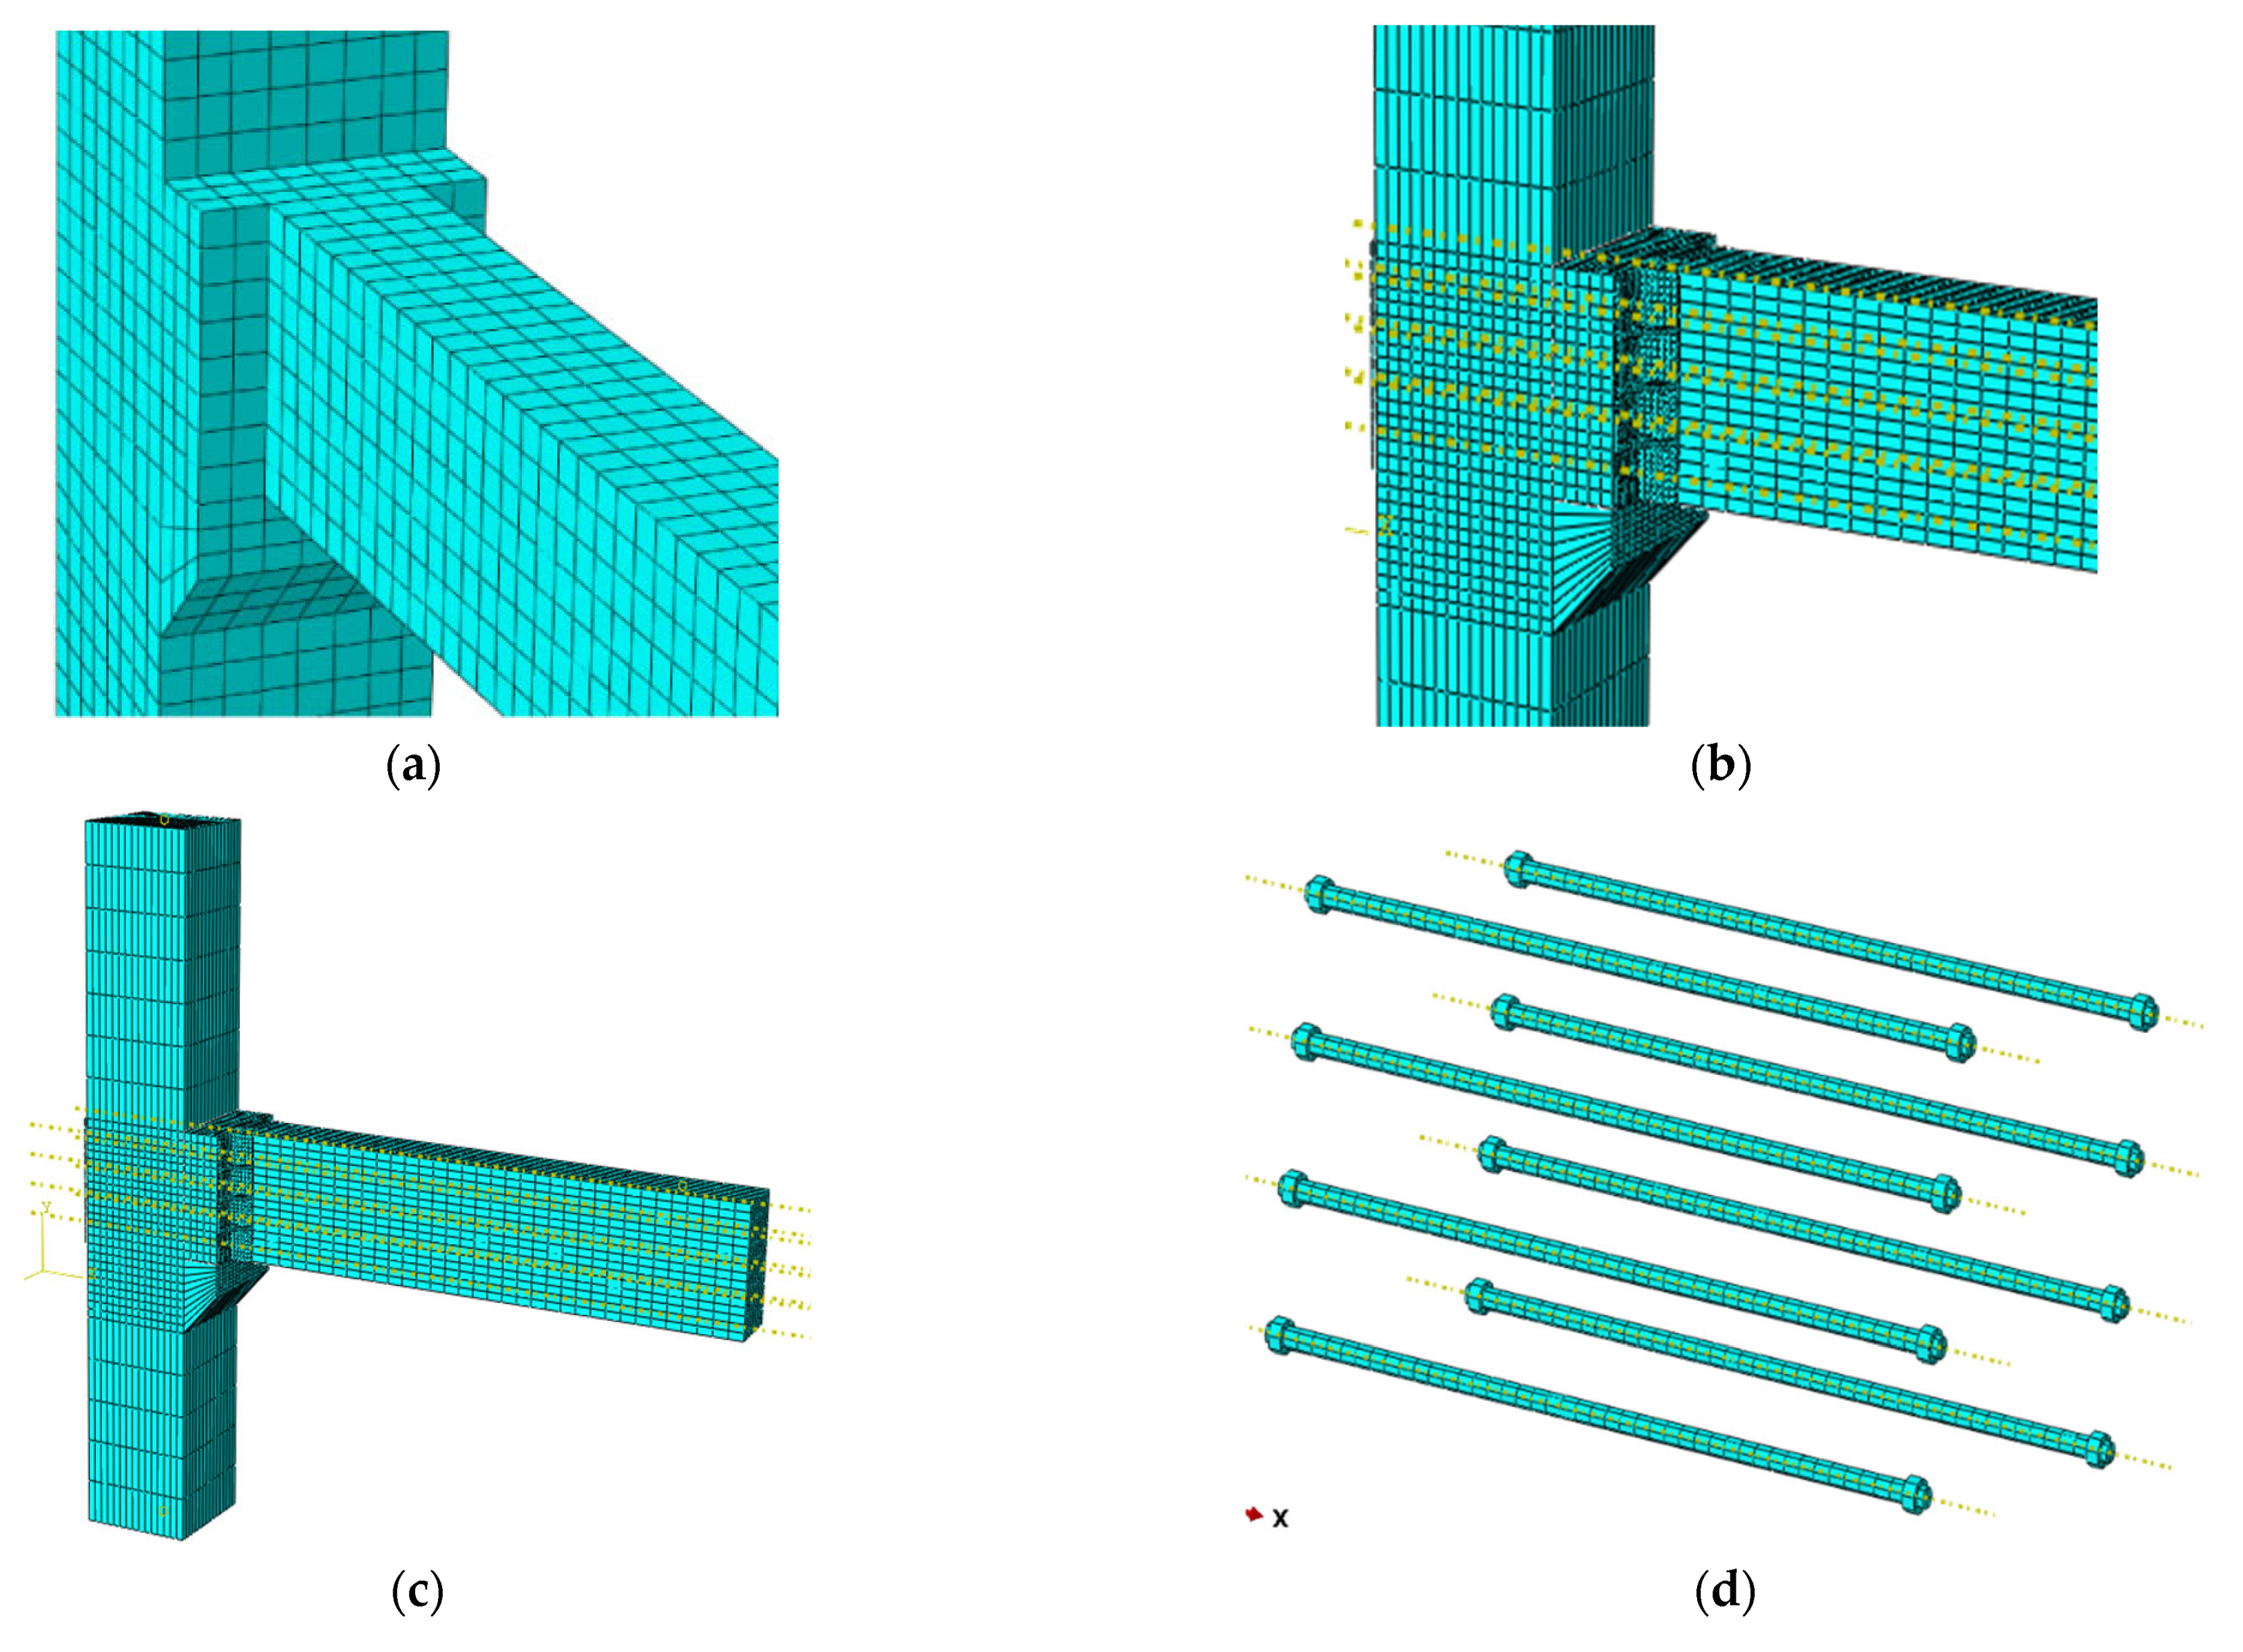
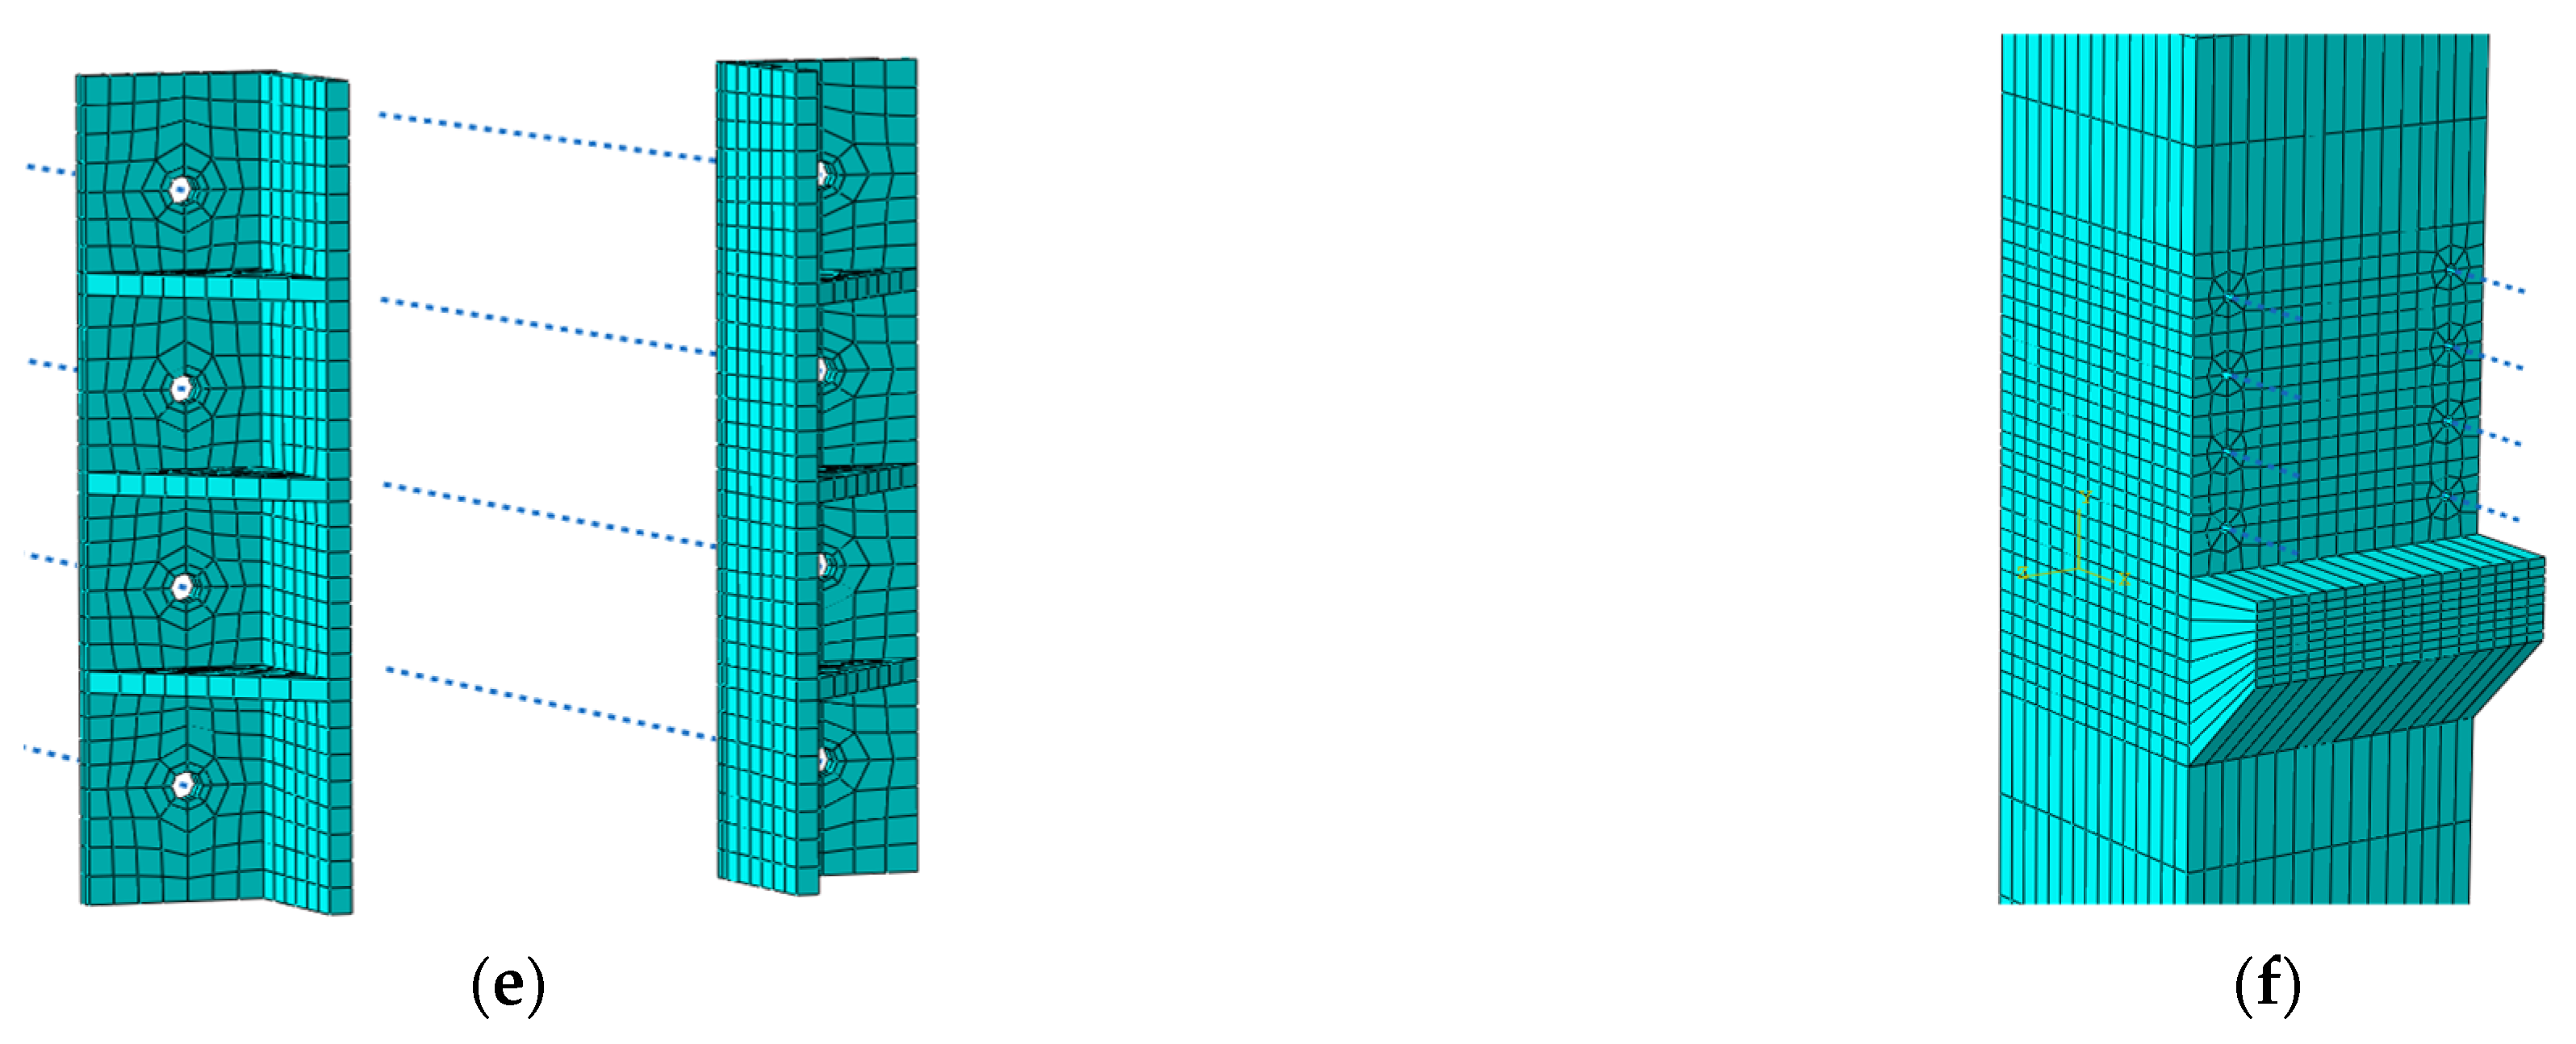
Without changing the property parameters and modeling method, the test joints and cast-in-place joints were modeled separately. C3D8R hexahedral linear reduced integral solid units were used for concrete, bolts and steel plates, and T3D2 linear truss units were used for steel reinforcement. The mesh division is carried out by defining the cutting surface first and then dividing the mesh, which can effectively divide each area of the model and reasonably encrypt the mesh in the core zone of the joints. The mesh division is shown in Figure 14. Considering both calculation accuracy and efficiency, the mesh is locally refined at the location where a high stress concentration exists. After conducting several mesh sensitivity analyses, the mesh size at the bolts was set as around 10 mm, the size of the mesh at the beams was set as 15 and the size of the column was set as 50 mm. As a result, the total number of meshes in the model was 16,048.

4.3. Material Properties

Material Stress–Strain Curves

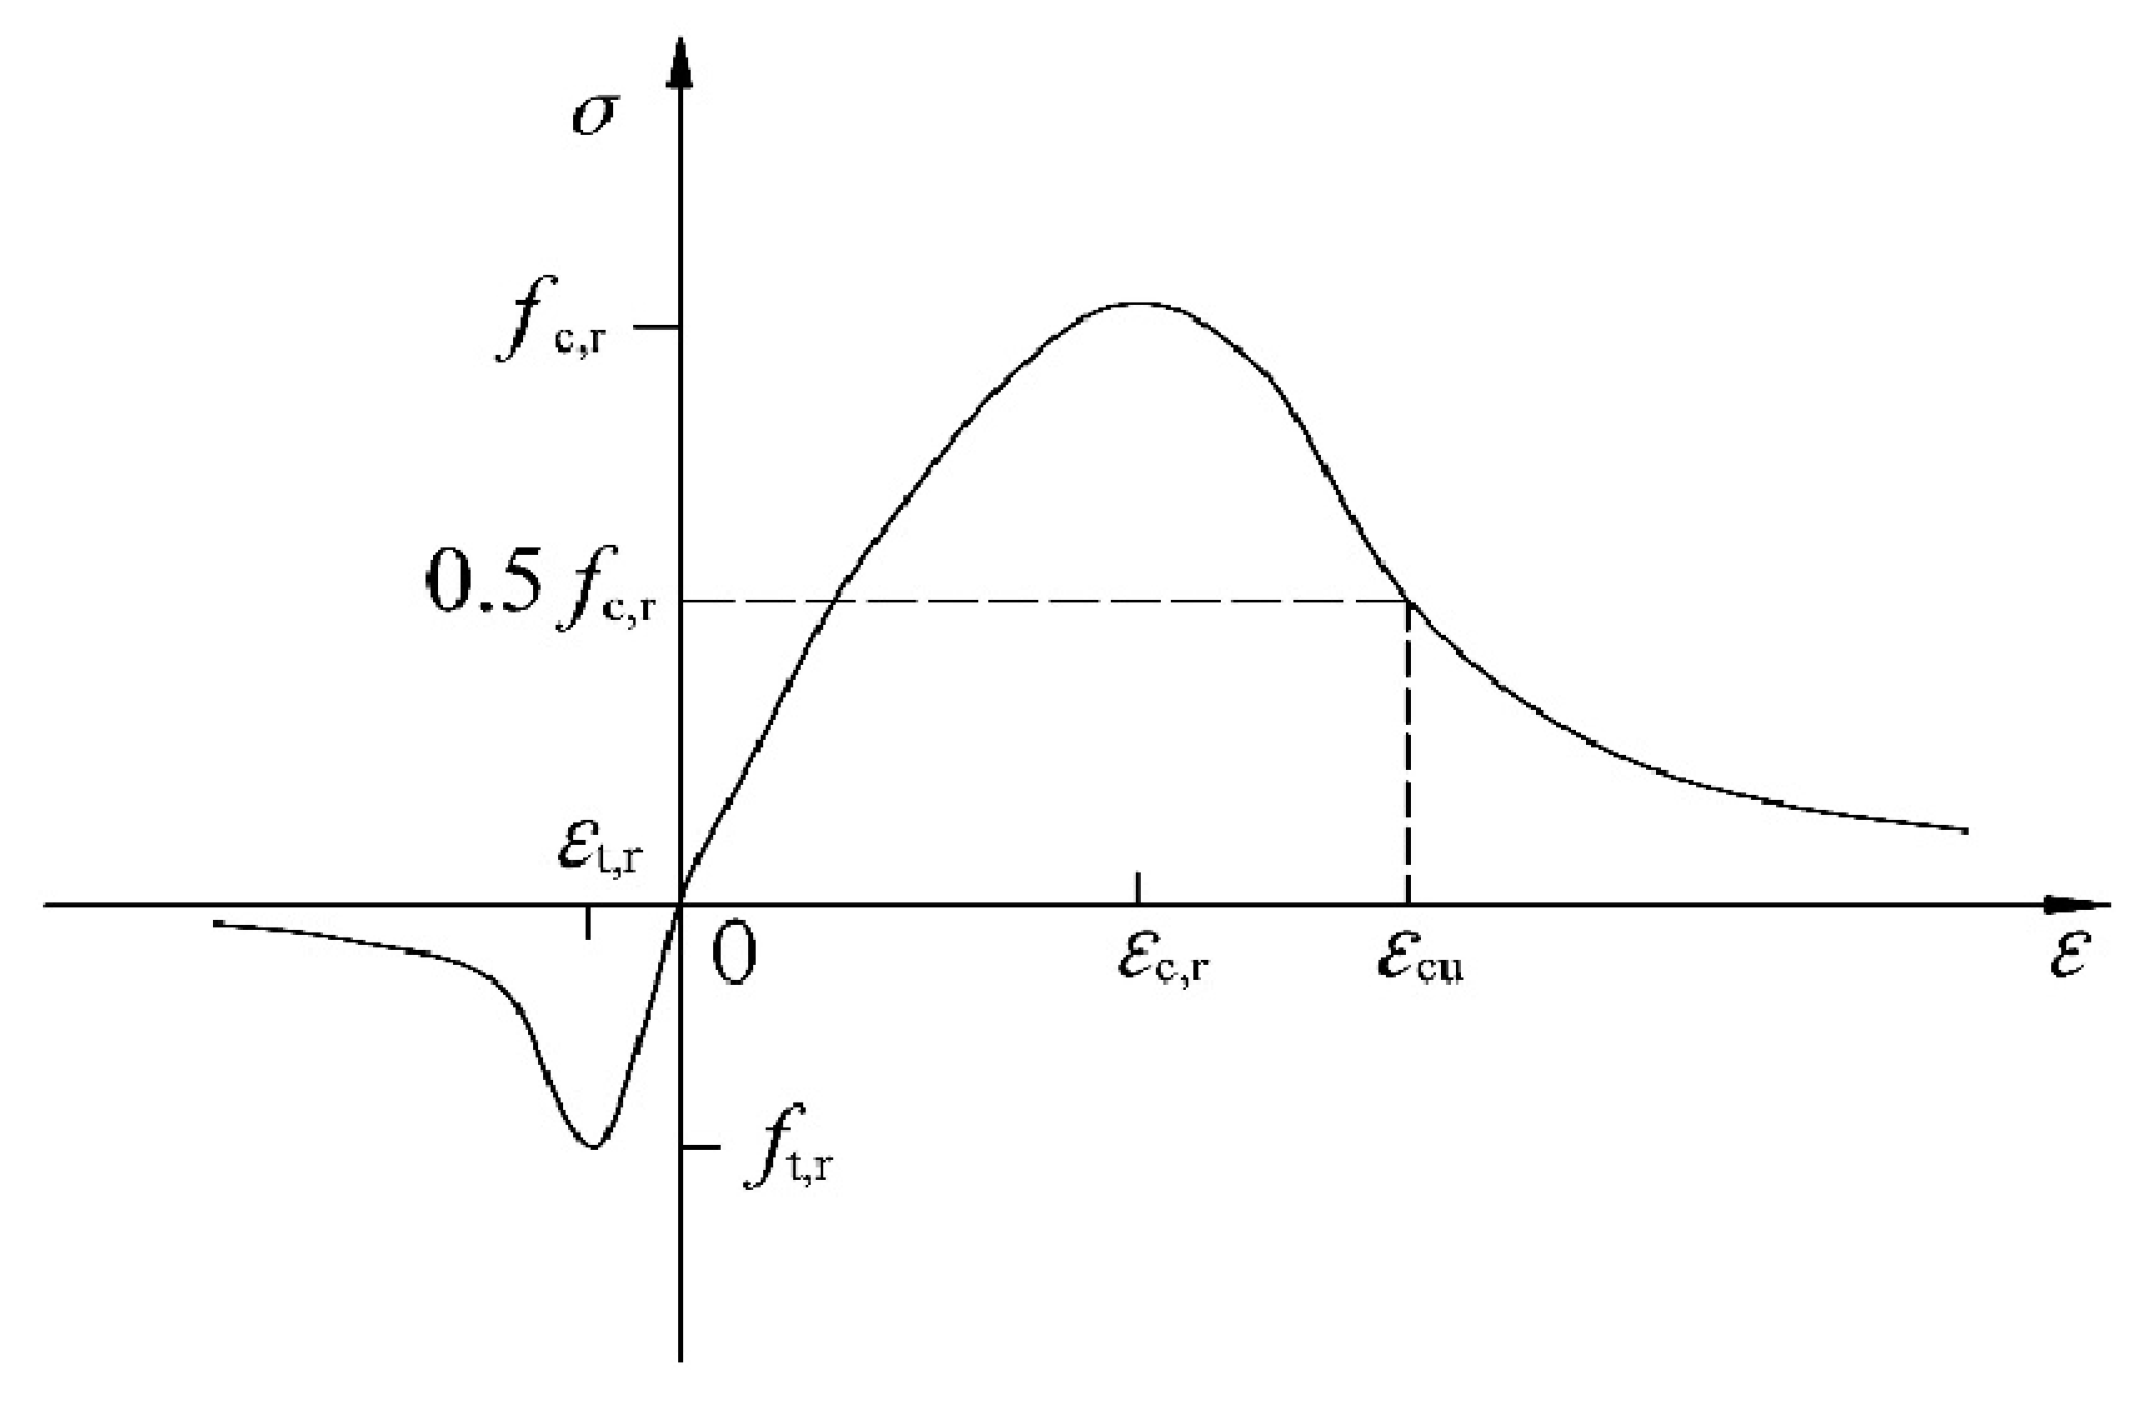
A plastic damage model is used to simulate the mechanical performances of concrete, requiring accurate input of concrete stress–strain values and corresponding damage parameters in ABAQUS, which can determine whether the concrete units are damaged according to the input parameters during the calculation. In the analysis of concrete damage, ABAQUS can show two main damage mechanisms—tensile cracking and compressive damage—and the model can reflect the degradation in concrete stiffness in the middle and late stages of loading. These parameters can be obtained from the curve equations provided in reference [44] by referring to the concrete model intrinsic structure curves.
The uniaxial compressive stress–strain curve for concrete can be determined from Equations (9) and (10) as follows:
σ = 1 d t E c ε
d t = 1 ρ t n n 1 + x n [ 1.2 0.2 x 5 z ] x 1 1 ρ c α t x 1 2 + x x > 1
where ρ c = f c , r E c ε c , r , n = E c ε c , r E c ε c , r f c , r , x = ε ε c , r .
The uniaxial stress–strain curve for concrete in tension can be determined from Equations (11) and (12) as follows:
σ = 1 d t E c ε
d t = 1 ρ t 1.2 0.2 x 5 x 1 1 ρ c α t x 1 1.7 + x x > 1
where x = ε ε t , r , ρ t = f t , r E c ε t , r .
The stress–strain curve for uniaxially stressed concrete is shown in Figure 15.
The material properties are shown in Table 6.
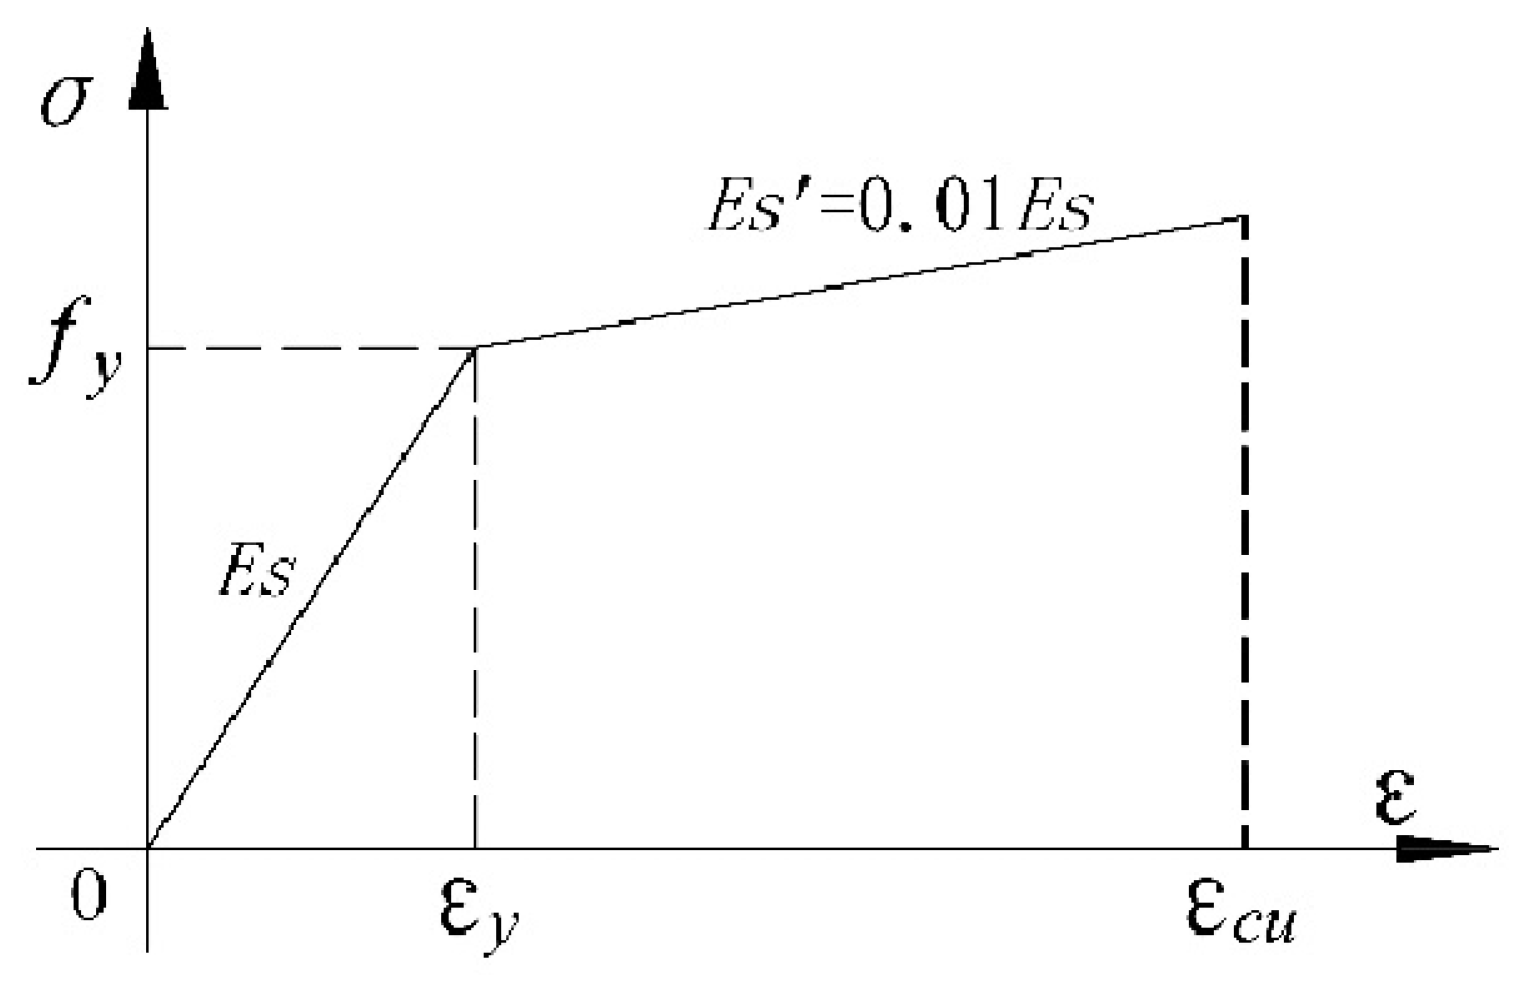
The steel used in this test included reinforcement bars, bolts and compression plates. There are three types of reinforcement constitutive models: an isotropic strengthening model, a kinematic strengthening model and a hybrid strengthening model. The steel reinforcement was embedded into the concrete substrate with perfect bonding [37,45]. As the experiment is a low cycle loading experiment, the Bauhinia effect of the steel needs to be considered, so it is not appropriate to use an isotropic strengthening model but rather a kinematic strengthening model. The steel is shown in Figure 16 using a bilinear hysteretic model.

4.4. Interaction

The contact between the bolts and the concrete column and between the steel plate and the concrete column is made by face-to-face contact, where the tangential direction is set to “penalty” contact and the normal direction is set to “hard” contact, with a friction factor of 0.45. “Tie” constraints (binding restraints) are used for steel plates and concrete beam–columns. Considering the relationship between steel and concrete, the “Embed” command (built-in command) is then used to embed the reinforcement directly into the concrete beam–column.

4.5. Boundary Conditions and Load Loading

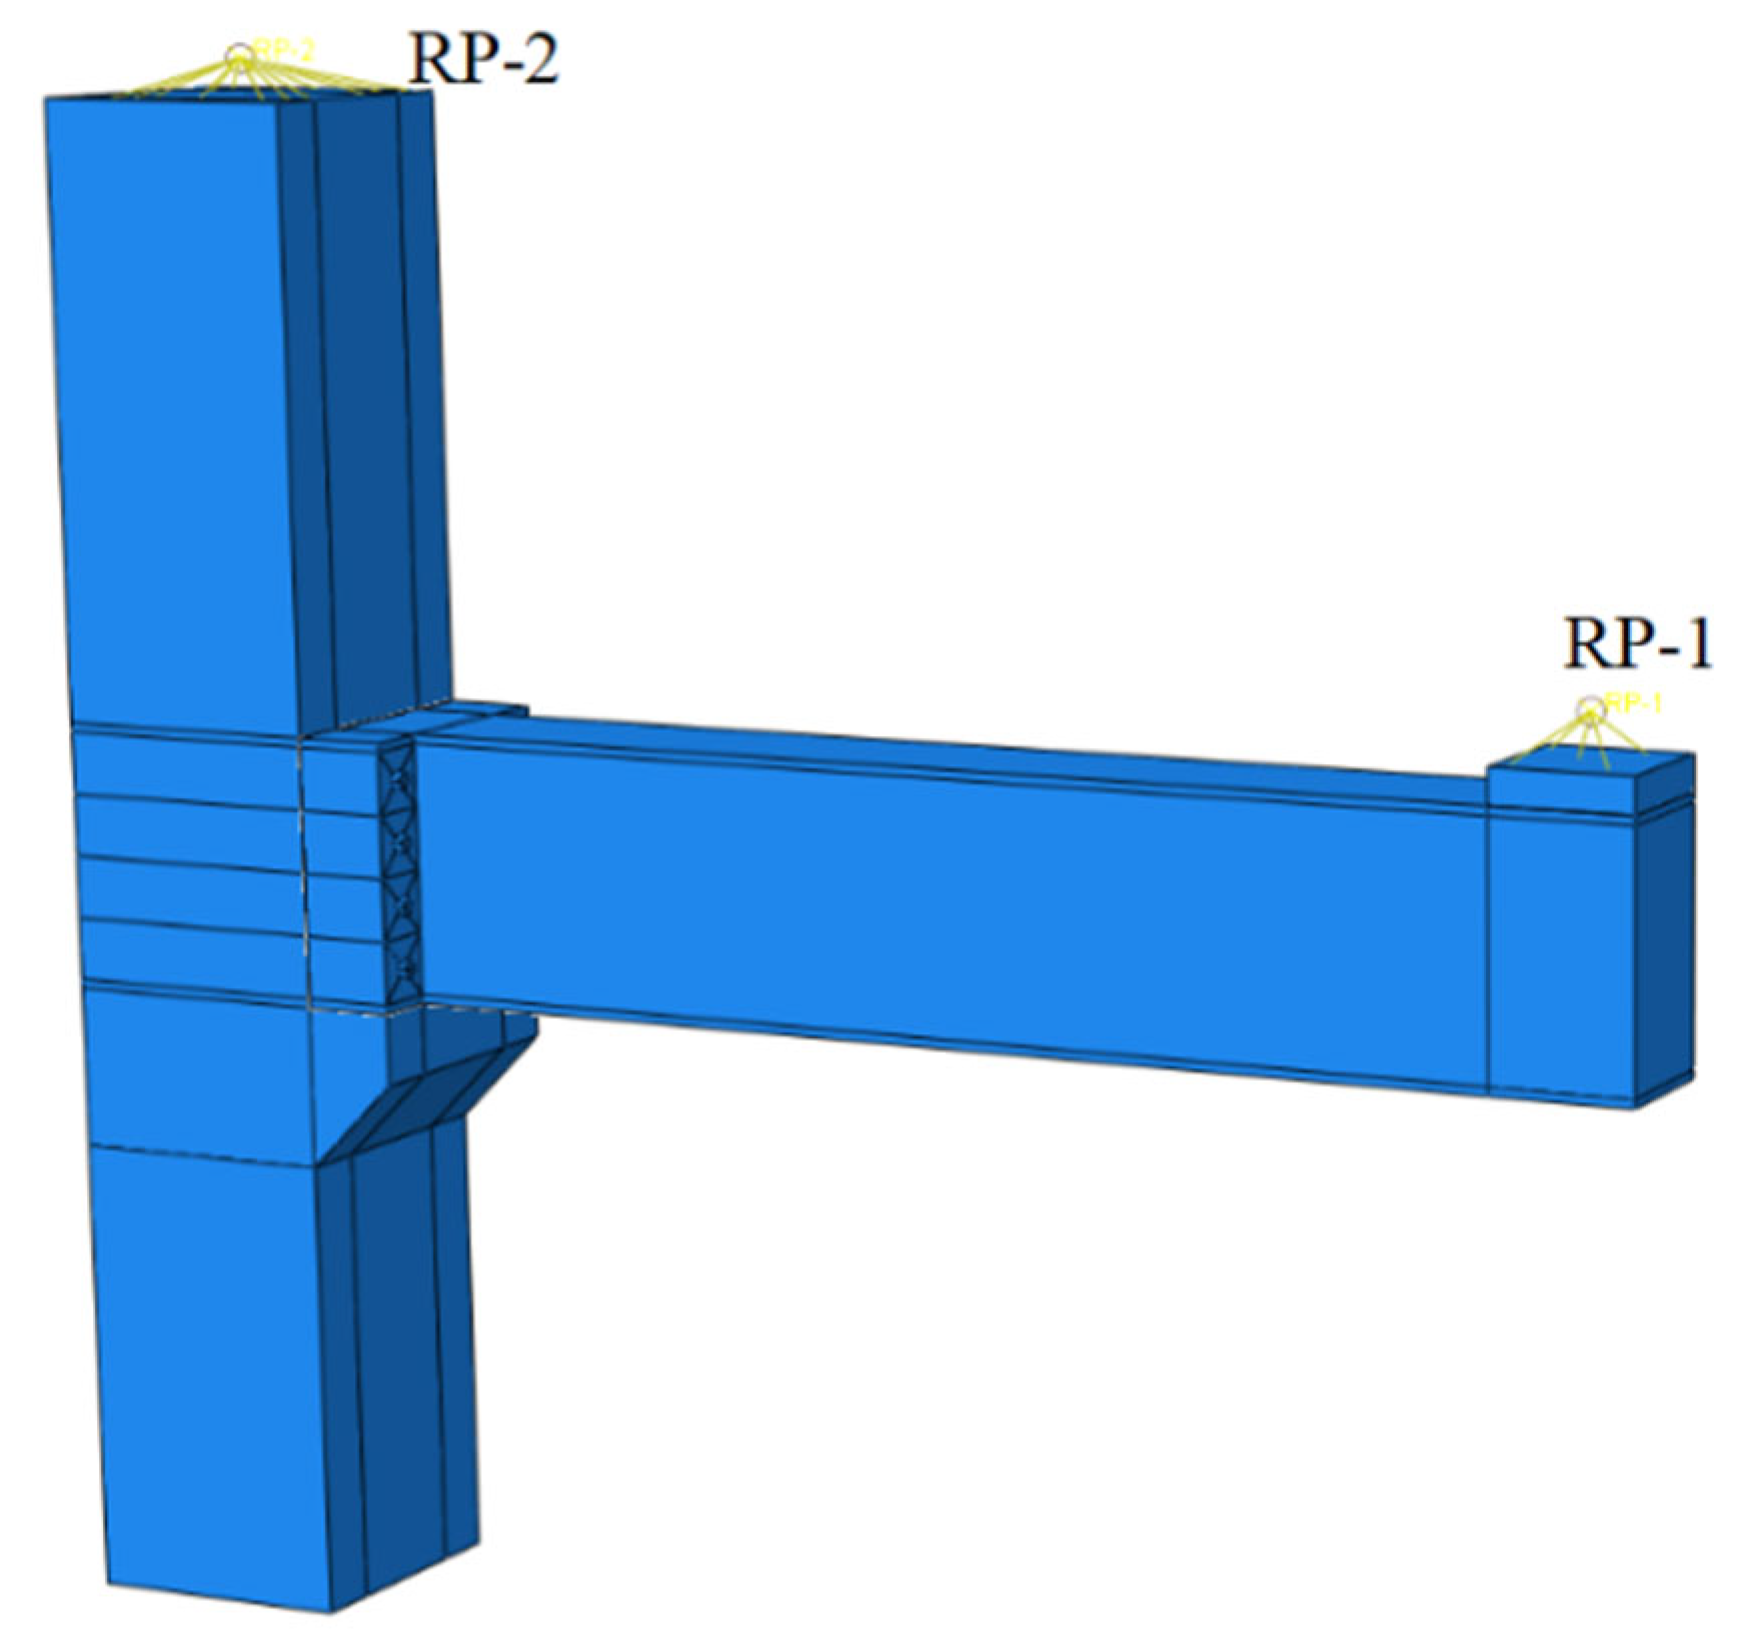
The coupling points RP1, RP2 and RP3 were established for the top of the column and the bottom of the beam, respectively, and the restraints and loads were set for these three coupling points according to the actual boundary conditions of the test (Figure 17). Displacement restraints in the x and z directions (ux = uz = 0) and rotation restraints in the x and z directions (δx = δz = 0) were set for the top of the column, and displacement restraints in the x, y and z directions (ux = uy = uz = 0) and rotation restraints the in x and z directions (δx = δz = 0) were set for the bottom of the column. According to the actual conditions of the test, a counter-axial pressure is applied at the coupling point at the top of the column and a low cyclic loading is applied at the coupling point at the end of the beam.

4.6. Validation of Finite Element Results

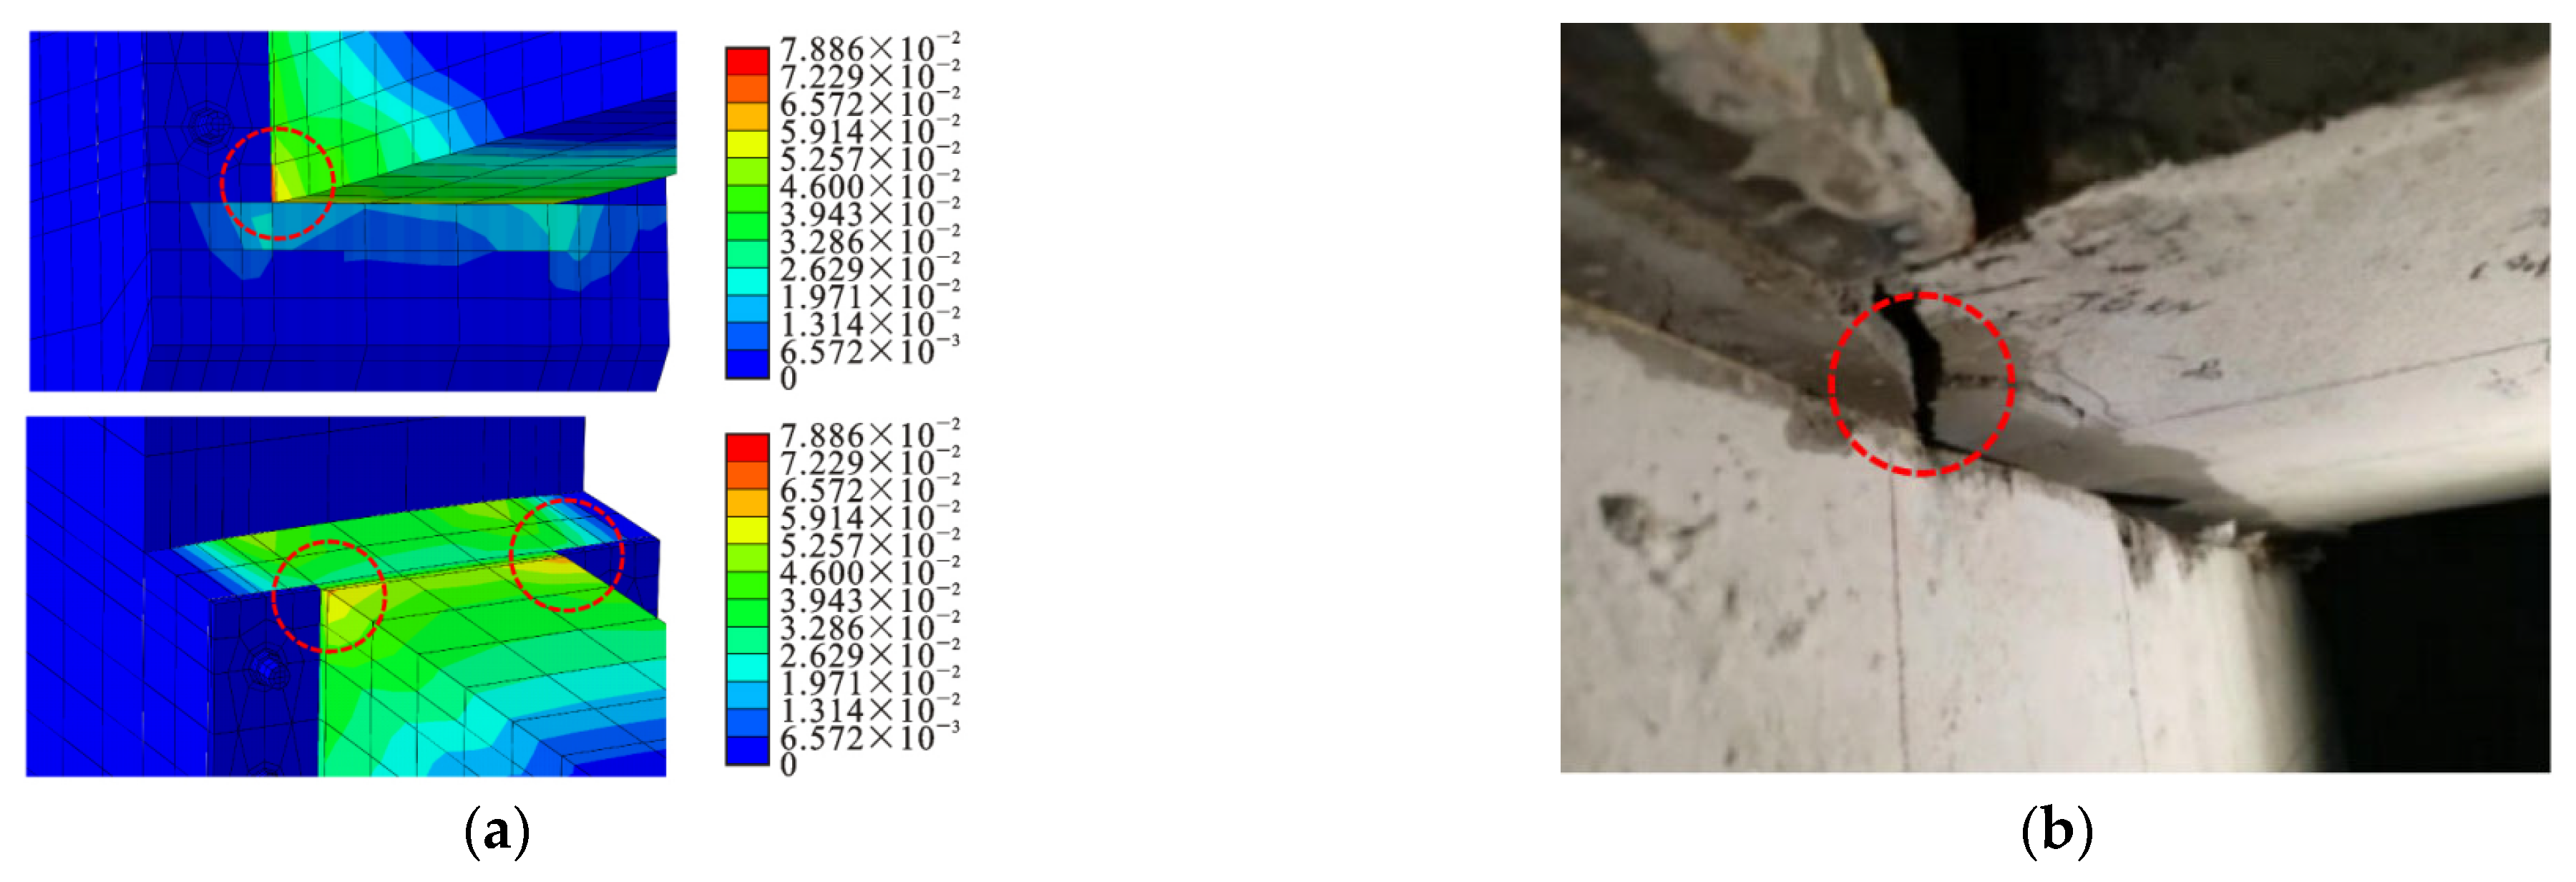
To verify the correctness of the finite element analysis, the simulation results of the ABAQUS finite element software for the S1 joint were compared with the experimental results, as shown in Figure 18. As can be seen from Figure 18, the hysteresis curves of both the simulation results and the test results are in good agreement. The finite element simulation results differ slightly from the test results, with the “pinch and shrink” effect of the test hysteresis curve being more pronounced than that of the finite element simulation, which is due to the bonded slip of the test member and the more desirable conditions of the finite element simulation, but the error between the two is relatively small. Figure 19 shows a comparison of the equivalent plastic strain cloud at test joint S1 from the finite element simulation and the test damage characteristics, with the top of the beam flange and the corbel bearing being the main areas of distribution, which is generally consistent with the test results. The above phenomenon shows that the finite element simulation can simulate the seismic performance of the joints very accurately, and therefore the proposed finite element modeling method can be used for further simulation analysis.

4.7. Hysteresis Performance

Figure 20 shows the hysteresis curves of the cast-in-place joint and the test joint S1 simulated based on ABAQUS finite element software. The load-carrying capacity of the cast-in-place joint is better than that of the S1 joint in the early stage of loading. With the increase in the displacement level, the load-carrying capacity of S1 is better than that of the cast-in-place joint in the middle of loading, but the hysteresis curve of the cast-in-place joint is fuller than that of the test joint. The above shows that the cast-in-place joint is better than the test joint in terms of energy dissipation capacity, but the ultimate load-carrying capacity of the test node is better than that of the cast-in-place joint, which proves that the joints have certain research significance.

4.8. Concrete Plastic Damage Model

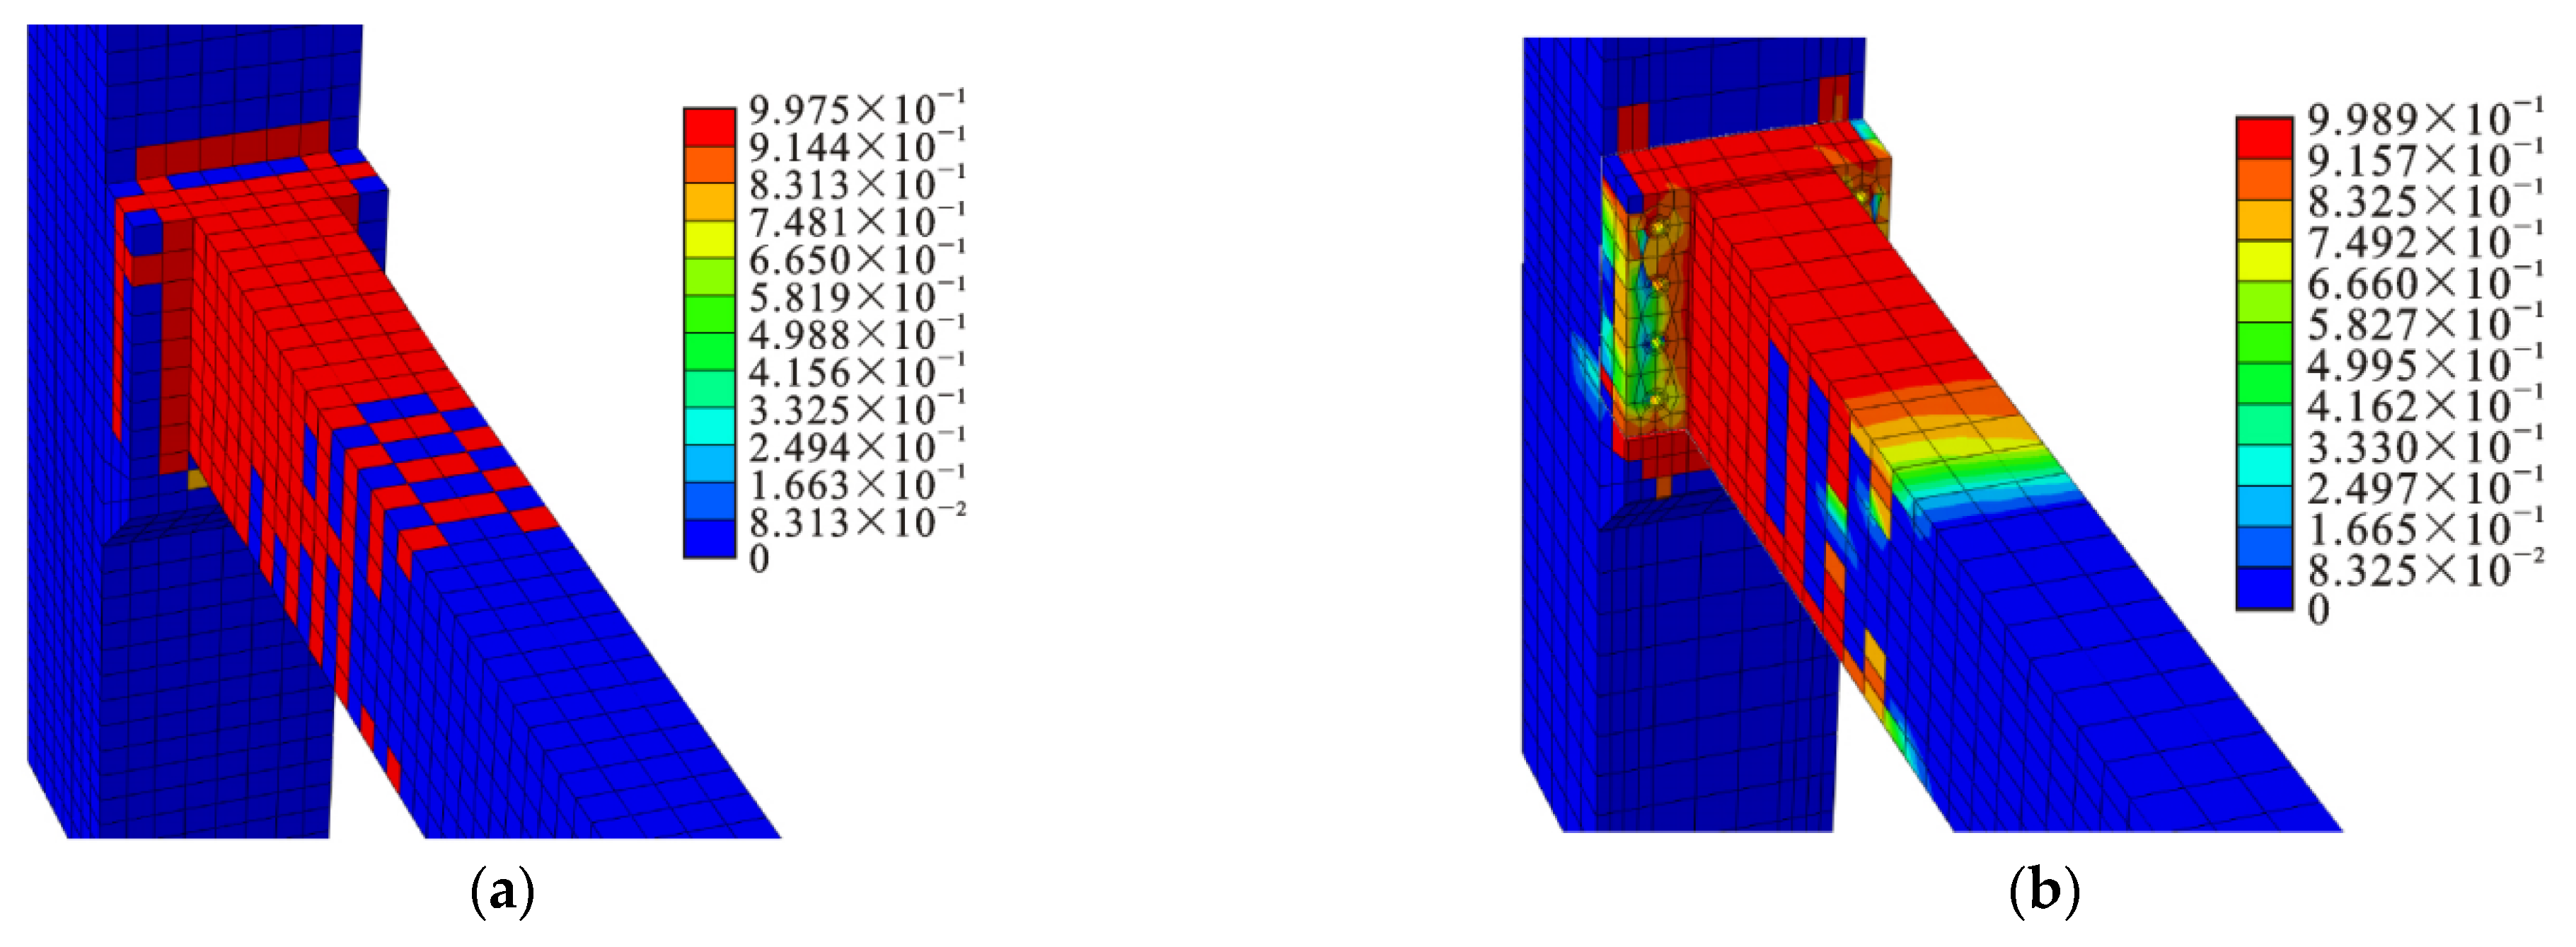
Figure 21 shows the concrete plastic damage model for the cast-in-place joint and the test joint S1 in the damage phase. From Figure 21, it can be seen that the concrete plastic damaged area of the test node is mainly concentrated in the joint core zone around the enlarged end of the precast beam and the bolt holes, which is consistent with the test results. Therefore, the plastic damage of concrete can be reduced by adding energy-dissipating angles to the upper end of the precast beam enlarged flange in practical engineering. Comparing the concrete plastic damage models of the cast-in-place joint and the test joint, it can be found that the test node has a non-uniform concentration of concrete plastic damage in the joint core zone due to the presence of bolt holes, while the concrete plastic damaged area of the cast-in-place joint is mainly concentrated in the enlarged end of the precast beam, and most of them are in the state of larger damage values (DAMAGET damage values are greater than 0.97).

5. Research on the Design Method of New Assembled Beam–Column Joints

The current Chinese standard design method upholds the design concepts of “strong columns and weak beams” and “strong joints and weak members” to ensure that the joints at the end of the beams can develop plastic hinges and have a certain rotation capacity to dissipate seismic energy. At the same time, the other members work properly and participate fully in the forces to ensure the safety and reliability of the building structure.

5.1. Calculation of Internal Forces in New Assembly Joints

5.1.1. Calculation of Internal Forces in Joints for Existing Standards

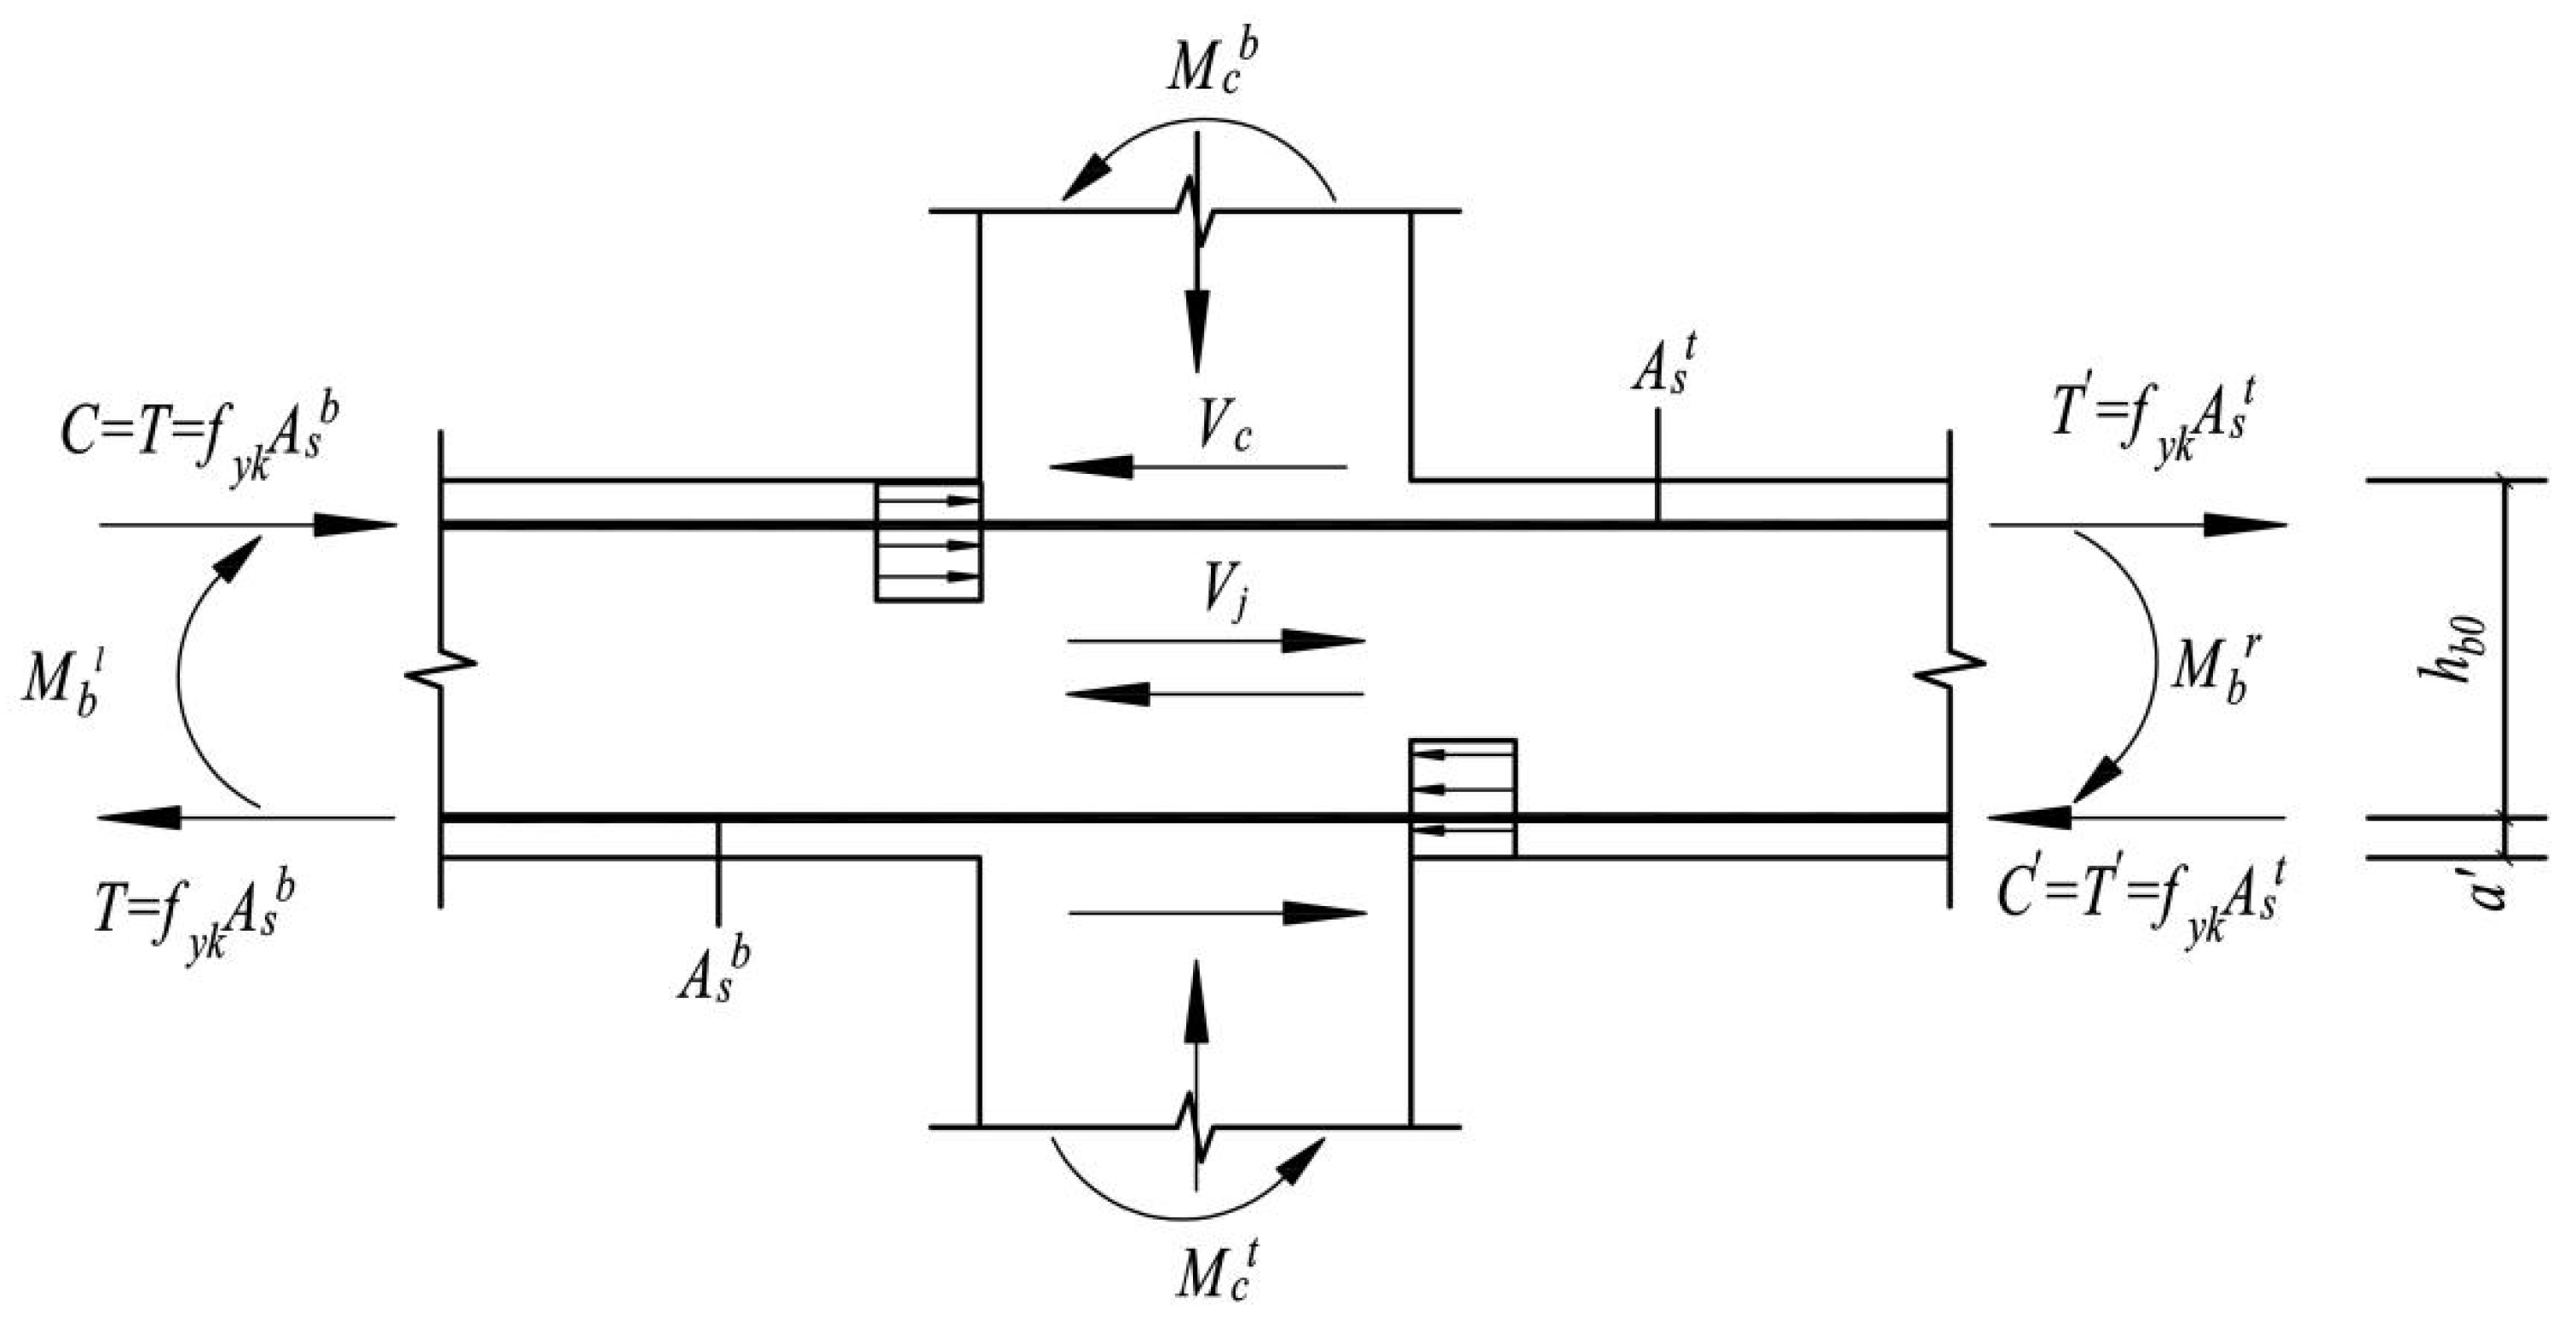
According to the seismic design concept of a strong core zone, the core zone should not shear yield when the reinforcement at the end of the beam yields, and the core zone shear force when the beam end section reaches the flexural bearing capacity is taken as its calculated shear force value. Taking the node as the isolated body analysis (see Figure 22 for the node core zone stress diagram), the support pressure at the top and bottom of the column produces a bending moment and shear force on the node core. When the height and stiffness of the upper and lower columns of the joint are the same, the bending moments at the upper and lower column ends are the same and the shear forces are of the same magnitude and in opposite directions. When the height and stiffness of the upper and lower columns of the joint are the same, the bending moments at the upper and lower column ends are the same and the shear forces are of the same magnitude and in opposite directions. According to the moment balance at the joint, the sum of the bending moment at the column end and the sum of the bending moment at the beam ends are equal in size and opposite in direction. At the same time, the core of the joint is subjected to the axial load of the column. It is known that the shear force in the core zone can be obtained from the equilibrium condition.
V j = ( f y k A s b + f y k A s t ) V c = M b l + M b r h b 0 a s ( 1 h b 0 a s H c h b )
where Vj is the shear force in the nodal core zone;
Vc is the support shear at the base of the column;
M b l is the value of the bending moment at the end of the beam to the left, and right of the joint;
M c b is bending moment value at the bottom, top of the column;
f y k is the standard value of tensile strength of reinforcement;
Hc isthe distance between the upper column and the lower column counter-bending point of the joint;
a s is the distance from the joint force point of the longitudinal reinforcement under compression in the beam to the near edge of the section;
hb0 is the effective height of the beam cross-section;
hb is the height of the beam section.
According to reference [30], the design values of the shear forces in the nodal core zone combinations of I, II and III level reinforced concrete frame beams and columns are determined according to the following equations:
V j 0 = η j b M b h b 0 a s ( 1 h b 0 a s H c h b )
where Vj0 is the design value of the shear force in the core zone of the joint;
∑Mb is the sum of the design values of the combined bending moments at the left and right beam ends of the joint in the counterclockwise or clockwise direction; when the left and right beam ends of a Class I seismic-rated frame joint have negative bending moments, the smaller absolute value of the bending moment is taken as 0;
η j b is the node shear force increase coefficient; for frame concrete structure, seismic grade I is 1.50, grade II is 1.35 and grade III is 1.20; for frames in other structures, grade I is 1.35, grade II is 1.20 and grade III is 1.10.

5.1.2. Requirements to Prevent Oblique Compression Damage in the Nodal Core Zone

Reference [30] specifies that the shear horizontal section in the core zone of a framed concrete beam–column joint should conform to:
V j 0 1 γ R E ( 0.3 η j β c f c b j h j )
where, γ R E is the seismic adjustment factor for load-bearing capacity;
h j is the height of the cross-section of the core zone of the frame joint, which can be taken as the height of the column cross-section in the direction of verification hc;
b j is the effective check width of the section in the core zone of the frame joint; when b b is not less than b c /2, it is taken as b c ; when b b is less than b c /2, it is taken as the smaller of ( b b + 0.5 h c ) and b c ; when the midline of the beam and column do not coincide and the eccentricity distance e 0 is not greater than b c /4, it is taken as the smallest of ( b b + 0.5 h c ), (0.5 b b + 0.5 b c + 0.25 h c e 0 ) and b c . Here, b b is the width of the beam section in the direction of verification and b c is the width of the side column section in the direction of verification;
η j is the coefficient of influence of orthogonal beams on the joint constraint: when the floor slab is cast-in-place, the center line of the beam and column coincide, the width of the beam section on all four sides is not less than 1/2 of the width of the column section on that side, and the height of the beam in the orthogonal direction is not less than 3/4 of the height of the higher frame beam, η j is taken as 1.50 but for 9 degrees of fortification intensity, η j is taken as 1.25. When the above conditions are not met, η j is taken as 1.00.

5.1.3. Shear Bearing Capacity Check of the Nodal Core Zone

Reference [31] requires that the seismic shear bearing capacity of framed beam–column joints should comply with:
V j 0 1 γ R E ( 1.1 η j f t b j h j ) + 0.05 η j N b j b c + f y v A s v j h b 0 α c s
where N is the base axial force design value of the column at the joint corresponding to the design value of the combined seismic shear force considered; when N is pressure, it is the smaller of the axial pressure design values and is 0.5fcbchc when N is greater than 0.5fcbchc; when N is tension, it is 0;
A s v j is the full cross-sectional area of each limb of the hoop reinforcement in the same cross-sectional check direction, within the valid check width of the core zone;
h b 0 is the effective height of the frame beam section, taken as the average value when the height of the beam section on both sides of the joint is not equal.

5.2. New Assembled Beam–Column Joint Design Method

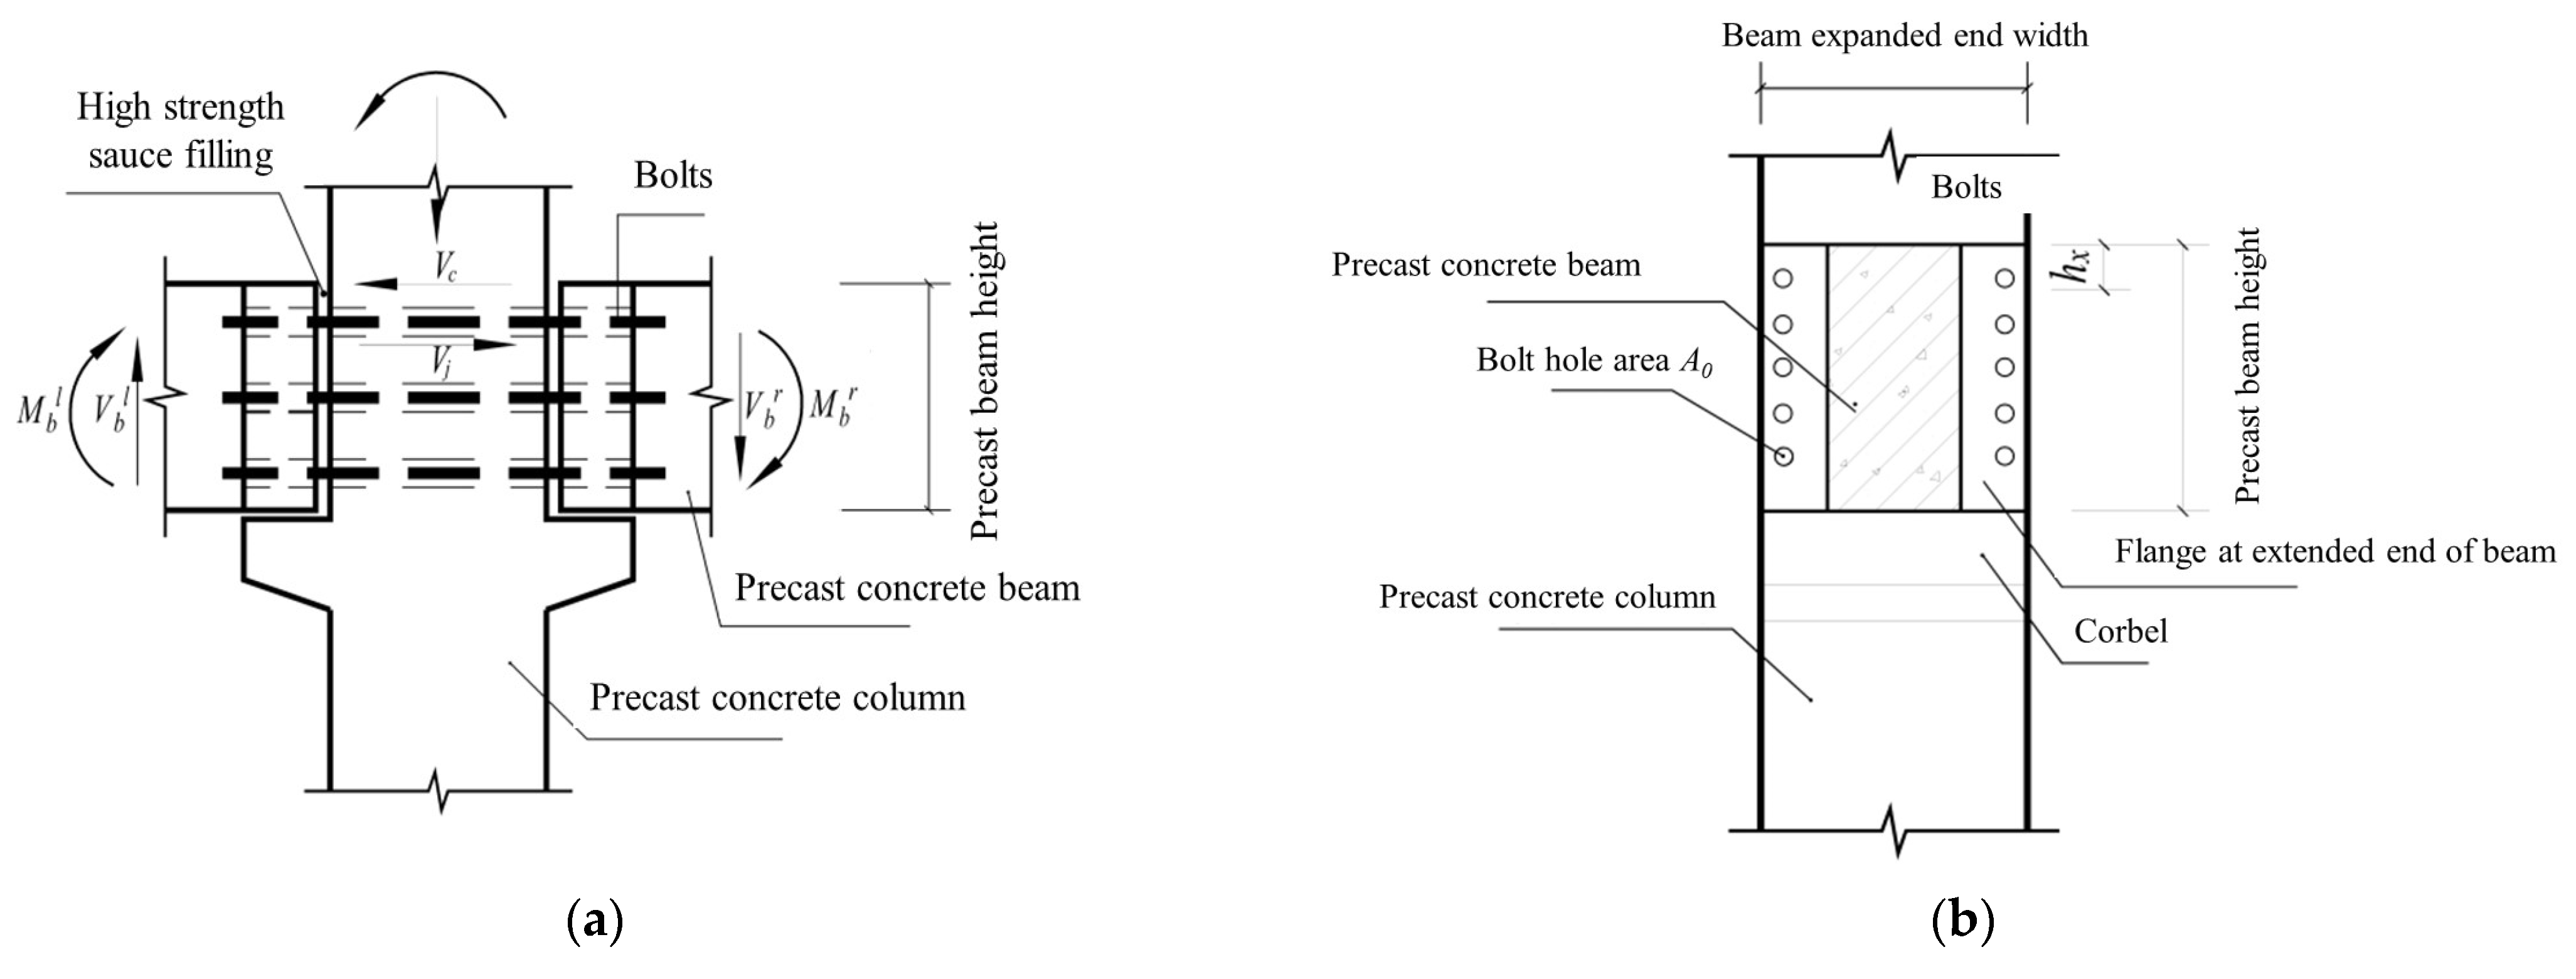
As the new assembled beam–column joints in this paper are composed of precast concrete beams and precast concrete columns with corbels, connected with bolts, they are fully assembled concrete beam–column joints with dry connections, which are more energy-efficient, environmentally friendly and convenient to install, and play a role in the transmission of bending moments, shear forces and axial forces in the structure. According to the tests and finite element numerical analysis in this paper, it is found that the force characteristics of the new assembled beam–column joints are different from those of the existing assembled integral concrete frames, but are instead close to the mechanical characteristics of the semi-rigid beam–column joints of steel structures, with simple force forms and clear transmission of forces, with the shear forces of the joints being carried by the corbel and the bending moments being carried by the bolts. The details are shown in Figure 23.
The stress state of this beam–column joint is divided into 2 types:
(1)
A rigid connection state, in which, during the stress process, the beam end and the column are in close contact without separation. Due to the reaction force between the precast concrete beam end on the precast concrete column, extrusion occurs and there is compressive stress between the two.
(2)
A semi-rigid connection state, in which, under the action of the bending moment, the bolt deformation increases, which makes the beam end and the column have a tendency to separate, and the compression force between the upper part of the two is 0.

5.2.1. Node Rigid Connection State

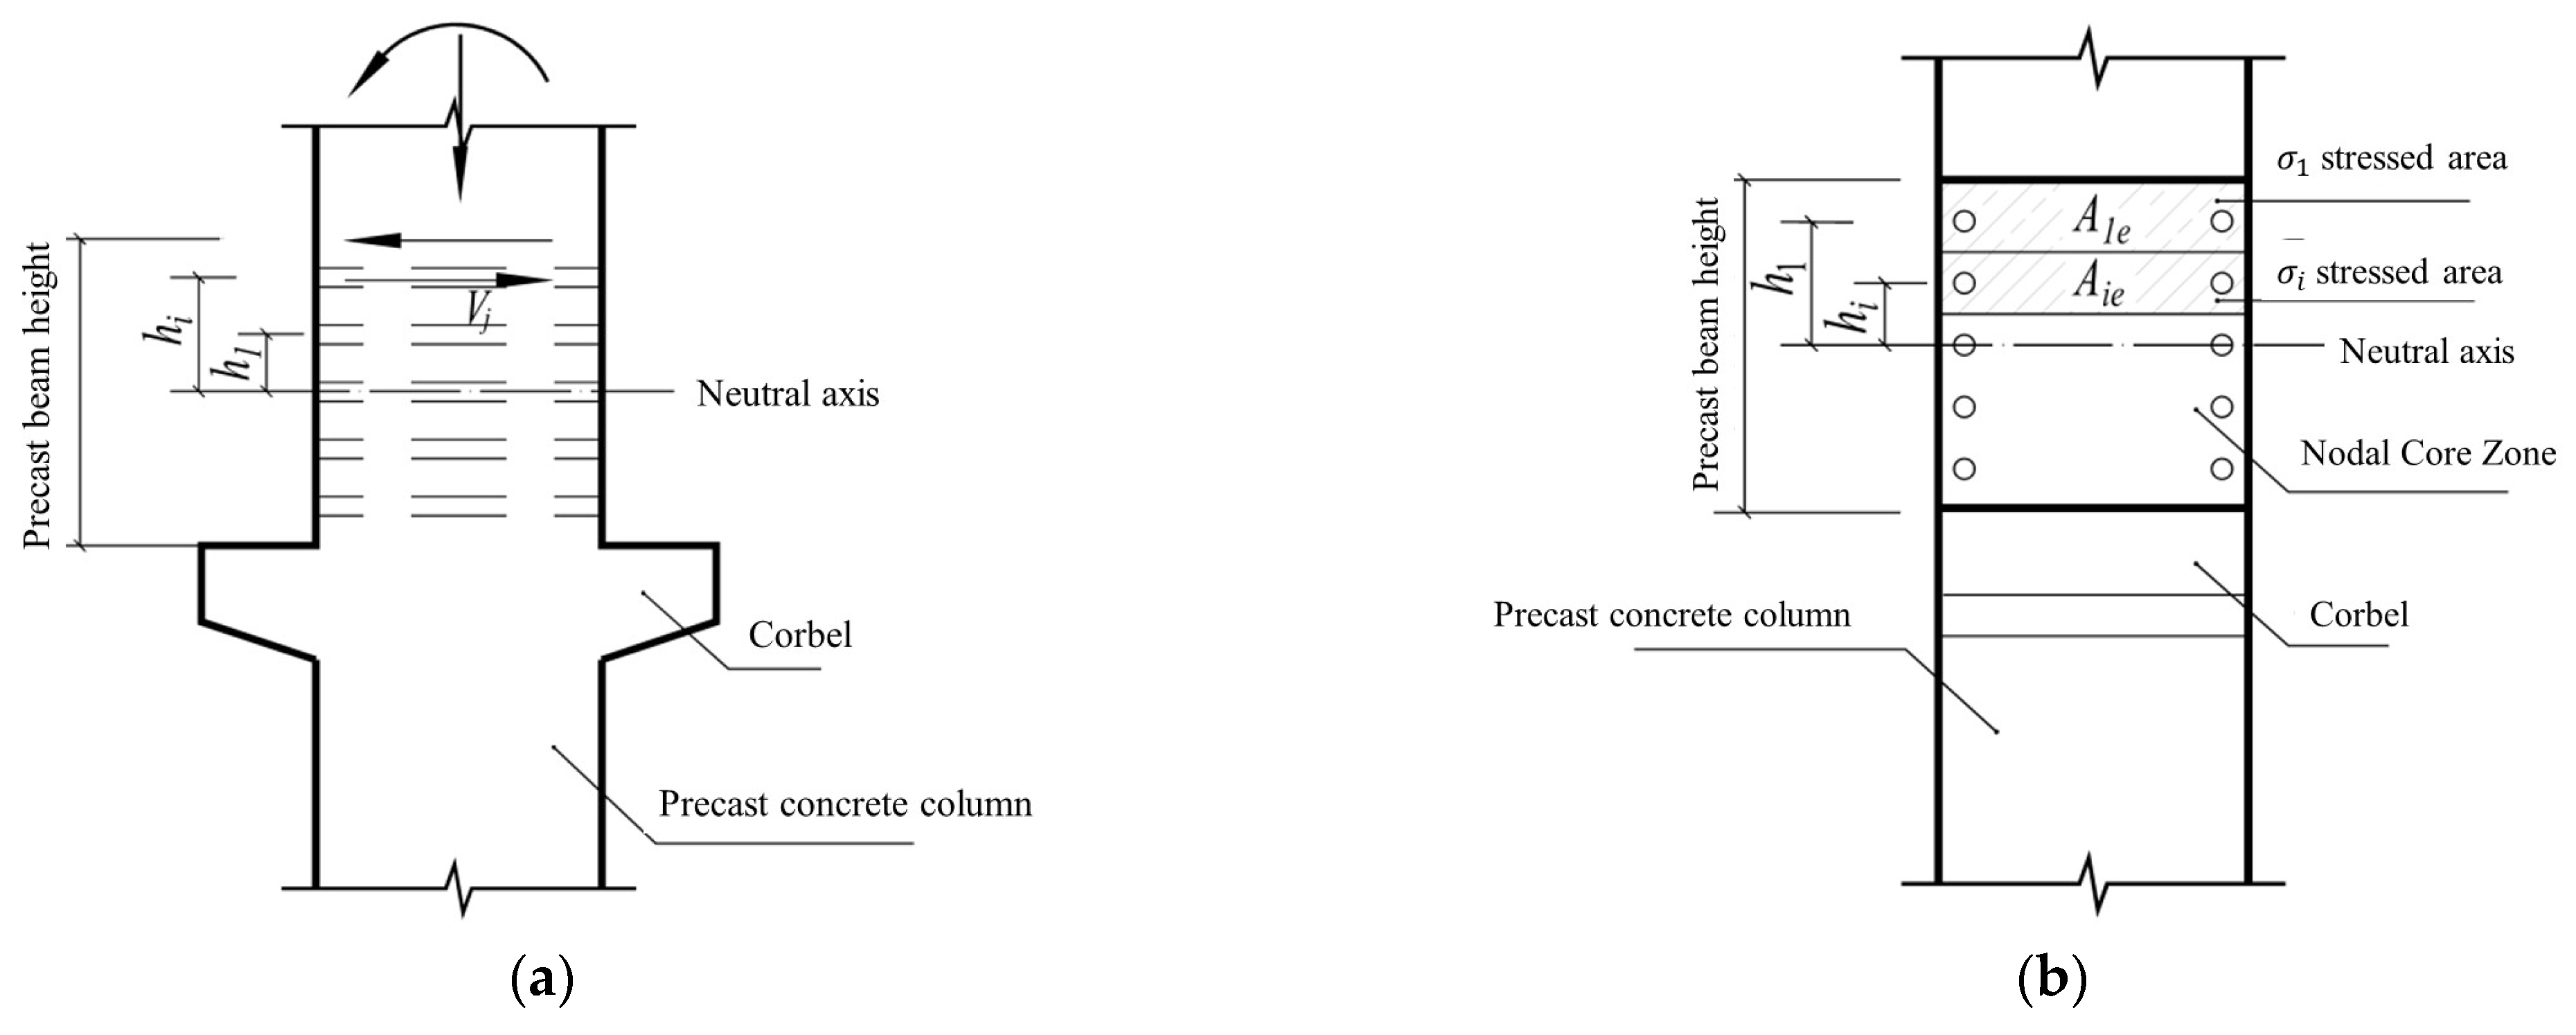
According to the test and references [44,45], it is known that the node rigid connection bolts are generally high-strength bolts. They apply preload so that the precast beams and columns at the joint do not separate during the stressing process, and there is compressive stress, thus forming a rigid joint. Referring to the bending characteristics of high-strength bolts with preload applied in “Principles of Steel Construction” [46], it is known that the position of the high-strength bolt group in an axis is in the position of the bolt group shape center (see Figure 24).
The mechanical analysis is calculated by taking the right unilateral beam end of the rigid connection joint. As can be seen from Figure 25, the vertical shear force at the beam end is carried by the corbel, and the bolt only carries the bending moment, using the mechanical model of the high-strength bolt subjected to bending in steel structures.
Establishing the equation of equilibrium for the bending moment at the neutral axis, it follows:
N 1 h 1 = N 2 h 2 = N i h i = N n h n
M = m ( N i / h i ) i = 1 n h i 2
From Equations (17) and (18), the forces on the individual bolts in row i under the bending moment are:
N i = M h i m h i 2
where N i is the force in the ith row of individual bolts under the action of the bending moment;
hi is the distance from the ith row of bolts to the neutral axis;
M is the bending moment at the end of the joint beam;
m is the number of bolt rows.
Since the bolt holes are hollow, the bolts are tension bolts. After applying a preload force Nd before the node is subjected to external forces, the initial internal force of the individual bolts is Nd. The compressive stress at the contact surface of the beam and column within the force range of the ith row of bolts is:
σ i l o r σ i r = m ( N d N i l ) A i e o r m ( N d N i r ) A i e
where σ i l , σ i l are the average stress between the left and right beam ends and columns, respectively, in the force range of the ith row of bolts;
Nd is the preload force of the high-strength bolts, as detailed in “Principles of Steel Construction” [46];
N i l , N i r are theforce at the left and right ends, respectively, of the individual bolt joints in row i under the action of bending moments;
A i e is the core zone net area of the cross-section of the force range of the ith row of bolts (see Figure 24); A i e   = AimA0;
Ai is a cross-section of the core zone of the stress range of the ith row of bolts;
A0 is the cross-sectional area of the individual bolt holes.
Figure 24 shows that the calculated value of the shear force Vj in the nodal core zone of the upper ith row of bolts can be obtained according to the principle of force balance.
V j = V c + i = 1 n σ i r A i e i = 1 n σ i l A i e
Drawing on Equation (14) for the nodal core zone shear calculation to increase the increase factor, the design value V0j for the shear in the core zone of a rigid joint can be obtained.
V 0 j = η j b V j = η j b ( V c + i = 1 n σ i r A i e i = 1 n σ i l A i e )

5.2.2. Semi-Rigid Connection of Joints

As the semi-rigid connection is under a negative bending moment, the neutral axis of the bolt group is at the top surface of the corbel, the bolt deformation is larger and the upper part between the beam end and the column is separated under the ultimate load, then the squeezing pressure in this part is 0. The calculated value of the node core zone shear force can be obtained.
V j = V c
Similarly, the design value V0j of the shear force in the core zone of the semi-rigid joint can be obtained.
V 0 j = η j b V j = η j b V c
Therefore, as the core zone of the new assembled beam–column joint does not carry the shear forces generated by the loads on the beam (the shear forces are carried by the corbel, which is designed according to the calculation method of the “Code for the Design of Concrete Structures”), the verification of the core zone of the joint can be carried out in two steps.
The first step is to determine whether the joint is a rigid or semi-rigid connection; if it is a rigid connection (generally a high-strength bolt connection with preload applied), the design value of the core zone shear is calculated following Equation (22); if it is a semi-rigid joint, the design value of the core zone shear is calculated following Equation (24).
In the second step, according to the calculation method for cast-in-place concrete joints, Equations (15) and (16) (where the shear surface is taken as the net cross-sectional area) are used to verify whether the shear-bearing capacity of the joint core zone meets the requirements, to complete the calculation and design of the new assembled beam–column joints.

6. Conclusions

In this paper, aiming at the technical difficulties existing in the dry joints of assembled frame concrete structures, a new type of bolted assembled concrete beam–column joint is innovatively proposed, and the low-cycle cyclic loading test and numerical simulation of the joints are systematically carried out. On this basis, the calculation and design methods of this type of joint are put forward, and the research results have important basic theoretical significance and engineering application value. The main conclusions of this paper are as follows:
(1)
The two new joints have good seismic performance and energy dissipation performance, the bolts and precast beams are the main load-bearing elements, and the new joints can be repaired by replacing the bolts and precast beams, meeting the seismic design concepts of “strong columns and weak beams” and “strong joints and weak elements”.
(2)
The hysteresis curves of the two new joints are bowed, and the hysteresis curves are generally smooth and full, with a large hysteresis loop area, indicating that the new joints have a strong energy dissipation capacity. The hysteresis curves of both joints show an obvious “pinching” phenomenon under the action of low cyclic loads, which is caused by the relative slip between the bolts and the bolt holes, which also makes the energy dissipation capacity of the two joints not fully developed.
(3)
The diameter of the connecting bolt has an effect on the seismic performance of the new joint. S2 increases the yield load by 39.4%, the ultimate load by 11.5% and the damage load by 13.2% compared to S1. This shows that when the bolt diameter increases, the yield load capacity and ultimate load capacity of the joint will increase.
(4)
According to the stiffness degradation curve, the rate of stiffness degradation of S2 at each displacement stage is slightly less than that of specimen S1, and the stiffness at each displacement stage is greater than that of specimen S1, indicating that increasing the bolt diameter reduces the node stiffness degradation rate.
(5)
The test joint is inferior to the cast-in-place joint in terms of energy consumption capacity, but superior to the cast-in-place joint in terms of load-bearing capacity. The presence of the explicit corbel solves the problems of accuracy and assembly efficiency of the bolted joint installation, while also avoiding the additional costs associated with temporary supports.
(6)
Based on the experimental and numerical simulation of the force characteristics of the nodal core zone, a nodal core zone mechanical analysis model of the new assembled concrete beam–column joint is proposed, and the nodal core zone shear force calculation formulae of the new assembled concrete beam–column rigid joints and semi-rigid joints are derived.

Author Contributions

Conceptualization, J.L., D.Y. and Y.L.; methodology, J.L. and Y.L.; software, J.L. and D.Y.; validation, J.L., D.Y. and Y.L.; formal analysis, Y.L.; investigation, J.L.; resources, Y.L.; data curation, D.Y.; writing—original draft preparation, J.L.; writing—review and editing, Y.L., J.L. and D.Y.; visualization, Y.L. and D.Y.; project administration, Y.L. and D.Y.; funding acquisition, Y.L. and D.Y. All authors have read and agreed to the published version of the manuscript.

Funding

This research was funded by Anhui Provincial Universities Natural Science Research Project, grant number KJ2020ZD43; Anhui Provincial Natural Science Foundation Project, grant number 1908085ME144; Shandong Province Key R&D Program (Major Science and Technology Innovation Project), grant number 2021CXGC011204; and Natural Science Foundation of Shandong Province, grant number ZR2020ME246.

Conflicts of Interest

The authors declare no conflict of interest.

References

  1. Zheng, C.; Ge, B.W. Research on Assembled Building Structure in Farmland Amland Hydraulic Structure. Fresen. Environ. Bull. 2020, 29, 4430–4436. [Google Scholar]
  2. Shu, X.; He, R.; Zhang, Z.; Yao, Y.; Leonard, J. Experimental Study on the Mechanical Properties of a New Long-Span Prefabricated Truss Composite Floor System. Rev. DYNA 2019, 94, 189–196. [Google Scholar] [CrossRef] [PubMed] [Green Version]
  3. Cao, X.Y.; Feng, D.C.; Wang, Z.; Wu, W. Parametric investigation of the assembled bolt-connected buckling-restrained brace and performance evaluation of its application into the structural retrofit. J. Build. Eng. 2022, 48, 103998. [Google Scholar] [CrossRef]
  4. The Journal. The accelerated development of assembled buildings. Architectural 2022, 10, 14–17. (In Chinese) [Google Scholar]
  5. Pantelides, C.P.; Hansen, J.; Ameli, M.J.; Reaveley, L.D. Seismic performance of reinforced concrete building exterior joints with substandard details. J. Struct. Integr. Main. 2017, 2, 34–47. [Google Scholar] [CrossRef]
  6. Nzabonimpa, J.D.; Hong, W.K.; Kim, J. Nonlinear finite element model for the novel mechanical beam-column joints of precast concrete-based frame. Comput. Struct. 2017, 189, 31–48. [Google Scholar] [CrossRef]
  7. Bruno, D.L.; Paolo, N.; Alberto, D.L. Seismic design and performance of dry-assembled precast structures with adaptable joints. Soil. Dyn. Earthq. Eng. 2018, 106, 182–195. [Google Scholar] [CrossRef]
  8. Pan, Z.H.; Si, Q.; Zhou, Z.B.; Zhang, Y.B.; Zhu, Y.Z.; Chen, X.D. Experimental and numerical investigations of seismic performance of hybrid joints with bolted connections. J. Constr. Steel. Res. 2017, 138, 867–886. [Google Scholar] [CrossRef]
  9. Ding, K.W.; Liu, J.H.; Ma, W.; Liu, Y.L. Experimental study on the seismic performance of new assembled semi-rigid joints. China Civ. Eng. J. 2021, 54, 1–7, 56. (In Chinese) [Google Scholar] [CrossRef]
  10. Ding, K.W.; Liu, J.H.; Ren, J.W.; Ma, W. Dynamic Responses of Cellular Metal-Filled Steel Beam-Column Joint under Impact Loading. J. Shanghai Jiaotong Univ. Sci. 2020, 25, 384–393. [Google Scholar] [CrossRef]
  11. Ding, K.W.; Zong, D.; Liu, Y.L.; He, S.L.; Shen, W.Y. Experimental and Finite Element Analysis of ALC Panel Steel Frames with New Semi-Rigid External Connector. Appl. Sci. 2021, 11, 1099. [Google Scholar] [CrossRef]
  12. Ding, K.W.; Ye, Y.; Ma, W. Seismic performance of precast concrete beam-column joint based on the bolt connection. Eng. Struct. 2021, 232, 111884. [Google Scholar] [CrossRef]
  13. Zhang, Y.; Ding, K.W. Study on seismic behavior of fabricated beam-column bolted joint. Struct. Eng. Mech. 2022, 82, 801–812. [Google Scholar] [CrossRef]
  14. Guan, D.Z.; Tian, W.H.; Chen, Z.X.; Liu, J.B.; Guo, Z.X. Research on the seismic performance of assembled concrete beam-column connections based on UHPC shells. China Civ. Eng. J. 2022, 1–7. (In Chinese) [Google Scholar] [CrossRef]
  15. Fan, W.; Su, H.X.; He, Y.B.; Sun, W.B.; Shao, X.D. Experimental investigation on UHPC-based gravity-type half-grouted sleeve connections under tensile and cyclic loadings. J. Build. Eng. 2022, 61, 105284. [Google Scholar] [CrossRef]
  16. Zhang, Z.Y.; Ding, R.; Nie, X.; Fan, J.S. Seismic performance of a novel interior precast concrete beam-column joint using ultra-high performance concrete. Eng. Struct. 2020, 222, 111145. [Google Scholar] [CrossRef]
  17. Xiong, X.Y.; Xie, Y.F.; Yao, G.F.; Liu, J.; Yan, L.Z.; He, L. Experimental Study on Seismic Performance of Precast Pretensioned Prestressed Concrete Beam-Column Interior Joints Using UHPC for Connection. Materials 2022, 15, 5791. [Google Scholar] [CrossRef]
  18. Tang, L.; Tian, W.H.; Guan, D.Z.; Chen, Z.X. Experimental Study of Emulative Precast Concrete Beam-to-Column Connections Locally Reinforced by U-Shaped UHPC Shells. Materials 2022, 15, 4066. [Google Scholar] [CrossRef]
  19. Wang, H.S.; Marino, E.M.; Hang, P.P.; Nie, L.X. Experimental study of a novel precast prestressed reinforced concrete beam-to-column joint. Eng. Struct. 2018, 156, 68–81. [Google Scholar] [CrossRef]
  20. Kim, S.K.; Kim, J.M.; Hong, W.K. Material nonlinear finite element analysis of hybrid hollow concrete beams encasing steel sections. Structure 2020, 25, 500–519. [Google Scholar] [CrossRef]
  21. Yang, T.Y.; Dashlejeh, A.A.; Arabzadeh, A.; Hizaji, R. New model for prediction of ultimate load of prestressed RC deep beams. Structure 2020, 23, 509–527. [Google Scholar] [CrossRef]
  22. Oliveira, J.L.A.; Araújo, D.L.; El Debs, M.K.; Diógenes, H.J.F. Precast Beam–Column Connection Subjected to Cyclic and Dynamic Loadings. Struct. Eng. Int. 2018, 27, 114–126. [Google Scholar] [CrossRef]
  23. Dai, E.-L.; Jin, G.-J.; Dai, S.-P. Study on the application of C80 high strength and high performance pumped concrete in practical engineering. Concrete 2013, 1, 97–101, 104. (In Chinese) [Google Scholar]
  24. Liu, Y.L.; Zhu, S.T. Finite element analysis on the seismic behavior of side joint of a Prefabricated Cage System in a prefabricated concrete frame. Front. Struct. Civ. Eng. 2019, 13, 1095–1104. [Google Scholar] [CrossRef]
  25. Liu, Y.L.; Liu, C.; Pan, H.; Fu, J.L.; Huang, J.Q.; Hong, J.Q. Experimental and numerical investigation on seismic performance of a semi-precast concrete sandwich shear wall. Adv. Struct. Eng. 2022, 25, 2772–2784. [Google Scholar] [CrossRef]
  26. Liu, Y.L.; Huang, J.Q.; Chong, X.; Ye, X.G. Experimental investigation on flexural performance of semi-precast reinforced concrete one-way slab with joint. Struct. Concrete 2021, 22, 2243–2257. [Google Scholar] [CrossRef]
  27. Du, H.X.; Zhang, M.L. Experimental investigation of thermal pore pressure in reinforced C80 high-performance concrete slabs at elevated temperatures. Constr. Build. Mater. 2020, 260, 120451. [Google Scholar] [CrossRef]
  28. Lohaus, L.; Oneschkow, N.; Wefer, M. Design model for the fatigue behavior of normal-strength, high-strength and ultra-high-strength concrete. Struct. Concrete 2012, 3, 189–192. [Google Scholar]
  29. Wu, H.M.; Shen, B.; Ma, K.J.; Xuan, D.X. Assessment of mechanical properties of C80 concrete prepared with different stone powder contents by a statistical analysis. J. Build. Eng. 2022, 56. [Google Scholar] [CrossRef]
  30. GB50010-2010 (2015 Edition); Code for the Design of Concrete Structures. Ministry of Construction of the People’s Republic of China: Beijing, China, 2015. (In Chinese)
  31. GB50010-2010 (2016 Edition); Code for Seismic Resistance of Building Structures. China Construction Industry Press: Beijing, China, 2016. (In Chinese)
  32. JGJ55-2011; Specification for the Design of Ordinary Concrete Proportions. China Construction Industry Press: Beijing, China, 2011. (In Chinese)
  33. El-Sabbagh, A.; Sharaf, T.; Nagy, S.; El-Ghandour, M. Behavior of extended end-plate bolted connections subjected to monotonic and cyclic loads. Eng. Struct. 2019, 190, 142–159. [Google Scholar] [CrossRef]
  34. Liu, Y.B.; Guo, Z.; Ding, J.H.; Wang, X.G.; Liu, Y. Experimental study on seismic behaviour of plug-in assembly concrete beam-column connections. Eng. Struct. 2020, 211, 111049. [Google Scholar] [CrossRef]
  35. Brunesia, E.; Nascimbeneb, R.; Rassatic, G.A. Response of partially-restrained bolted beam-to-column connections under cyclic loads. J. Constr. Steel Res. 2014, 97, 24–38. [Google Scholar] [CrossRef]
  36. Zhou, Y.; Hu, X.; Pei, E.L.; Hwang, H.G.; Chen, T.P.; Yi, W.G.; Deng, L. Dynamic load test on progressive collapse resistance of fully assembled precast concrete frame structures. Eng. Struct. 2020, 2014, 110675. [Google Scholar] [CrossRef]
  37. Aksoylu, C.; Özkılıç, Y.O.; Arslan, M.H. Damages on prefabricated concrete dapped-end purlins due to snow loads and a novel reinforcement detail. Eng. Struct. 2020, 225, 111–225. [Google Scholar] [CrossRef]
  38. Özkılıç, Y.O.; Aksoylu, C.; Arslan, M.H. Experimental and numerical investigations of steel fiber reinforced concrete dapped-end purlins. J. Build. Eng. 2021, 36, 10499. [Google Scholar] [CrossRef]
  39. Özkılıç, Y.O.; Yazman, Ş.; Aksoylu, C.; Arslan, M.H.; Gemi, L. Numerical investigation of the parameters influencing the behavior of dapped end prefabricated concrete purlins with and without CFRP strengthening. Constr. Build. Mater. 2021, 275, 122–173. [Google Scholar] [CrossRef]
  40. Özkılıç, Y.O.; Aksoylu, C.; Arslan, M.H. Numerical evaluation of effects of shear span, stirrup spacing and angle of stirrup on reinforced concrete beam behaviour. Struct. Eng. Mech. Int. J. 2021, 79, 309–326. [Google Scholar]
  41. Yasin, O.O.; Ceyhun, A.; Şakir, Y.; Lokman, G.; Musa, H.A. Behavior of CFRP-strengthened RC beams with circular web openings in shear zones: Numerical study. Structure 2022, 41, 1369–1389. [Google Scholar]
  42. Aksoylu, C.; Özkılıç, Y.O.; Yazman, Ş.; Gemi, L.; Arslan, M. İnceltilmiş Uçlu Önüretimli Aşık Kirişlerinin Yük Taşıma Kapasitelerinin Deneysel ve Numerik Olarak İrdelenmesi ve Çözüm Önerileri. Teknik Dergi. 2021, 32, 10823–10858. [Google Scholar]
  43. Wu, C.X.; Zhou, Y.; Zhang, C.; Deng, X.S.; Lai, W.S. Experimental study on the seismic performance of cast-in-place and precast assembled frame beam-column assemblies with the deployment of dampers. J. Build. Struct. 2015, 33, 61–68. (In Chinese) [Google Scholar]
  44. Mi, S.K. Application Analysis of a New Type of Assembled Concrete Frame Joints; Anhui Jianzhu University: Hefei, China, 2020. (In Chinese) [Google Scholar]
  45. Gemi, L.; Madenci, E.; Özkılıç, Y.O. Experimental, analytical and numerical investigation of pultruded GFRP composite beams infilled with hybrid FRP reinforced concrete. Eng. Struct. 2021, 244, 103699. [Google Scholar] [CrossRef]
  46. Yao, Z.; Xia, Z.B. Principles of Steel Construction; China Construction Industry Press: Beijing, China, 2020. (In Chinese) [Google Scholar]
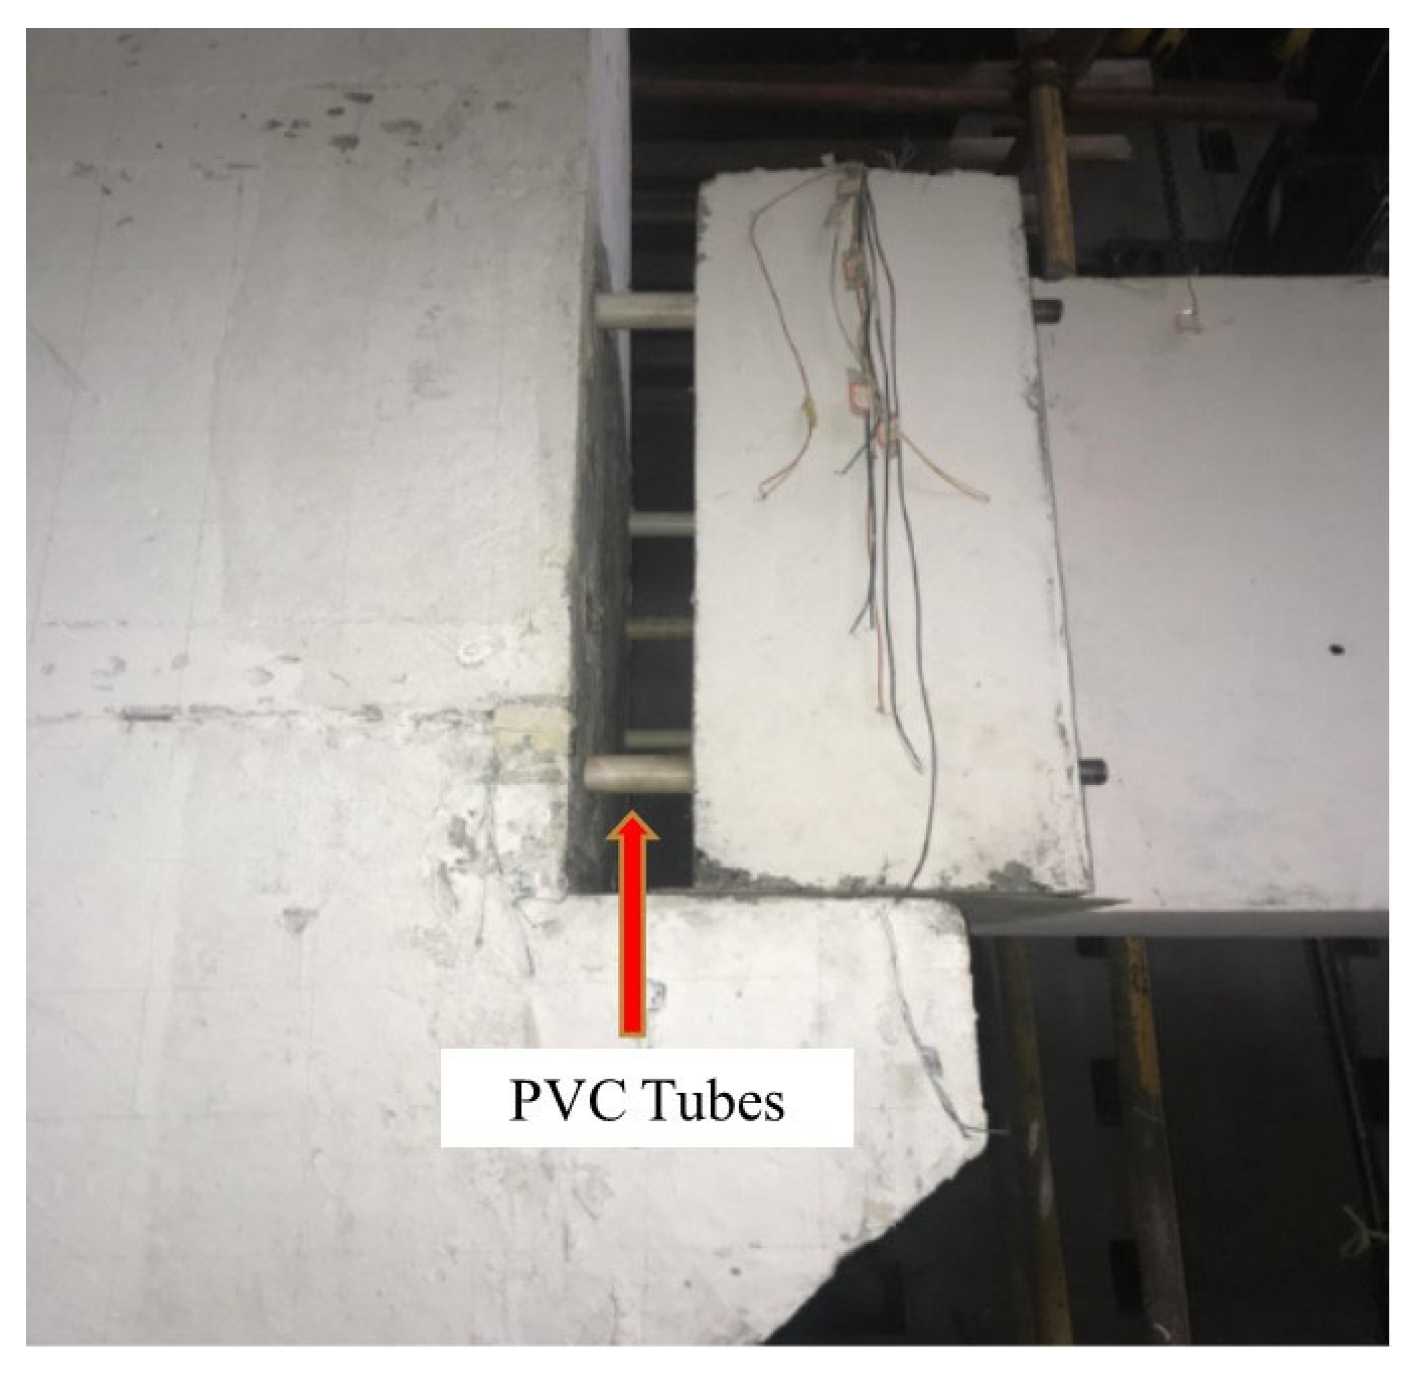
Figure 1. Assembly of precast concrete beam–column specimens.
Buildings 13 00329 g001
Figure 2. Design of the specimen. (a) S1. (b) S2.
Buildings 13 00329 g002
Figure 3. Specimen reinforcement arrangement.
Buildings 13 00329 g003
Figure 4. Precast beam–column connection joints. (a) Splice in precast beams and columns; (b) Splice in precast beams and columns after grouting.
Buildings 13 00329 g004
Figure 5. Test specimen fabrication process.
Buildings 13 00329 g005
Figure 6. Brace and loading regime of specimens. (a) Loading device diagram; (b) Loading site plan of S1; (c) Loading site plan of S2.
Buildings 13 00329 g006aBuildings 13 00329 g006b
Figure 7. Experimental loading regime. (a) S1 loading system; (b) S2 loading system.
Buildings 13 00329 g007
Figure 8. S1 Damage figure. (a) Precast beam damage diagram after loading; (b) Precast column damage diagram after loading.
Buildings 13 00329 g008aBuildings 13 00329 g008b
Figure 9. S2 Damage figure. (a) Precast beam damage diagram after loading; (b) Precast column damage diagram after loading.
Buildings 13 00329 g009aBuildings 13 00329 g009b
Figure 10. Experimental fracture figure.
Buildings 13 00329 g010aBuildings 13 00329 g010b
Figure 11. Comparison of experimental curves.
Buildings 13 00329 g011
Figure 12. Comparison of test piece skeleton curves.
Buildings 13 00329 g012
Figure 13. Stiffness degradation curve.
Buildings 13 00329 g013
Figure 14. Specimen meshing diagram. (a) Cast-in-place joint; (b) Experimental joint; (c) The whole specimen; (d) bolts; (e) steel haunched plates; (f) precast column bolt holes.
Buildings 13 00329 g014aBuildings 13 00329 g014b
Figure 15. Uniaxial stress–strain curve for concrete.
Buildings 13 00329 g015
Figure 16. Bilinear stress–strain curves for steel.
Buildings 13 00329 g016
Figure 17. Boundary conditions and loading settings.
Buildings 13 00329 g017
Figure 18. Comparison of experimental results with finite element results. (a) Hysteresis curves; (b) Skeleton curves.
Buildings 13 00329 g018
Figure 19. Comparison of finite element and experimental damage characteristics. (a) Finite element simulation of damage characteristics; (b) Experimental damage characteristics.
Buildings 13 00329 g019
Figure 20. Comparison of FEM simulation joints hysteresis curves.
Buildings 13 00329 g020
Figure 21. Plastic damage model for concrete. (a) Cast-in-place joint; (b) Experimental joint S1.
Buildings 13 00329 g021
Figure 22. Force diagram of the core zone of the joint.
Buildings 13 00329 g022
Figure 23. Force diagram and dimensional drawing of the new assembled beam–column joint. (a) Force diagram of the nodal core zone; (b) Beam enlarged end section.
Buildings 13 00329 g023
Figure 24. Sketch of Core Area Calculation for Rigidly Connected Joint. (a) Side calculation diagram of the nodal core zone; (b) Diagram for calculating the area of pressure applied to the bolt.
Buildings 13 00329 g024
Figure 25. Sketch of calculation of bolts at rigid connection joints.
Buildings 13 00329 g025
Table 1. Details of precast specimens.
Specimen NameConcrete GradeThickness of the Concrete Protection Layer (mm)Cross-Sectional Dimensions (mm)Length (mm)
Precast concrete beamC4025400 × 750
(Extended end 750 × 750)
3800
Precast concrete columnC8025750 × 7504200
Table 2. Specimen types and sizes.
NumberType of Joint ConstructionBolt GradesBolt Diameter (mm)
S1with haunched platesQ34524
S2with haunched platesQ34528
Table 3. Mechanical properties of concrete materials.
Concrete StrengthCube Compressive Strength (N/mm2)Standard Values for Axial Compressive Strength (N/mm2)Modulus of Elasticity (×104 N/mm2)
C4028.2818.343.25
C4028.6818.253.25
C4028.1318.323.25
C8077.3050.203.80
C8078.2052.303.80
C8077.9051.403.80
Table 4. Mechanical properties of steel bars and plates.
CategoryDiameter (mm)Yield Strength (N/mm2)Ultimate Strength (N/mm2)Modulus of Elasticity (×105 N/mm2)Elongation/%
HRB4008427.60637.102.1016.30
HRB40010437.90568.302.1015.60
HRB40012465.20577.302.0016.60
HRB40014447.40547.602.0016.20
HRB40016437.60640.402.1023.20
HRB40022487.50635.902.1121.60
HRB40025456.60 605.702.0617.80
Q34520 (Plate thickness)425.20570.402.0731.90
Table 5. Mechanical properties of bolts.
Bolt GradesDiameter (mm)Yield Strength (N/mm2)Ultimate Strength (N/mm2)Modulus of Elasticity (×105 N/mm2)
Q345244327612.12
Q345284367642.06
Table 6. Material properties.
Type of MaterialDensity (t × mm3)Elasticity Model/MpaPoisson’s Ratio
Steel7.89 × 10−920,6000.3
C402.5 × 10−932,5000.2
C802.5 × 10−938,0000.2
Disclaimer/Publisher’s Note: The statements, opinions and data contained in all publications are solely those of the individual author(s) and contributor(s) and not of MDPI and/or the editor(s). MDPI and/or the editor(s) disclaim responsibility for any injury to people or property resulting from any ideas, methods, instructions or products referred to in the content.