Article

Data-Driven Shear Strength Prediction of FRP-Reinforced Concrete Beams without Stirrups Based on Machine Learning Methods

College of Civil Engineering and Architecture, Zhejiang University, Hangzhou 310058, China
*
Author to whom correspondence should be addressed.
Buildings 2023, 13(2), 313; https://doi.org/10.3390/buildings13020313
Submission received: 21 November 2022 / Revised: 10 January 2023 / Accepted: 15 January 2023 / Published: 20 January 2023
(This article belongs to the Section Building Structures)

Abstract

:
Due to the intrinsic complexity, there has been no widely accepted mechanics-based estimation model of the shear performance of Fiber-Reinforced Polymer (FRP)-reinforced concrete beams. Capitalizing on a large amount of previous experimental data, data-driven machine learning (ML) models could be potentially suitable for addressing this problem. In this paper, four existing shear design provisions are reviewed and four typical ML models are analyzed. The accuracy of codified methods and ML models are compared and analyzed based on our established extensive database of FRP-reinforced concrete beams with rectangular cross sections. A series of artificially selected features considering the shear-carrying mechanisms of FRP-reinforced beams are incorporated into the proposed ML models to show their influence on the model validity. Bayesian optimization is utilized to automatically tune the hyperparameters of different ML models. Compared to the most satisfying codified predictions from CSA S806, the best ML model, XGBoost, can provide more accurate and consistent predictions for the database, with R2 enhanced by 15% and the MAE and RMSE reduced by 59% and 52%, respectively. With the selected features based on domain knowledge, the performance of ML models is further enhanced, shown by the most important features being the added ones. With outstanding performance on a large database and singular test, the ML approaches have great potential in guiding the shear design of FRP-reinforced concrete.

1. Introduction

Composed of high-strength fibers and polymer matrix, Fiber-Reinforced Polymer (FRP) has been applied in civil engineering since the 1980s due to its high strength, light weight and corrosion resistance [1,2]. To address the corrosion-related problems, FRP rebars were proposed to replace steel rebars as reinforcement for concrete structures [3,4]. Due to the anisotropic linear-elastic mechanical properties and lower elastic modulus, FRP-reinforced concrete (FRP-RC) structures show different flexural and shear behaviors compared to steel-reinforced concrete structures [1,5,6,7].
Specifically, due to catastrophic failure, the shear performance of FRP-reinforced concrete beams became a critical topic [8,9,10,11,12,13]. FRP-reinforced concrete beams with no stirrups share similar shear-carrying mechanisms with steel-reinforced concrete beams, where the applied shear force is carried by the aggregate interlock, dowel effect and uncracked concrete compression zone, as shown in Figure 1.
However, compared to steel rebars, the lower stiffness of FRP flexural rebars initiates wider shear cracks and weaker aggregate interlock [9,14,15,16]. The resulting smaller compression depth provides lower shear resistance. In addition, a lower dowel effect is found as a result of the lower transverse strength and stiffness of FRP rebars [8,10,17].
The current shear design methods of FRP-reinforced concrete members without stirrups adopt the same shear design philosophy of steel-reinforced concrete by modifying the empirical equations derived from steel-RC [9,12,18]. Although the codified design provisions for FRP-RC [17,19,20,21,22,23] could be valid for certain sets of tests, most of the design provisions only can provide inaccurate predictions of shear strength. The validity of the current codified approaches varies depending on the changing beam geometry, shear span–depth ratio and flexural reinforcement [9,12,18]. Significant studies have been carried out on shear capacity estimation but there has been no comprehensive and widely accepted mechanics-based model capable of providing accurate predictions for the shear strength of FRP-RC beams without FRP links due to the complex underlying phenomena.
Recently, there has been a surge of interest in using data-driven or machine learning (ML) approaches to estimate complex underlying relationships. ML is used to design a model to learn the trends, thus focusing on prediction based on known properties learned from the training data. It can be effectively used to enhance metamodel performance and can also be considered to check the general validity of laboratory or field test results. ML can also help minimize and potentially avoid time-consuming laboratory or field tests to determine design parameters [24,25].
To date, ML approaches have been used for strength predictions of concrete structures, capitalizing on the extensive amount of experimental data and low accuracy of traditional mechanical prediction models, especially for shear problems [26,27,28,29,30,31,32,33,34]. The current investigations have demonstrated that the data-driven ML approaches could provide strength predictions with significantly high accuracy compared with the design provisions. However, limited research has been carried out, focusing on the retrofitting of RC structures with FRP [35,36,37,38,39,40,41,42,43,44]. In addition, normal ML approaches only rely on the initial input, but the shear prediction of FRP-reinforced concrete is a complex question which requires a deep understanding of the mechanism.
There are mainly two paradigms for shear strength prediction: mechanics-driven models [8,9,10,11,12,13] and data-driven models (such as ML models) [36,37,39,43,44]. However, both methods have their drawbacks. Mechanics-driven models are limited by their respective assumptions, making them difficult to simulate this strong nonlinear problem. Pure data-driven models ignore the prior knowledge of mechanisms in this field and require a lot of data to ensure the model performance. Obtaining data for engineering problems is time-consuming and labor-intensive. Embedding prior mechanics knowledge into the machine learning model is expected to improve performance with a given number of specimens.
To address these issues, this paper established an extensive database of shear tests of FRP-reinforced concrete beams with rectangular cross-sections. The typical codified shear design provisions and four data-driven Machine Learning models are reviewed and evaluated. Additional mechanics-based properties are introduced to improve model performance given existing machine learning models and limited data, aiming to explore the integration of data-driven and mechanics-driven models. The accuracy of the shear design provisions and the ML models incorporating artificially selected features considering the shear-carrying mechanisms are evaluated, compared and analyzed based on the established database. An additional validation test is used to verify the accuracy of the proposed ML approaches with additional features for individual testing. Further parametric analysis is conducted to analyze the influences of design configurations of the FRP-reinforced beams. This work shows the significant potential of ML approaches in the shear design of FRP-reinforced concrete.

2. Shear Design Provisions and Machine Learning Approaches

2.1. Codified Shear Design Provisions

The shear design provisions for FRP-RC beams without stirrups from four widely used design guidelines including CSA S806 (2012) [20], CSA S6 (2014) [21], JSCE guideline (1997) [23] and ACI 440.1R (2015) [17] are reviewed. As the modified version of their counterparts in steel RC design codes, the expressions of concrete contribution V c differ in all the listed guidelines. Given that the lower stiffness of flexural FRP bars could result in wider shear cracks, lower dowel effect and lower aggregate interlock, these guidelines use various factors to account for this effect, as shown in Table 1.
The effect of lower flexural bar rigidity could normally be considered by introducing a ratio of elastic modulus between FRP and steel ( E f l / E s ): JSCE (1997) shear design equation of V c incorporates the factor ( E f l / E s )1/3; ACI 440.1R (2015) only considers the uncracked compression zone to provide shear resistance by using the factor k , which is a function of the flexural reinforcement ratio and the ratio of flexural bars and concrete. CSA S6 (2014) considers this effect by replacing E s A s with E f l A f l when calculating the mid-depth normal strain of the critical cross-section ε x , whilst CSA S806 (2012) introduces a coefficient k r accounting for the effect of flexural reinforcement rigidity on shear strength.

2.2. Machine Learning Models

In this study, four typical ML models are adopted for the comparison analysis. Linear Regression serves as the baseline model and evaluates the linearity of features. Tree-based models are most utilized for the prediction of tabular data [45,46]. Another three tree-based models are employed, namely Decision Tree, Random Forest and XGBoost. Decision Tree is a typical single tree model. Random Forest and XGBoost are two ensemble tree models, which are widely used and often achieve SOTA performance for tabular data.

2.2.1. Linear Regression

Linear regression fits a linear model with coefficients to minimize the residual sum of squares between the observed targets in the dataset and the targets predicted by the linear approximation [47]. Given a sample x = ( x 1 ,   x 2 , , x N ) T with N features, the predicted value y ^ is determined by:
y ^ ( w , x ) = w 0 + w 1 x 1 + + w N x N = x T w
where w = ( w 1 ,   ,   w N ) is the regression coefficients and T denotes the transpose so that x T w is the inner product between vectors x and w . In the least-squares setting, the optimum coefficients are defined as such that minimizes the sum of mean squared loss to obtain the optimized value of the regression coefficients.

2.2.2. Decision Trees

Decision trees (DTs) are a non-parametric guided method for solving classification and regression problems. They divide the feature space into a series of simple parts, which in turn create a learning model and use the simple decision rules inferred from the training data to make predictions. DTs are one of the most popular machine learning algorithms given their intelligibility and simplicity. In this study, DTs serve as the baseline for the evaluation of model performance compared to other ensemble models.

2.2.3. Random Forests

Random Forests (RF) are an integrated model consisting of a combination of the bagging method and decision trees. They combine M randomized DTs and aggregate their predictions by averaging. The j-th tree estimate takes the form
T n ( x ; Θ j , D n ) = i D n ( Θ j ) 𝟙 x i A n ( x ; Θ j , D n ) Y i N n ( x ; Θ j , D n )
where Θ j is the model parameter, D n ( Θ j ) is the set of data points selected prior to the tree construction, A n ( x ; Θ j , D n ) is the cell containing x and N n ( x ; Θ j , D n ) is the number of (preselected) points that fall into A n ( x ; Θ j , D n ) . With M DT models established, the RF prediction y ^ i of specimen ( x i , y i ) is
y ^ i = 1 M M = j M T n ( x ; Θ j , D n )

2.2.4. XGBoost

XGBoost (eXtreme Gradient Boosting) is also an integrated learning method, which is an extended form of gradient boosted decision tree (GBDT). Compared to other models, XGBoost is optimized in terms of loss function and loss optimization process. XGBoost runs with a parallel tree boost and can quickly and accurately resolve many data science tasks, achieving state-of-the-art results in many problems. XGBoost minimizes the following rule loss function to learn the weak learner set in the integrated model:
= i   l ( y i ^ ,   y i ) + K   ( γ N + 1 2 v β k 2 )
where l is the difference between the prediction y ^ i and the target y i ; N is tree node number; γ and v are penalty coefficients and β k is leaf scores. The first term typically adopts a squared loss function, while the second term is based on the leaf’s L 2 norm and the number of tree nodes N . The prediction of XGBoost for concrete is obtained by the unweighted summation of all weak learners.

2.3. Bayesian Optimization

Bayesian optimization is utilized in this study for the automated hyperparameter optimization. It involves two critical components: a probabilistic proxy model and an acquisition function that determines which point to be further evaluated. The surrogate model is adjusted to all currently observable targets with each iteration. The usefulness of various candidate points is then determined by the acquisition function using the probabilistic model’s prediction distribution. The acquisition function is computationally inexpensive compared to evaluating expensive black box functions and therefore can be thoroughly optimized. In this study, positive expected improvement (EI), denoted as I ( λ ) = m a x { c J m a x , 0 } , is utilized as the acquisition function. The expectation is as follows:
E [ I ( λ ) ] : = J m a x + m a x { c J m a x , 0 } p   ( J λ ) d J
where p (J∣λ) is obtained using the surrogate model Tree Parzen Estimator (TPE). TPE adopts individual models for p(J) and p (λ∣J) to obtain p (J∣λ). The calculation is expressed as
p ( λ J ) = { ( λ ) , if   J < J * g ( λ ) ,                 if   J J *
p ( J λ ) = p ( λ J ) p ( J ) p ( λ ) = l ( λ ) p ( J ) γ l ( λ ) + ( 1 γ ) g ( λ )
where, J * is chosen as the γ -quantile of the objective values (0.15 by default) and ( λ ) and g ( λ ) are density estimates with corresponding objective values smaller or greater than J * , respectively. The best   λ is the hyperparameter set to maximize Equation (6). Finally, hyperparameters of the predictive model for concrete compressive strength are optimized using Bayesian optimization, which randomly generates innumerable candidate hyperparameter configurations and selects λ as the minimum value.

3. Database

To develop the data-driven models, an extensive database of shear tests of concrete beams reinforced without FRP stirrups was established, including test details of 219 beam members without FRP stirrups from 47 investigations between 1994 and 2018. In the database, all the beams had rectangular cross-sections. Only beams that failed in shear are considered and datasets with inadequate information are removed. As the included tests were conducted under various setups, the shear force carried by the shear span at failure is considered as the ultimate shear capacity to exclude the influence of the test setup.
For the shear design provisions and ML approaches, the input information of the beam specimens includes beam geometry (effective depth d and web width b w ), testing setup (ratio of shear span to effective depth a / d ), concrete strength f c , flexural bar parameters (tensile strength f f u , Elastic Modulus E f and Reinforcement ratio ρ f l ) and ultimate capacity (total shear force V u , e x p ). The database statistics are summarized in Table 2. The distributions of input features and correlations between them are shown in Figure 2.

4. Evaluation Methodology

In this section, the evaluation for shear design provisions and ML models are illustrated. For the shear design provisions, the shear capacities of the tested specimens in the established database could be calculated following the equations shown in Table 1. For the ML models, the models were developed by inputting the design parameters of the beam specimens in the established database. The ML models were developed by incorporating additional artificially selected features based on the literature in this field (Section 4.1). With the predictions from the shear design provisions and the ML models (two versions), their effectiveness will be evaluated by the performance measures.

4.1. Artificially Selected Features

With the understanding of the shear-carrying mechanism and the design provisions, the current basic form of the ML models could be developed by artificially selecting the input features to reflect the shear-carrying mechanism.
The selected features could be categorized into two levels including: (1) beam features and (2) shear capacity features, as shown in Table 3. The beam features include G , C and R to reflect the cross-section, concrete strength and reinforcement stiffness, respectively. There are two different methods to consider the concrete strength in current codified provisions and, therefore, C1 and C2 are used to reflect the two methods. Similarly, for the reinforcement, various methods have been included in the codified provisions to consider the lower stiffness of FRP flexural reinforcement and three representative approaches are adopted as features R1, R2 and R3. In addition, the shear span to depth ratio ( λ ) is also a critical factor for the shear capacity predictions. Consequently, the shear capacity features are the products of different features to reflect the contributions from concrete (C1 and C2) and reinforcement stiffness (R1, R2 and R3) and the influence of the ratio of shear span to effective depth ratio ( λ ).

4.2. Performance Measures

To evaluate the predictive performances of the current shear design provisions and the ML models with proposed features in this study, the mean value of the experimental result divided by the predictions ( V u , e x p / V u , p r e ), corresponding standard deviation (SD), root mean squared error (RMSE), the mean absolute error (MAE) and the correlation of coefficient ( R 2 ) were adopted to examine the prediction errors.
R 2 = 1 i = 1 n ( V u , e x p V u , p r e ) 2 i = 1 n ( V u , e x p V ¯ u , e x p ) 2
RMSE = i = 1 n ( V u , e x p V u , p r e ) 2 n
MAE = i = 1 n | V u , e x p V u , p r e | n
where, n is the number of specimens in the dataset, V u , e x p and V u , p r e are experimental and predicted shear strength and V ¯ u , e x p is the average value of the experimental shear strength. R 2 is more intuitively informative as it can be expressed as a percentage. It denotes the proportion of the variation in the dependent variable that is predictable from the independent variable.

5. Implementation of the Predictive Model

The implementation of ML-based predictive models for shear strength prediction of FRP-reinforced concrete beams without stirrups is solved by a fully automated approach, leveraging Bayesian optimization for conditional hyperparameter optimization. There are two cases in this study. First, all ML models are trained with raw input features without artificially selected ones. After that, all ML models are trained with all the artificially selected features. The dataset is randomly split into train set and test set comprising 80% and 20% of the complete dataset, respectively. There are 175 and 44 samples in train set and test set. During the Bayesian optimization, 10-fold cross-validation is utilized, where 9 folds of train set are for training and left 1-fold of the train set for validation. The procedure is iterated 10 times to ensure that each fold is utilized as a validation set. Model performance is calculated based on the average of the 10 validation sets. Test set is kept unseen in the training process to avoid data leakage. The objective metric is set to be R 2 for all models, with the number of iterations set to 100. The hyperparameter search space varies on different models, including Linear Regression, Decision Tree, Random Forest and XGBoost.
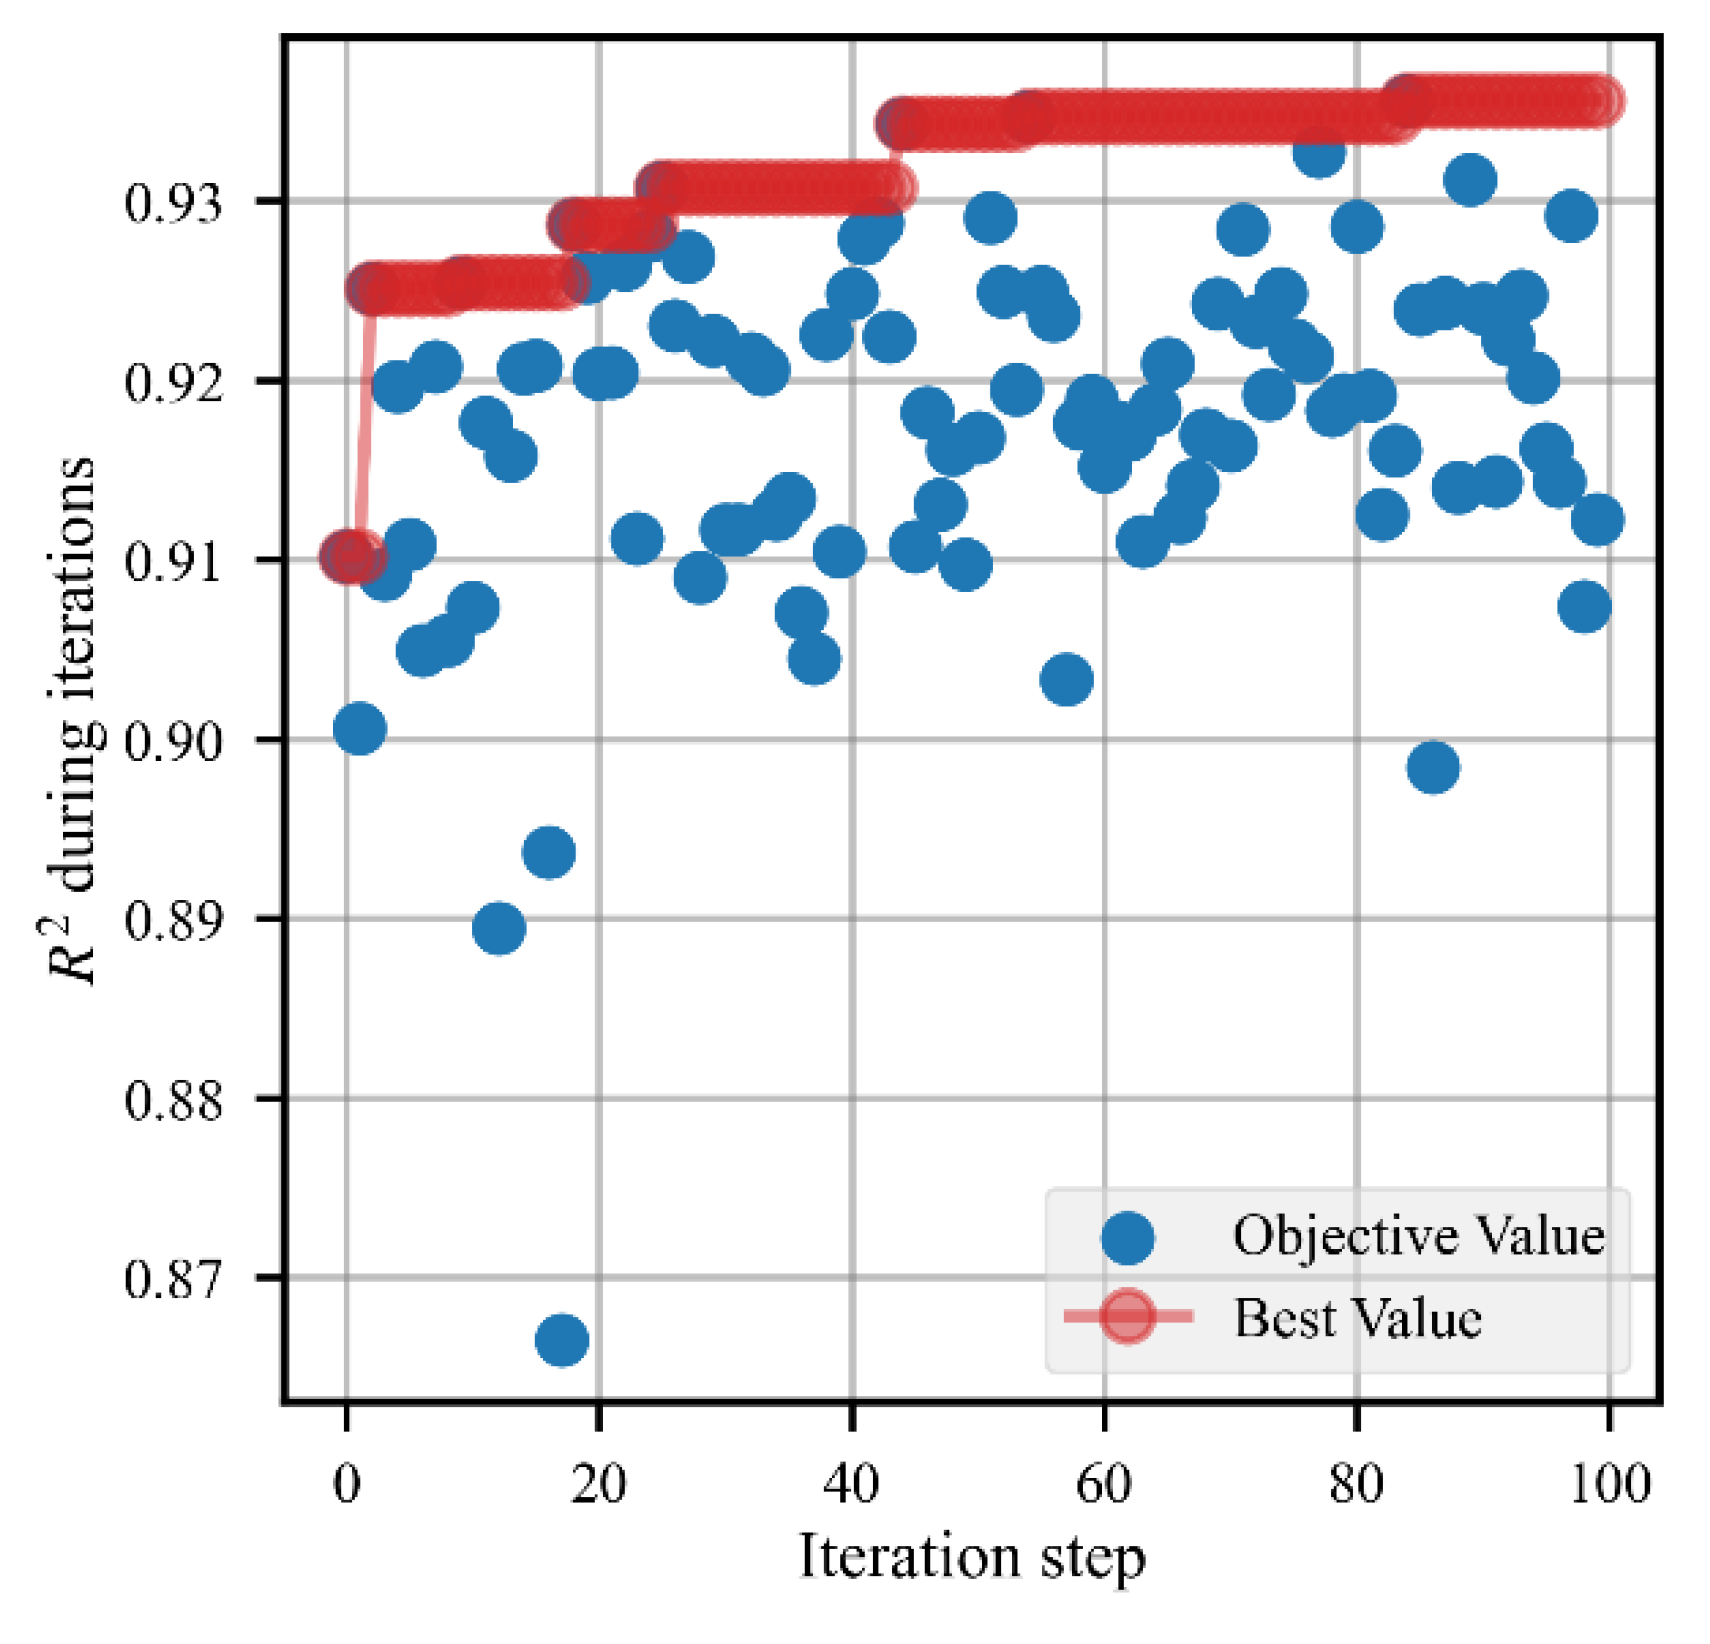
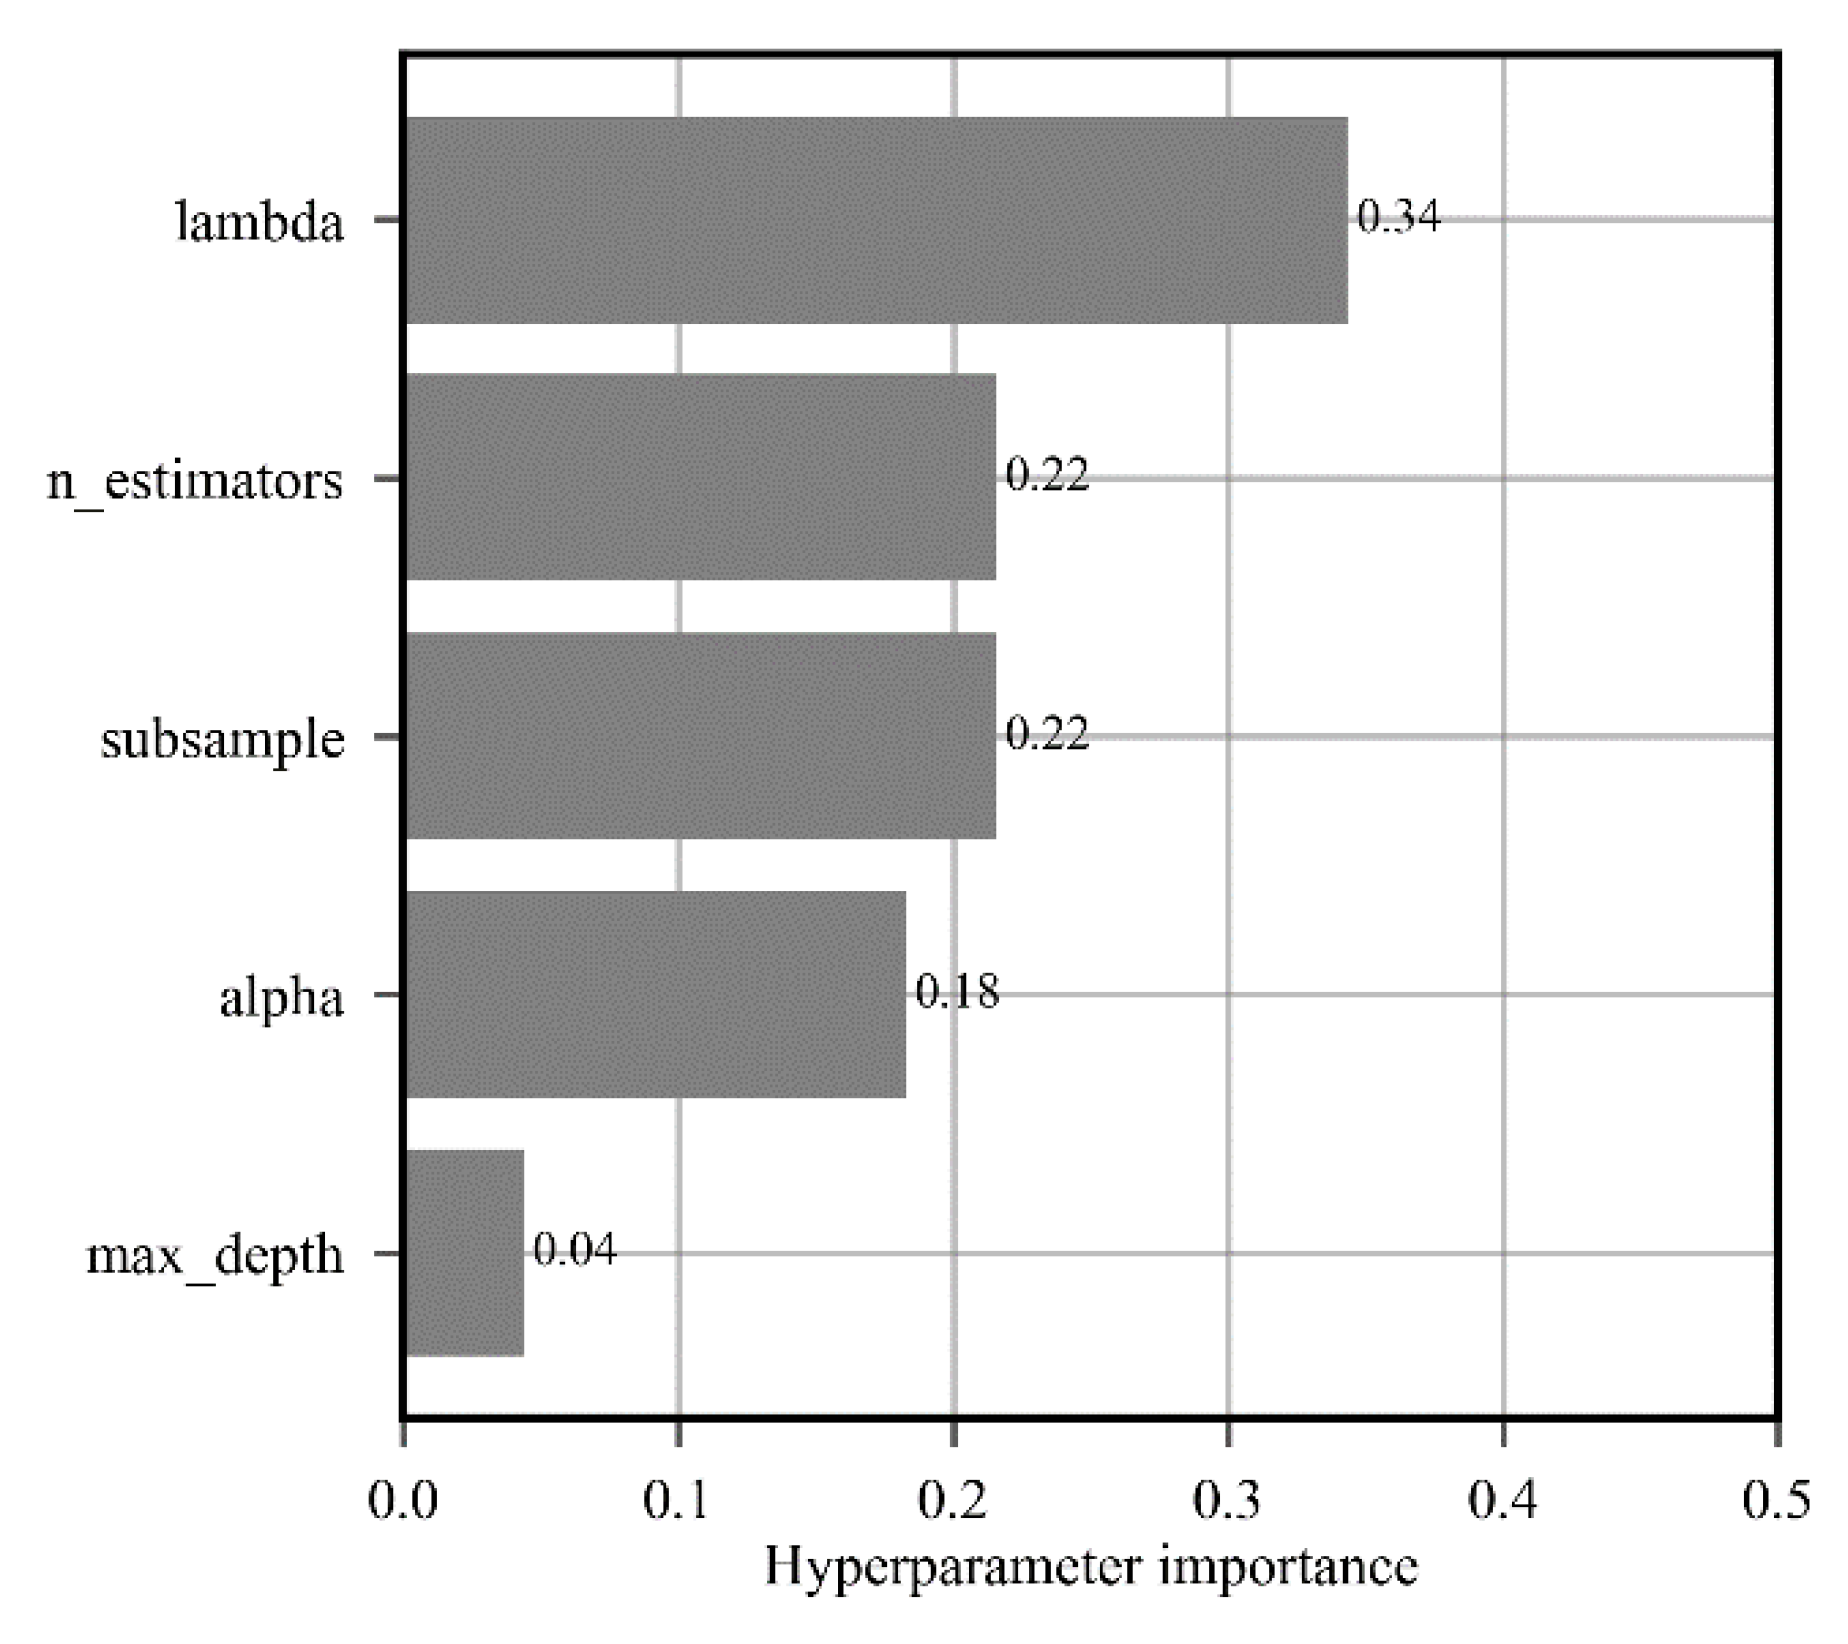
The optimization history XGBoost is shown in Figure 3. Hyperparameters of other ML models are tuned automatically with the same procedure using Bayesian optimization. R 2 is set to be the objective value. The initial R 2 value is low, and as the optimization progresses, the value of TPE of Bayesian optimization for the hyperparameter makes the model performance tend to be better. The best R 2 result is 0.9362 in the validation set. The hyperparameter importance of the XGBoost is shown in Figure 4. The hyperparameter importance is calculated by Hutter [48]. All the importance values are summed up to 1.0. The most important hyperparameter of XGBoost is lambda. The number of estimators ranks second. The range of the important hyperparameters is set iteratively to ensure including the best values. With the aid of hyperparameter importance, users could pay more attention to setting the ranges of the relatively more important hyperparameters. It will greatly help reduce time consumption and manual intervention.
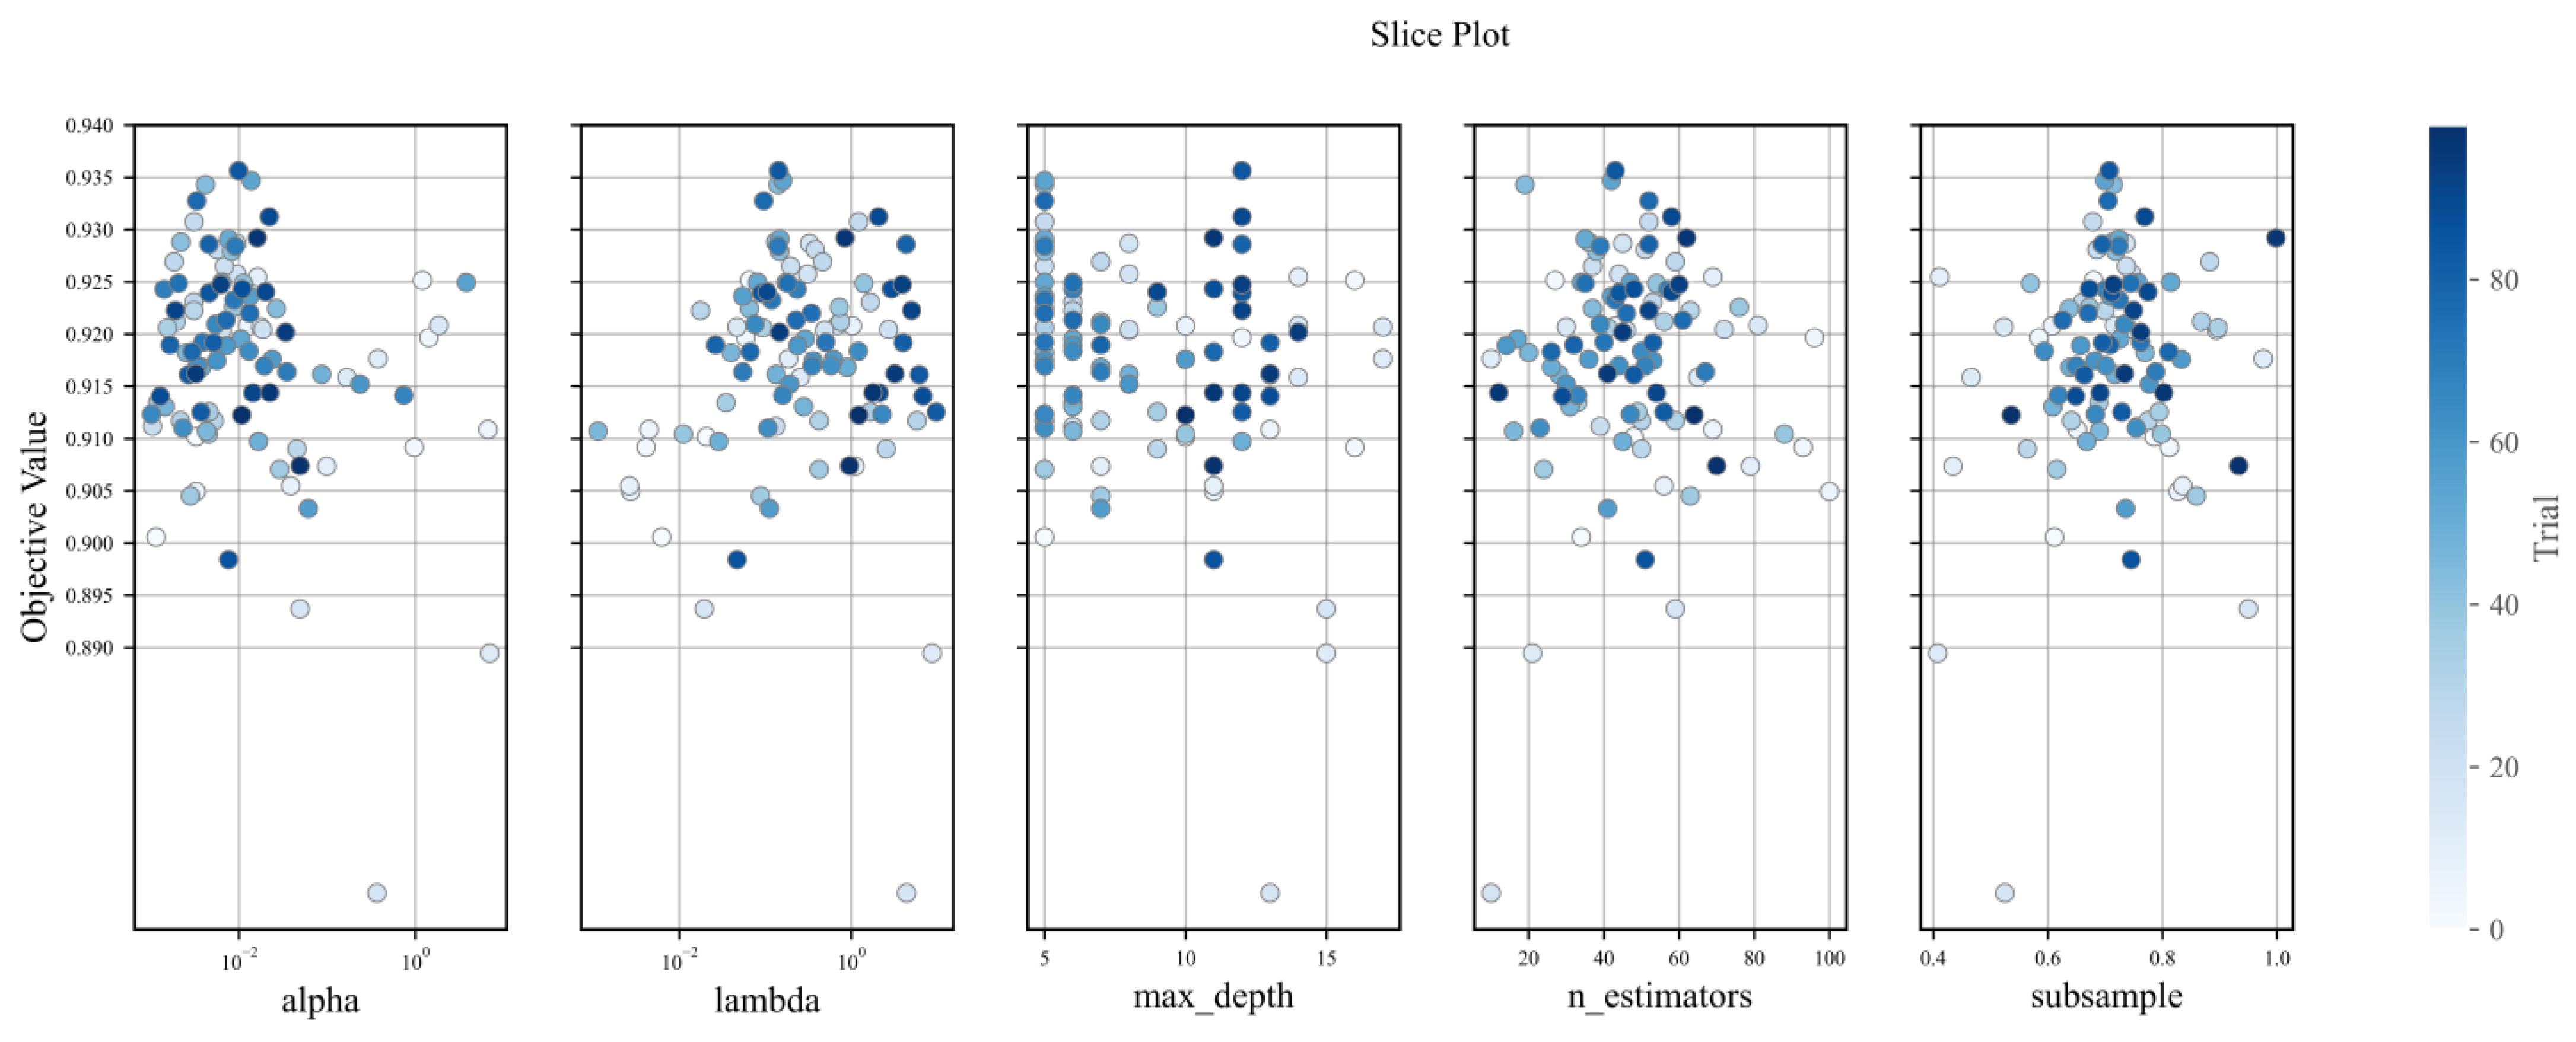
The hyperparameter optimization process for 100 iterations is shown in Figure 5. Due to space limitations, only the model and five most important features of XGBoost are listed in the Figure 5. The principles of the optimization process of other models and hyperparameters are similar. It should be noted that, compared with grid search in the optimization process of Bayesian optimization, the value of a single hyperparameter does not increase in one direction. The value of a single hyperparameter is determined by TPE, and the value that increases EI the most is chosen. The iteration steps are denoted by colors, which show the optimization process of hyperparameters. It can be seen that the hyperparameter values at the beginning of the iteration are relatively discrete. In the later stages of the iteration, the hyperparameter values are gradually concentrated in the area that maximizes the objective value improvement. Compared with grid search and random search, this kind of Bayesian optimization based on prior information can effectively reduce the search time of hyperparameters, reduce manual intervention and can obtain more accurate results.

6. Evaluation, Results and Analysis

6.1. Performance Evaluation

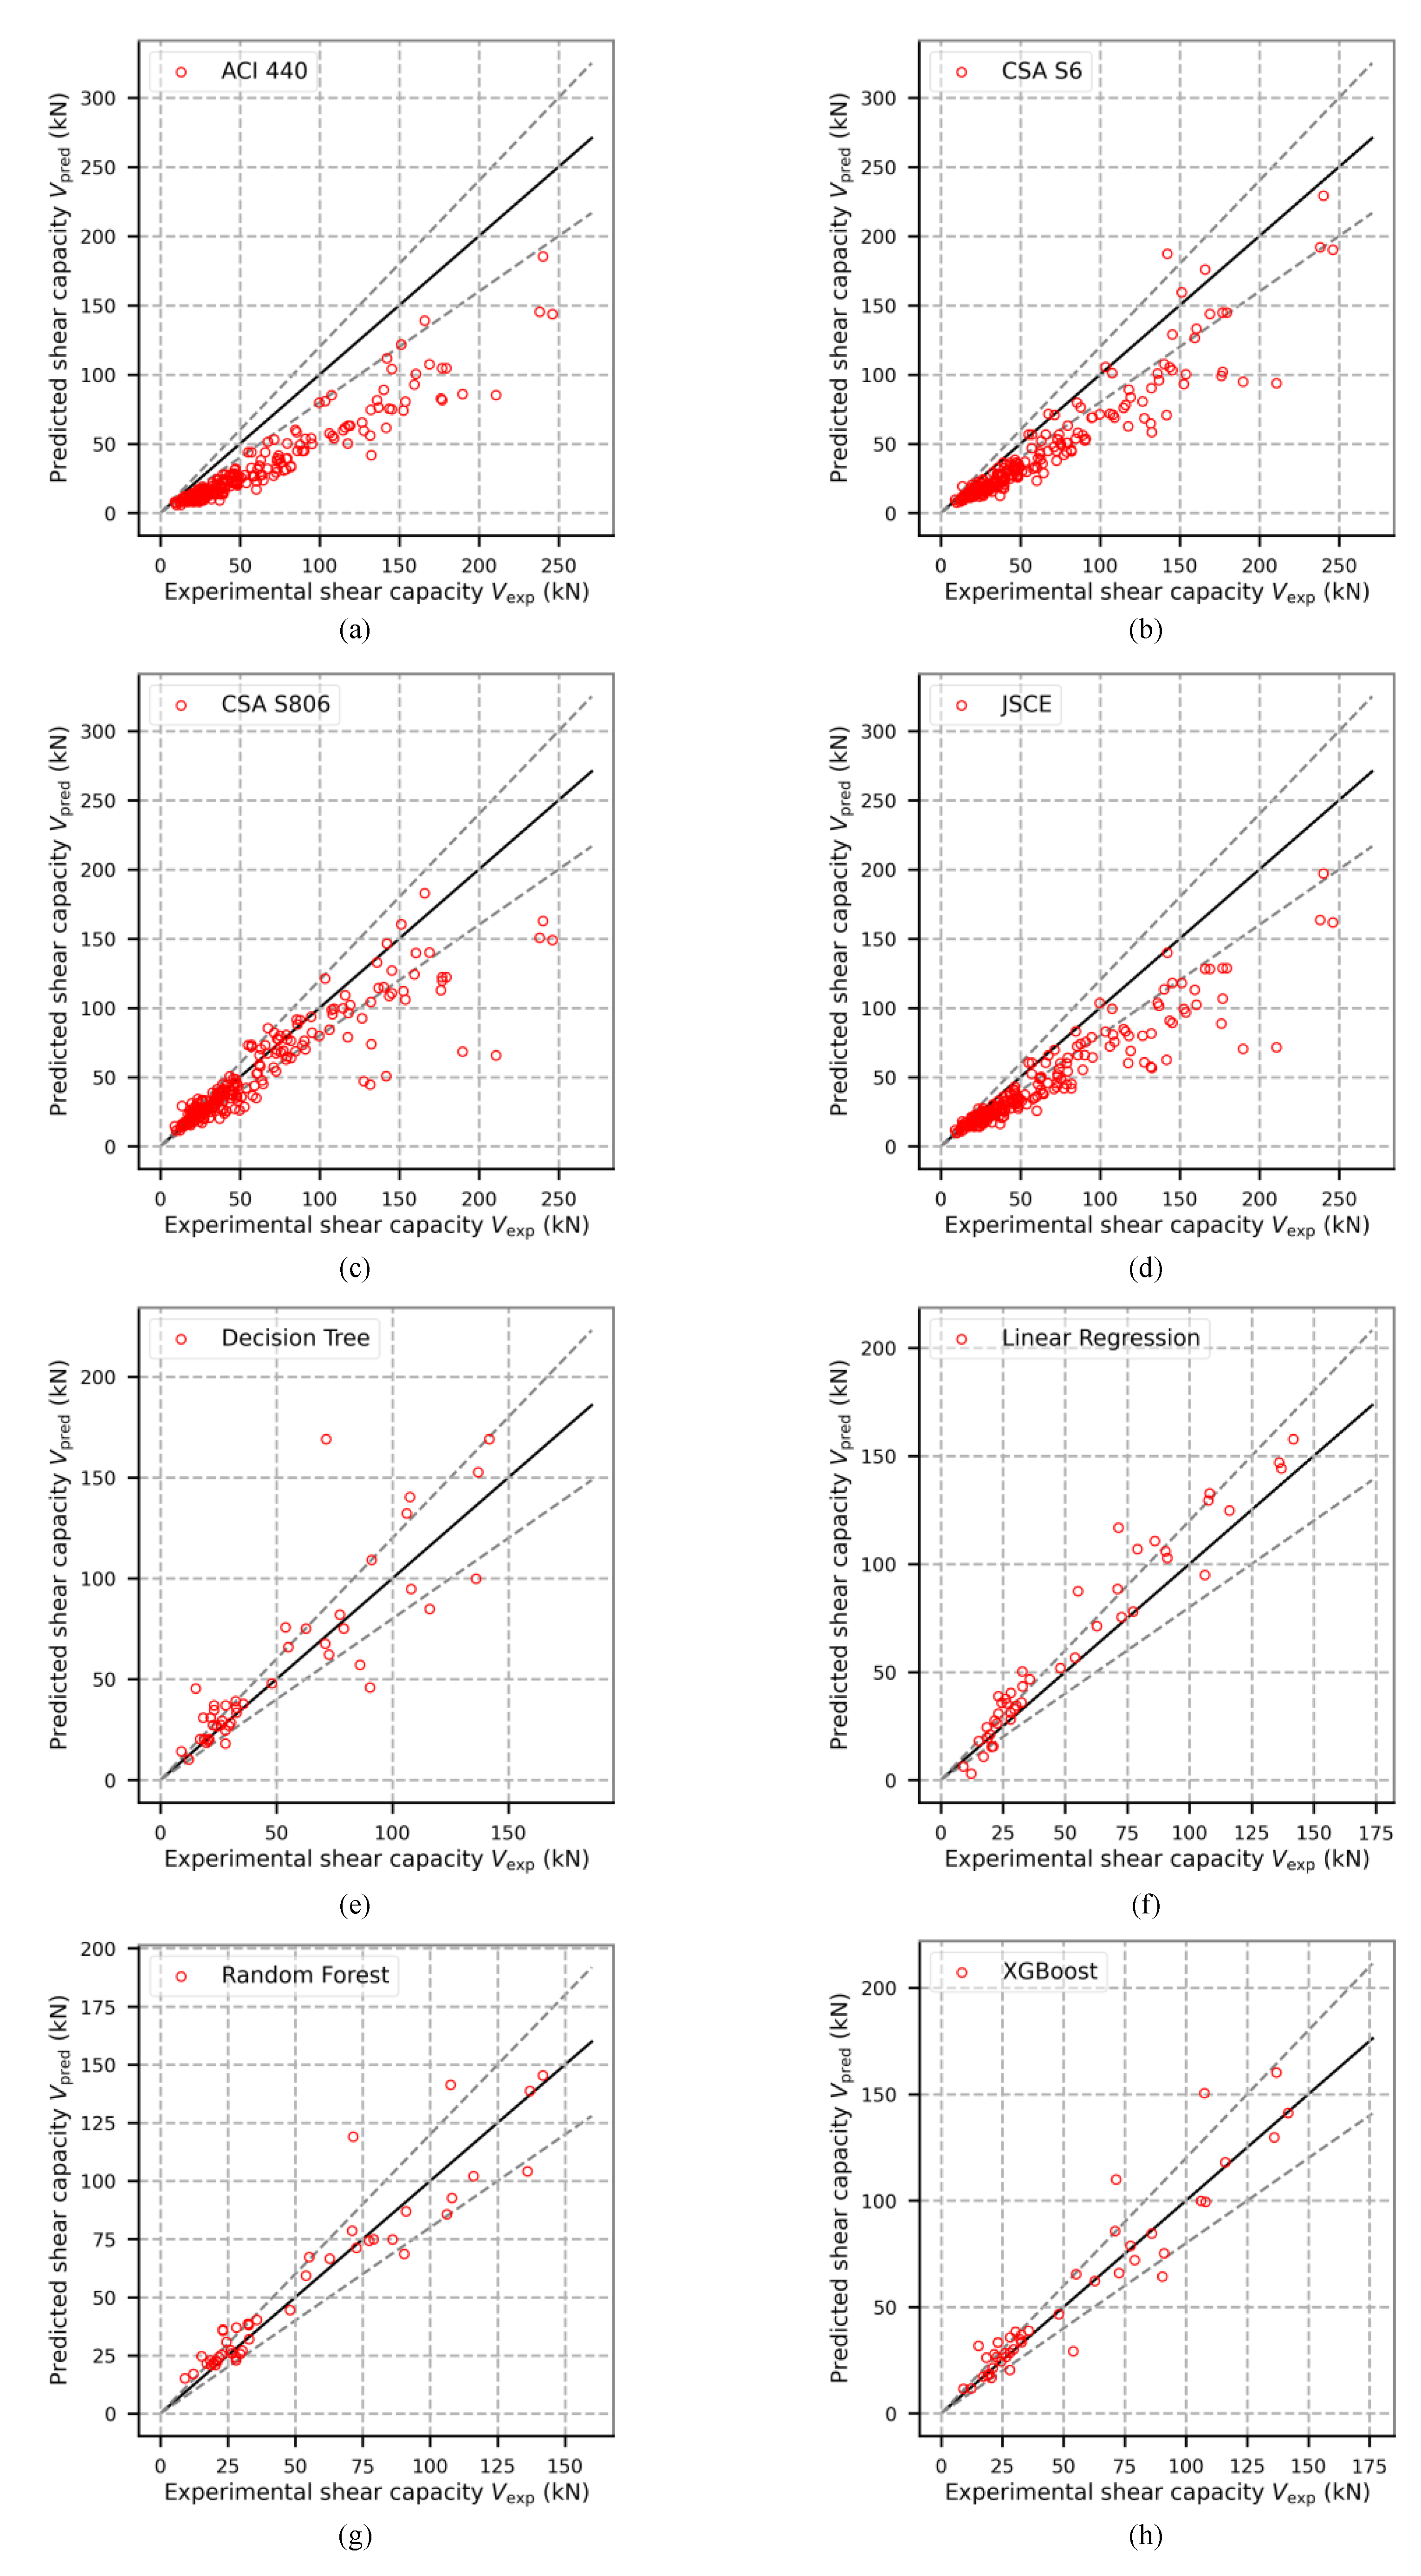
The test results from the established database are compared with the shear design provisions and the ML models with proposed features in Table 4. The experimental data points are plotted against the predictions in Figure 6. A tolerance of 20% is plotted on the graph. Model performance is determined by the randomly split train set, while the model metrics are affected by the test set. A single experiment with random dataset split and model training does not guarantee the generalizability of the model. To further validate the robustness and reliability of all the models, the Monte Carlo method is used in this section to analyze the distribution of the model performance. In the Monte Carlo method, all the data are first randomly divided into train set and test set, where the train set accounts for 80%. The ML models are trained on the training set, after which all models are evaluated on the corresponding test set. The Monte Carlo simulation consists of a total of 200 iterations. Table 4 illustrates the mean and standard deviation of the statistical properties of different model prediction results. The values are presented as mean ( ± standard   deviation ).
Table 4 indicates that the Monte Carlo simulation results of XGBoost are more accurate and with less dispersion with and without additional features. This validates that XGBoost has a higher probability of obtaining better prediction results with different train and test sets. The R2 of CSA S806 (2012) is more discrete, which means that the uncertainty and dispersion of its prediction results are larger. From the Monte Carlo simulation, XGBoost trained with additional features yields the largest R2 mean value, as well as the smallest RMSE and MAE mean values, which are 0.94, 11.91 and 7.25, respectively. The iterative results of XGBoost are more concentrated around the mean values. In addition, the performance of the train set with additional features is better than without additional features. There is no design provision that could provide accurate predictions with low variations. The mean ratio of V u , e x p / V u , p r e of the shear design provisions varies from 1.07 to 1.49 and the corresponding standard deviation (SD) varies from 0.21 to 0.41. The large variations of the provisions are also shown by the relatively large RMSE, MAE, low R2 and data point scatter in Figure 6.
The most satisfying design provision could be the CSA S806 (2012), which has a mean V u , e x p / V u , p r e of 1.07 with the least SD of 0.21. The CSA S806 (2012) provides the least RMSE (27.62) and MAE (20.07), and the highest R2 of 0.80 among all codified shear design provisions, showing the most satisfying accuracy and consistency among all codified design provisions.
As ACI 440.1R (2015) only considers the shear contribution from uncracked concrete, it provides the most conservative with a mean V u , e x p / V u , p r e of 1.86, with all data points falling below the equal line of V u , e x p / V u , p r e . Compared to the ACI 440.1R (2015) prediction, the JSCE (1997) and CSA S6 (2014) show similar data point scatter with the most data points closer to and below the line of equality, whilst JSCE (1997) provides more accurate predictions than CSA S6 (2014) with a mean V u , e x p / V u , p r e of 1.39 and SD of 0.22.
To address the inaccurate predictions with large variations, attempts could be made to modify the equations with factors. It is not difficult to adjust the codified equations by incorporating factors larger than 1.0 to adjust the slope of the regression line of the data scatter in Figure 6a–d. However, this type of modification has drawbacks. The pertinent values or definitions of the modification factors normally cannot be explicitly explained from the physical perspective. Even if the physical meanings of the modifications are neglected, there could be unlimited ways to adjust the linear or nonlinear modification factors, making it impossible to achieve the optimal solution for manual adjustment. For example, it is possible to add a constant factor to ensure the accuracy of the codified equations, but the data deviation cannot be addressed.
The basic form of ML models in this work could significantly enhance prediction accuracy and reduce prediction error variations. The ML models have a similar mean ratio of V u , e x p / V u , p r e varying from 1.03 to 1.10. The average mean ratio of V u , e x p / V u , p r e of the ML models is 1.06, which is improved by over 40%, with respect to the codified design provisions. The performance measures of MAE, RMSE and R2 obtained from the ML models are significantly improved compared to the shear design provisions. The average MAE and RMSE of ML models are reduced to 11.07 and 17.43, respectively. The corresponding improvement of average R2 reaches 32.8%.
Considering all the performance measures, the XGBoost is considered the best within all the ML models, which provides consistently accurate predictions ( V u , e x p / V u , p r e = 1.03) with the least SD compared to all basic ML models and shear design provisions. It also yields the least MAE, relatively good RMSE and the second-best R2. Compared to the most satisfying codified predictions from CSA S806, the best ML model, XGBoost, can provide more accurate and consistent predictions for the database, with R2 enhanced by 15% and the MAE and RMSE reduced by 59% and 52%, respectively.
By incorporating the artificially selected features, the effectiveness of all ML models is improved as shown in Table 4. The mean ratios of V u , e x p / V u , p r e of all the ML models with additional features are approximately 1.00. The average SD of the ML models with additional features is 20% lower than that of the basic ML models. Correspondingly, the average MAE and RMSE of the ML models with additional features are 12.6% and 16.1% lower, respectively. The average R2 is increased from 0.89 by 2.2% to 0.91. The importance of domain knowledge of the shear strength of FRP-reinforced beams is effectively reflected in the four ML models. By comparing the performance measures of the basic ML models and the ML models with additional features, it shows that the artificially selected features to reflect the shear-carrying mechanisms can effectively enhance the model effectiveness, including accuracy and consistency.

6.2. Feature Importance Analysis

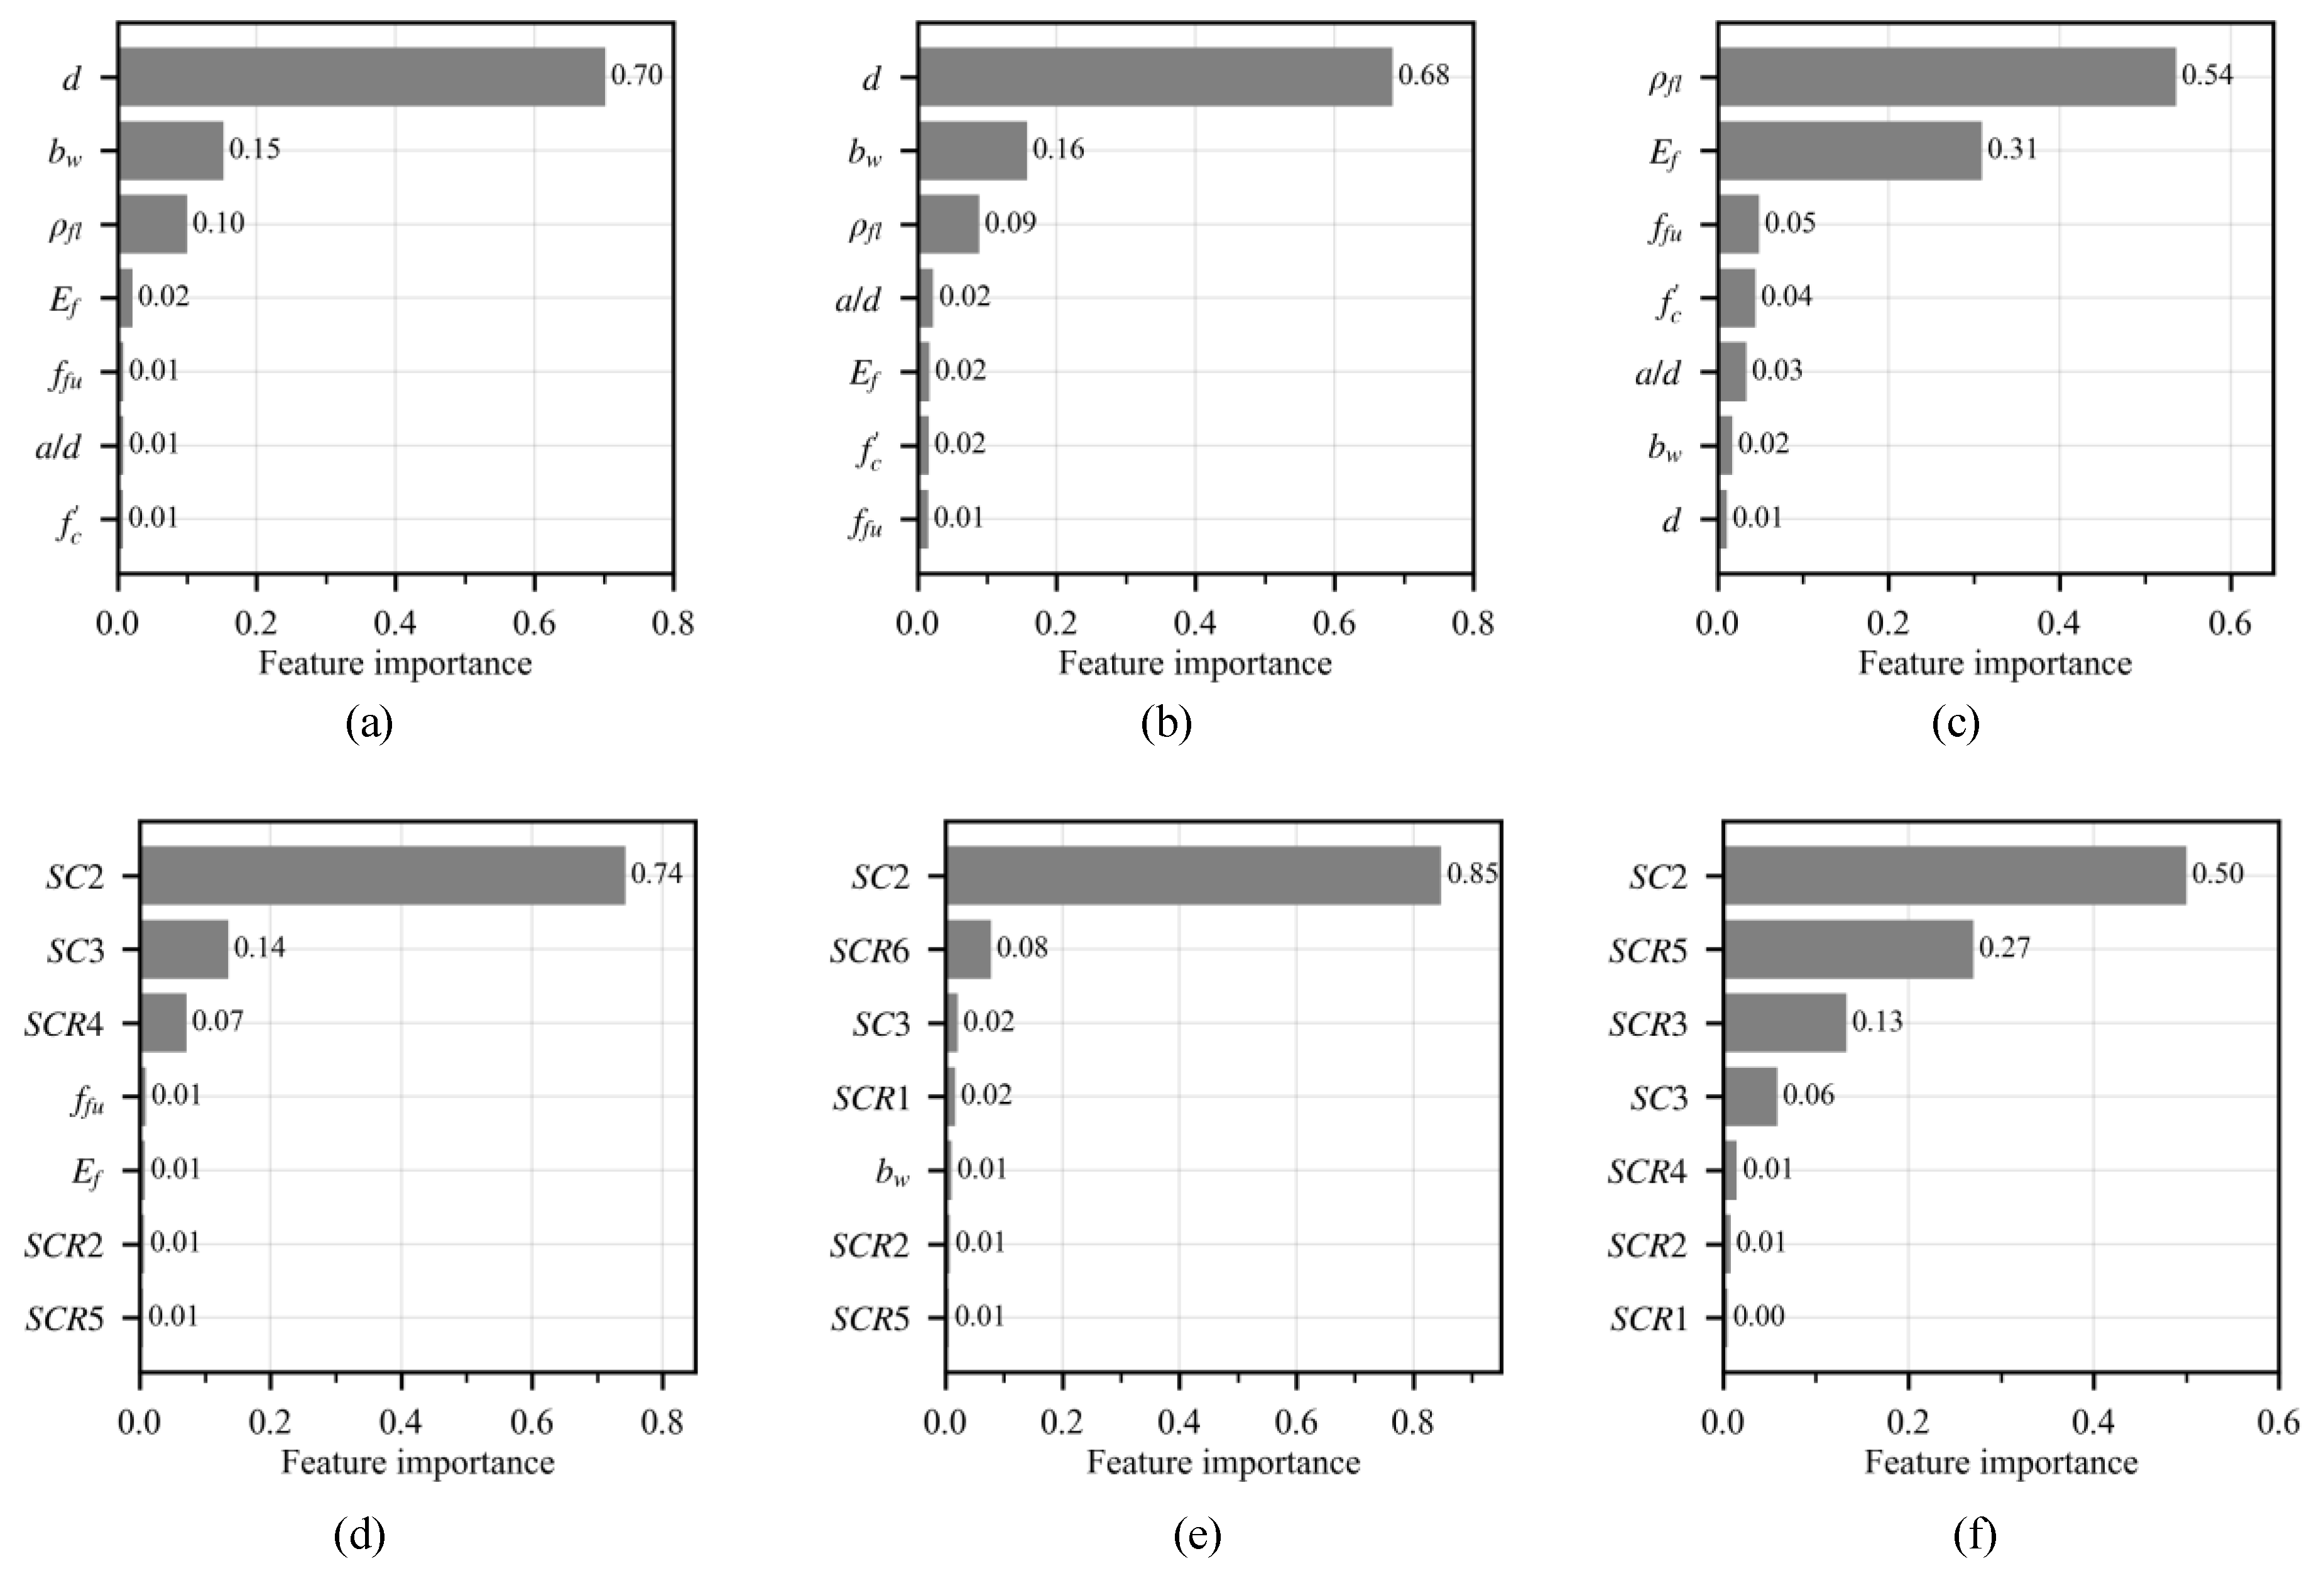
The relative importance of the input parameters for the original ML models and ML models with additional features are ranked in Figure 7. Only the seven most important features are presented in Figure 7. Decision Tree, Random Forest and XGBoost take different strategies to calculate the feature importance. Specially, Decision Tree and Random Forest compute the feature importance as the normalized total reduction of the squared error brought by that feature. XGBoost uses gains to obtain the relative contribution of the corresponding feature to the model calculated by taking each feature’s contribution for each tree in the model. Therefore, the feature importance varies between different models. As the two Linear Regression models do not include this feature importance analysis, therefore, only six models are presented.
It is observed that for the three basic models, the cross-section of the beams ( b w and d ) is the predominant key factor influencing the shear capacity predictions, followed by the reinforcement stiffness ( ρ f l and E f l ). The ratio of shear span to effective depth a / d has a very limited impact on the predictions, which could be attributed to the narrow range of this ratio in the established database.
By implementing the additional features, the most important influencing factors become the selected ones. As shown in Figure 7, the Decision Tree, Random Forest and XGBoost models’ predictions are more relative to the features SC2, SC3 and SCR5. This indicates that for these models, the combination of concrete strength, cross-section and reinforcement stiffness in shear capacity predictions plays a more important role than other features, as shown in Table 3.
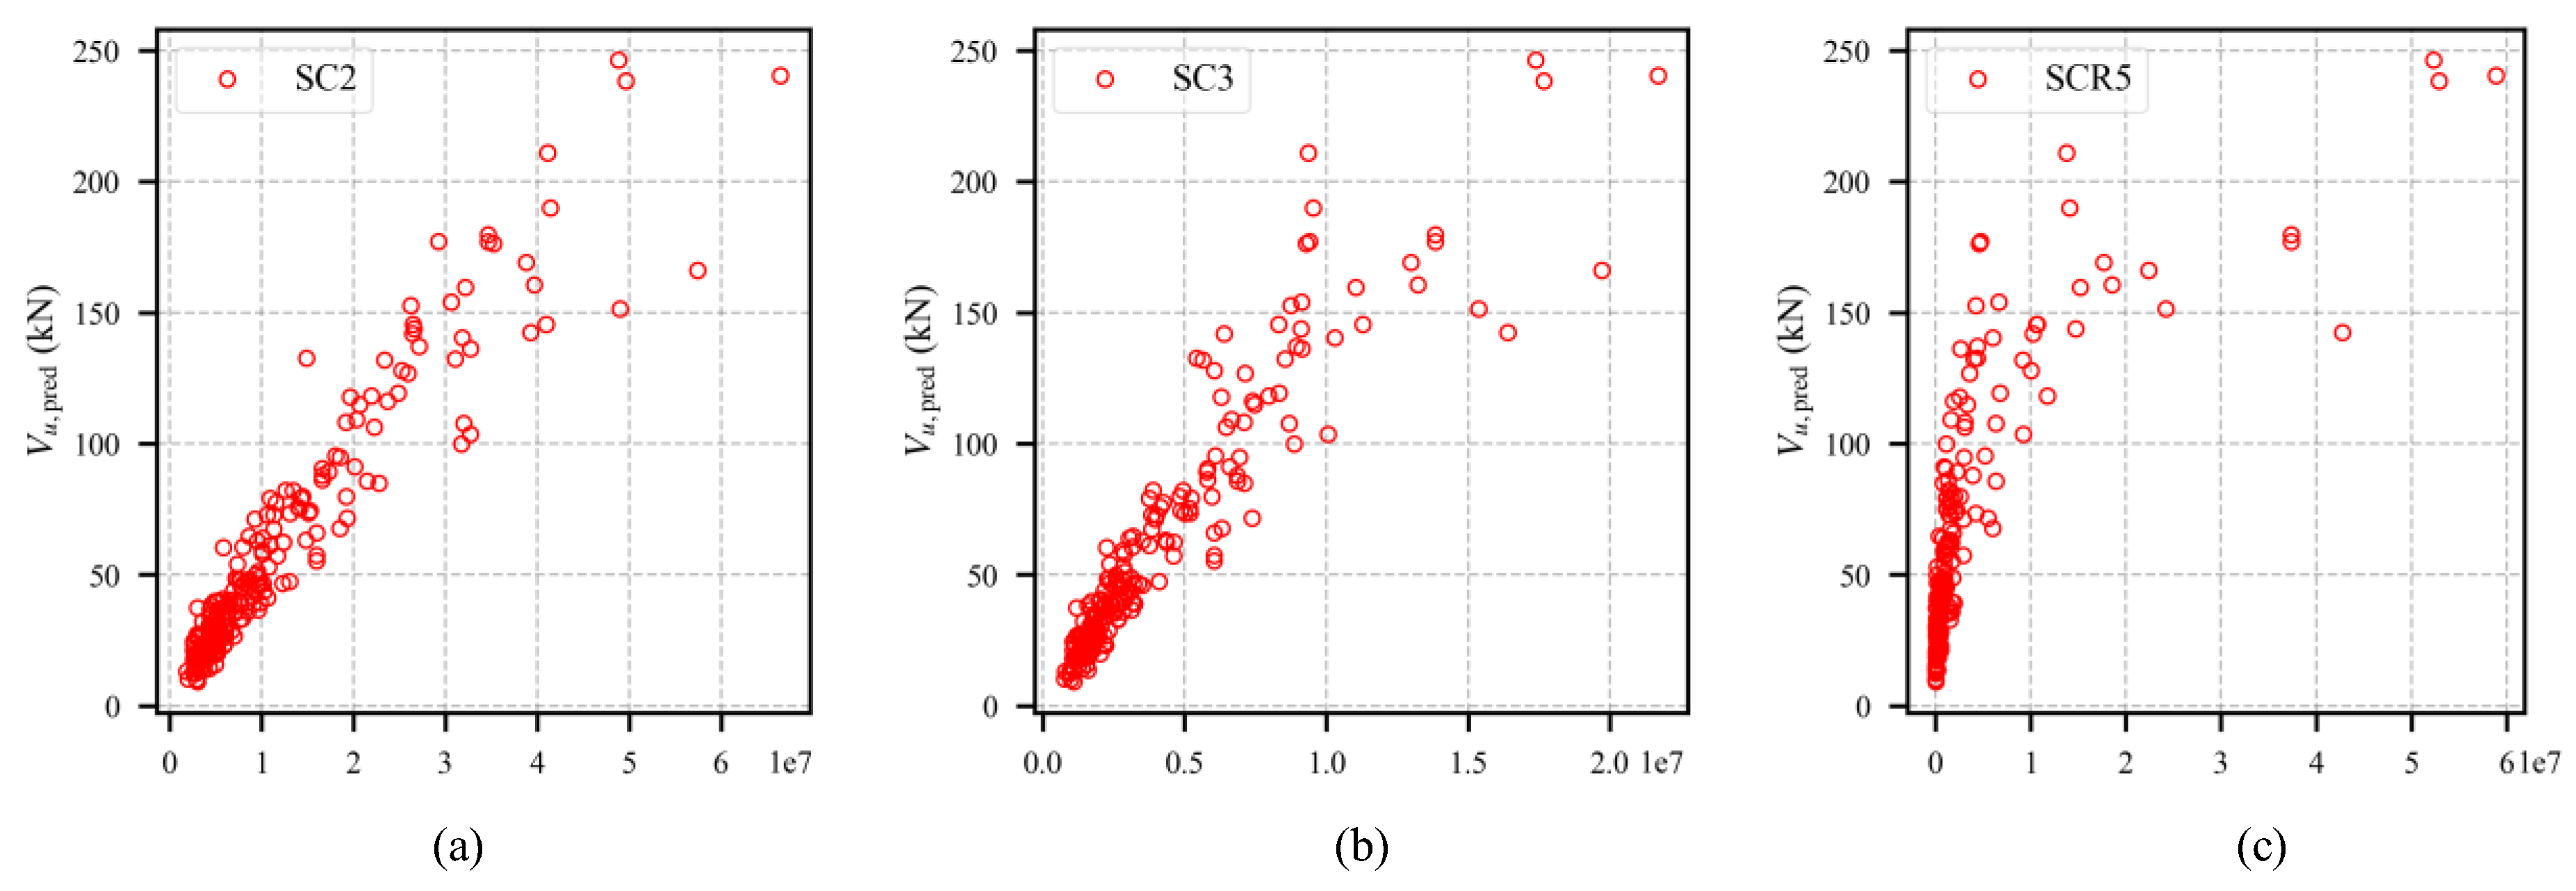
The significant improvement of the Linear Regression model could be attributed to the added features. The additional features have more linear relations with the predictions of the shear capacities of the database, as shown in Figure 8, and these linear relations could help to improve the accuracy and consistency of the Linear Regression model.
Note that there are also more artificially selected features and combinations that could be added to the ML models. For example, for features C and R, the root value could be numerous, but only the values adopted in the shear design provisions are adopted. However, this is the initial attempt of the authors to combine the knowledge of shear resistance of FRP-reinforced concrete beams obtained in the previous investigations and ML models. It is proposed to undertake further investigations on selecting more effective features to improve the validity of the ML models and to make the ML models more explainable in our future research.

7. Experimental Verification and Parametric Analysis

7.1. Test Verification

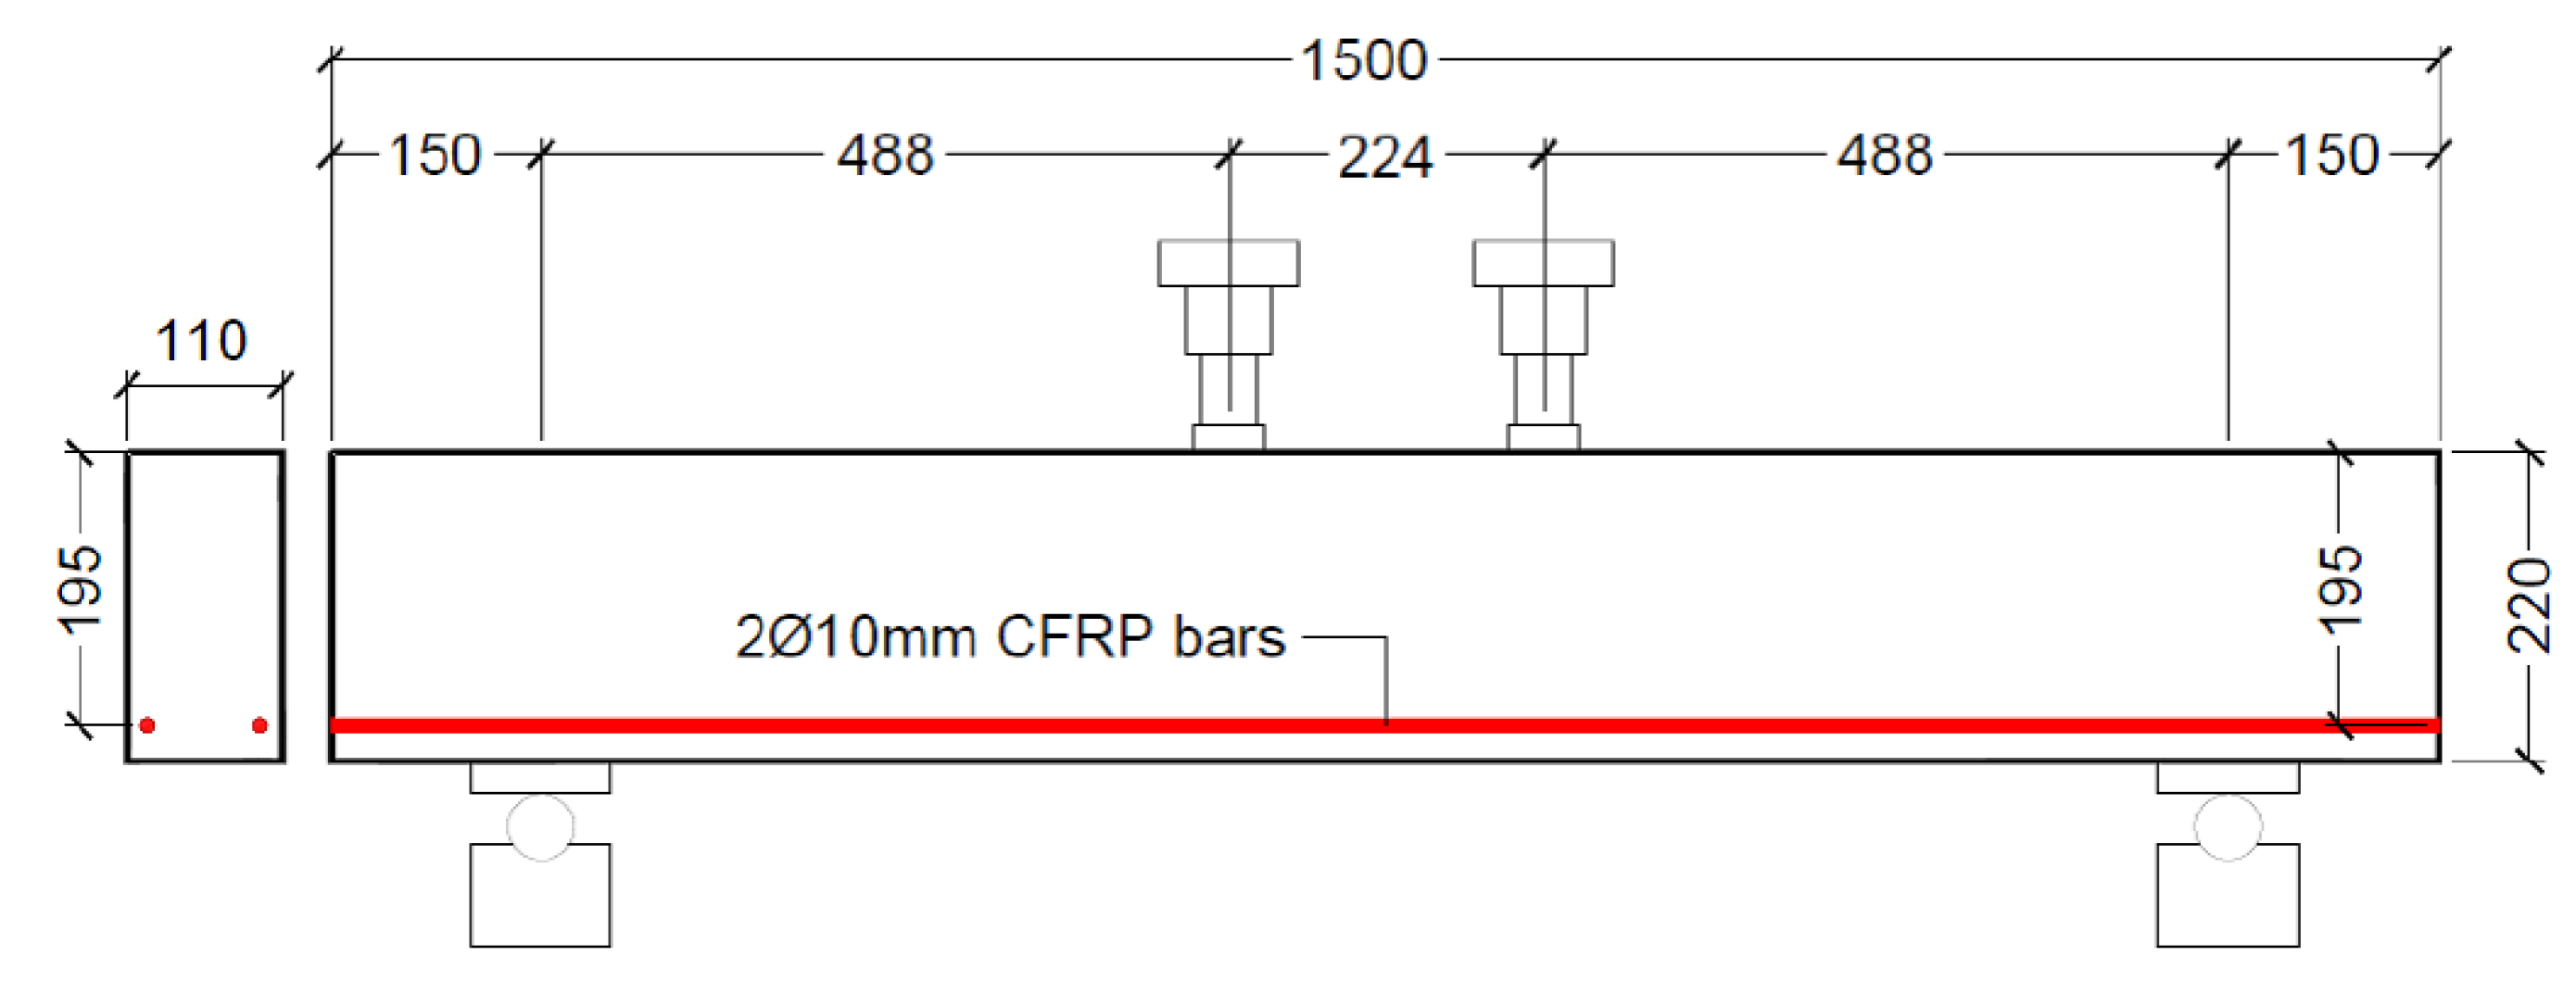
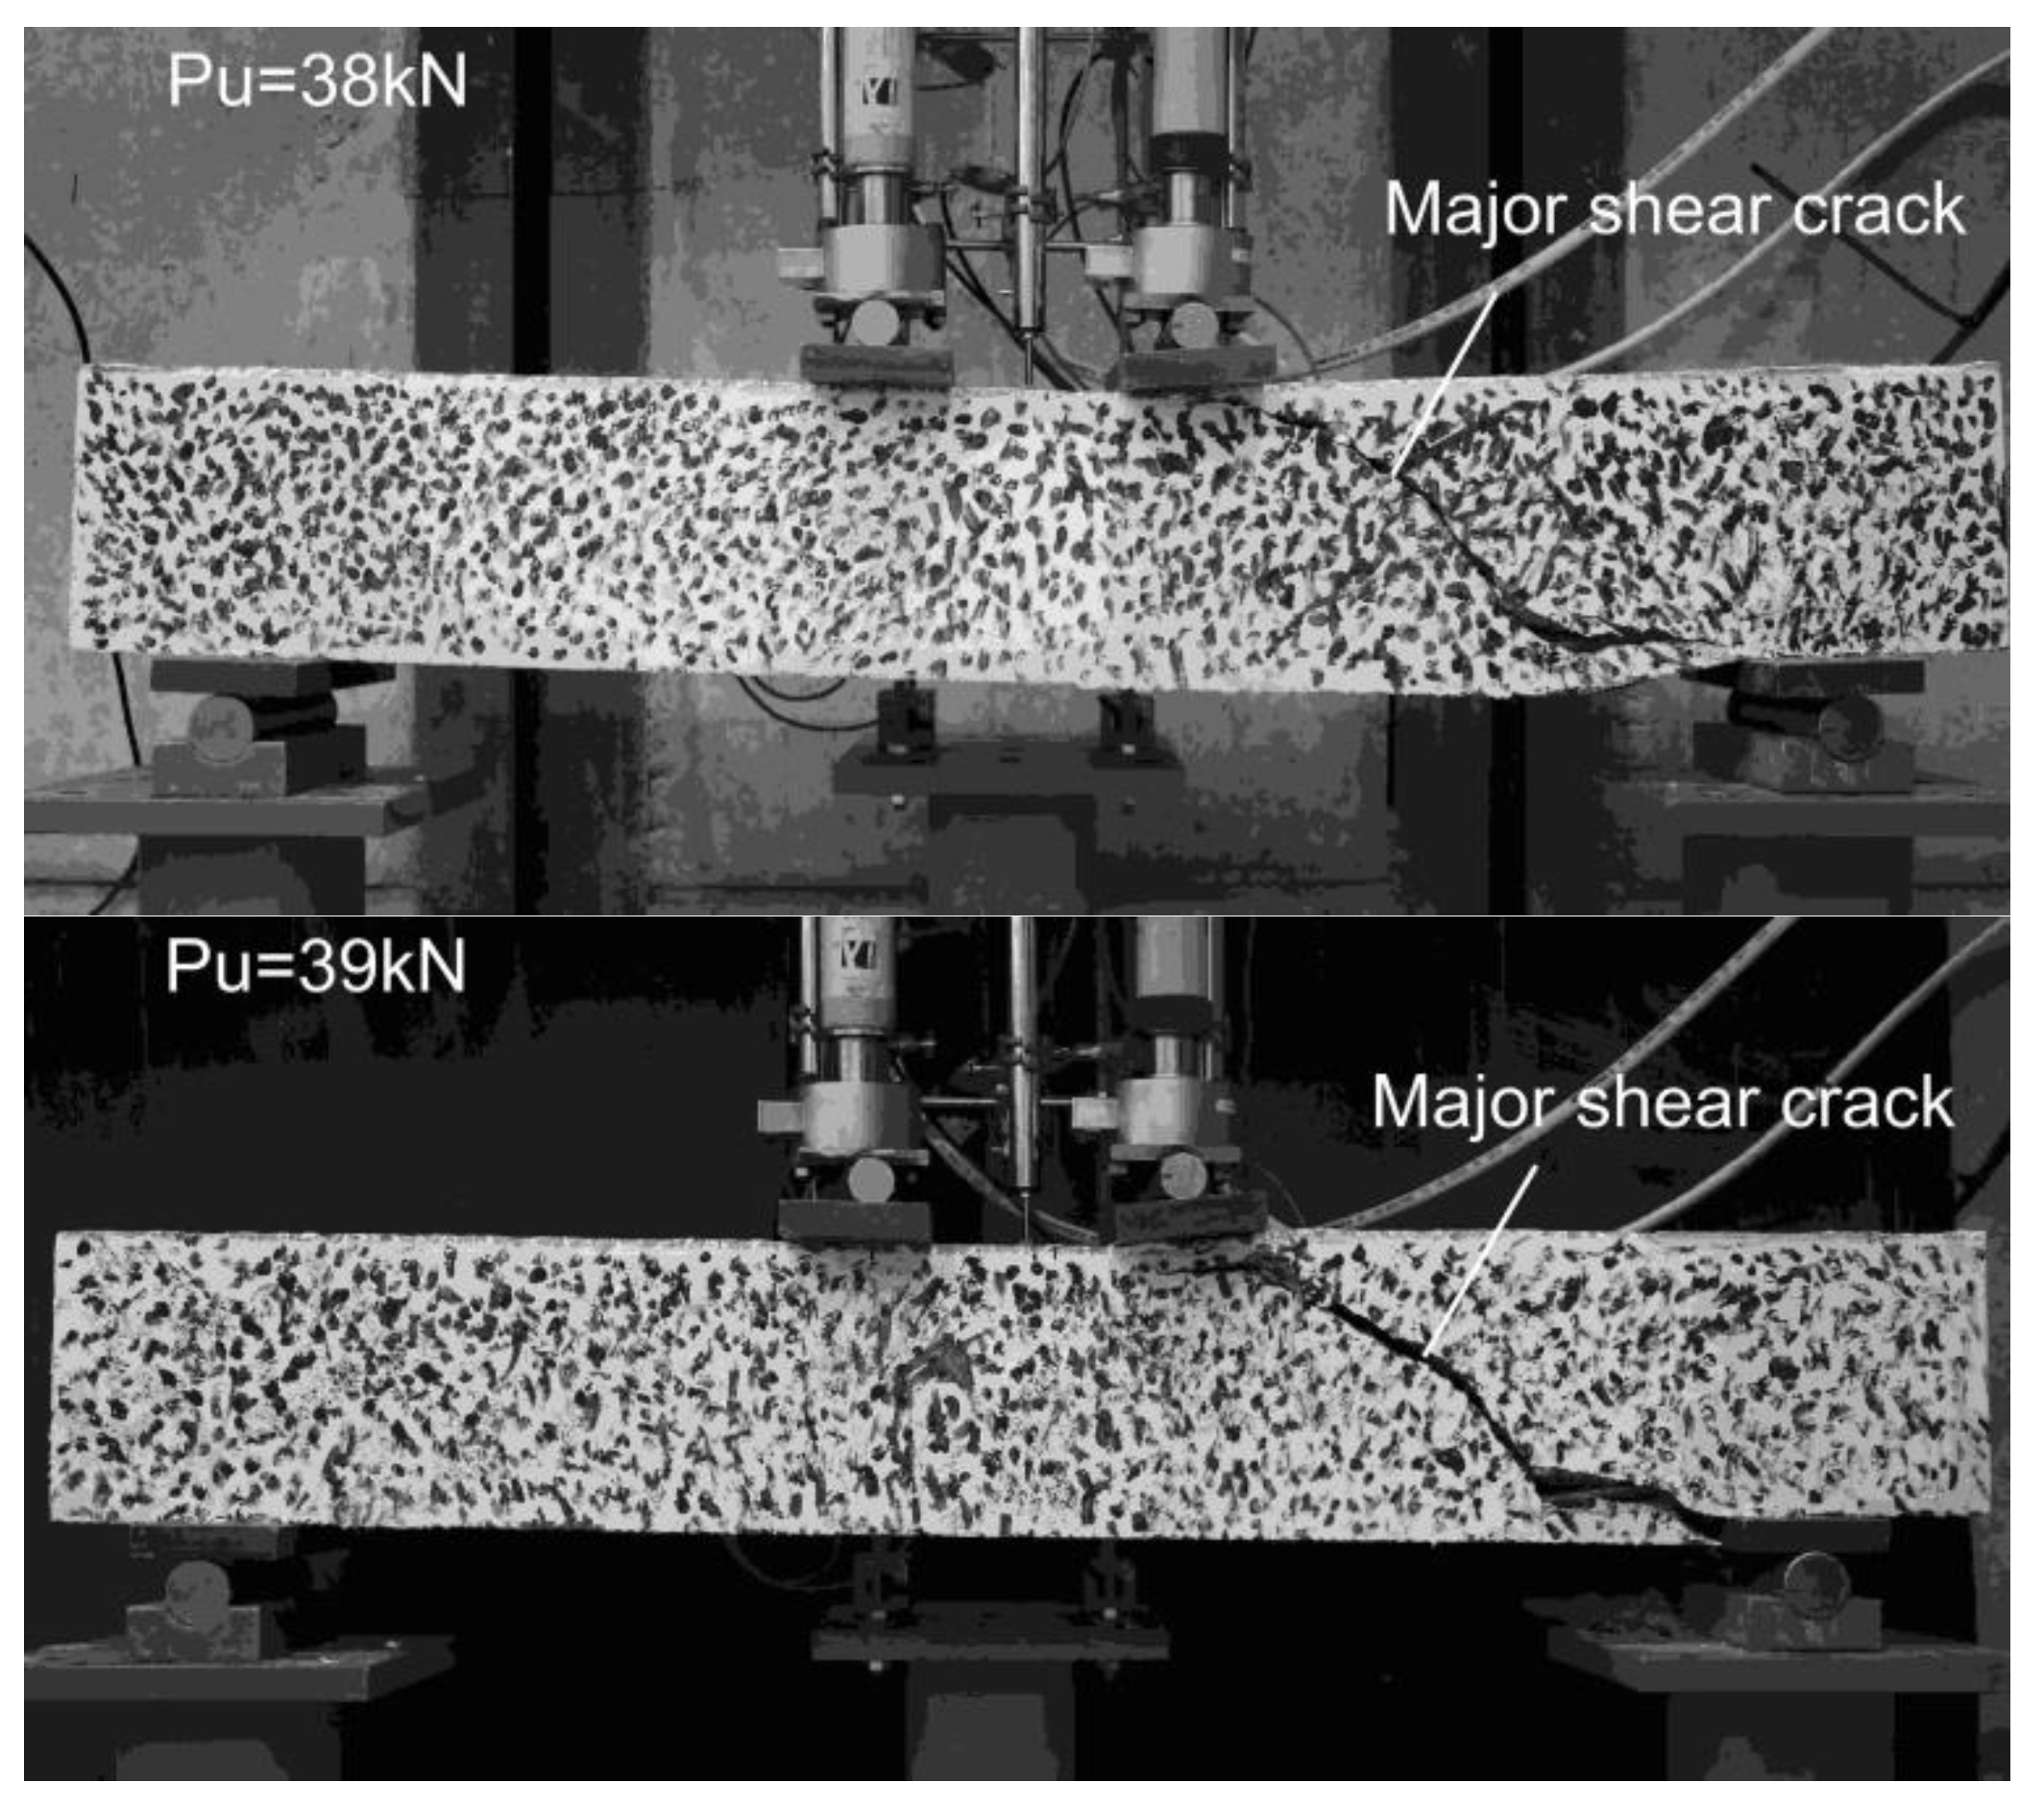
To further verify the validity of the proposed data-driven ML models with the artificial features for individual tests, the test results of two FRP-reinforced concrete beams without shear reinforcement tested by the authors (design configurations shown in Figure 9 and material properties shown in Table 5) are compared with the predictions in Table 6. Both of the two beams failed in shear as expected (Figure 10) with an average shear resistance of 19.3 kN (38.5 kN total applied load).
The ML models with added features could effectively predict the shear performance of the validation tests. The predictions of the ML models (with features) are all acceptable for the individual test, with V u , e x p / V u , p r e varying from 0.79 to 1.10. The best prediction is provided by the XGBoost with a difference of 8% from the test results. Although the Decision Tree and Linear Regression models have shown lower accuracy, they both could provide more desirable conservative predictions.

7.2. Parametric Analysis

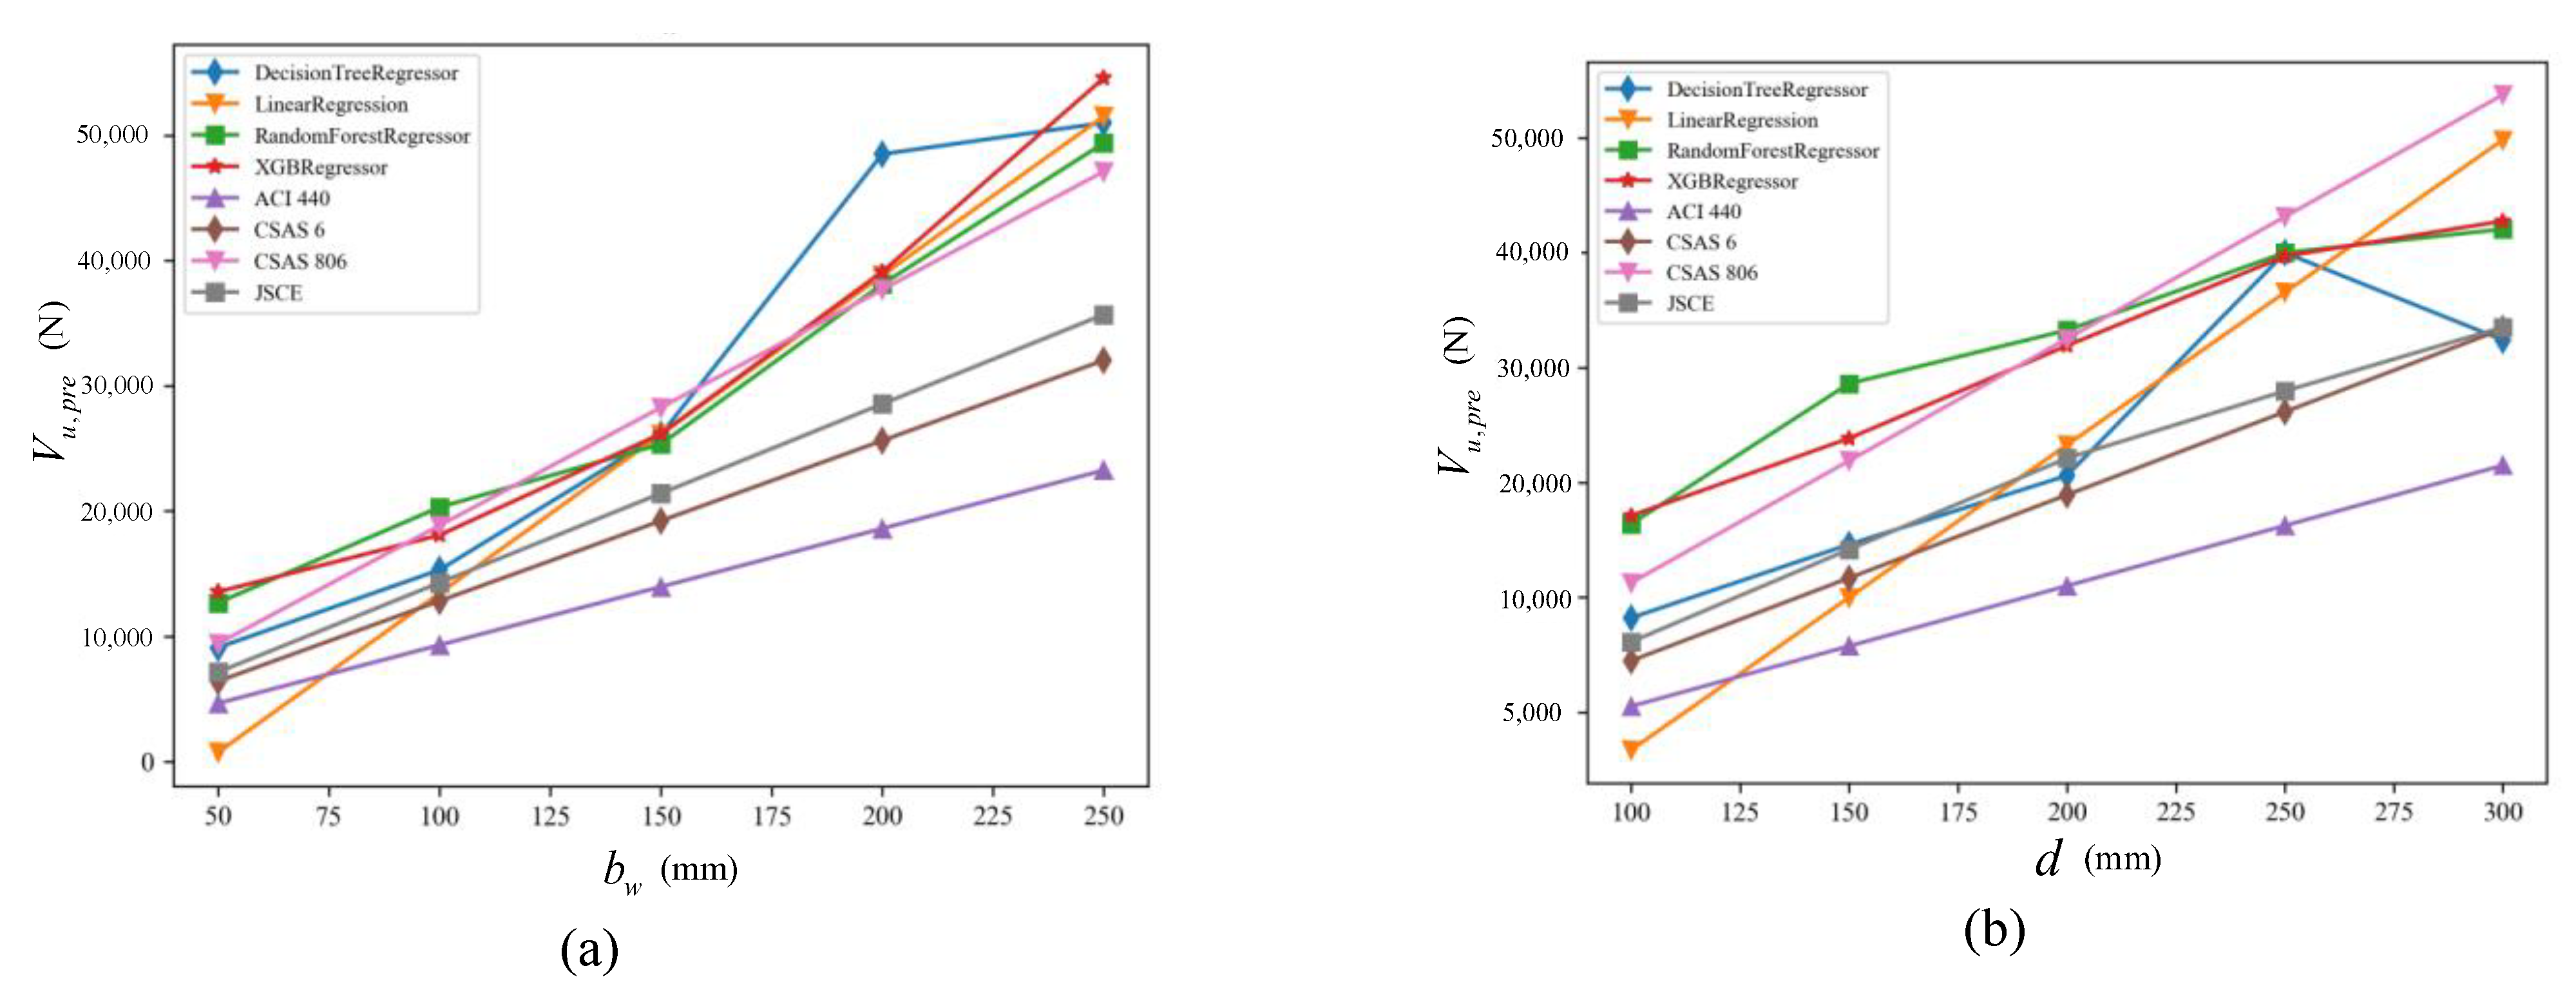
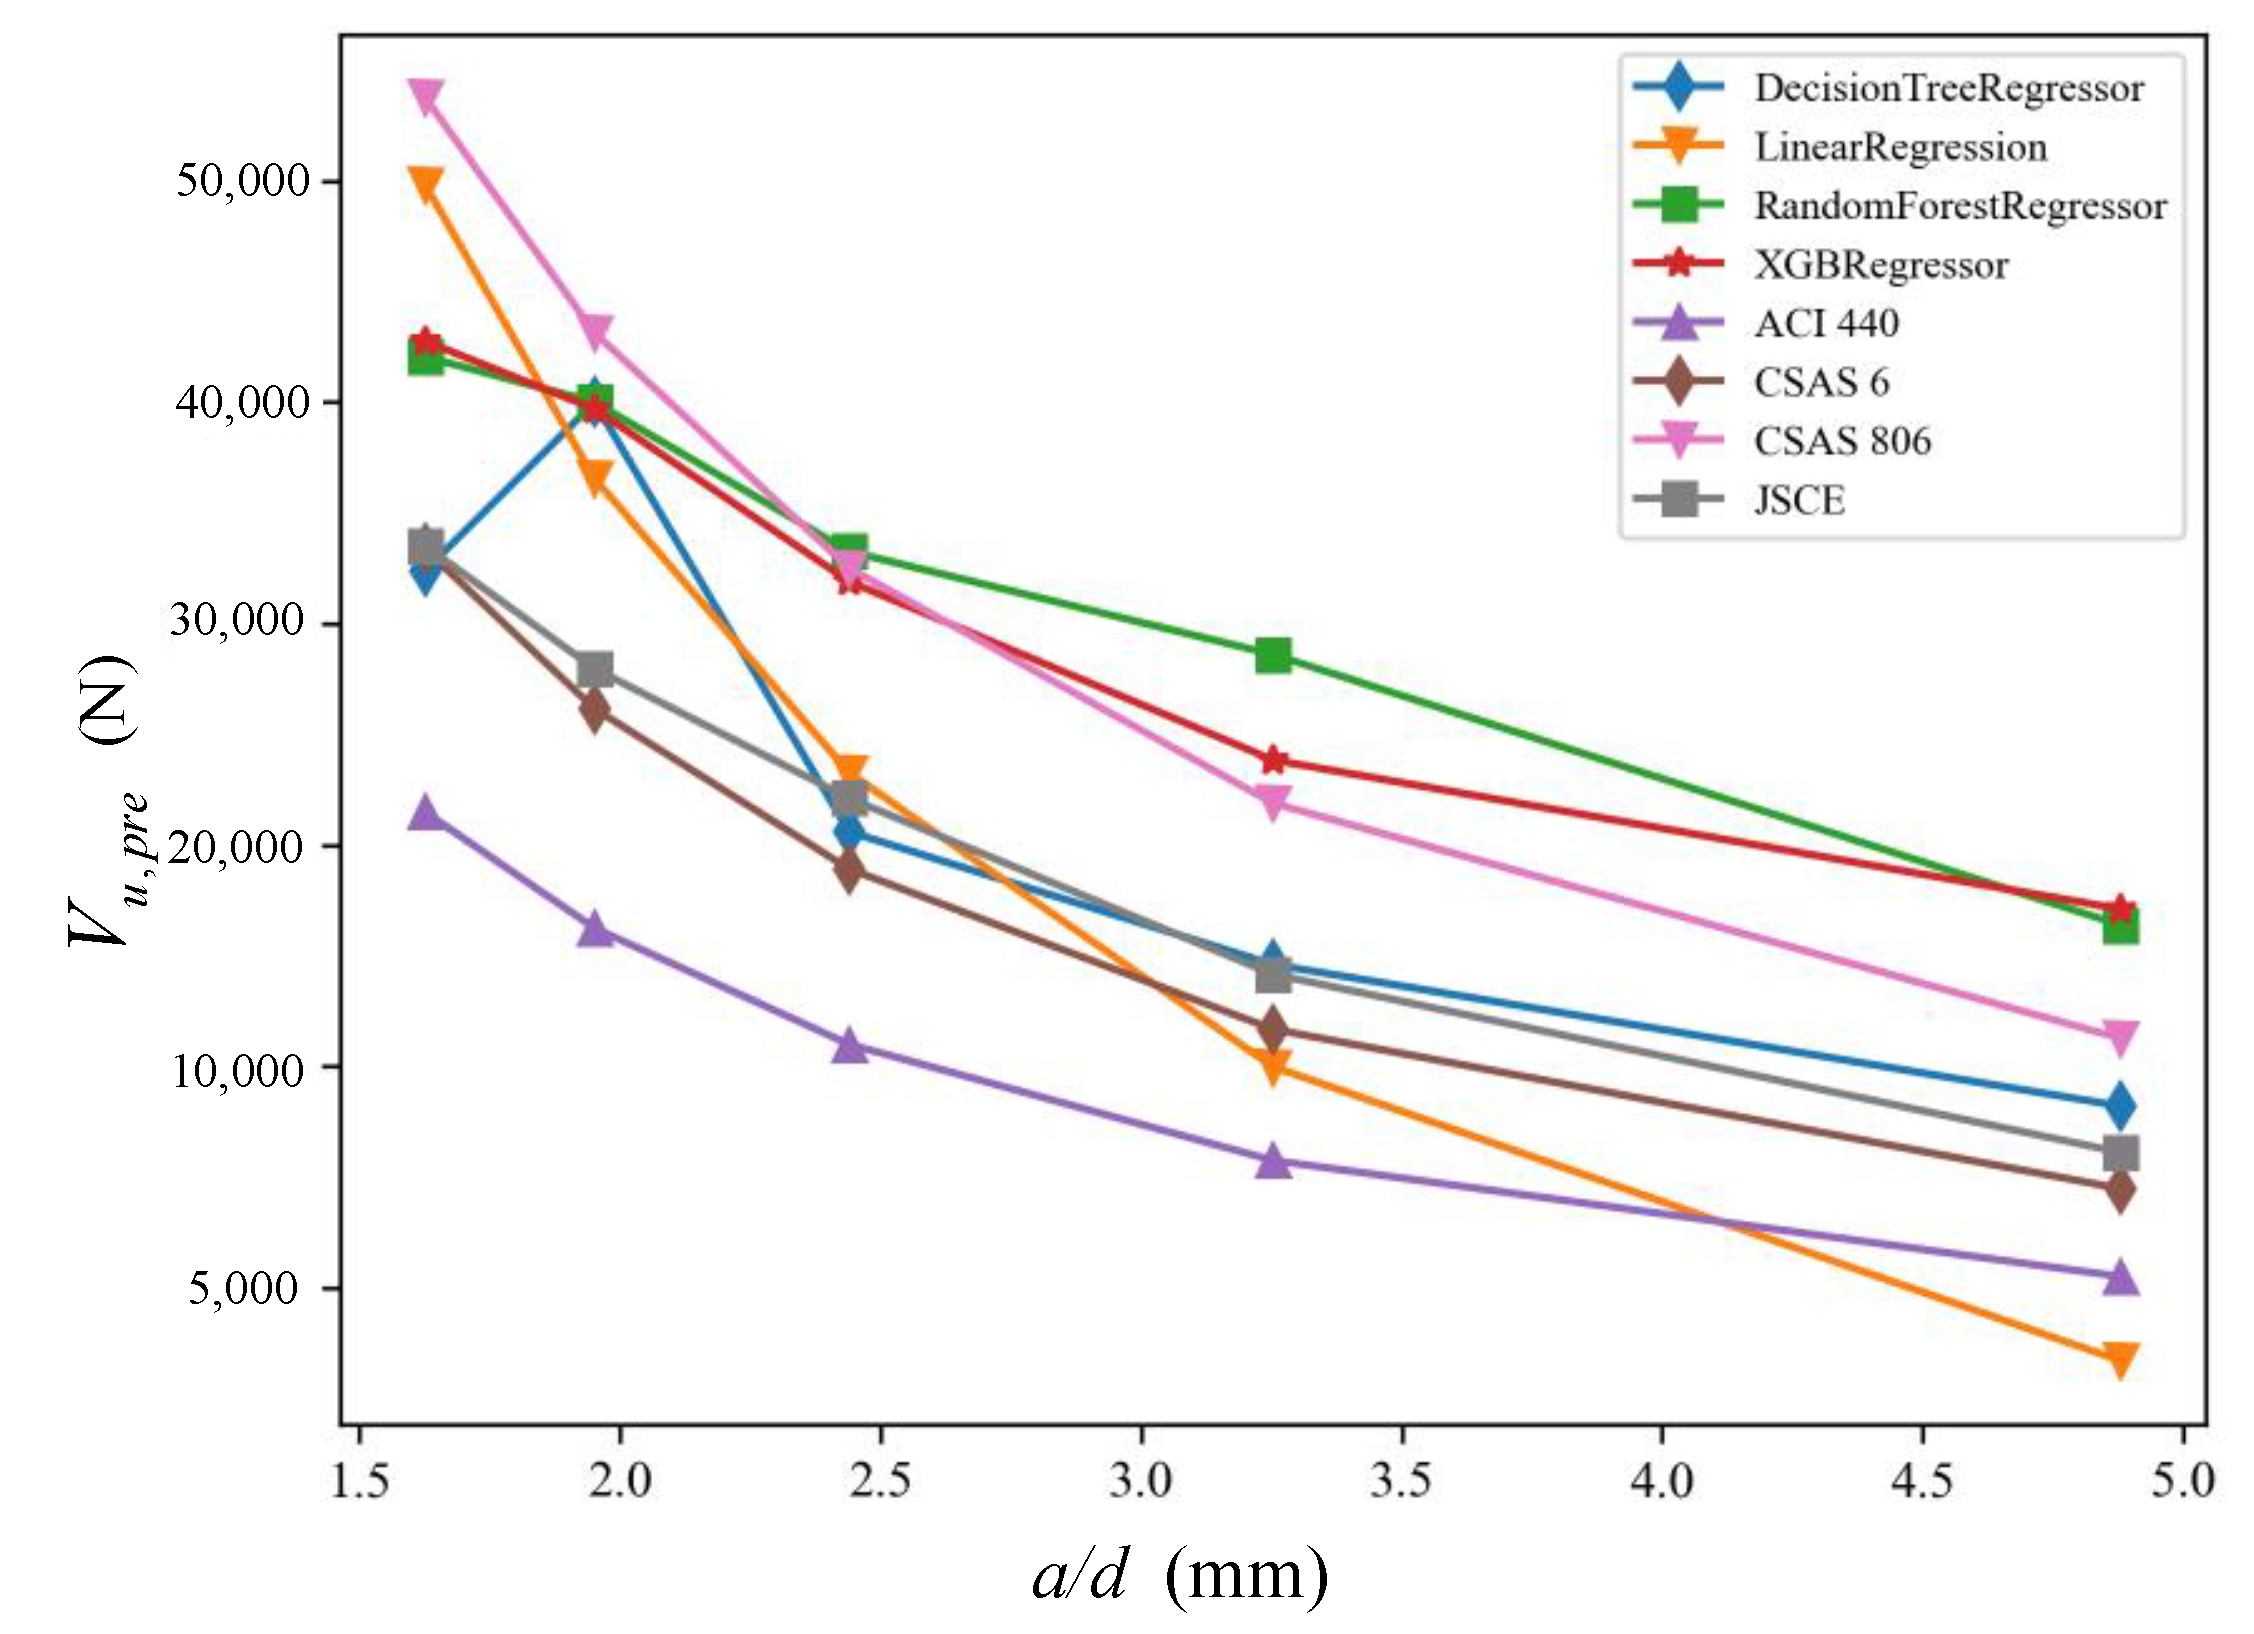
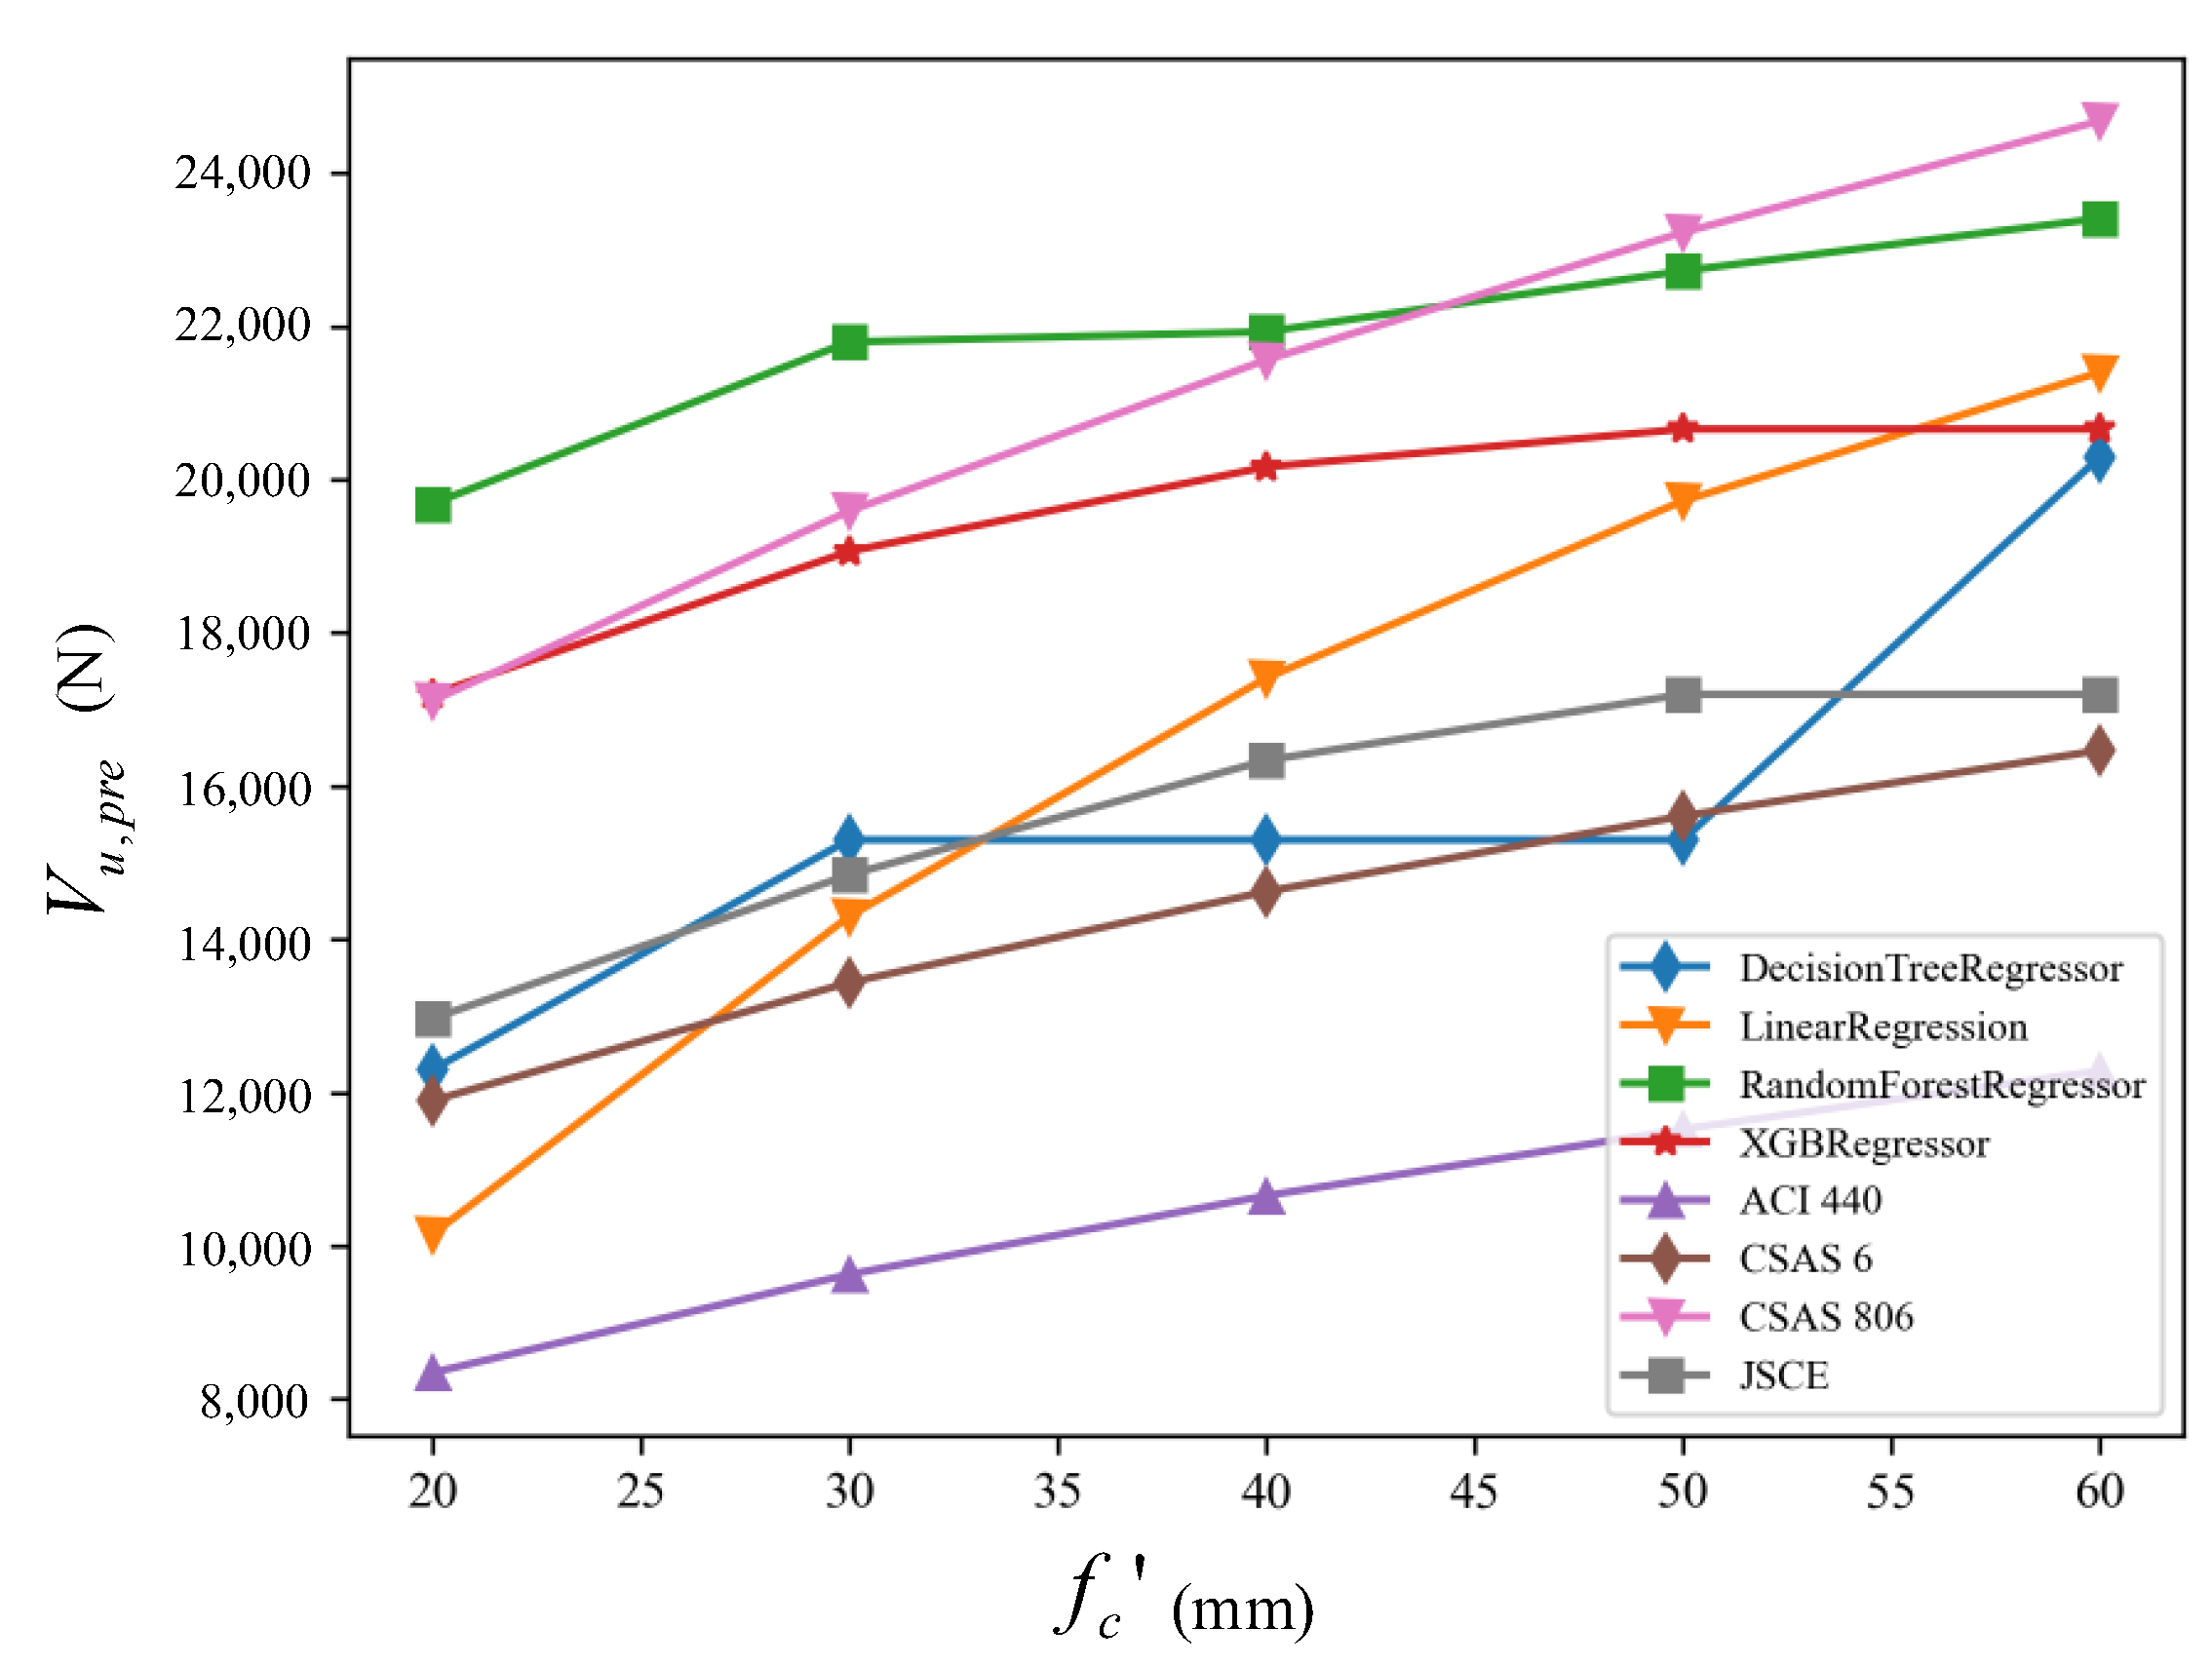
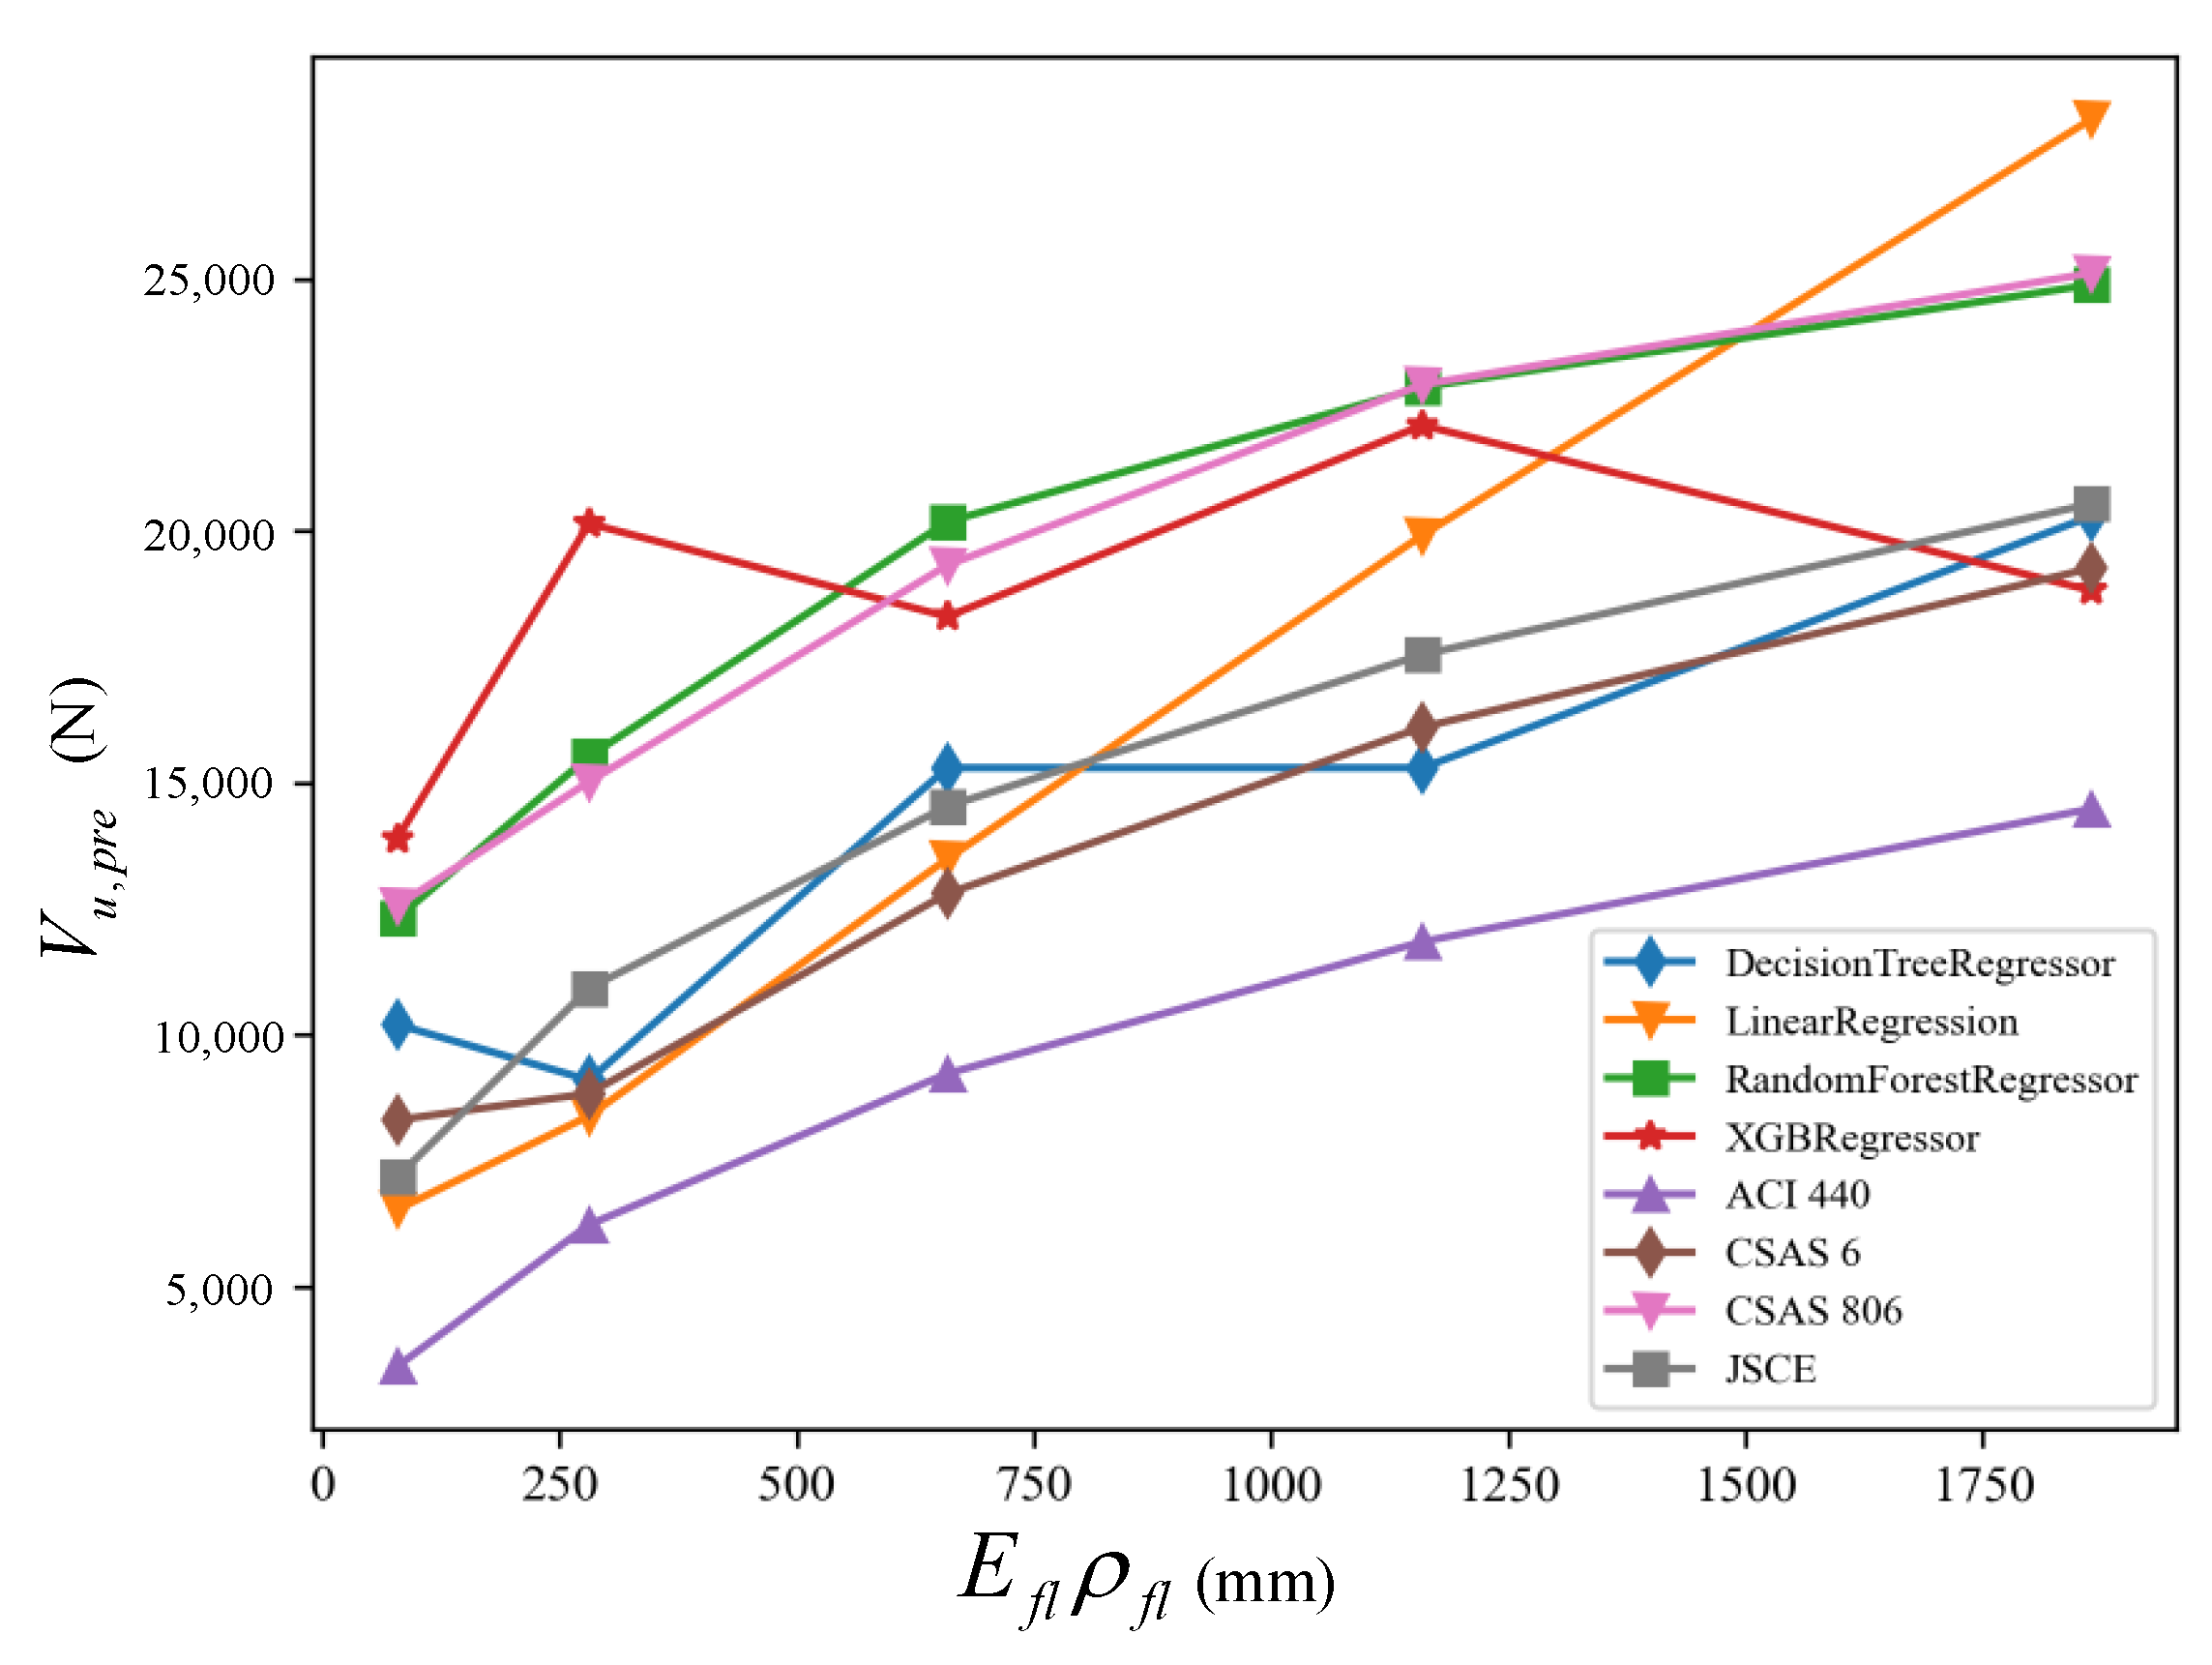
With satisfying predictions of ML models, further parametric analysis of the verification test specimens was conducted to investigate the effects of varying contributing parameters on shear performance, including cross-section dimensions ( b w and d ), test setup ( a / d ), concrete properties ( f c ) and reinforcement properties ( ρ f l and E f l ).
The effects of the beam cross-section dimensions are shown in Figure 11. For the web breadth, most of the predictions from shear design provisions increase linearly with b w , as it is normal to assume the shear stress keeps constant at failure. The same linear relationship is shown by the Linear Regression model but with a high slope. For the remaining ML models, the shear capacity increases with different slopes at a different level of b w . This could be attributed to the data distribution in the train set.
For the effective depth d , low nonlinearity is also seen from the JSCE prediction curve for the corporation of the factor of 1000 / d 4 in Equation (1), while for the remaining codified predictions, a linear relation between shear prediction and effective depth is found. The Linear Regression model also has a linear relation between d and the shear prediction with a higher slope than all codified predictions. The XGBoost and Random Forest model share a similar trend with JSCE with higher prediction values, which is also a reason for the higher accuracy. Note that the Decision Tree model has drastic slope changes between 200 mm and 300 mm effective depth. This could be caused by a relatively simple single model structure compared with other ensemble models such as XGBoost. The prediction results of the model may be affected by some outliers in the training set.
For the ratio of shear span to effective depth, all codified models and the Linear Regression model share a very similar trend (Figure 12). Random Forest model and XGBoost model show an approximately linear reduction of shear predictions along with the increasing a / d . Similar to the inconsistent performance in the analysis of beam cross-section dimensions, the Decision Tree model also has the odd drastic change of shear predictions, as this model is sensitive to the train set of the database.
Figure 13 shows that the shear strength predictions vary with increasing concrete strengths from 25 MPa to 60 MPa. As shown in Table 1, the predictions of the codified design provisions are related to f c or f c 3 . The XGBoost model and JSCE predictions show a similar curve slope related to f c 3 . With nonlinear relations between f c and the shear predictions, the Linear Regression model is more sensitive to the increasing f c than to the remaining prediction curves. The curve slope of the Random Forest model is similar to that of the CSA S6 and ACI 440 but with higher predictions, although it does not show explicit relation with f c , and the validity of the prediction curve is still higher.
As increasing the FRP reinforcement ratio and elastic modulus could result in a more effective aggregate interlock and limit crack width, the shear design provisions consider this axial rigidity effect by incorporating E f l ρ f l directly or indirectly. However, as shown in Figure 14, all the shear provisions show a similar trend, which is a function of E f l ρ f l or E f l ρ f l 3 . The Random Forest model shows a very similar prediction curve with the CSA S6, whilst the Linear Regression model shows a linear function of E f l ρ f l . The remaining two ML models cannot effectively provide an explicit trend for the variation of E f l ρ f l .
From the parametric analysis, it could be seen that the prediction validity of the machine learning models is extremely good for the whole database. Although the prediction validities are reduced for a singular test with different parameters, the ML approaches still provide more accurate predictions than do the codified approaches. To enhance their effectiveness, further experimental investigations on the shear performance of FRP-reinforced concrete beams are required to establish a larger database with more even data distributions.

8. Conclusions

This paper established an extensive database of shear tests of FRP-reinforced concrete beams with rectangular cross-sections. Based on the database, the accuracy of the existing codified shear design provisions and four proposed data-driven Machine Learning models are compared and analyzed. By considering the shear-carrying mechanisms of FRP-reinforced beams, a series of artificially selected features are selected to be incorporated into the proposed ML models and analysis is conducted to show their influence on the effectiveness of the ML models. An additional validation test is used to verify the accuracy of the proposed approaches with and without additional features on a singular test. This research supports the following conclusions:
1.
The codified shear design provisions provide conservative predictions with large variations with the mean ratio of V u , e x p / V u , p r e varying from 1.07 to 1.86 and the corresponding standard deviation varying from 0.21 to 0.31. The shear-carrying mechanism of FRP-reinforced concrete beams without stirrups could not be accurately described by the parameters of the design provisions.
2.
Compared to the design provisions, ML models significantly improve the prediction accuracy and reduce the variations, with the mean ratio of V u , e x p / V u , p r e of the ML models varying from 1.03 to 1.10 and the standard deviation varying from 0.09 to 0.20. XGBoost is the best model with the least dispersion, yielding the largest R2 of 0.92 as well as the smallest RMSE of 13.03 and MAE of 8.34, respectively.
3.
With artificially selected features, the effectiveness of the proposed ML models is further improved. The mean ratio of V u , e x p / V u , p r e of the ML models varies from 0.97 to 1.02 and the corresponding standard deviation is reduced, varying from 0.06 to 0.15.
4.
Nearly all the important features for the ML are the artificially selected ones, indicating that the importance of domain knowledge of shear strength of FRP-reinforced beams is effectively reflected in the four ML models. Further investigations on selecting more effective features could be undertaken to improve the validity of the ML models and to make the ML models more explainable.
5.
For the singular validation test, the initial ML models and the shear design provisions provide similar inaccurate predictions with large variations, whilst the ML models with artificially selected features successfully yield acceptable predictions. Verified with the established database and the validation test, the ML models with artificially selected features show great potential in guiding the shear design of FRP-reinforced concrete.

Author Contributions

Y.Y.: Experiment, investigation, writing—original draft and project administration. G.L.: Investigation, methodology, visualization, writing—original draft and funding acquisition. All authors have read and agreed to the published version of the manuscript.

Funding

This research was funded by the China Postdoctoral Science Foundation (Grant No. 2021M702866) and National Natural Science Foundation of China (52208216).

Data Availability Statement

The data presented in this study are available on request from the corresponding authors.

Conflicts of Interest

The authors declare no conflict of interest.

References

  1. Hollaway, L.C. A review of the present and future utilisation of FRP composites in the civil infrastructure with reference to their important in-service properties. Constr. Build. Mater. 2010, 24, 2419–2445. [Google Scholar] [CrossRef]
  2. Pendhari, S.S.; Kant, T.; Desai, Y.M. Application of polymer composites in civil construction: A general review. Compos. Struct. 2008, 84, 114–124. [Google Scholar] [CrossRef]
  3. FIB (Fédération Internationale du Béton Lausanne, Switzerland). FRP Reinforcement in RC Structures; Bulletin No. 40; FIB: Lausanne, Switzerland, 2007. [Google Scholar]
  4. Xue, W.; Peng, F.; Zheng, Q. Design Equations for Flexural Capacity of Concrete Beams Reinforced with Glass Fiber–Reinforced Polymer Bars. J. Compos. Constr. 2016, 20, 04015069. [Google Scholar] [CrossRef]
  5. Bischoff, P.H.; Gross, S.P. Design approach for calculating deflection of FRP-reinforced concrete. J. Compos. Constr. 2011, 15, 490–499. [Google Scholar] [CrossRef]
  6. Burgoyne, C.J. Rational use of advanced composites in concrete. Proc. Inst. Civ. Eng.-Struct. Build. 2001, 146, 253–262. [Google Scholar] [CrossRef]
  7. Ibell, T.; Darby, A.; Denton, S. Research issues related to the appropriate use of FRP in concrete structures. Constr. Build. Mater. 2009, 23, 1521–1528. [Google Scholar] [CrossRef] [Green Version]
  8. Bentz, E.C.; Massam, L.; Collins, M.P. Shear strength of large concrete members with FRP reinforcement. J. Compos. Constr. 2010, 14, 637–646. [Google Scholar] [CrossRef]
  9. El-Sayed, A.K.; Soudki, K. Evaluation of Shear Design Equations of Concrete Beams with FRP Reinforcement. J. Compos. Constr. 2011, 15, 9–20. [Google Scholar] [CrossRef]
  10. Hoult, N.A.; Sherwood, E.G.; Bentz, E.C.; Collins, M.P. Does the use of FRP reinforcement change the one-way shear behavior of reinforced concrete slabs? J. Compos. Constr. 2008, 12, 125–133. [Google Scholar] [CrossRef]
  11. Nagasaka, T.; Fukuyama, H.; Tanigaki, M. Shear performance of concrete beams reinforced with FRP stirrups. Spec. Publ. 1993, 138, 789–812. [Google Scholar]
  12. Razaqpur, A.G.; Spadea, S. Shear strength of FRP reinforced concrete members with stirrups. J. Compos. Constr. 2015, 19, 04014025. [Google Scholar] [CrossRef]
  13. Yang, Y.; Orr, J.; Ibell, T. Shear behaviour of fabric formed T beams reinforced using W-FRP. Structures 2020, 24, 869–879. [Google Scholar] [CrossRef]
  14. Razaqpur, A.G.; Isgor, O.B. Proposed shear design method for FRP-reinforced concrete members without stirrups. ACI Struct. J. 2006, 103, 93. [Google Scholar]
  15. Tureyen, A.K.; Frosch, R.J. Concrete shear strength: Another perspective. Struct. J. 2003, 100, 609–615. [Google Scholar]
  16. Tureyen, A.K.; Frosch, R. Shear tests of FRP-reinforced concrete beams without stirrups. ACI Struct. J. 2002, 99, 427–434. [Google Scholar]
  17. ACI 440.1R-15; Guide for the Design and Construction of Concrete Reinforced with FRP Bars. ACI (American Concrete Institute): Farmington Hills, MI, USA, 2015.
  18. Peng, F.; Xue, W.; Xue, W. Database evaluation of shear strength of slender fiber-reinforced polymer-reinforced concrete members. ACI Struct. J. 2020, 117, 273–281. [Google Scholar]
  19. CNR-DT 203/2006; Guide for the Design and Construction of Concrete Structures Reinforced with Fiber-Reinforced Polymer Bars. CNR: Rome, Italy, 2007.
  20. CSA S806-12; Design and Construction of Building Structures with Fibre-Reinforced Polymers. CSA (Canadian Standards Association): Toronto, ON, Canada, 2012.
  21. CSA (Canadian Standards Association). Canadian Highway Bridge Design Code; CSA (Canadian Standards Association): Toronto, ON, Canada, 2014. [Google Scholar]
  22. IStructE. Interim Guidance on the Design of Reinforced Concrete Structures Using Fibre Composite Reinforcement; IStructE: London, UK, 1999. [Google Scholar]
  23. JSCE. Recommendation for Design and Construction of Concrete Structures Using Continuous Fiber Reinforcing Materials; JSCE: Tokyo, Japan, 1997. [Google Scholar]
  24. Feng, D.-C.; Liu, Z.-T.; Wang, X.-D.; Chen, Y.; Chang, J.-Q.; Wei, D.-F.; Jiang, Z.-M. Machine learning-based compressive strength prediction for concrete: An adaptive boosting approach. Constr. Build. Mater. 2020, 230, 117000. [Google Scholar] [CrossRef]
  25. Salehi, H.; Burgueño, R. Emerging artificial intelligence methods in structural engineering. Eng. Struct. 2018, 171, 170–189. [Google Scholar] [CrossRef]
  26. Rahman, J.; Ahmed, K.S.; Khan, N.I.; Islam, K.; Mangalathu, S. Data-driven shear strength prediction of steel fiber reinforced concrete beams using machine learning approach. Eng. Struct. 2021, 233, 111743. [Google Scholar] [CrossRef]
  27. Azadi Kakavand, M.R.; Sezen, H.; Taciroglu, E. Data-Driven Models for Predicting the Shear Strength of Rectangular and Circular Reinforced Concrete Columns. J. Struct. Eng. 2021, 147, 04020301. [Google Scholar] [CrossRef]
  28. Yu, Y.; Zhao, X.; Xu, J.; Chen, C.; Deresa, S.; Zhang, J. Machine Learning-Based Evaluation of Shear Capacity of Recycled Aggregate Concrete Beams. Materials 2020, 13, 4552. [Google Scholar] [CrossRef] [PubMed]
  29. Solhmirzaei, R.; Salehi, H.; Kodur, V.; Naser, M.Z. Machine learning framework for predicting failure mode and shear capacity of ultra high performance concrete beams. Eng. Struct. 2020, 224, 111221. [Google Scholar] [CrossRef]
  30. Uddin, M.N.; Yu, K.; Li, L.; Ye, J.; Tafsirojjaman, T.; Alhaddad, W. Developing machine learning model to estimate the shear capacity for RC beams with stirrups using standard building codes. Innov. Infrastruct. Solut. 2022, 7, 227. [Google Scholar] [CrossRef]
  31. Wakjira, T.G.; Ebead, U.; Alam, M.S. Machine learning-based shear capacity prediction and reliability analysis of shear-critical RC beams strengthened with inorganic composites. Case Stud. Constr. Mater. 2022, 16, e01008. [Google Scholar] [CrossRef]
  32. Feng, D.-C.; Wang, W.-J.; Mangalathu, S.; Hu, G.; Wu, T. Implementing ensemble learning methods to predict the shear strength of RC deep beams with/without web reinforcements. Eng. Struct. 2021, 235, 111979. [Google Scholar] [CrossRef]
  33. Khaleghi, M.; Salimi, J.; Farhangi, V.; Moradi, M.J.; Karakouzian, M. Evaluating the behaviour of centrally perforated unreinforced masonry walls: Applications of numerical analysis, machine learning, and stochastic methods. Ain Shams Eng. J. 2022, 13, 101631. [Google Scholar] [CrossRef]
  34. Moradi, M.J.; Khaleghi, M.; Salimi, J.; Farhangi, V.; Ramezanianpour, A.M. Predicting the compressive strength of concrete containing metakaolin with different properties using ANN. Measurement 2021, 183, 109790. [Google Scholar] [CrossRef]
  35. Abuodeh, O.R.; Abdalla, J.A.; Hawileh, R.A. Prediction of shear strength and behavior of RC beams strengthened with externally bonded FRP sheets using machine learning techniques. Compos. Struct. 2020, 234, 111698. [Google Scholar] [CrossRef]
  36. Chen, S.-Z.; Zhang, S.-Y.; Han, W.-S.; Wu, G. Ensemble learning based approach for FRP-concrete bond strength prediction. Constr. Build. Mater. 2021, 302, 124230. [Google Scholar] [CrossRef]
  37. Keshtegar, B.; Gholampour, A.; Thai, D.-K.; Taylan, O.; Trung, N.-T. Hybrid regression and machine learning model for predicting ultimate condition of FRP-confined concrete. Compos. Struct. 2021, 262, 113644. [Google Scholar] [CrossRef]
  38. Perera, R.; Arteaga, A.; Diego, A.D. Artificial intelligence techniques for prediction of the capacity of RC beams strengthened in shear with external FRP reinforcement. Compos. Struct. 2010, 92, 1169–1175. [Google Scholar] [CrossRef] [Green Version]
  39. Su, M.; Peng, H.; Yuan, M.; Li, S. Identification of the interfacial cohesive law parameters of FRP strips externally bonded to concrete using machine learning techniques. Eng. Fract. Mech. 2021, 247, 107643. [Google Scholar] [CrossRef]
  40. Naser, M.Z. Machine Learning Assessment of Fiber-Reinforced Polymer-Strengthened and Reinforced Concrete Members. Struct. J. 2020, 117, 237–251. [Google Scholar] [CrossRef]
  41. Wakjira, T.G.; Abushanab, A.; Ebead, U.; Alnahhal, W. FAI: Fast, accurate, and intelligent approach and prediction tool for flexural capacity of FRP-RC beams based on super-learner machine learning model. Mater. Today Commun. 2022, 33, 104461. [Google Scholar] [CrossRef]
  42. Al-Hamrani, A.; Wakjira, T.G.; Alnahhal, W.; Ebead, U. Sensitivity analysis and genetic algorithm-based shear capacity model for basalt FRC one-way slabs reinforced with BFRP bars. Compos. Struct. 2023, 305, 116473. [Google Scholar] [CrossRef]
  43. Wakjira, T.G.; Ibrahim, M.; Ebead, U.; Alam, M.S. Explainable machine learning model and reliability analysis for flexural capacity prediction of RC beams strengthened in flexure with FRCM. Eng. Struct. 2022, 255, 113903. [Google Scholar] [CrossRef]
  44. Wakjira, T.G.; Al-Hamrani, A.; Ebead, U.; Alnahhal, W. Shear capacity prediction of FRP-RC beams using single and ensenble ExPlainable Machine learning models. Compos. Struct. 2022, 287, 115381. [Google Scholar] [CrossRef]
  45. Borisov, V.; Leemann, T.; Seßler, K.; Haug, J.; Pawelczyk, M.; Kasneci, G. Deep Neural Networks and Tabular Data: A Survey. IEEE Trans. Neural Netw. Learn. Syst. 2022, 1–21. [Google Scholar] [CrossRef]
  46. Shwartz-Ziv, R.; Armon, A. Tabular data: Deep learning is not all you need. Inf. Fusion 2022, 81, 84–90. [Google Scholar] [CrossRef]
  47. Montgomery, D.C.; Peck, E.A.; Vining, G.G. Introduction to Linear Regression Analysis; John Wiley & Sons: Hoboken, NJ, USA, 2021. [Google Scholar]
  48. Hutter, F.; Hoos, H.; Leyton-Brown, K. An Efficient Approach for Assessing Hyperparameter Importance. In Proceedings of the 31st International Conference on Machine Learning, PMLR, Beijing, China, 21–26 June 2014; pp. 754–762. Available online: https://proceedings.mlr.press/v32/hutter14.html (accessed on 17 October 2022).
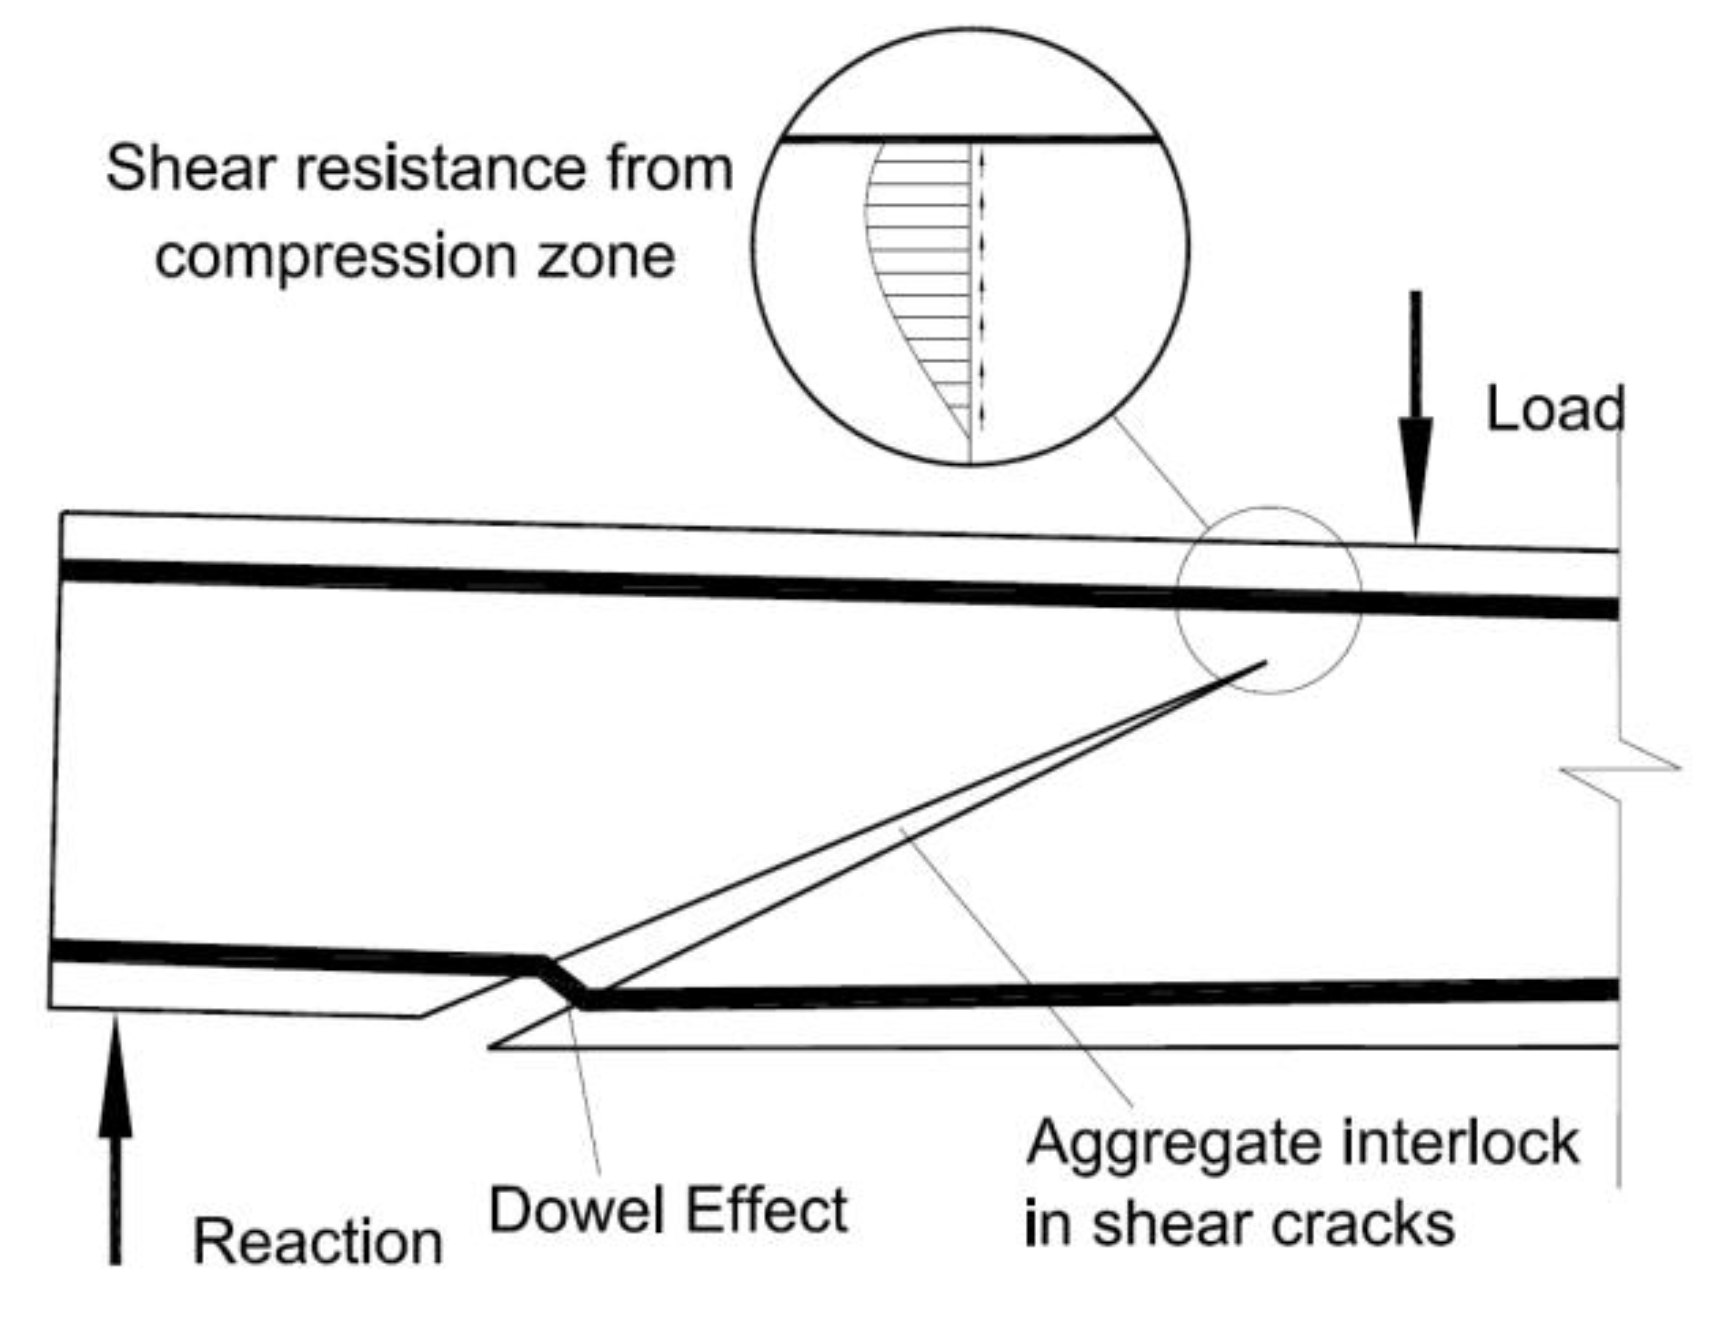
Figure 1. Shear-carrying mechanism of FRP-reinforced concrete beams without shear reinforcement.
Buildings 13 00313 g001
Figure 2. Distributions and correlations between the input features.
Buildings 13 00313 g002
Figure 3. R2 history of Bayesian optimization.
Buildings 13 00313 g003
Figure 4. Hyperparameter importance of XGBoost.
Buildings 13 00313 g004
Figure 5. Bayesian hyperparameter optimization process for 100 iterations.
Buildings 13 00313 g005
Figure 6. Comparisons of test results and predictions of shear design provisions and ML models: shear design provisions: (a) ACI 440, (b) CSA S6, (c) CSA S806, (d) JSCE; basic ML models: (e) Decision Tree, (f) Linear Regression, (g) Random Forest, (h) XGBoost; ML models with additional features: (i) Decision Tree, (j) Linear Regression, (k) Random Forest, (l) XGBoost.
Buildings 13 00313 g006aBuildings 13 00313 g006b
Figure 7. Relative importance of input features of the basic ML models ((a) Decision Tree; (b) Random Forest; (c) XGBoost) and ML models with additional features ((d) Decision Tree; (e) Random Forest; (f) XGBoost).
Buildings 13 00313 g007
Figure 8. Data scatter of added features: (a) SC2; (b) SC3 and (c) SCR5.
Buildings 13 00313 g008
Figure 9. Validation test setup and beam dimensions.
Buildings 13 00313 g009
Figure 10. Shear failure of the two validation beams.
Buildings 13 00313 g010
Figure 11. Effects of web breadth (a) and effective depth (b) on shear performance.
Buildings 13 00313 g011
Figure 12. Effects of the shear span-depth ratio on shear performance.
Buildings 13 00313 g012
Figure 13. Effects of concrete strength on shear performance.
Buildings 13 00313 g013
Figure 14. Effects of axial rigidity of FRP reinforcement E f l ρ f l on shear performance.
Buildings 13 00313 g014
Table 1. Shear provisions of concrete contribution.
GuidelinesShear Design Provisions
JSCE (1997) V c = 1000 / d 4 100 ρ f l E f l / E s 3 0.2 ( f c ) 1 / 3 b d
where 1000 / d 4   and   100 ρ f l E f l / E s 3 1.5   a n d   0.2 ( f c ) 1 3 0.72 M P a
(1)
ACI 440.1R (2015) V c = 0.4 f c b k d
where k = 2 ρ f l n f l + ( ρ f l n f l ) 2 ρ f l n f l   a n d   n f l = E f l / E c
(2)
CSA S6 (2014) V c = 2.5 β ϕ c f c r b d v
where β = 0.4 ( 1 + 1500 ε x ) 1300 ( 1000 + S z e )   a n d   ε x = M f / V f + V f 2 ( E f A f ) 0.003
(3)
CSA S806 (2012) V c = 0.11 ϕ c ( f c ) 1 / 2 b d v 0.05 λ ϕ c k m k r k s k a ( f c ) 1 / 3 b d v 0.22 ϕ c ( f c ) 1 / 2 b d v
where k m = V f d / M f 1.0 ;   k r = 1 + ( ρ f l E f l ) 1 / 3 ; k a = 2.5 V f d / M f 1.0 ; k s = 750 / ( 450 + d ) 1.0
(4)
Note: d is beam effective depth; b is beam width; ρ f l is flexural reinforcement ratio; E f l is elastic modulus of FRP flexural reinforcing bars; E f l is elastic modulus of steel reinforcing bars; f c is concrete cylinder strength at 28 days; E c is concrete elastic modulus; f c r is concrete crack strength, calculated as 0.4 f c ; S z e is the equivalent cracking spacing parameter considering aggregate size; V f and M f are applied shear force and bending moment, respectively; d v is shear effective depth; ϕ c is coefficient accounting for concrete type.
Table 2. Statistics of database.
ParameterMeanMaxMinSDCOV
Beam geometry d (mm)258.393773141.30.55
b w (mm)221.24578995.10.43
a / d 3.582.51.10.31
Concrete f c (MPa)46.21022017.10.37
Reinforcement f f u (MPa)1091.52840397535.00.49
E f (MPa)70.91482940.70.57
ρ f l (%)1.211.460.111.41.17
Shear capacity V u , e x p (kN)78.3396.39.166.80.85
Table 3. Artificially selected input features.
FeaturesFeature DescriptionNotionCalculation Method
Beam featureGeometry G b w d
Concrete C 1 f c
C 2 f c 3
Reinforcement R 1 E f ρ f l
R 2 E f ρ f l
R 3 E f ρ f l 3
Shear capacity featuresShear capacity calculation S C R 1 f c b w d E f ρ f l / ( λ + 1 )
S C R 2 f c b w d E f ρ f l / ( λ + 1 )
S C R 3 f c b w d E f ρ f l 3 / ( λ + 1 )
S C R 4 f c 3 b w d E f ρ f l / ( λ + 1 )
S C R 5 f c 3 b w d E f ρ f l / ( λ + 1 )
S C R 6 f c 3 b w d E f ρ f l 3 / ( λ + 1 )
S C 1 f c b w d E f ρ f l
S C 2 f c b w d E f ρ f l
S C 3 f c b w d E f ρ f l 3
S C 4 f c 3 b w d E f ρ f l
S C 5 f c 3 b w d E f ρ f l
S C 6 f c 3 b w d E f ρ f l 3
Table 4. Means and standard deviations of the statistical properties of Monte Carlo simulation.
Provision V u , e x p / V u , p r e MAERMSER2
JSCE (1997)1.39 ( ± 0.22 )22.31 ( ± 2.17 )37.21 ( ± 4.01 )0.77 ( ± 0.19 )
ACI 440.1R (2015)1.86 ( ± 0.31 )39.84 ( ± 3.91 )60.08 ( ± 6.37 )0.41 ( ± 0.22 )
CSA S6 (2014)1.49 ( ± 0.41 )28.32 ( ± 3.01 )35.82 ( ± 4.68 )0.70 ( ± 0.29 )
CSA S806 (2012)1.07 ( ± 0.21 )20.07 ( ± 2.31 )27.62 ( ± 3.85 )0.80 ( ± 0.31 )
Average1.49 ( ± 0.22 )27.64 ( ± 2.85 )40.18 ( ± 4.73 )0.67 ( ± 0.25 )
XGBoost1.03 ( ± 0.09 )8.34 ( ± 1.73 )13.03 ( ± 2.76 )0.92 ( ± 0.07 )
Decision Tree1.07 ( ± 0.20 )12.51 ( ± 2.56 )20.17 ( ± 4.11 )0.82 ( ± 0.13 )
Random Forest1.05 ( ± 0.11 )11.37 ( ± 2.00 )16.81 ( ± 3.88 )0.91 ( ± 0.08 )
Linear Regression1.10 ( ± 0.18 )12.06 ( ± 3.21 )19.69 ( ± 5.45 )0.89 ( ± 0.21 )
Average 1.06 ( ± 0.15 )11.07 ( ± 2.38 )17.43 ( ± 3.80 )0.89 ( ± 0.12 )
XGBoost *1.00 ( ± 0.06 )7.25 ( ± 1.12 )11.91 ( ± 1.92 )0.94 ( ± 0.06 )
Decision Tree *1.02 ( ± 0.14 )11.28 ( ± 2.30 )17.34 ( ± 3.13 )0.87 ( ± 0.11 )
Random Forest *1.01 ( ± 0.09 )9.32 ( ± 1.73 )14.39 ( ± 2.76 )0.91 ( ± 0.07 )
Linear Regression *0.97 ( ± 0.15 )10.06 ( ± 2.22 )14.88 ( ± 3.88 )0.91 ( ± 0.18 )
Average 1.00 ( ± 0.12 )9.67 ( ± 1.84 )14.63 ( ± 2.92 )0.91 ( ± 0.11 )
*: ML models with artificially selected features.
Table 5. Material properties of the validation specimen.
FRP Flexural BarConcrete
A f (mm2) E f (MPa) f f u (MPa) f c (MPa)
142.6143264834.7
Table 6. Comparisons of predictions of shear design provisions and proposed data-driven models.
Design Provision V u , p r e V u , e x p / V u , p r e (kN) Modified ML Model V u , p r e (kN) V u , e x p / V u , p r e
JSCE (1997)33.90.57Linear Regression15.91.21
ACI 440.1R (2015)10.21.90XGBoost Regressor20.90.92
CSA S6 (2014)14.11.37Decision Tree Regressor15.31.26
CSA S806 (2012)25.20.77Random Forest Regressor21.40.91
Disclaimer/Publisher’s Note: The statements, opinions and data contained in all publications are solely those of the individual author(s) and contributor(s) and not of MDPI and/or the editor(s). MDPI and/or the editor(s) disclaim responsibility for any injury to people or property resulting from any ideas, methods, instructions or products referred to in the content.