
Performance of Rubberized Concrete and the Effect of Temperature and Stainless Steel Fibers


Abstract
1. Introduction
2. Experimental Setup
2.1. Materials
2.1.1. Concrete
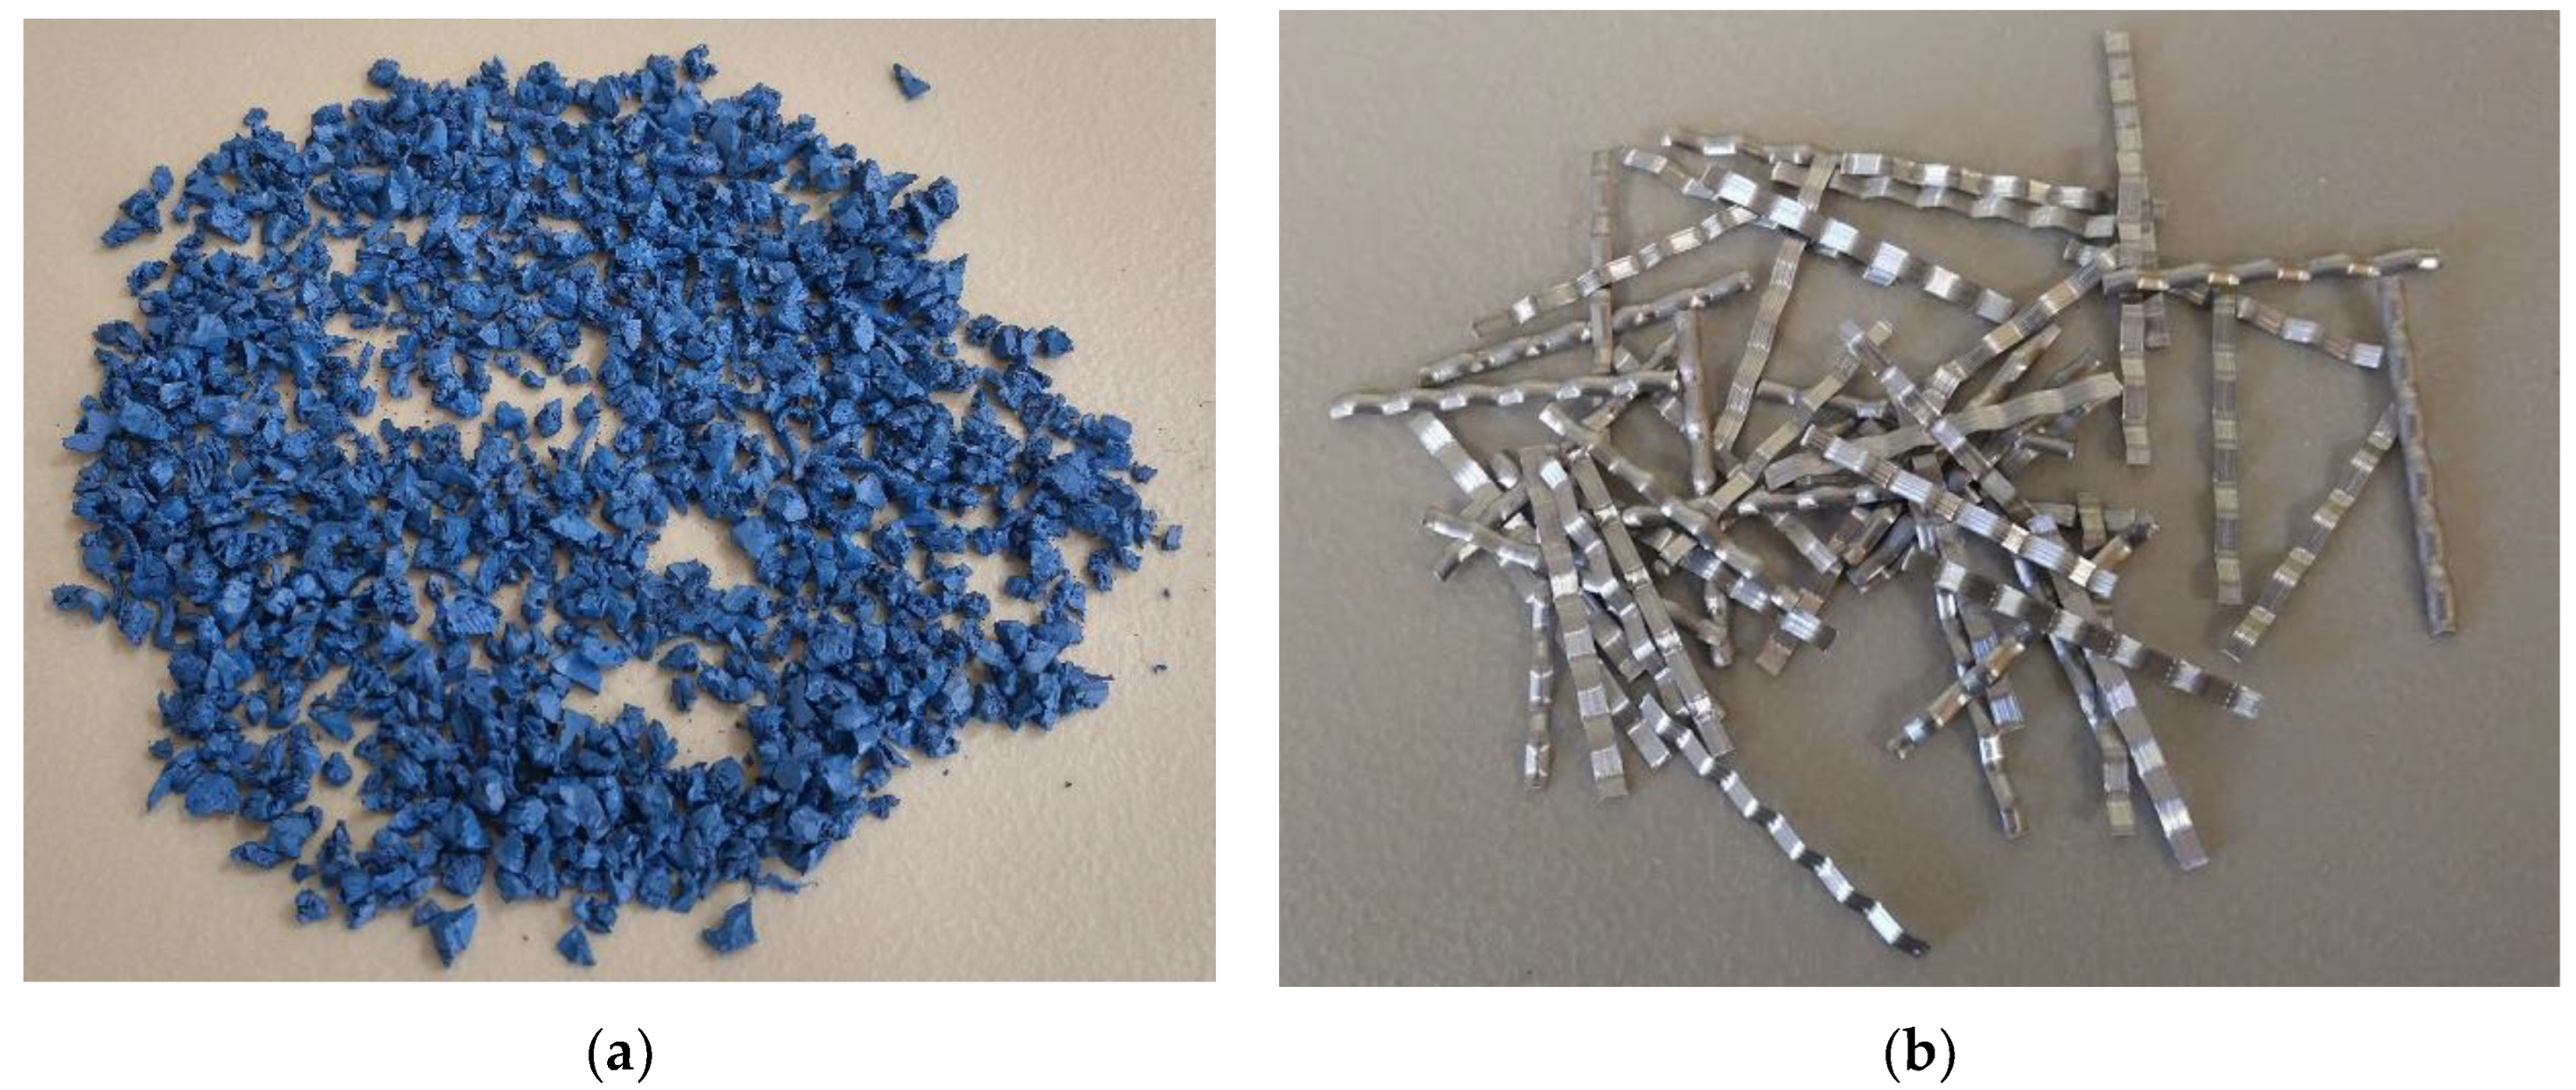
2.1.2. Crumb Rubber
2.1.3. Stainless Steel Fibers (SSFs)
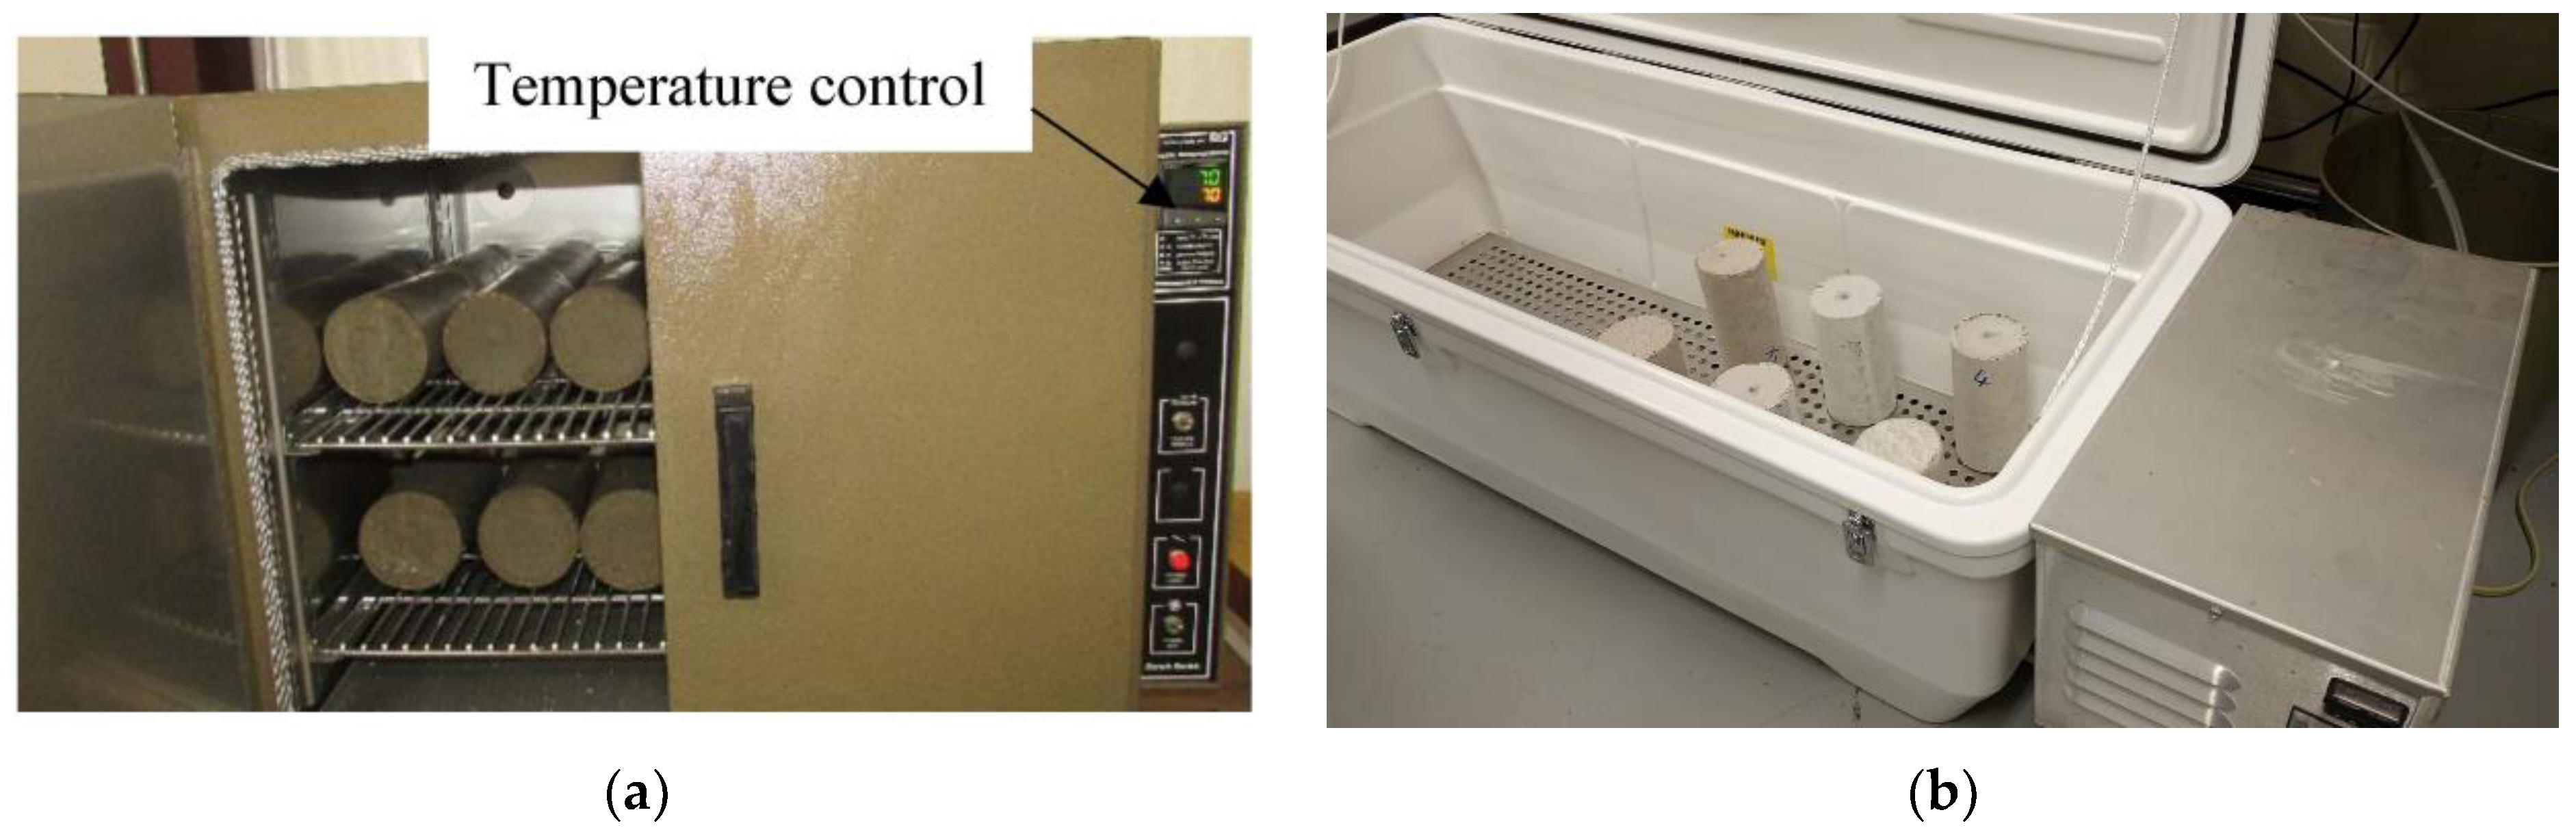
2.2. Preparation and Curing of Specimens
2.3. Detection of Temperature, Freezing–Thawing, and Stainless Steel Fiber Effects
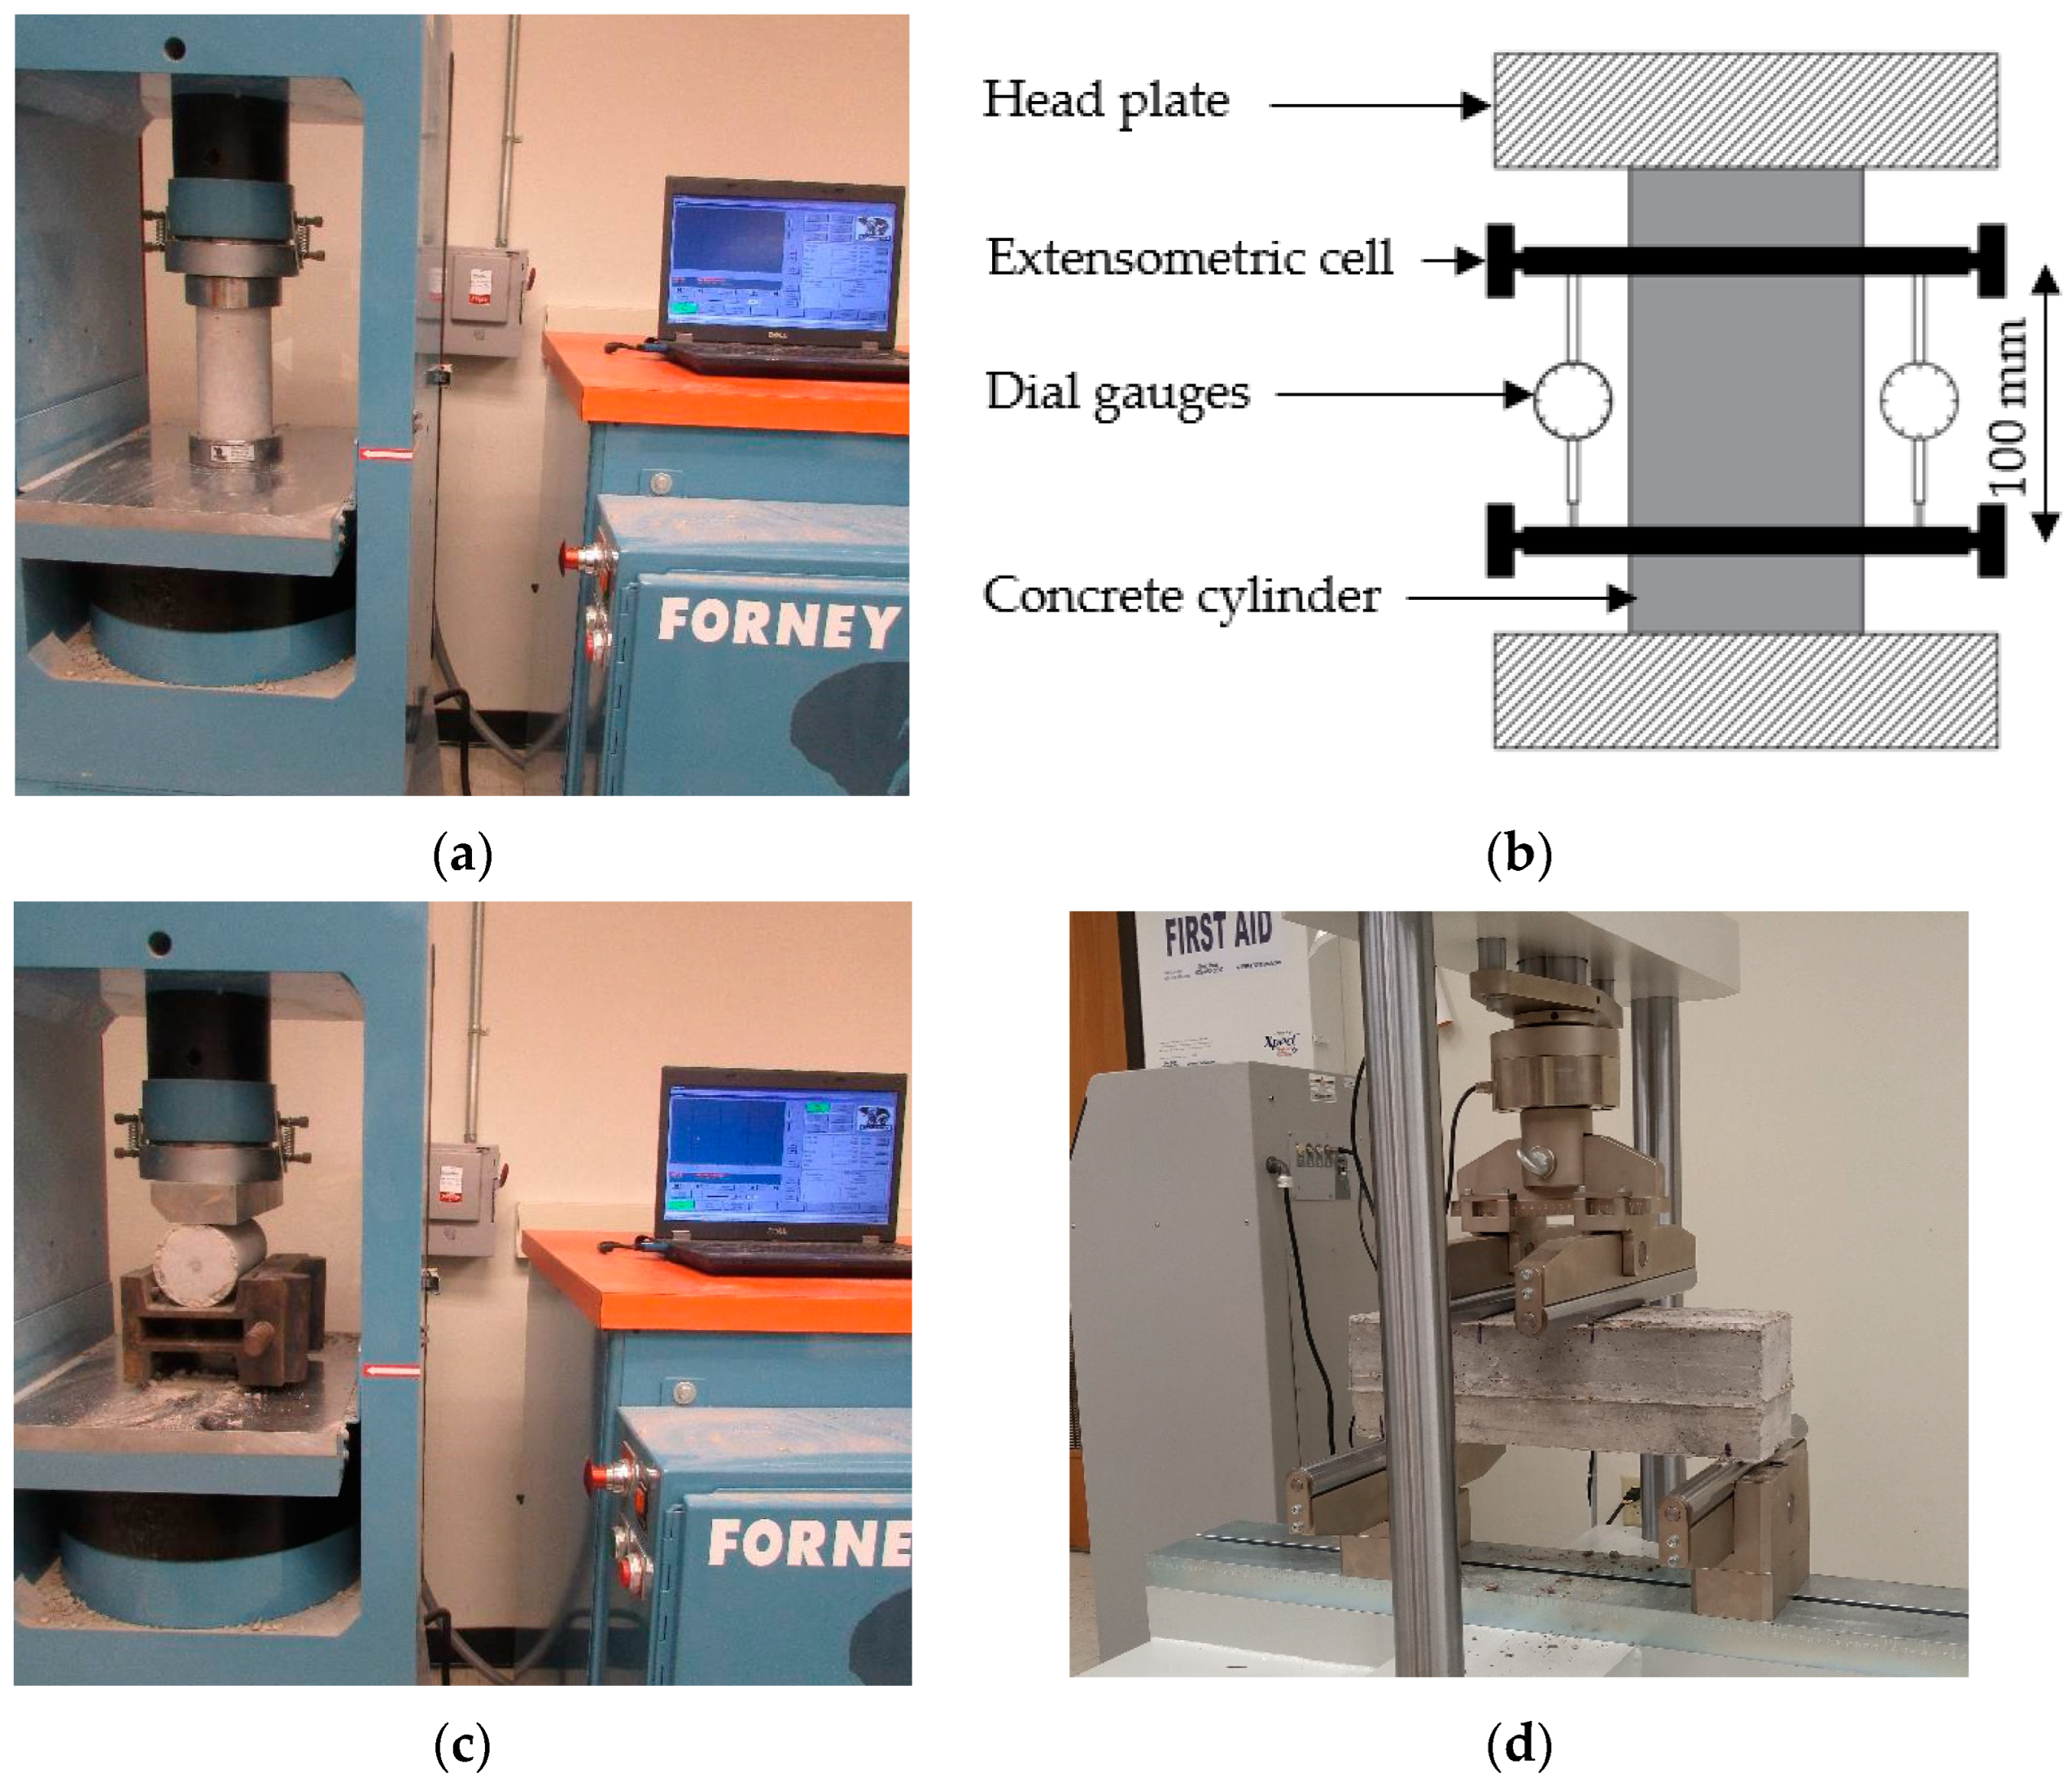
2.4. Test Set-Up
3. Test Results and Discussion
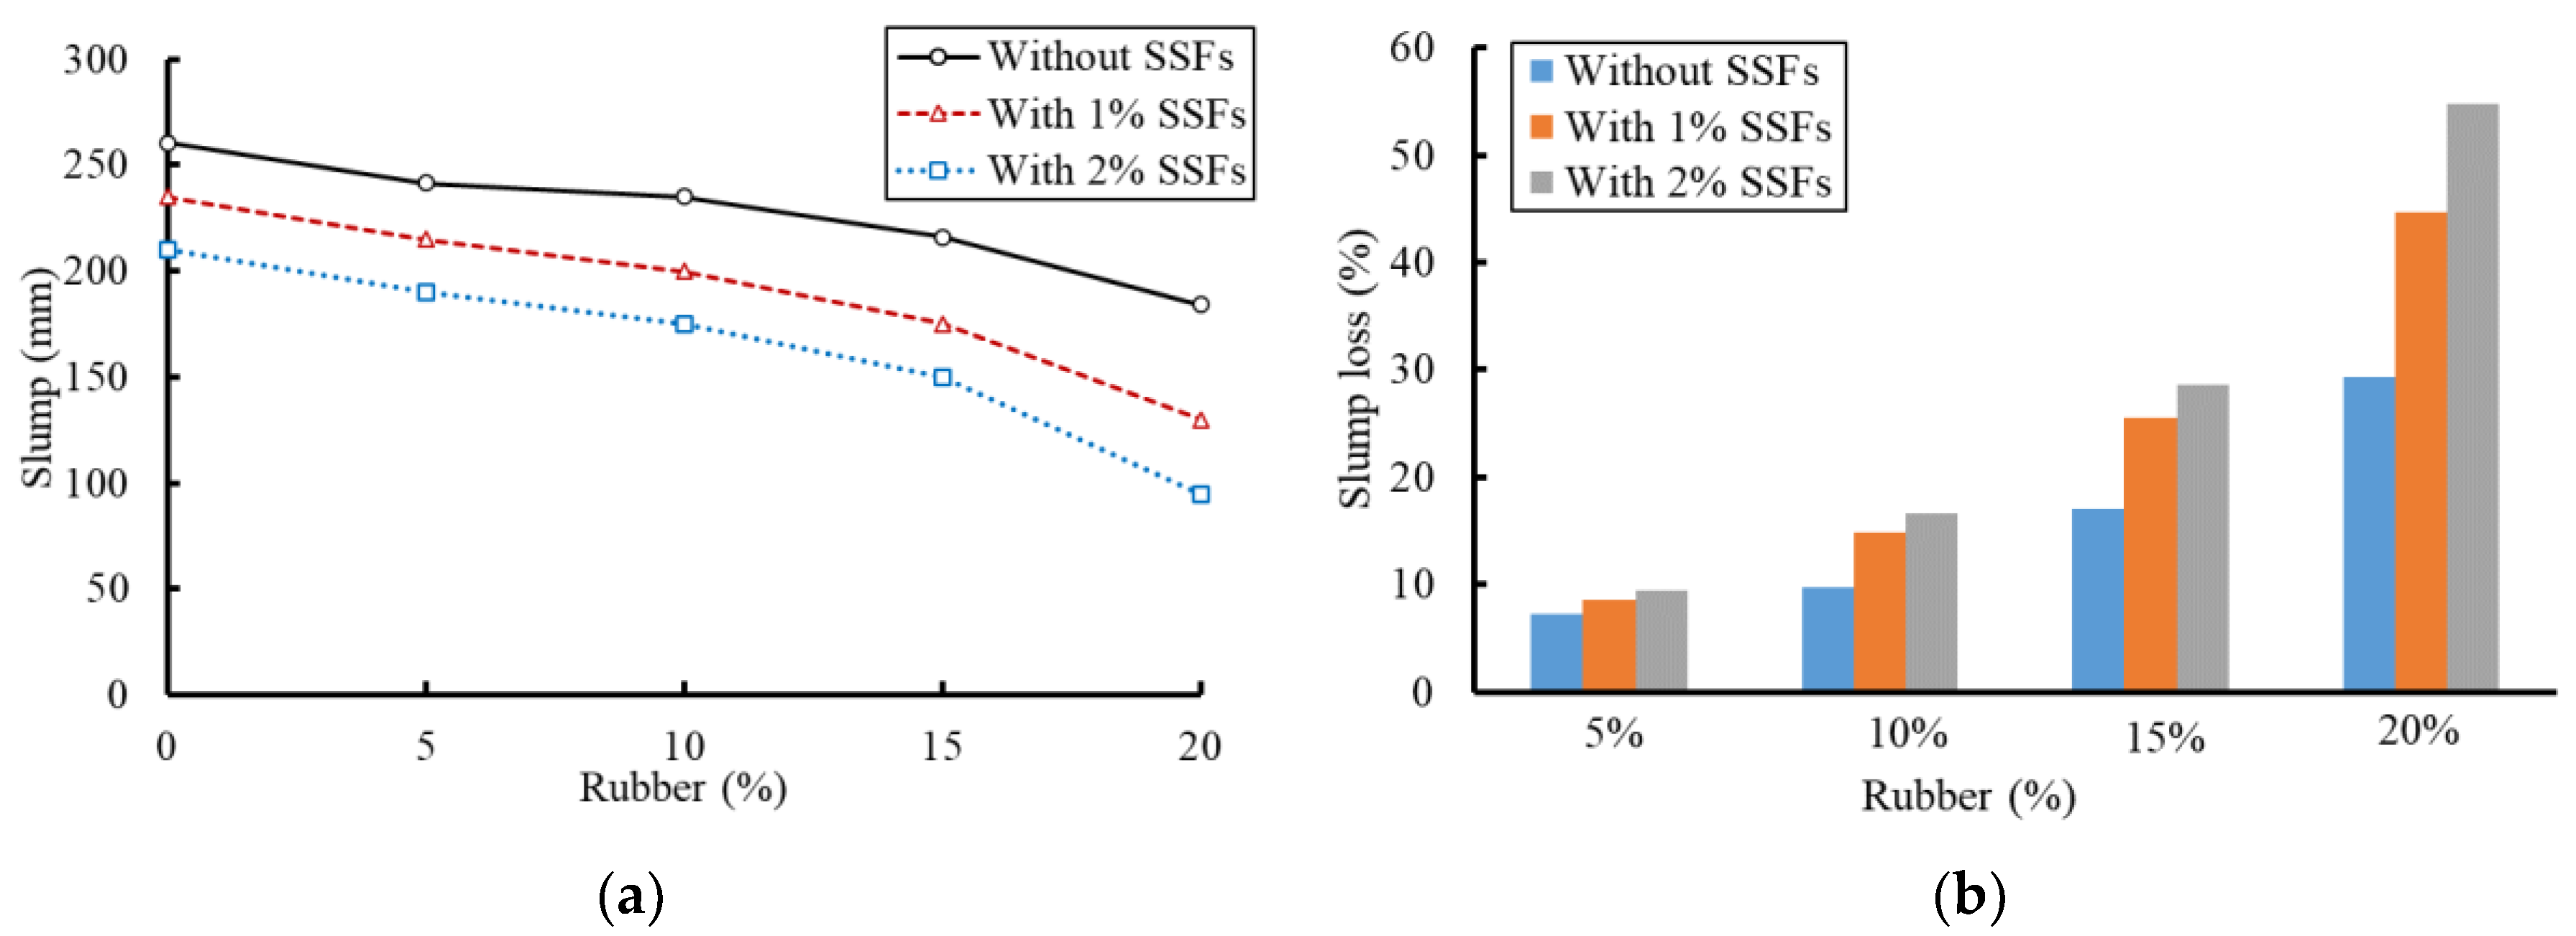
3.1. Slump Test Results
3.2. Unit Weight
3.3. Stress–Strain Relationships
3.4. Compressive Strength
3.5. Strain at Peak Stress
3.6. Modulus of Elasticity
3.7. Compression Toughness
3.8. Indirect Tensile Strength
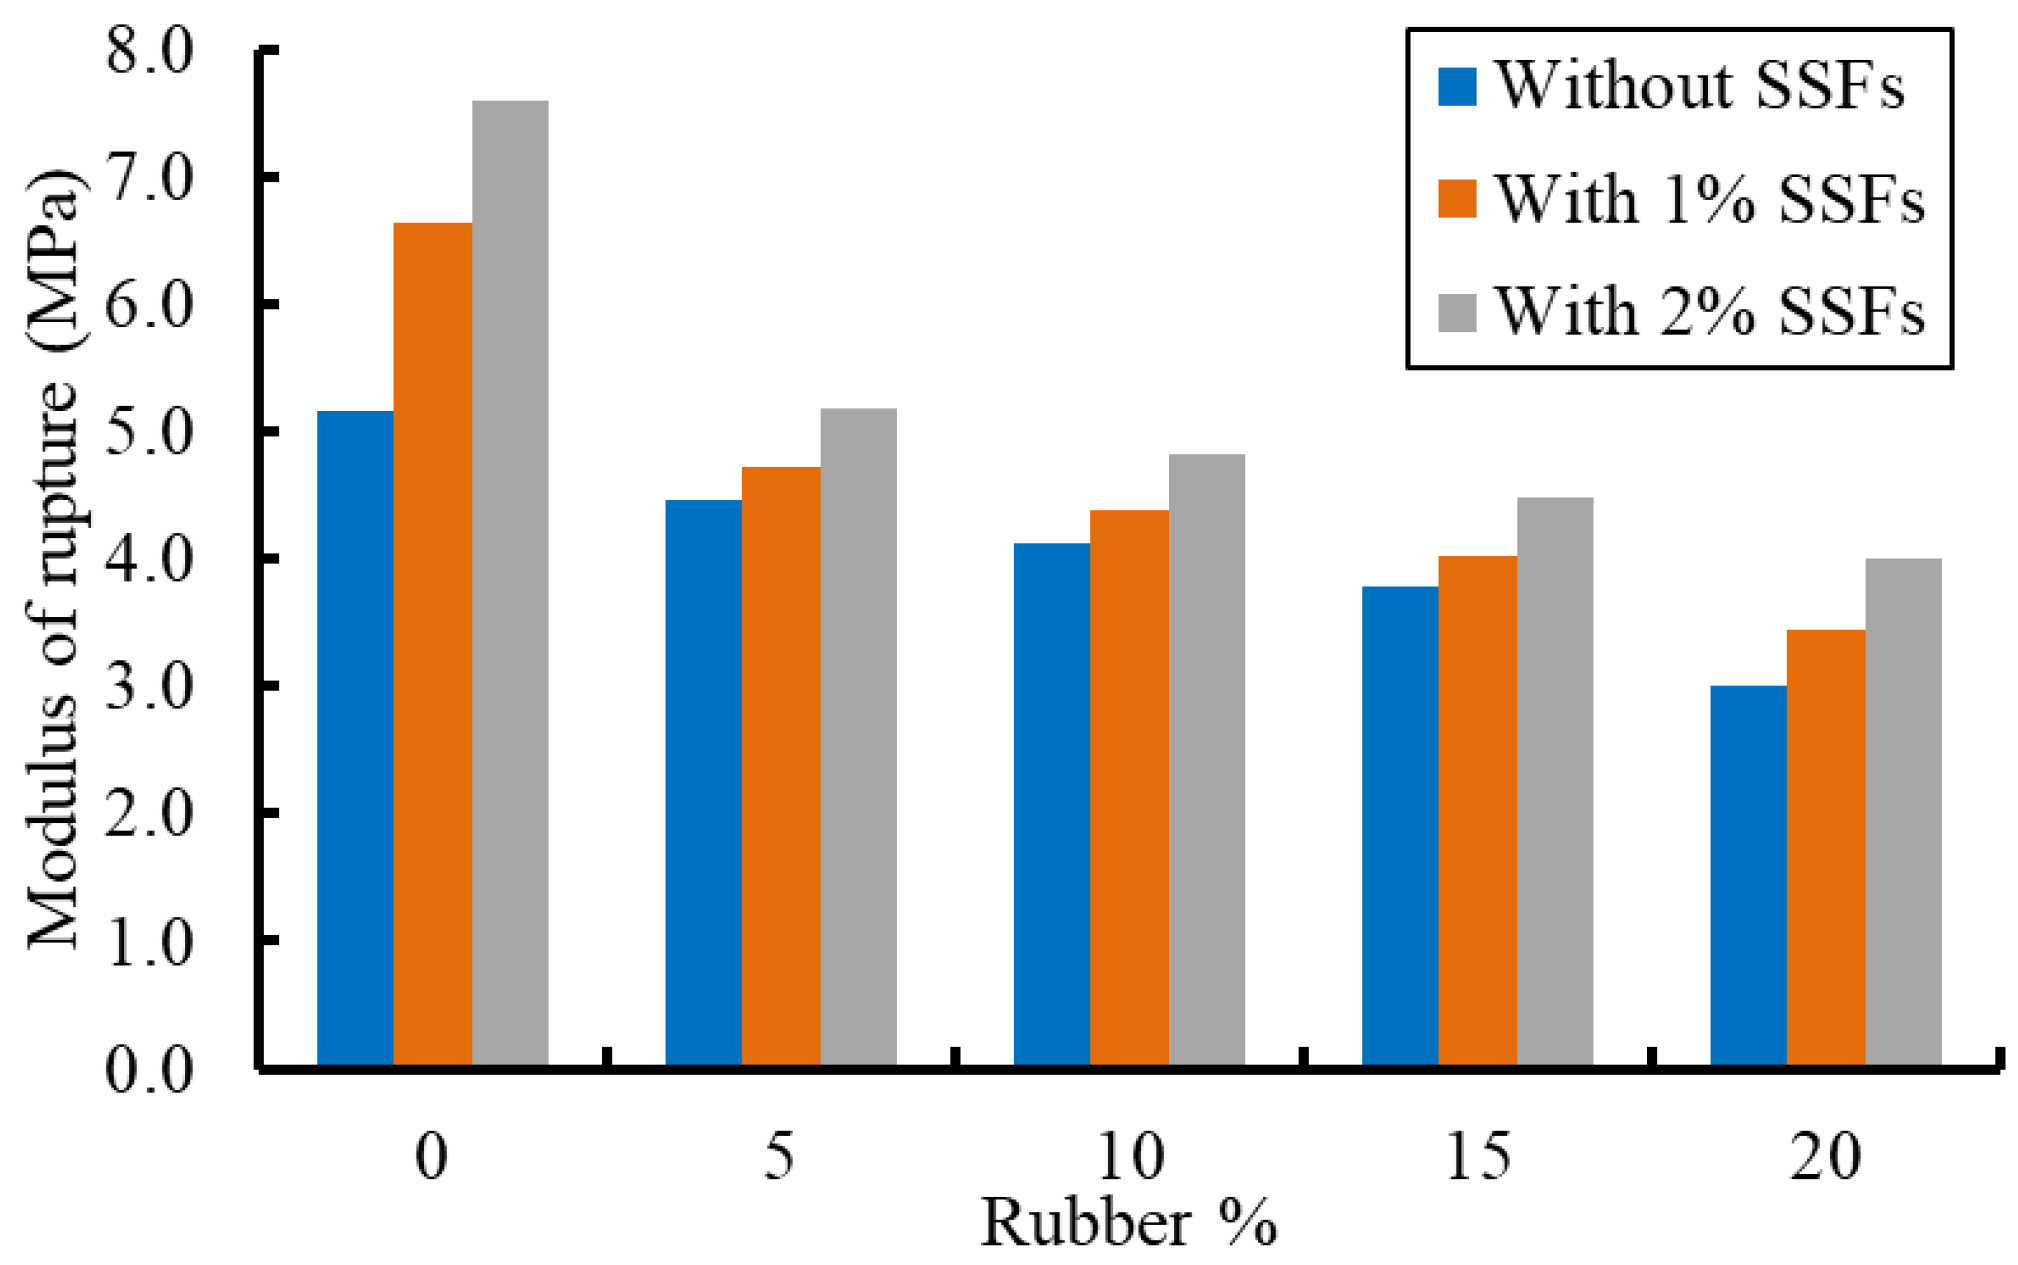
3.9. Modulus of Rupture
4. Life Cycle Cost Analysis
4.1. Application
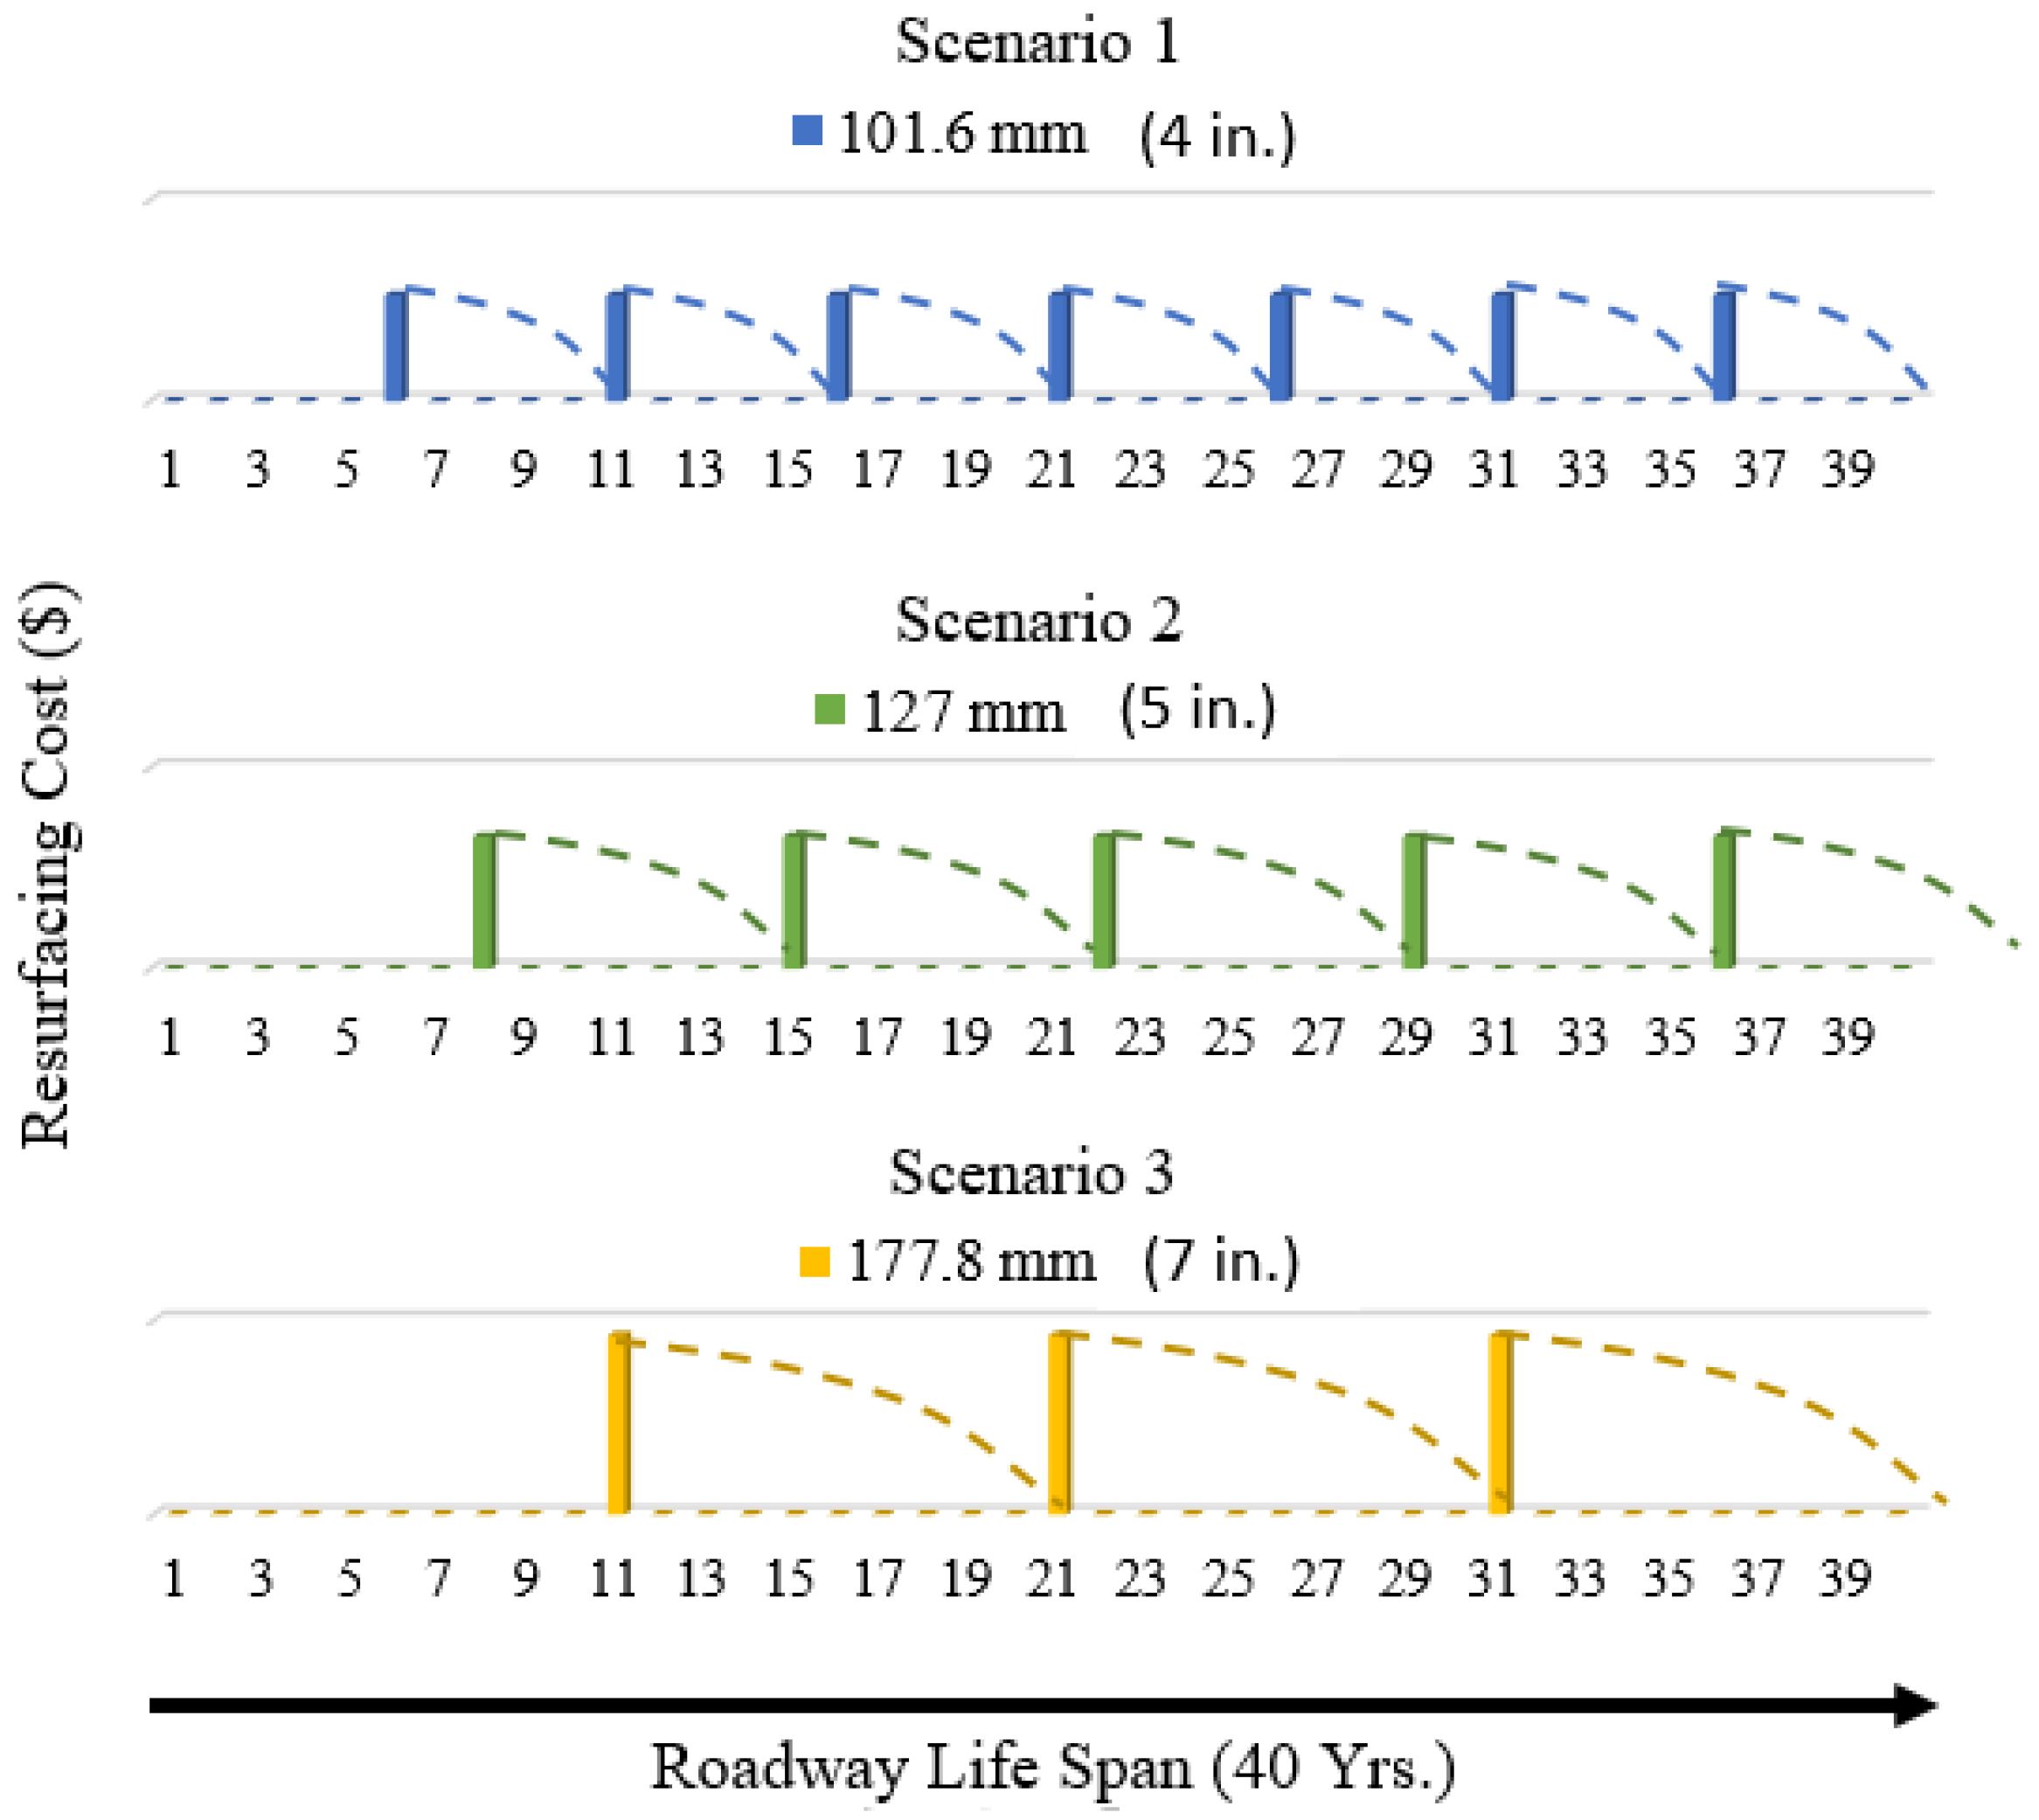
4.2. Scenarios and the Expected Life Span of the Alternatives
4.3. Material Costs and Cashflow Streams
4.4. Net Present Value (NPV)
5. Conclusions
- Increasing the percentage of CR resulted in reducing the slump of concrete, especially when 20% rubber was used. Additional reductions in the slump were obtained when SSFs were used in the concrete mixes, and these reductions increased as the content of SSFs increased. Slump decreased by approximately 30% when 20% rubber was used (without SSFs). However, using 1.0% and 2.0% of the SSFs with 20% rubber caused reductions in the slump value of nearly 45% and 55%, respectively.
- The average unit weight decreased by 1.3%, 2.5%, 3.4%, and 5.7% of the control mixture when 5%, 10%, 15%, and 20% of the CR were incorporated into the concrete mixtures, respectively. A similar trend was observed for mixtures with the same replacement ratios when CR was added to SSF concrete.
- The unit weights of the rubberized concrete were reduced when the temperature increased, and this reduction decreased as the CR content increased. The mixture containing 20% CR displayed the lowest effect of temperature on the unit weight of the rubberized concrete.
- The stress–strain relationships confirmed reductions in the concrete stiffness and compressive strength with an increase in the CR content. However, the ultimate strains increased with an increase in the CR content. On the other hand, the stiffness and compressive strength of the rubberized concrete specimens improved with the addition of SSFs. The improvement was enhanced as the content of SSFs increased.
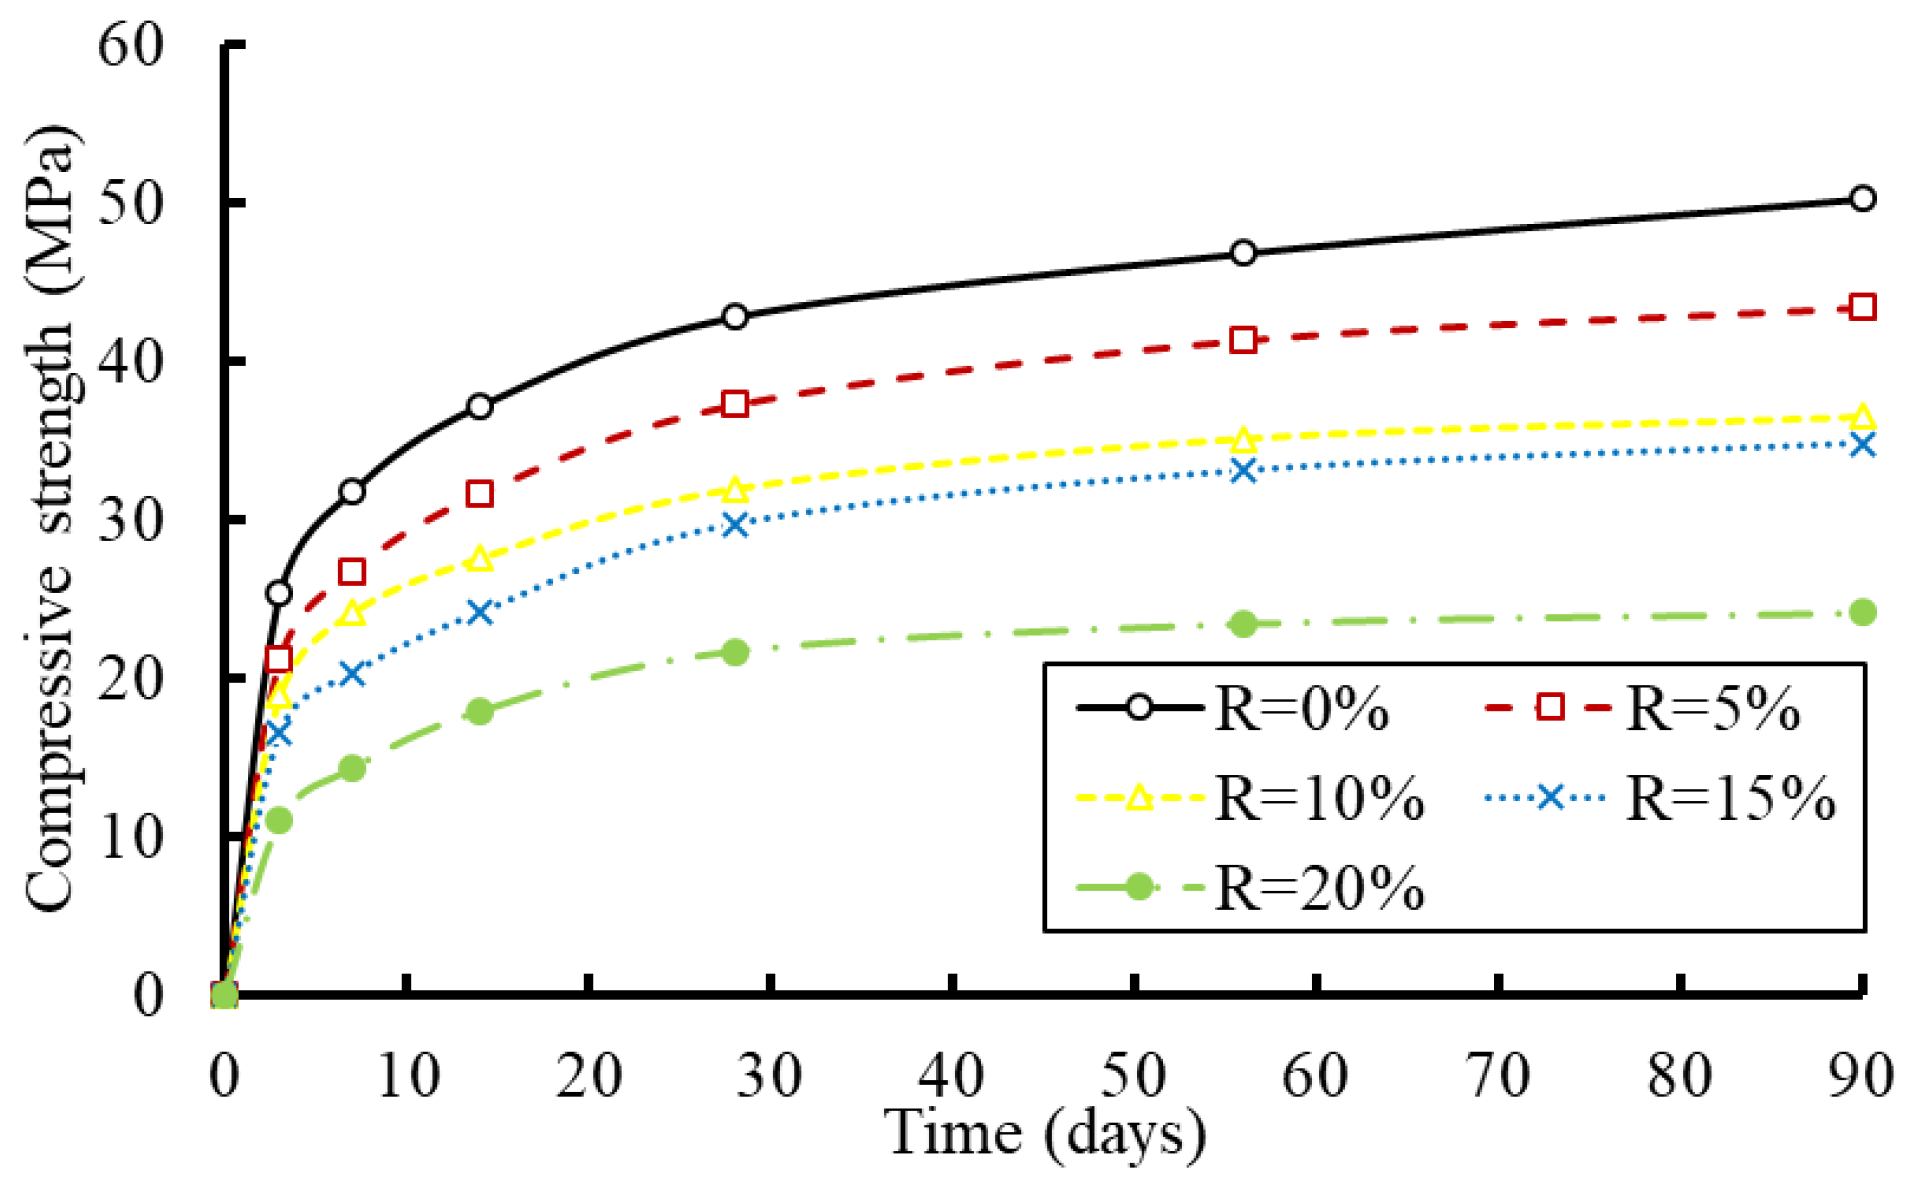
- All concrete mixes gained more strength over time. However, the gaining rate decreased as the CR content increased at the early age of concrete (age of 3-day).
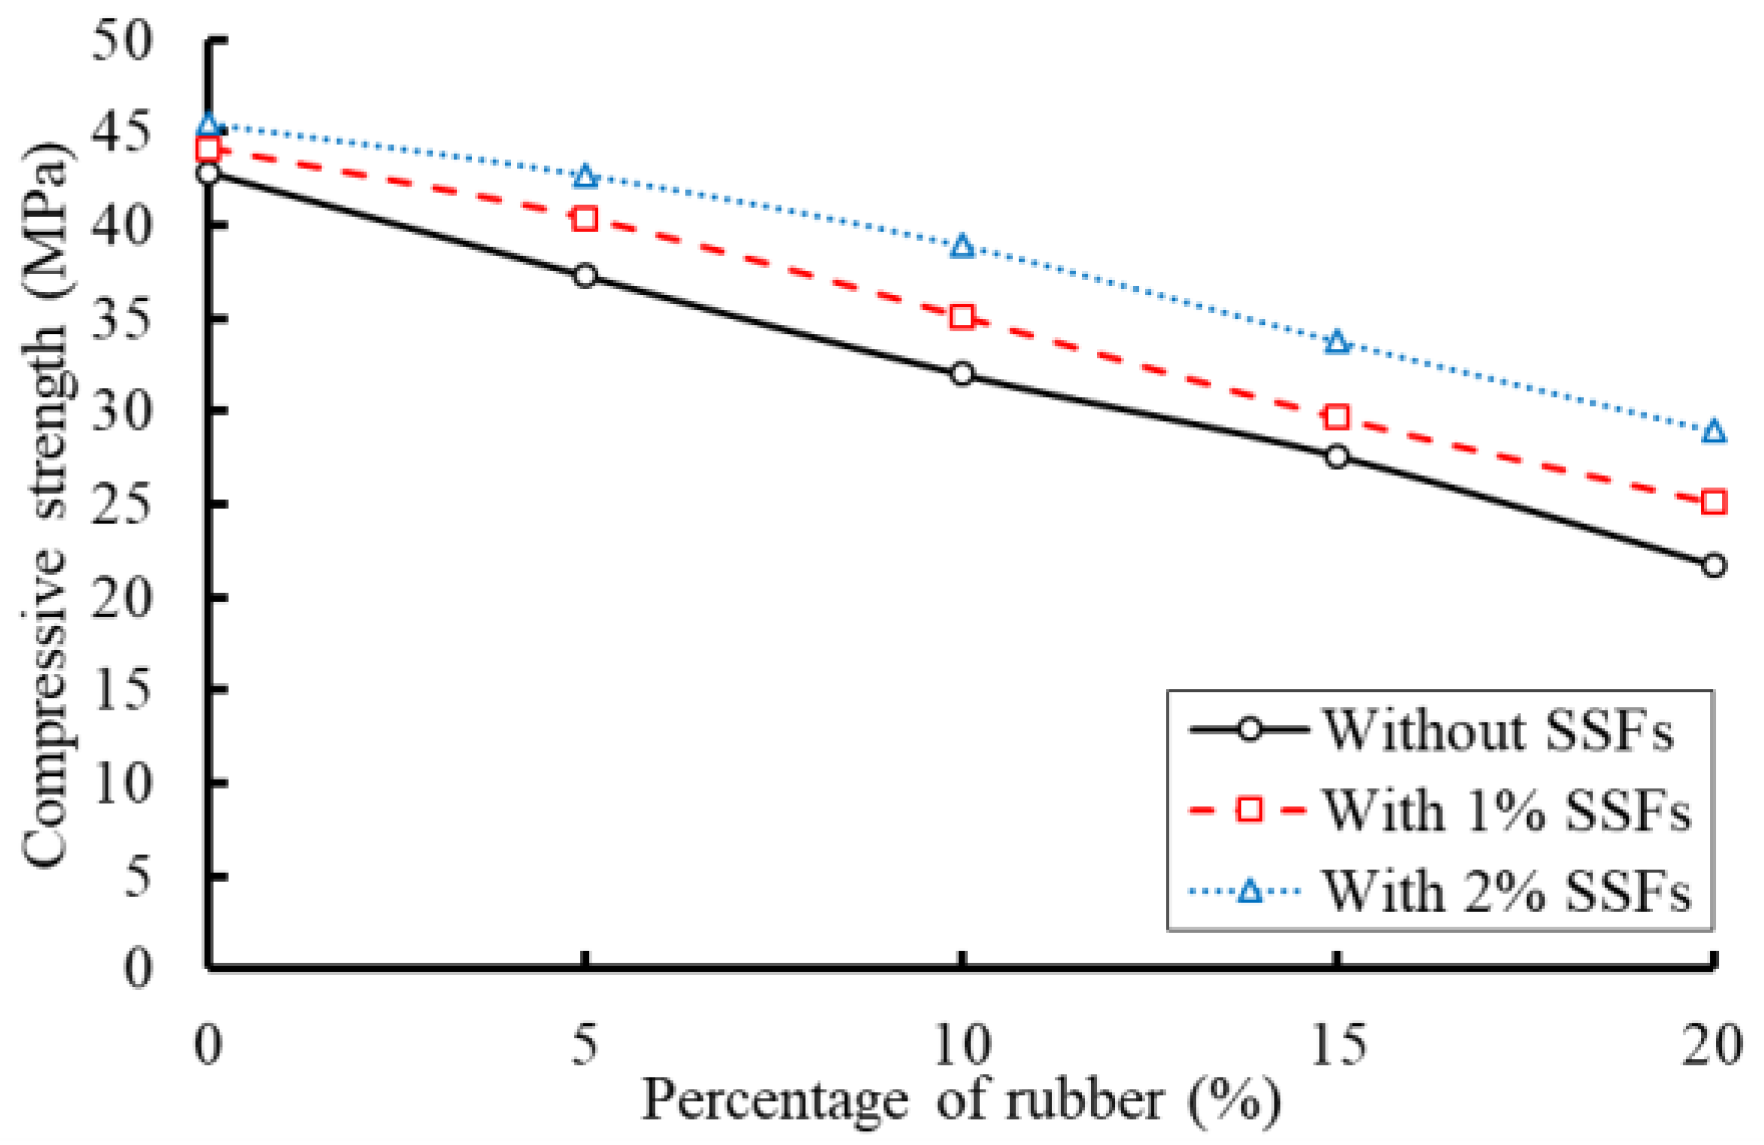
- The compressive strength reductions ranged between 13% and 50% based on the percentage of CR in the concrete mix. Slight improvements in compressive strength were obtained after using 1.0% and 2.0% SSF content without CR. However, a 33.3% improvement in compressive strength was confirmed when using 2.0% SSFs with 20% CR content. The contribution of the SSFs in enhancing compressive strength increased as the CR content increased.
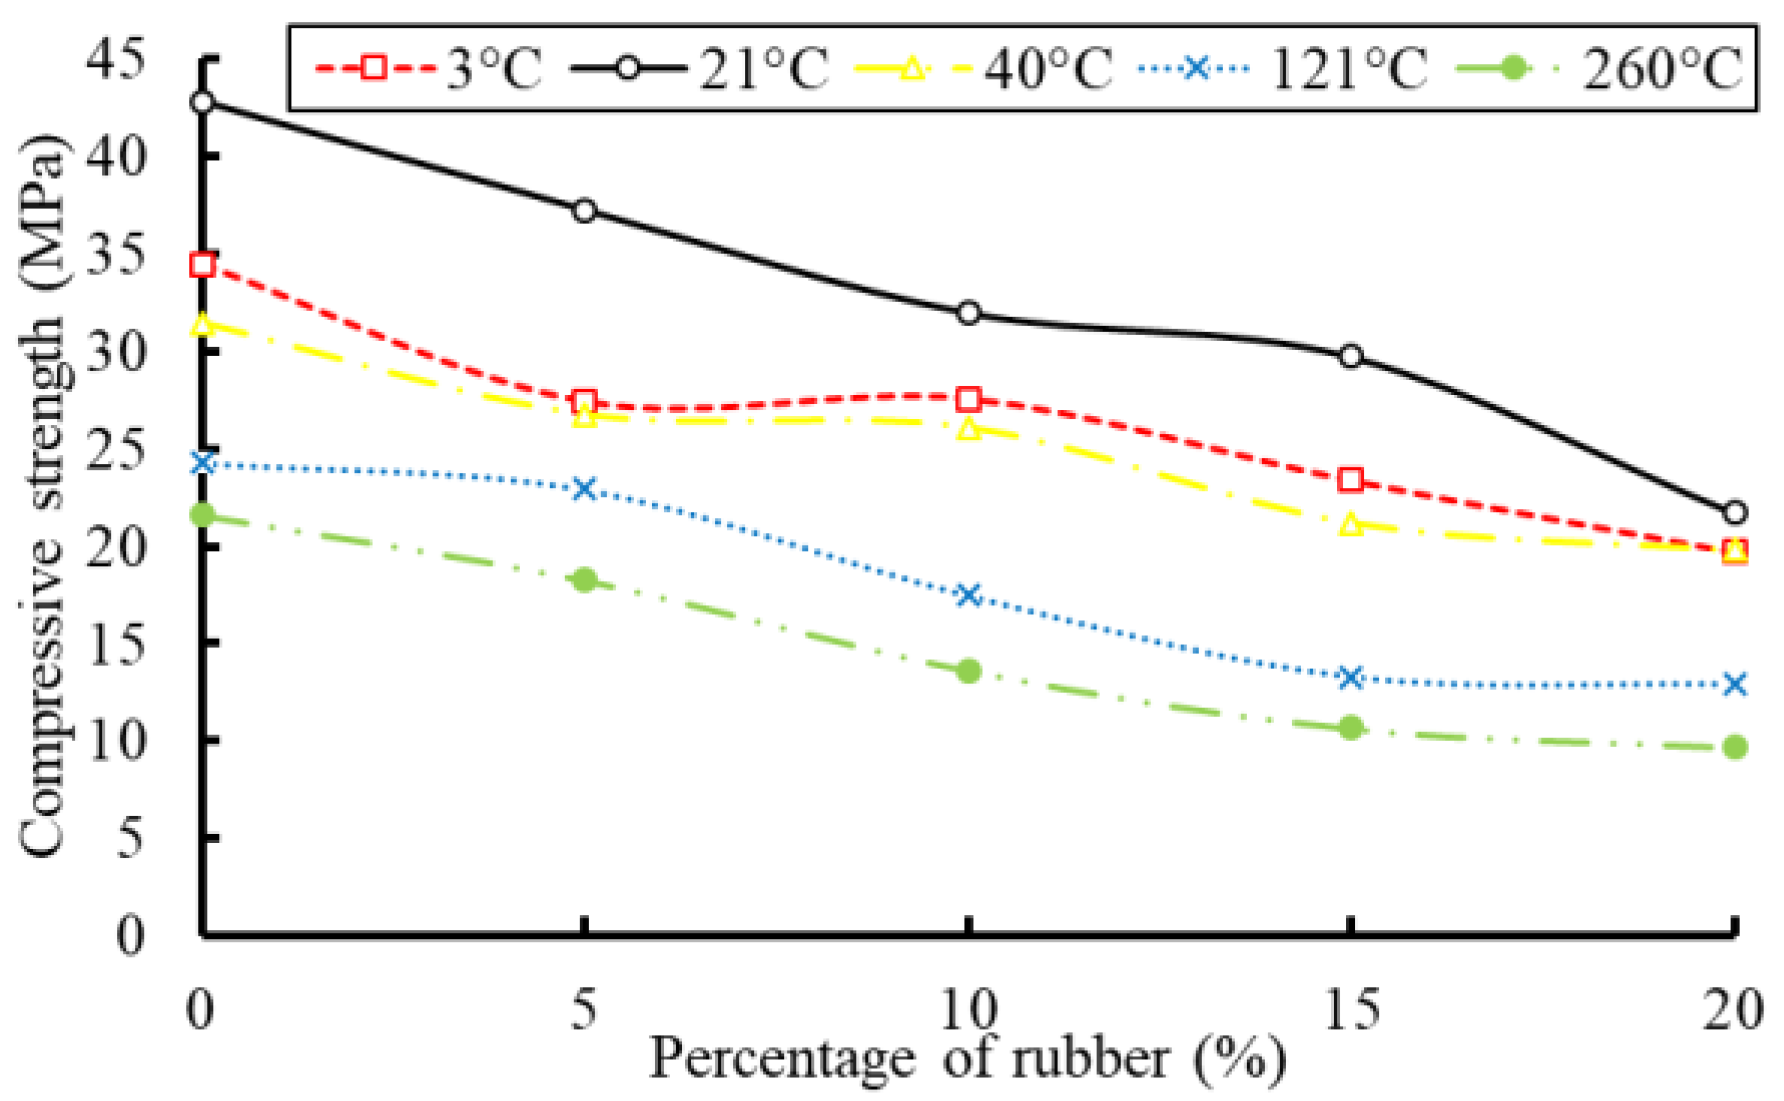
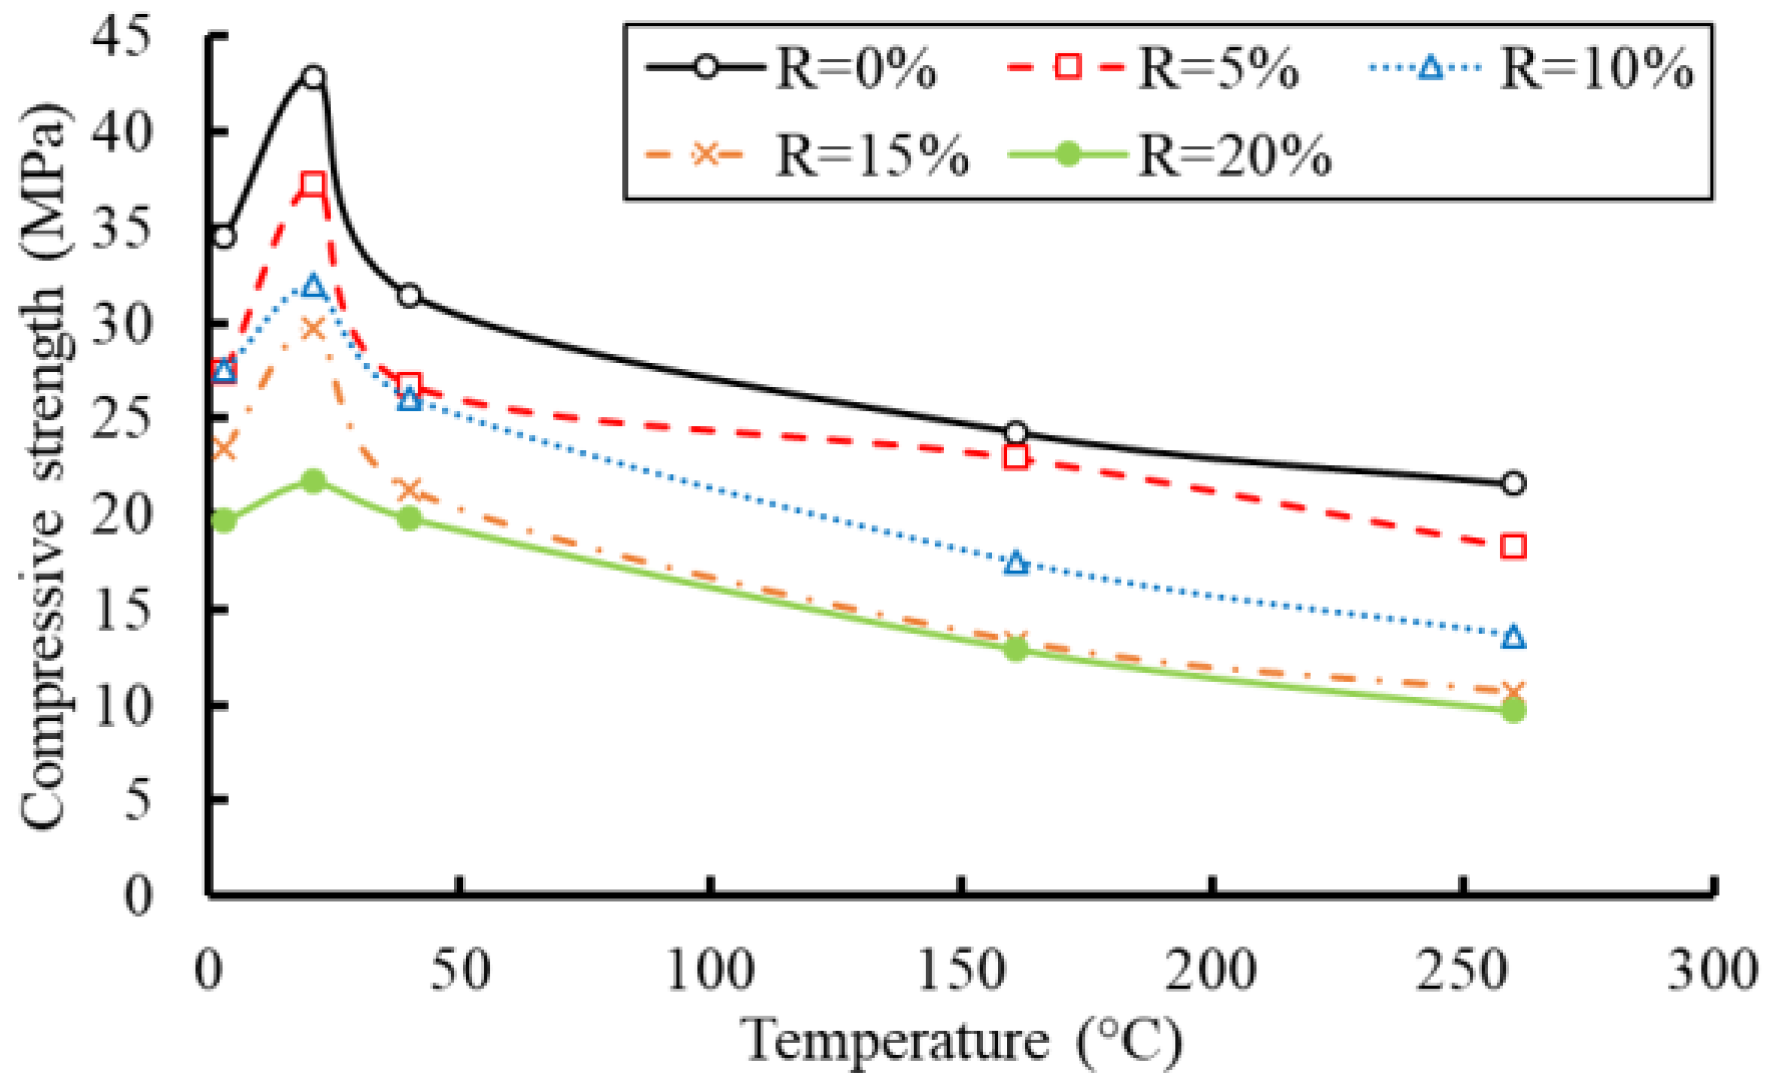
- The effect of cold and hot weather (3 °C and 40 °C) in reducing the compressive strength of concrete vanished as the CR content reached 20%. However, serious reductions were obtained at temperatures of 121 °C and 260 °C.
- Reductions in the splitting tensile strength were observed after increasing the CR content. The tensile strength decreased by 11.1%, 20.7%, 33.5%, and 43.5% for CR contents of 5%, 10%, 15%, and 20%, respectively. However, using SSFs in the concrete mix enhanced the indirect tensile strength by 29.2% and 43.1% when the percentages of SSFs increased from 1.0% to 2.0%, respectively.
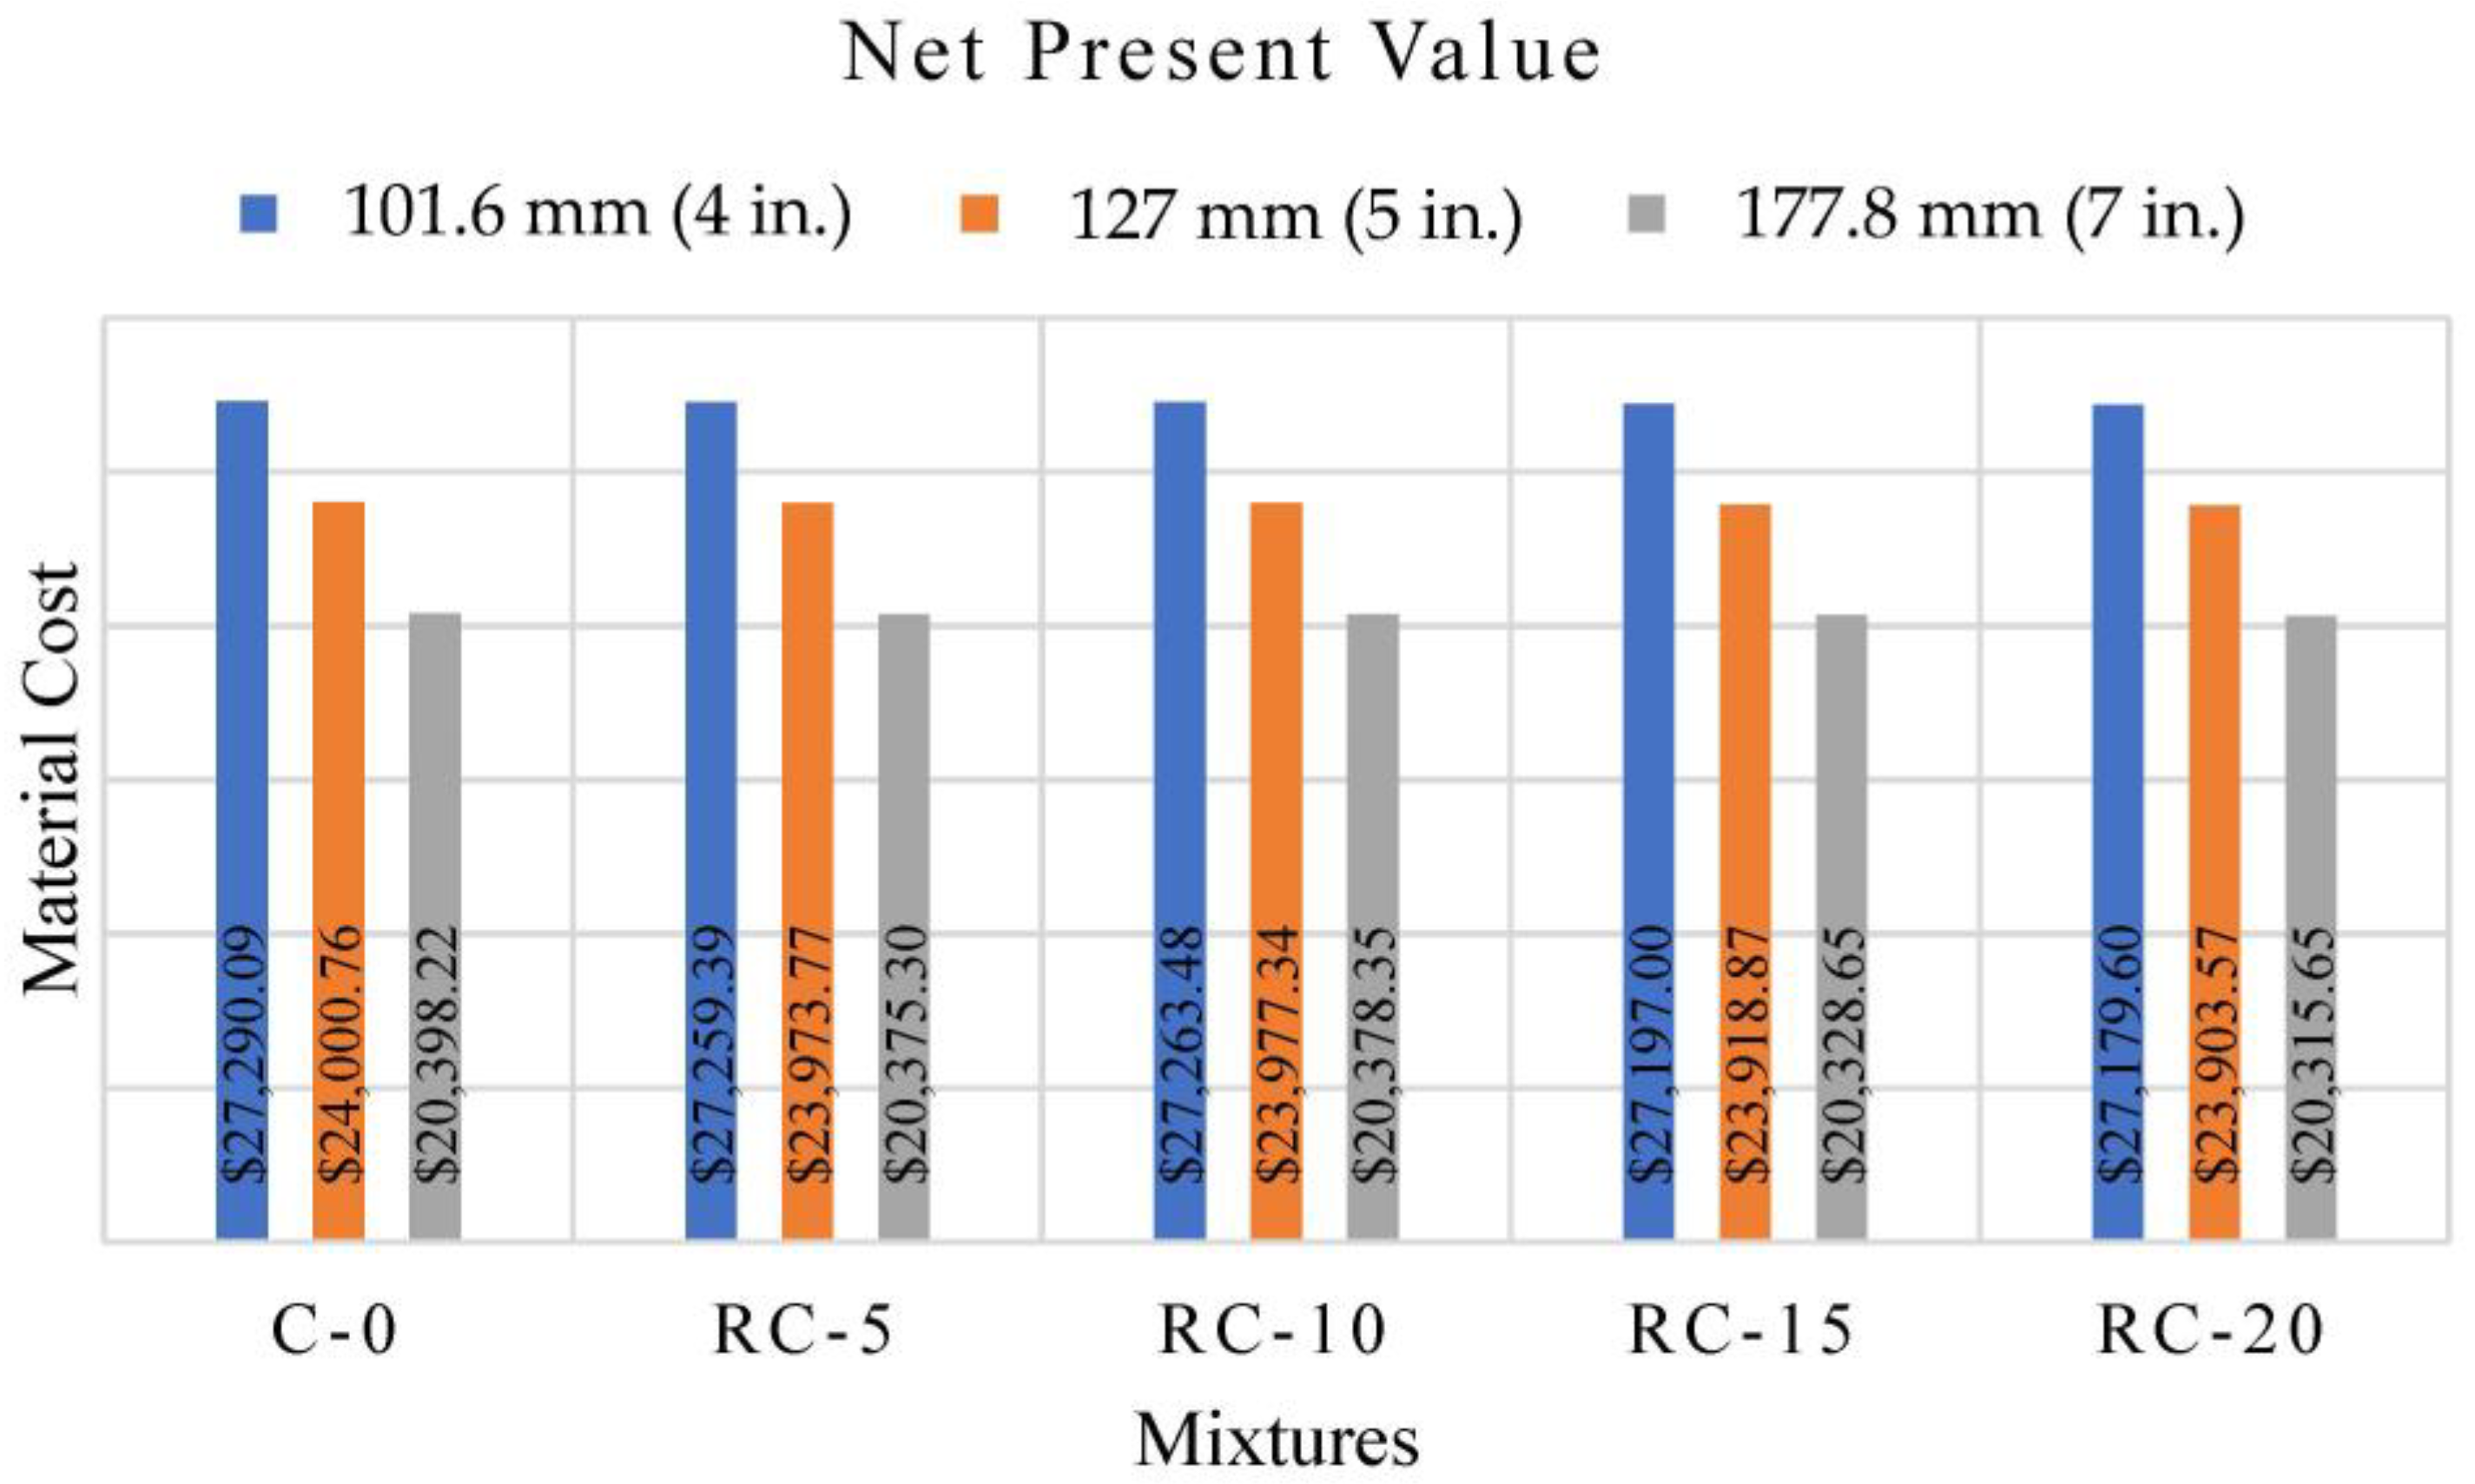
- Using rubberized concrete mixtures for thin whitetopping offered a slightly lower NPV compared to the ordinary concrete mix. Among the rubberized concrete mixtures, RC-20 offered the lowest NPVs for all three scenarios (i.e., 101.6 mm, 127 mm, and 177.8 mm) due to having higher percentages of CR as a cheaper aggregate substitute in the mixture.
Author Contributions
Funding
Institutional Review Board Statement
Informed Consent Statement
Data Availability Statement
Acknowledgments
Conflicts of Interest
References
- Lewis, G. “Impacts & Results In your Region”, Regional Solid Waste Grants Program Funding Report Fiscal Years 2014/2015; Texas Association of Regional Councils: Austin, TX, USA, 2016. [Google Scholar]
- Mhaya, A.M.; Huseien, G.F.; Abidin, A.R.Z.; Ismail, M. Long-term mechanical and durable properties of waste tires rubber crumbs replaced GBFS modified concretes. Constr. Build. Mater. 2020, 256, 119505. [Google Scholar] [CrossRef]
- Hasan, A.; Dincer, I. Comparative assessment of various gasification fuels with waste tires for hydrogen production. Int. J. Hydrog. Energy 2019, 44, 18818–18826. [Google Scholar] [CrossRef]
- Habib, A.; Yıldırıma, U. Prediction of the dynamic properties in rubberized concrete. Comput. Concr. 2021, 27, 185–197. [Google Scholar] [CrossRef]
- Siringi, G.; Abolmaali, A.; Aswath, P.B. Properties of concrete with tire-derived aggregate partially replacing coarse aggregates. Sci. World J. 2015, 2015, 863706. [Google Scholar] [CrossRef]
- Batayneh, M.K.; Marie, I.; Asi, I. Promoting the use of crumb rubber concrete in developing countries. Waste Manag. 2008, 28, 2171–2176. [Google Scholar] [CrossRef]
- Panda, K.; Parhi, P.; Jena, T. Scrap-Tyre-Rubber replacement for aggregate in cement concrete: Experimental study. Int. J. Earth Sci. Eng. 2012, 5, 1692–1701. [Google Scholar]
- Padhi, S.; Panda, K.C. Fresh and hardened properties of Rubberized Concrete using fine rubber and silpozz. Adv. Concr. Constr. 2016, 4, 49–69. [Google Scholar] [CrossRef]
- Al-Tayeb, M.M.; Abu Bakar, B.H.; Akil, H.M.; Ismail, H. Performance of rubberized and hybrid rubberized concrete structures under static and impact load conditions. Exp. Mech. 2013, 53, 377–384. [Google Scholar] [CrossRef]
- Guo, J.; Huang, M.; Huang, S.; Wang, S. An Experimental Study on Mechanical and Thermal Insulation Properties of Rubberized Concrete Including its Microstructure. Appl. Sci. 2019, 9, 2943. [Google Scholar] [CrossRef]
- Chen, Z.; Li, L.; Xiong, Z. Investigation on the interfacial behaviour between the rubber-cement matrix of the rubberized concrete. J. Clean. Prod. 2019, 209, 1354–1364. [Google Scholar] [CrossRef]
- Xiong, Z.; Tang, Z.; He, S.; Fang, Z.; Chen, Z.; Liu, F.; Li, L. Analysis of mechanical properties of rubberised mortar and influence of styrene–butadiene latex on interfacial behaviour of rubber–cement matrix. J. Constr. Build. Mater. 2021, 300, 124027. [Google Scholar] [CrossRef]
- Ling, T. Prediction of density and compressive strength for rubberized concrete blocks. Constr. Build. Mater. 2011, 25, 4303–4306. [Google Scholar] [CrossRef]
- Al-Dala’ien, R.N.S. An Assessment of Mechanical Properties of Using Tires Rubber as a Partial Replacement of Aggregate in Sustainable Concrete. J. Green Eng. 2020, 10, 5017–5033. [Google Scholar]
- Gul, M.; Qasab, R.A. Effect of Tyre Rubber on the Mechanical Properties of Concrete. J. Emerg. Technol. Innov. Res. 2018, 5, 658–664. [Google Scholar]
- Feng, W.; Liu, F.; Yang, F.; Li, L.; Jing, L. Experimental study on dynamic split tensile properties of rubber concrete. J. Constr. Build. Mater. 2018, 165, 675–687. [Google Scholar] [CrossRef]
- Güneyisi, E.; Gesoğlu, M.; Mermerdaş, K.; İpek, S. Experimental investigation on durability performance of Rubberized Concrete. Adv. Concr. Constr. 2014, 2, 193–207. [Google Scholar] [CrossRef]
- Karimipour, A.; Ghalehnovi, M.; Brito, J. Mechanical and durability properties of steel fiber-reinforced rubberised concrete. Constr. Build. Mater. 2020, 257, 119463. [Google Scholar] [CrossRef]
- Liu, F.; Chen, G.; Li, L.; Guo, Y. Study of impact performance of rubber reinforced concrete. J. Constr. Build. Mater. 2012, 36, 604–616. [Google Scholar] [CrossRef]
- Eisa, A.S.; Shehab, H.K.; El-Awady, K.A.; Nawar, M.T. Improving the flexural toughness behavior of R.C beams using micro/nano silica and steel fibers. Adv. Concr. Constr. 2020, 11, 45–58. [Google Scholar] [CrossRef]
- Eisa, A.S.; Elshazli, M.T.; Nawar, M.T. Experimental investigation on the effect of using crumb rubber and steel fibers on the structural behavior of reinforced concrete beams. Constr. Build. Mater. 2020, 252, 119078. [Google Scholar] [CrossRef]
- Ahmad, S.; Umar, A.; Masood, A.; Nayeem, M. Performance of self-compacting concrete at room and after elevated Temperature incorporating Silica fume. Adv. Concr. Constr. 2019, 7, 31–37. [Google Scholar] [CrossRef]
- Salhi, M.; Li, A.; Ghrici, M.; Bliard, C. Effect of Temperature on the behavior of self-compacting concretes and their durability. Adv. Concr. Constr. 2019, 7, 277–288. [Google Scholar] [CrossRef]
- Pokorný, J.; Záleská, M.; Pavlíková, M.; Pavlík, Z. The Influence of Elevated Temperatures on Thermal Properties of Concrete with Crumb Rubber. In AIP Conference Proceedings; AIP Publishing LLC: Melville, NY, USA, 2019; Volume 2293, pp. 070003-1–070003-4. [Google Scholar] [CrossRef]
- Bengar, H.A.; Shahmansouri, A.A.; Sabet, N.A.Z.; Kabirifar, K.; Tam, V.W.Y. Impact of elevated temperatures on the structural performance of recycled rubber concrete: Experimental and mathematical modeling. Constr. Build. Mater. 2020, 255, 119374. [Google Scholar] [CrossRef]
- Mousavimehr, M.; Nematzadeh, M. Predicting post-fire behavior of crumb rubber aggregate concrete. Constr. Build. Mater. 2019, 229, 116834. [Google Scholar] [CrossRef]
- Grinys, A.; Augonis, A.; Daukšys, M.; Pupeikis, D. Mechanical properties and durability of rubberized and SBR latex modified rubberized concrete. Constr. Build. Mater. 2020, 248, 118584. [Google Scholar] [CrossRef]
- Luo, T.; Zhang, C.; Sun, C.; Zheng, X.; Ji, Y.; Yuan, X. Experimental Investigation on the Freeze–Thaw Resistance of Steel Fibers Reinforced Rubber Concrete. Materials 2020, 13, 1260. [Google Scholar] [CrossRef]
- ASTM C150/C150M-20; Standard Specification for Portland Cement. ASTM International: West Conshohocken, PA, USA, 2020.
- ASTM C31/C31M-19a; Standard Practice for Making and Curing Concrete Test Specimens in the Field. ASTM International: West Conshohocken, PA, USA, 2019.
- ASTM C39/C39M-20; Standard Test Method for Compressive Strength of Cylindrical Concrete Specimens. ASTM International: West Conshohocken, PA, USA, 2020.
- ASTM C496/C496M-17; Standard Test Method for Splitting Tensile Strength of Cylindrical Concrete Specimens. ASTM International: West Conshohocken, PA, USA, 2017.
- ASTM, C293/C293M-16; Standard Test Method for Flexural Strength of Concrete (Using Simple Beam with Center-Point Loading). ASTM International: West Conshohocken, PA, USA, 2016.
- ASTM C143/C143M-15a; Standard Test Method for Slump of Hydraulic Cement Concrete. ASTM International: West Conshohocken, PA, USA, 2015.
- Zhang, Z.; Ma, H.; Qian, S. Investigation on properties of ECC incorporating crumb rubber of different sizes. J. Adv. Concr. Technol. 2015, 13, 241–251. [Google Scholar] [CrossRef]
- Ahmad, J.; Zhou, Z.; Majdi, A.; Alqurashi, M.; Deifalla, A.F. Overview of Concrete Performance Made with Waste Rubber Tires: A Step toward Sustainable Concrete. Materials 2022, 15, 5518. [Google Scholar] [CrossRef]
- Correia, J.; Marques, A.M.; Pereira, C.M.C.; de Brito, J. Fire reaction properties of concrete made with recycled rubber aggregate. J. Fire Mater. 2012, 36, 139–152. [Google Scholar] [CrossRef]
- Marques, A.; Correia, J.; De Brito, J. Post-fire residual mechanical properties of concrete made with recycled rubber aggregate. J. Fire Saf. 2013, 58, 49–57. [Google Scholar] [CrossRef]
- Poon, C.S.; Shui, Z.H.; Lam, L. Effect of microstructure of ITZ on compressive strength of concrete papered with recycled aggregates. Constr. Build. Mater. 2004, 18, 461–468. [Google Scholar] [CrossRef]
- Sofi, A. Effect of waste tyre rubber on mechanical and durability properties of concrete—A review. Ain Shams Eng. J. 2017, 9, 2691–2700. [Google Scholar] [CrossRef]
- Li, G.; Stubblefield, M.A.; Garrick, G.; Eggers, J.; Abadie, C.; Huang, B. Development of waste tire modified concrete. Cem. Concr. Res. 2004, 34, 2283–2289. [Google Scholar] [CrossRef]
- Texas Department of Transportation (TxDOT). 2021; Pavement Manual. Available online: http://onlinemanuals.txdot.gov/txdotmanuals/pdm/manual_notice.htm (accessed on 29 June 2021).
- Texas Department of Transportation (TxDOT). 2021; Average Low Bid Unit Prices-Highway Maintenance Projects. Available online: https://www.txdot.gov/business/letting-bids/average-low-bid-unit-prices.html (accessed on 13 October 2021).
- Liu, F.; Zheng, W.; Li, L.; Feng, W.; Ning, G. Mechanical and fatigue performance of rubber concrete. Constr. Build. Mater. 2013, 47, 711–719. [Google Scholar] [CrossRef]
- Feng, W.; Chen, B.; Yang, F.; Liu, F.; Li, L.; Jing, L.; Li, H. Numerical study on blast responses of rubberized concrete slabs using the Karagozian and Case concrete model. J. Build. Eng. 2021, 33, 101610. [Google Scholar] [CrossRef]
- Hicks, R.G.; Lundy, J.R.; Epps, J.A. Life Cycle Costs for Asphalt-Rubber Paving Materials; Rubber Pavements Association: Tempe, AZ, USA, 1999. [Google Scholar]
- Zhou, W.; Won, M.; Choi, P. Performance Evaluation of Whitetopping with Improved Design Practices in Texas. J. Test. Eval. 2018, 47, 2127–2149. [Google Scholar] [CrossRef]
- U.S. Office of Management and Budget. Discount Rates for Cost-Effectiveness, Lease Purchase, and Related Analyses. Circular A-94; National Institute of Building Sciences: Washington, DC, USA, 2016. [Google Scholar]
- Wang, J.; Dai, Q.; Si, R.; Ma, Y.; Guo, S. Fresh and mechanical performance and freeze-thaw durability of steel fiber-reinforced rubber self-compacting concrete (SRSCC). J. Clean. Prod. 2020, 277, 123180. [Google Scholar] [CrossRef]


| Mix | Cement (kg/m3) | Aggregate | Water (kg/m3) | Rubber | SSFs (%) | ||
|---|---|---|---|---|---|---|---|
| Sand (kg/m3) | Gravel (kg/m3) | Weight (kg/m3) | Volume (%) | ||||
| C-0 | 464 | 742 | 1253 | 231 | 0 | 0 | 0, 1, and 2 |
| RC-5 | 464 | 742 | 1190 | 231 | 36 | 5 | 0, 1, and 2 |
| RC-10 | 464 | 742 | 1128 | 231 | 73 | 10 | 0, 1, and 2 |
| RC-15 | 464 | 742 | 1064 | 231 | 108 | 15 | 0, 1, and 2 |
| RC-20 | 464 | 742 | 1002 | 231 | 144 | 20 | 0, 1, and 2 |
| Scenario | Overly Thickness (mm) | Life Cycle (Yrs.) | Analysis Period (Yrs.) |
|---|---|---|---|
| 1 | 101.6 (4 in.) | 5 | 40 |
| 2 | 127.0 (5 in.) | 7 | |
| 3 | 177.8 (7 in.) | 10 |
| CR Content | Ingredients | Total ($/m3) | ||||
|---|---|---|---|---|---|---|
| Cement ($0.29/kg) | Sand ($0.05/kg) | Gravel ($0.13/kg) | Water ($0.01/Lit) | Rubber ($0.22/kg) | ||
| 0% | $63.42 | $37.01 | $163.88 | $2.44 | $- | $266.75 |
| 5% | $63.42 | $37.01 | $155.64 | $2.44 | $7.94 | $266.45 |
| 10% | $63.42 | $37.01 | $147.53 | $2.44 | $16.09 | $266.49 |
| 15% | $63.42 | $37.01 | $139.16 | $2.44 | $23.81 | $265.84 |
| 20% | $63.42 | $37.01 | $131.05 | $2.44 | $31.75 | $265.67 |
| Scenario | Thickness | CR Content | Quantity | Project Material Cost |
|---|---|---|---|---|
| 1 | 101.6 mm (4 in.) | 0% | 3.65 ∗ 53.3 ∗ 0.1016 19.76 m3 | $5270.98 |
| 5% | $5265.05 | |||
| 10% | $5265.84 | |||
| 15% | $5253.00 | |||
| 20% | $5249.64 | |||
| 2 | 127.0 mm (5 in.) | 0% | 3.65 ∗ 53.3 ∗ 0.127 24.70 m3 | $6588.73 |
| 5% | $6581.32 | |||
| 10% | $6582.30 | |||
| 15% | $6566.25 | |||
| 20% | $6562.05 | |||
| 3 | 177.8 mm (7 in.) | 0% | 3.65 ∗ 53.3 ∗ 0.1778 34.59 m3 | $9226.88 |
| 5% | $9216.51 | |||
| 10% | $9217.89 | |||
| 15% | $9195.41 | |||
| 20% | $9189.53 |
Disclaimer/Publisher’s Note: The statements, opinions and data contained in all publications are solely those of the individual author(s) and contributor(s) and not of MDPI and/or the editor(s). MDPI and/or the editor(s) disclaim responsibility for any injury to people or property resulting from any ideas, methods, instructions or products referred to in the content. |
© 2023 by the authors. Licensee MDPI, Basel, Switzerland. This article is an open access article distributed under the terms and conditions of the Creative Commons Attribution (CC BY) license (https://creativecommons.org/licenses/by/4.0/).
Share and Cite
El-Zohairy, A.; Sanchez, M.; Abediniangerabi, B.; Moler, P. Performance of Rubberized Concrete and the Effect of Temperature and Stainless Steel Fibers. Buildings 2023, 13, 280. https://doi.org/10.3390/buildings13020280
El-Zohairy A, Sanchez M, Abediniangerabi B, Moler P. Performance of Rubberized Concrete and the Effect of Temperature and Stainless Steel Fibers. Buildings. 2023; 13(2):280. https://doi.org/10.3390/buildings13020280
Chicago/Turabian StyleEl-Zohairy, Ayman, Matthew Sanchez, Bahram Abediniangerabi, and Perry Moler. 2023. "Performance of Rubberized Concrete and the Effect of Temperature and Stainless Steel Fibers" Buildings 13, no. 2: 280. https://doi.org/10.3390/buildings13020280
APA StyleEl-Zohairy, A., Sanchez, M., Abediniangerabi, B., & Moler, P. (2023). Performance of Rubberized Concrete and the Effect of Temperature and Stainless Steel Fibers. Buildings, 13(2), 280. https://doi.org/10.3390/buildings13020280