
An Experimental Study on Flexural-Shear Behavior of Composite Beams in Precast Frame Structures with Post-Cast Epoxy Resin Concrete

Abstract
:1. Introduction
2. Test Profile
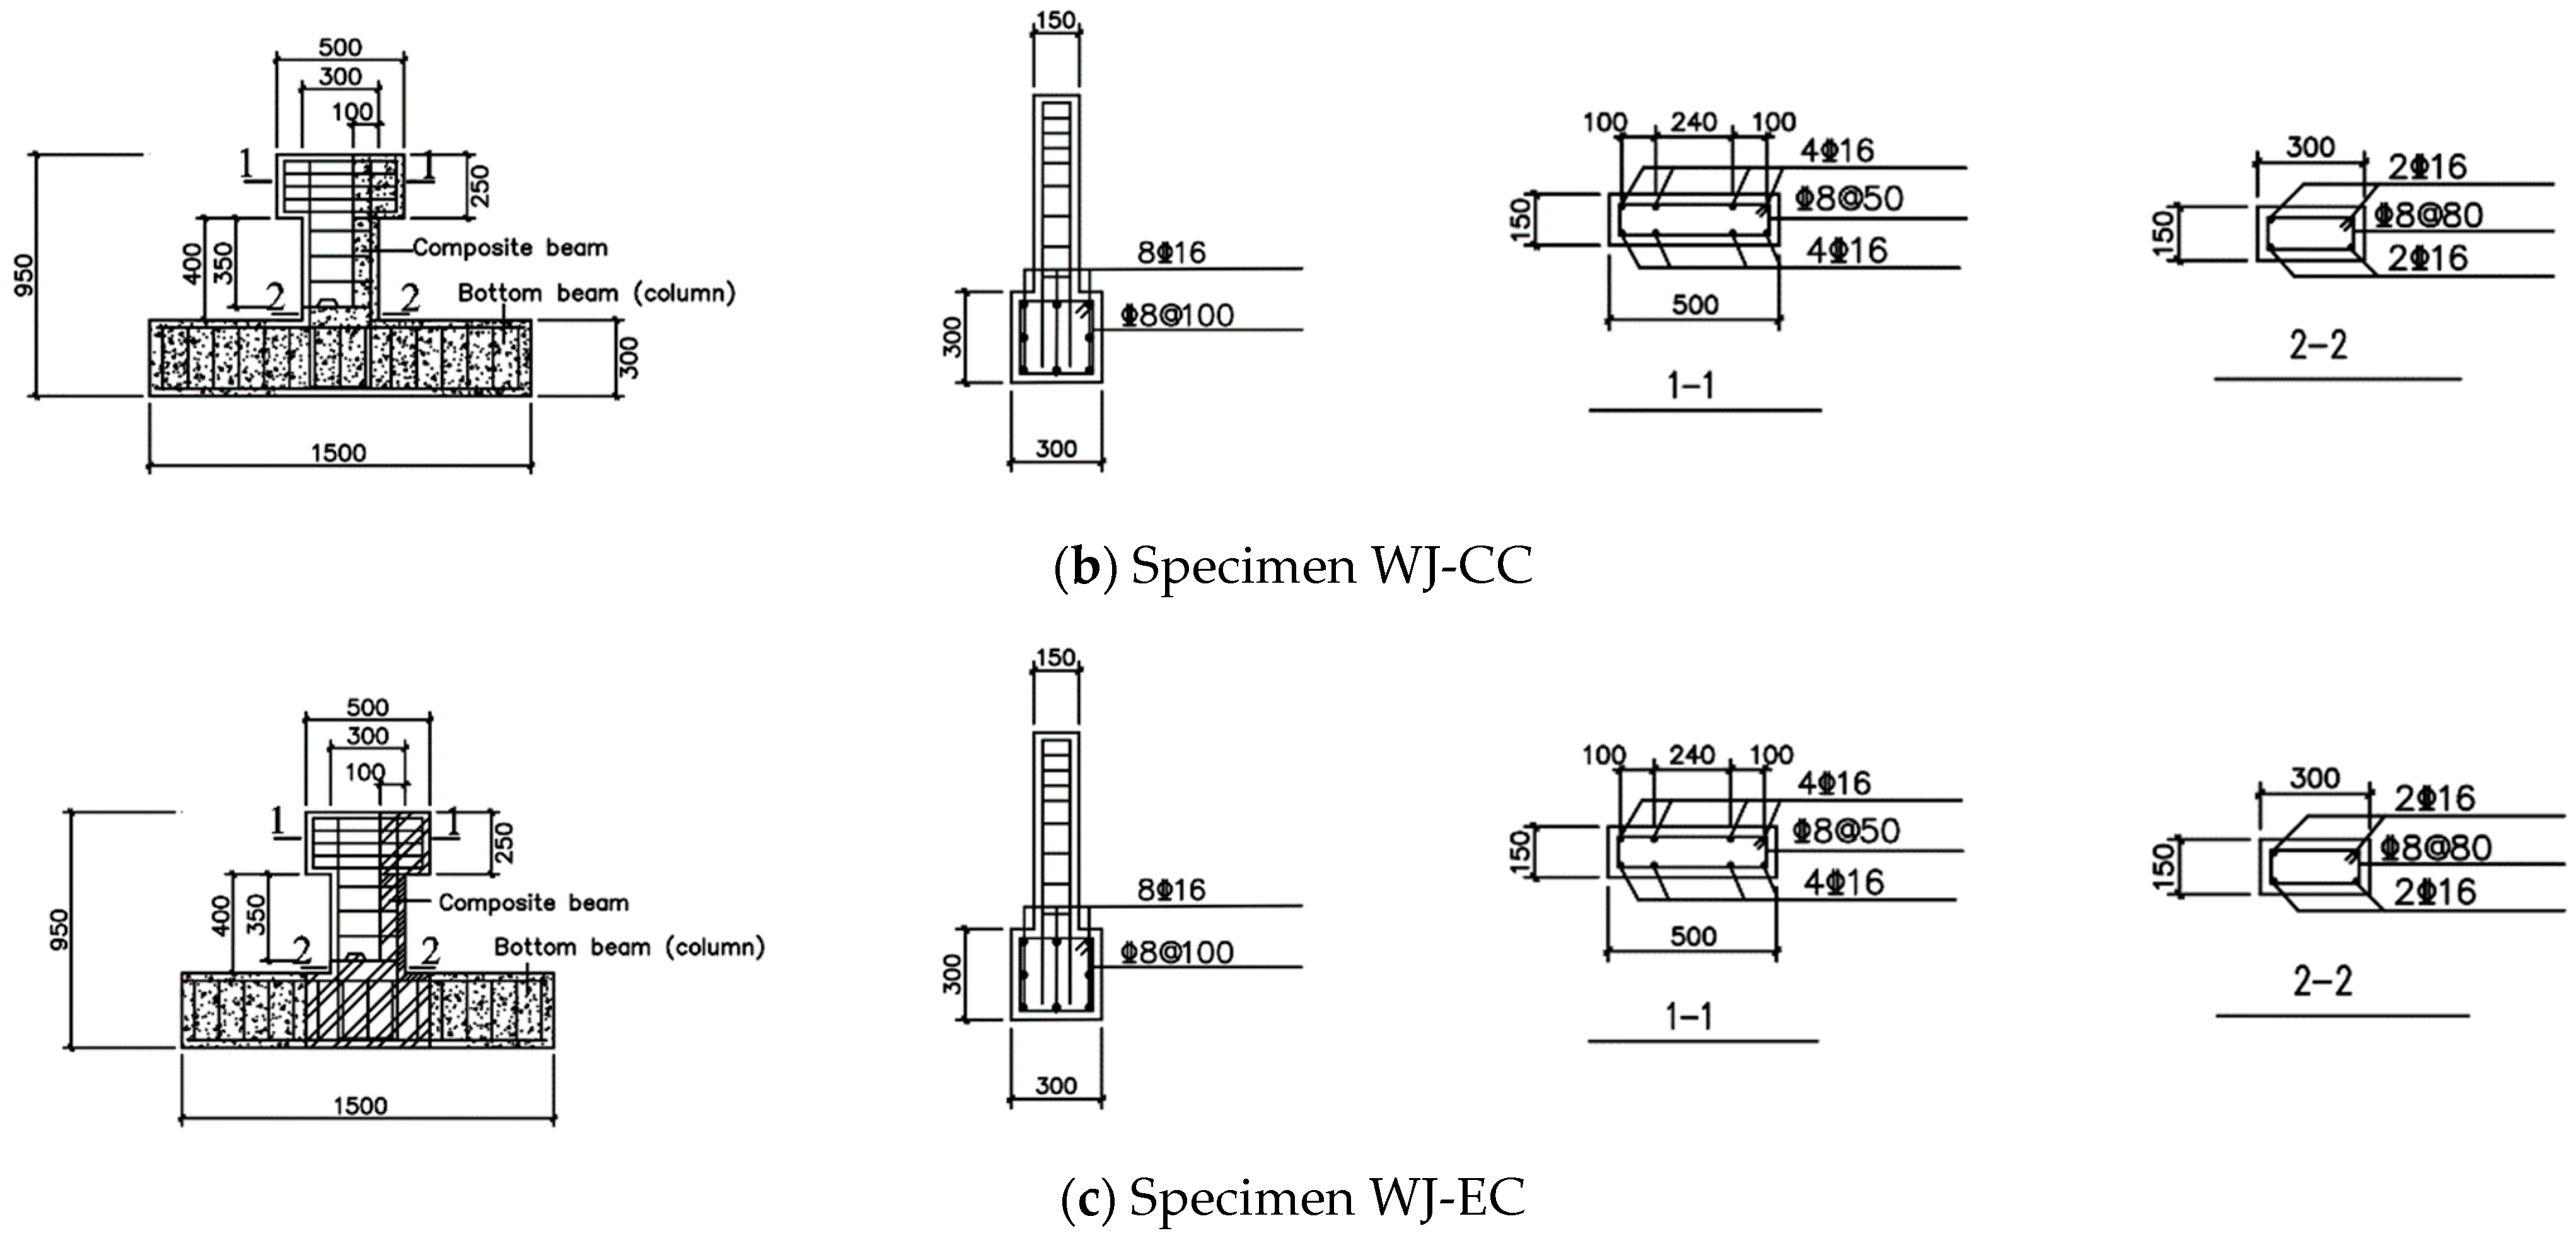
2.1. Test Piece Design
2.2. Basic Mechanical Properties of Materials
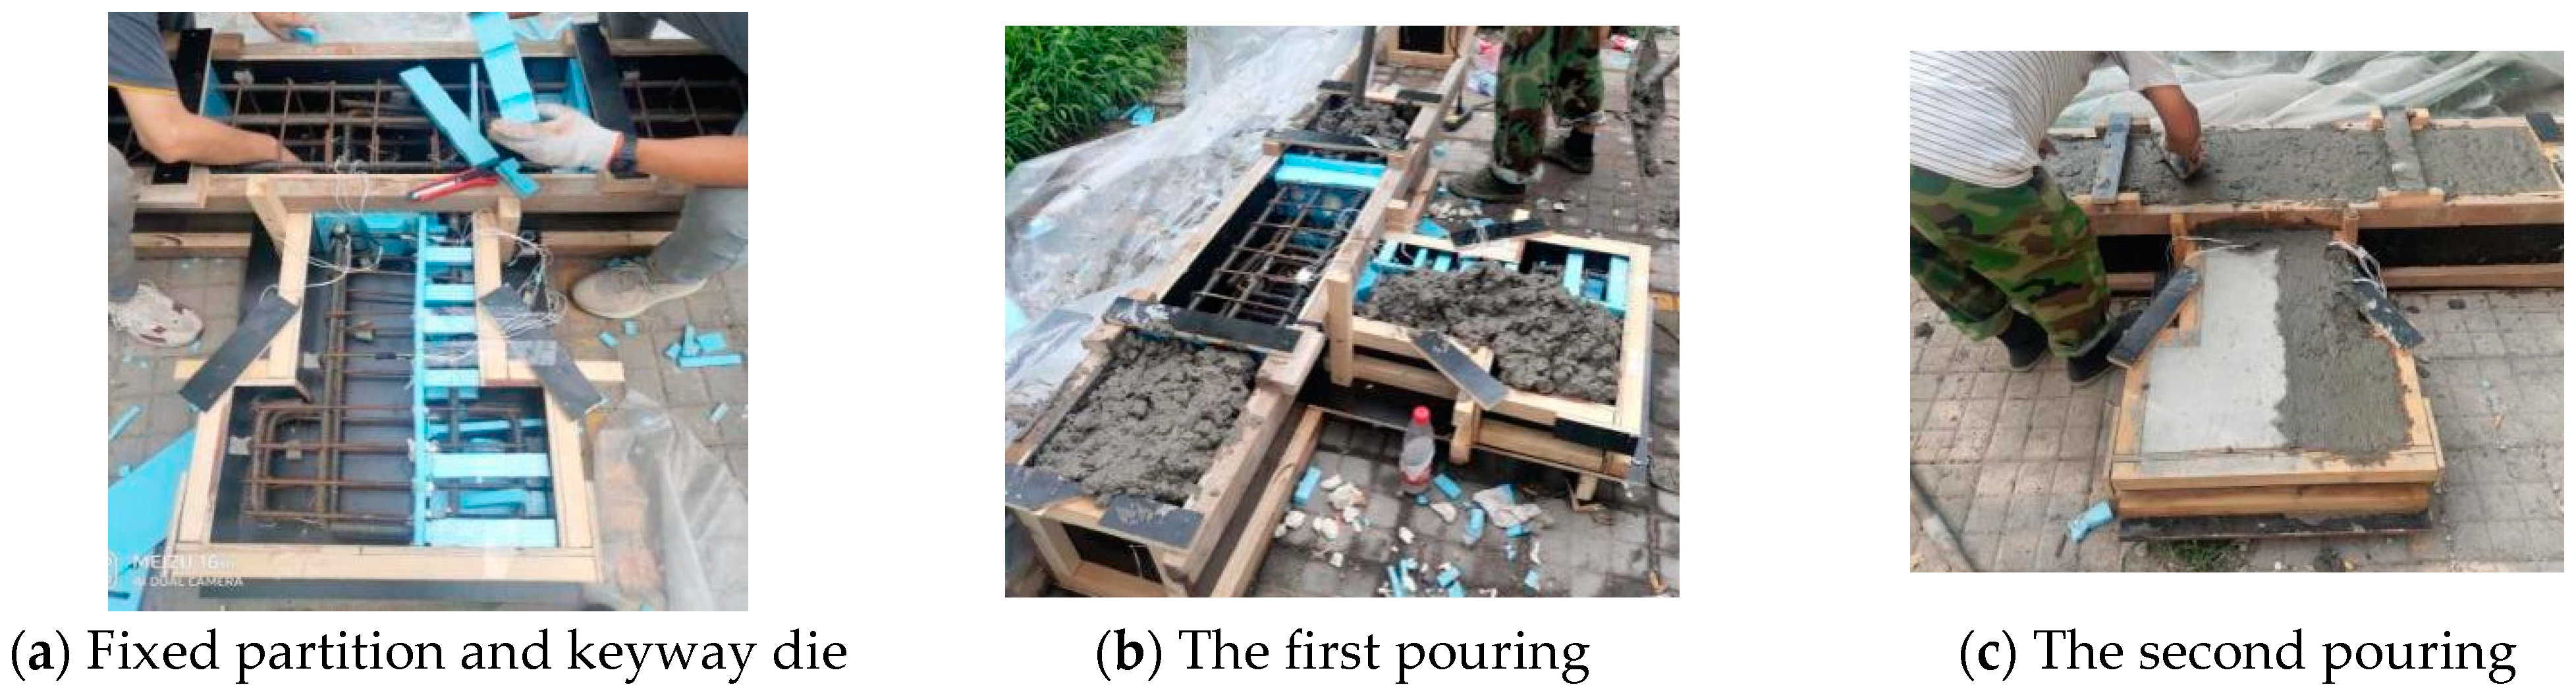
2.3. The Production Process of the Specimens
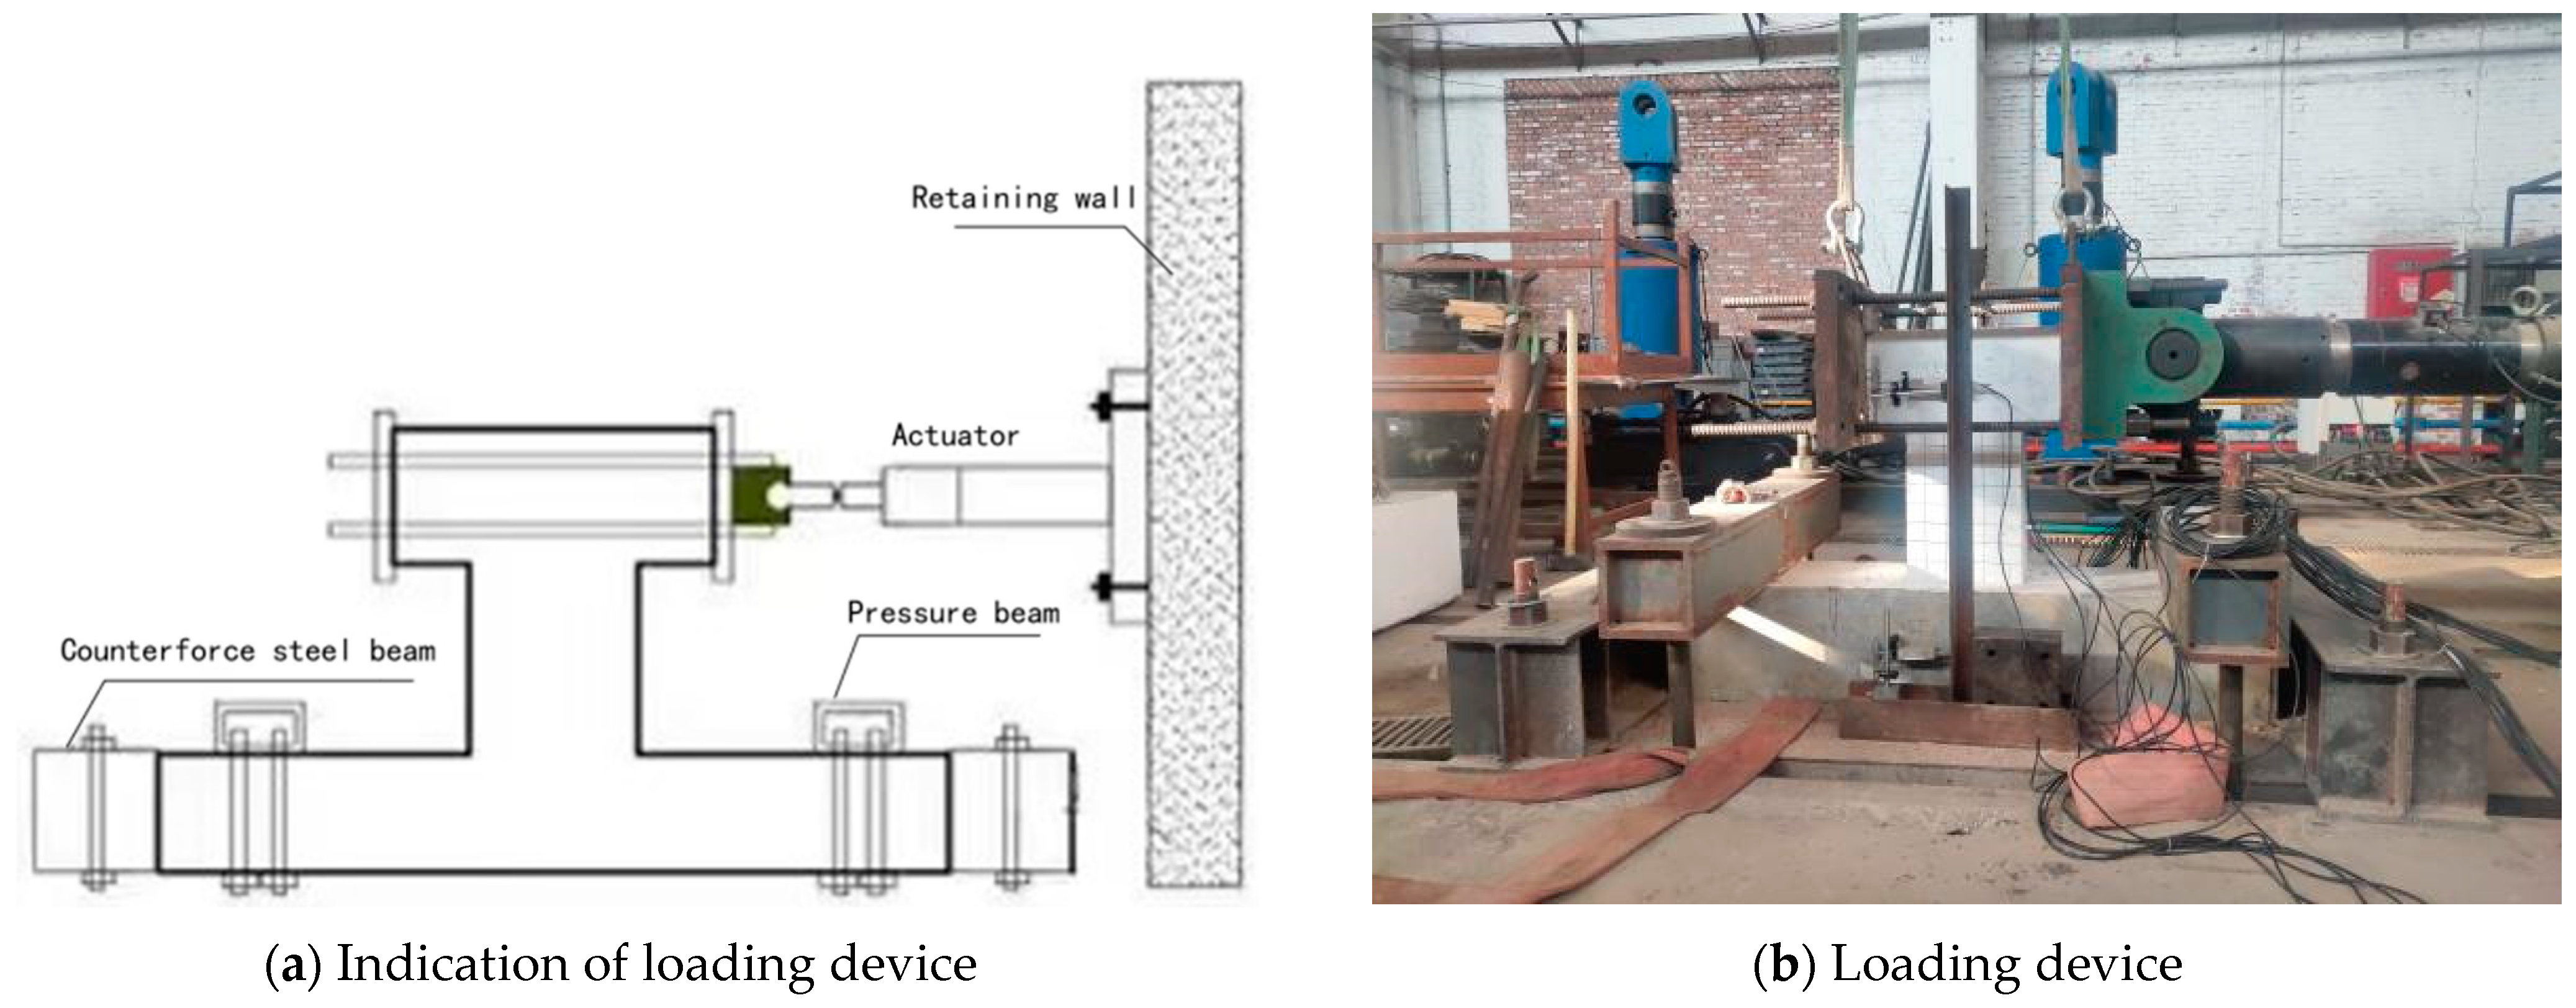
2.4. Loading Device and Loading Scheme
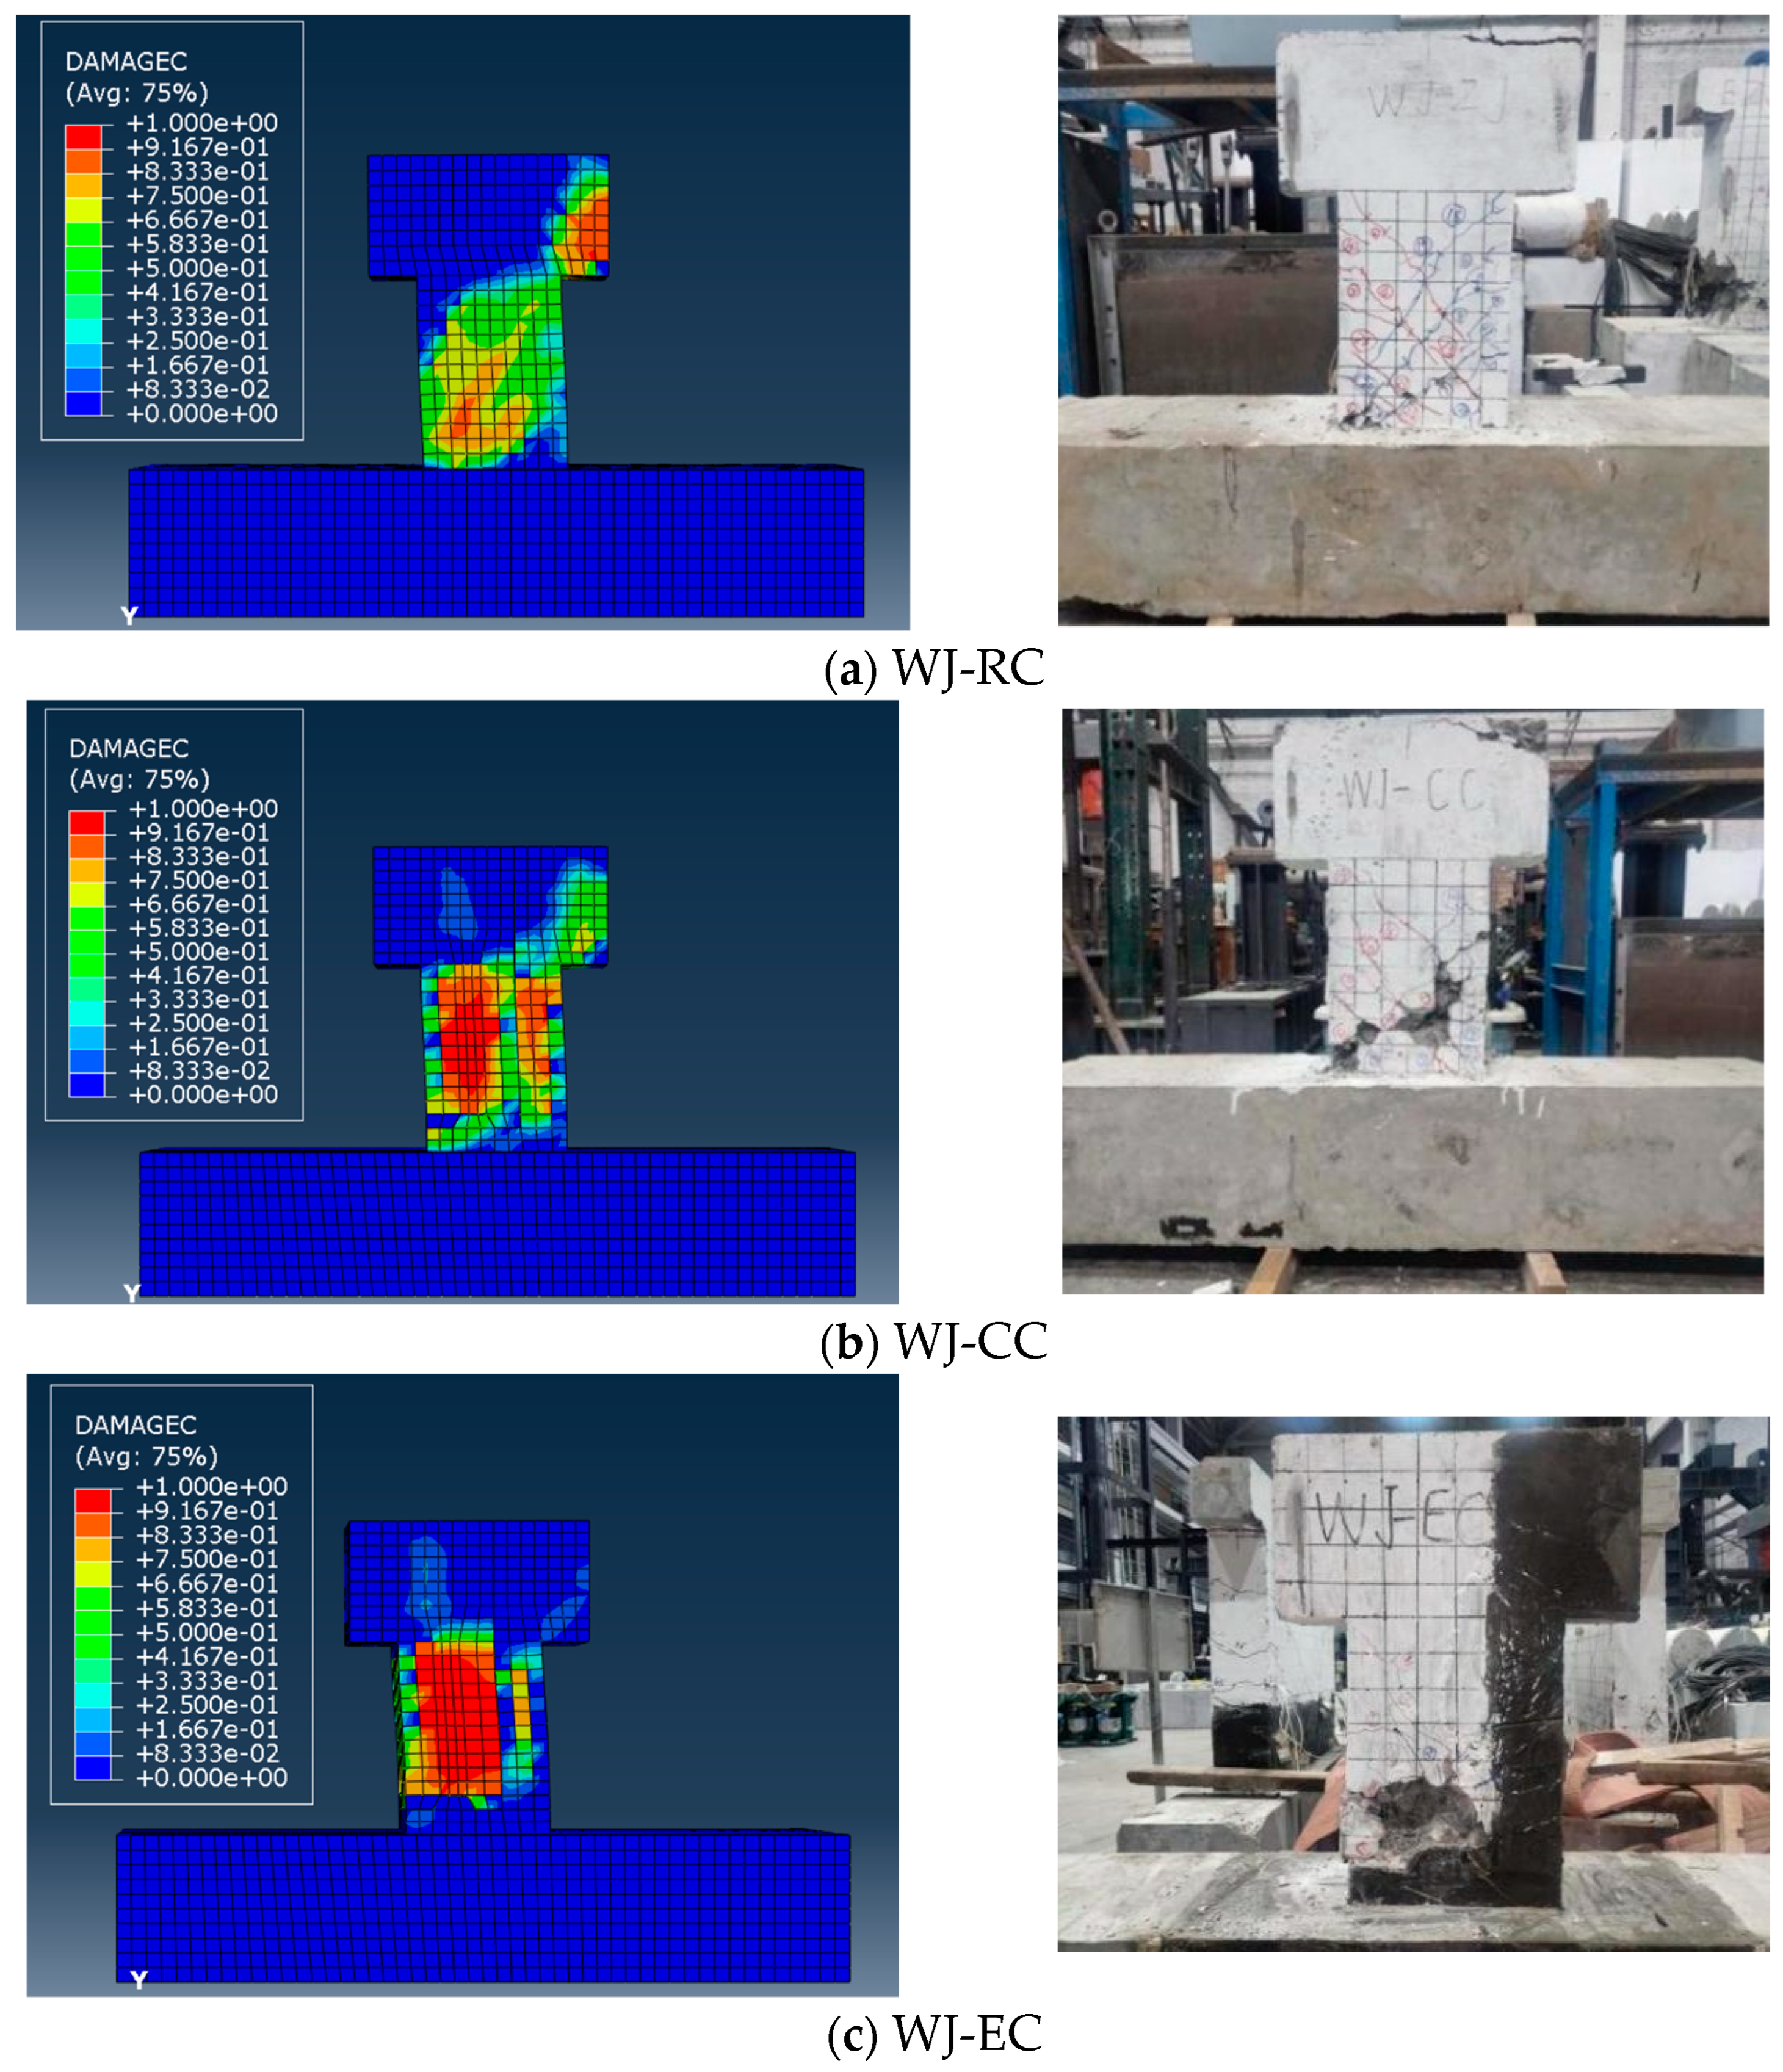
3. Test Process and Failure Characteristics of Specimen
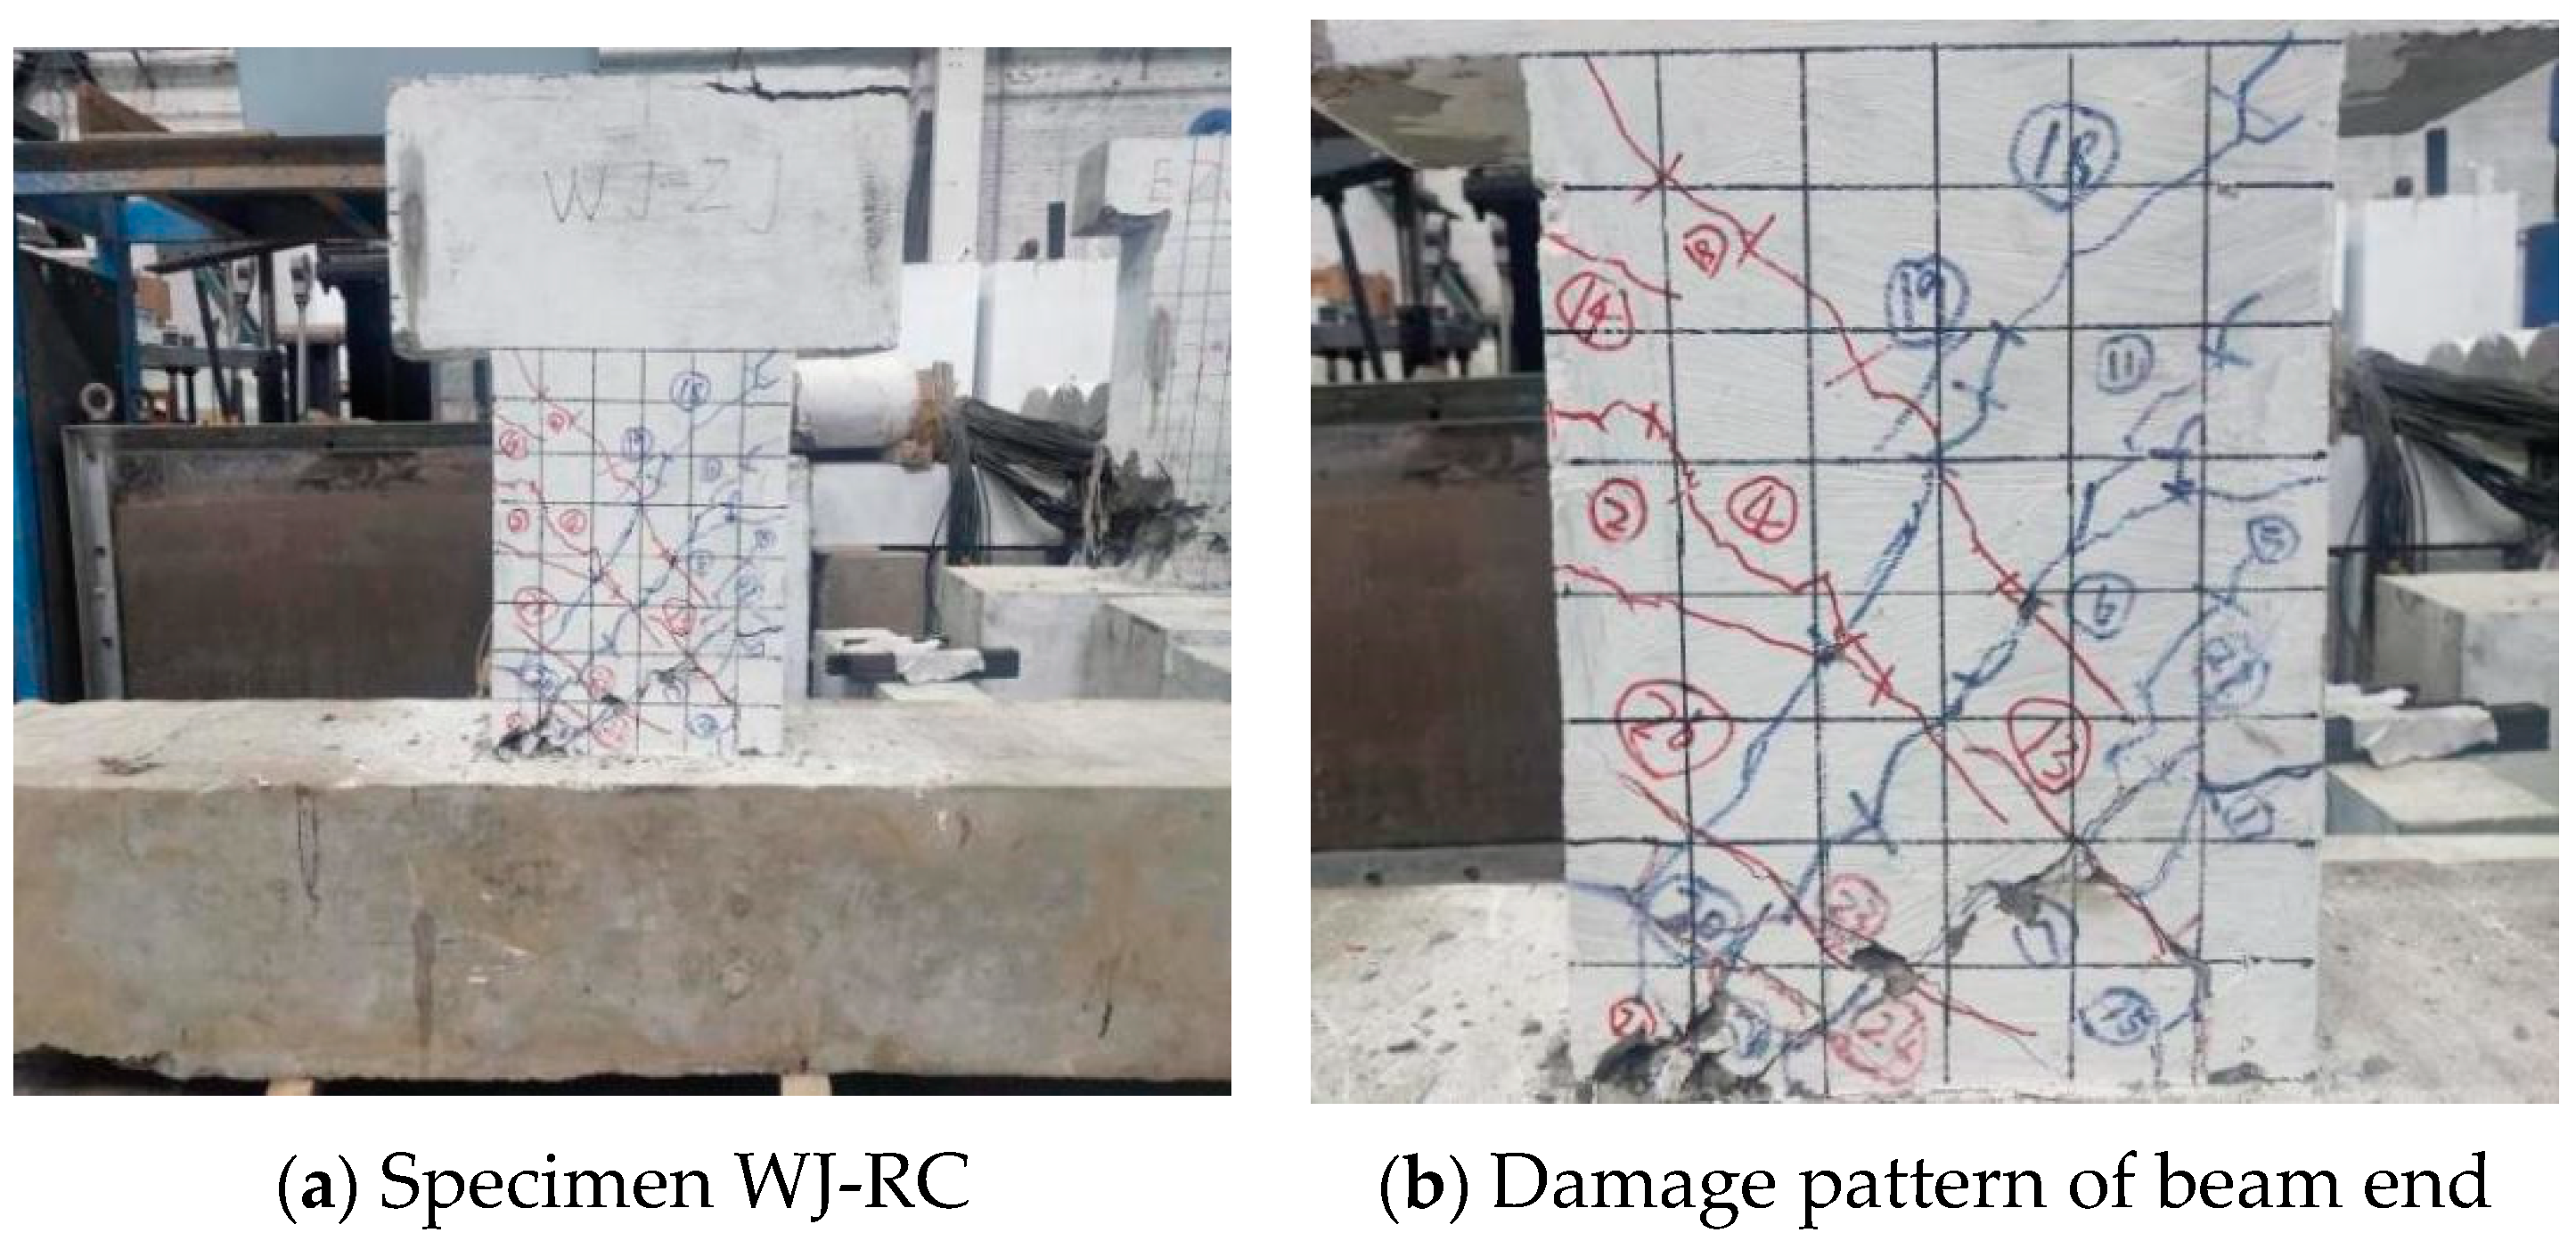
- (1)
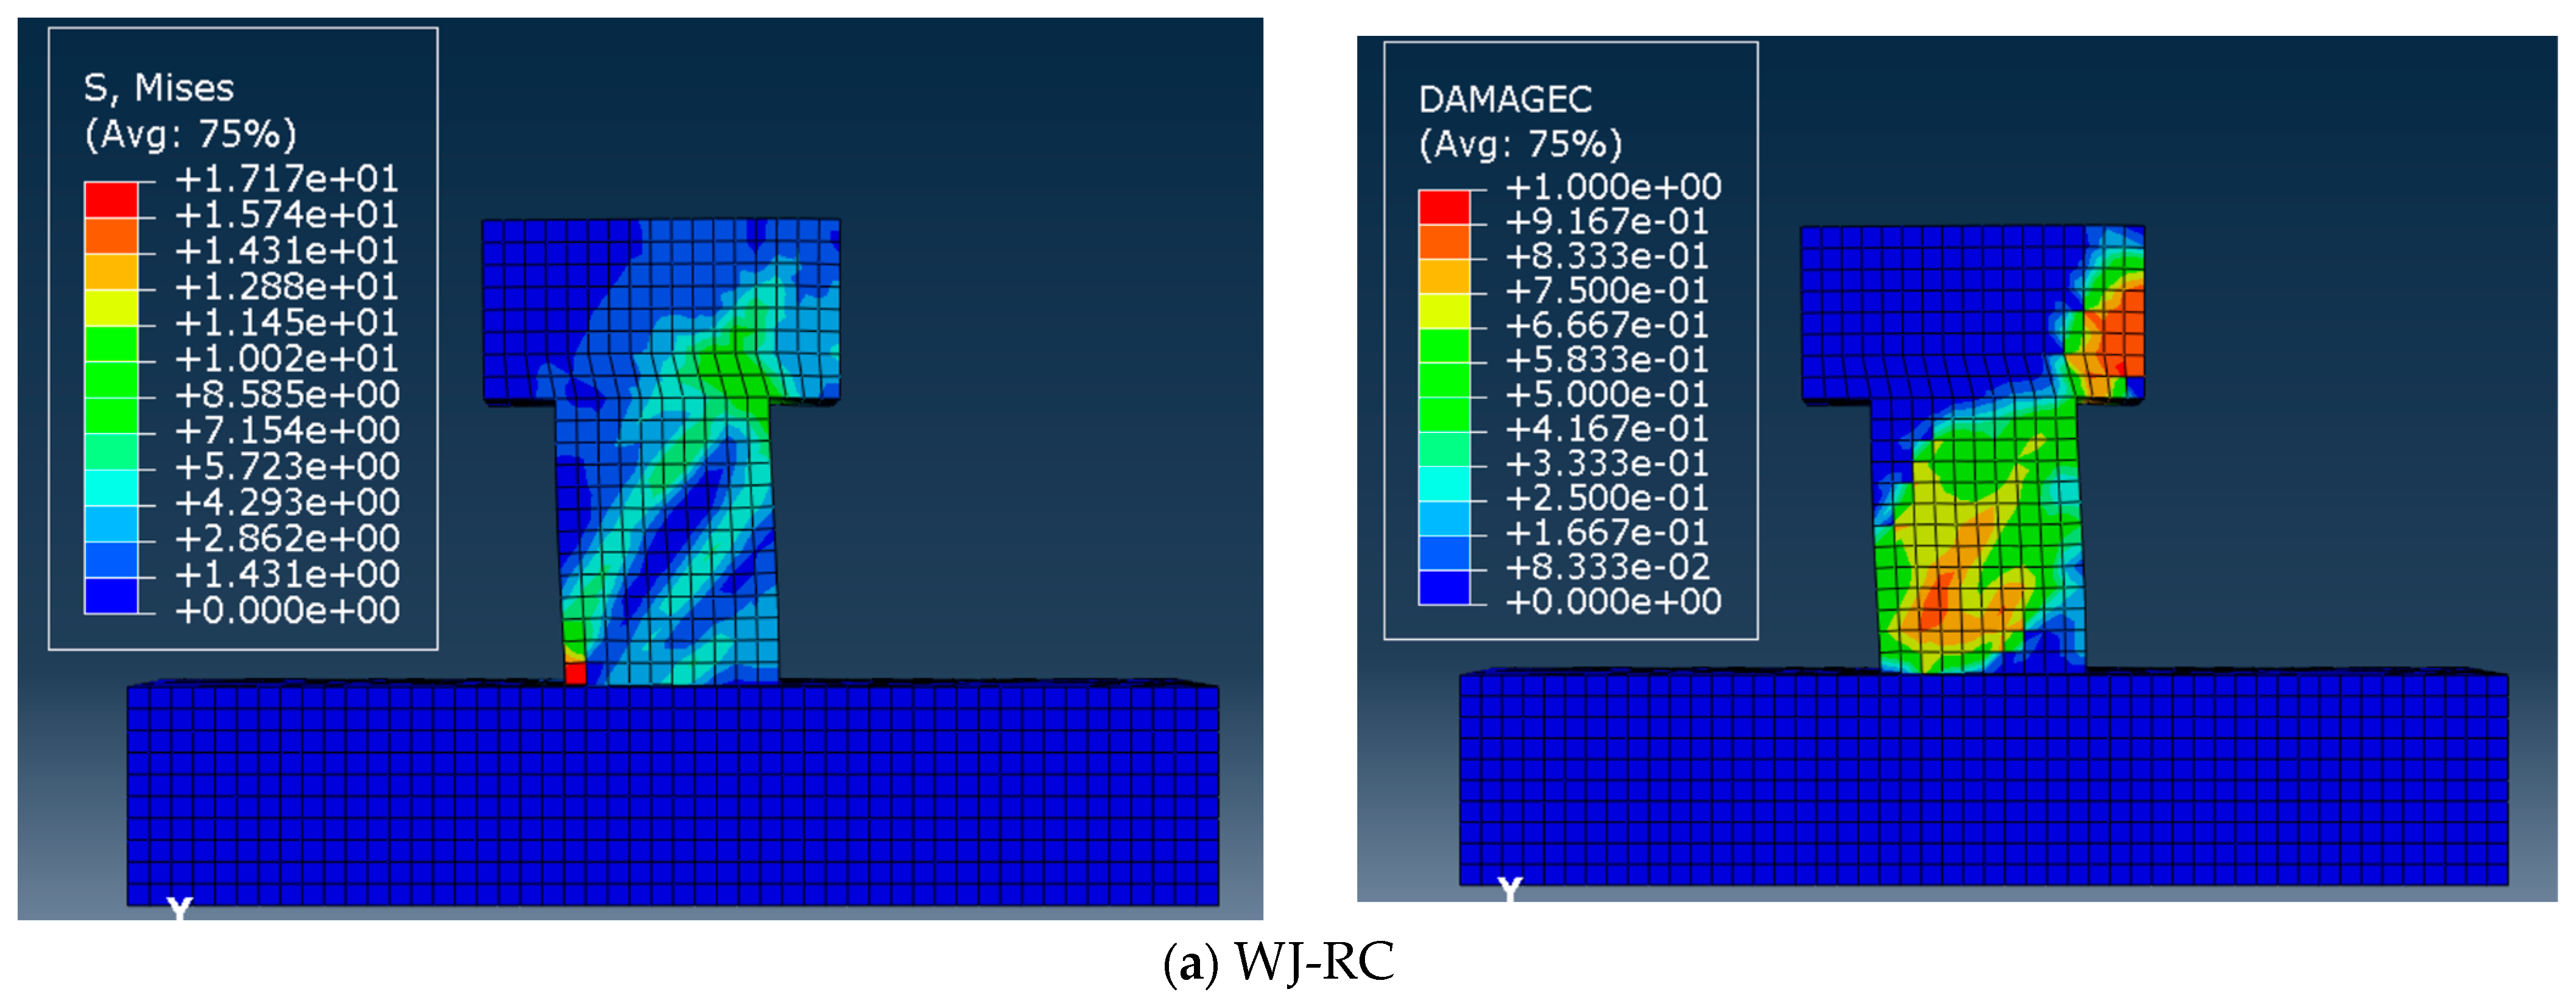
- Specimen WJ-RC
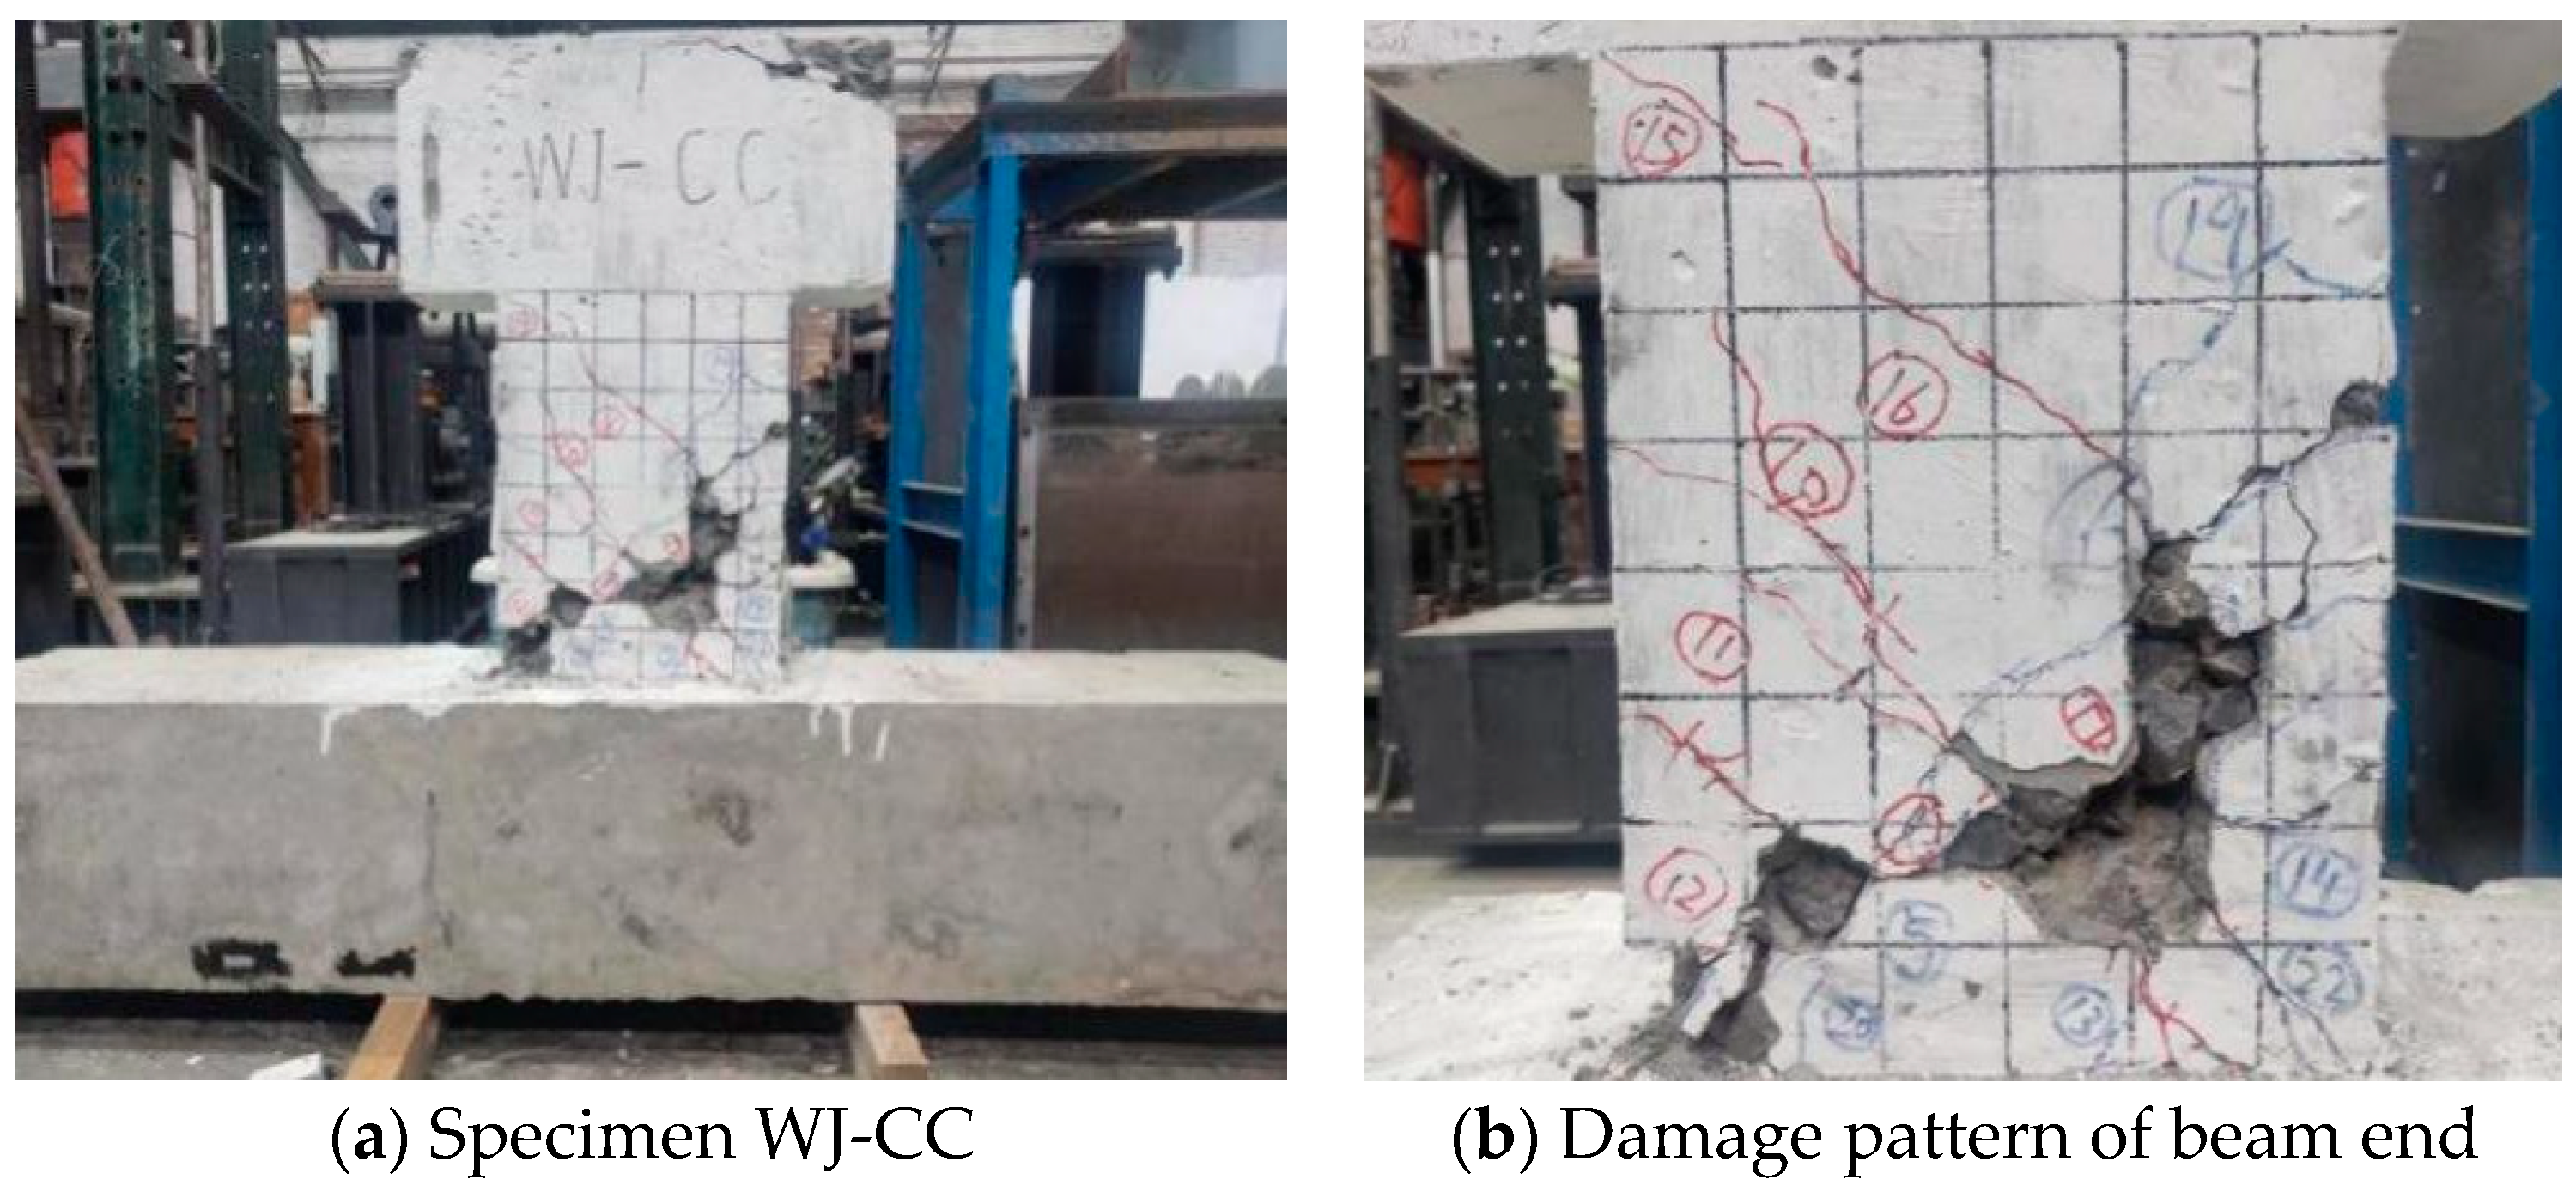
- (2)
- Specimen WJ-CC
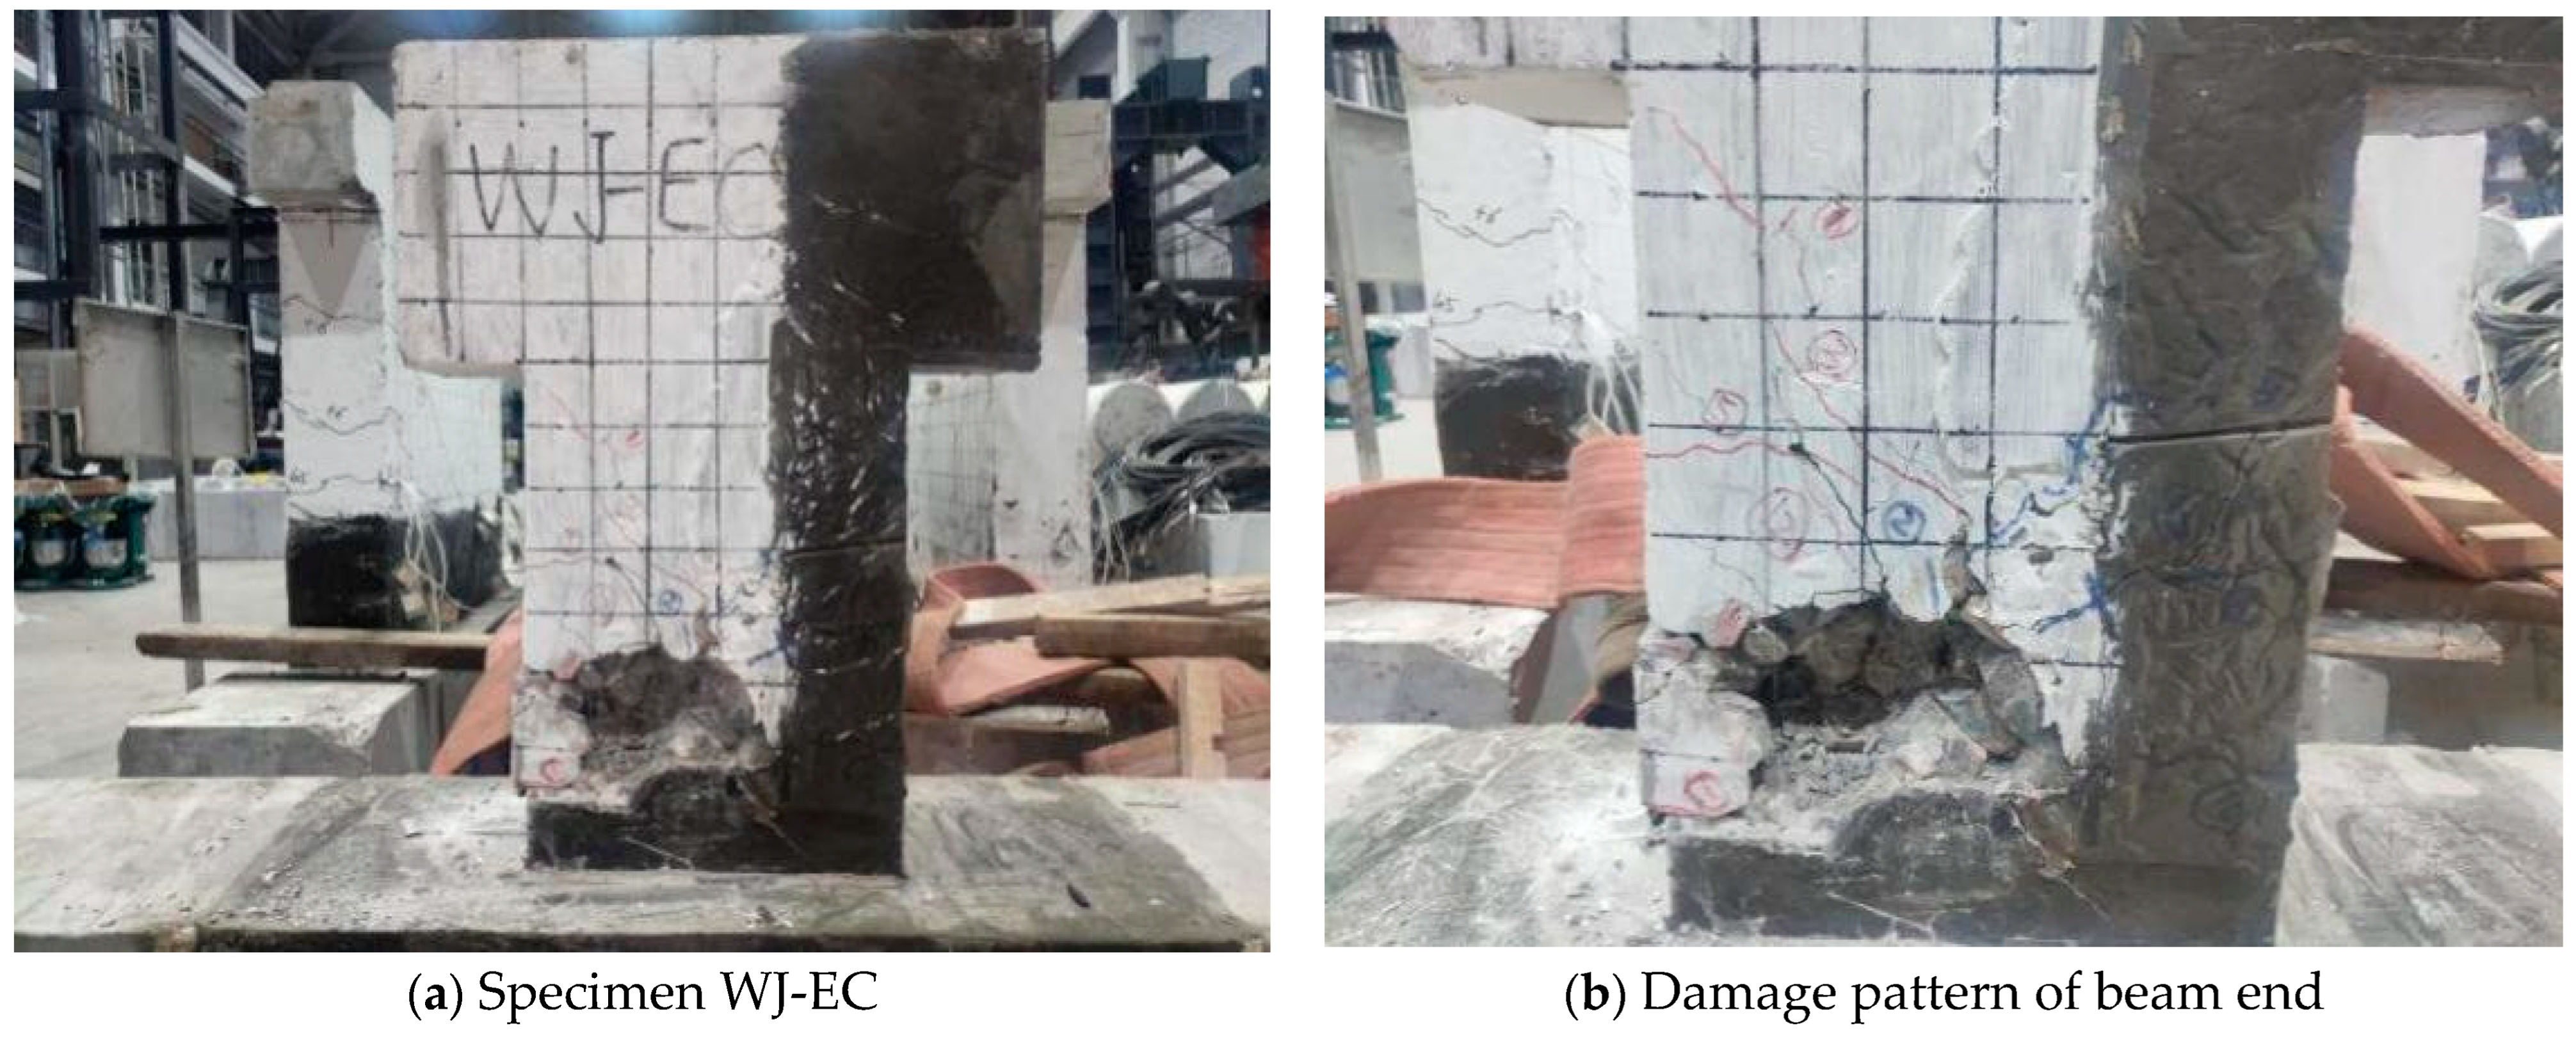
- (3)
- Specimen WJ-EC
4. Experimental Results and Analysis
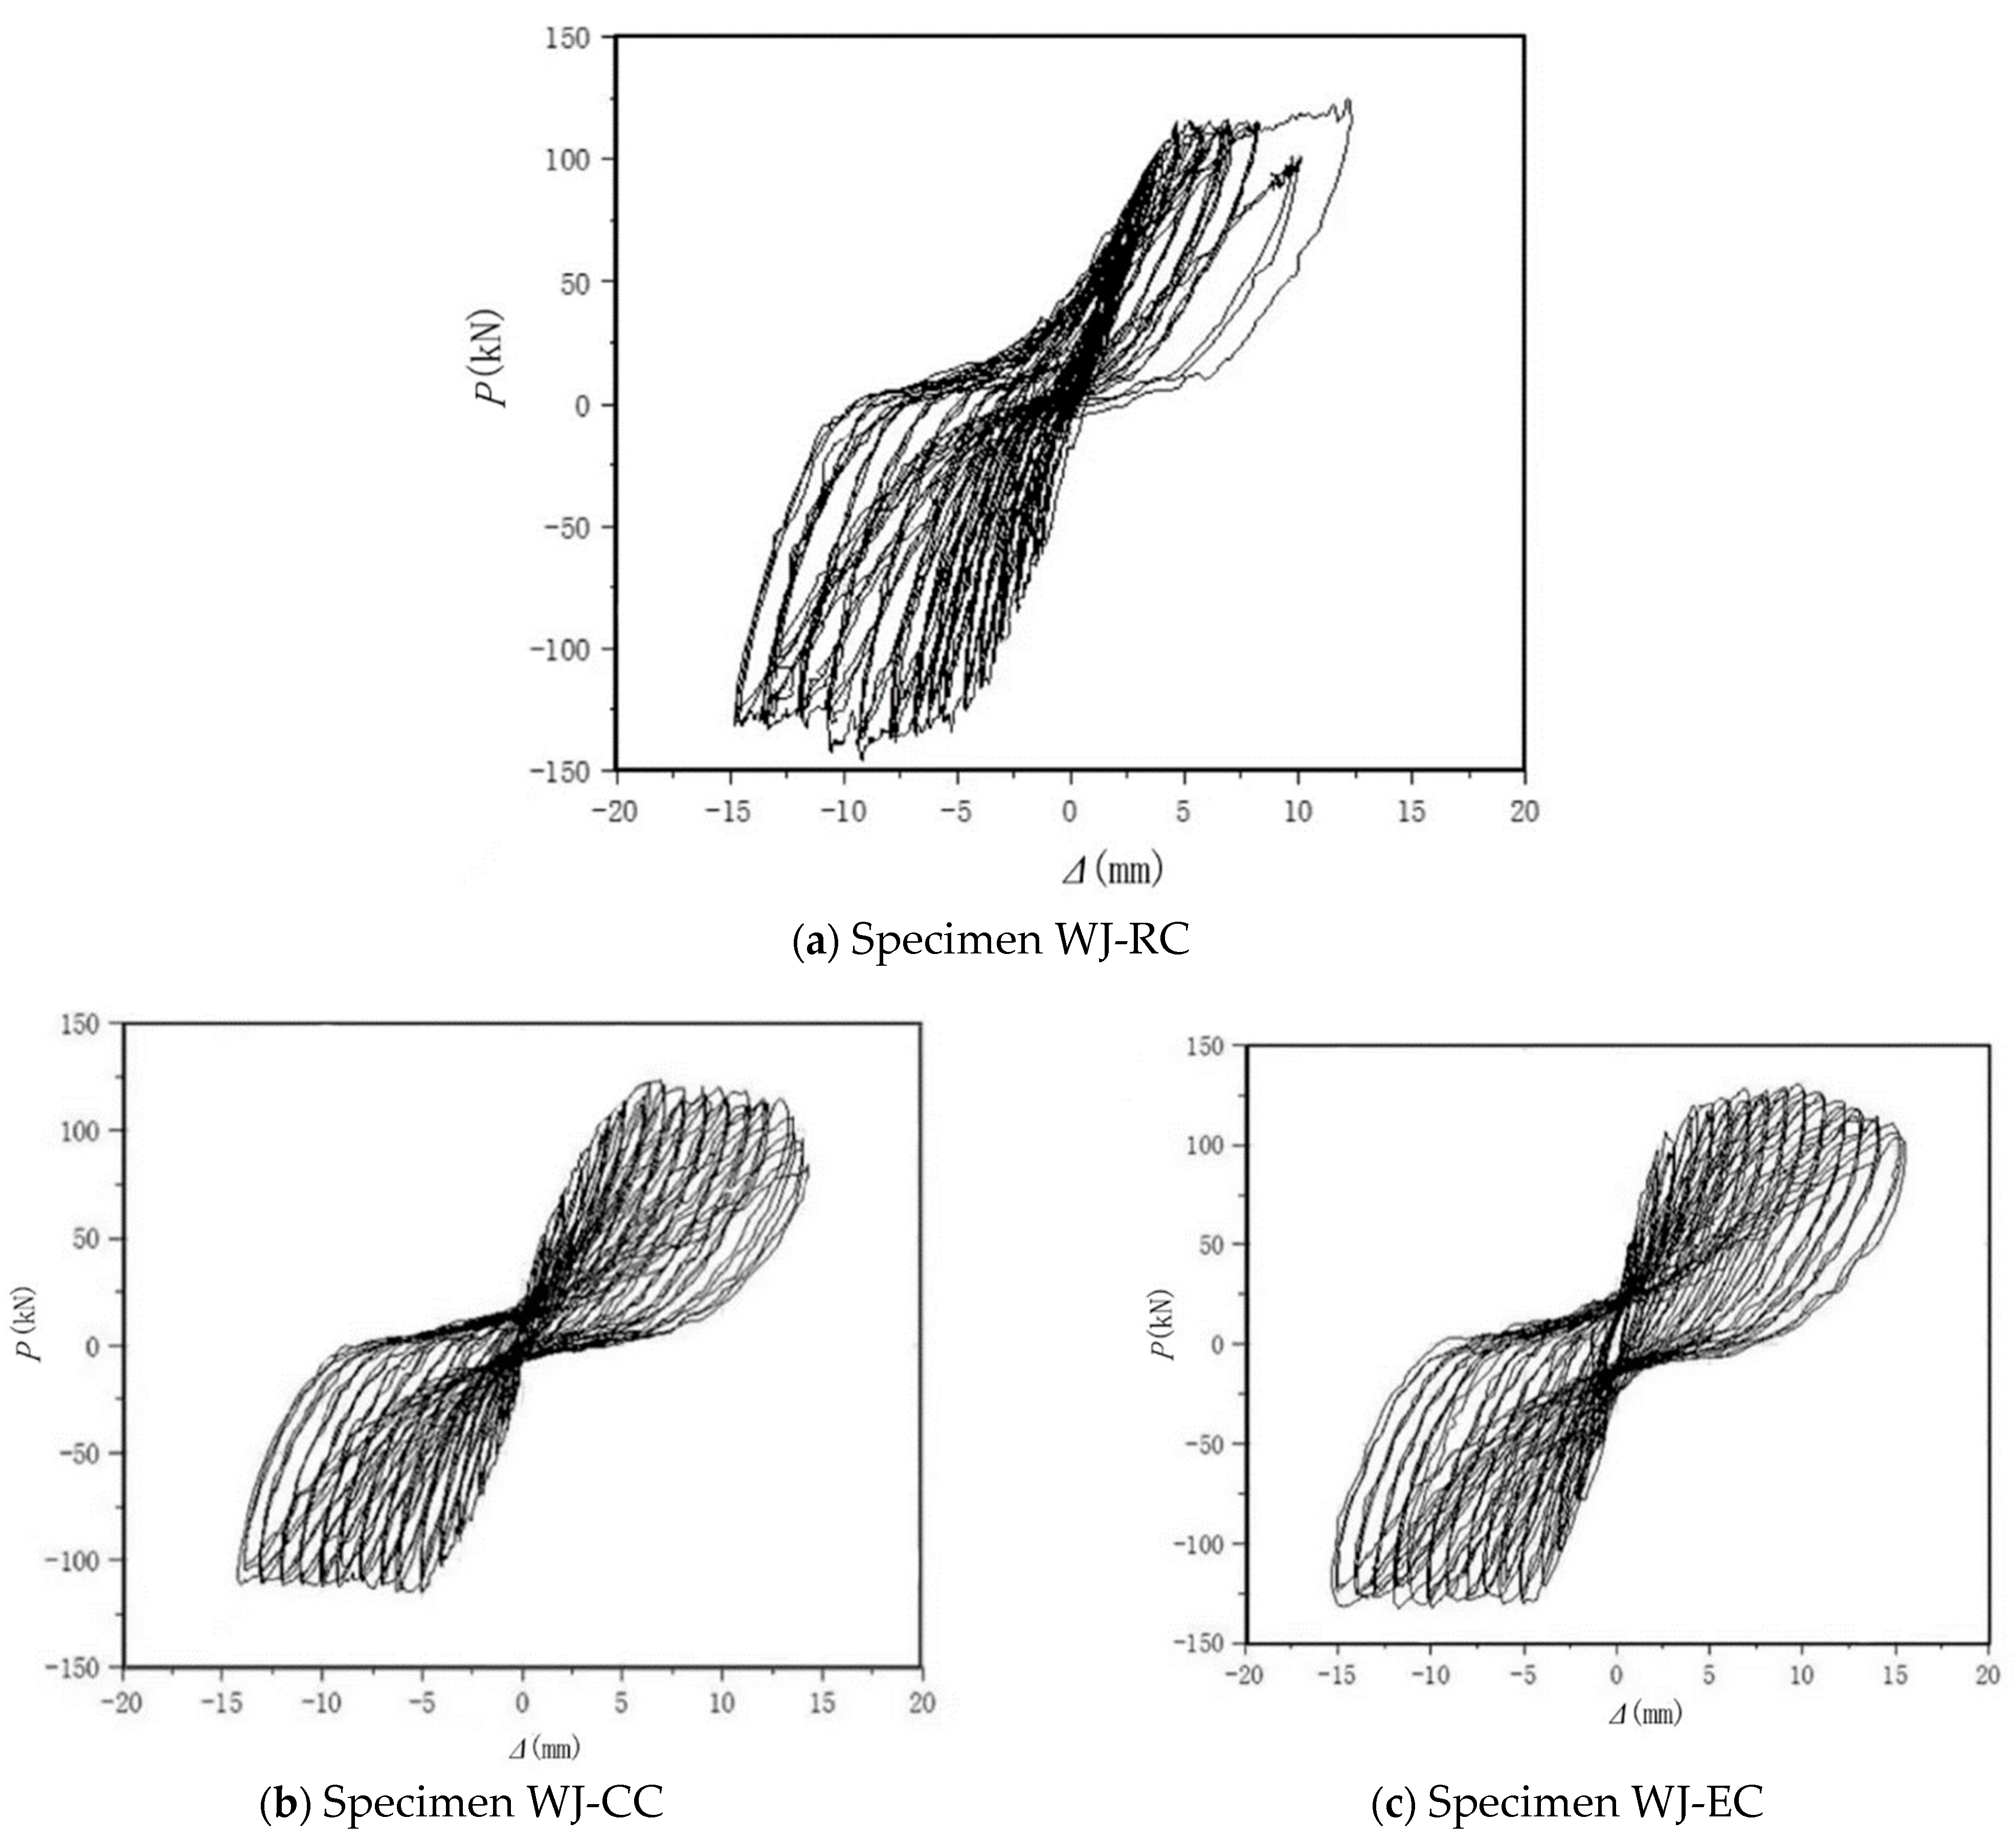
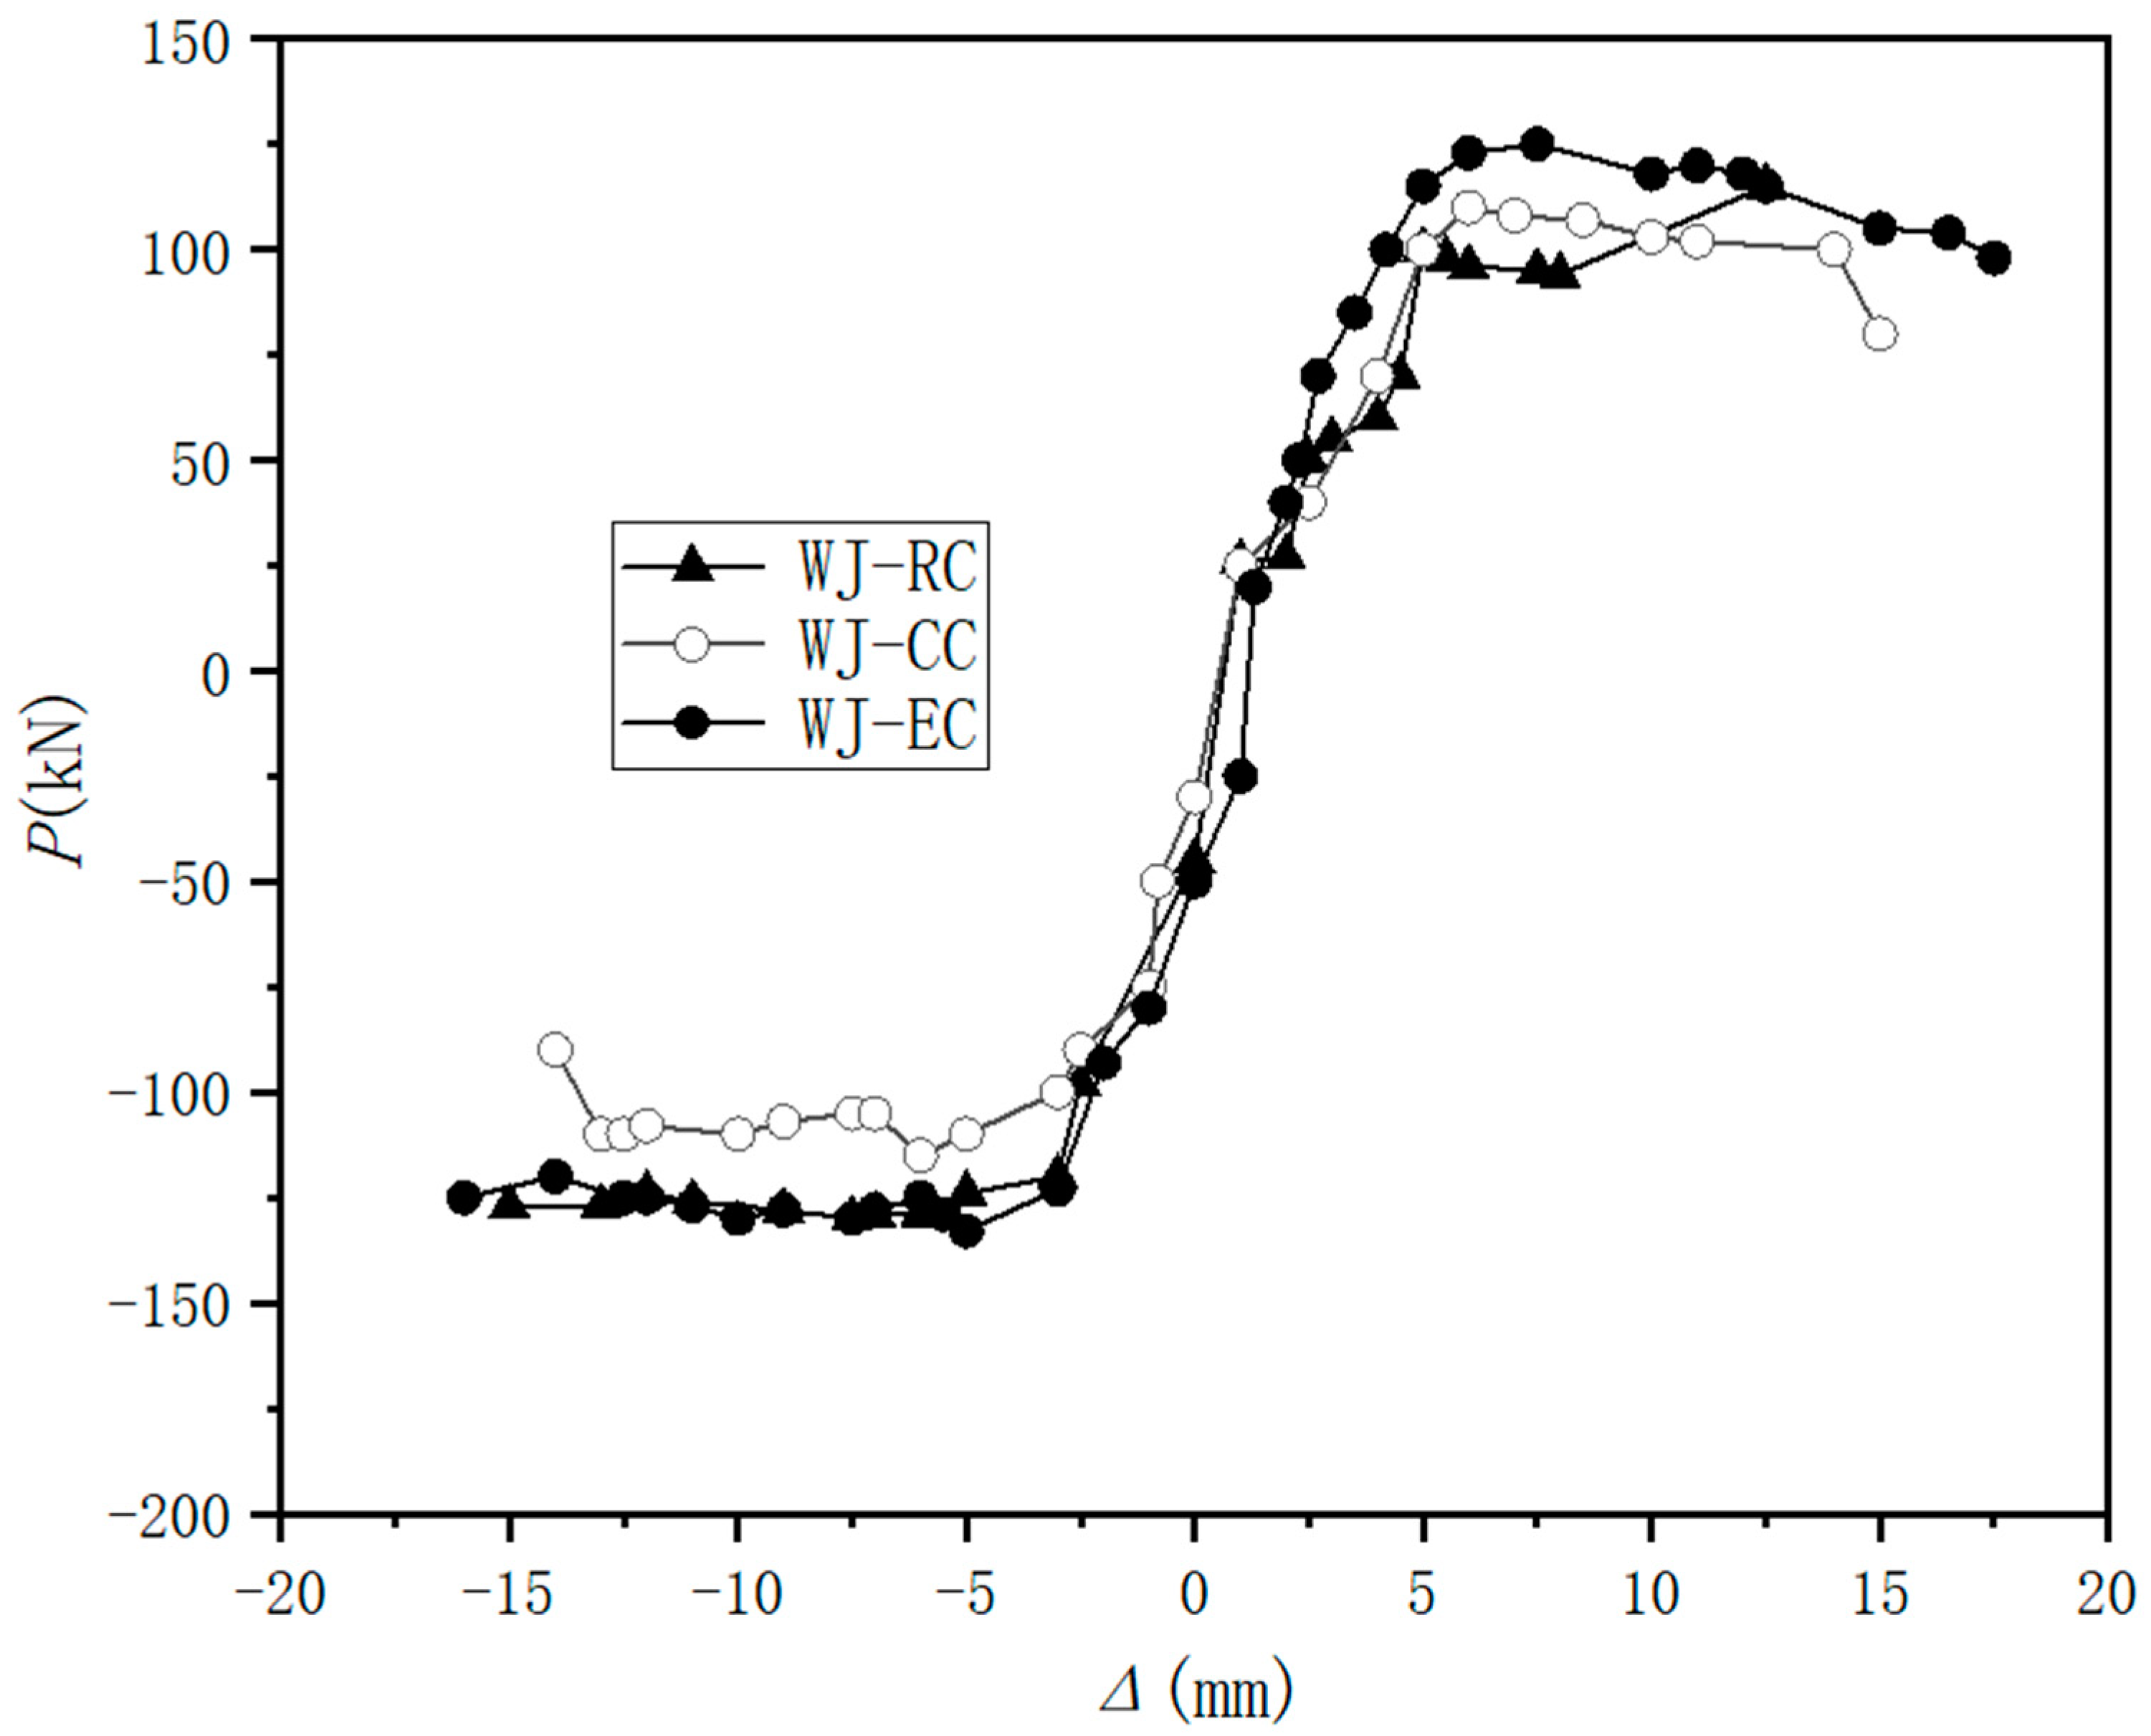
4.1. Hysteresis Curve
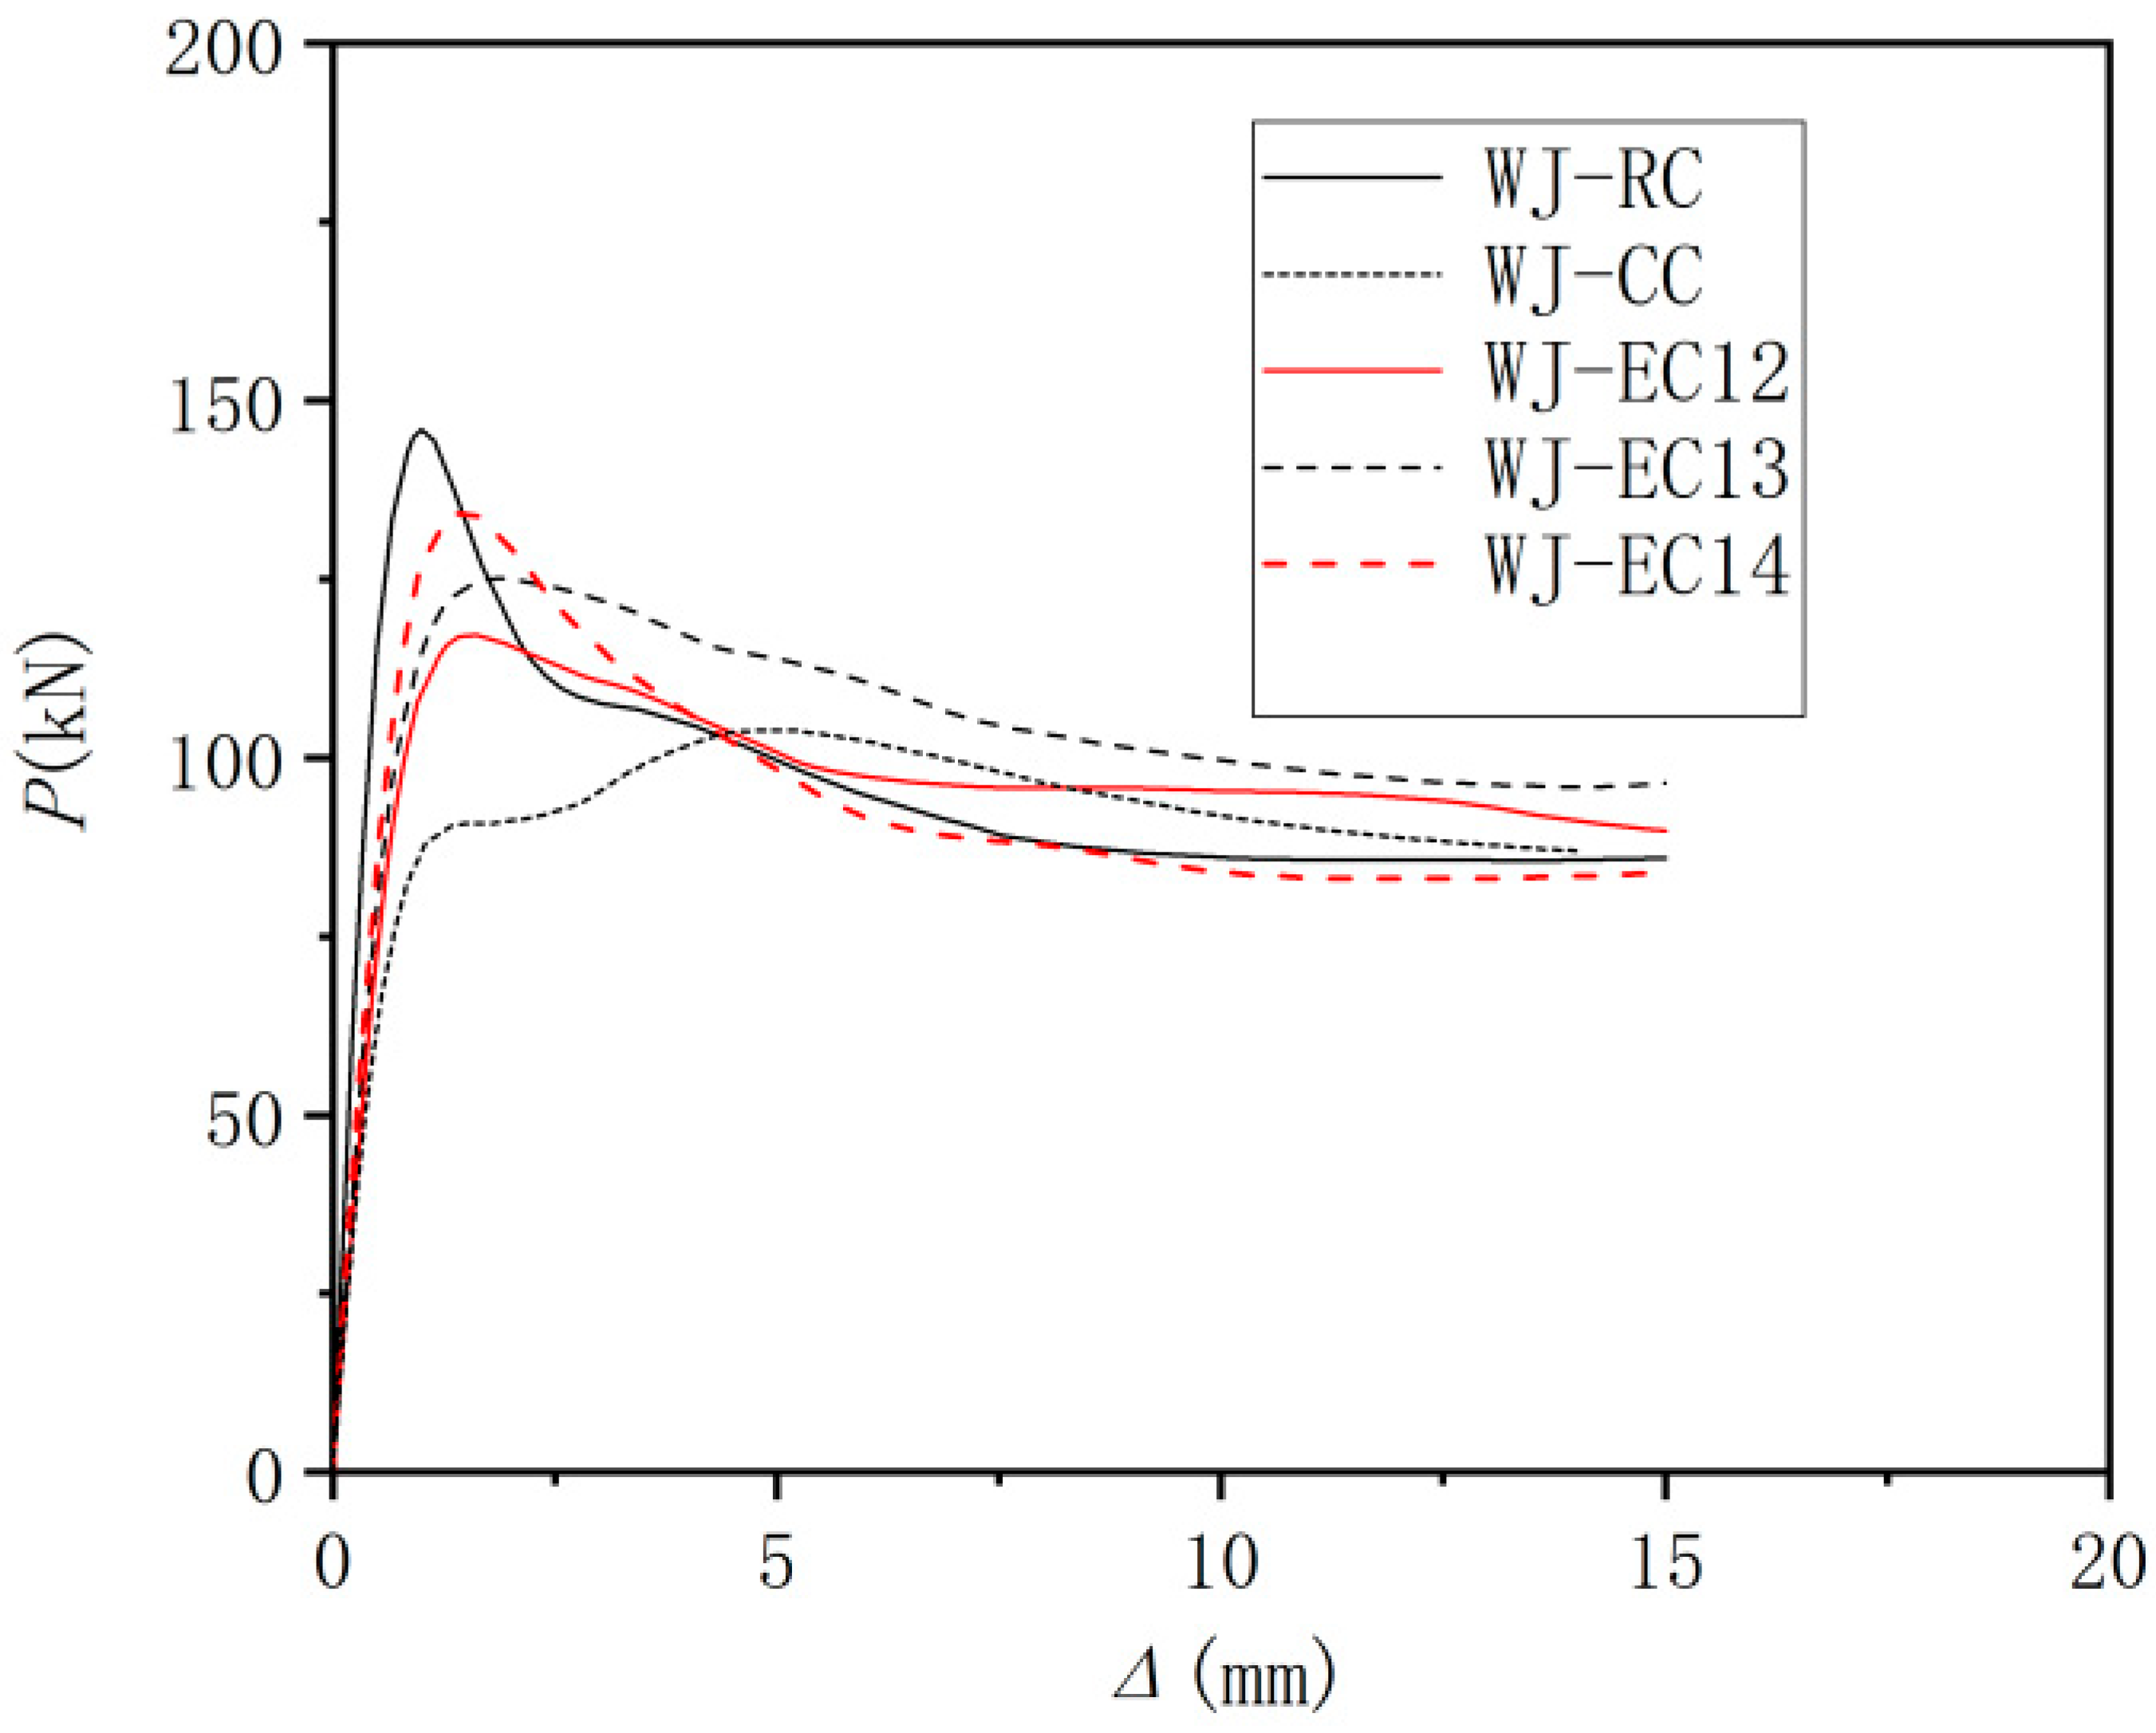
4.2. Skeleton Curve
- (1)
- During the early loading stage, the load value of the WJ-EC specimen exhibited the most rapid increase, indicating the highest stiffness. In comparison, the stiffness of the WJ-RC and WJ-CC specimens was slightly lower, with minimal difference between them. After reaching the ultimate load, the WJ-EC specimen demonstrated the slowest decrease in bearing capacity, followed by the WJ-RC specimen, while the bearing capacity of the WJ-CC specimen exhibited a more pronounced decline.
- (2)
- The cracking load of the WJ-CC specimen was the lowest, whereas the cracking load of the WJ-EC specimen was marginally lower than that of the fully cast specimen, with no significant distinction between them. The initial crack in both the WJ-CC and WJ-EC specimens appeared on the horizontal joint surface between the old and new concrete. The cracking displacement of the two specimens was similar and smaller than that of the fully cast specimens.
- (3)
- The overall trend of the skeleton curve for the WJ-EC specimen was higher, resulting in a 10% increase in bearing capacity compared to the WJ-CC specimen. The bearing capacity of the WJ-EC specimen was similar to that of the WJ-RC specimen, but the ductility of the WJ-EC specimen was 1.65 times greater than that of the WJ-RC specimen.
5. Finite Element Analysis
5.1. Constitutive Model of Materials
5.2. Establishment of Model
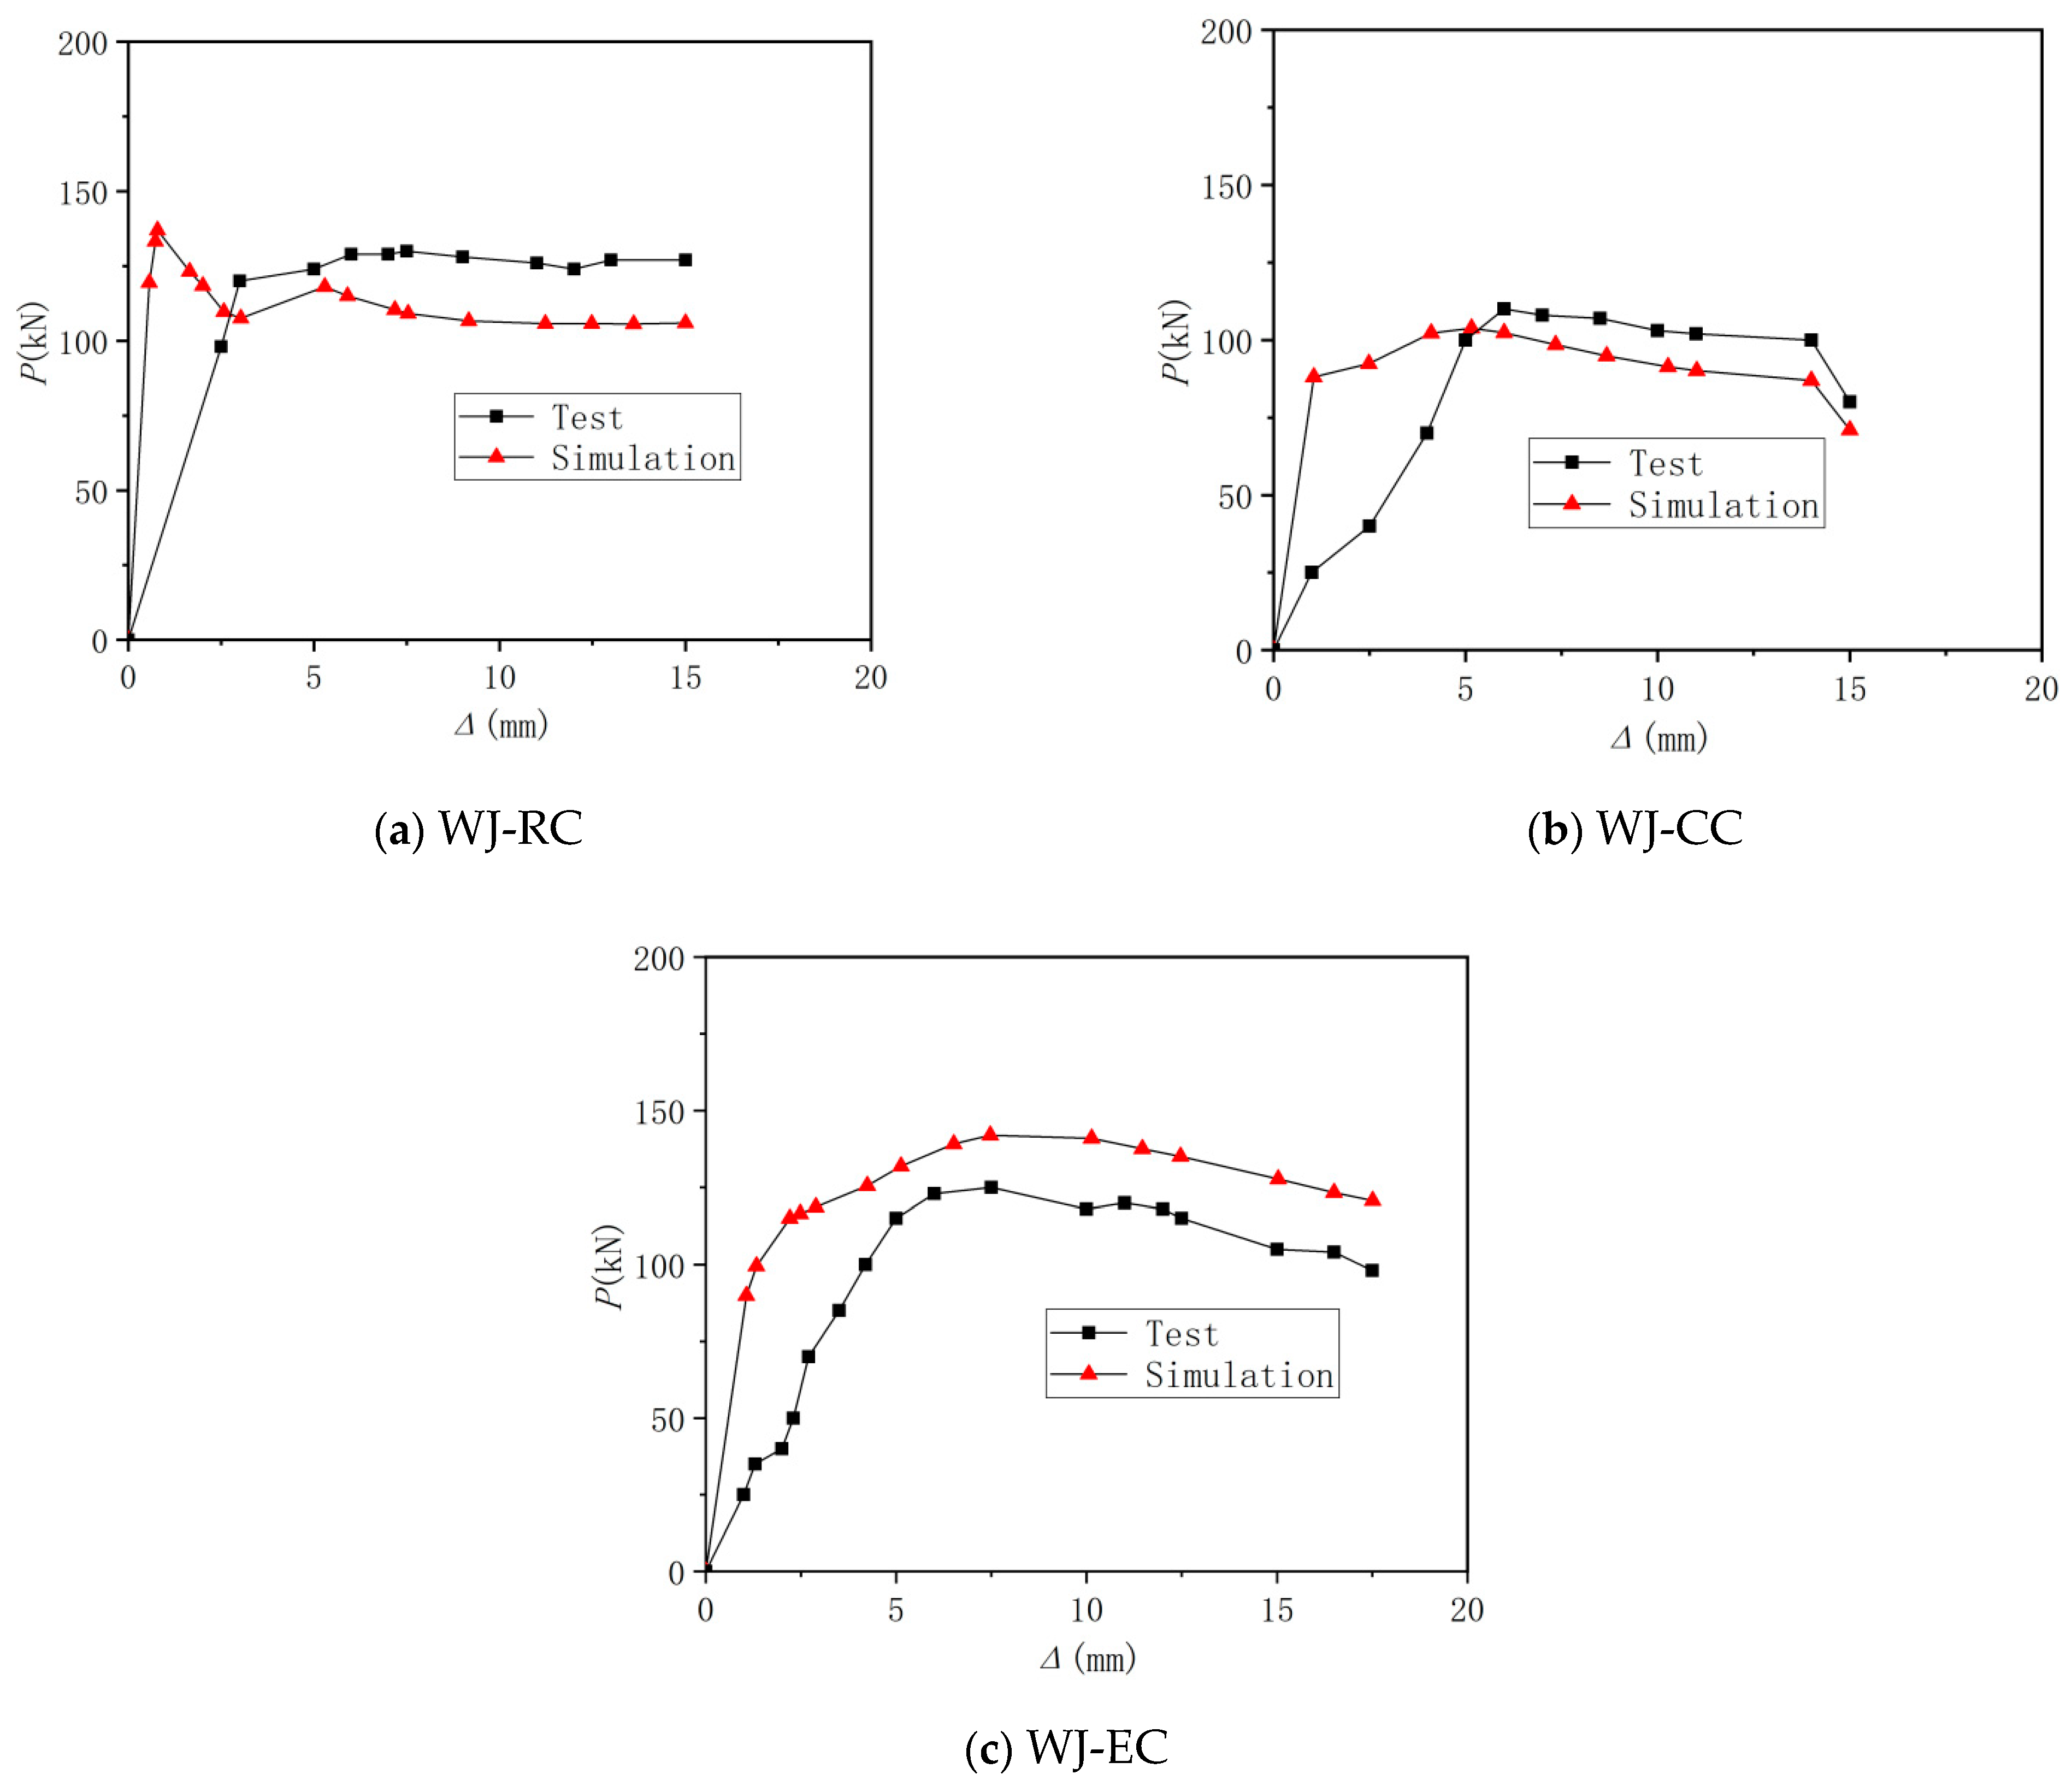
5.3. Model Verification
5.4. Influence of Parameter Variation on Seismic Performance of the Composite Beam
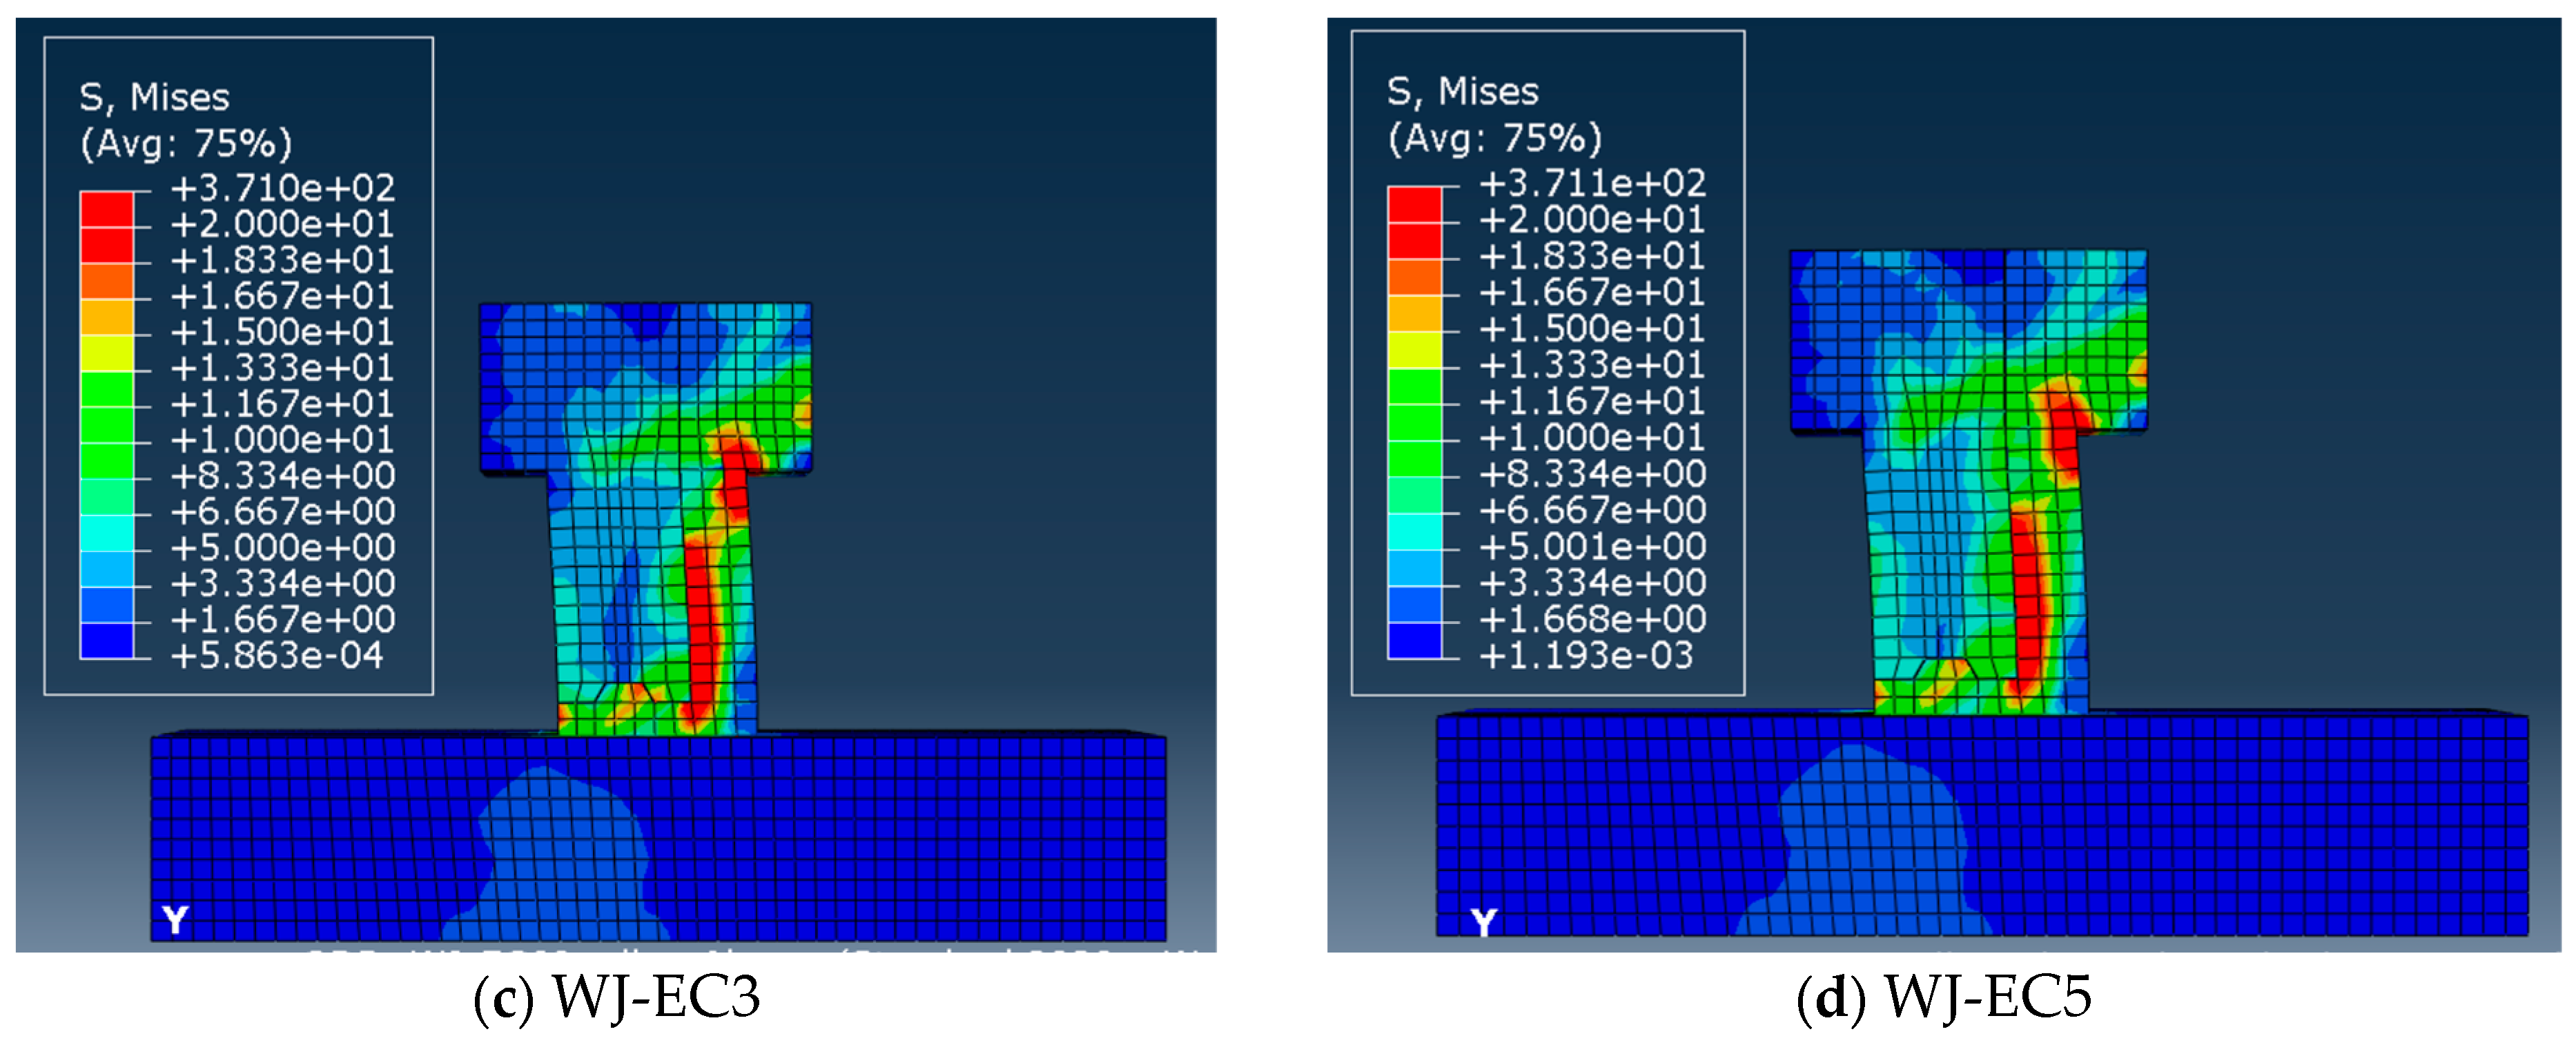
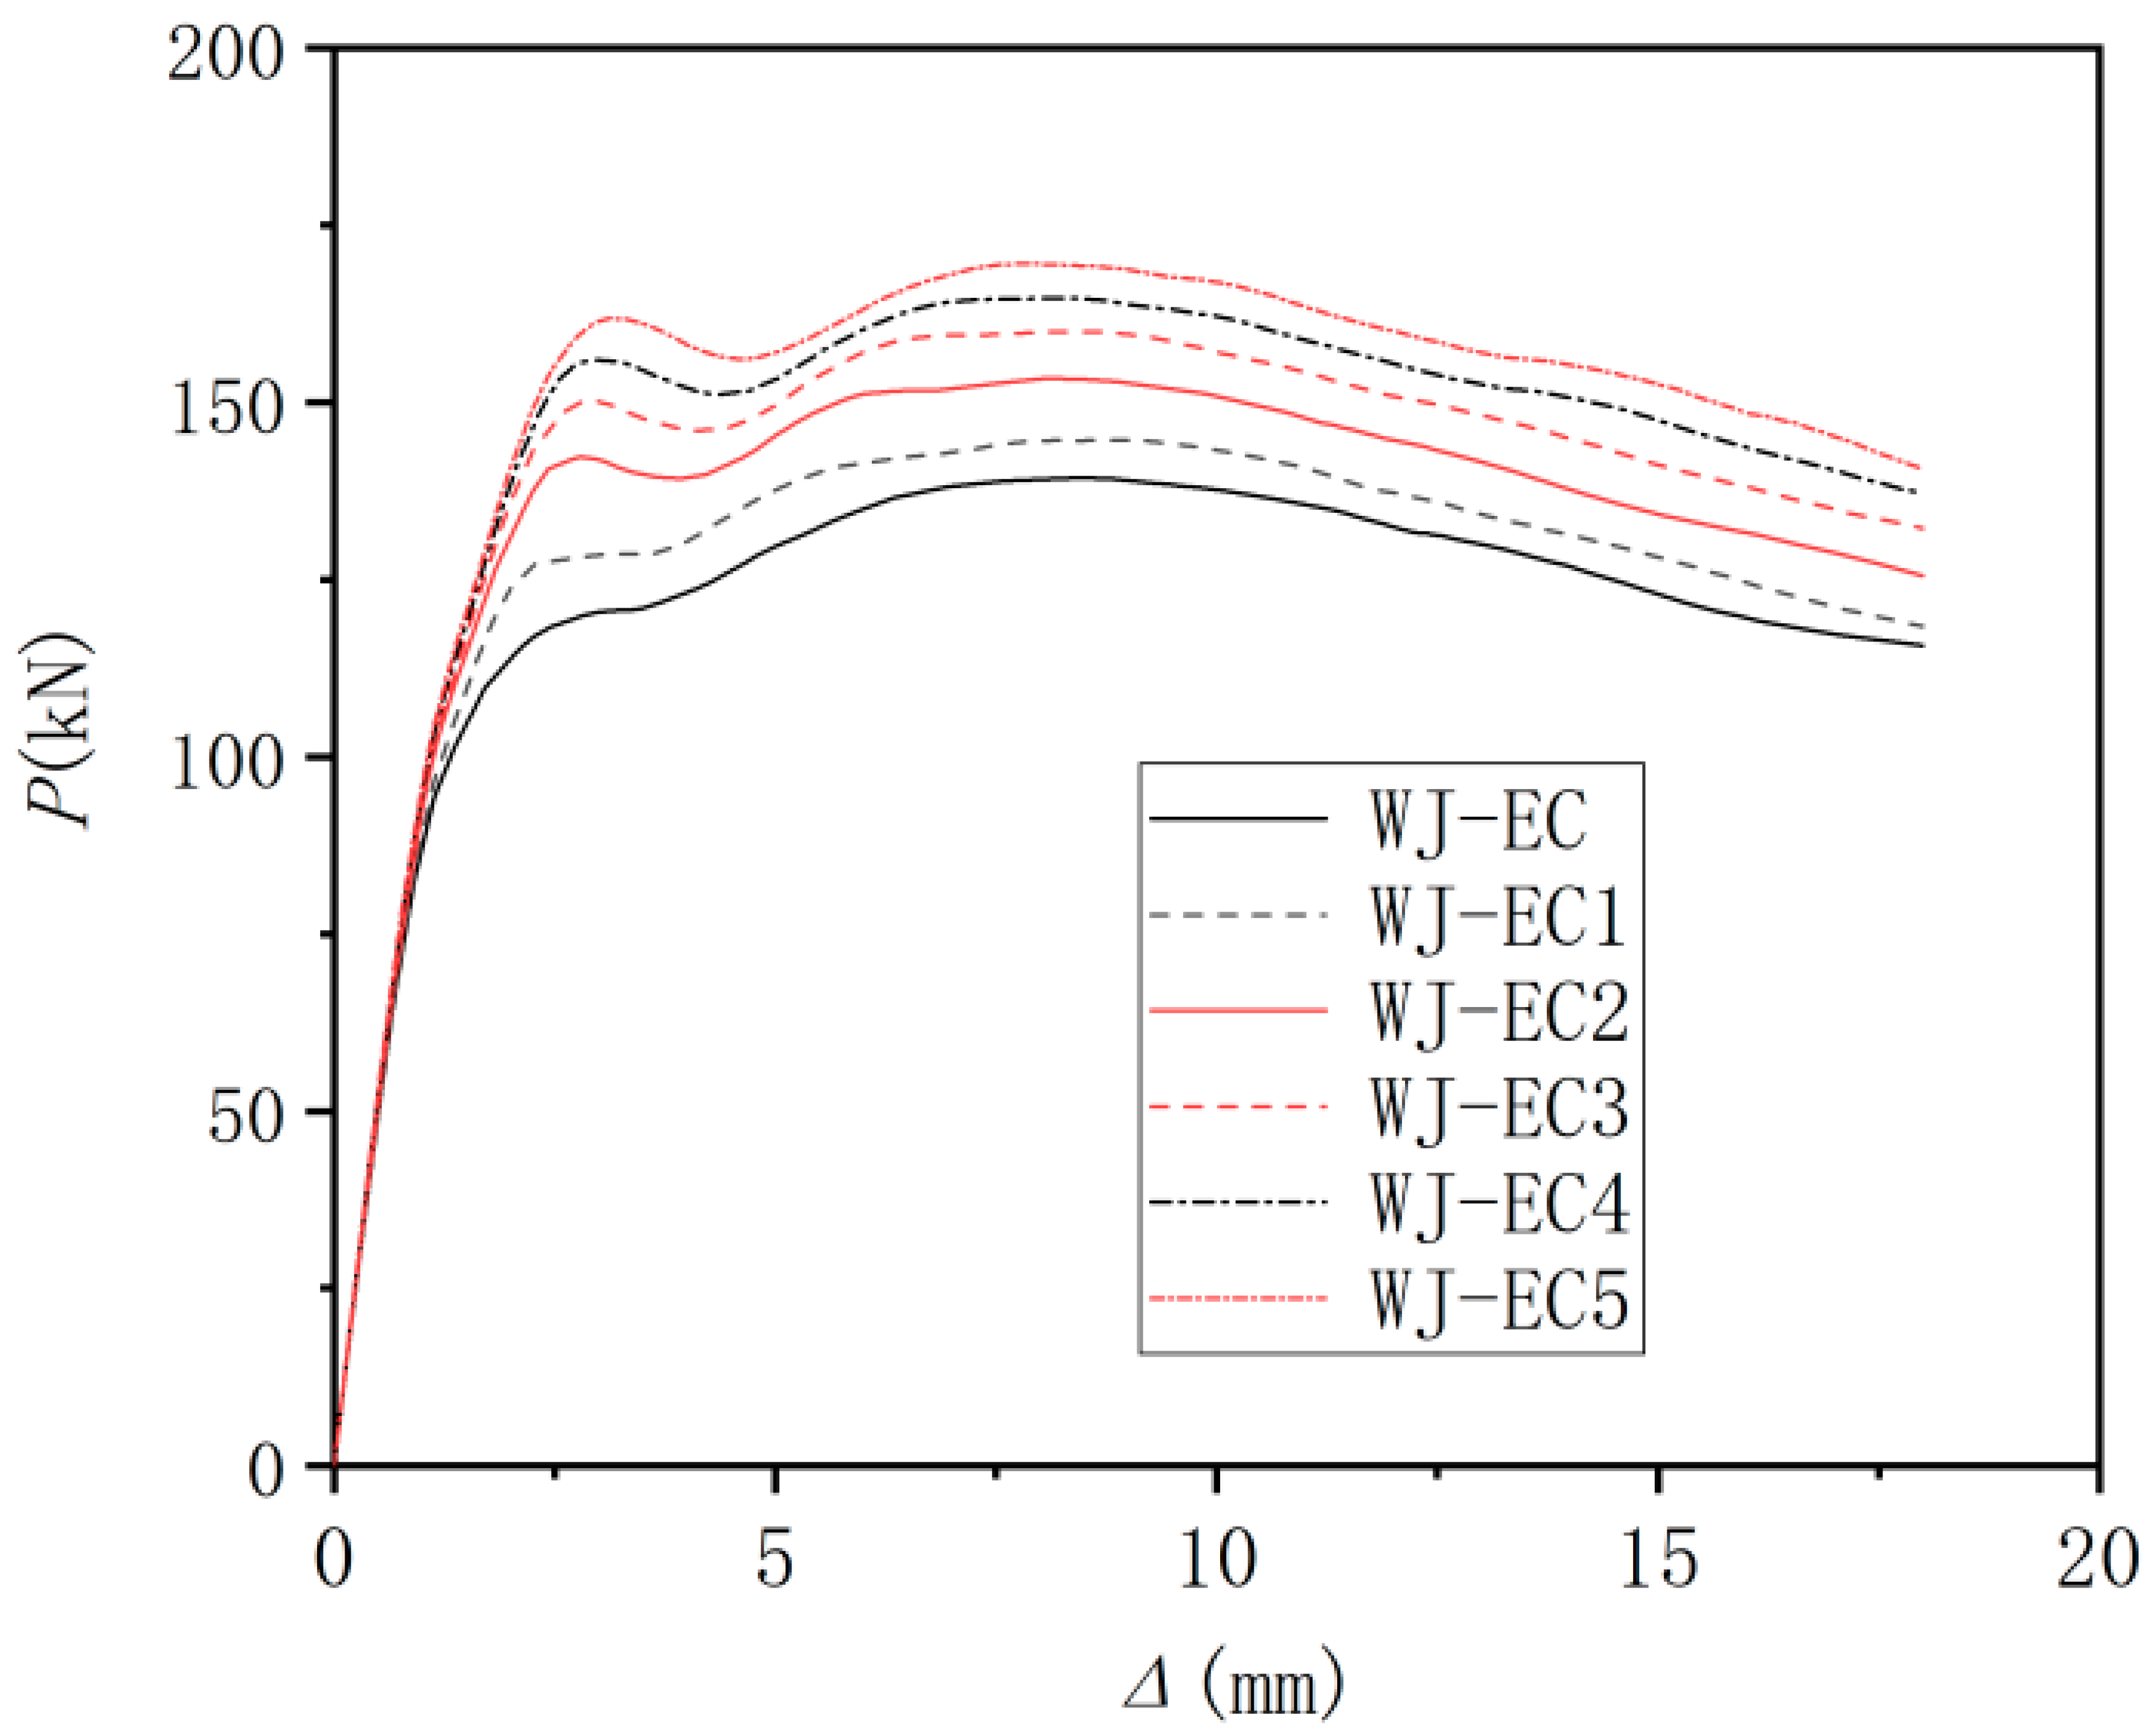
5.4.1. Influence of Precast Concrete Strength
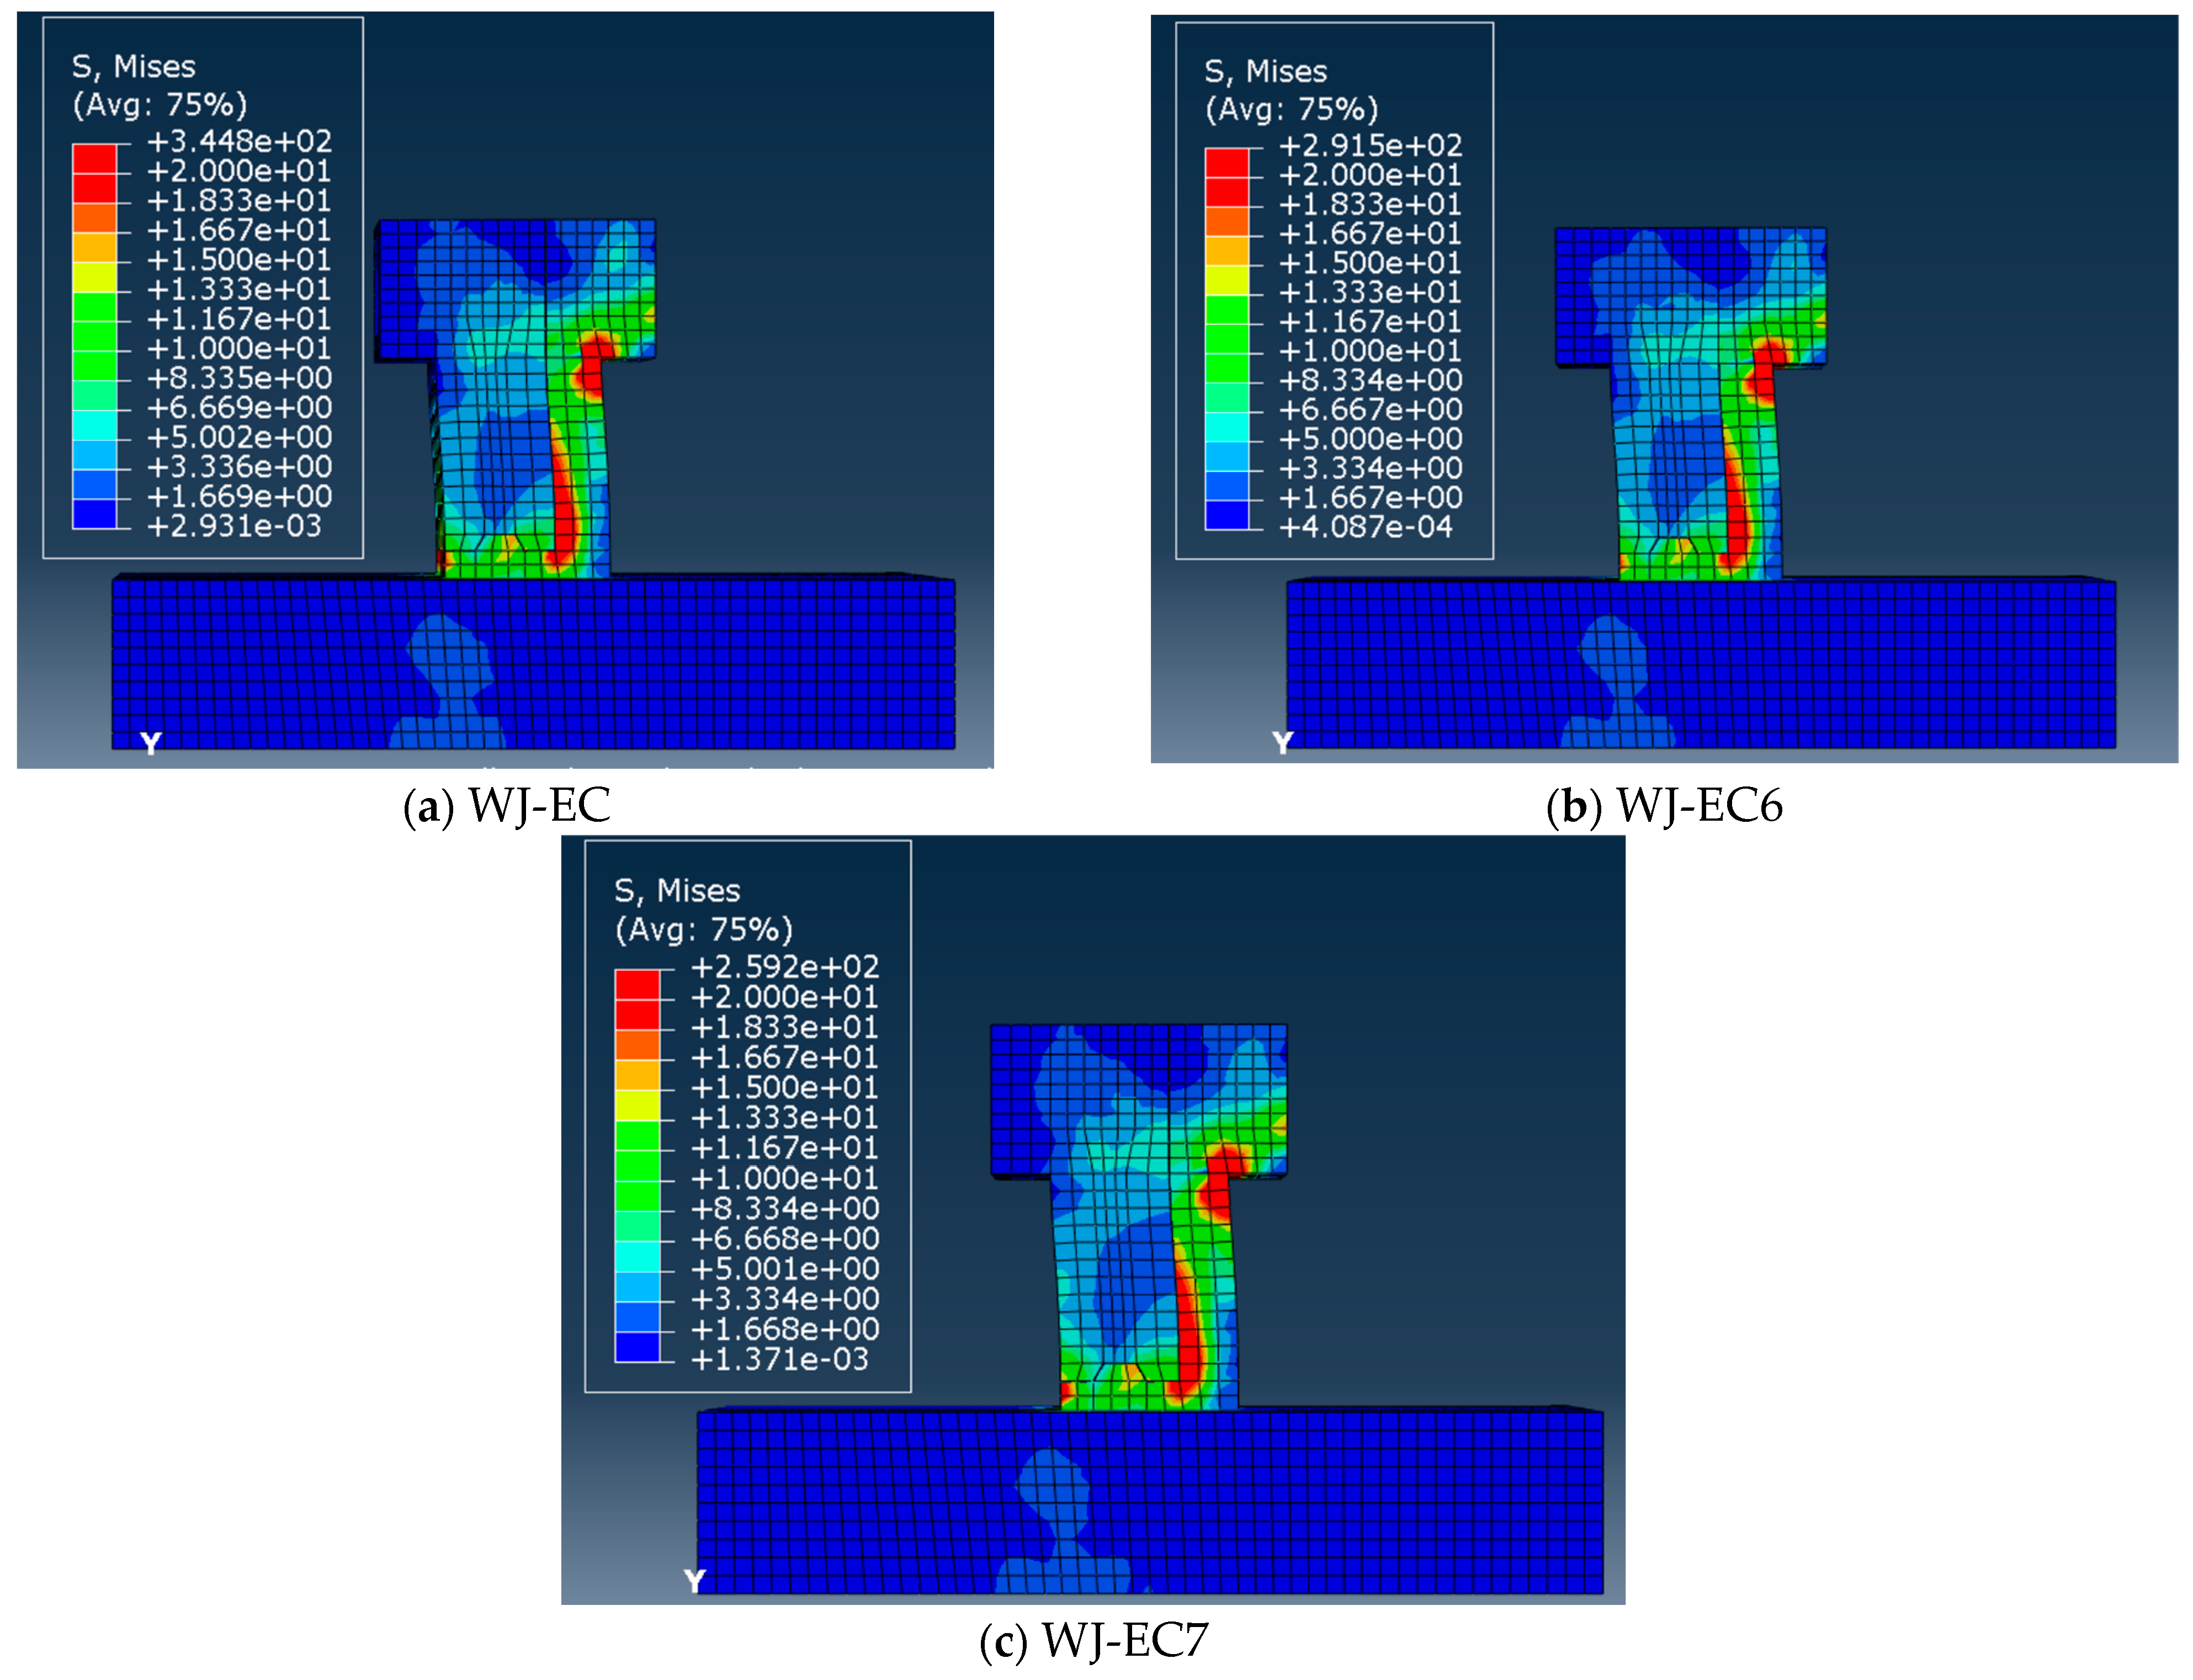
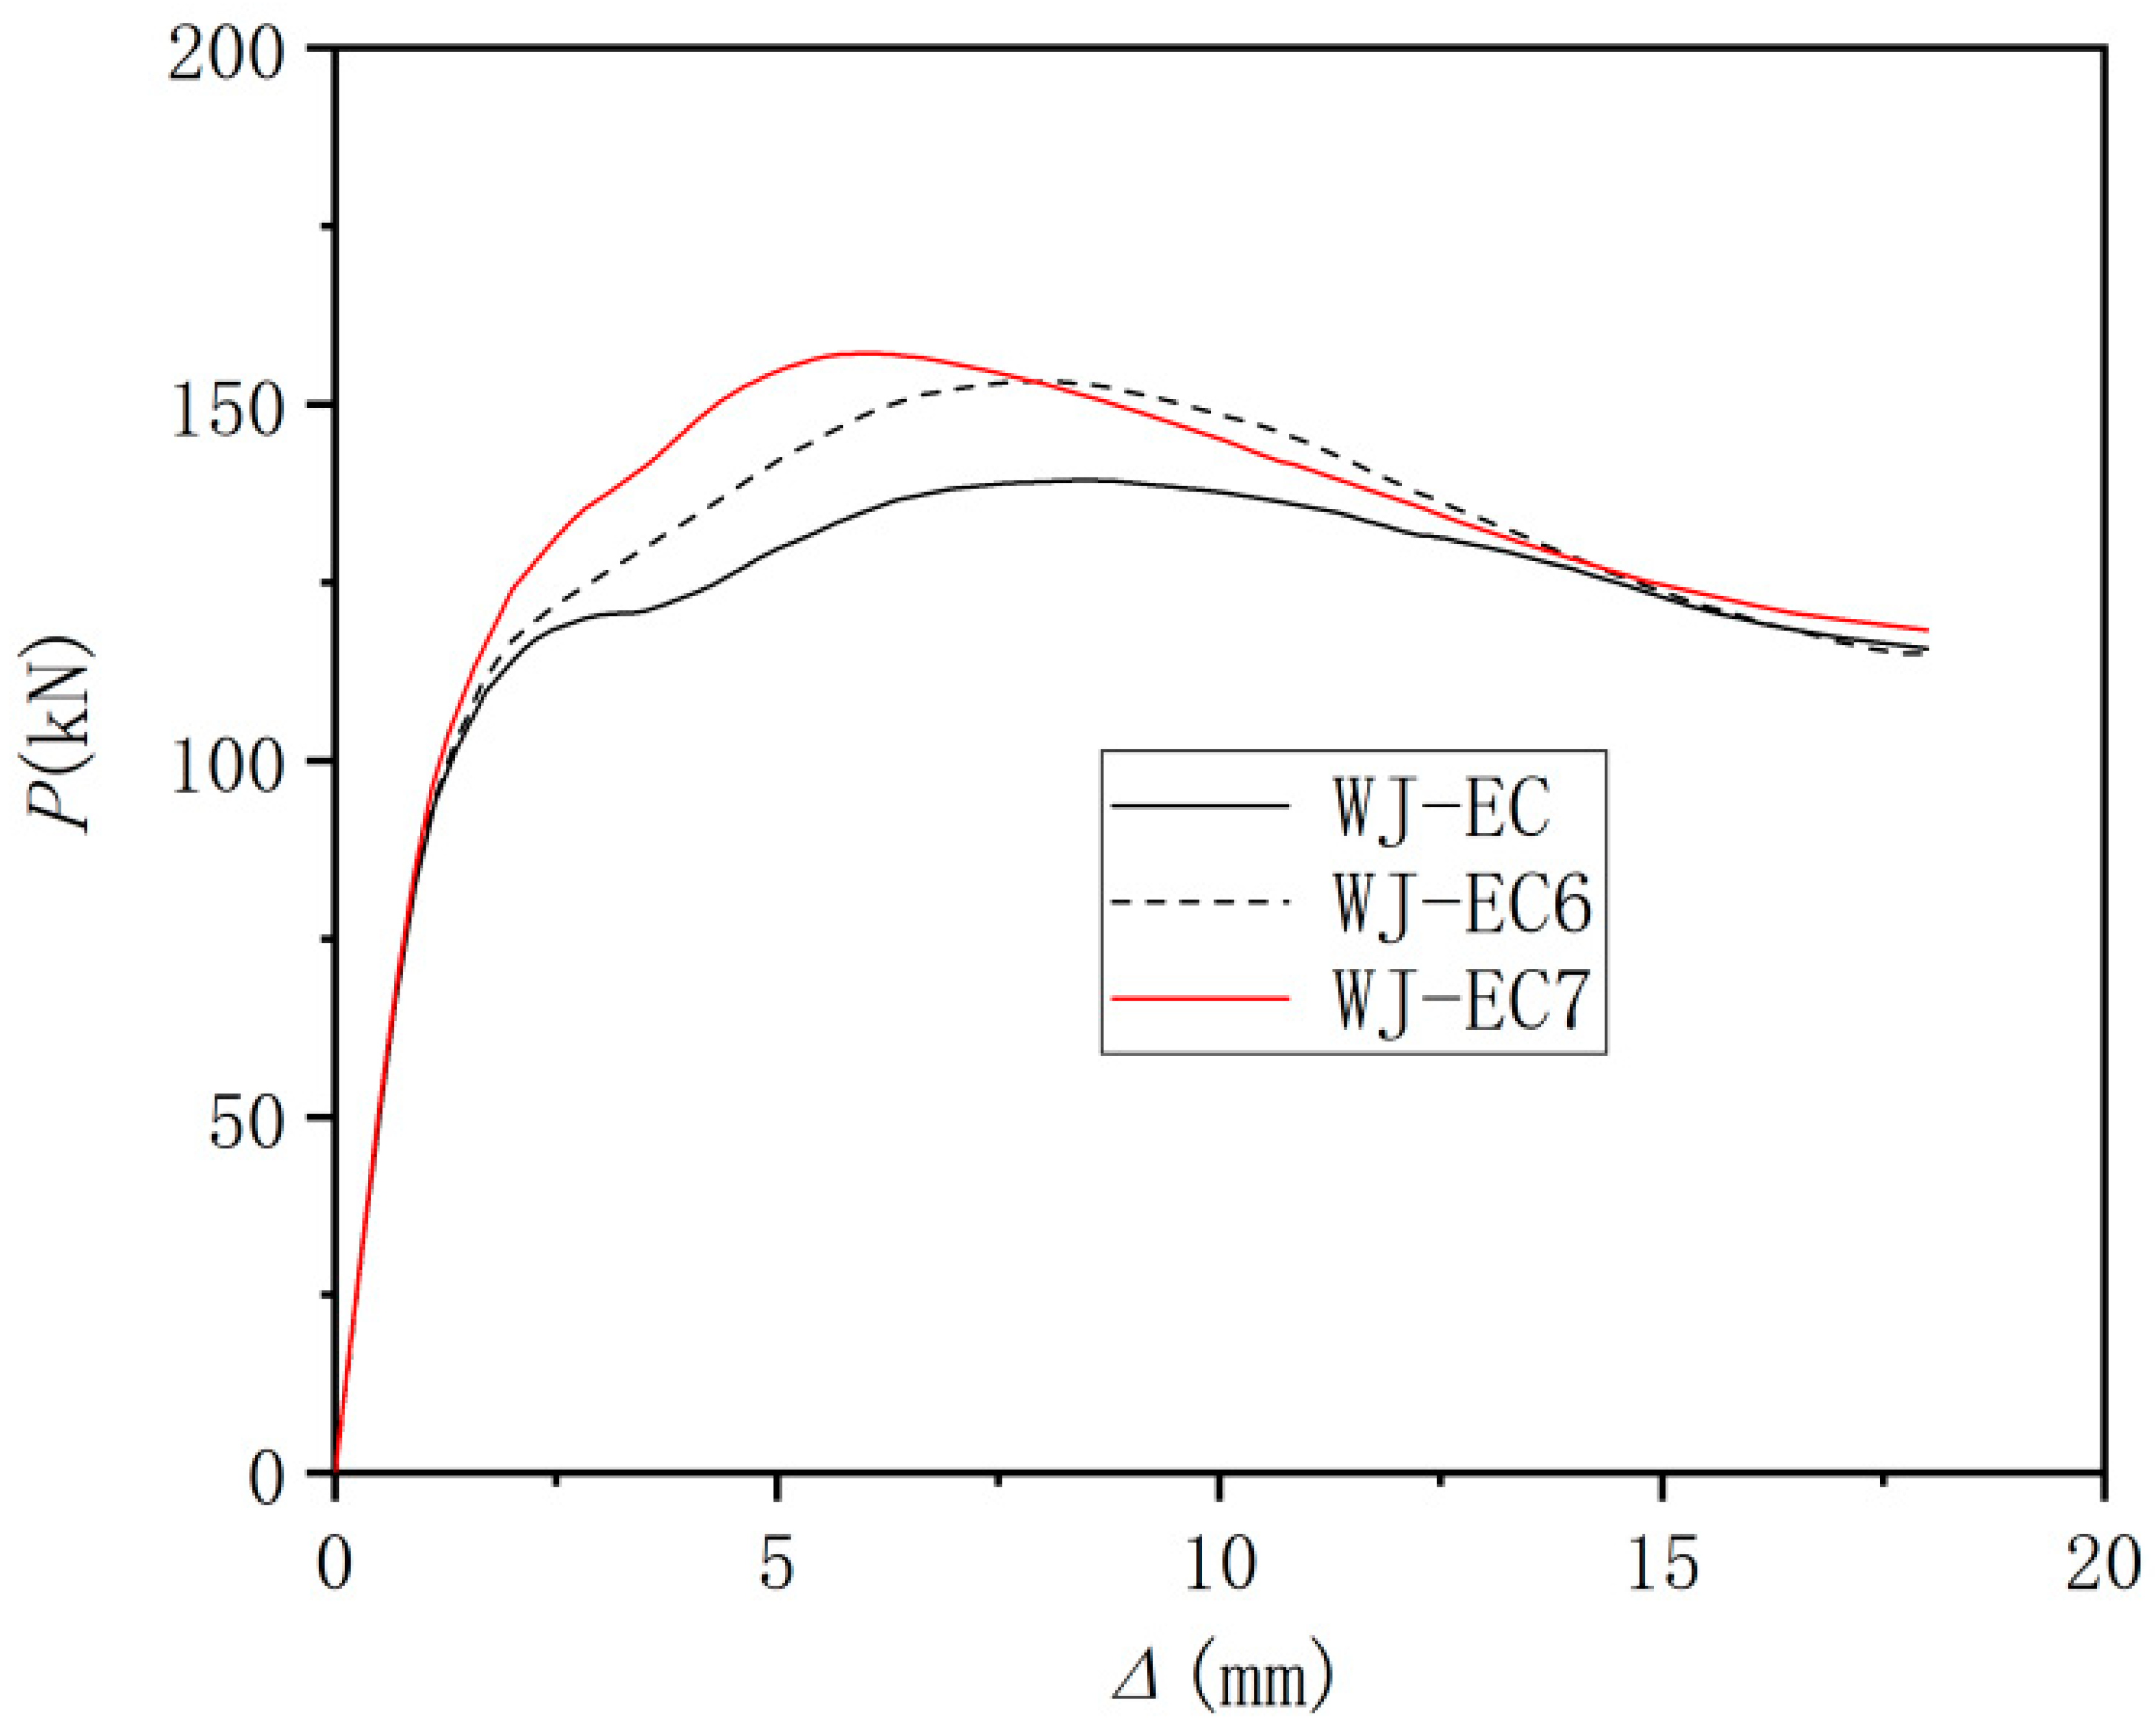
5.4.2. Effect of the Longitudinal Reinforcement Ratio of the Composite Beam
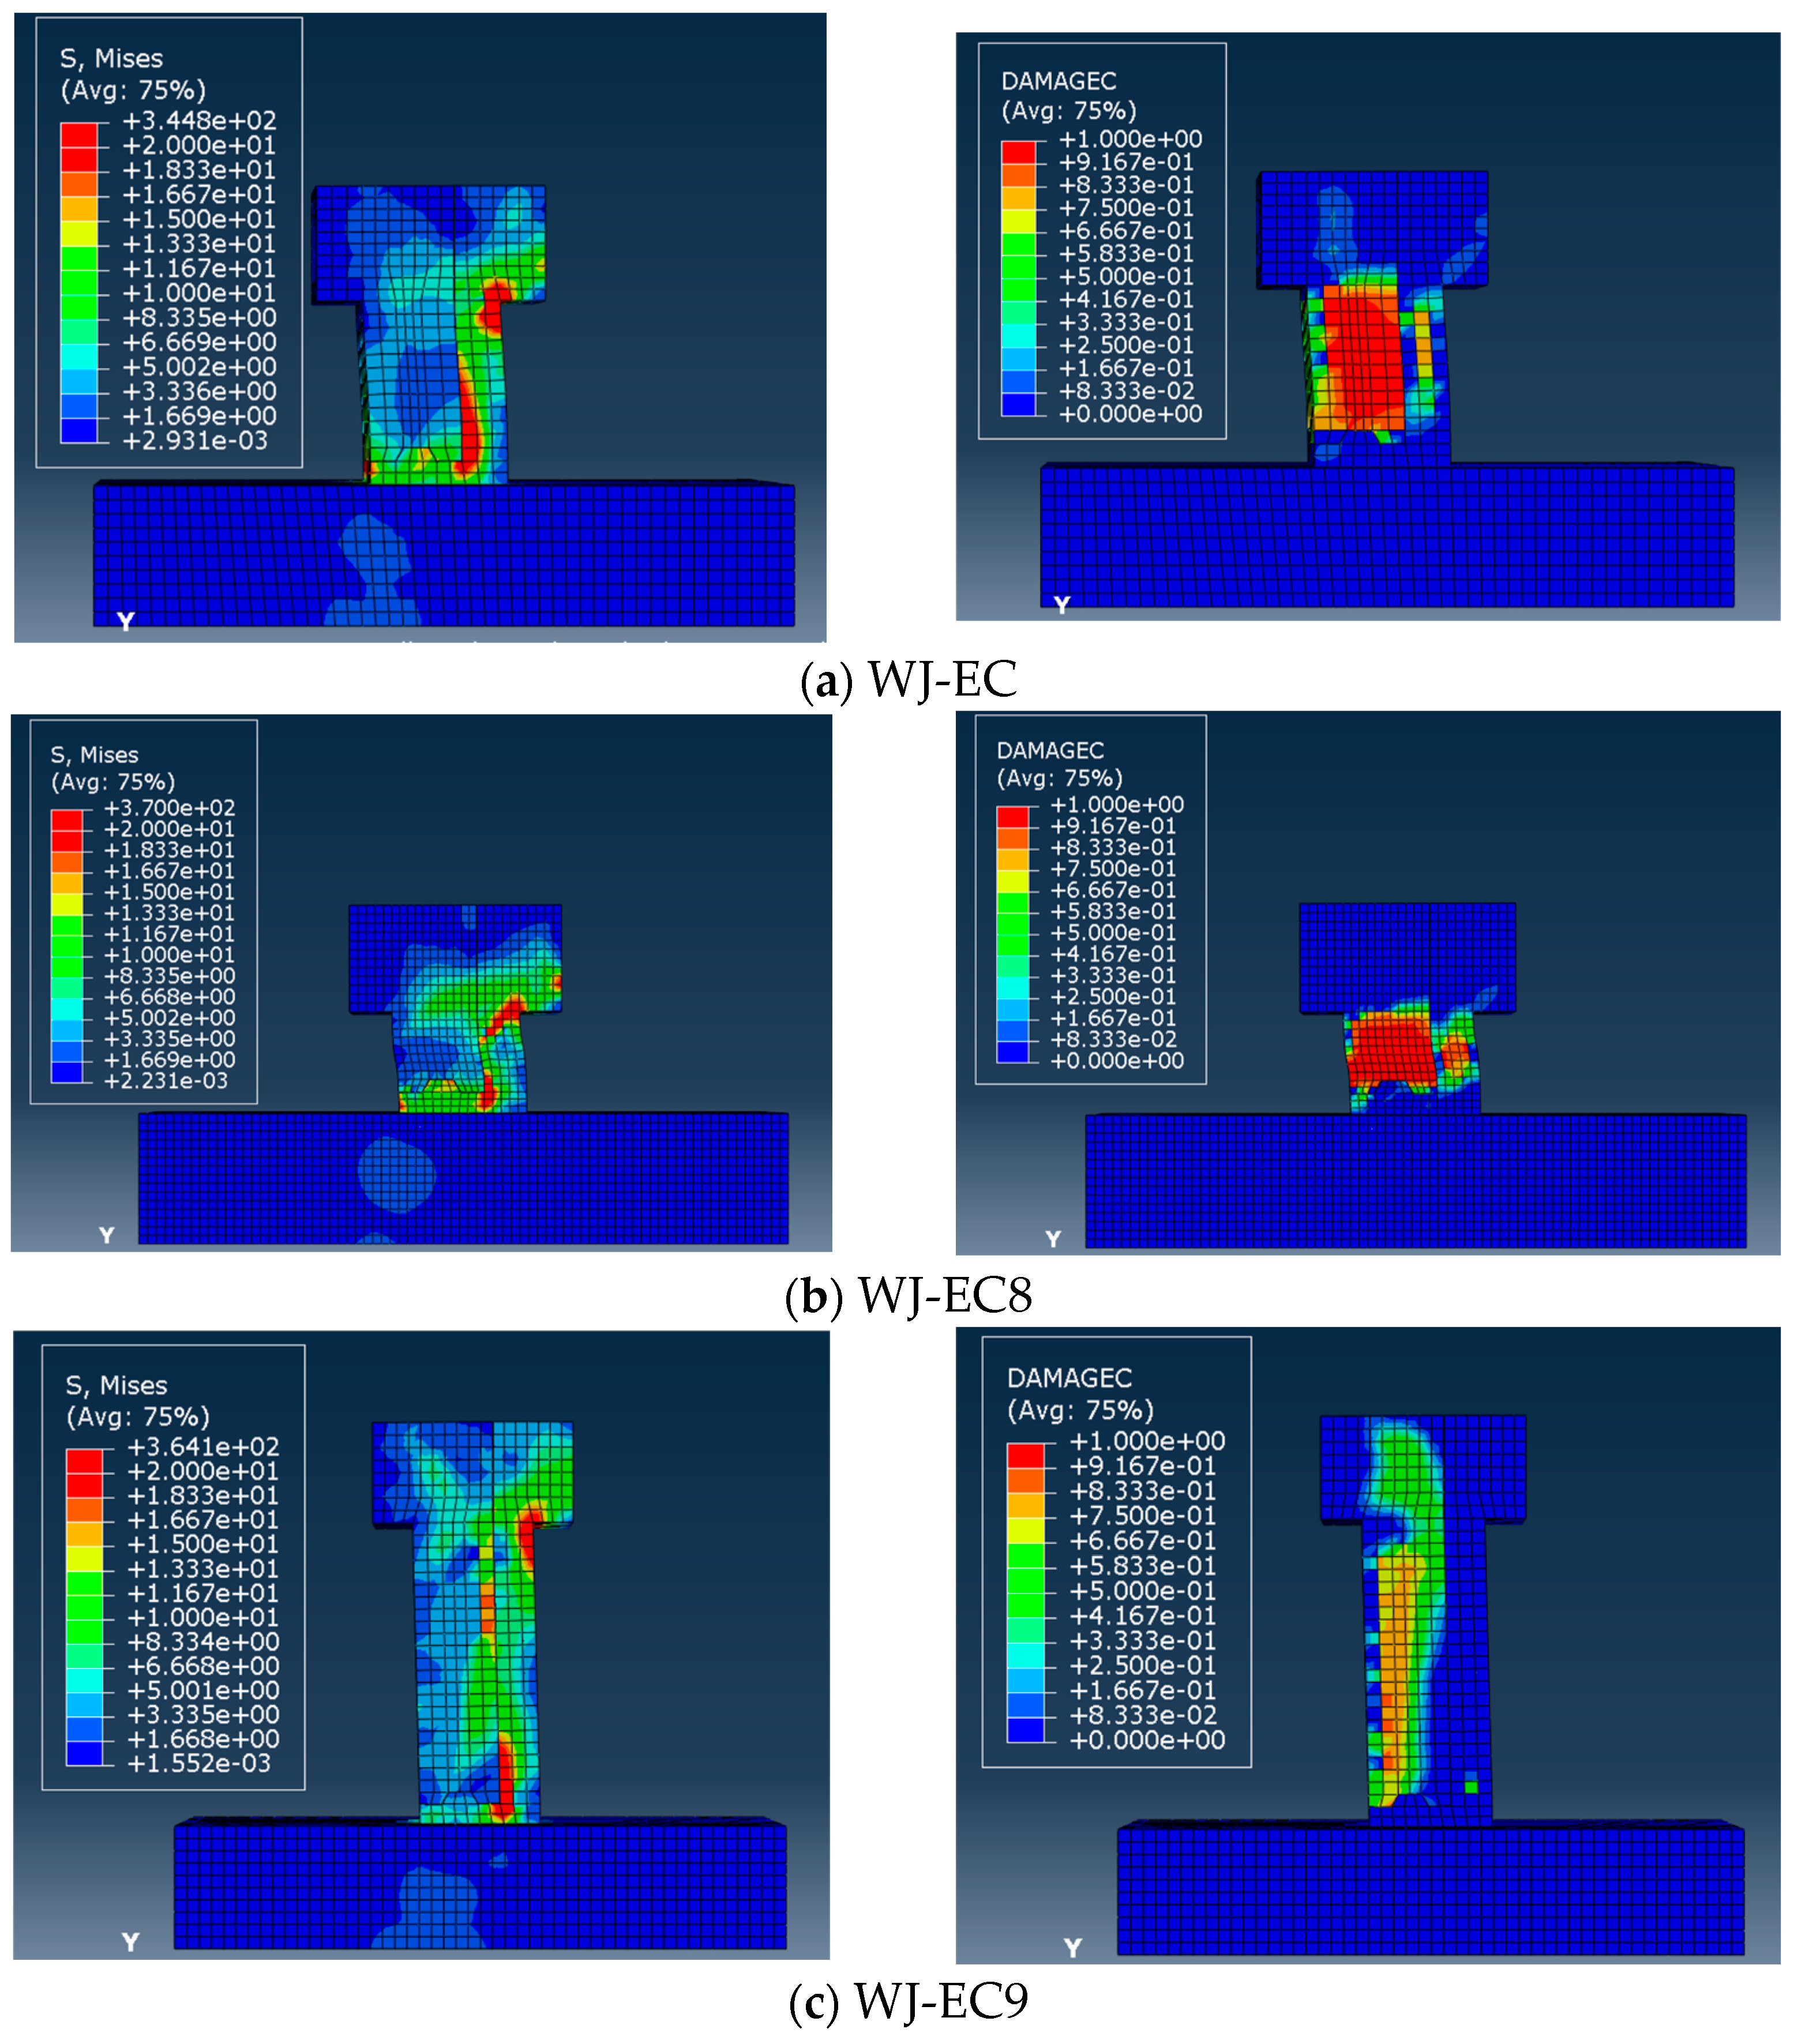
5.4.3. The Influence of Shear–Span Ratio
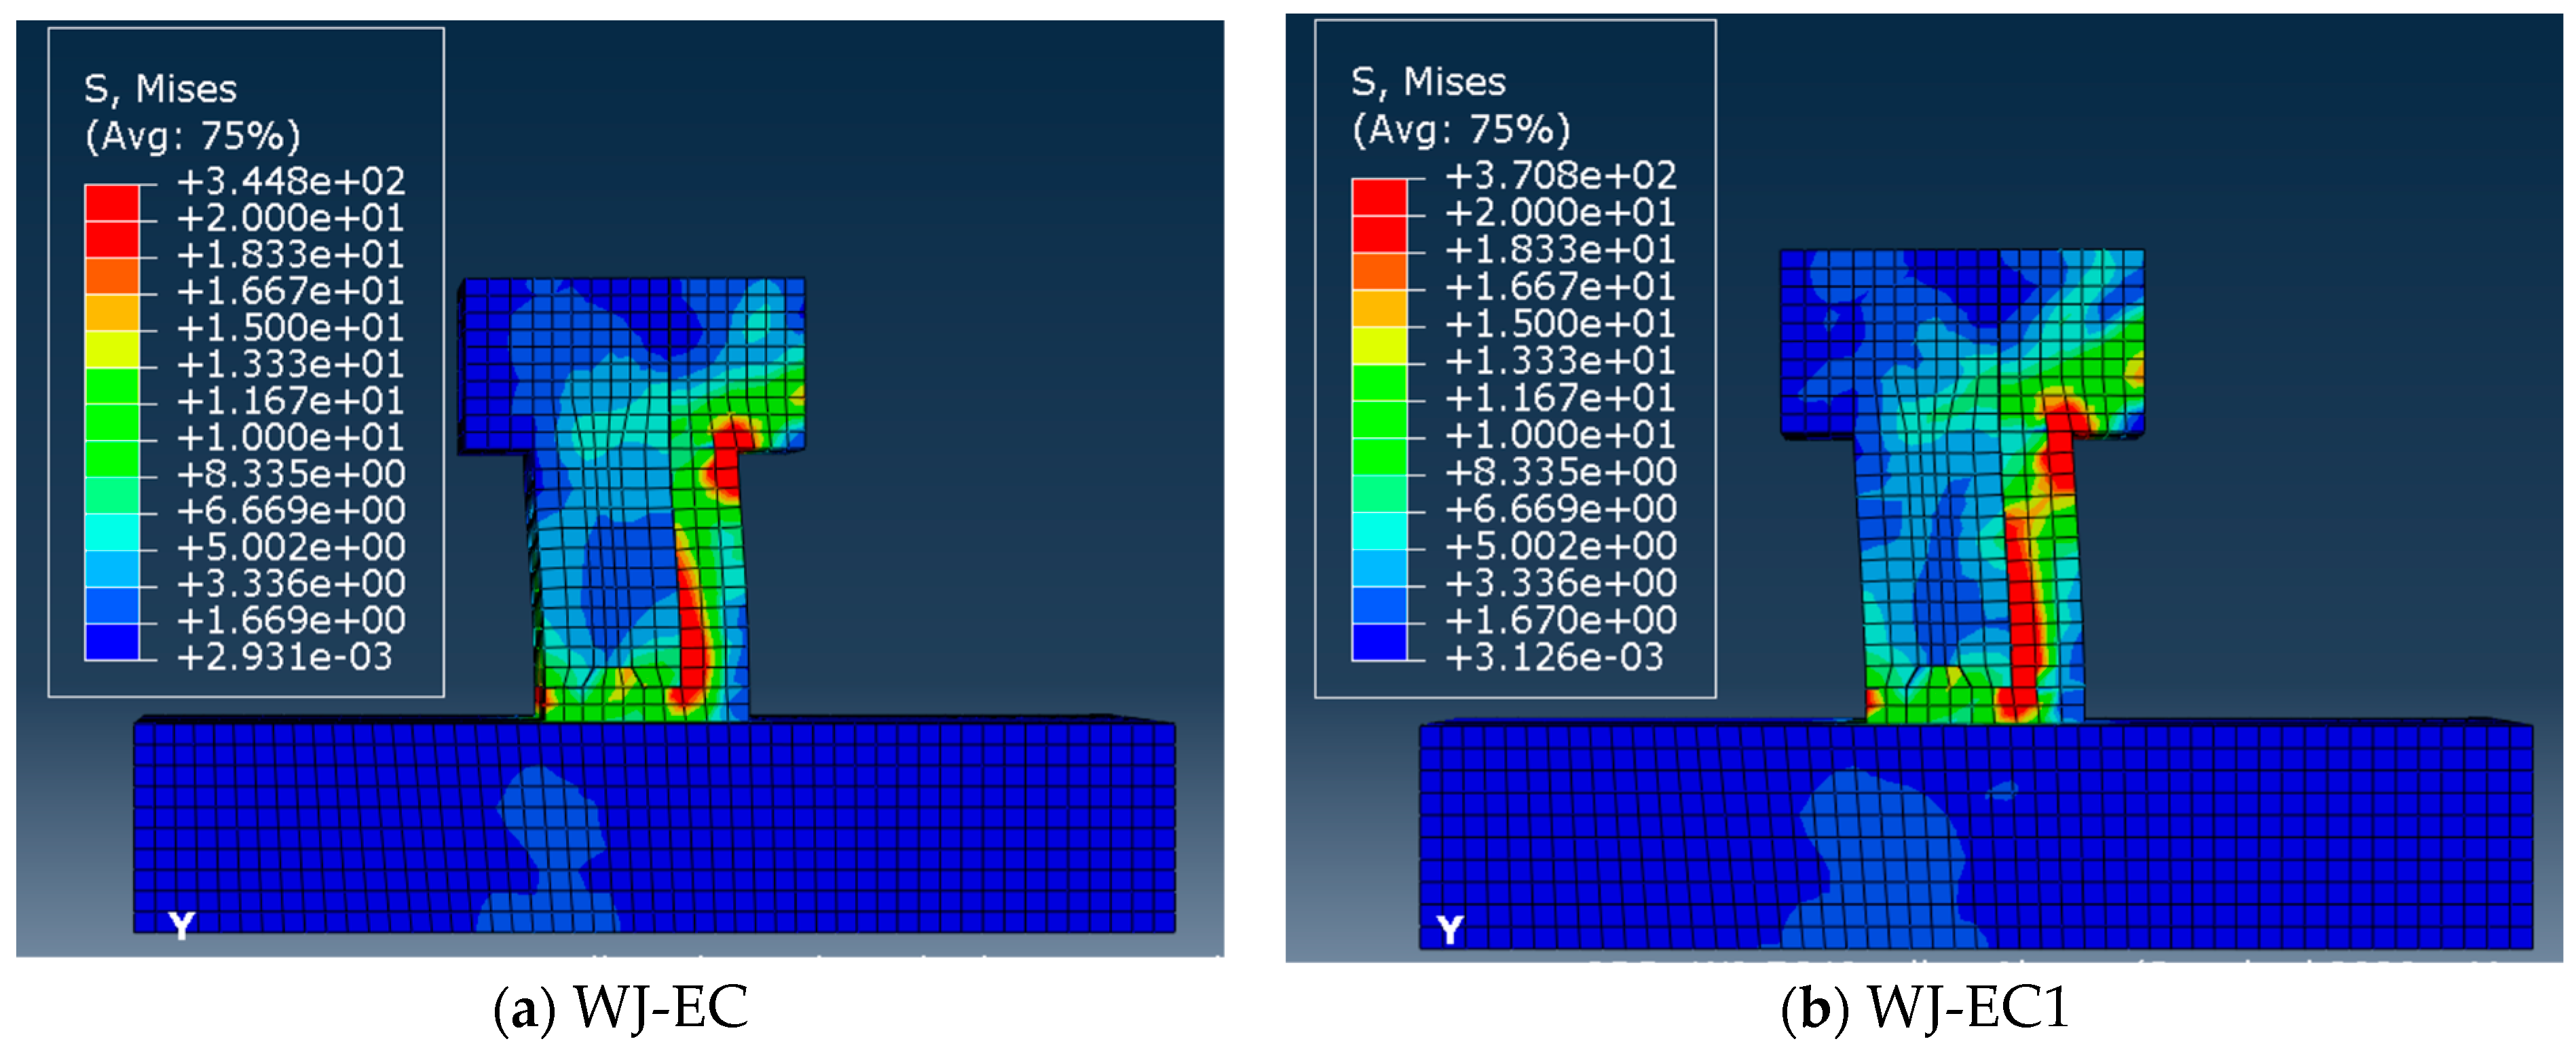
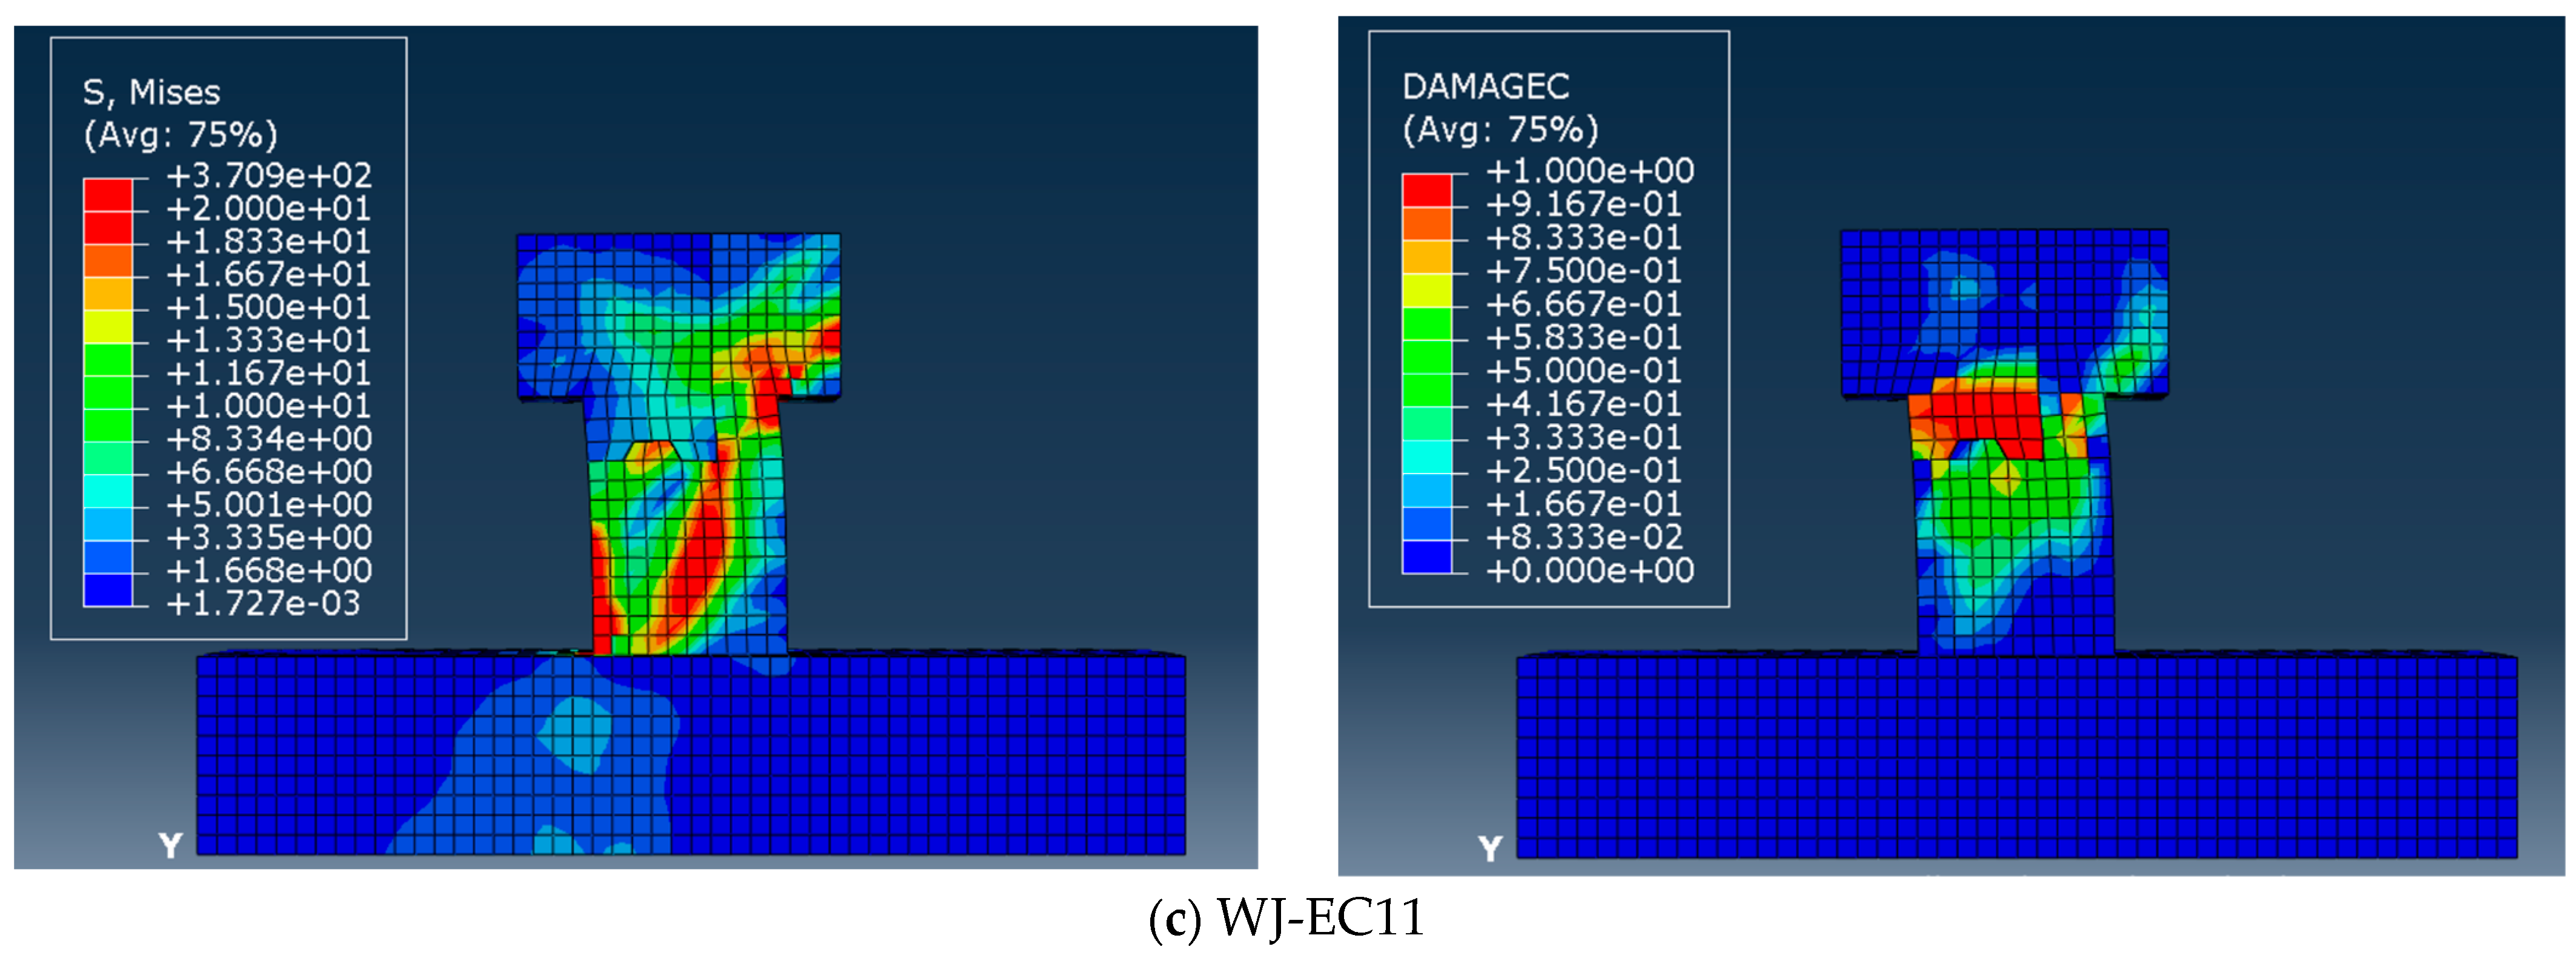
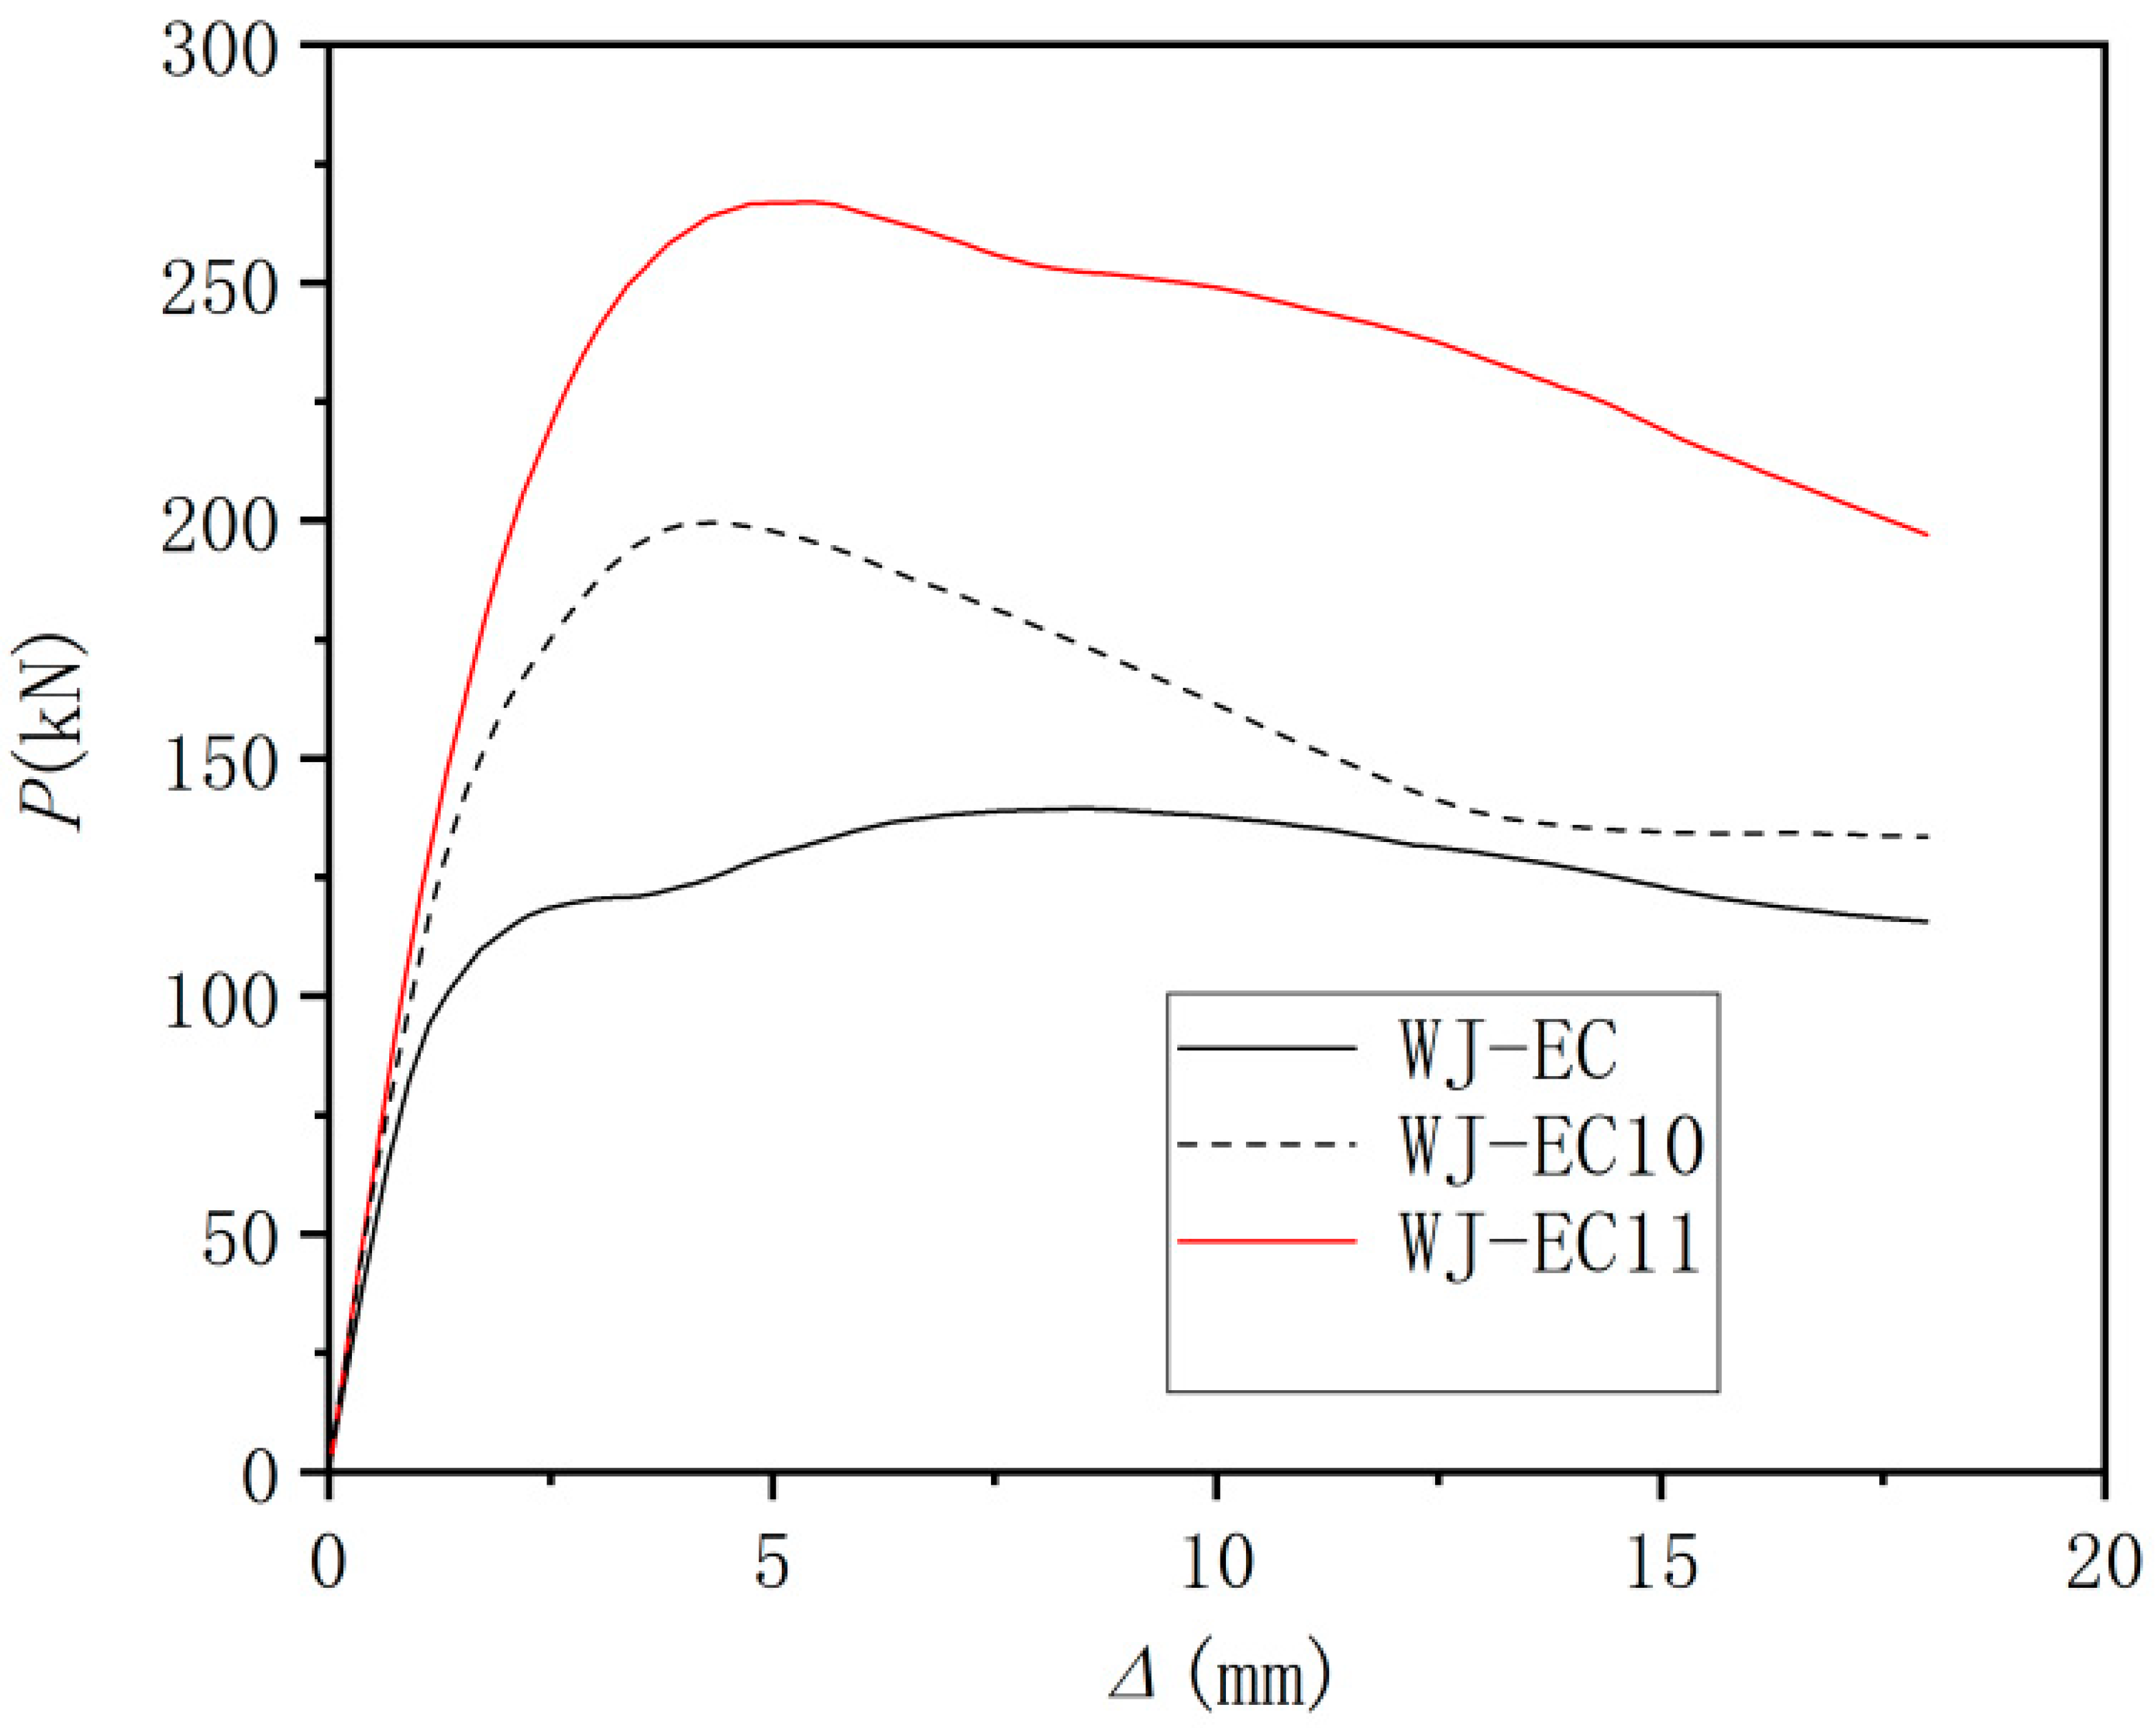
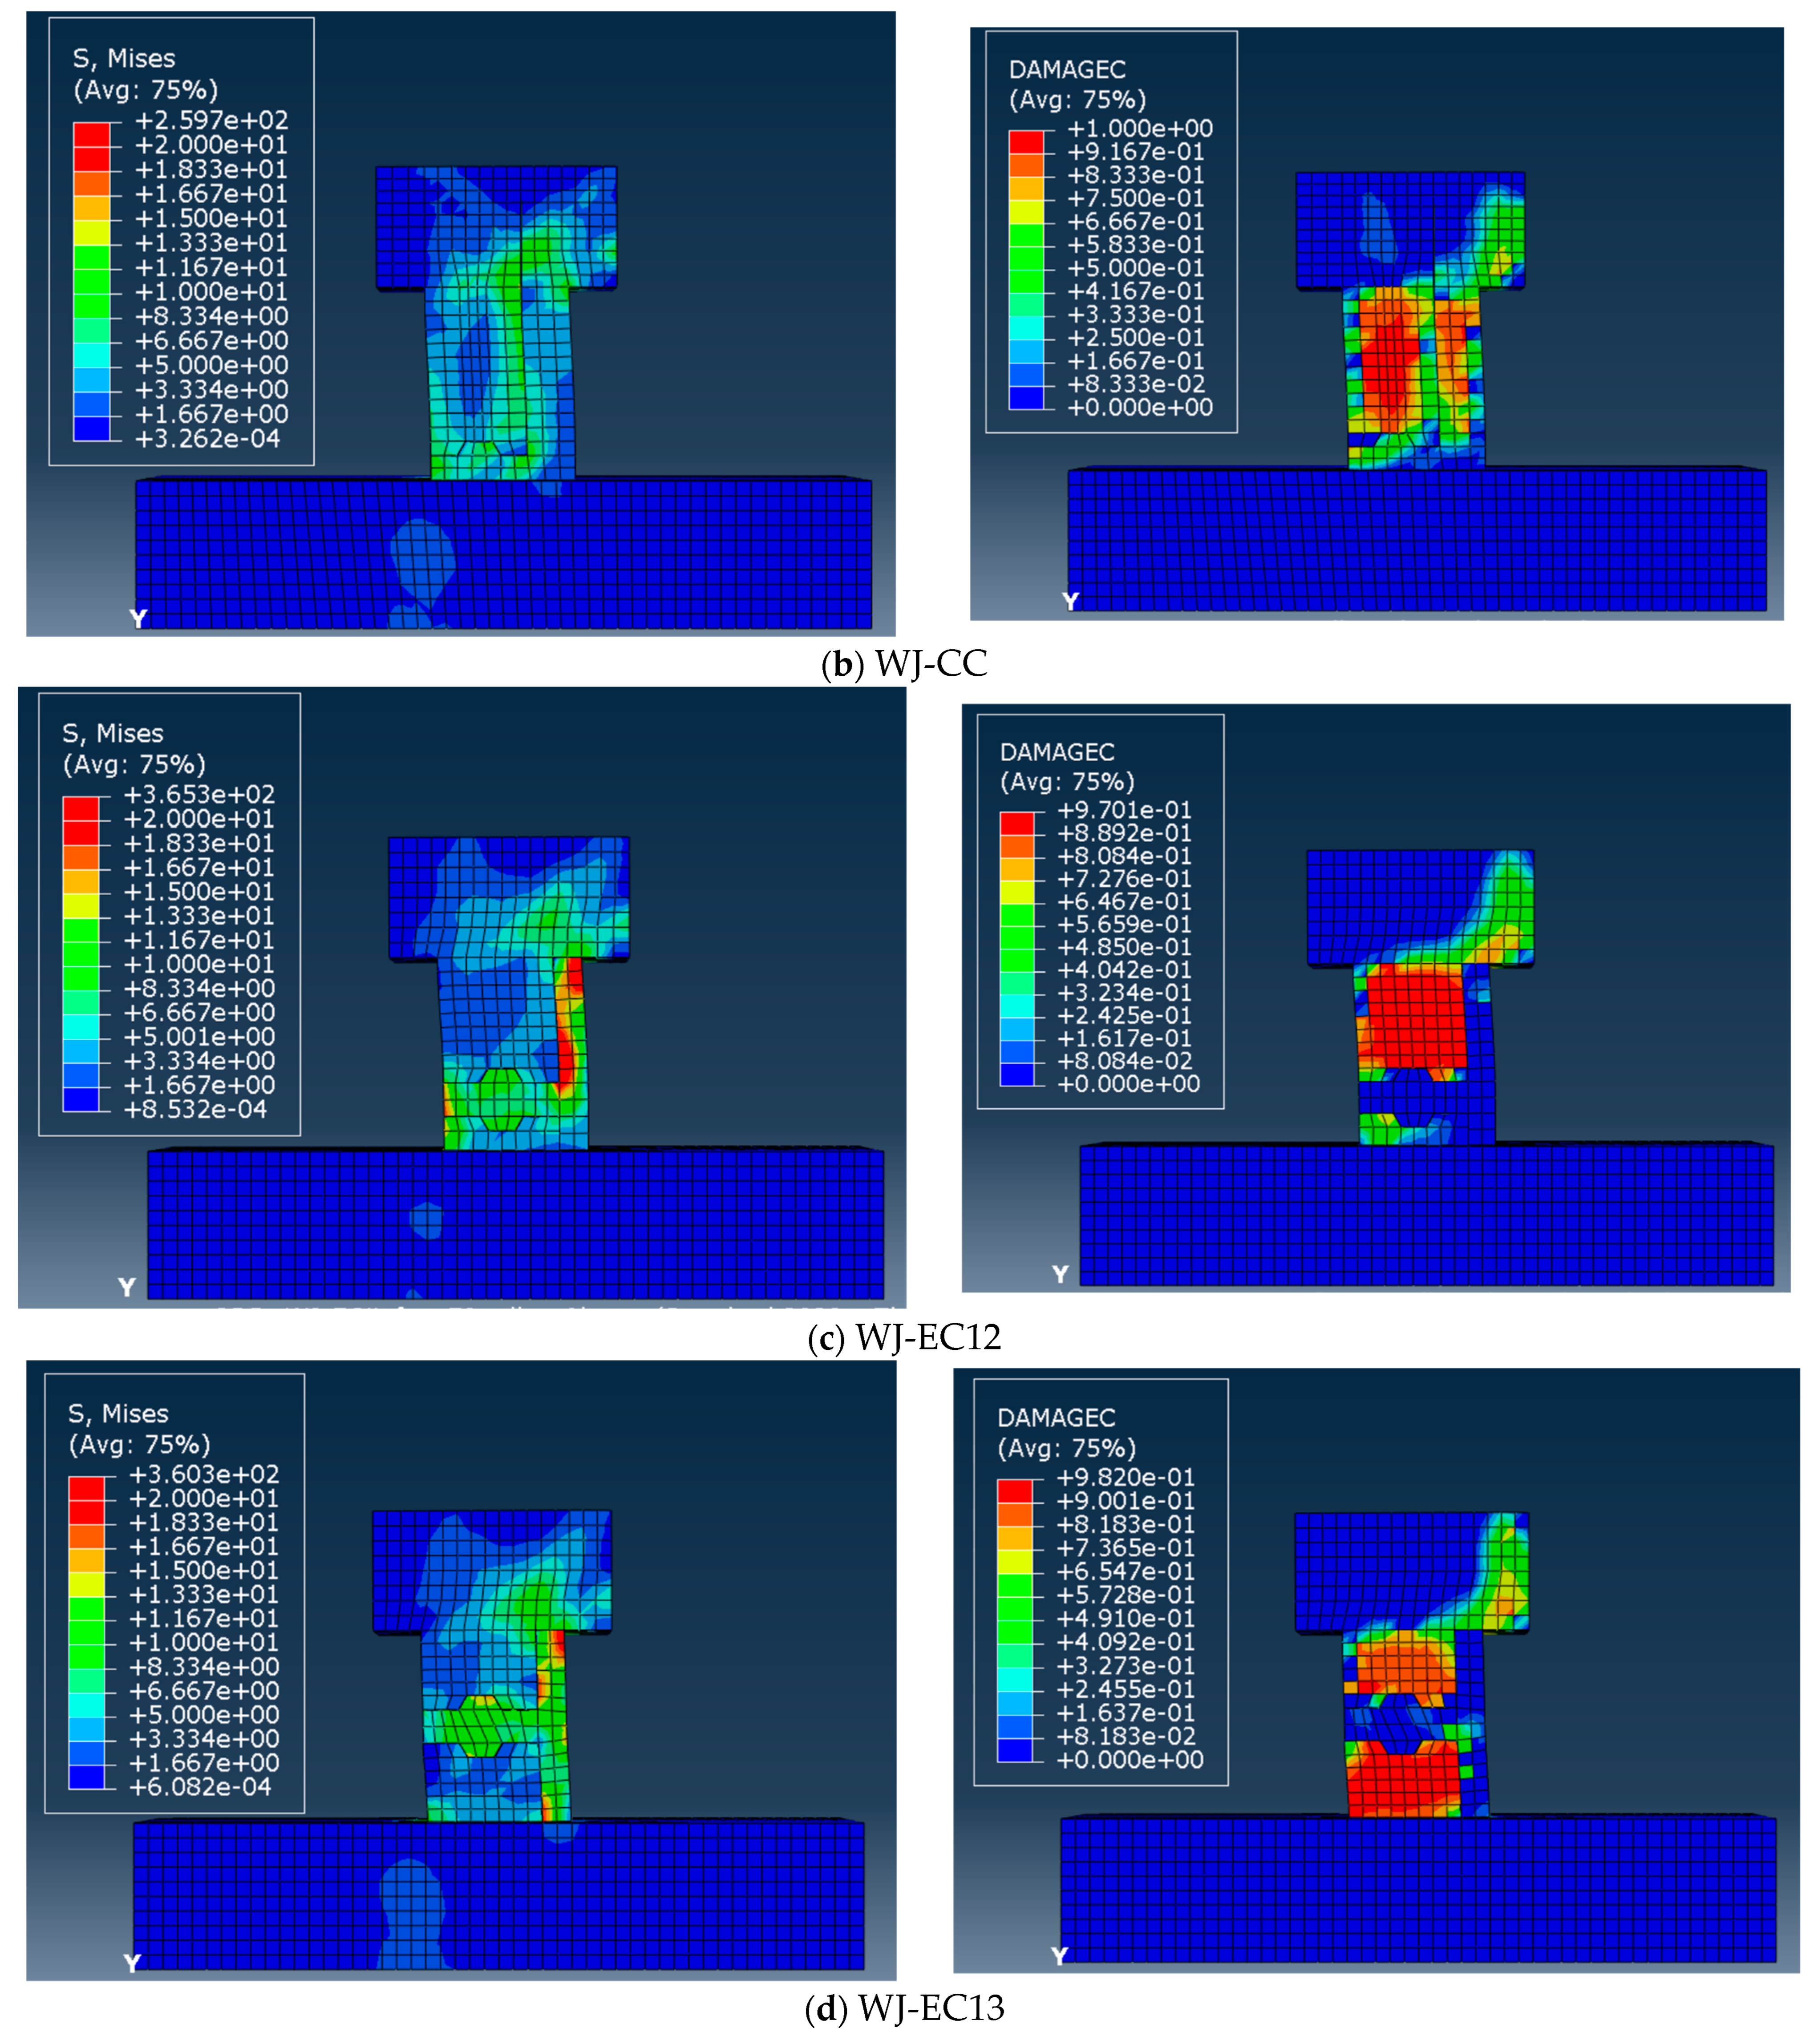
5.4.4. The Effect of the Epoxy Resin Concrete Post-Cast Area
- (1)
- Case 1: Expand the area of the post-cast node
- (2)
- Case 2: Reserve the precast node area
6. Conclusions and Prospects
6.1. Conclusions
- (1)
- The composite beam frame structure, specifically in the beam-column joint area featuring post-cast epoxy resin concrete, exhibits a structural behavior that is essentially identical to that of the cast-in situ reinforced concrete frame structure. Moreover, it demonstrates superior load-bearing capacity and deformation performance. Conversely, the composite beam frame structure with post-cast ordinary concrete in the joint area exhibits inadequate mechanical properties. Therefore, epoxy concrete, as a high-performance concrete, holds potential for applications in precast concrete structures.
- (2)
- In the case of the composite beam frame structure with post-poured epoxy resin concrete in the joint area, an increase in the strength of precast concrete leads to an enhancement in the beam end’s load-bearing capacity and ensures stable deformation performance. Notably, when the strength of post-cast epoxy concrete approaches or slightly surpasses that of precast concrete, the load-bearing capacity experiences the most significant improvement. In addition, an increase in the longitudinal reinforcement ratio results in an increase in the beam end’s load-bearing capacity, albeit with a slight decrease in deformation performance. Conversely, as the shear span ratio decreases, the beam end’s load-bearing capacity increases, but the deformation performance deteriorates significantly. Therefore, it is necessary to avoid excessively small shear–span ratios for composite beams, such as those lower than 1.5. Additionally, the expansion of the post-cast area allows for the full utilization of epoxy resin concrete’s superior mechanical properties, leading to a significant increase in the beam end’s load-bearing capacity and initial stiffness, albeit with a slight decrease in deformation capacity.
- (3)
- The composite beam frame structure, which preserves the integrity of the precast joint area and is infused with epoxy resin concrete, exhibits an enhanced load-bearing capacity at the beam end due to the expansion of the prefabricated joint area. However, this capacity remains inferior to that of the cast-in situ reinforced concrete frame structure. Therefore, the aforementioned composite beam frame structure, as discussed in Conclusion (2), demonstrates superior mechanical properties. Nevertheless, it necessitates a substantial quantity of epoxy resin concrete, resulting in high costs.
- (4)
- In contrast, the composite beam frame structure, which maintains the integrity of the precast joint area and is filled with ordinary concrete, exhibits enhanced load-bearing capacity and deformation performance at the beam end compared to the composite beam frame structure filled with ordinary concrete in the joint area. As the precast joint area expands, the load-bearing capacity at the beam end increases and gradually approaches that of the cast-in situ reinforced concrete frame structure. This observation highlights the advantages of the precast construction scheme that preserves the integrity of the precast joint area.
6.2. Prospects
Author Contributions
Funding
Data Availability Statement
Conflicts of Interest
References
- Sha, M.; Liu, P.; Gao, J.; Ma, H. Research status and application of prefabricated concrete frame joints. E3S Web Conf. 2021, 260, 03025. [Google Scholar] [CrossRef]
- Lin, K.; Lu, X.; Li, Y.; Guan, H. Experimental study of a novel multi-hazard resistant prefabricated concrete frame structure. Soil Dynam. Earthq. Eng. 2019, 119, 390–470. [Google Scholar] [CrossRef]
- Wang, C.; Liu, Y.; Zheng, X.; Wu, J. Experimental investigation of a precast concrete connection with all-steel bamboo-shaped energy dissipaters. Eng. Struct. 2019, 178, 298–308. [Google Scholar] [CrossRef]
- Ghayeb, H.H.; Abdul Razak, H.; Ramli Sulong, N.H. Seismic performance of innovative hybrid precast reinforced concrete beam-to-column connections. Eng. Struct. 2020, 202, 109886. [Google Scholar] [CrossRef]
- Ding, T.; Xiao, J.; Khan, A.-u.-R. Behavior of concrete beam-column frame joints with DfD connections: A simulation study with interface modelling. Eng. Struct. 2019, 189, 347–358. [Google Scholar] [CrossRef]
- Gou, S.; Ding, R.; Fan, J.; Nie, X.; Zhang, J. Experimental study on seismic performance of precast LSECC/RC composite joints with U-shaped LSECC beam shells. Eng. Struct. 2019, 189, 618–634. [Google Scholar] [CrossRef]
- Si, J.; Chen, J.; Li, F.; Wu, Z.; Zhou, M.; Ju, J. Experimental study on seismic performance of prefabricated concrete bucket arch joints. Earthq. Eng. Eng. Dynam. 2021, 41, 114–122. (In Chinese) [Google Scholar]
- Hanson, N.W. Precast-prestressed concrete bridge horizontal shear connections. J. PCA Res. Dev. Lab. 1960, 2, 38–58. [Google Scholar]
- Gohnert, M. Horizontal shear transfer across a roughened surface. Cement Concrete Compos. 2003, 25, 379–385. [Google Scholar] [CrossRef]
- Lawrence, F.K.; Adam, S. Interface shear in high strength composite T-beams. PCI J. 2004, 49, 102–110. [Google Scholar]
- Salih, M.N.; Tahir, M.M.; Mohammad, S.; Ahmad, Y.; Sulaiman, A.; Shek, P.N.; Abraham, A.; Firdaus, M.; Aminuddin, K.M. Experimental study on flexural behaviour of partially encased cold-formed steel composite beams using rebar as shear connector. IOP Conf. Ser. Mater. Sci. Eng. 2019, 513, 012038. [Google Scholar] [CrossRef]
- Ozawa, K.; Maekawa, K.; Okamura, H. Development of high performance concrete. J. Faculty Eng. Univ. Tokyo Ser. B (Jpn.) 1992, 41, 381–439. [Google Scholar]
- Soubra, K.S.; Wight, J.K.; Naaman, A.E. Cyclic response of fibrous cast-in-place connections in precast beam-column subassemblages. Struct. J. 1993, 90, 316–323. [Google Scholar]
- Parra-Montesinos, G.J. High-Performance Fiber-Reinforced Cement Composites: An Alternative for Seismic Design of Structures. Struct. J. 2005, 102, 668–675. [Google Scholar]
- Zheng, Q.; Liu, Y.; Long, L.; Chen, G.; Ma, Y. Experimental research on seismic behavior of precast concrete frame connected with UHPC. Ind Constr. 2019, 49, 85–91. [Google Scholar]
- Deng, M.; Ma, F.; Ye, W.; Yin, P. Experimental study on aseismic behavior of locally used HDC assembled frame beam-column joints. Eng. Mech. 2019, 36, 68–78. (In Chinese) [Google Scholar]
- Wang, H.; Wang, N.; Liu, X.; Yue, Q.; Yan, J.; Zhang, Y. Effects of UHPC shear key on strengthening shear performances of wet joint in prefabricated composite beams. Eng. Struct. 2024, 299, 117130. [Google Scholar] [CrossRef]
- Liang, X.; Wang, Y.; Tao, Y.; Deng, M. Seismic Performance of Fiber-Reinforced Concrete Interior Beam-Column Joints. Eng. Struct. 2016, 126, 432–445. [Google Scholar] [CrossRef]
- Qian, Y.; Li, Z.; Jin, Y.; Wang, R. Experimental Study on Axial Tension Members of a New Epoxy Resin Concrete. Sci. Adv. Mater. 2021, 13, 2005–2015. [Google Scholar] [CrossRef]
- Xiang, Q.; Xiao, F. Applications of epoxy materials in pavement engineering. Construct. Build. Mater. 2020, 235, 117529. [Google Scholar] [CrossRef]
- Rahman, M.M.; Akhtarul Islam, M. Application of epoxy resins in building materials: Progress and prospects. Polym. Bull. 2022, 79, 1949–1975. [Google Scholar] [CrossRef]
- Zhang, W.; Guan, X.; Ren, J.; Gu, X. Experimental study on chloride permeability of concrete surface-treated with epoxy resin. J. Build. Mater. 2008, 11, 339–344. [Google Scholar]
- El-Hawary, M.; Al-Khaiat, H.; Fereig, S. Fereing Effect of Sea Water on Epoxy-repaired Concrete. Cement Concrete Compos. 1998, 20, 41–52. [Google Scholar] [CrossRef]
- Yu, T. The Experimental Study of Repairing Concrete Cracks with Epoxy Resin Grouting. Master’s Thesis, Beijing University of Technology, Beijing, China, 2016. (In Chinese). [Google Scholar]
- Gil-Martín, L.M.; Rodríguez-Suesca, A.E.; Fernández-Ruiz, M.A.; Hernández-Montes, E. Cyclic behavior of RC beam-column joints with epoxy resin and ground tire rubber as partial cement replacement. Construct. Build. Mater. 2019, 211, 659–674. [Google Scholar] [CrossRef]
- Li, X. Study on the Behavior of the Axial Compression Members of the New Epoxy Resin Concrete. Master’s Thesis, Jilin Jianzhu University, Jilin, China, 2019. (In Chinese). [Google Scholar]
- Zhang, G. Study on the Mechanical Properties of New Epoxy Resin Concrete Axial Tensile Members. Master’s Thesis, Jilin Jianzhu University, Jilin, China, 2019. (In Chinese). [Google Scholar]
- Sun, Z. Study on Mechanical Behavior of New Epoxy Resin Concrete Beam. Master’s Thesis, Jilin Jianzhu University, Jilin, China, 2019. (In Chinese). [Google Scholar]
- Shahzamanian, M.M.; Basirun, W.J. Modeling of Cementitious Representative Volume Element with Additives. J. Multiscale Modell. 2017, 29, 1750003. [Google Scholar] [CrossRef]
- Bernard, F.; Kamali-Bernard, S. Performance simulation and quantitative analysis of cement-based materials subjected to leaching. Comput. Mater. Sci. 2010, 218, 2262010. [Google Scholar] [CrossRef]
- GB 50010-2010; Code for Design of Concrete Structures. China Architecture & Building Press: Beijing, China, 2015. (In Chinese)
- Lv, X.; Yu, Z.; Shan, Z. Seismic behaviour of frame structures with assembly of prefabricated concrete beam. J. Build. Eng. 2021, 40, 102765. [Google Scholar] [CrossRef]
- EN1992-1-2; European Standard. Euro-Code2: Design of Concrete Structures-Part1: General Rules and Rules for Buildings. European Committee for Standardization: Bruxelles, Belgium, 2021.
 Precast ordinary concrete;
  Cast- and Post-cast ordinary concrete;
  Post-cast epoxy resin concrete.
Precast ordinary concrete; Cast- and Post-cast ordinary concrete; Post-cast epoxy resin concrete.
Post-cast epoxy resin concrete.
Precast ordinary concrete; Cast- and Post-cast ordinary concrete; Post-cast epoxy resin concrete.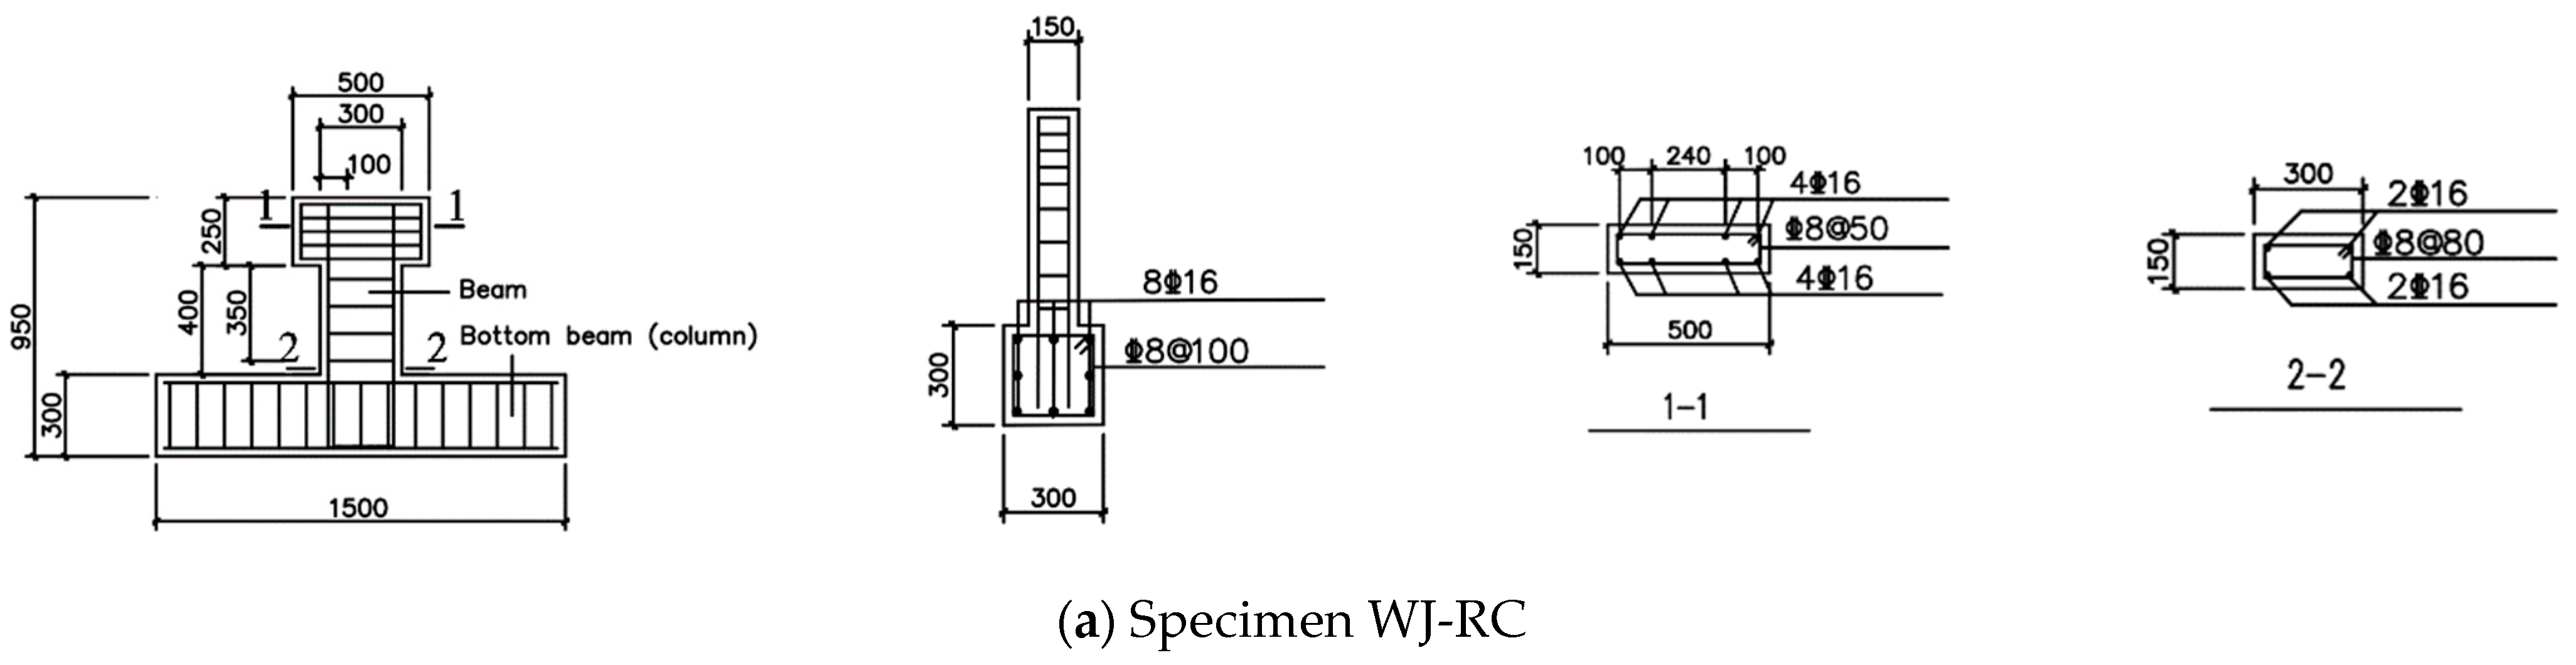


| Specimen Number | Type of Post-Cast Concrete | Longitudinal Reinforcement | Column Stirrup | Beam Stirrup | Shear Span Ratio | Keyway Dimension/mm | Remark |
|---|---|---|---|---|---|---|---|
| WJ-RC | ------ |  16 16 | 8@100 | 8@80 | 1.5 | --- | cast-in situ specimen |
| WJ-CC | Ordinary concrete | 16 | 8@100 | 8@80 | 1.5 | Width 90 mm, depth 30 mm | --- |
| WJ-EC | Epoxy resin concrete | 16 | 8@100 | 8@80 | 1.5 | Width 90 mm, depth 30 mm | --- |
| Epoxy Resin (kg/m3) | Curing Agent (kg/m3) | Cement (kg/m3) | Cobble (kg/m3) | Sand (kg/m3) | Diluent (kg/m3) |
|---|---|---|---|---|---|
| 800 | 320 | 1200 | 2800 | 3200 | 80 |
| Specimen Number | Cracking Load Pcr/kN | Cracking Displacement Δcr/mm | Yield Load Py/kN | Yield Displacement Δy/mm | Peak Load Pmax/kN | Peak Displacement Δmax/mm | Failure Load Pu/kN | Failure Displacement Δu/mm | Ductility Coefficient μ = Δu/Δy |
|---|---|---|---|---|---|---|---|---|---|
| WJ-RC | 42.7 | 0.55 | 97.5 | 3.37 | 130.8 | 9.0 | 118 | 14.71 | 4.36 |
| WJ-CC | 28.1 | 0.43 | 80.9 | 2.76 | 117.5 | 6.0 | 92.8 | 14.08 | 5.07 |
| WJ-EC | 41.5 | 0.45 | 87.5 | 2.10 | 129.1 | 10.0 | 113.9 | 15.32 | 7.27 |
| Specimen Number | Pt/kN | Δt/mm | Pnu/kN | Δnu/mm | Pnu/Pt | Δnu/Δt |
|---|---|---|---|---|---|---|
| WJ-RC | 130.8 | 9 | 139.0 | 1.2 | 0.90 | 0.67 |
| WJ-CC | 117.5 | 6 | 103.8 | 5.2 | 0.88 | 0.87 |
| WJ-EC | 129.1 | 10 | 139.4 | 8.8 | 1.07 | 0.88 |
| Specimen Number | Strength Grade of Precast Concrete | Beam and Column Longitudinal Reinforcement | Shear Span Ratio | y (mm) | Remark |
|---|---|---|---|---|---|
| WJ-EC | C30 | 16 | 1.5 | 50 | Compare specimens |
| WJ-EC1 | C40 | 16 | 1.5 | 50 | --- |
| WJ-EC2 | C50 | 16 | 1.5 | 50 | --- |
| WJ-EC3 | C60 | 16 | 1.5 | 50 | --- |
| WJ-EC4 | C70 | 16 | 1.5 | 50 | --- |
| WJ-EC5 | C80 | 16 | 1.5 | 50 | --- |
| WJ-EC6 | C30 | 18 | 1.5 | 50 | --- |
| WJ-EC7 | C30 | 20 | 1.5 | 50 | --- |
| WJ-EC8 | C30 | 16 | 1 | 50 | --- |
| WJ-EC9 | C30 | 16 | 2.5 | 50 | --- |
| WJ-EC10 | C30 | 16 | 1.5 | 200 | --- |
| WJ-EC11 | C30 | 16 | 1.5 | 300 | --- |
| Specimen Number | Strength Grade of Precast Concrete | Beam and Column Longitudinal Reinforcement | Shear Span Ratio | Post-Cast Materials | Horizontal Seam Thickness (mm) | y (mm) | Remark |
|---|---|---|---|---|---|---|---|
| WJ-RC | --- | 16 | 1.5 | --- | --- | Contrast specimen | |
| WJ-CC | C30 | 16 | 1.5 | Ordinary concrete | --- | --- | Contrast specimen |
| WJ-EC12 | C30 | 16 | 1.5 | Epoxy resin concrete | 70 | 70 | --- |
| WJ-EC13 | C30 | 16 | 1.5 | Epoxy resin concrete | 70 | 165 | --- |
| WJ-EC14 | C30 | 16 | 1.5 | Epoxy resin concrete | 70 | 260 | --- |
Disclaimer/Publisher’s Note: The statements, opinions and data contained in all publications are solely those of the individual author(s) and contributor(s) and not of MDPI and/or the editor(s). MDPI and/or the editor(s) disclaim responsibility for any injury to people or property resulting from any ideas, methods, instructions or products referred to in the content. |
© 2023 by the authors. Licensee MDPI, Basel, Switzerland. This article is an open access article distributed under the terms and conditions of the Creative Commons Attribution (CC BY) license (https://creativecommons.org/licenses/by/4.0/).
Share and Cite
Chen, P.; Xu, S.; Zhou, X.; Xu, D. An Experimental Study on Flexural-Shear Behavior of Composite Beams in Precast Frame Structures with Post-Cast Epoxy Resin Concrete. Buildings 2023, 13, 3137. https://doi.org/10.3390/buildings13123137
Chen P, Xu S, Zhou X, Xu D. An Experimental Study on Flexural-Shear Behavior of Composite Beams in Precast Frame Structures with Post-Cast Epoxy Resin Concrete. Buildings. 2023; 13(12):3137. https://doi.org/10.3390/buildings13123137
Chicago/Turabian StyleChen, Peiqi, Shuo Xu, Xiaojie Zhou, and Dezong Xu. 2023. "An Experimental Study on Flexural-Shear Behavior of Composite Beams in Precast Frame Structures with Post-Cast Epoxy Resin Concrete" Buildings 13, no. 12: 3137. https://doi.org/10.3390/buildings13123137
APA StyleChen, P., Xu, S., Zhou, X., & Xu, D. (2023). An Experimental Study on Flexural-Shear Behavior of Composite Beams in Precast Frame Structures with Post-Cast Epoxy Resin Concrete. Buildings, 13(12), 3137. https://doi.org/10.3390/buildings13123137