
Exploring the Dynamic Cultural Driving Factors Underlying the Regional Spatial Pattern of Chinese Traditional Villages

Abstract
:1. Introduction
2. Materials and Methods
2.1. Study Area
2.2. Data Sources
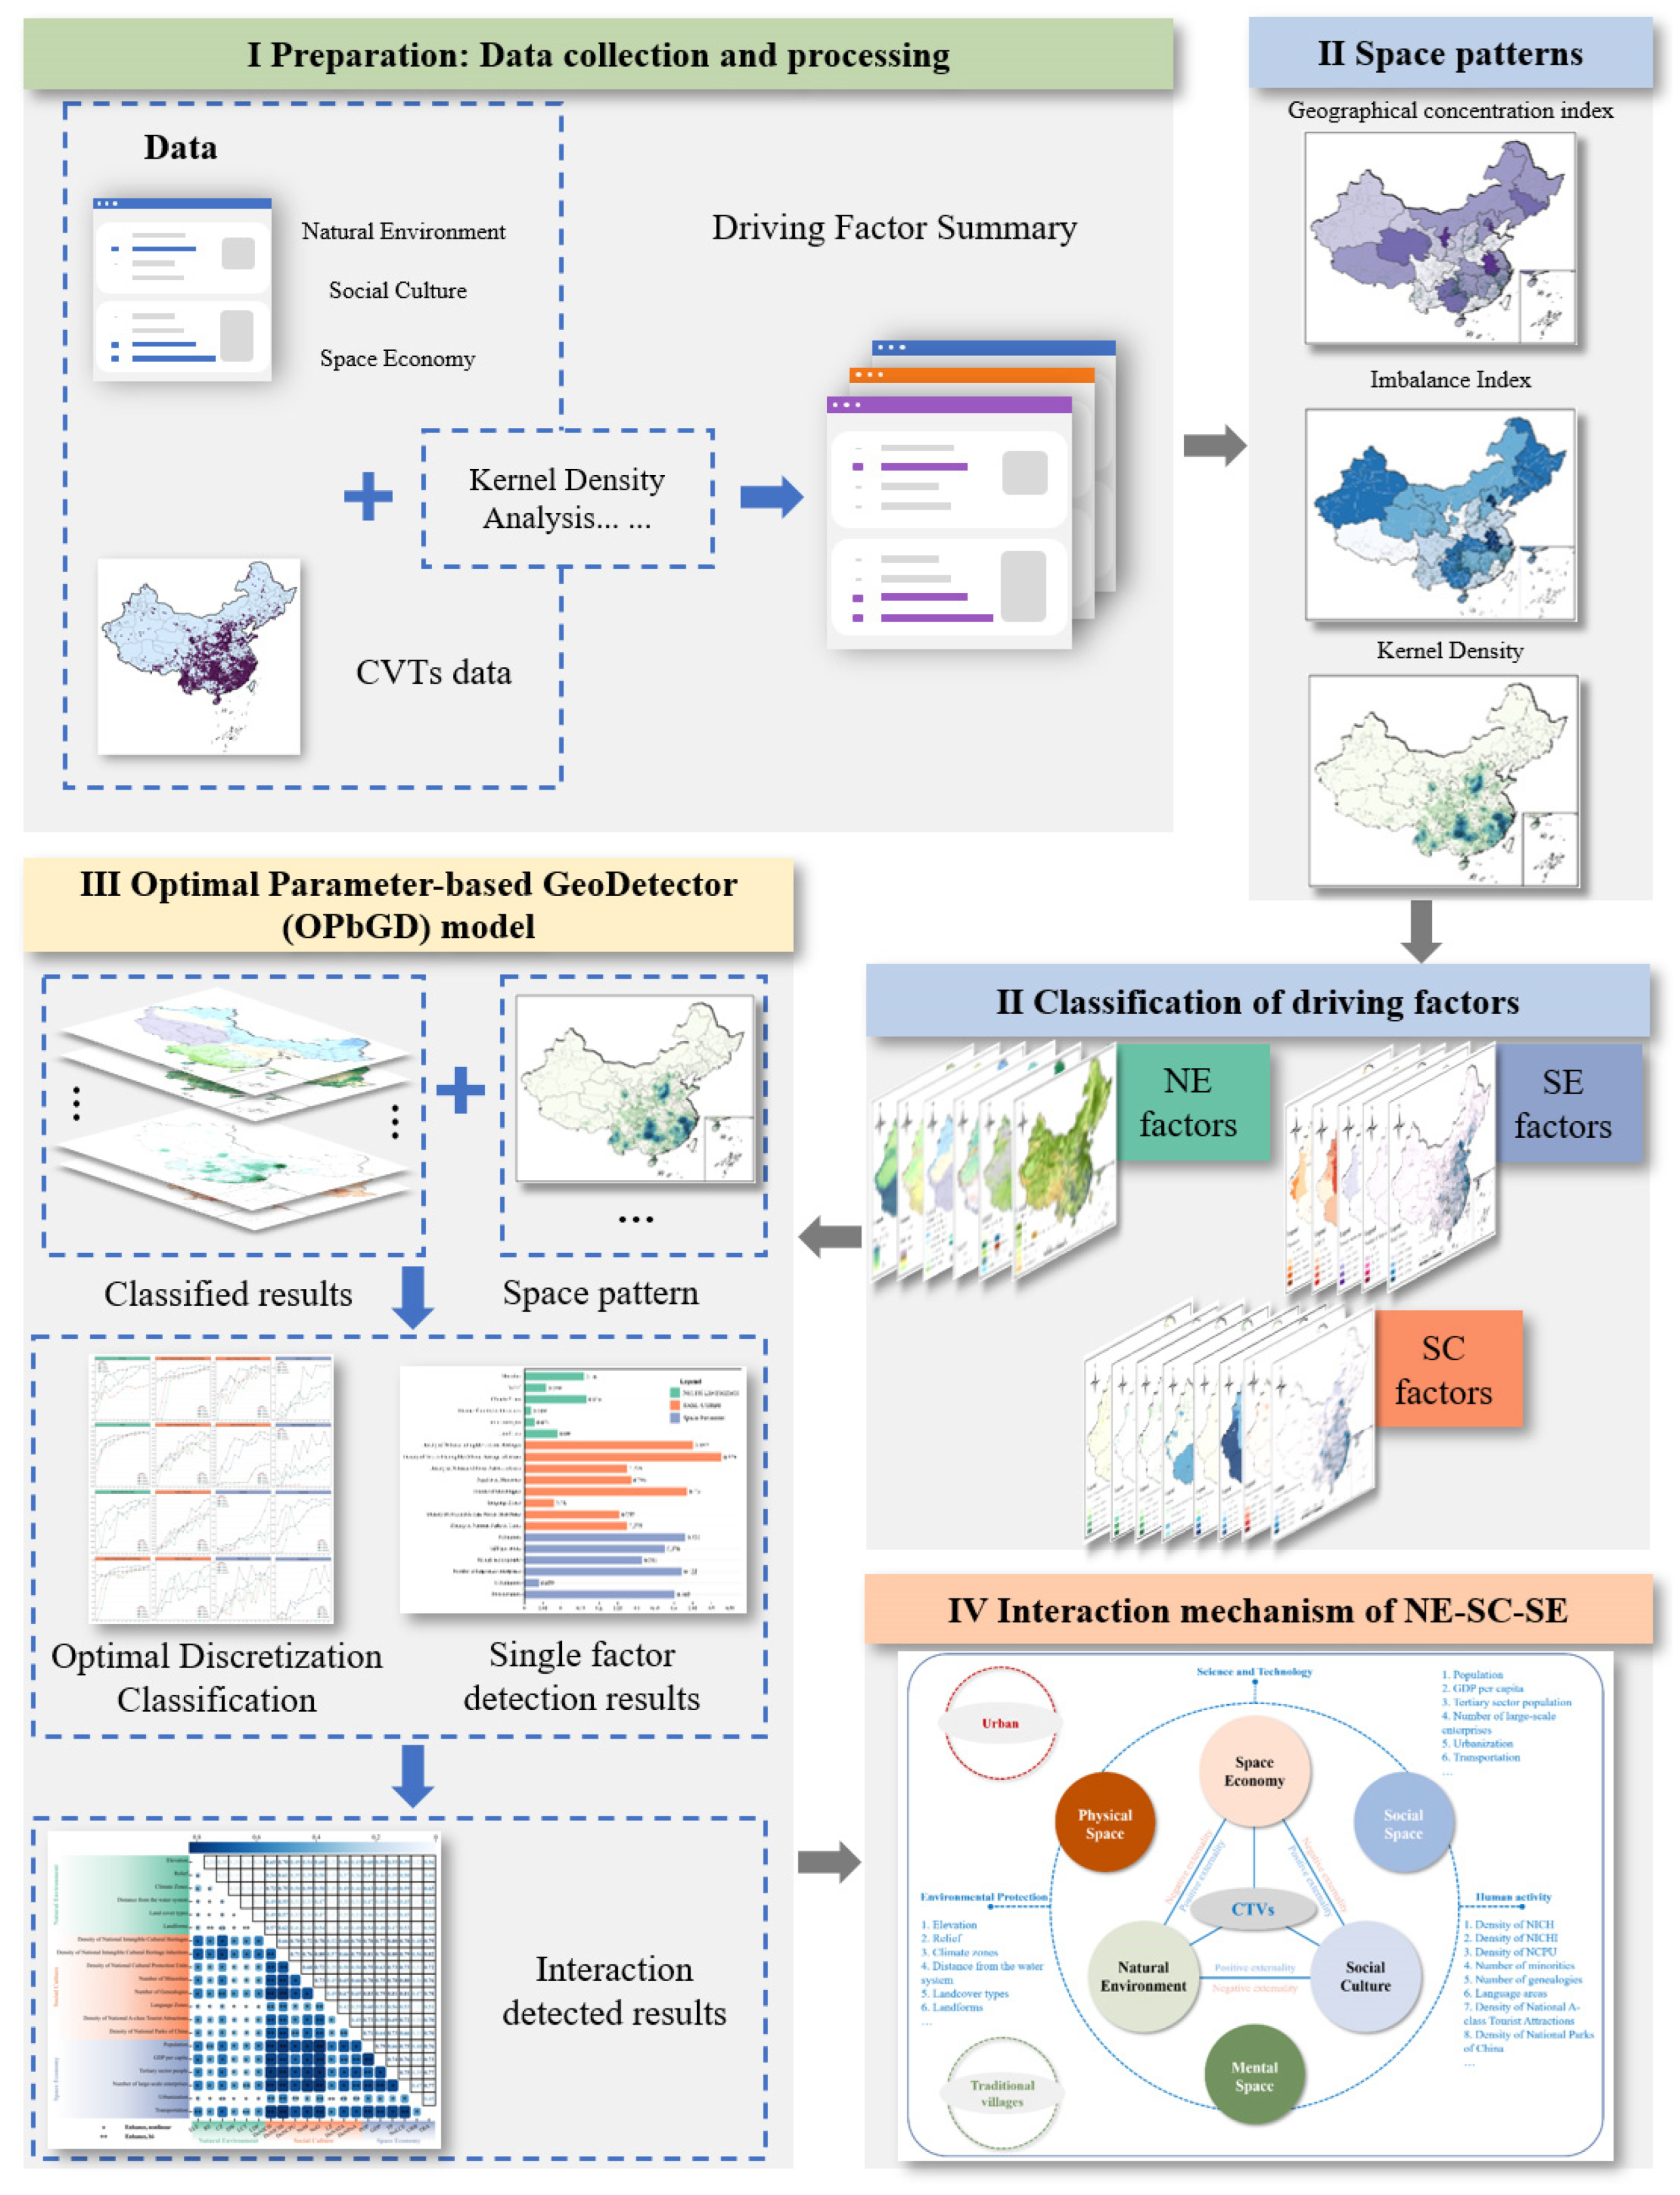
2.3. Methods
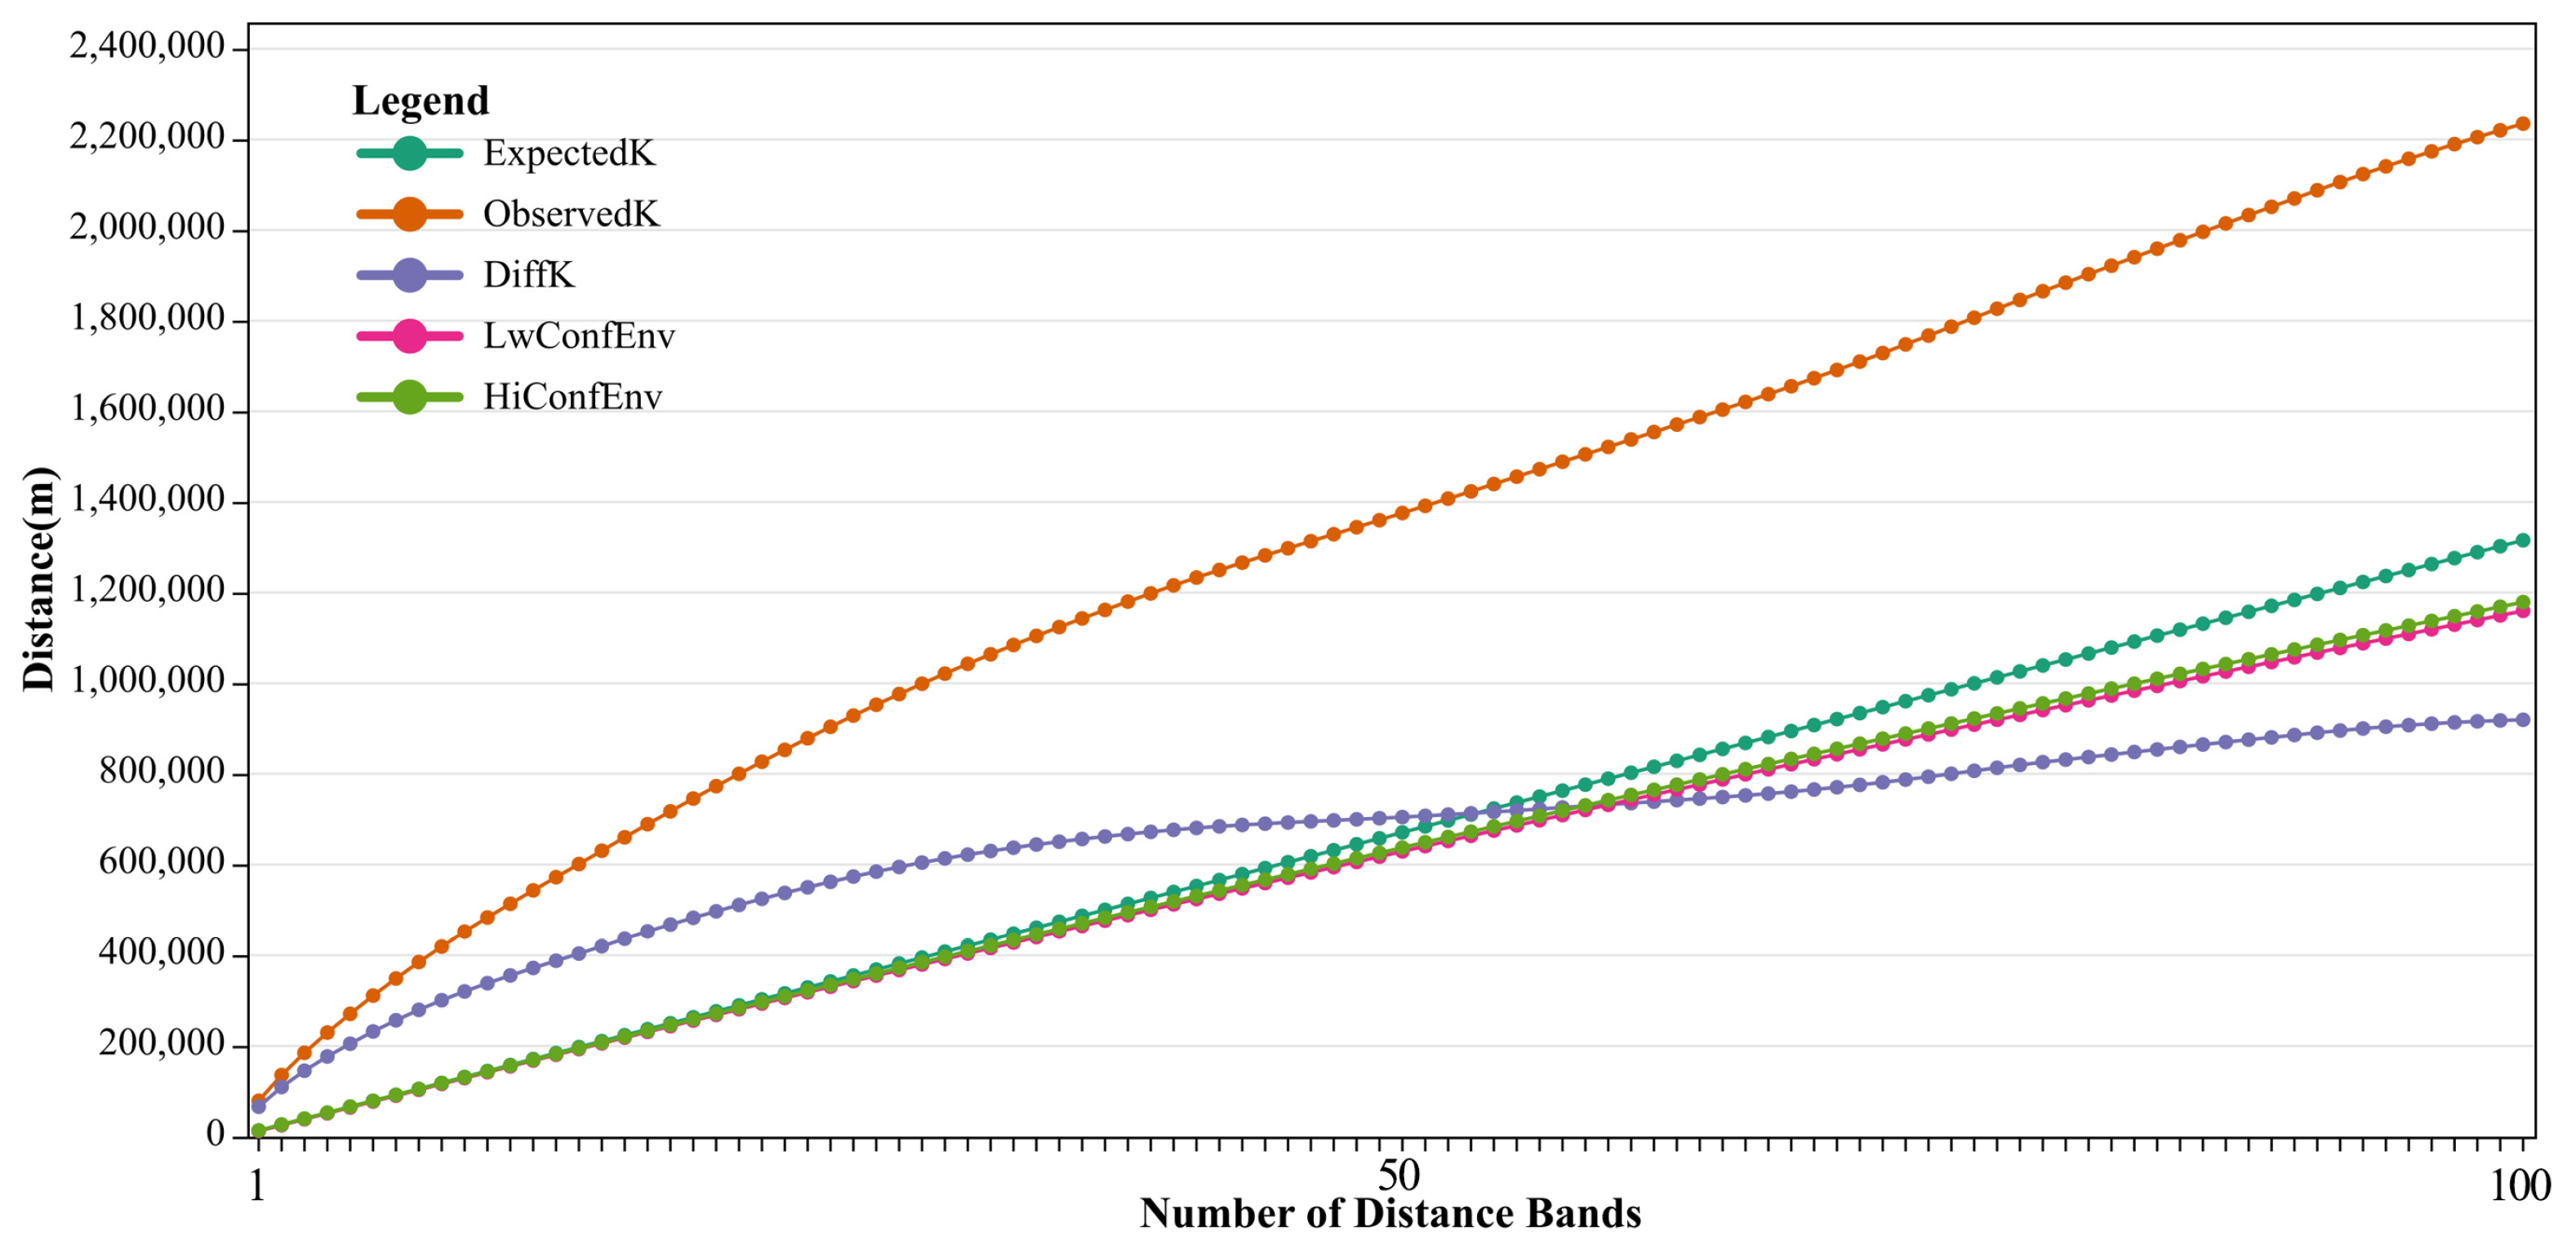
2.3.1. Spatial Pattern Analysis Methods
2.3.2. Optimal Parameter-Based GeoDetector
3. Distribution Characteristics of CTVs
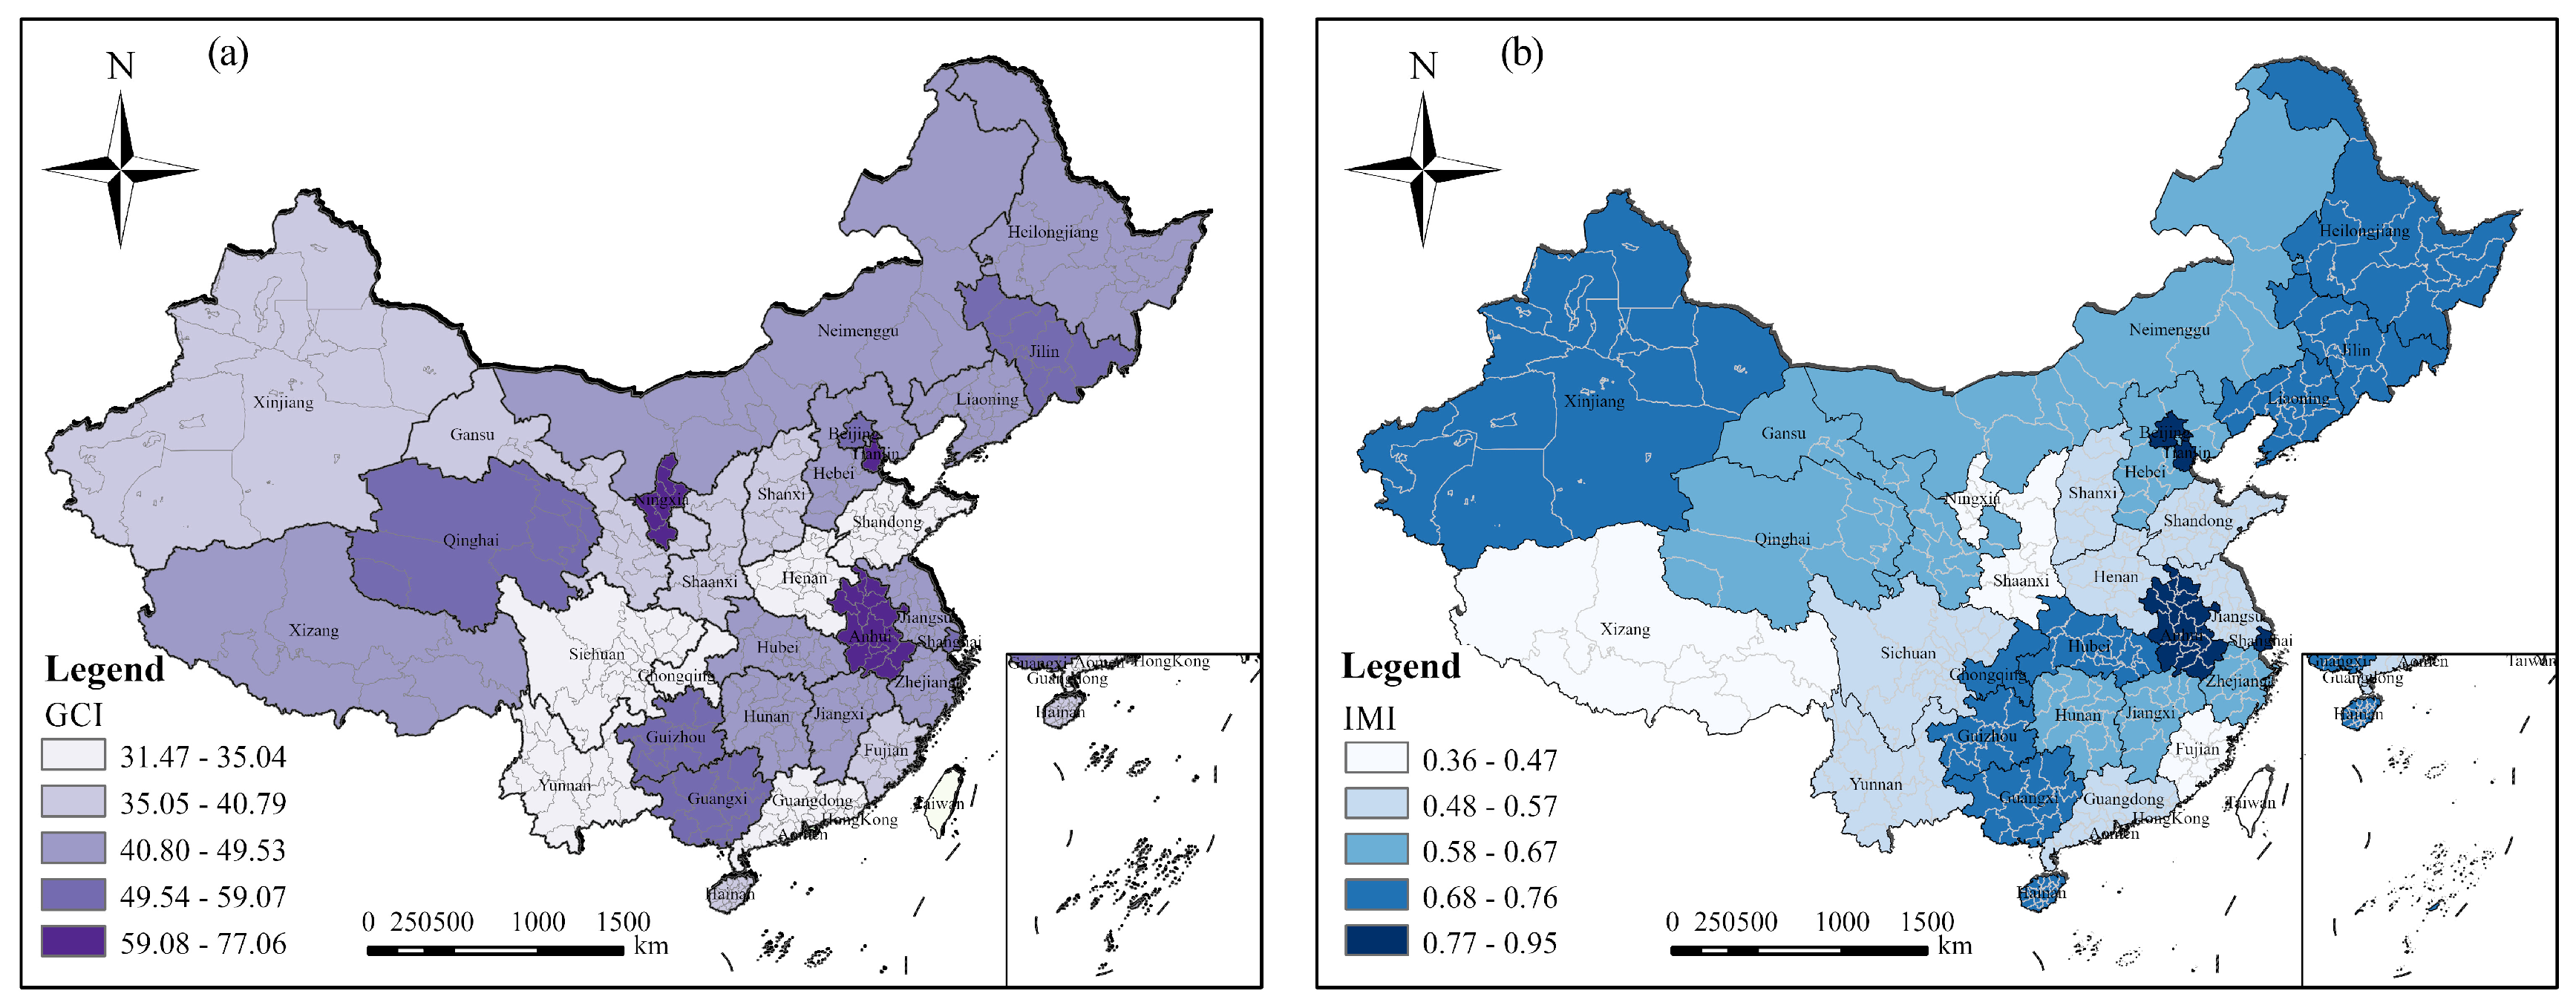
3.1. Spatial Pattern and Degree of Concentration
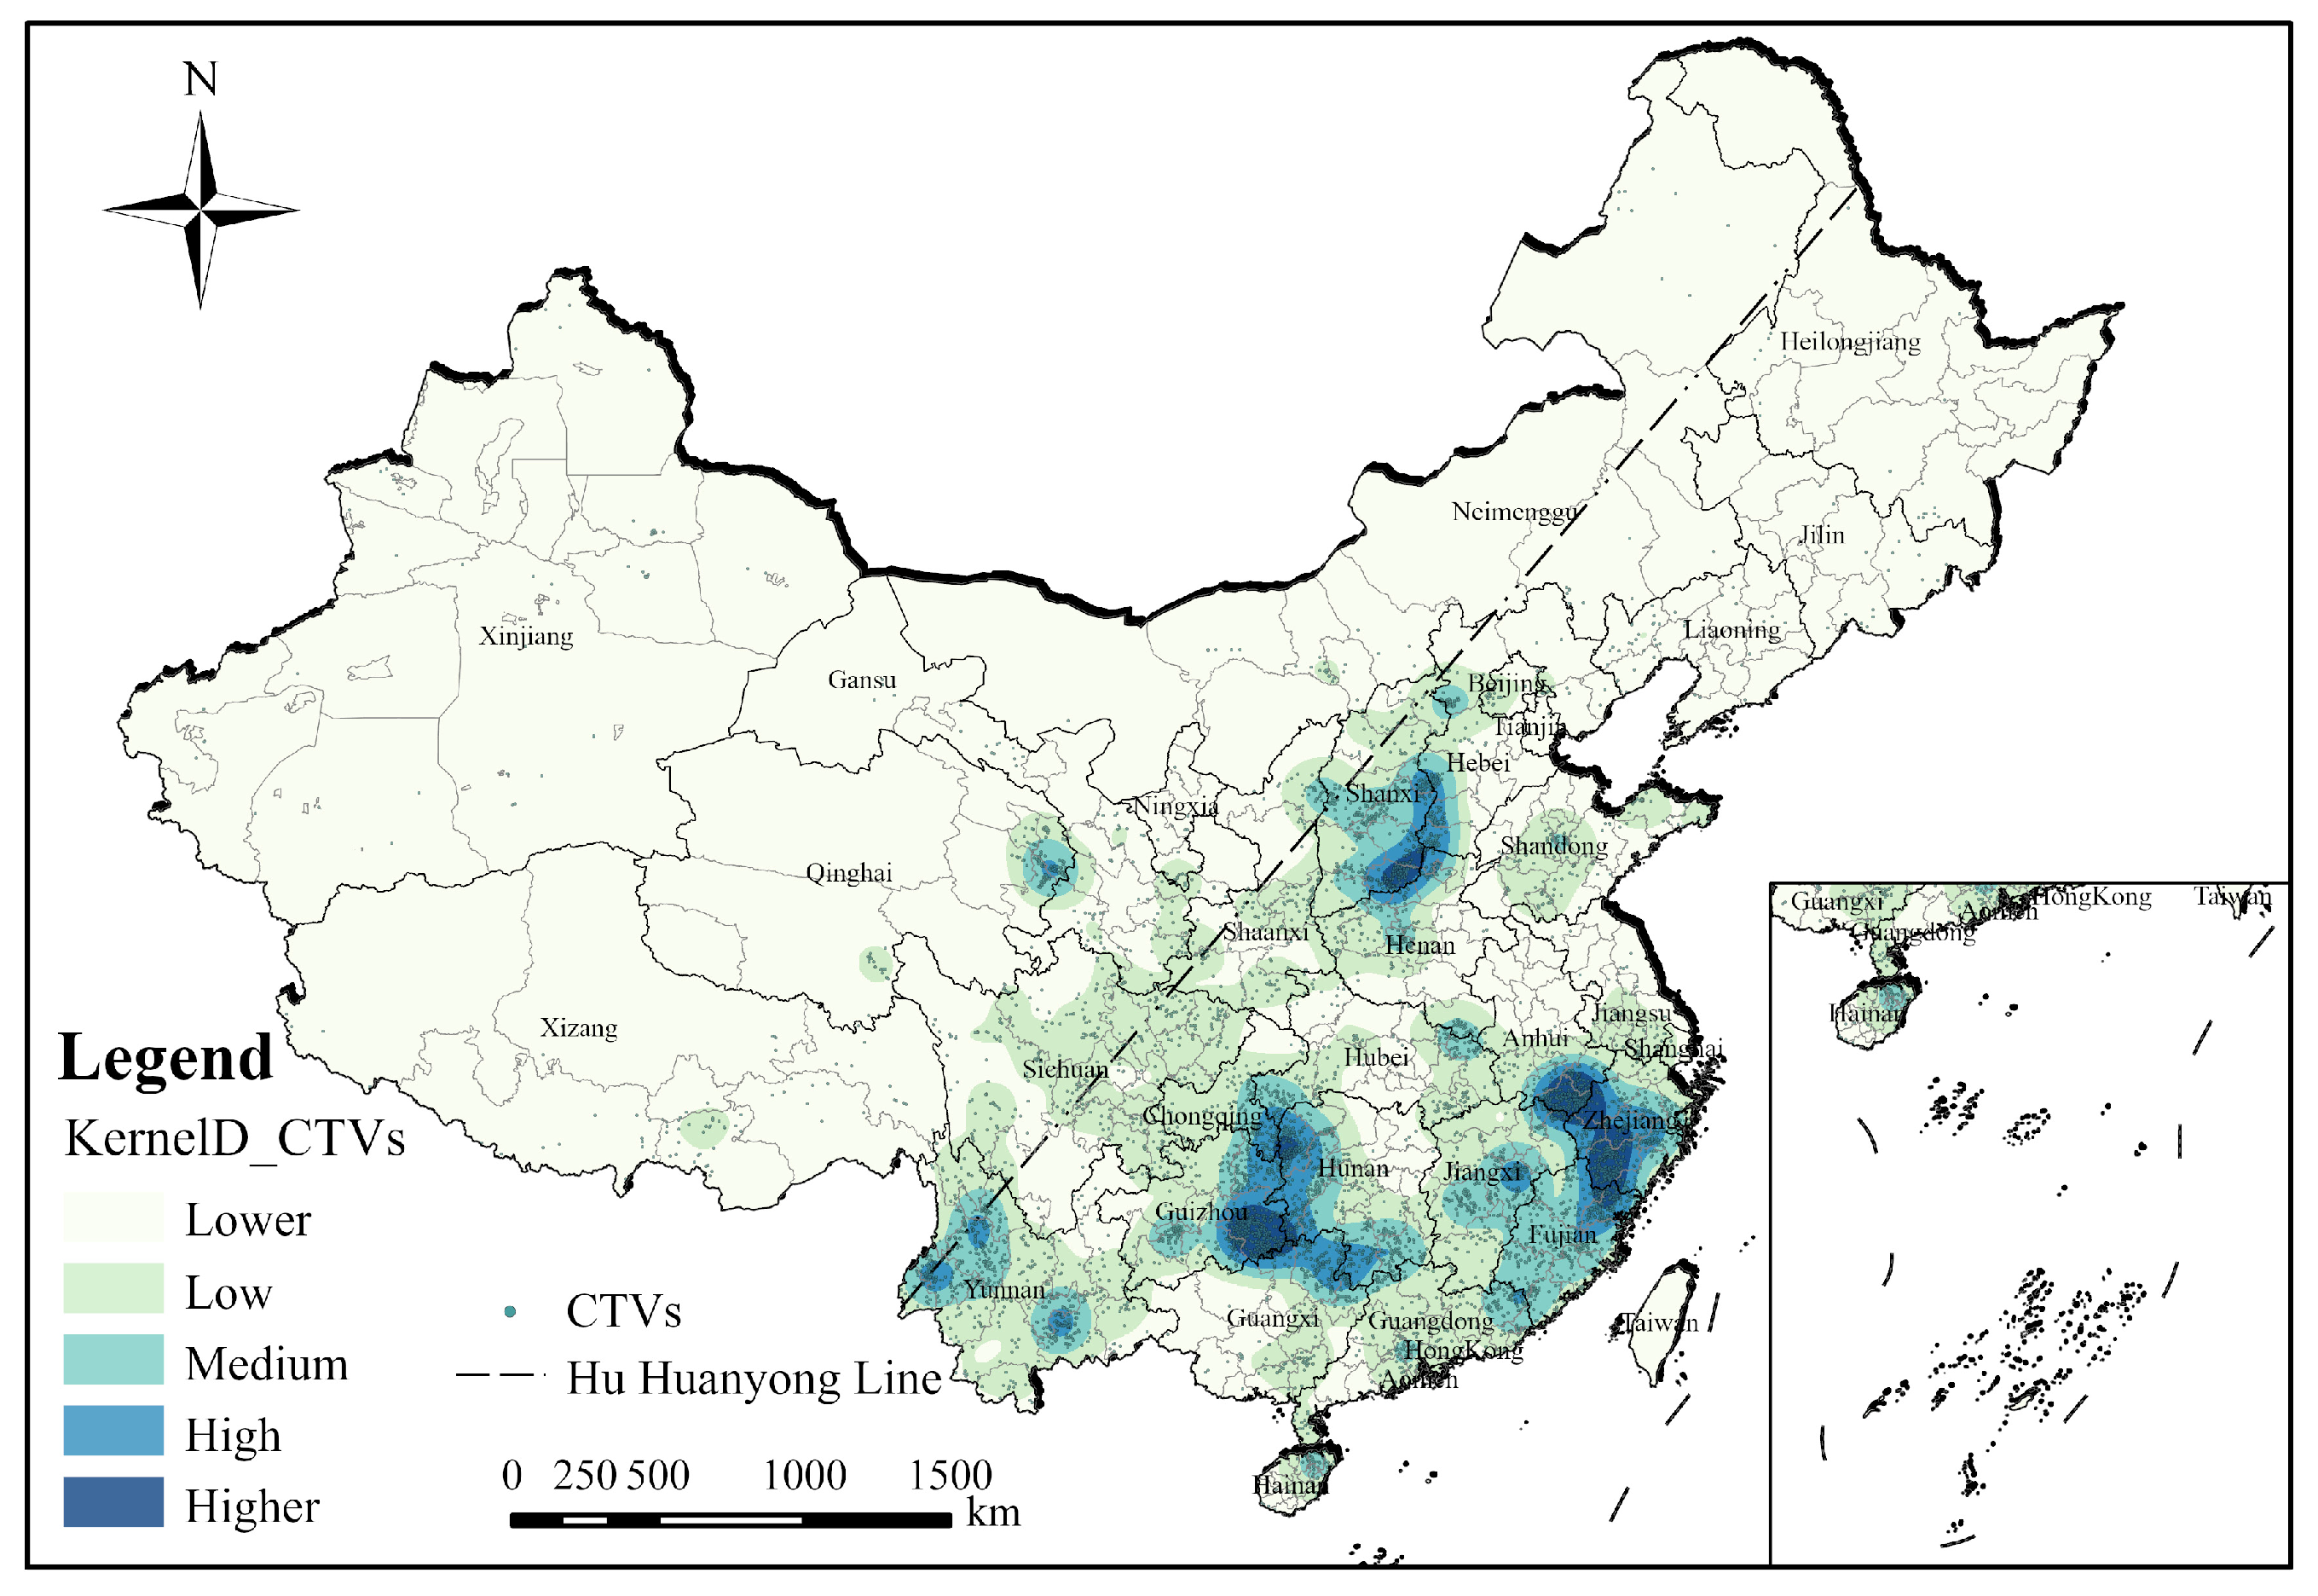
3.2. Spatial Distribution Density
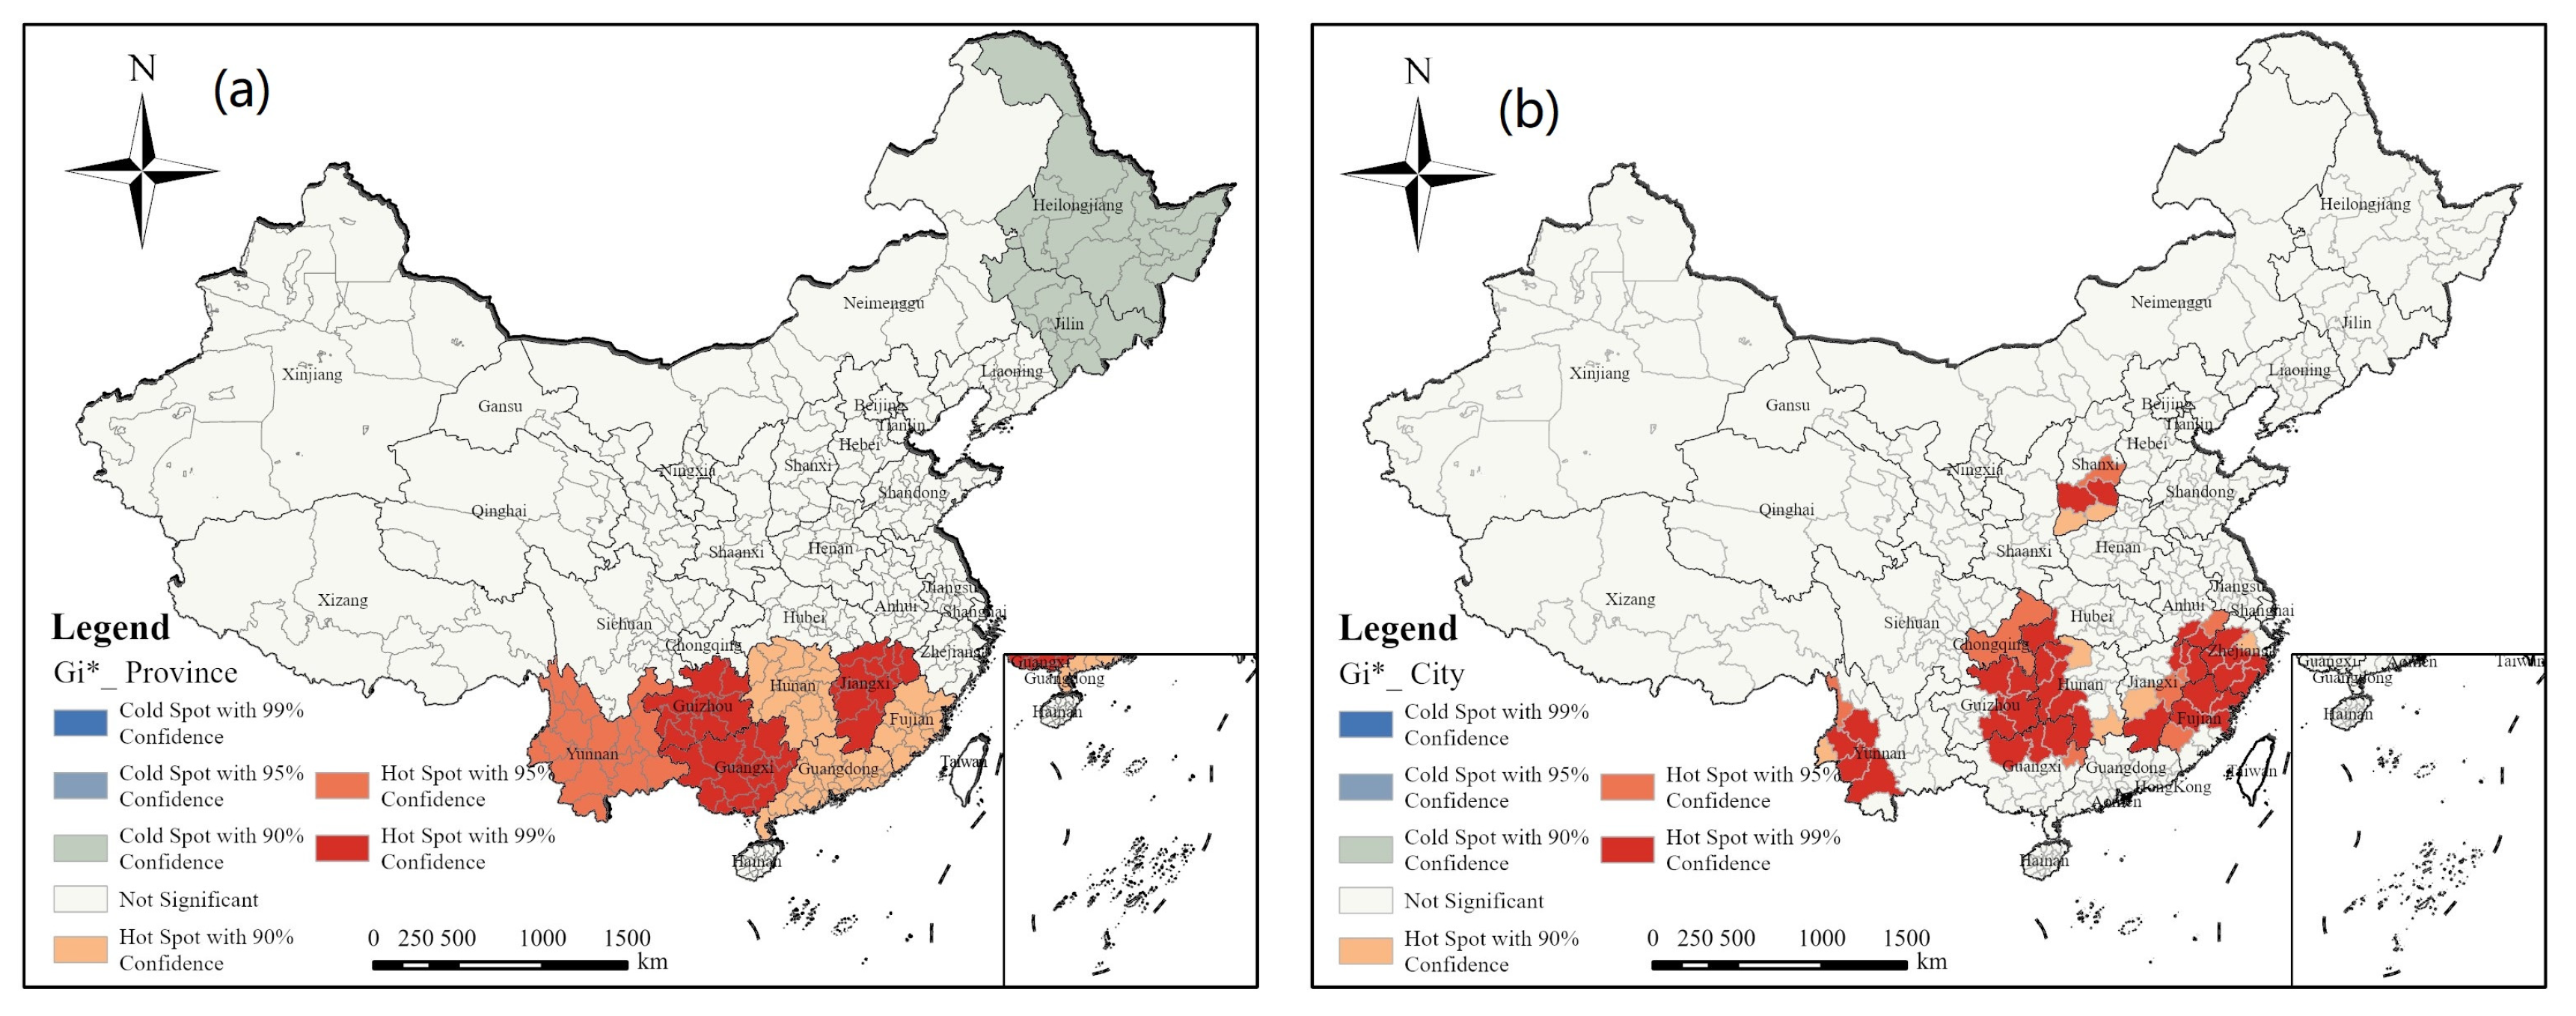
3.3. Spatial Autocorrelation Characteristics
4. Factors Influencing the Spatial Differentiation of CTVs
4.1. Natural Environment
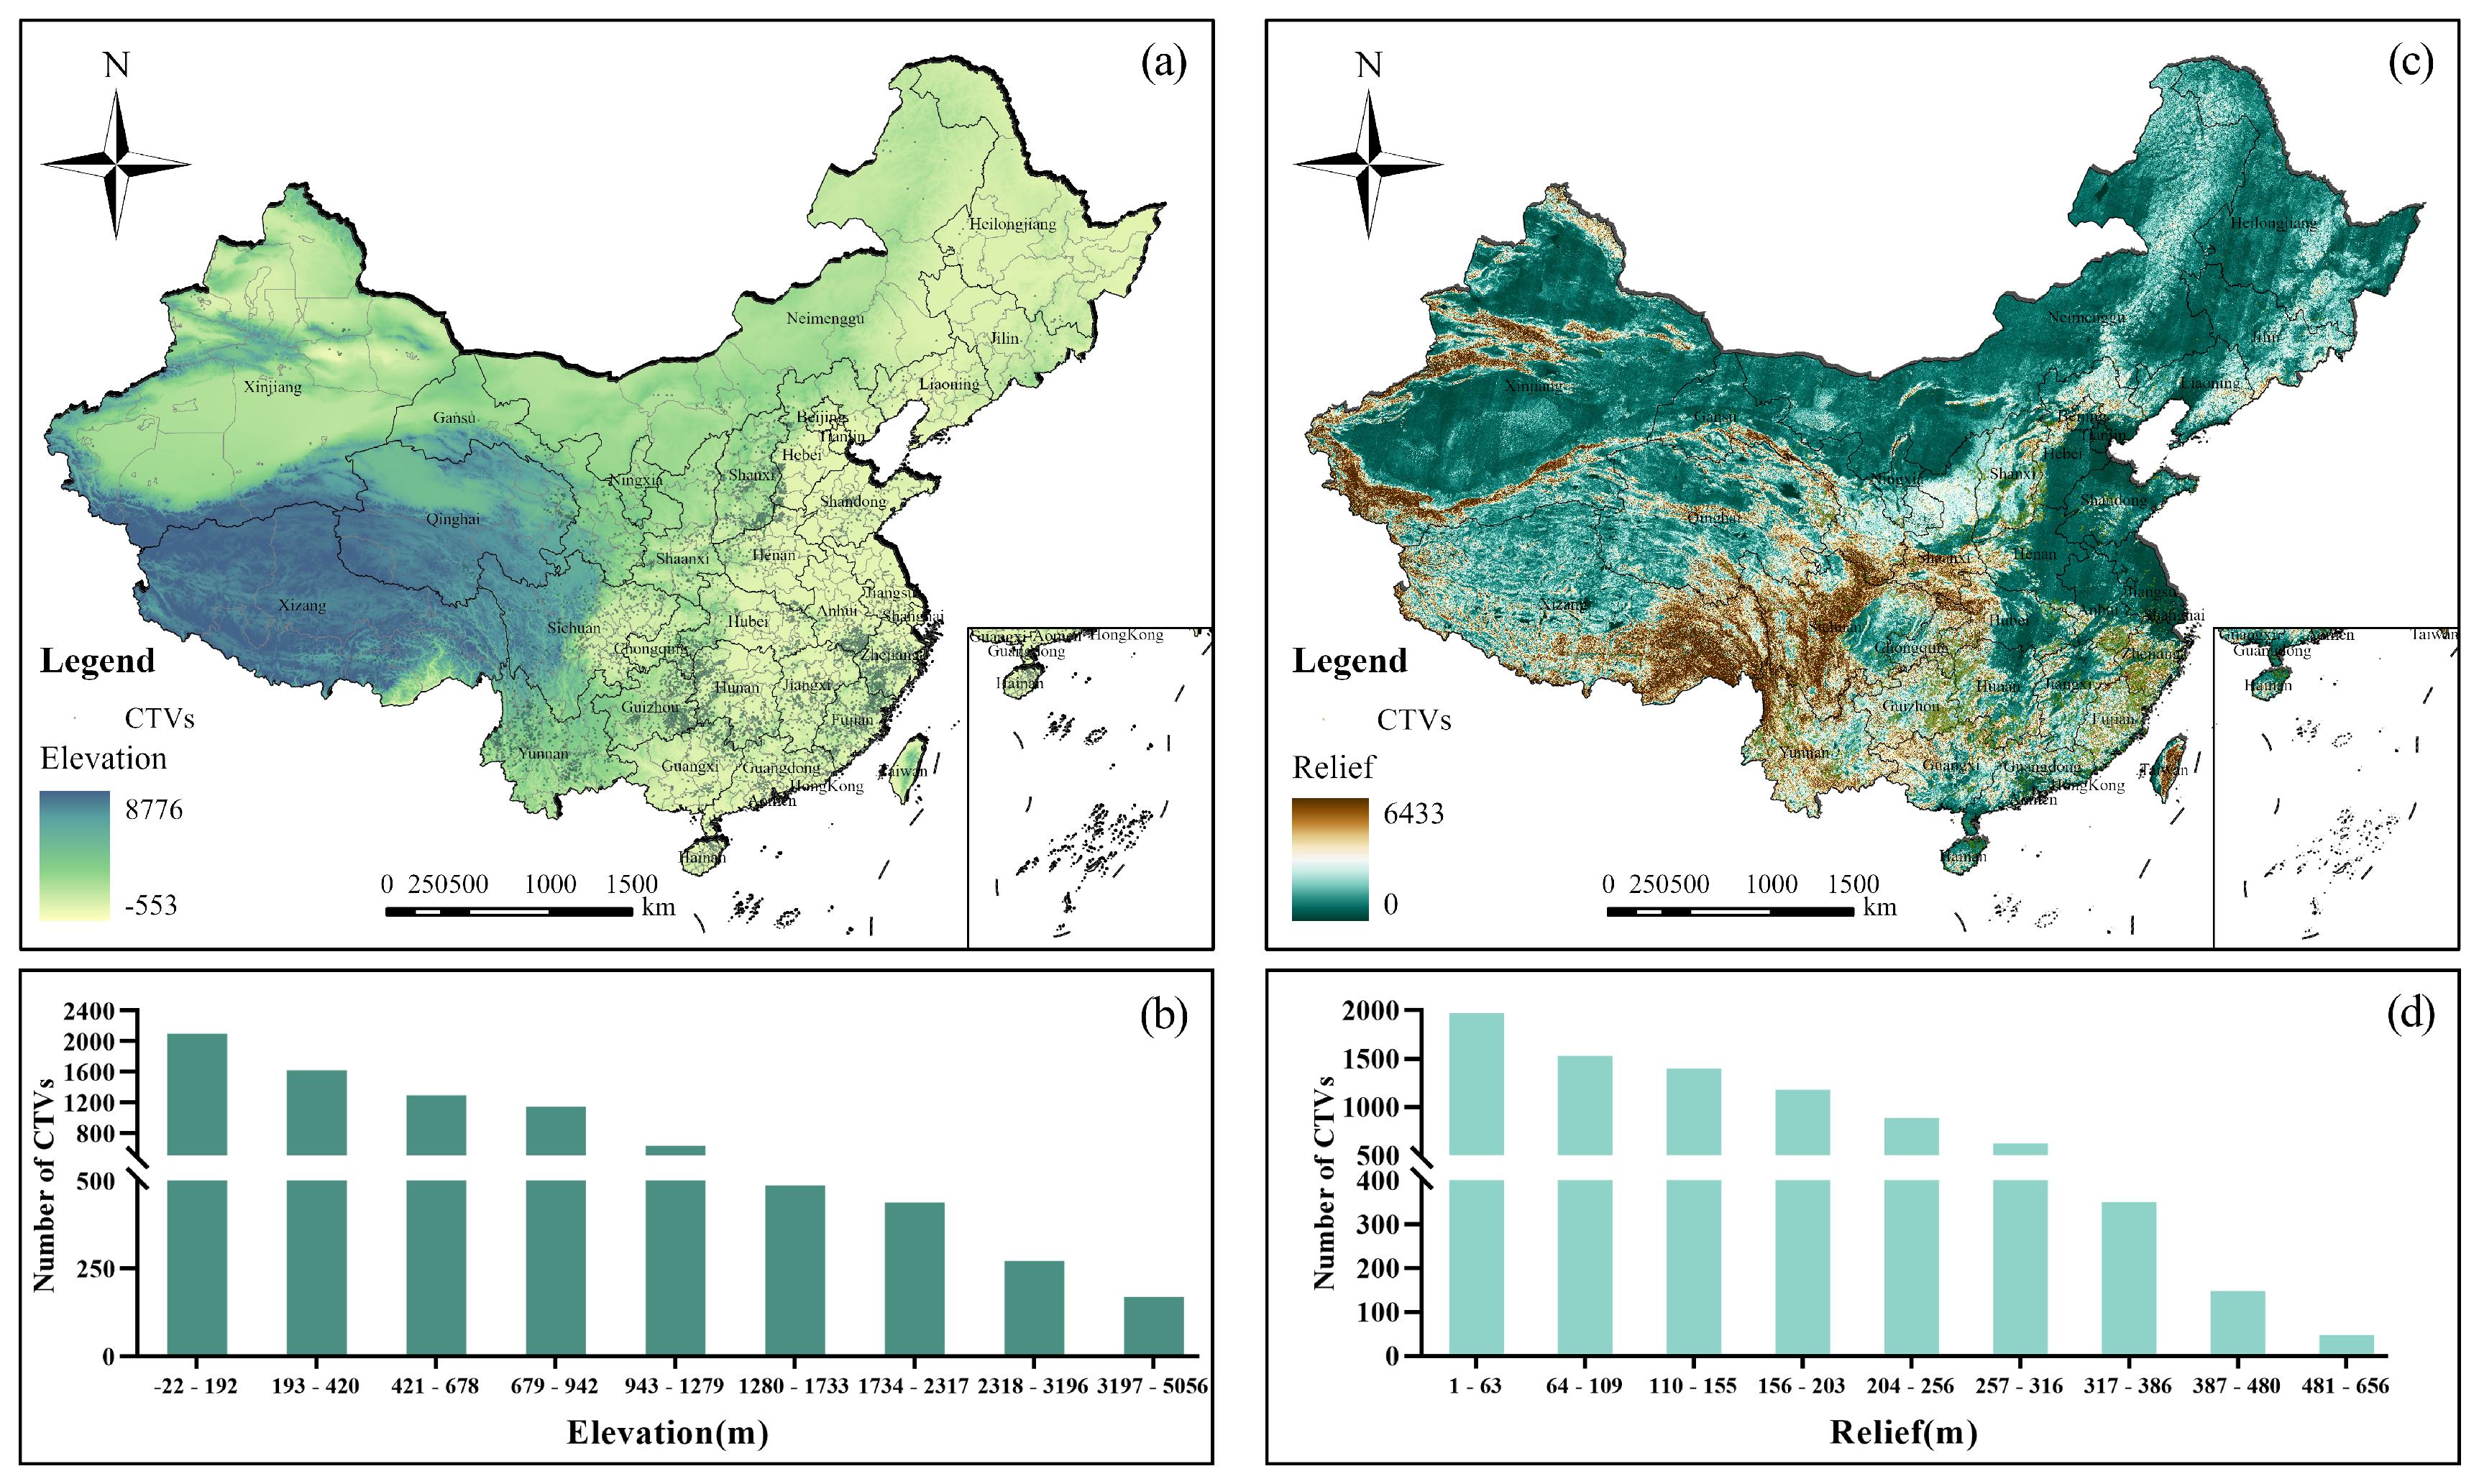
4.1.1. Elevation and Relief
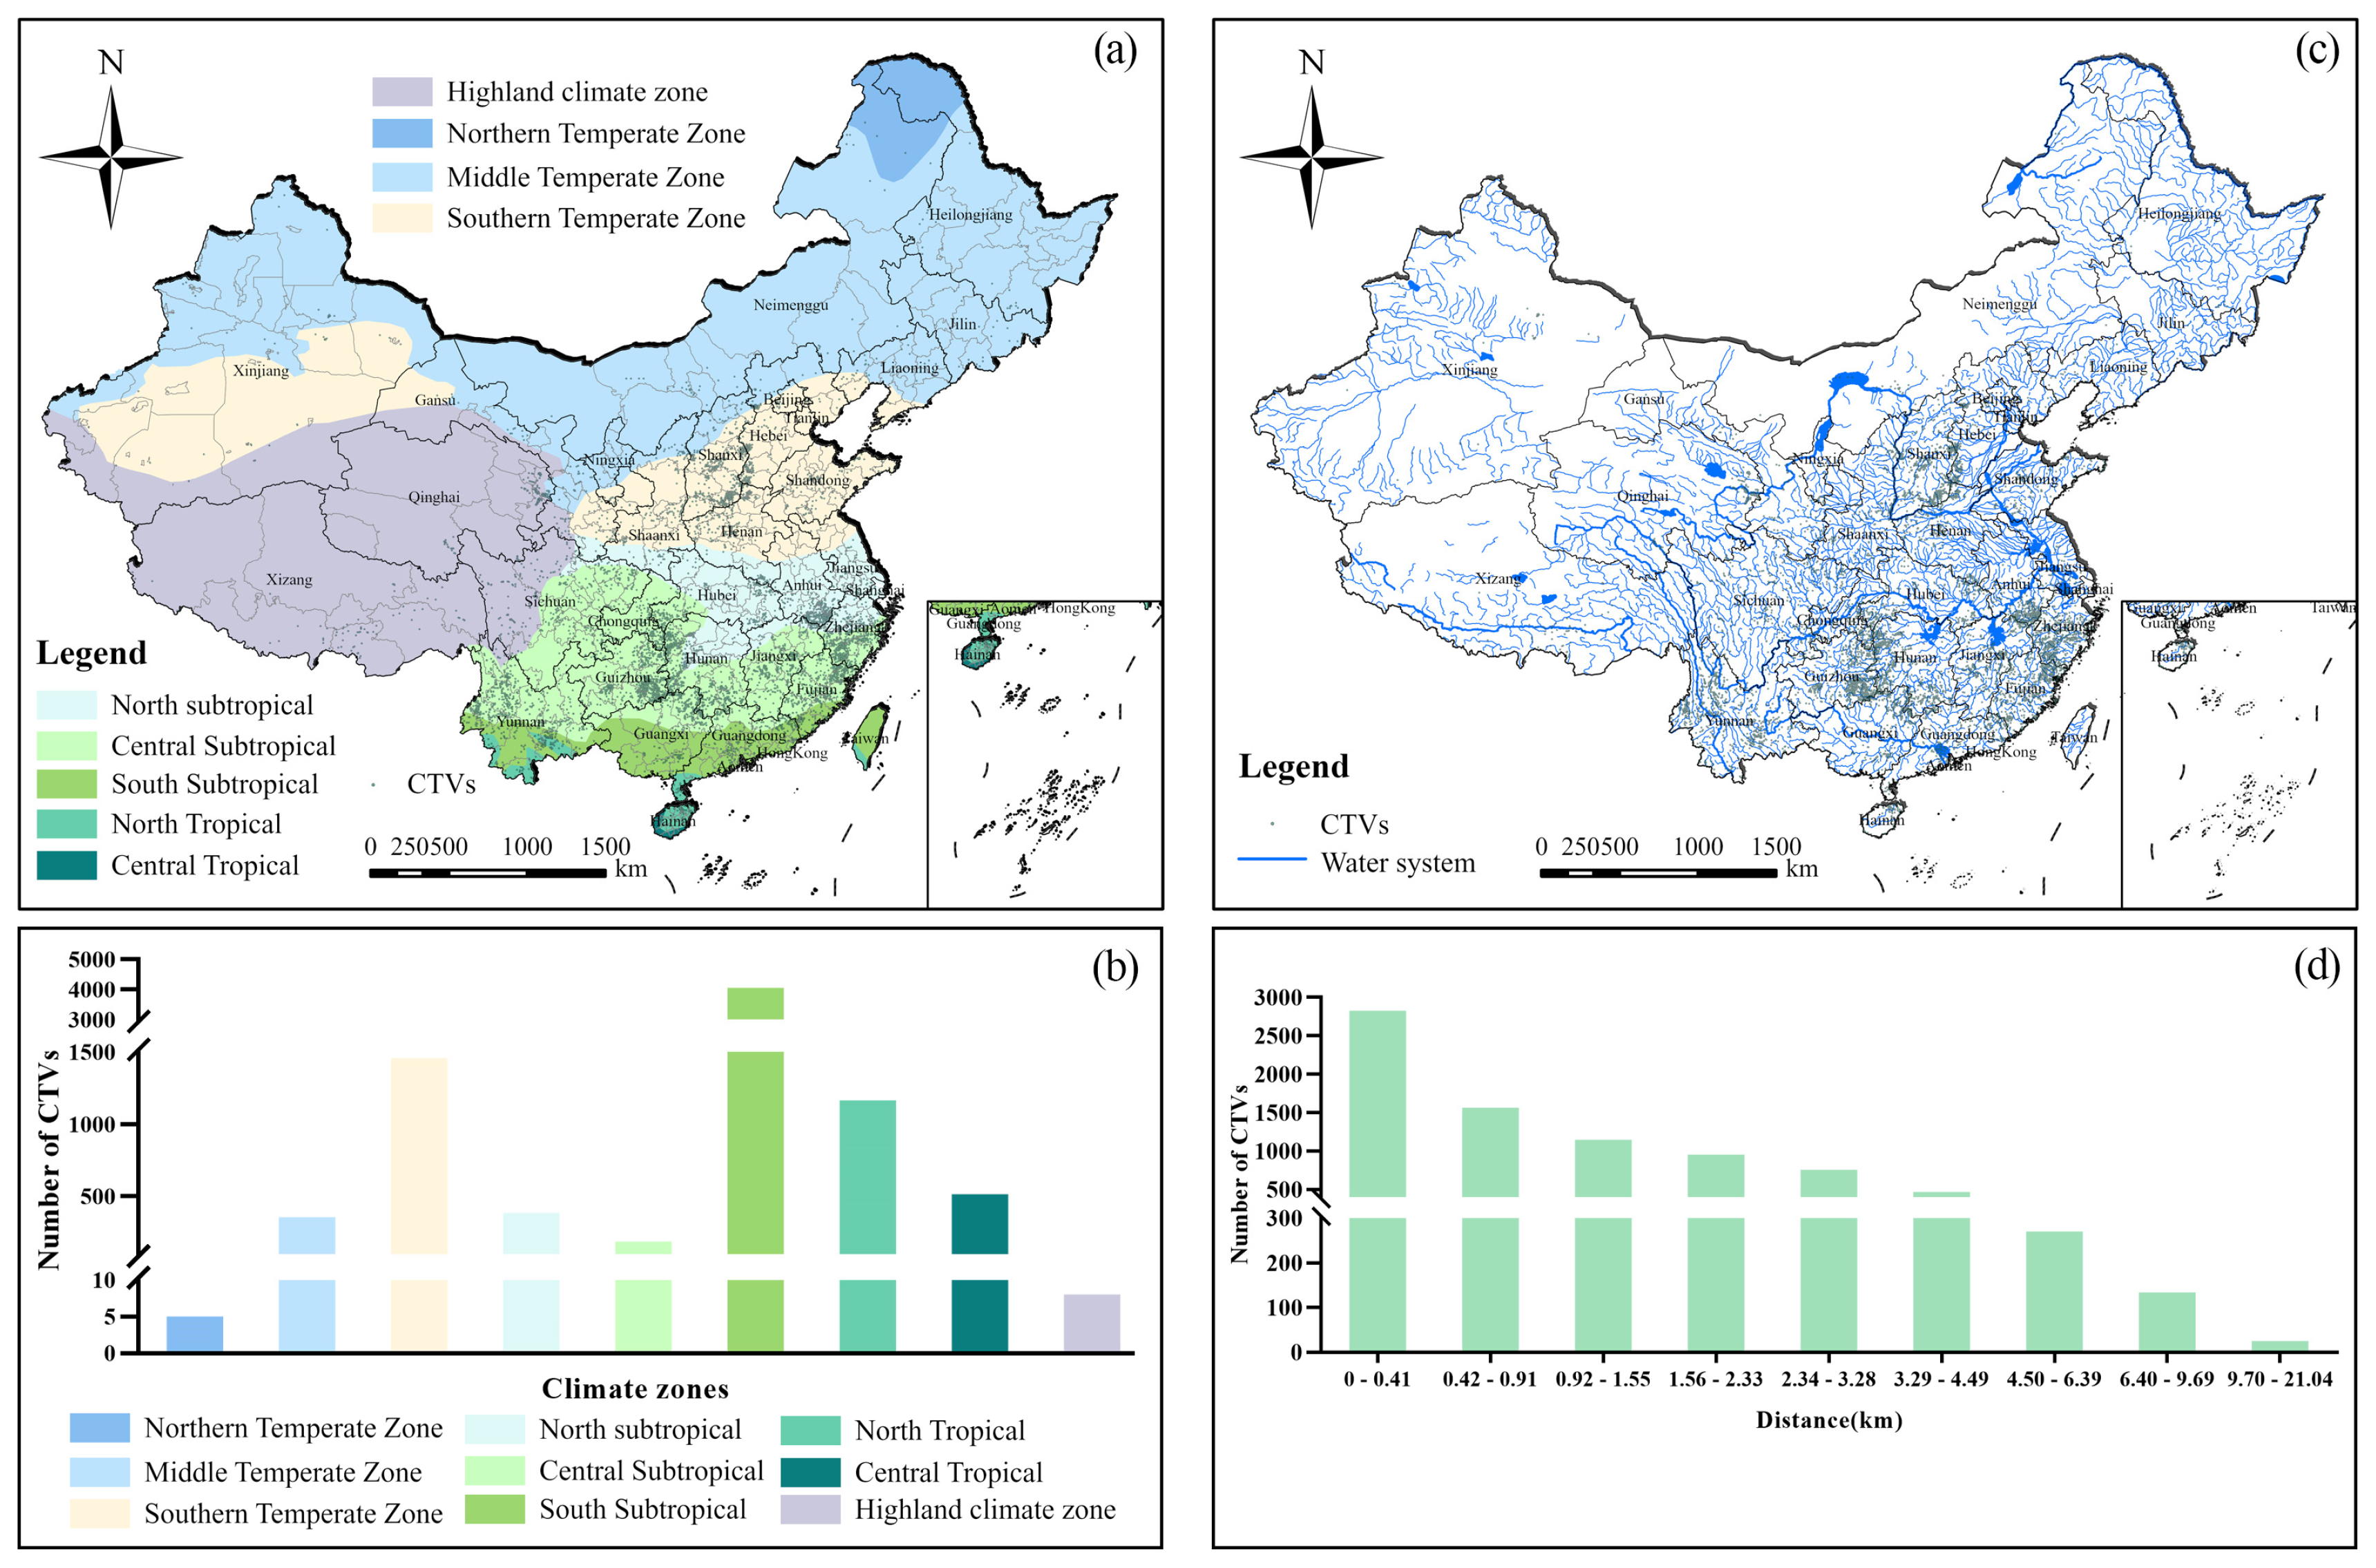
4.1.2. Climate Zone and Water System
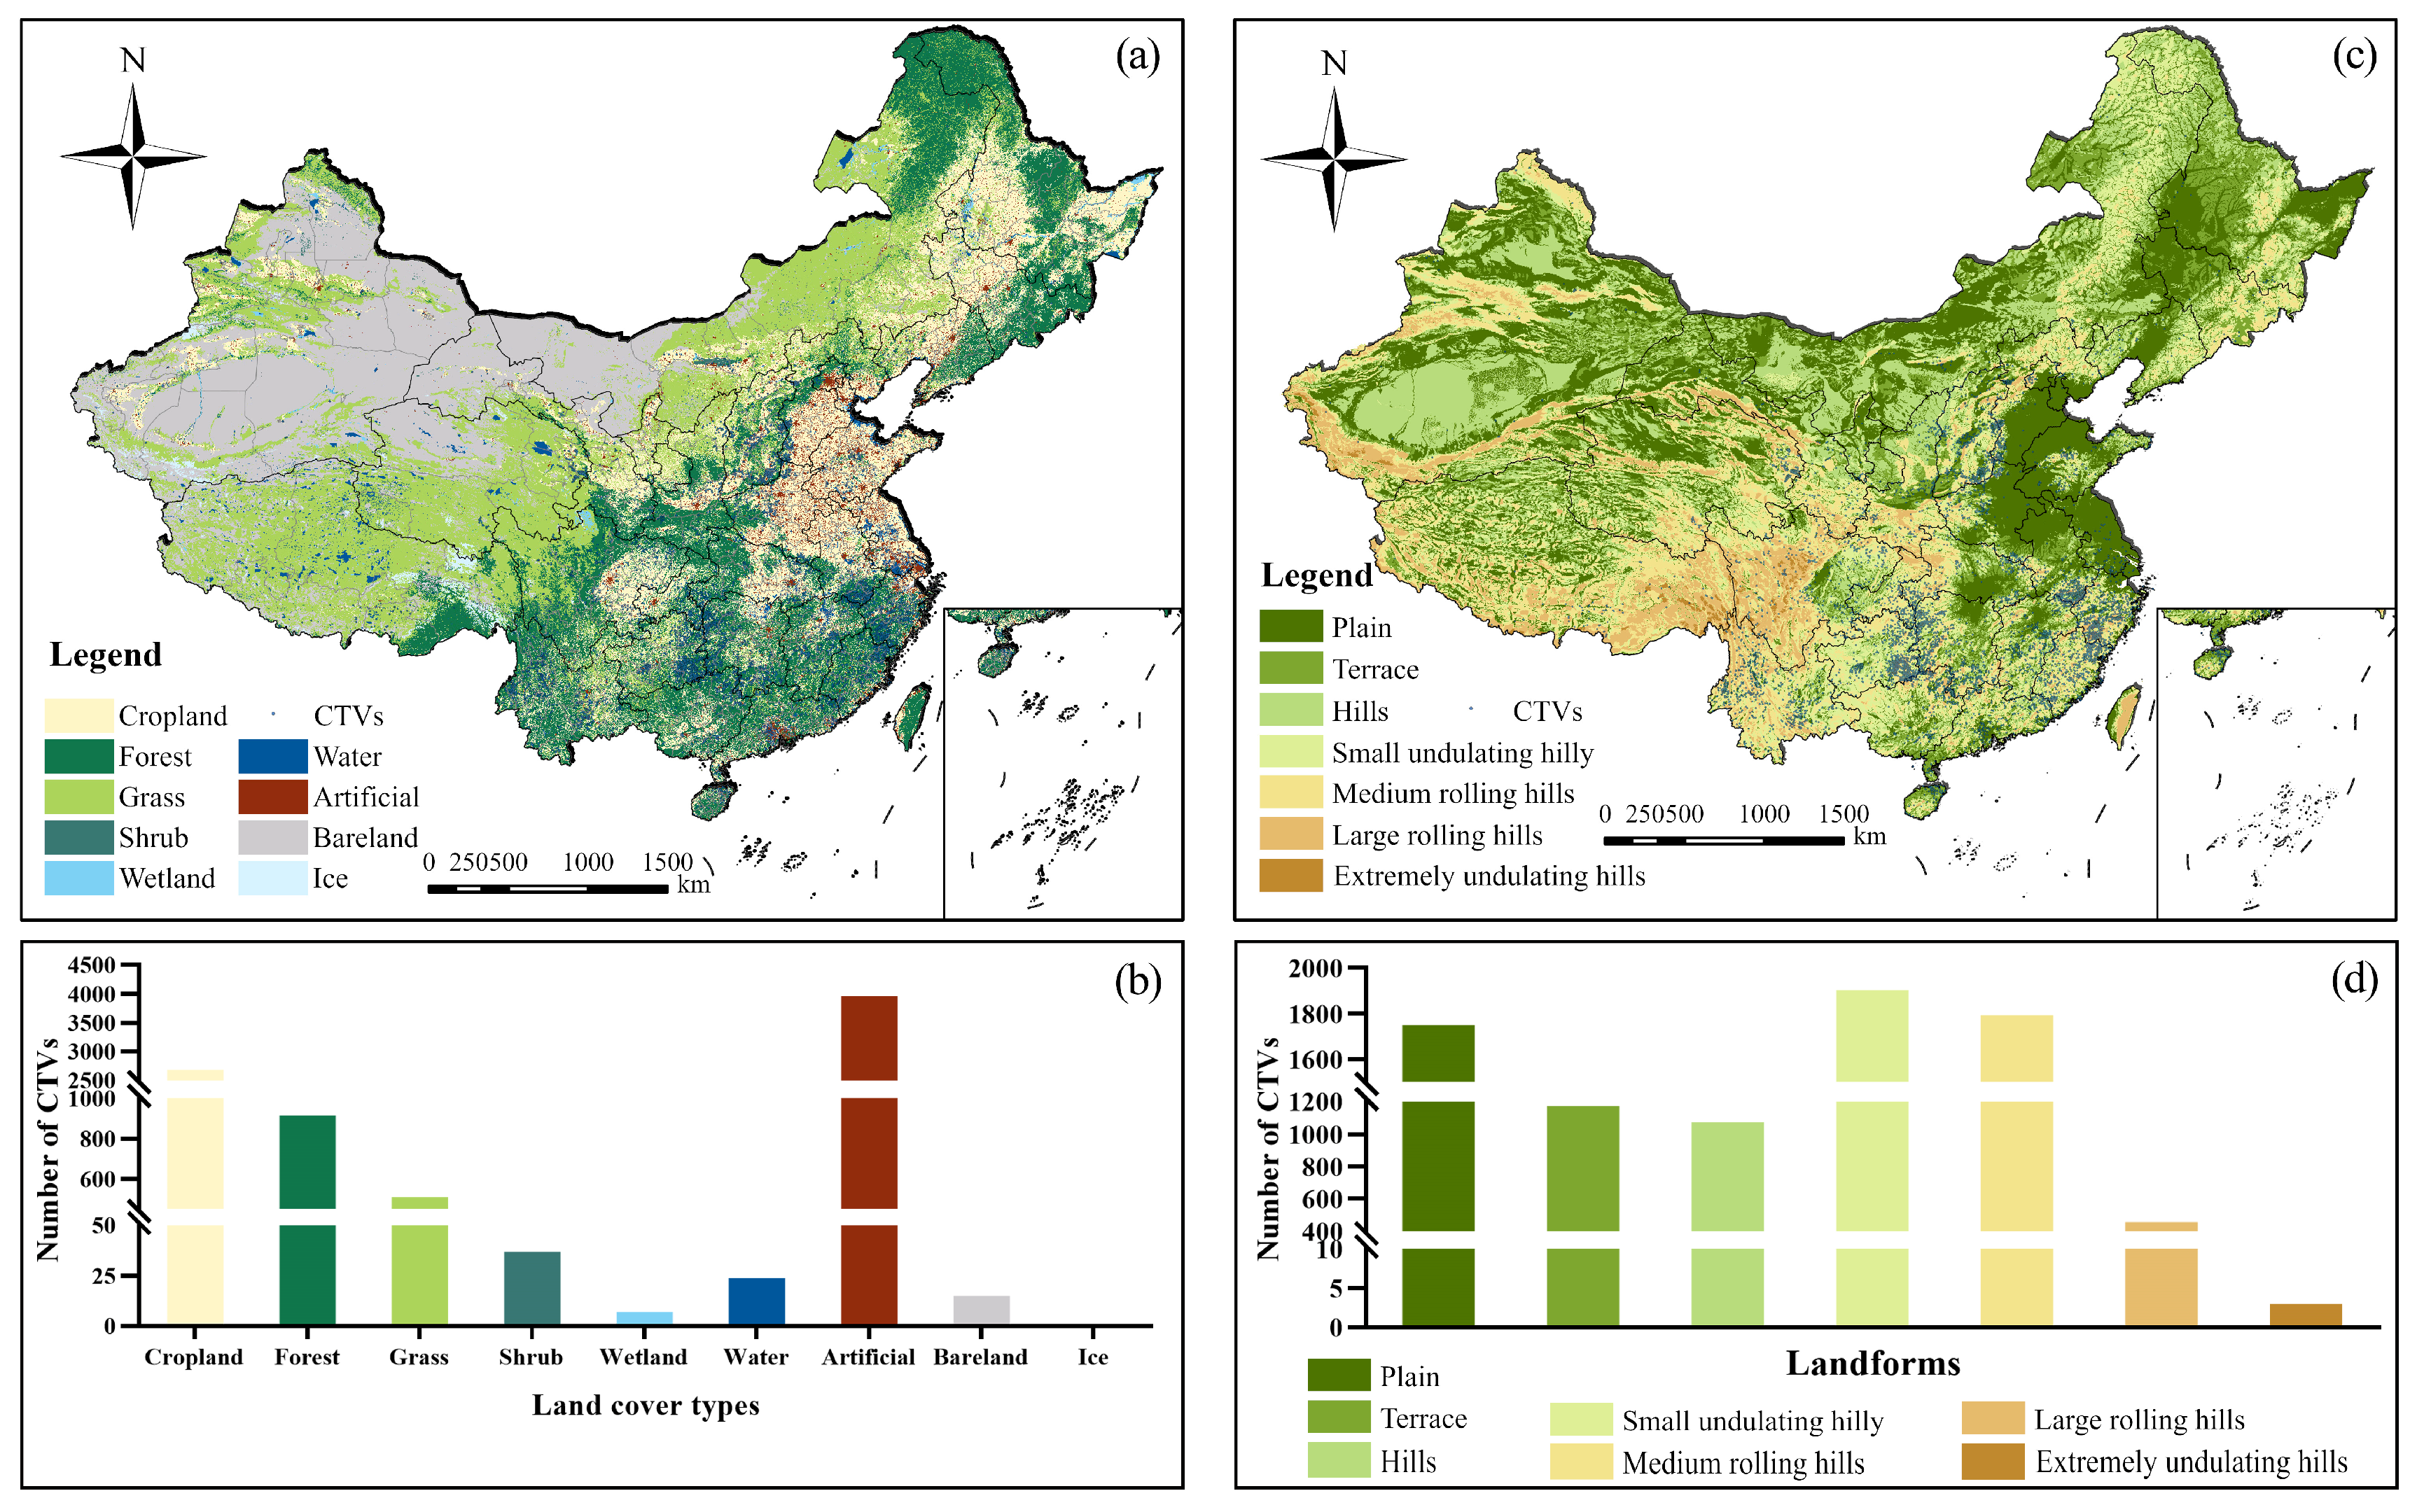
4.1.3. Land Cover Types and Landforms
4.2. Space Economy
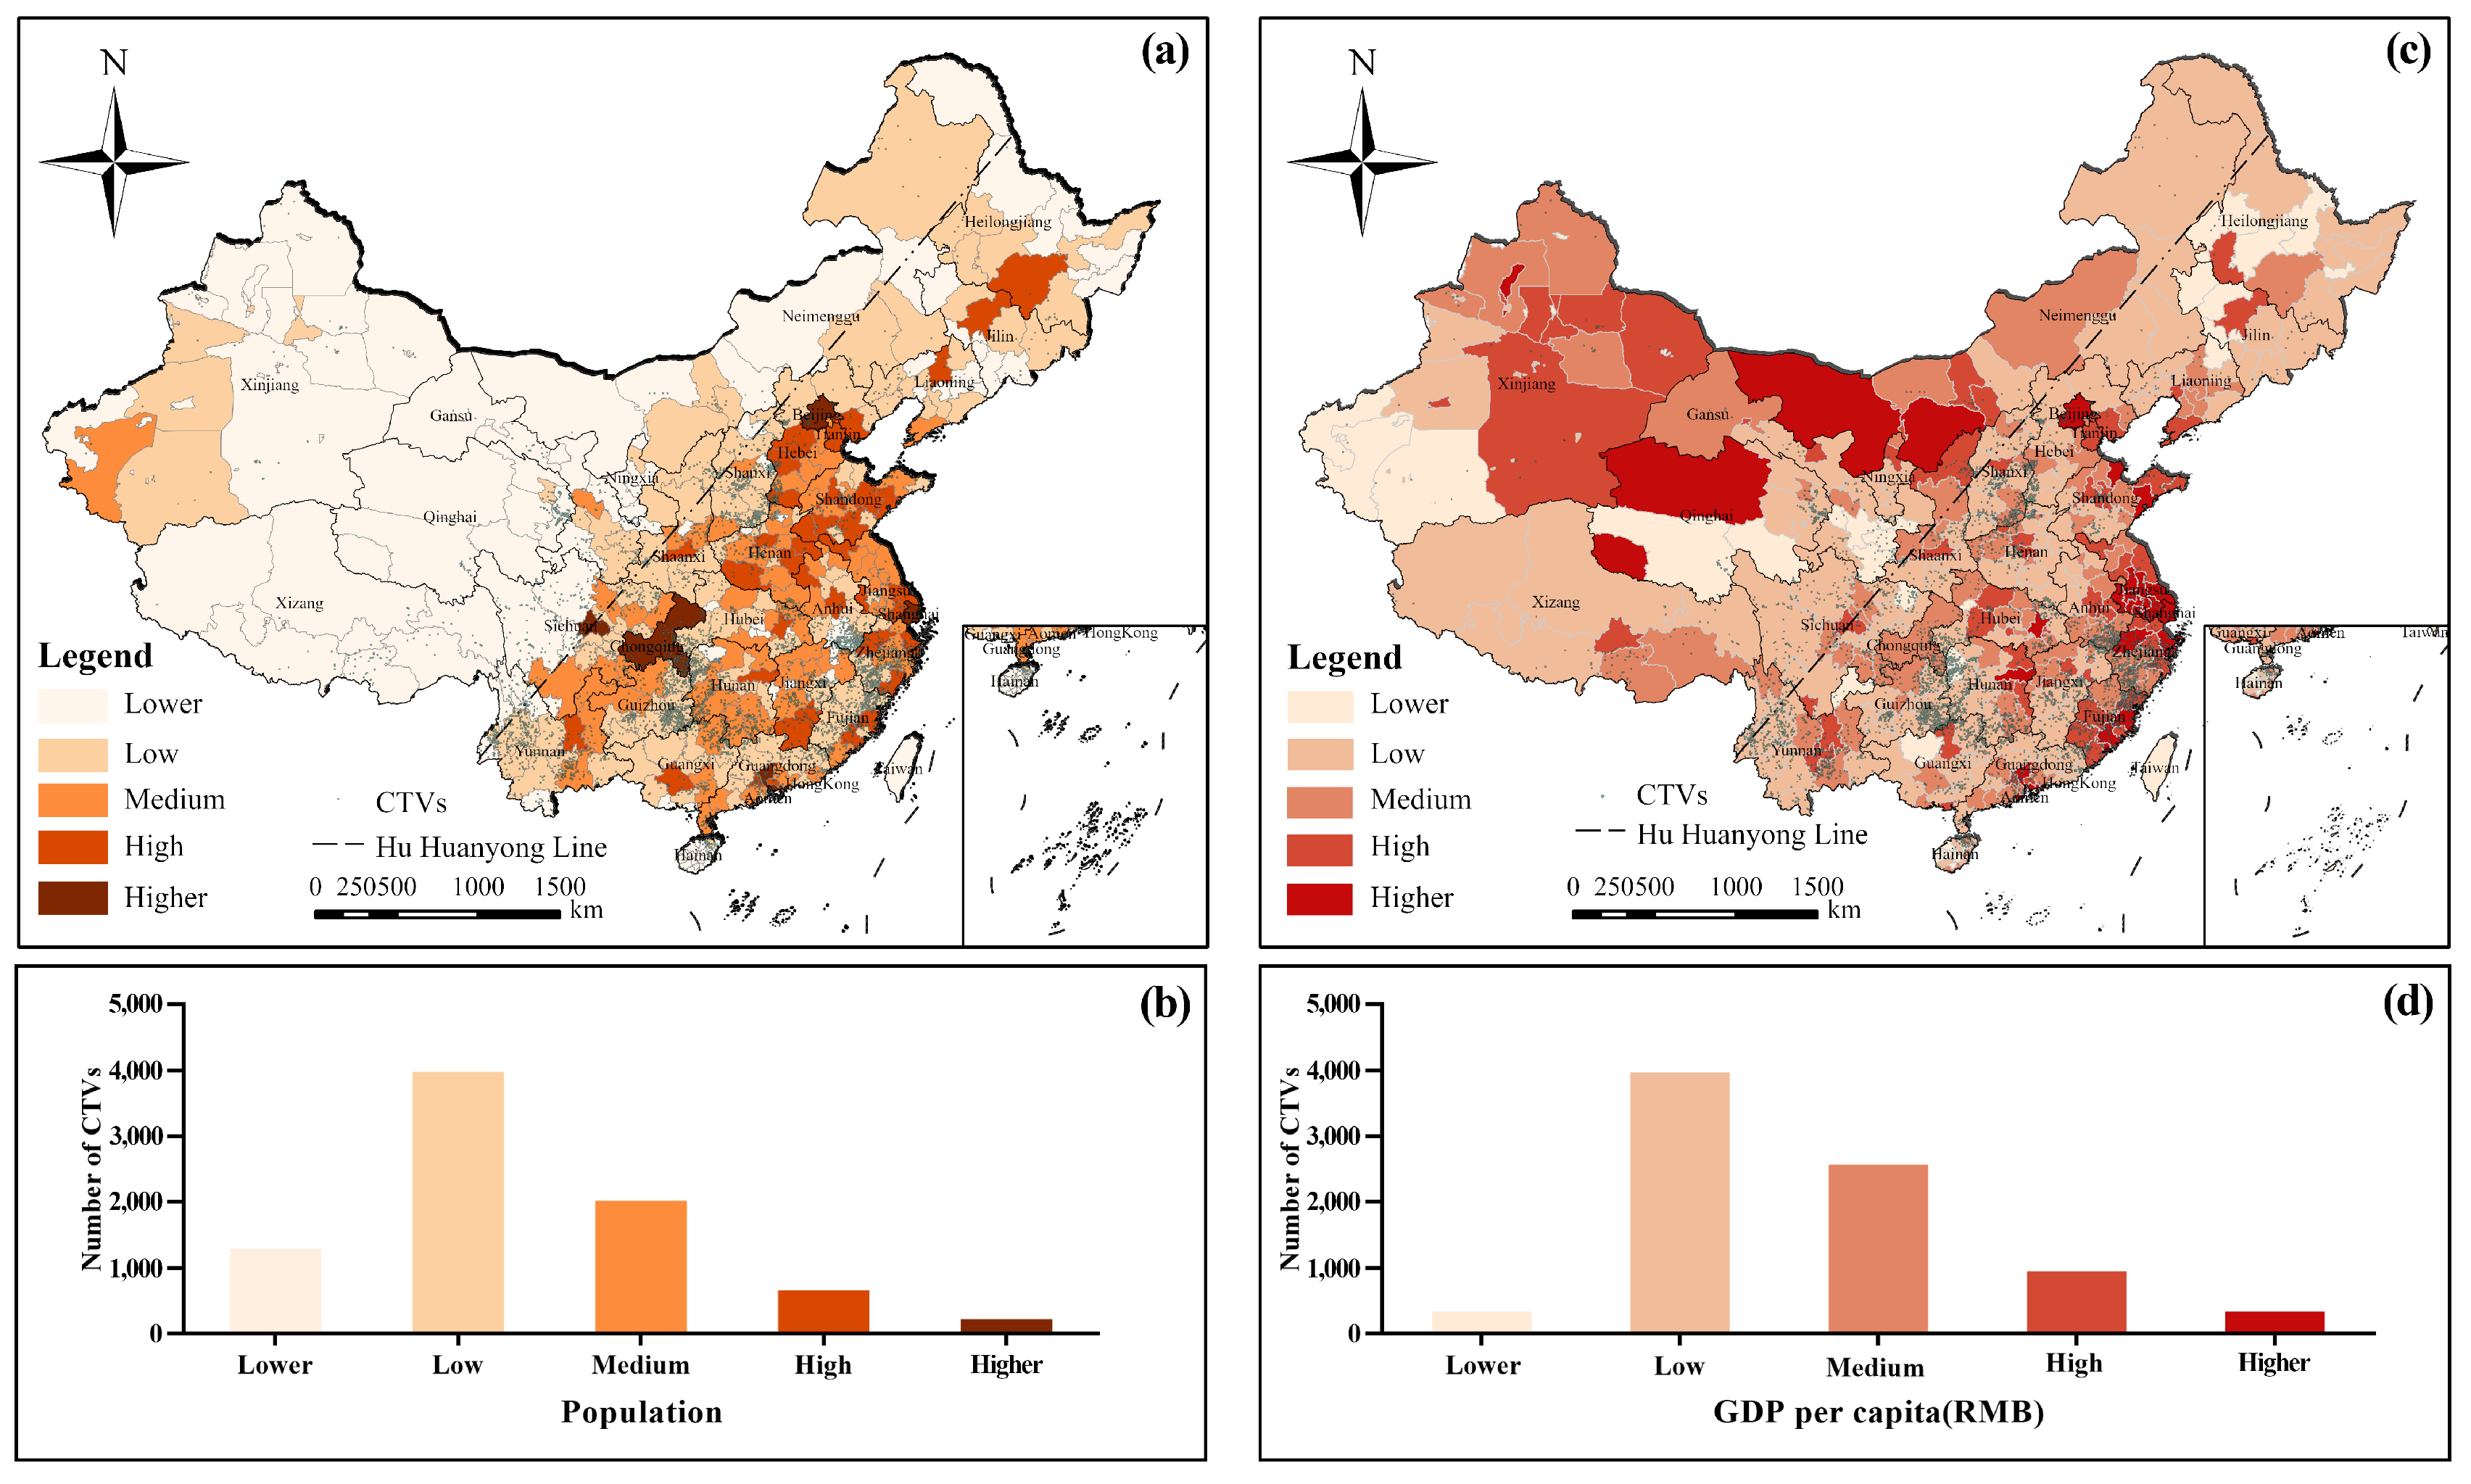
4.2.1. Population and GDP per Capita
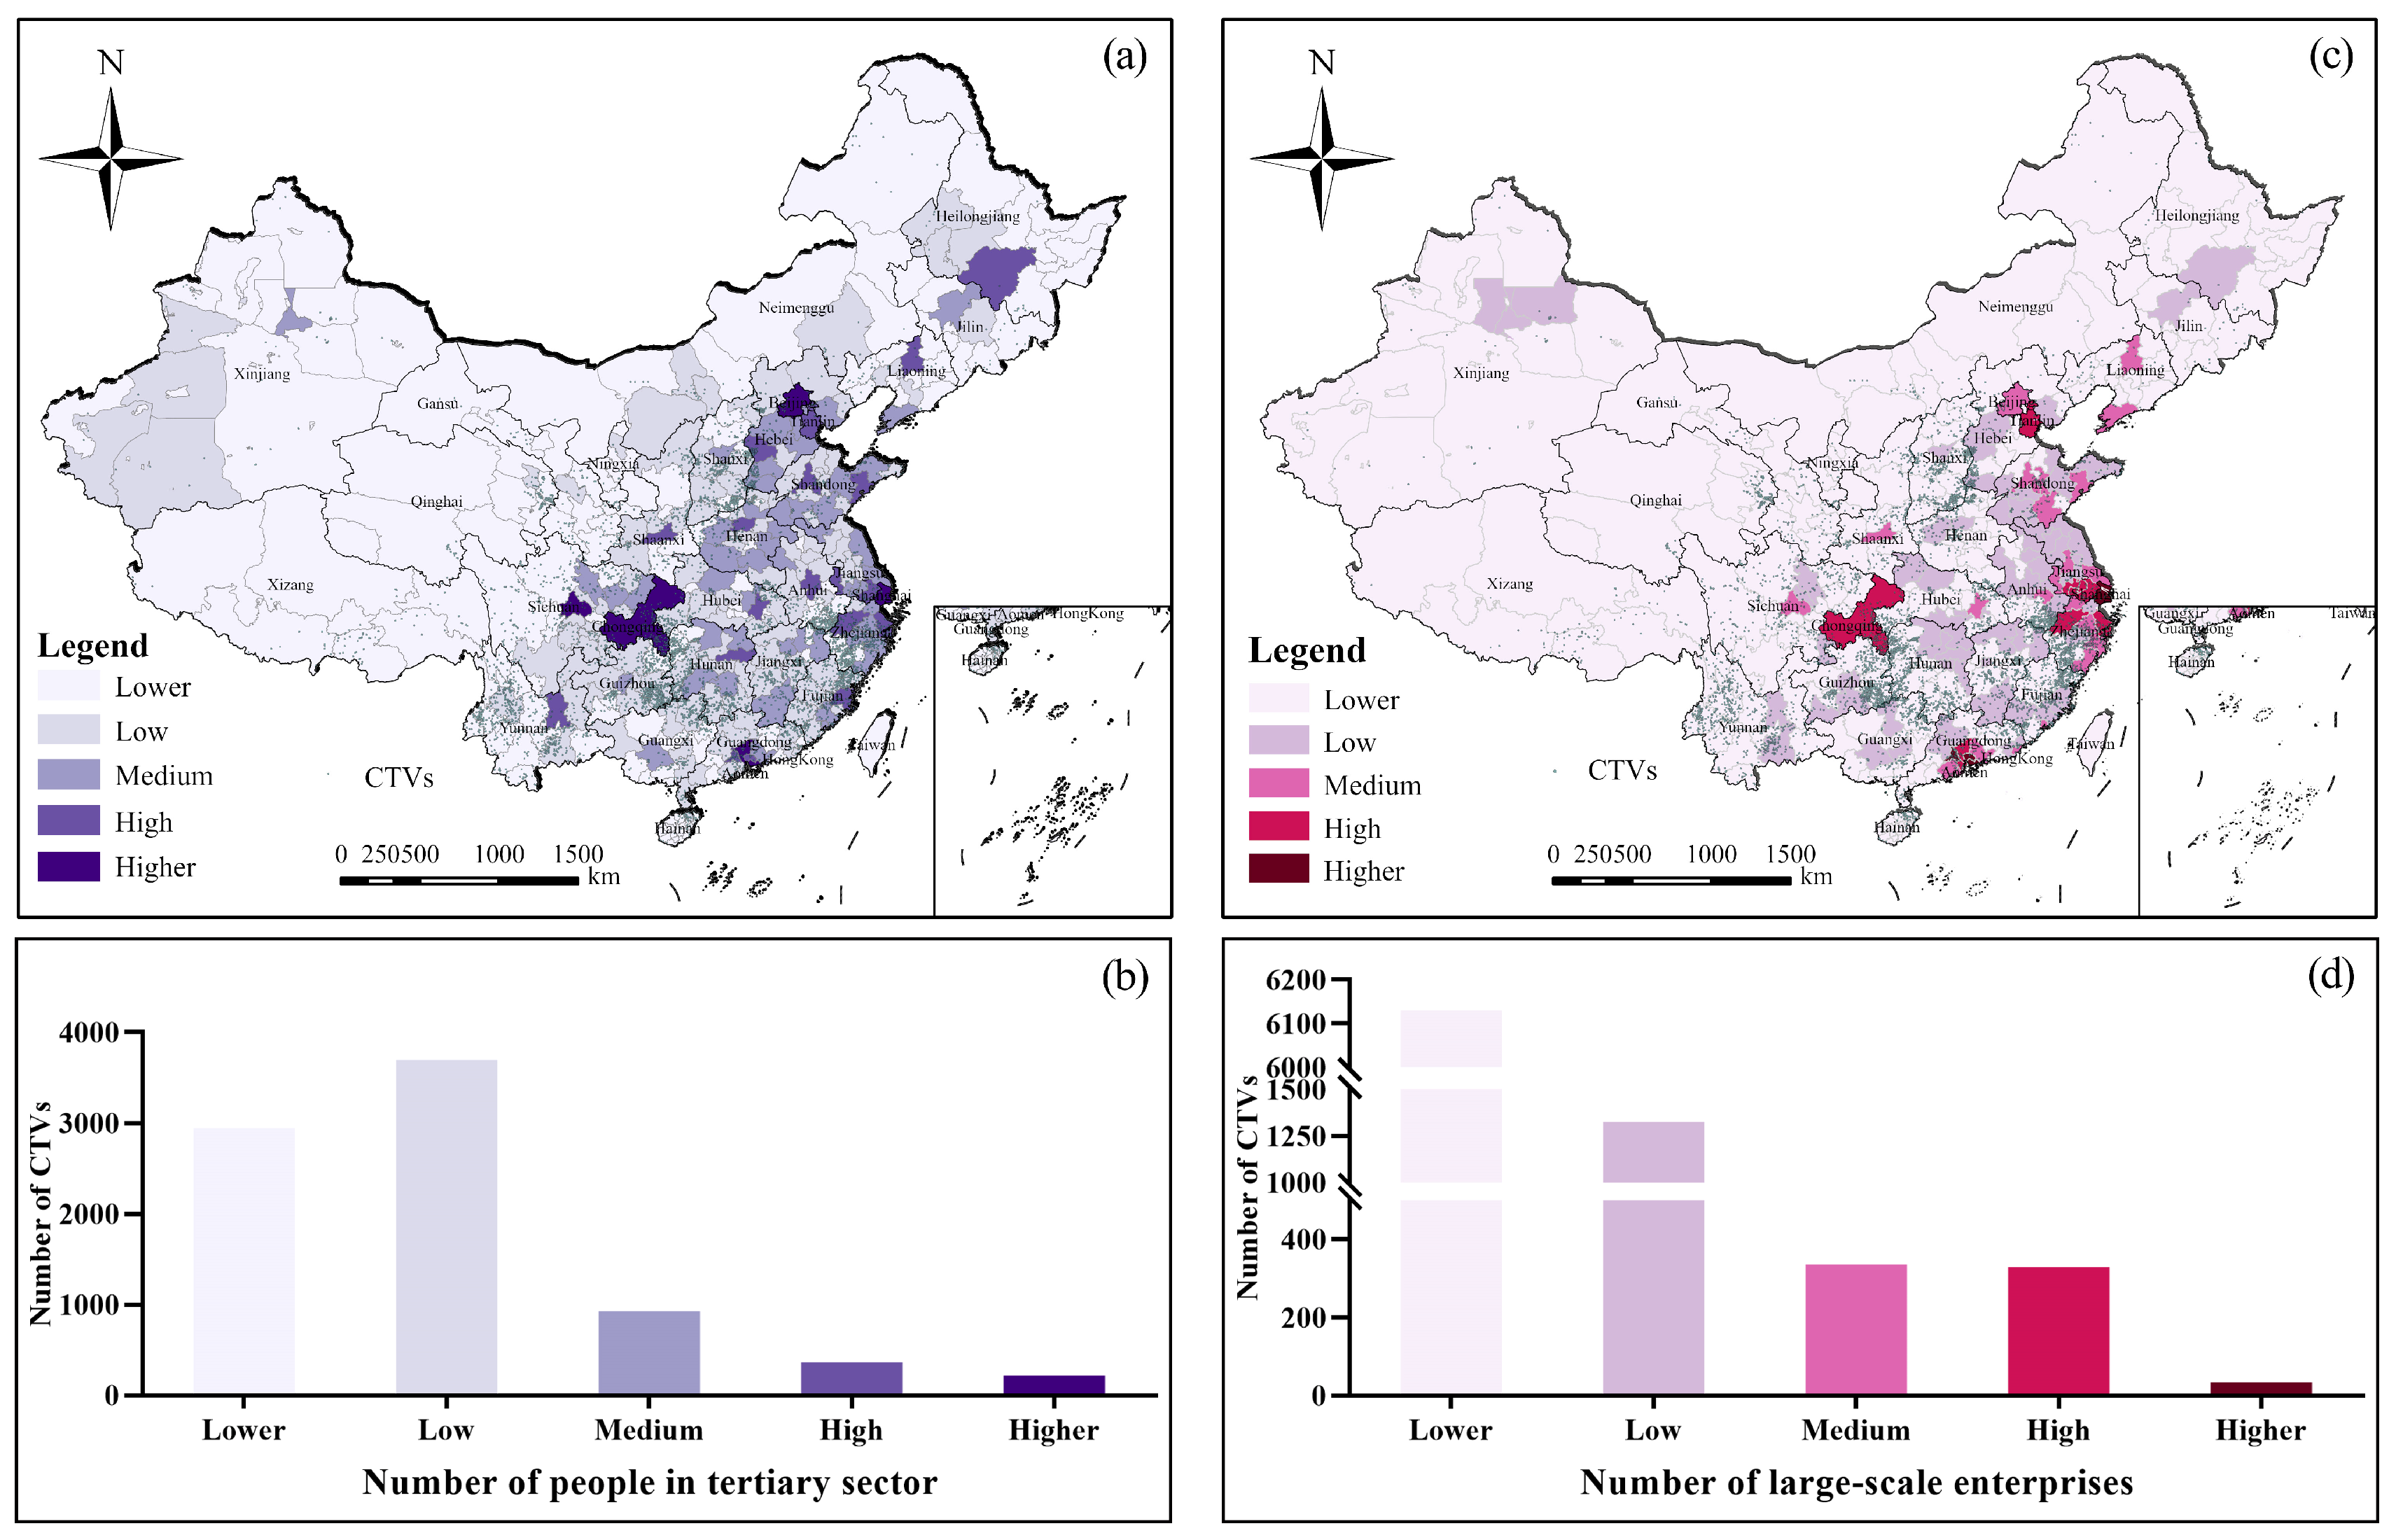
4.2.2. Industry
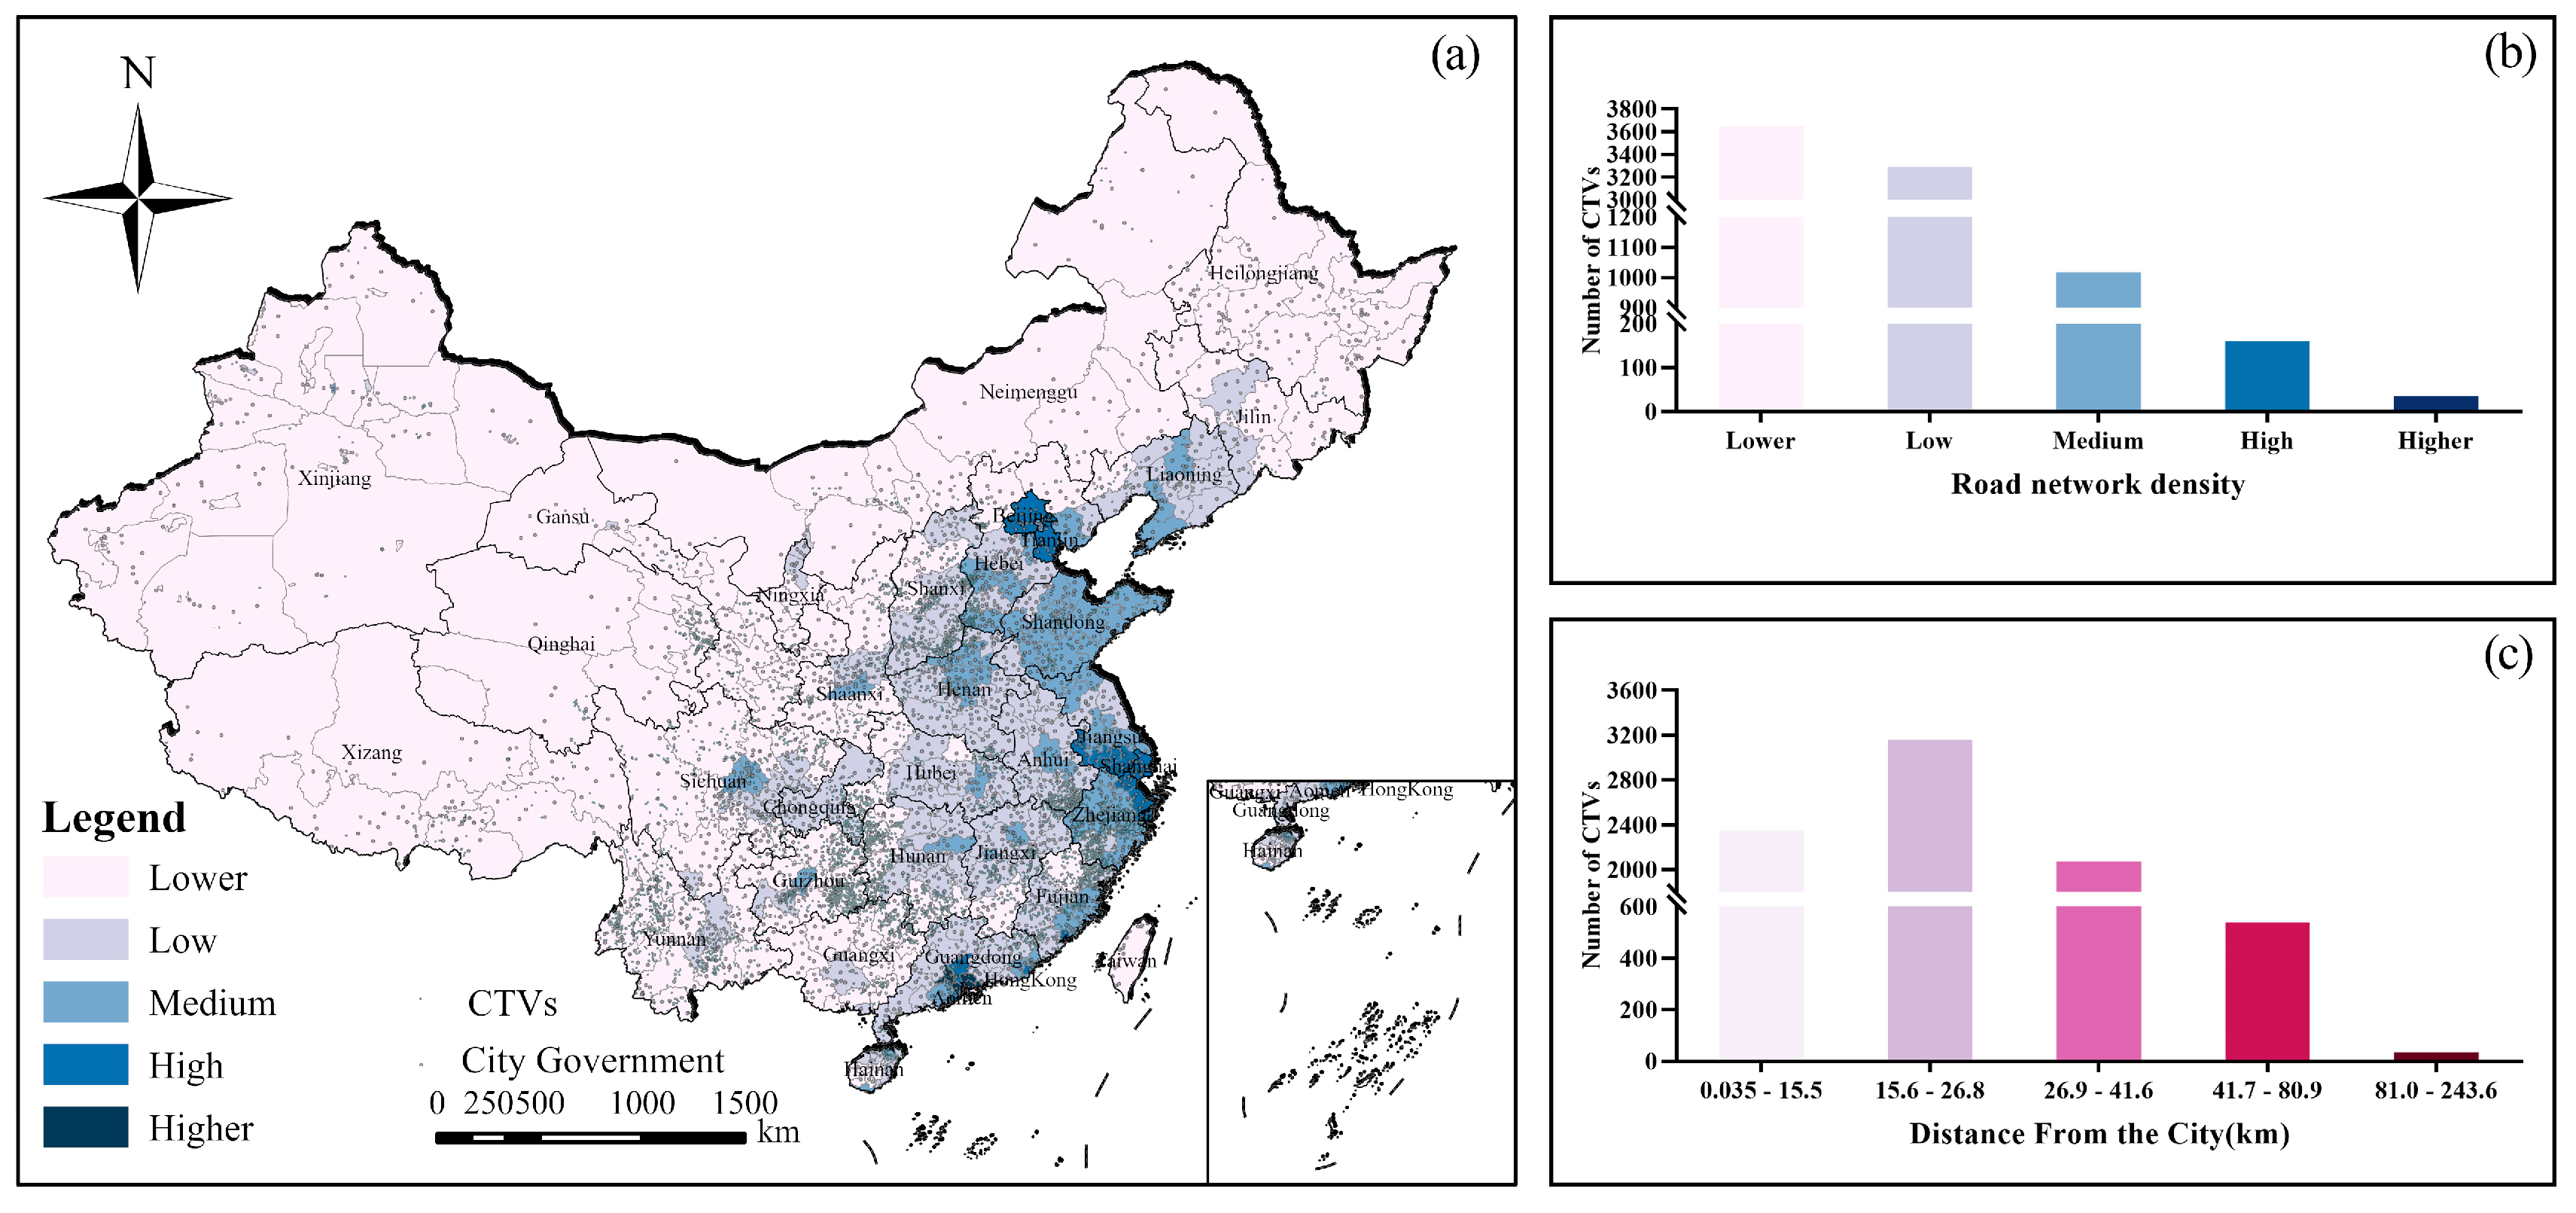
4.2.3. Urbanization and Transportation
4.3. Social Culture
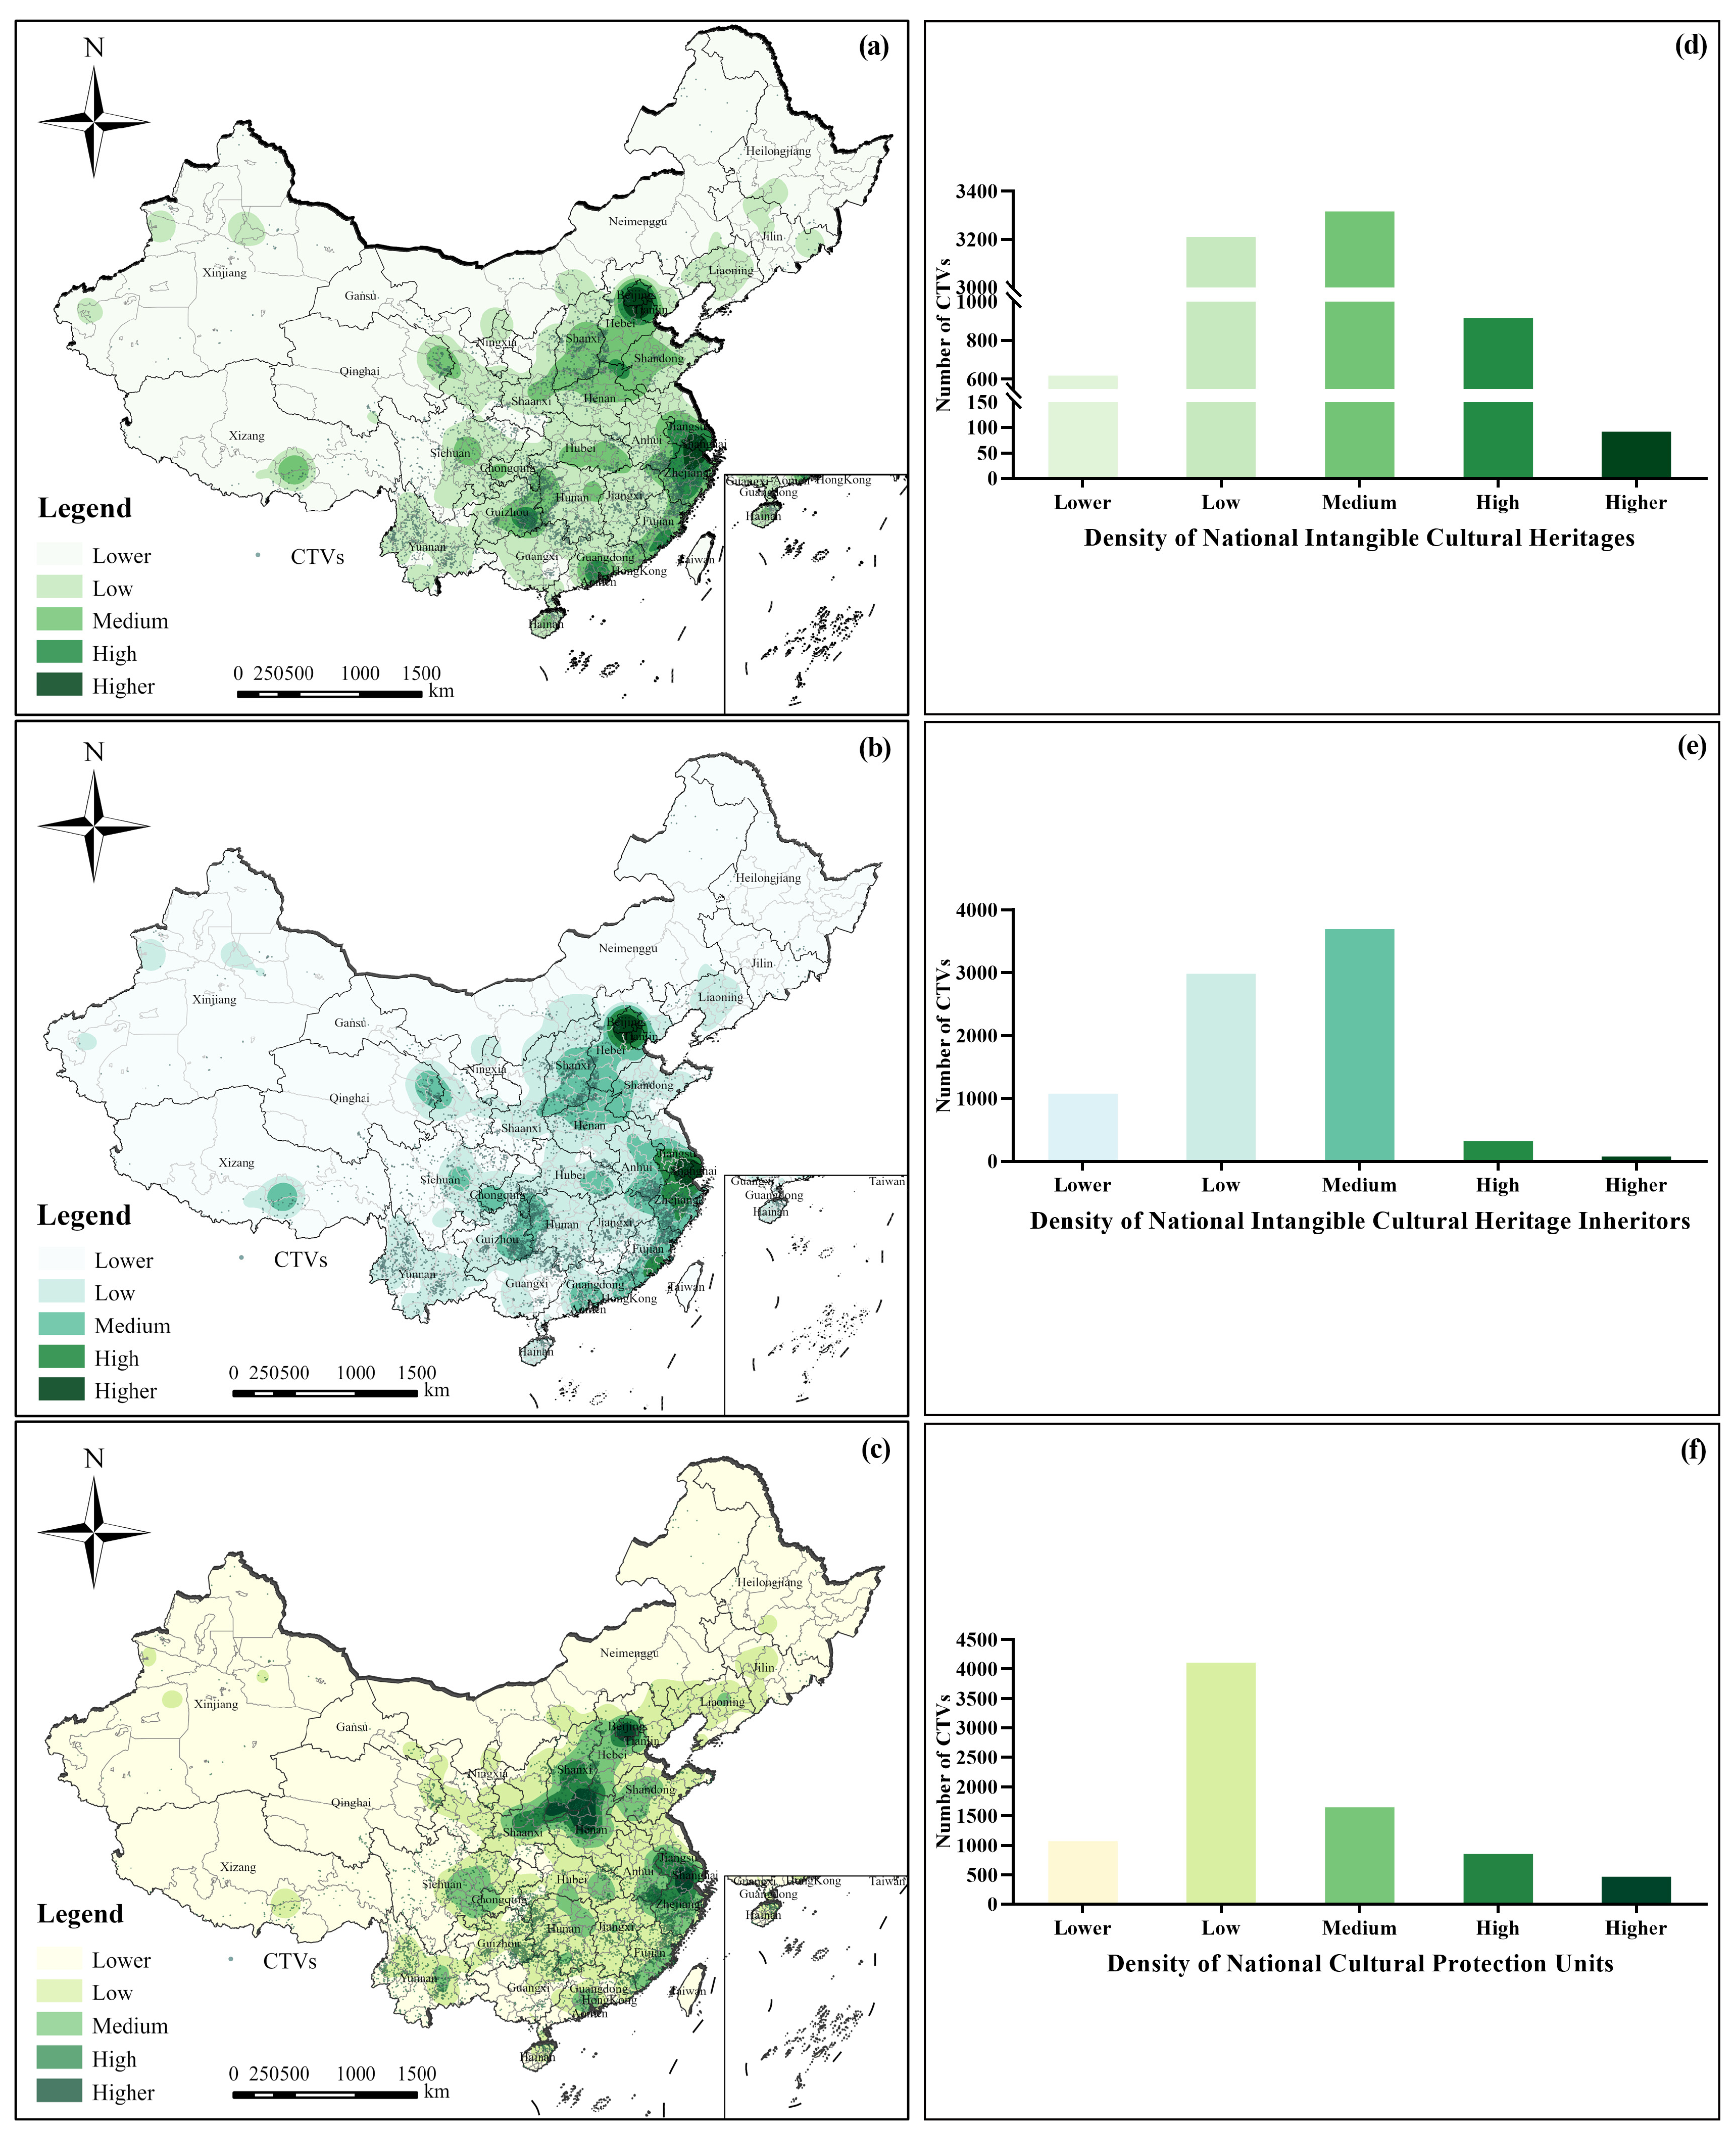
4.3.1. Cultural Heritage
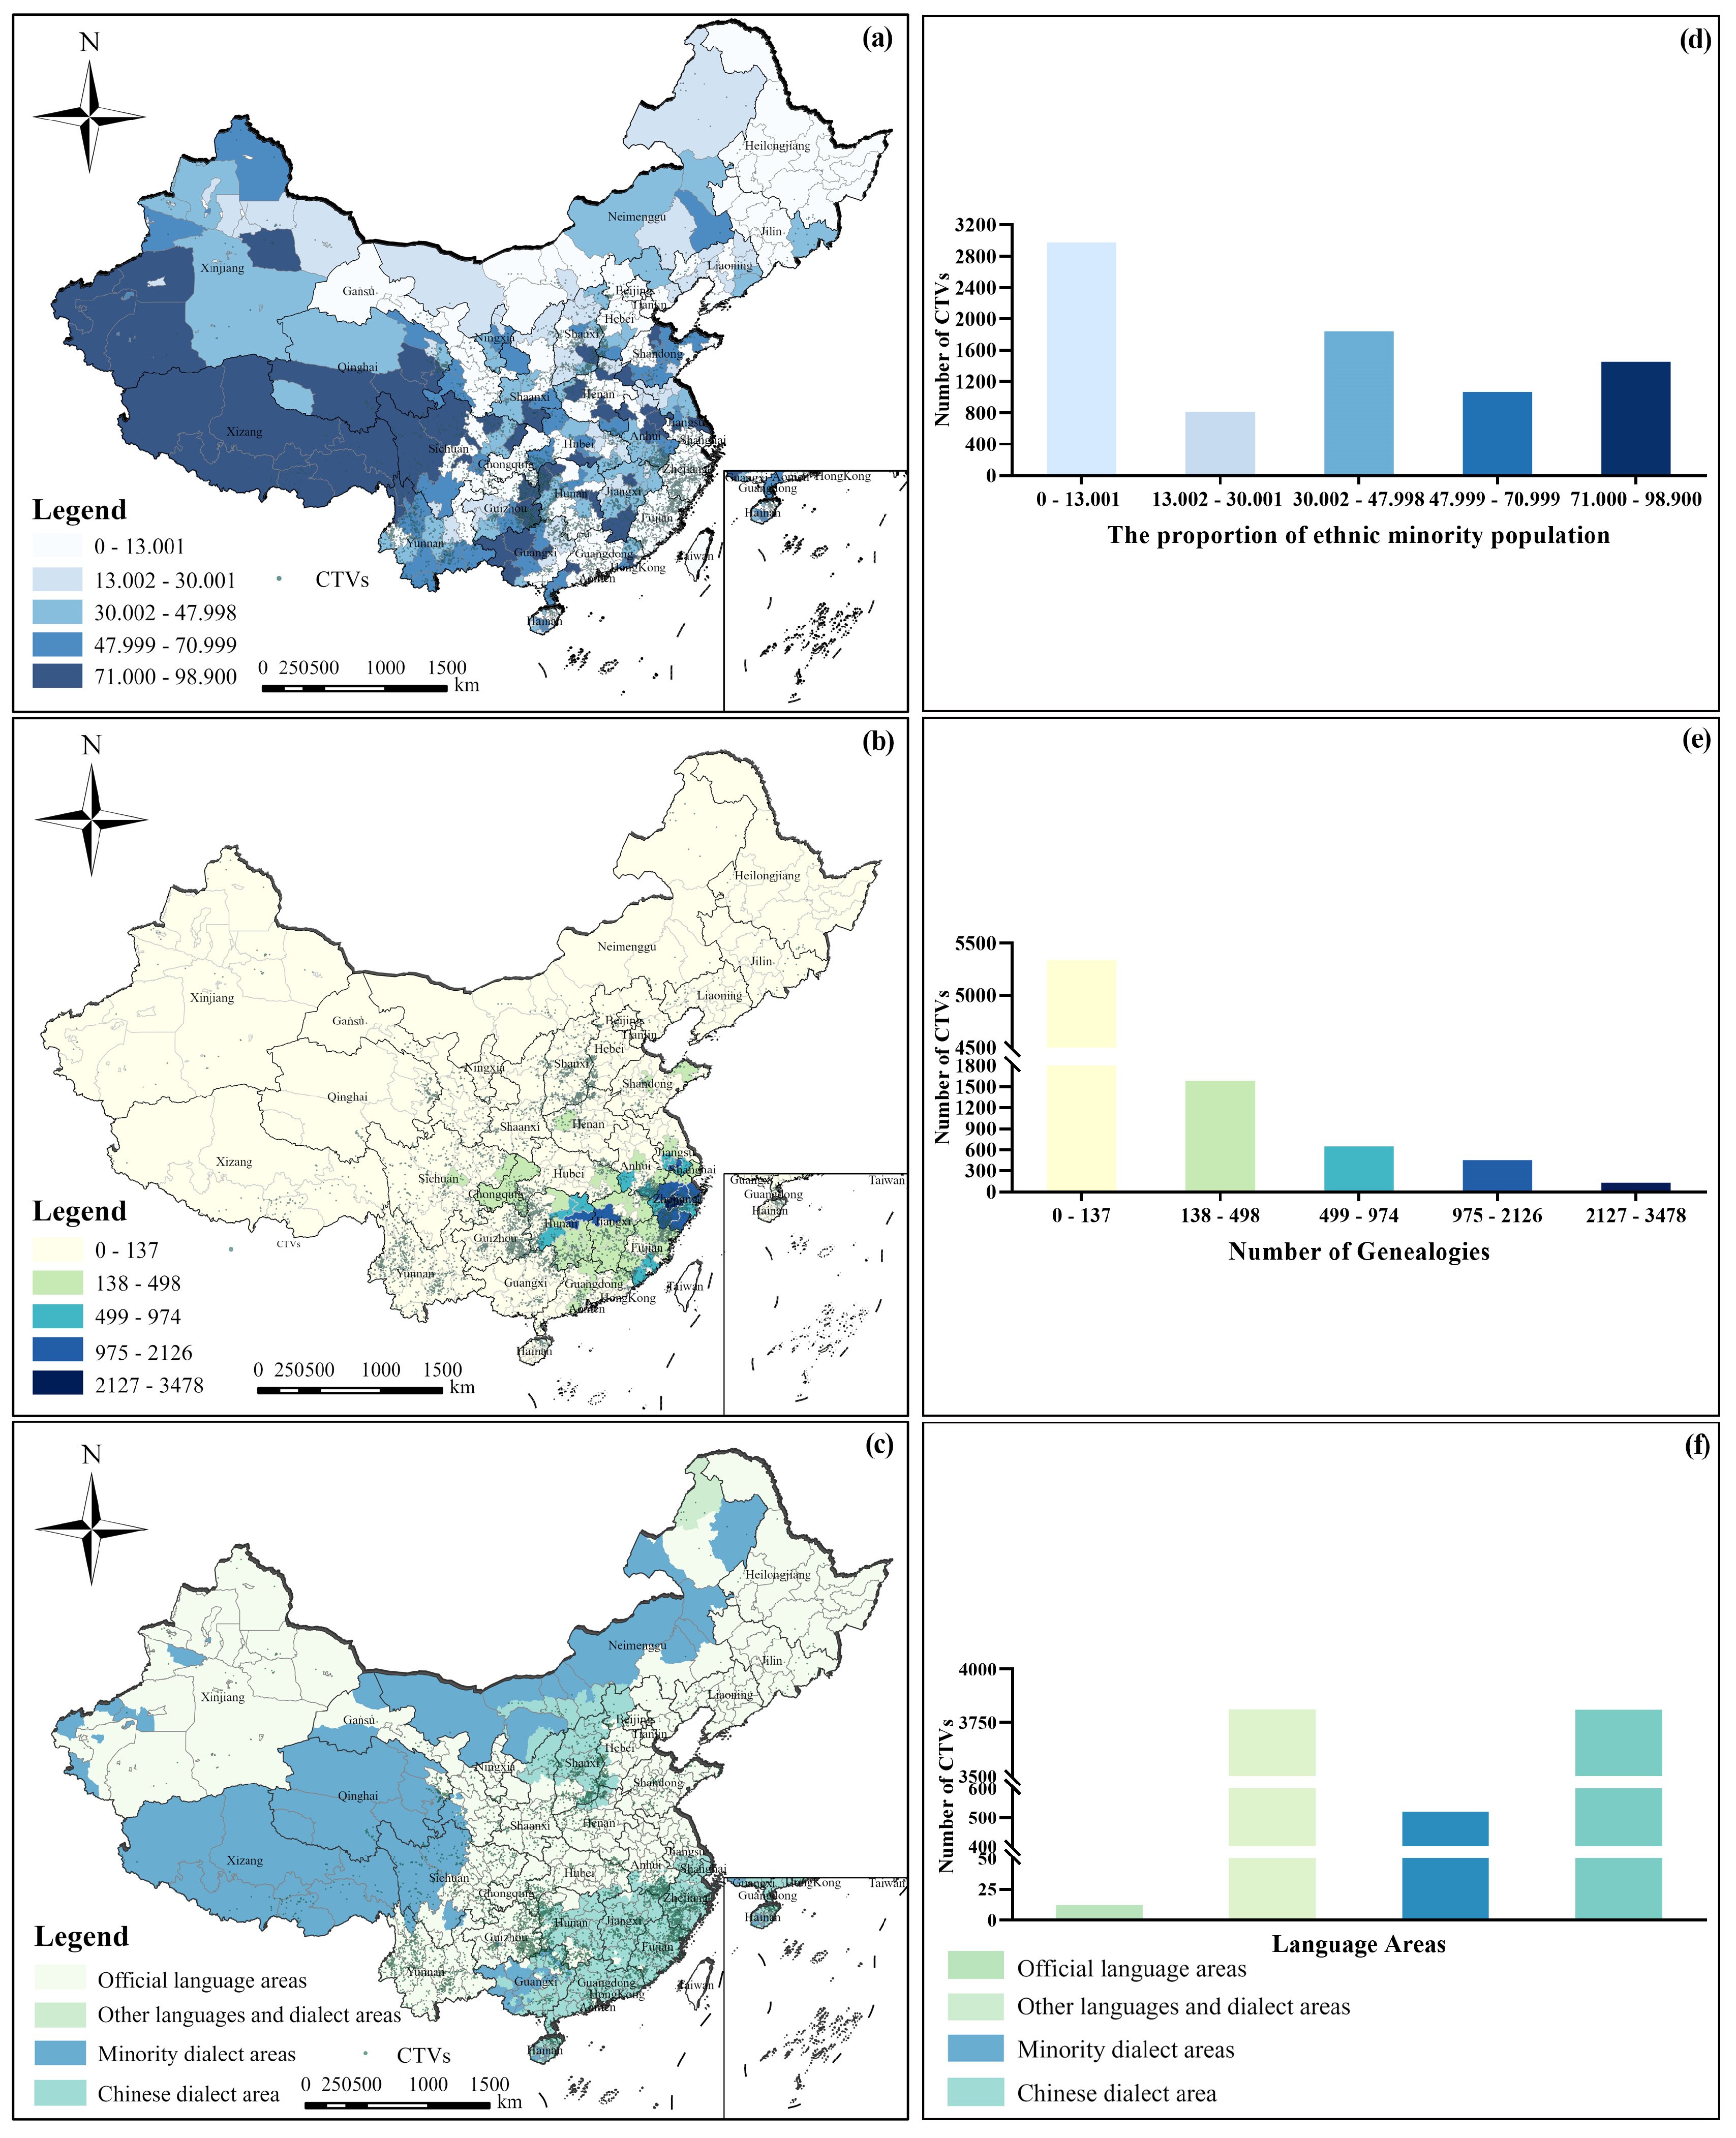
4.3.2. Ethnicity and Language
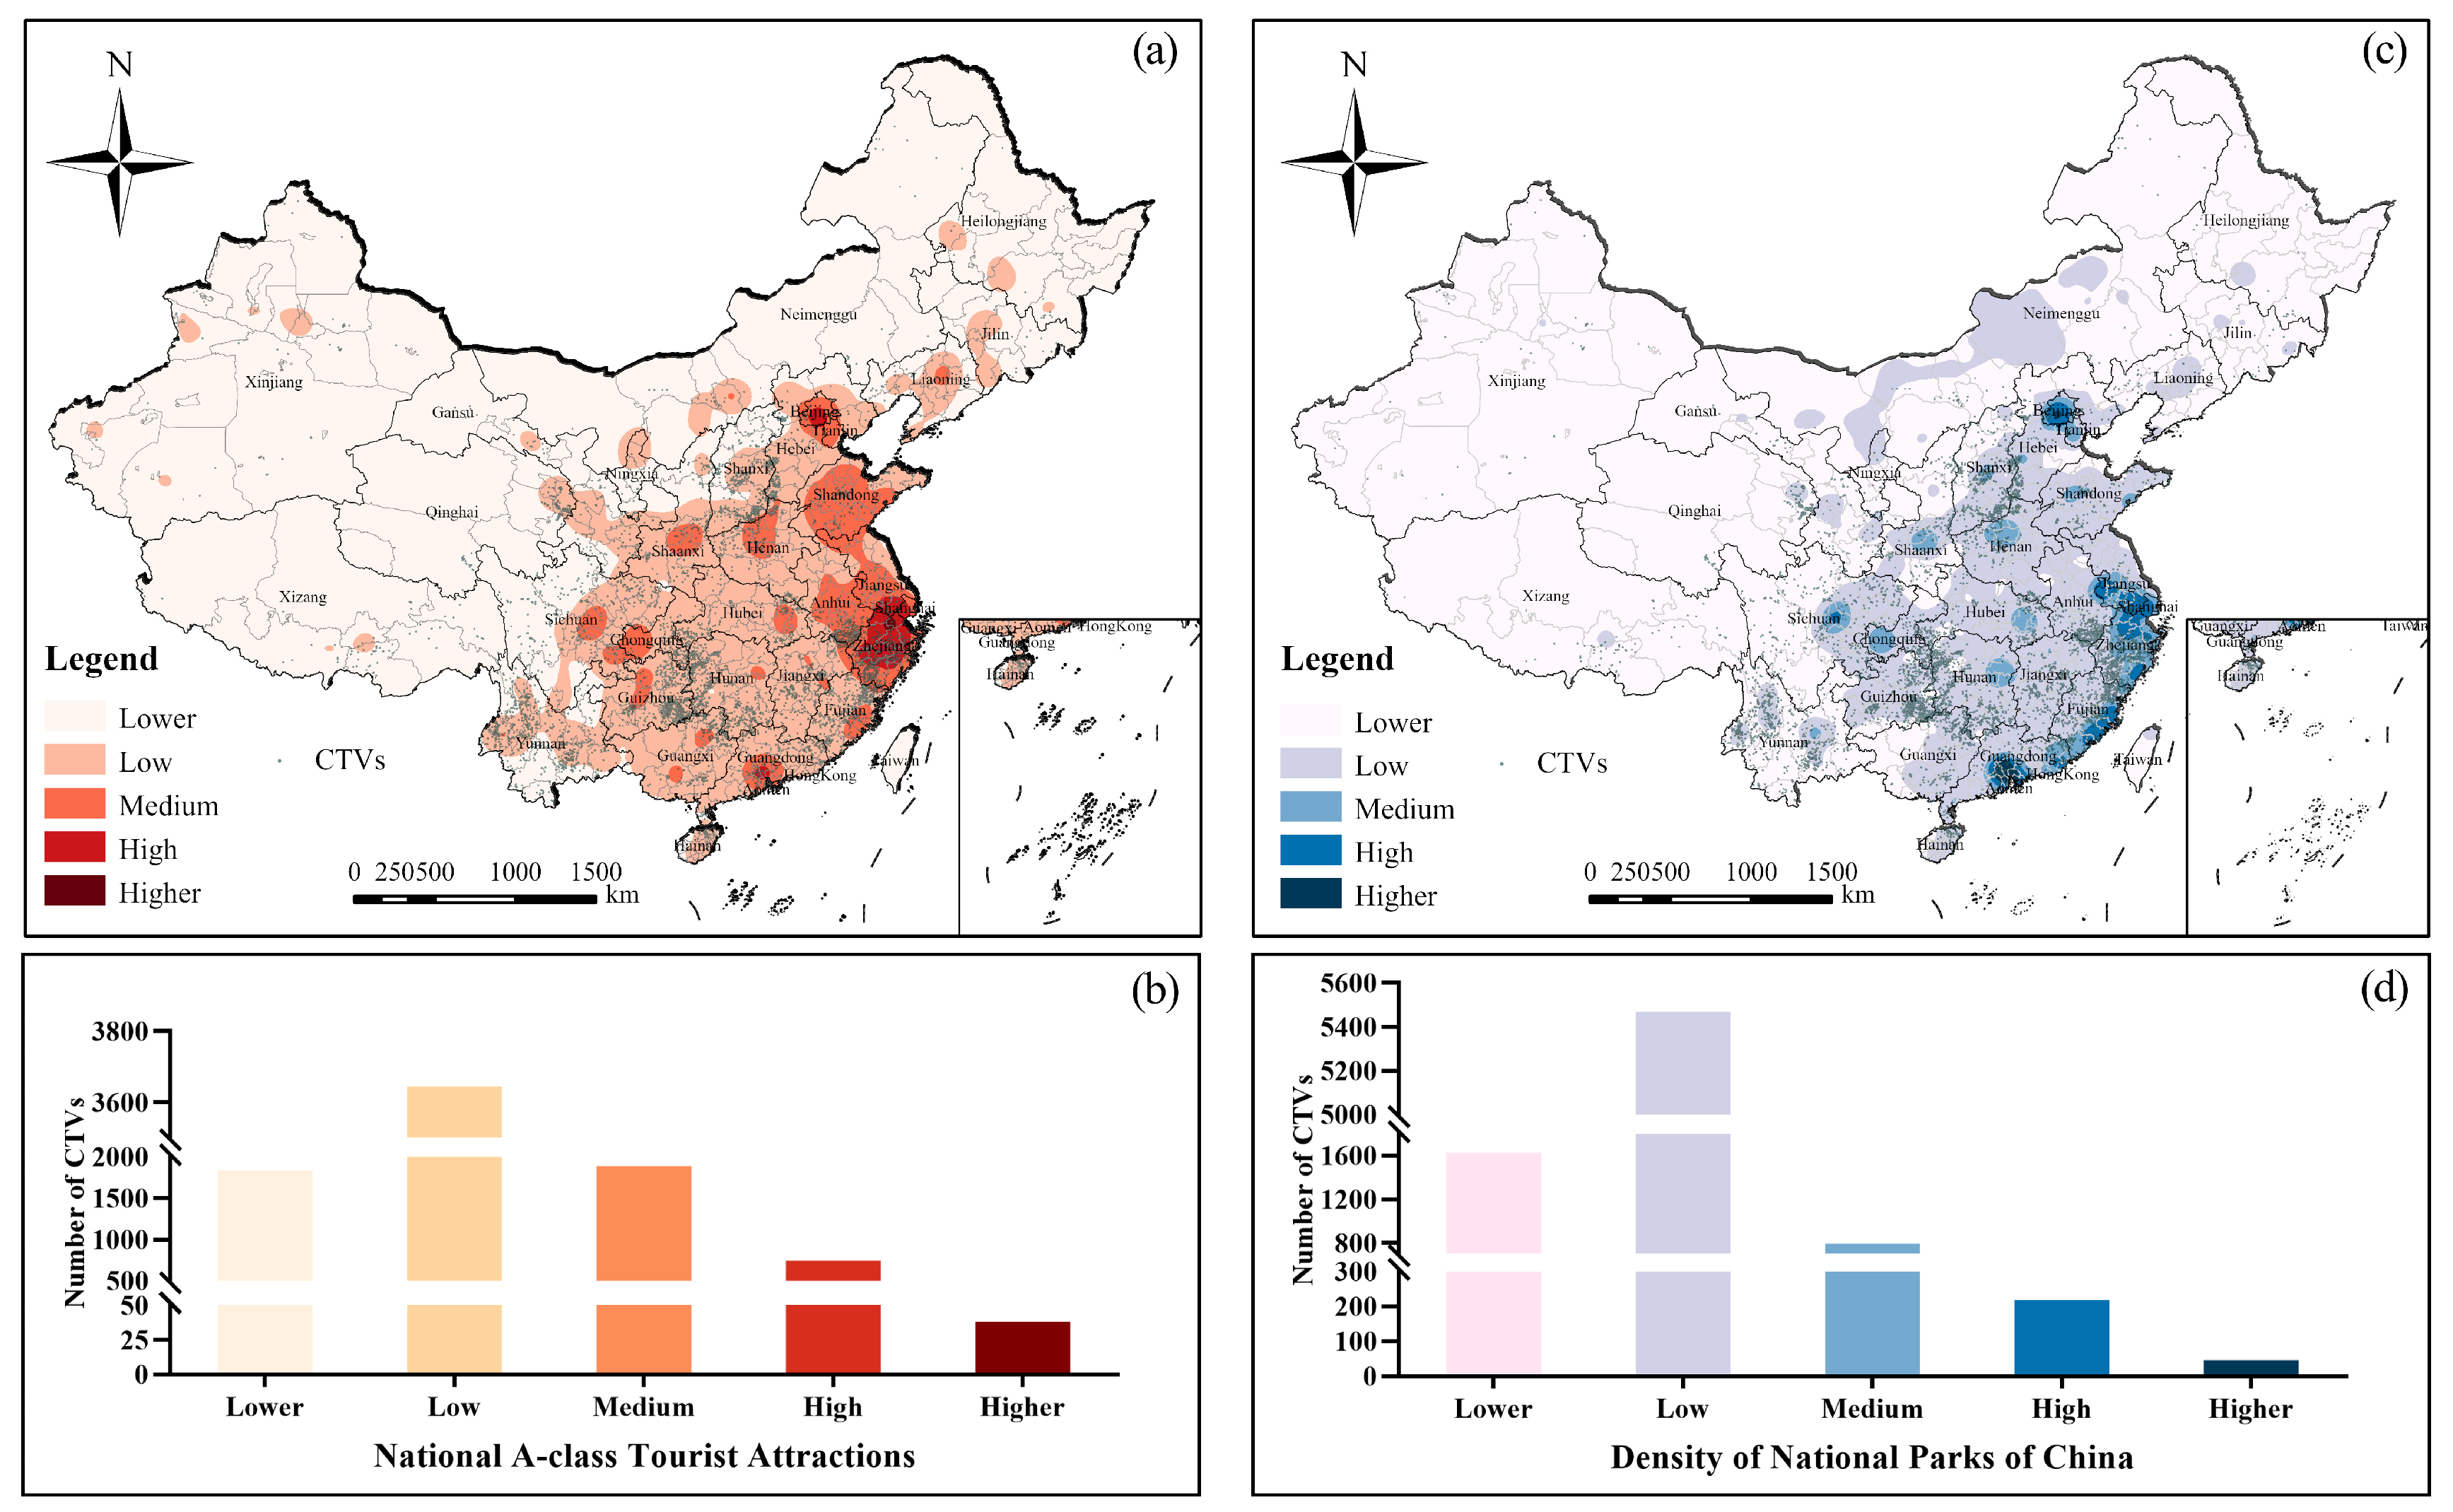
4.3.3. Scenic Area
4.4. Comprehensive Impact Factor Analysis
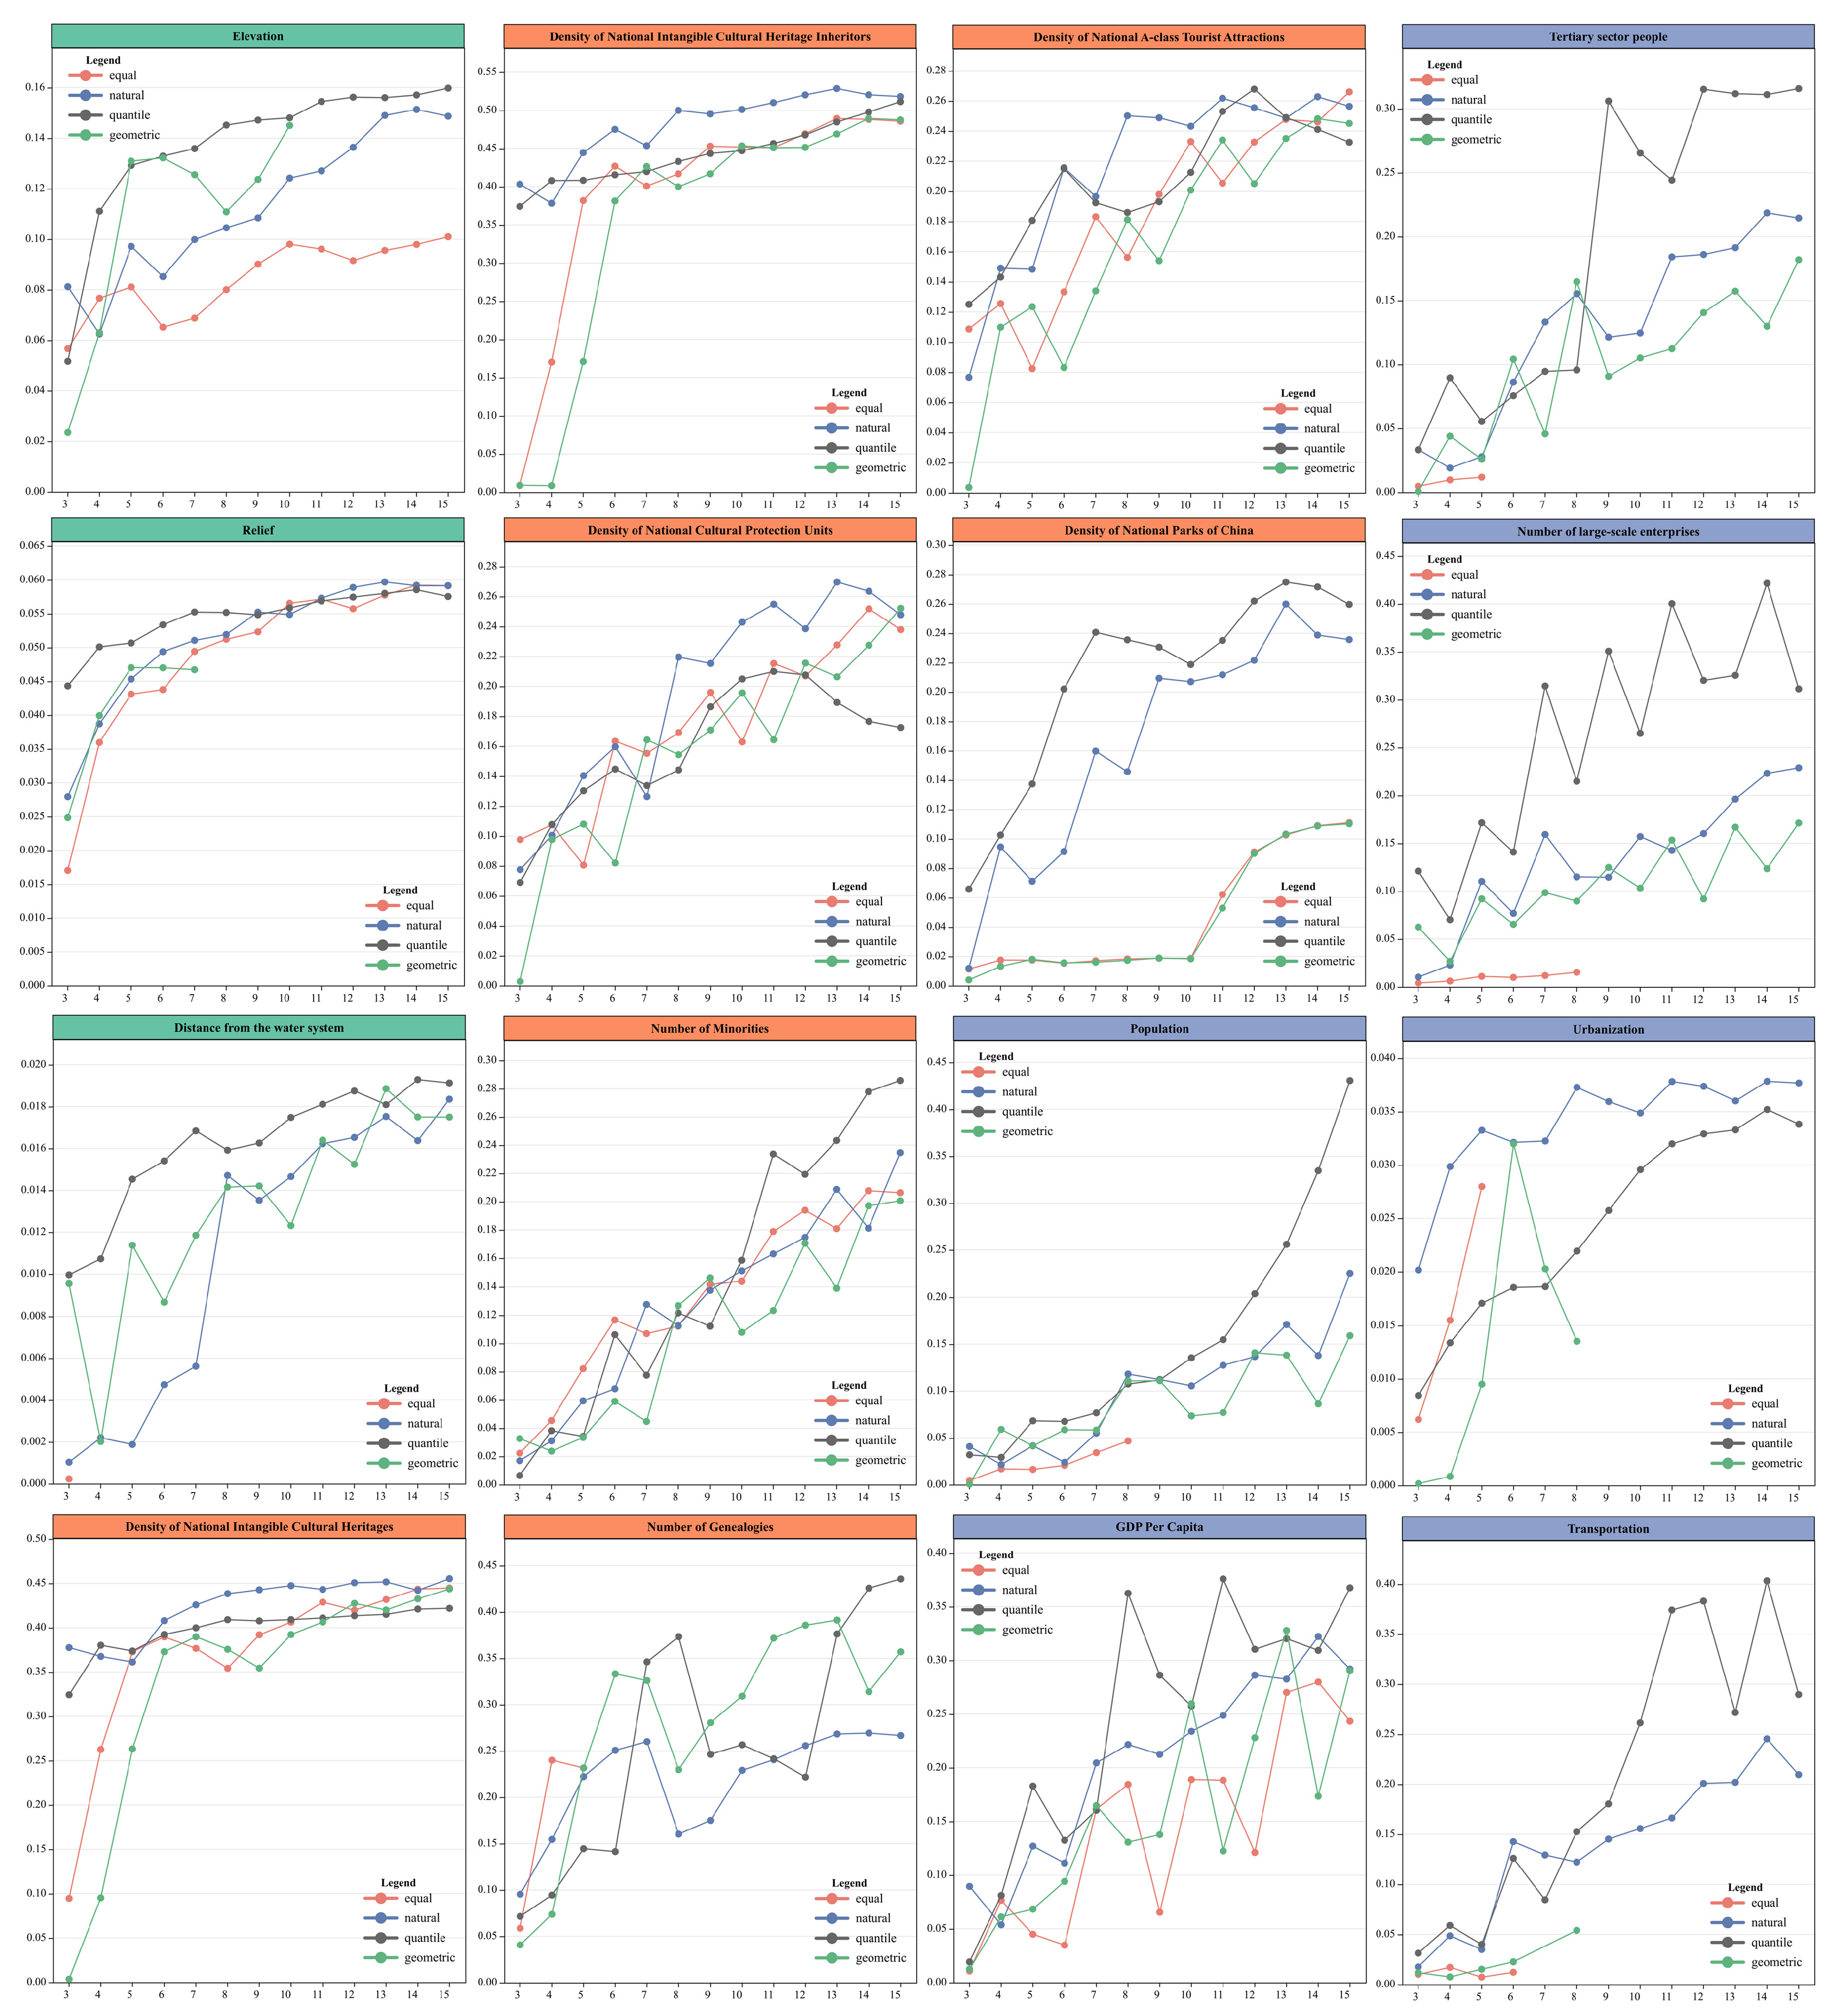
4.4.1. Optimal Discretization of Continuous Variables
4.4.2. Single Factor Detection
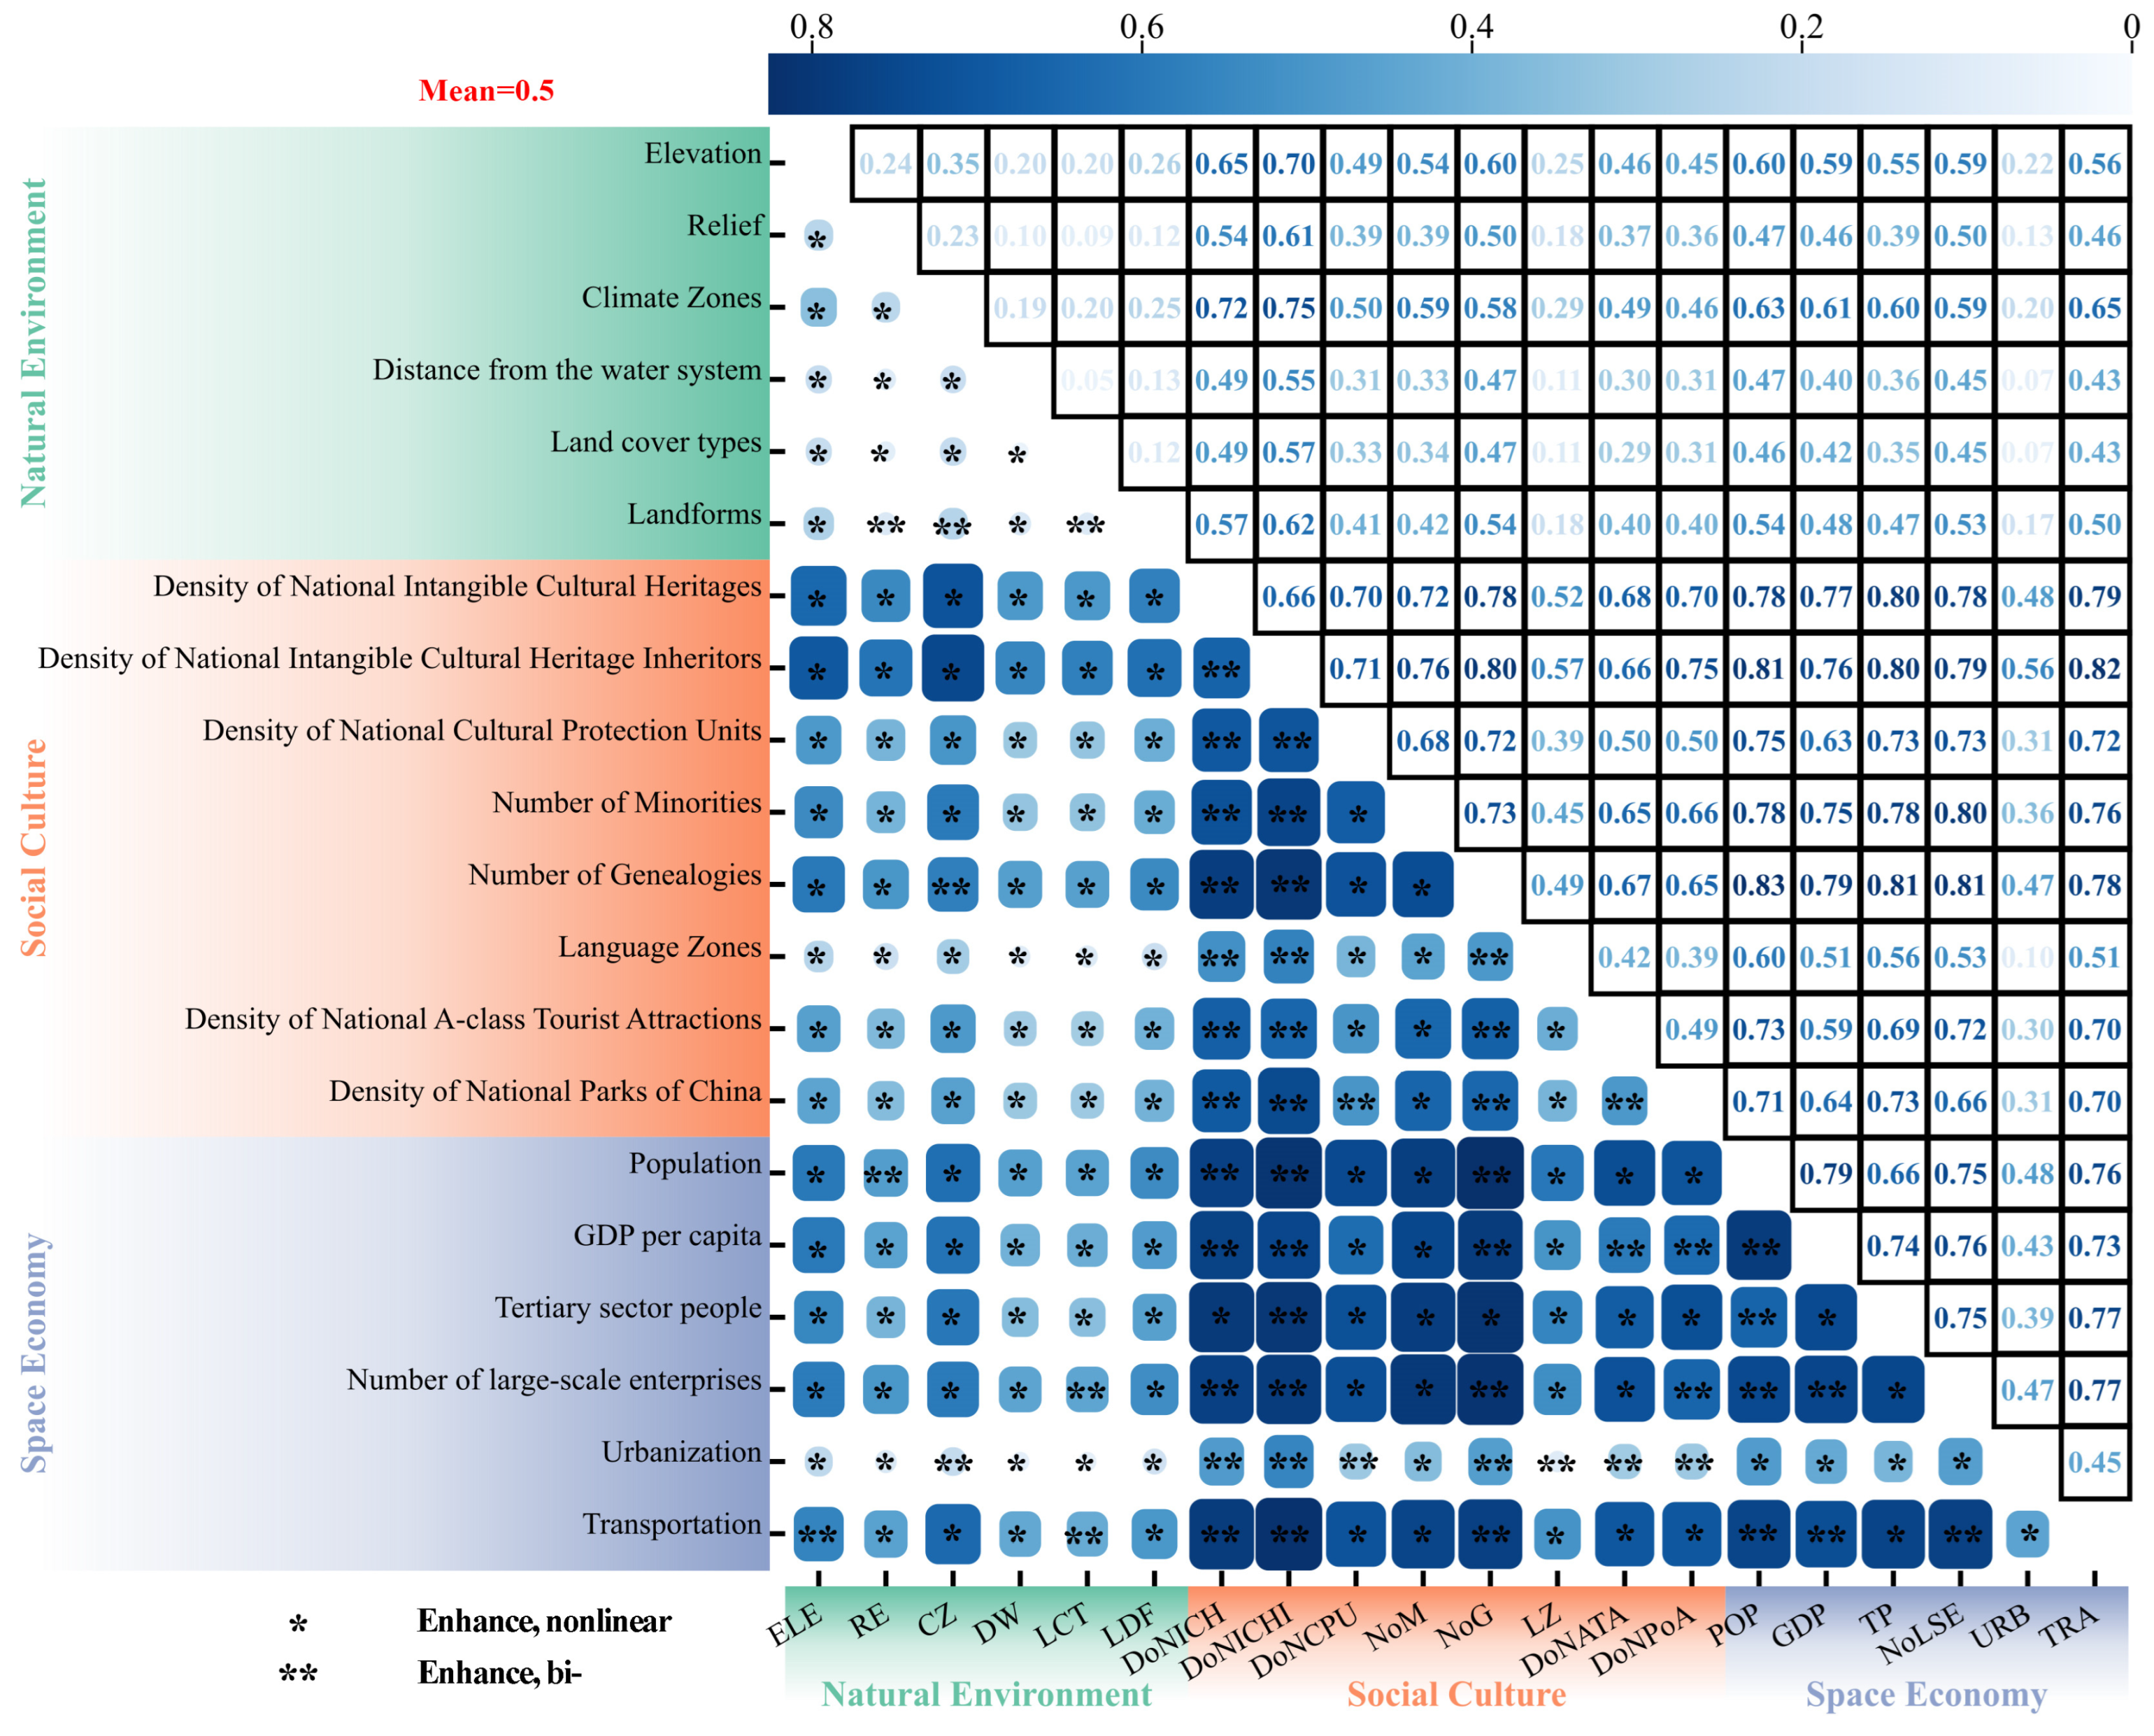
4.4.3. Factor Interplay Detection
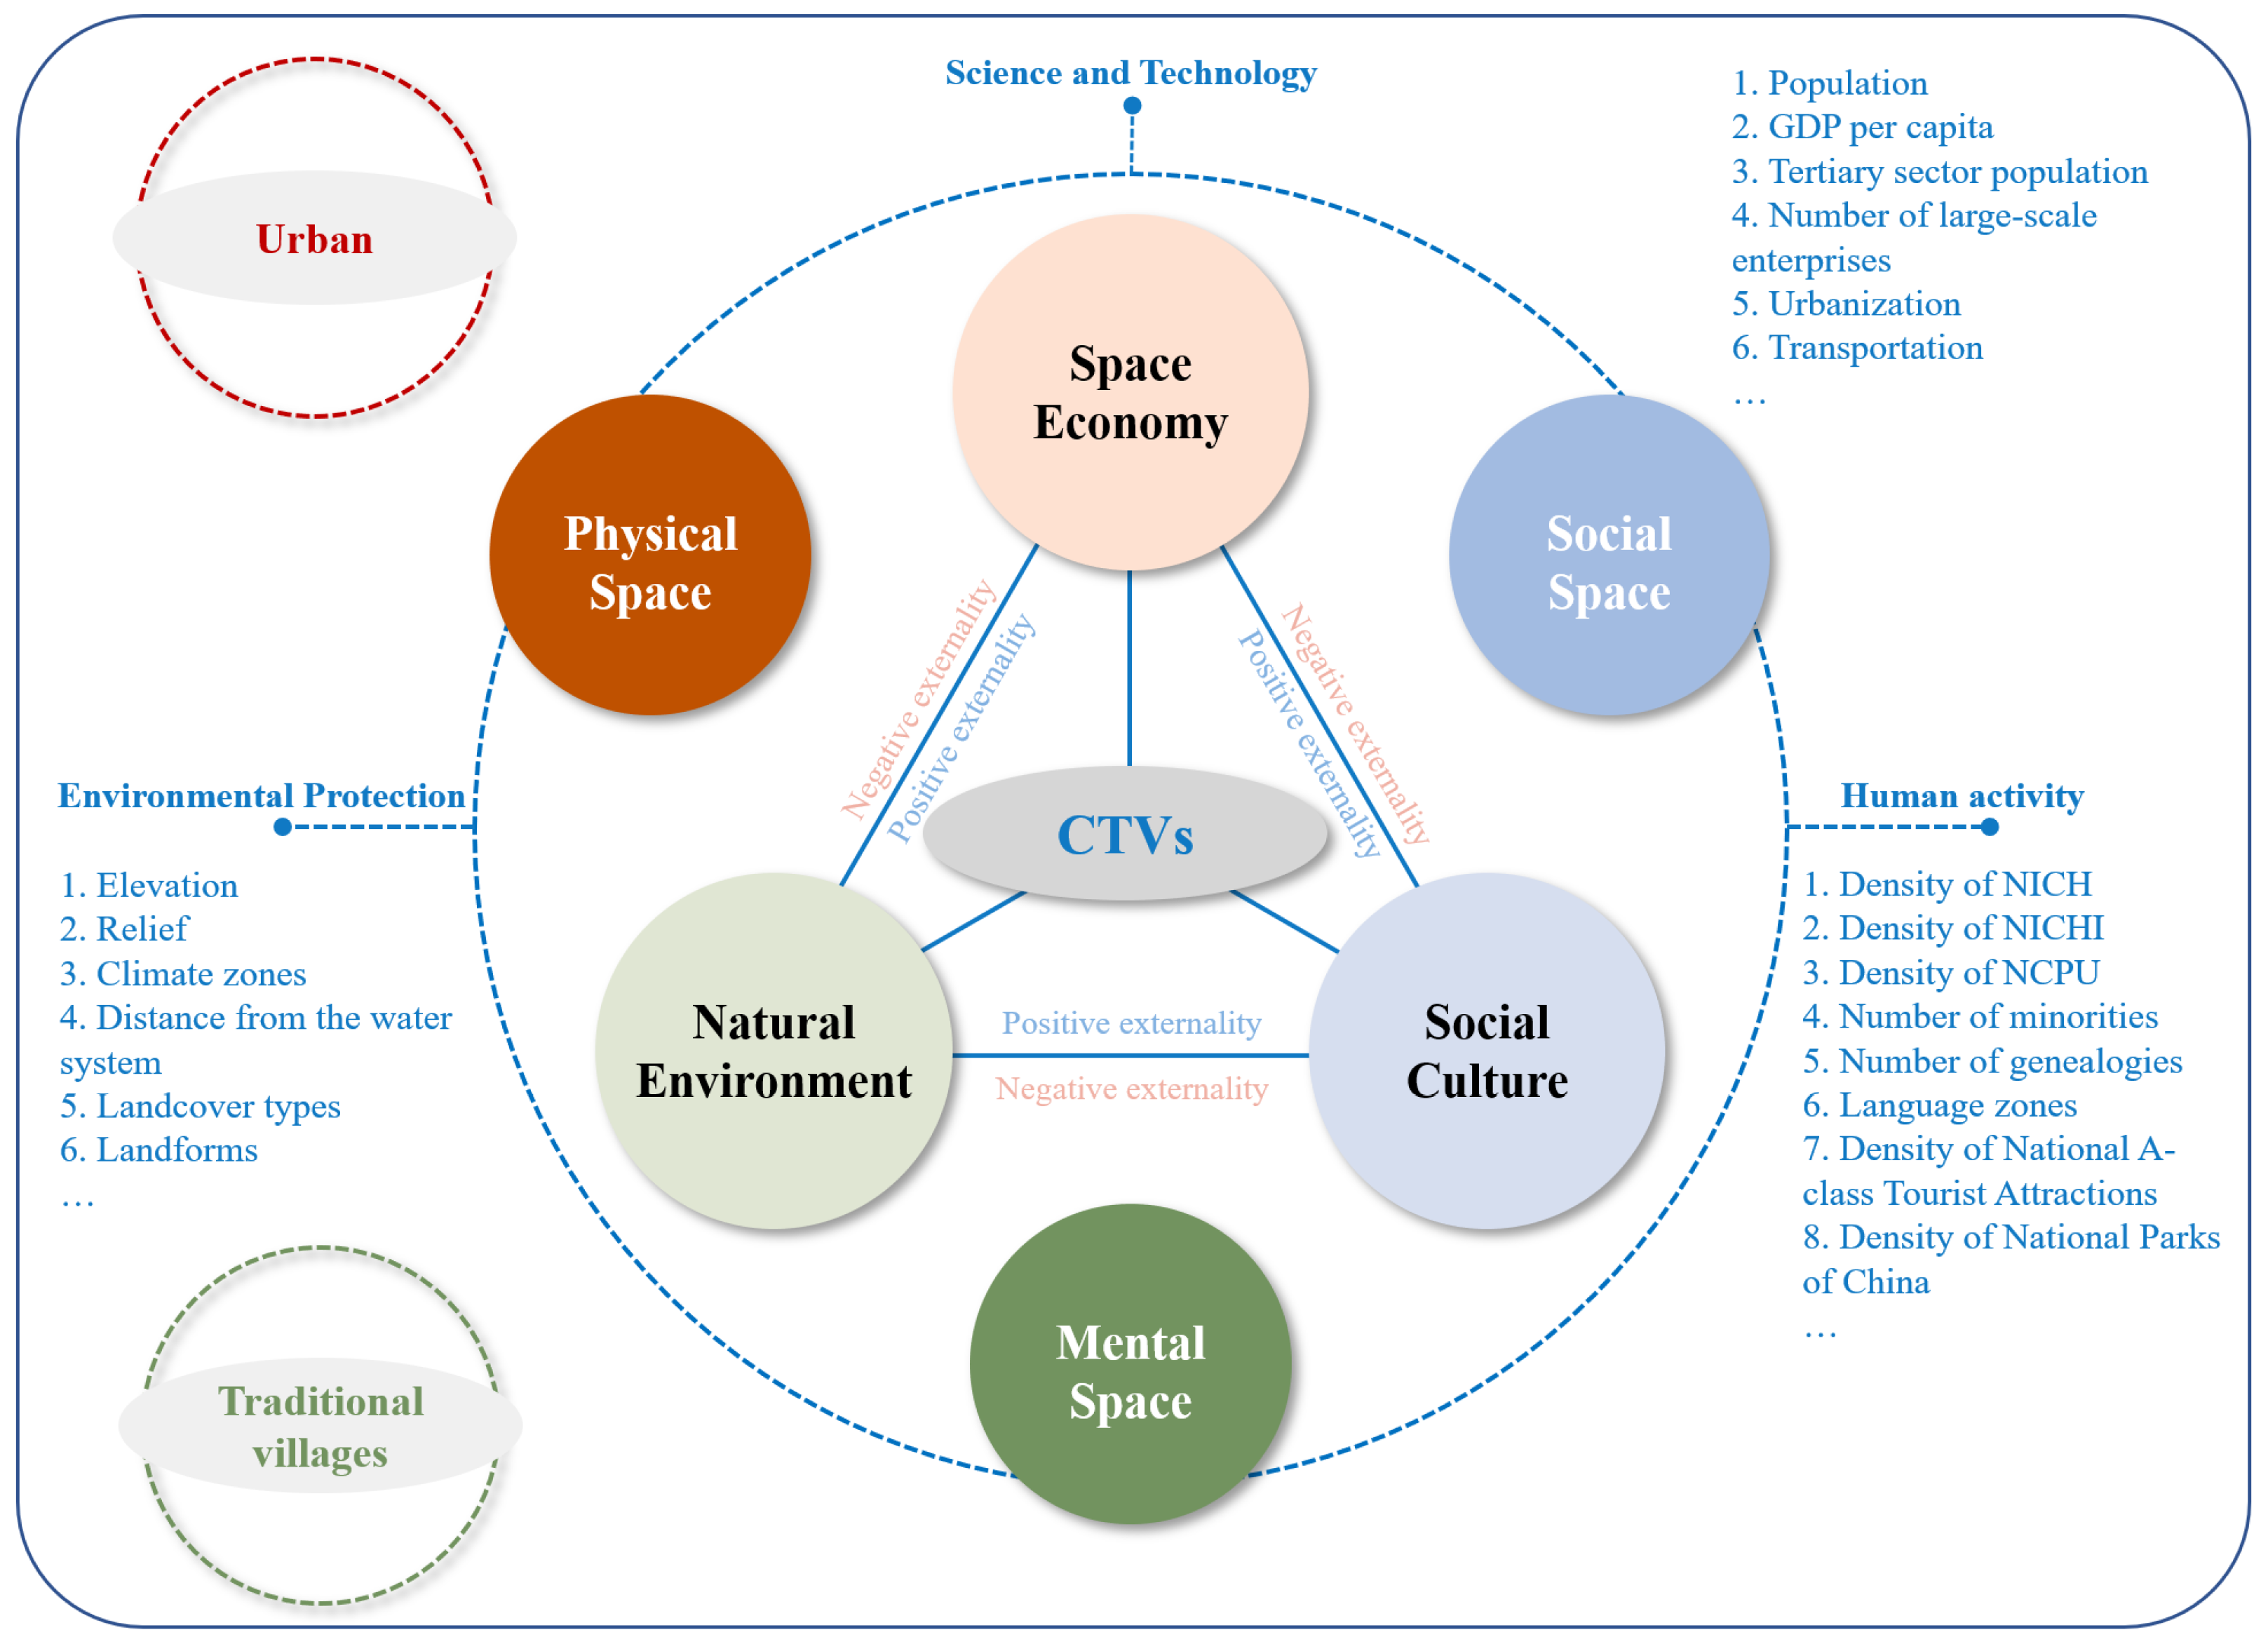
5. Interplay Mechanism of NE-SC-SE
6. Conclusions and Discussion
6.1. Conclusions
- (1)
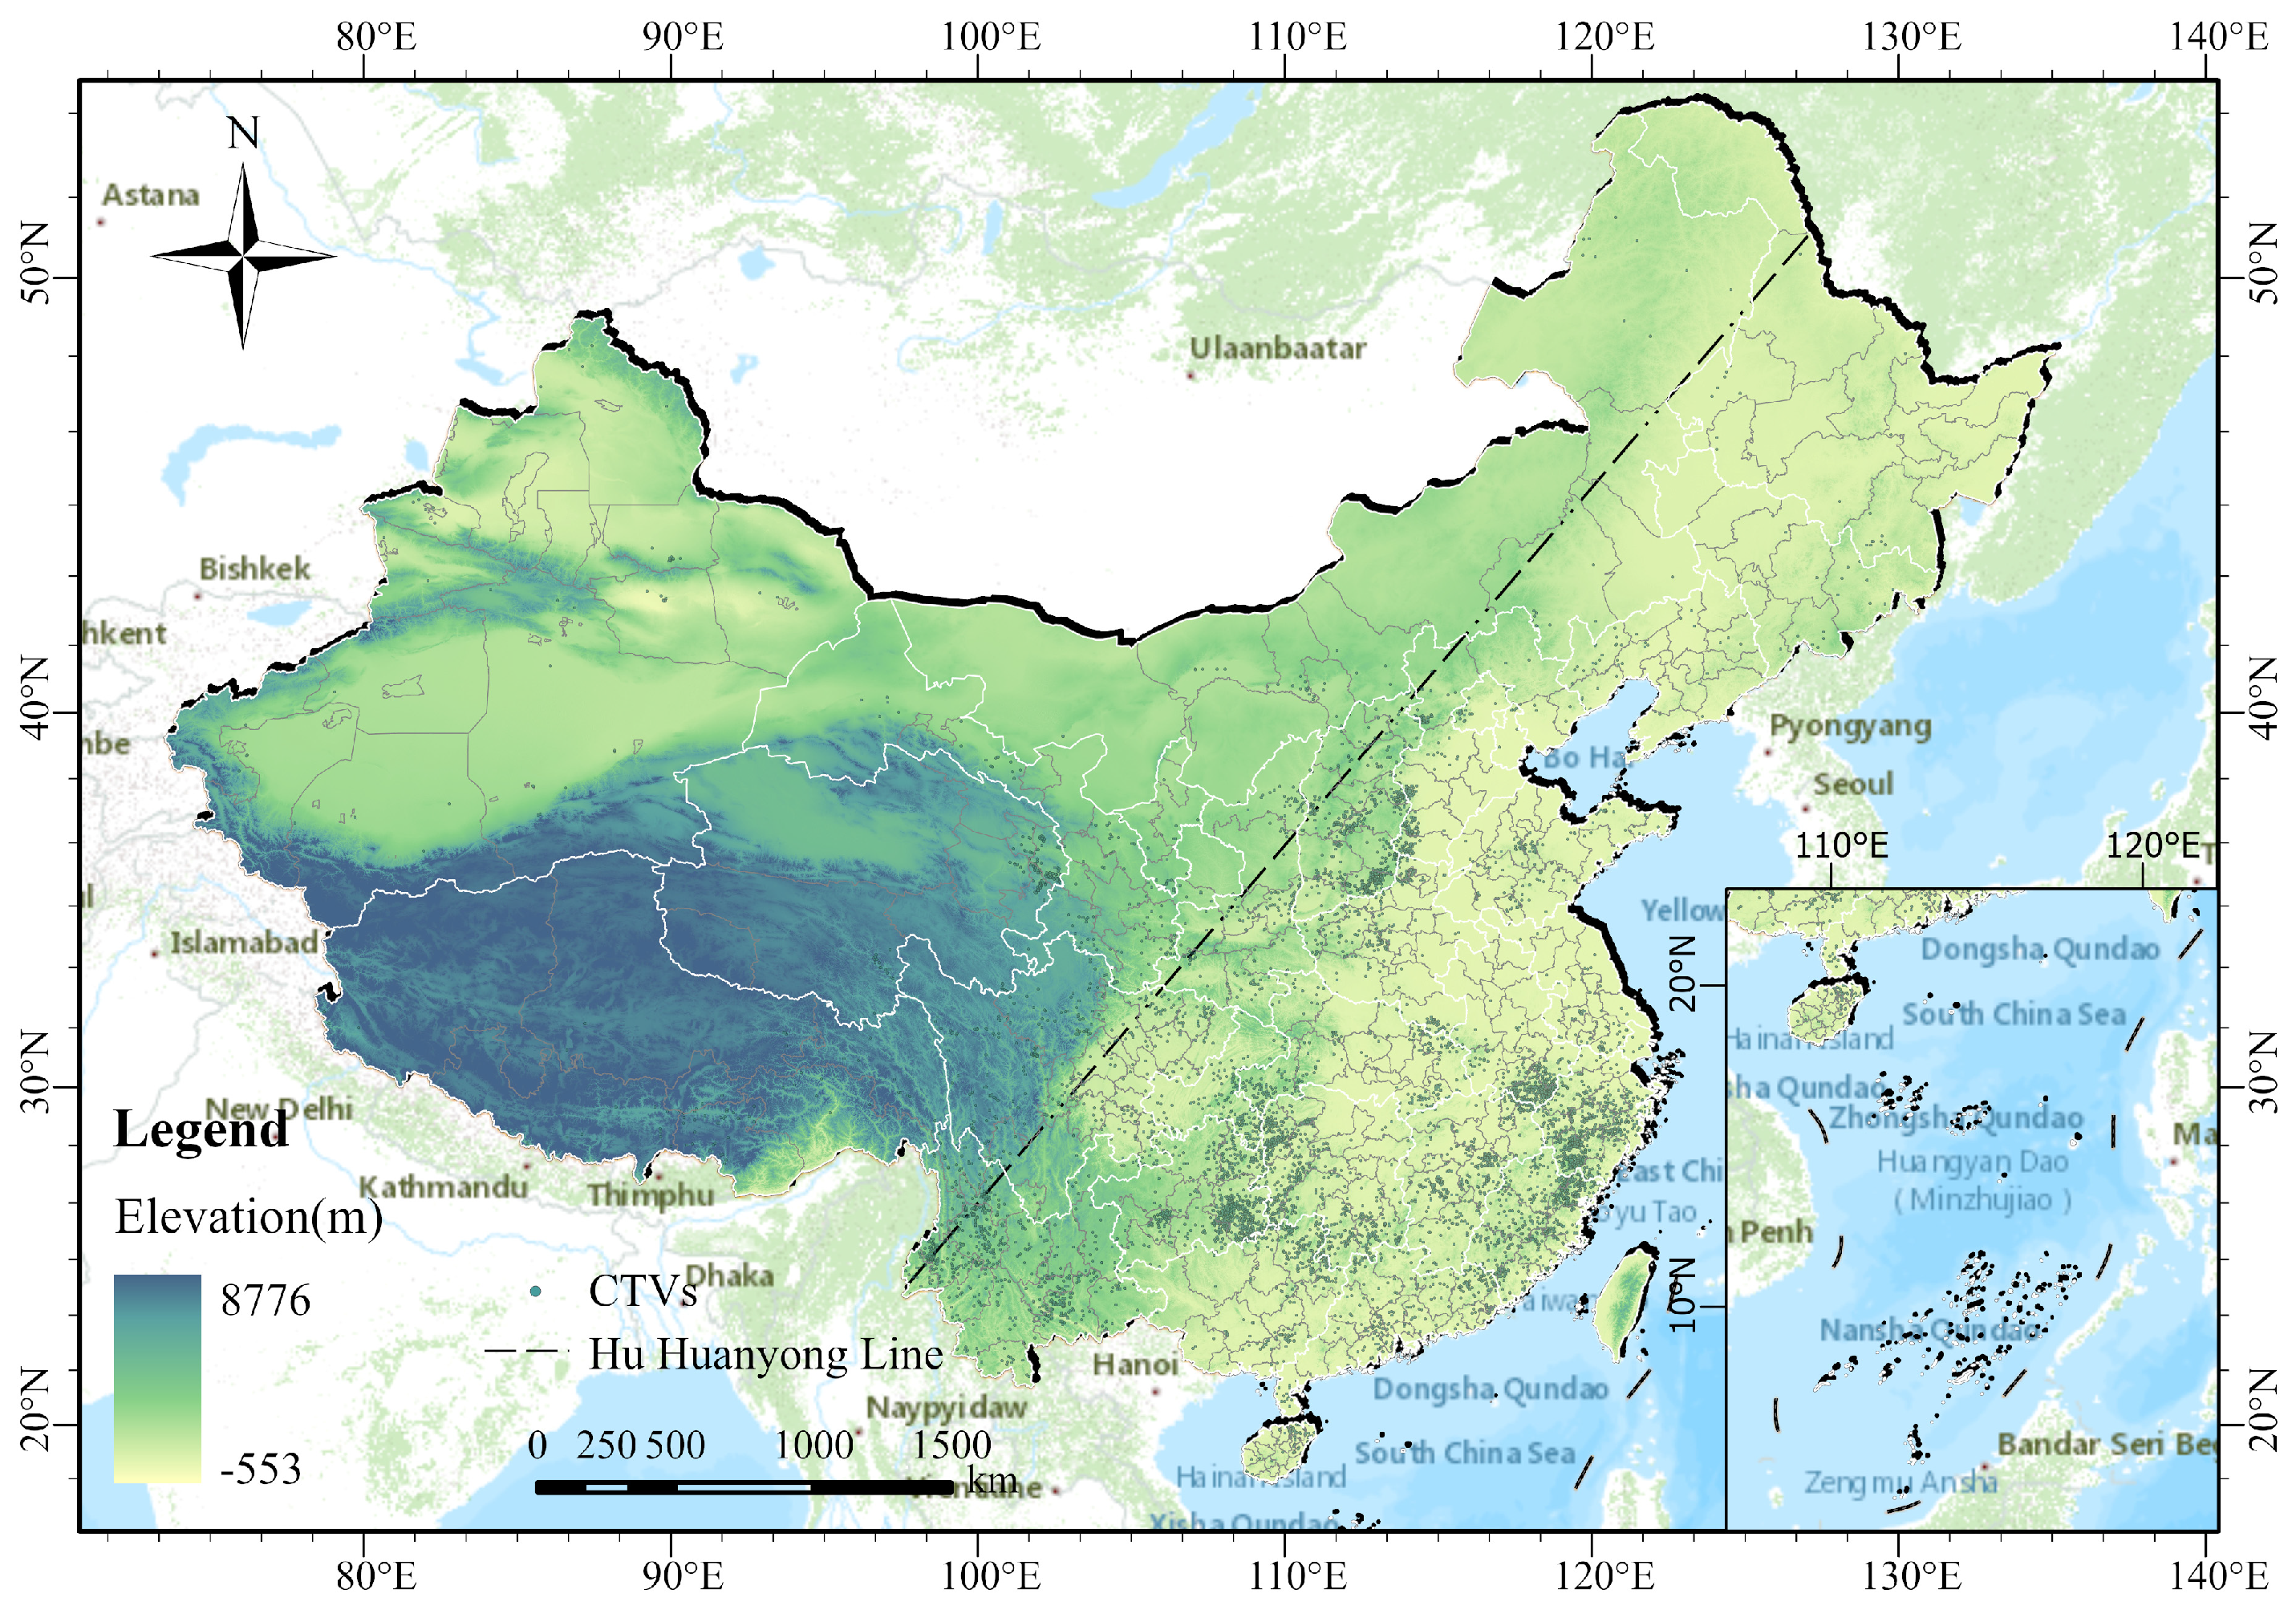
- The spatial configuration of CTVs shows notable spatial agglomeration and differentiation. Moran’s I, which is 0.309, indicates significant clustering. The GCI ranges from 31.473 to 77.055 among provinces, with substantial variation. The IMI ranges from 0.369 to 0.95, showing significant disparities in the distribution equilibrium of TVs in each province. Kernel density analysis reveals that the spatial configuration of CTVs generally follows the features of “three centers and two secondary centers”. Among them, the three centers are located at the junction of the “Shaanxi-Henan-Hebei” border, the “Anhui-Zhejiang-Fujian” contiguous area, and the “Hunan-Chongqing-Guizhou-Guangxi” contiguous area. The two secondary centers are located east of Qinghai and northwest of Yunnan. According to the analysis of local hotspots, at the provincial level, TVs are most concentrated in Guizhou, Guangzhou, and Jiangxi, followed by Yunnan, and finally, Hunan, Fujian, and Guangzhou. On the city scale, TVs are mainly concentrated in four areas. The first is the southeastern part of Shaanxi; the second is the border of Hunan, Hubei, Chongqing, Guizhou, and Guangxi; the third is the border of Zhejiang, Anhui, Jiangxi, and Fujian; and the fourth is located on the border of southwest Yunnan.
- (2)
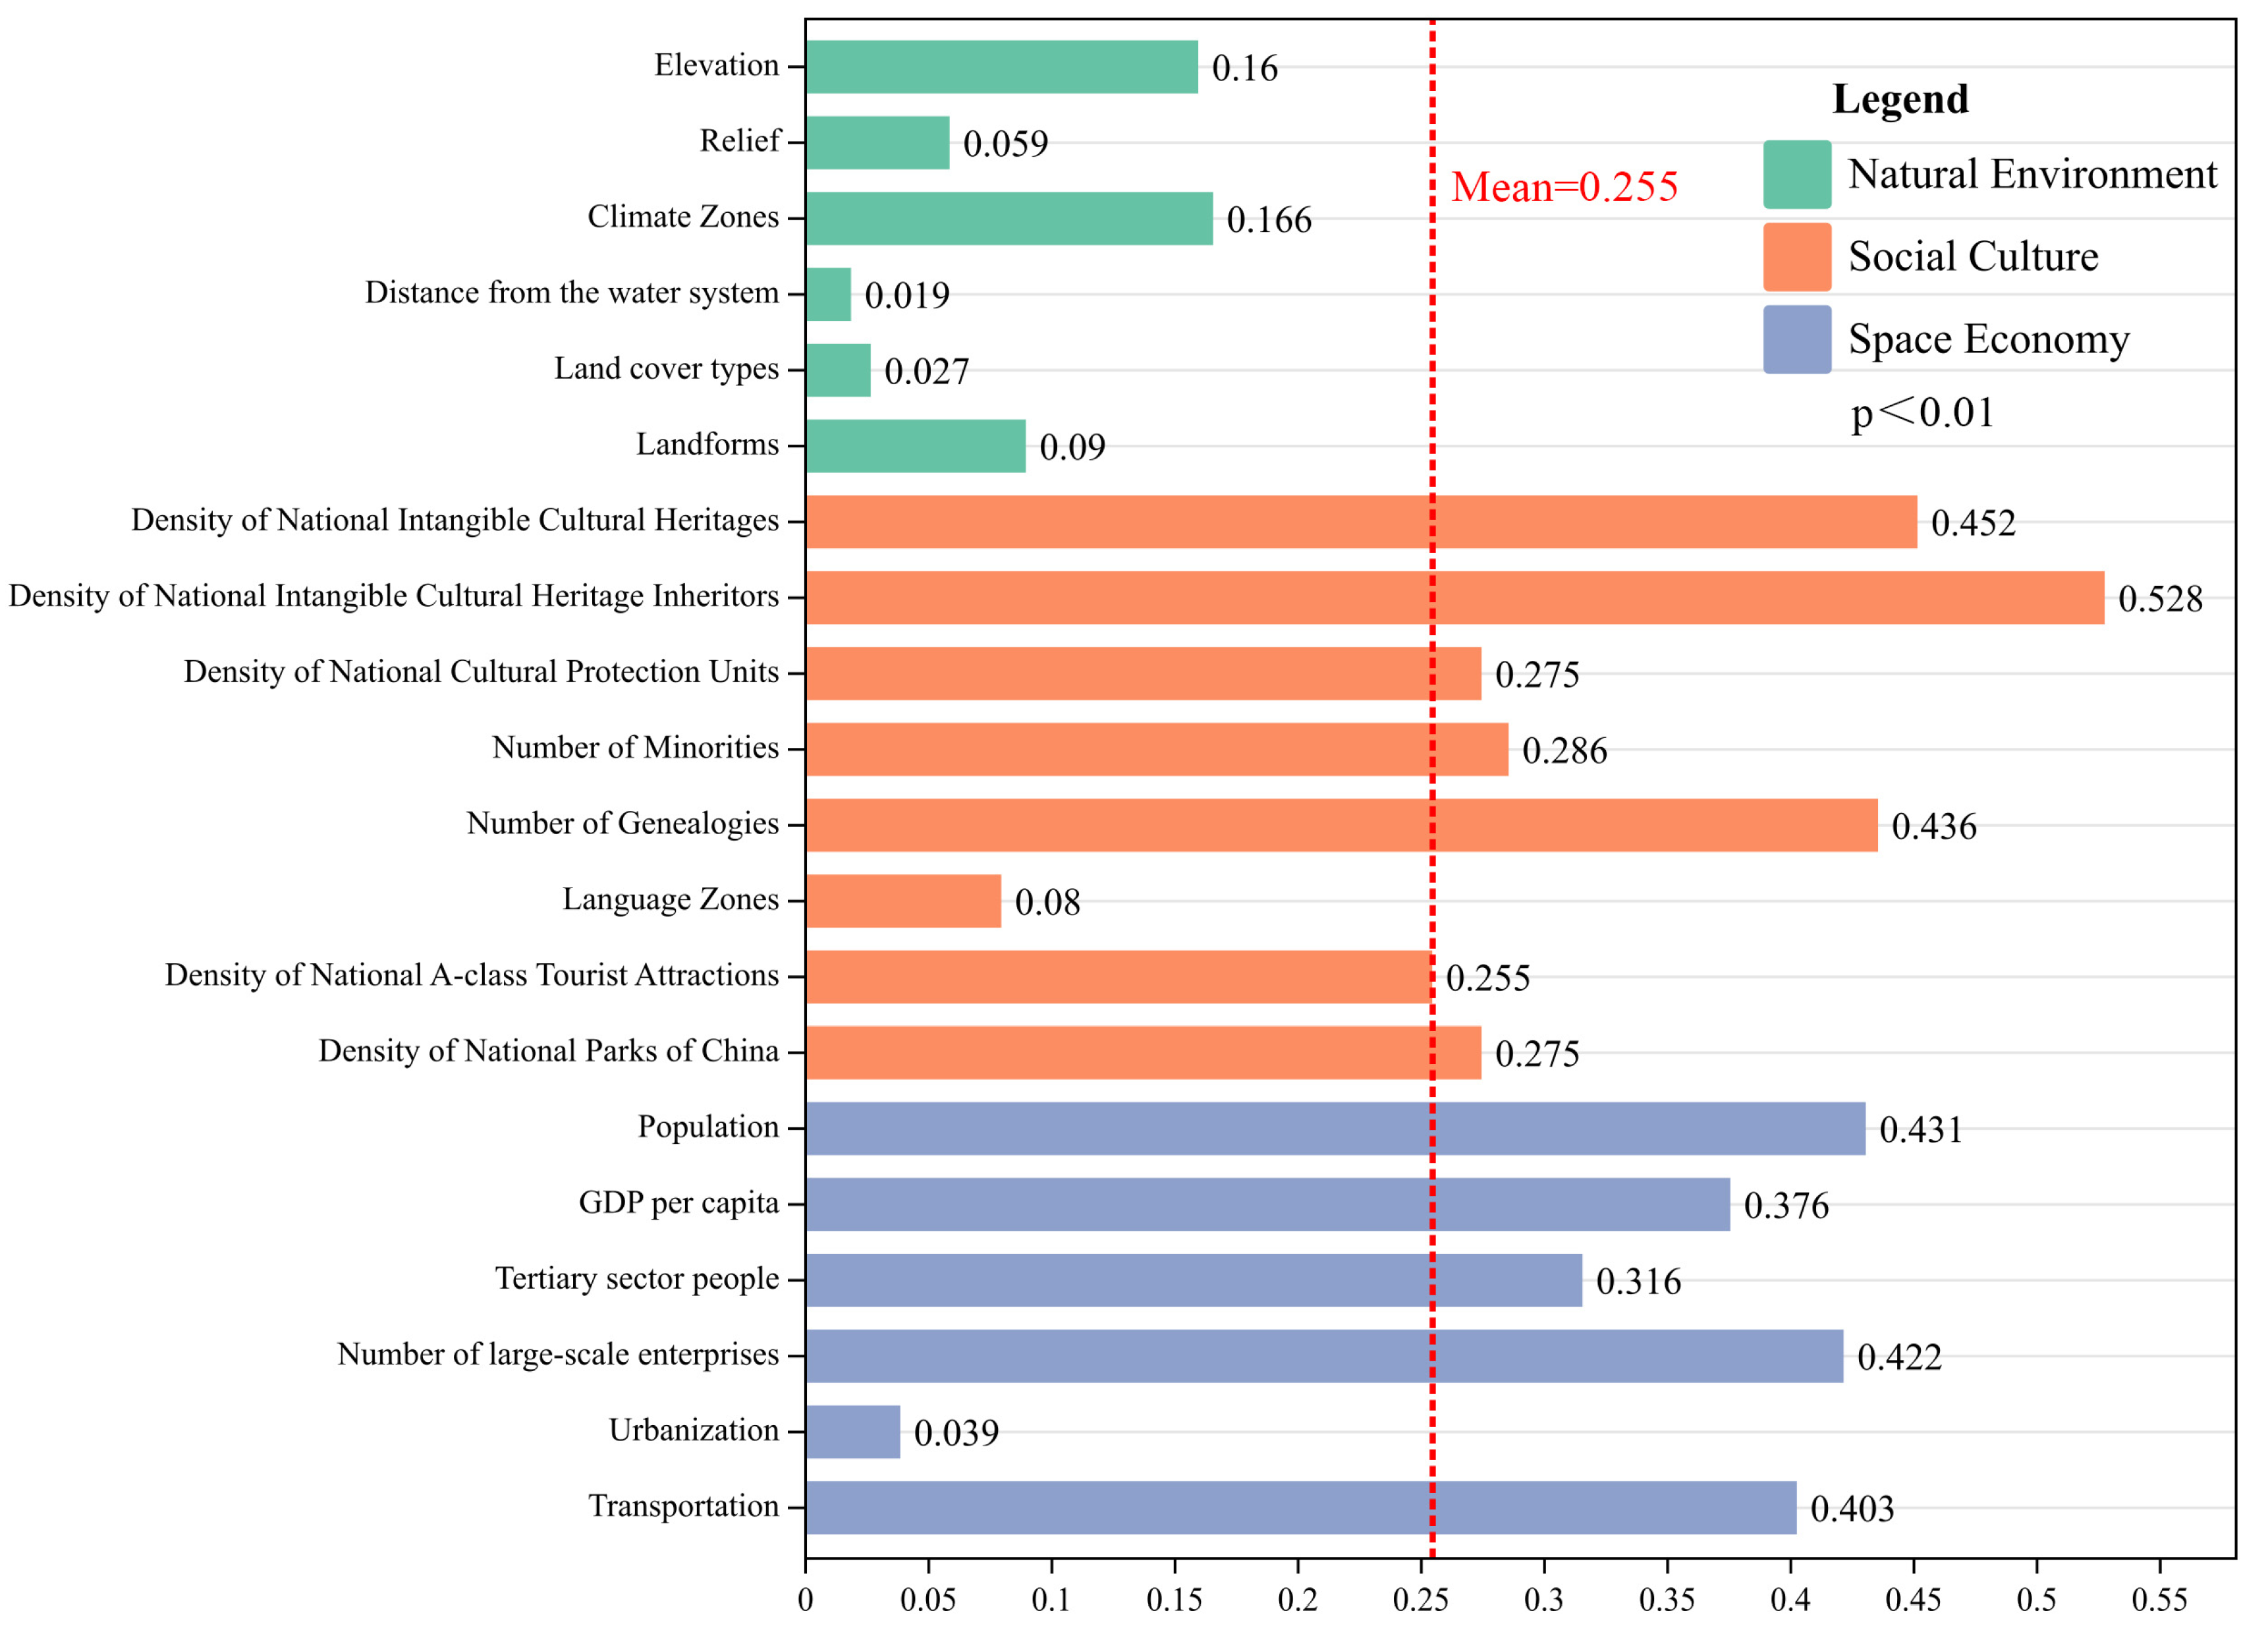
- Based on the results of the single-factor analysis, the spatial patterns of CTVs are primarily influenced by DoNICHI, DoNICH, NoG, POP, NoLSE, and TRA, with q-values above 0.4 for these factors. Considering the baseline q-value mean of 0.255, except for LZ, URB, and NE factors, the influence of the remaining factors exceeds 0.255, indicating that SC and SE factors have a more significant impact on the spatial patterns of CTVs.
6.2. Discussion
6.2.1. Exploring the Main Driving Factors in the Spatial Configuration of CTVs
6.2.2. Concentrated Contiguous Protection Strategy of CTVs
Author Contributions
Funding
Data Availability Statement
Conflicts of Interest
References
- Klokov, K. Substitution and Continuity in Southern Chukotka Traditional Rituals: A Case Study from Meinypilgyno Village, 2016–2017. Arct. Anthropol. 2018, 55, 117–133. [Google Scholar] [CrossRef]
- Nie, Z.; Li, N.; Pan, W.; Yang, Y.; Chen, W.; Hong, C. Quantitative Research on the Form of Traditional Villages Based on the Space Gene—A Case Study of Shibadong Village in Western Hunan, China. Sustainability 2022, 14, 8965. [Google Scholar] [CrossRef]
- Prasiasa, D.P.O.; Widari, D. Traditional agricultural system as tourism icon in jatiluwih tourism village, tabanan regency, bali province. J. Asian Dev. 2019, 5, 89–100. [Google Scholar] [CrossRef]
- Liu, C.; Xu, M. Characteristics and Influencing Factors on the Hollowing of Traditional Villages—Taking 2645 Villages from the Chinese Traditional Village Catalogue (Batch 5) as an Example. Int. J. Environ. Res. Public Health 2021, 18, 12759. [Google Scholar] [CrossRef] [PubMed]
- Song, W.; Liu, M. Assessment of decoupling between rural settlement area and rural population in China. Land Use Policy 2014, 39, 331–341. [Google Scholar] [CrossRef]
- Tan, M.; Li, X. The changing settlements in rural areas under urban pressure in China: Patterns, driving forces and policy implications. Landsc. Urban Plan. 2013, 120, 170–177. [Google Scholar] [CrossRef]
- Liu, Y.; Ou, C.; Li, Y.; Zhang, L.; He, J. Regularity of rural settlement changes driven by rapid urbanization in North China over the three decades. Sci. Bull. 2023, 68, 2115–2124. [Google Scholar] [CrossRef]
- Liu, Y.; Li, Y. Revitalize the world’s countryside. Nature 2017, 548, 275–277. [Google Scholar] [CrossRef]
- Stone, K.H. The Development of a Focus for the Geography of Settlement. Econ. Geogr. 1965, 41, 346–355. [Google Scholar] [CrossRef]
- Verdini, G.; Frassoldati, F.; Nolf, C. Reframing China’s heritage conservation discourse. Learning by testing civic engagement tools in a historic rural village. Int. J. Herit. Stud. 2017, 23, 317–334. [Google Scholar] [CrossRef]
- Ye, C.; Liu, Z. Rural-urban co-governance: Multi-scale practice. Sci. Bull. 2020, 65, 778–780. [Google Scholar] [CrossRef] [PubMed]
- Li, Y.; Li, J.; Chu, J. Research on the revitalization of Huizhou traditional villages based on the PAF model. J. Asian Archit. Build. Eng. 2023, 22, 3703–3717. [Google Scholar] [CrossRef]
- Wang, H.-F.; Chiou, S.-C. Research on the Sustainable Development of Traditional Dwellings. Sustainability 2019, 11, 5333. [Google Scholar] [CrossRef]
- Torreggiani, D.; Ludwiczak, Z.; Dall’Ara, E.; Benni, S.; Maino, E.; Tassinari, P. TRuLAn: A high-resolution method for multi-time analysis of traditional rural landscapes and its application in Emilia-Romagna, Italy. Landsc. Urban Plan. 2014, 124, 93–103. [Google Scholar] [CrossRef]
- Yang, X.; Pu, F. Cellular Automata for Studying Historical Spatial Process of Traditional Settlements Based on Gaussian Mixture Model: A Case Study of Qiaoxiang Village in Southern China. Int. J. Archit. Herit. 2018, 14, 568–588. [Google Scholar] [CrossRef]
- Shi, Z.; Ma, L.; Zhang, W.; Gong, M. Differentiation and correlation of spatial pattern and multifunction in rural settlements considering topographic gradients: Evidence from Loess Hilly Region, China. J. Environ. Manag. 2022, 315, 115127. [Google Scholar] [CrossRef]
- Gong, J.; Jian, Y.; Chen, W.; Liu, Y.; Hu, Y. Transitions in rural settlements and implications for rural revitalization in Guangdong Province. J. Rural Stud. 2022, 93, 359–366. [Google Scholar] [CrossRef]
- Bian, J.; Chen, W.; Zeng, J. Spatial Distribution Characteristics and Influencing Factors of Traditional Villages in China. Int. J. Environ. Res. Public Health 2022, 19, 4627. [Google Scholar] [CrossRef]
- Xie, B.; Wei, W.; Li, Y.; Liu, C.; Ju, S. Research on Spatial Distribution Characteristics and Correlation Degree of the Historical and Cultural Towns (Villages) in China. Sustainability 2023, 15, 1680. [Google Scholar] [CrossRef]
- Ma, H.; Tong, Y. Spatial differentiation of traditional villages using ArcGIS and GeoDa: A case study of Southwest China. Ecol. Inform. 2022, 68, 101416. [Google Scholar] [CrossRef]
- Liu, X.; Yuan, L.; Tan, G. Identification and Hierarchy of Traditional Village Characteristics Based on Concentrated Contiguous Development—Taking 206 Traditional Villages in Hubei Province as an Example. Land 2023, 12, 471. [Google Scholar] [CrossRef]
- Chen, W.; Yang, L.; Wu, J.; Wu, J.; Wang, G.; Bian, J.; Zeng, J.; Liu, Z. Spatio-temporal characteristics and influencing factors of traditional villages in the Yangtze River Basin: A Geodetector model. Herit. Sci. 2023, 11, 111. [Google Scholar] [CrossRef]
- Wu, C.; Chen, M.; Zhou, L.; Liang, X.; Wang, W. Identifying the Spatiotemporal Patterns of Traditional Villages in China: A Multiscale Perspective. Land 2020, 9, 449. [Google Scholar] [CrossRef]
- Jia, A.; Liang, X.; Wen, X.; Yun, X.; Ren, L.; Yun, Y. GIS-Based Analysis of the Spatial Distribution and Influencing Factors of Traditional Villages in Hebei Province, China. Sustainability 2023, 15, 9089. [Google Scholar] [CrossRef]
- Li, T.; Li, C.; Zhang, R.; Cong, Z.; Mao, Y. Spatial Heterogeneity and Influence Factors of Traditional Villages in the Wuling Mountain Area, Hunan Province, China Based on Multiscale Geographically Weighted Regression. Buildings 2023, 13, 294. [Google Scholar] [CrossRef]
- Yang, R.; Xu, Q.; Long, H. Spatial distribution characteristics and optimized reconstruction analysis of China’s rural settlements during the process of rapid urbanization. J. Rural Stud. 2016, 47, 413–424. [Google Scholar] [CrossRef]
- Gao, C.; Wu, Y.; Bian, C.; Gao, X. Spatial characteristics and influencing factors of Chinese traditional villages in eight provinces the Yellow River flows through. River Res. Appl. 2023, 39, 1255–1269. [Google Scholar] [CrossRef]
- Li, X.; Yang, Q.; Lyu, X.; Ye, Y.; Zhang, B. Multidimensional framework for analyzing the distribution patterns of traditional villages in the karst landscape regions of China. Ecol. Inform. 2023, 77, 102184. [Google Scholar] [CrossRef]
- Lu, M.; Wei, L.; Ge, D.; Sun, D.; Zhang, Z.; Lu, Y. Spatial optimization of rural settlements based on the perspective of appropriateness–domination: A case of Xinyi City. Habitat Int. 2020, 98, 102148. [Google Scholar] [CrossRef]
- Liu, S.; Ge, J.; Bai, M.; Yao, M.; He, L.; Chen, M. Toward classification-based sustainable revitalization: Assessing the vitality of traditional villages. Land Use Policy 2022, 116, 106060. [Google Scholar] [CrossRef]
- Ebrard Casaubon, M.; Frausto-Guerrero, A. Mexico, Culture and MONDIACULT 2022. Rev. Mex. Política Exter. 2022, 123, 5–8. [Google Scholar]
- Voicu, I. Universal Declaration on Cultural Diversity. ABAC J. 2002, 22, 1–3. [Google Scholar]
- Jinfeng, W.; Chengdong, X. Geodetector: Principle and prospective. Acta Geogr. Sin. 2017, 72, 116–134. (In Chinese) [Google Scholar] [CrossRef]
- An, M.; Xie, P.; He, W.; Wang, B.; Huang, J.; Khanal, R. Spatiotemporal change of ecologic environment quality and human interaction factors in three gorges ecologic economic corridor, based on RSEI. Ecol. Indic. 2022, 141, 109090. [Google Scholar] [CrossRef]
- Jiang, R.; Wu, P.; Song, Y.; Wu, C.; Wang, P.; Zhong, Y. Factors influencing the adoption of renewable energy in the U.S. residential sector: An optimal parameters-based geographical detector approach. Renew. Energy 2022, 201, 450–461. [Google Scholar] [CrossRef]
- Wang, J.F.; Li, X.H.; Christakos, G.; Liao, Y.L.; Zhang, T.; Gu, X.; Zheng, X.Y. Geographical Detectors-Based Health Risk Assessment and its Application in the Neural Tube Defects Study of the Heshun Region, China. Int. J. Geogr. Inf. Sci. 2010, 24, 107–127. [Google Scholar] [CrossRef]
- Wren, C. Geographic concentration and the temporal scope of agglomeration economies: An index decomposition. Reg. Sci. Urban Econ. 2012, 42, 681–690. [Google Scholar] [CrossRef]
- Wang, X.; Zhang, J.; Cenci, J.; Becue, V. Spatial Distribution Characteristics and Influencing Factors of the World Architectural Heritage. Heritage 2021, 4, 2942–2959. [Google Scholar] [CrossRef]
- Zhang, S. A study on traditional villages as a form of human settlement and their integrated conservation. Urban Plan 2017, 2, 44–49. (In Chinese) [Google Scholar] [CrossRef]
- Zhang, J.; Zhu, W.; Zhu, L.; Cui, Y.; He, S.; Ren, H. Topographical relief characteristics and its impact on population and economy: A case study of the mountainous area in western Henan, China. J. Geogr. Sci. 2019, 29, 598–612. [Google Scholar] [CrossRef]
- Ye, D. The interactive mechanism of man-earth areal system and the sustainable development. Geogr. Res. 2001, 20, 307–314. (In Chinese) [Google Scholar]
- Wang, F.; Gao, C. Settlement–river relationship and locality of river-related built environment. Indoor Built Environ. 2020, 29, 1331–1335. [Google Scholar] [CrossRef]
- Fujita, M. Spatial Economics; Edward Elgar Publishing: Northampton, MA, USA, 2005. [Google Scholar]
- Yeung, H.W.-c. Rethinking relational economic geography. Trans. Inst. Br. Geogr. 2005, 30, 37–51. [Google Scholar] [CrossRef]
- Jiao, S.; Zheng, Z.; Xu, F. The marginal tendency of the traditional village distribution: The case study of Hunan Province. Geogr. Res. 2016, 35, 1525–1534. [Google Scholar]
- Ha, G.; Yafang, Y.; Zeng, Z. Study on the Influence of Mutual Adaptation between National Park and Traditional Village Planning—Loushang Ancient Village Scenic Spot in Guizhou Province as the Example. Chin. Landsc. Archit. 2020, 36, 89–94. (In Chinese) [Google Scholar] [CrossRef]
- Zhao, Y.; Tian, Y. Research on the Spatial Distribution Characteristics and Influencing Factors of Traditional Villages in Southwest China. Dev. Small Cities Towns 2020, 38, 54–62. (In Chinese) [Google Scholar] [CrossRef]
- Nicholson-Smith, D. The Production of Space; Blackwell Publishers Limited: Oxford, UK, 1991. [Google Scholar]
- Harvey, D. Marx, Capital, and the Madness of Economic Reason; Oxford University Press: Oxford, UK, 2017. [Google Scholar]
- Hu, J.; Zhang, C.; Sun, C.; Zheng, W. Distribution pattern of national traditional villages in Guilin from the perspective of space production. J. Guilin Univ. Technol. 2021, 36, 23–32. (In Chinese) [Google Scholar]
- Ng, Y.-K. Welfare Economics; Springer: Berlin/Heidelberg, Germany, 1983. [Google Scholar]
- Su, H.; Wang, Y.; Zhang, Z.; Dong, W. Characteristics and Influencing Factors of Traditional Village Distribution in China. Land 2022, 11, 1631. [Google Scholar] [CrossRef]


| Type | Application | Source | Resolution | |
|---|---|---|---|---|
| Natural Environment (NE) | DEM | Elevation (ELE), Relief (RE) | Geospatial Data Cloud (https://www.gscloud.cn/search (accessed on 5 December 2023)) | 30 m |
| Climate Zones, Land cover types, Landforms | Climate Zones (CZs), Land cover types (LCTs), Landforms (LDFs) | Resource Environment and Data Center of the Chinese Academy of Sciences (https://www.resdc.cn/data.aspx?DATAID=124 (accessed on 5 December 2023)) | /(No resolution) | |
| Water system | Distance from the water (DW) | OpenStreetMap (http://www.openstreetmap.org/ (accessed on 5 December 2023)) | / | |
| Space Economy (SE) | Population | Population (POP) | Bulletin of the Seventh National Census | / |
| GDP per capita, Tertiary sector people, Number of large-scale enterprises | GDP per capita (GDP), Tertiary sector people (TP), Number of large-scale enterprises (NoLSE) | China City Statistical Yearbook (2020) | / | |
| City government location | Urbanization (URB) | Baidu map (https://map.baidu.com/@12576415,3251499,13z (accessed on 5 December 2023)) | / | |
| Roads | Transportation (TRA) | OpenStreetMap (http://www.openstreetmap.org/ (accessed on 5 December 2023)) | / | |
| Social Culture (SC) | Cultural heritage | Density of National Intangible Cultural Heritages (DoNICHs), Density of National Intangible Cultural Heritage Inheritors (DoNICHIs), Density of National Cultural Protection Units (DoNCPUs) | China Intangible Cultural Heritage Network (https://www.ihchina.cn/ (accessed on 5 December 2023)) | / |
| Minorities | Number of Minorities (NoM) | The 7th China Population Census | / | |
| Genealogies | Number of Genealogies (NoG) | General Catalogue of Chinese Genealogy | / | |
| Language | Language Zones (LZs) | Atlas of Chinese Languages | / | |
| Scenic areas | Density of National A-Class Tourist Attractions (DoNATAs), Density of National Parks of China (DoNPoA) | Chinese Ministry of Culture and Tourism (https://www.mct.gov.cn/ (accessed on 5 December 2023)) | / | |
| Methods | Formulas | Definition | Description | Number |
|---|---|---|---|---|
| Multi-distance spatial cluster analysis | where m is the number of TVs in the study area, d is the distance, and C is the area of the study area. is the weight. | The TVs exhibit a clustered distribution if is greater than 0, while less than 0 suggests a dispersed distribution. | (1) | |
| Geographical Concentration Index (GCI) | where is the GCI of the TVs, is the number of TVs in the a-th city-level administrative district, represents the total number of TVs, and n is the total number of prefecture-level cities. | The value of ranges from 0 to 100, with higher values indicating a more concentrated configuration of TVs and lower values indicating a more dispersed configuration. | (2) | |
| Imbalance index (IMI) | stands for the total number of prefecture-level cities within the research area, and represents the accumulated percentage of the ranking of the ratio of TVs in each prefecture-level city to all TVs in the area, from the largest to the smallest, at the i-th position. | The value of S is between 0 and 1. When S = 0, TVs are evenly distributed across all prefecture-level cities; when S = 1, all TVs are concentrated in one city. | (3) | |
| Kernel density (KDE) analysis | is the KDE estimate, with as the search bandwidth. Additionally, represents the count of point elements, () denotes the distance from the estimated point to , and is the kernel function. | A higher value of indicates a greater level of clustering, while conversely, a lower value indicates a sparser distribution of points. | (4) | |
| Moran’s I | where and are the counts of the point features in regions a and b, respectively; is the mean value of , , …, ; represents the spatial weights matrix; and m refers to the count of spatial cells. | The Moran’s I statistic ranges from −1 to 1. If I > 0, it demonstrates the presence of positive space autocorrelation, whereas I < 0 shows the presence of negative space autocorrelation. If I = 0, it demonstrates the absence of space autocorrelation. | (5) | |
| Getis-Ord Gi* | is the attribute value of feature b, is the spatial weight between feature a and feature b, n is the total count of features, is the mean value, and is the standard deviation of . | Higher z-scores indicate the presence of significant spatial clustering of high attribute values, often referred to as hot spots. In comparison, lower z-scores indicate the presence of significant spatial clustering of low attribute values, often referred to as cold spots. | (6) |
| Continuous Variable | Discretization Method | Optimal Classification | Continuous Variable | Discretization Method | Optimal Classification |
|---|---|---|---|---|---|
| ELE | Quantile | 15 | DoNATA | Quantile | 12 |
| RE | Natural | 13 | DoNPoA | Quantile | 13 |
| DW | Quantile | 14 | POP | Quantile | 15 |
| DoNICH | Natural | 15 | GDP | Quantile | 11 |
| DoNICHI | Natural | 13 | TP | Quantile | 15 |
| DoNCPU | Natural | 13 | NoLSE | Quantile | 14 |
| NoM | Quantile | 15 | URB | Natural | 14 |
| NoG | Quantile | 15 | TRA | Quantile | 14 |
| Rank | Interactive Variable () | Interaction Type | q-Value | Enhanced Compared to | Enhanced Compared to |
|---|---|---|---|---|---|
| 1 | NoG∩POP | Enhance, bi- | 0.82663 | +89.71% | +91.95% |
| 2 | DoNICHI∩TRA | Enhance, bi- | 0.81260 | +58.54% | +101.46% |
| 3 | NoG∩NoLSE | Enhance, bi- | 0.81257 | +86.48% | +92.76% |
| 4 | NoG∩TP | Enhance, nonlinear | 0.81136 | +86.20% | +156.89% |
| 5 | DoNICHI∩POP | Enhance, bi- | 0.81080 | +58.19% | +88.28% |
| 6 | DoNICHI∩TP | Enhance, bi- | 0.80440 | +56.94% | +154.69% |
| 7 | DoNICHI∩NoG | Enhance, bi- | 0.80076 | +56.23% | +83.77% |
| 8 | NoM∩NoLSE | Enhance, nonlinear | 0.79821 | +179.26% | +89.36% |
| 9 | DoNICH∩TP | Enhance, nonlinear | 0.79147 | +76.27% | +150.59% |
| Rank | Interactive Variable () | Interaction Type | q-Value | Enhanced Compared to | Enhanced Compared to |
|---|---|---|---|---|---|
| 1 | NoM∩TP | Enhance, nonlinear | 0.78380 | +174.22% | +148.17% |
| 2 | NoM∩GDP | Enhance, nonlinear | 0.75142 | +162.89% | +132.64% |
| 3 | DoNCPU∩TP | Enhance, nonlinear | 0.72819 | +177.36% | +130.56% |
| 4 | DoNATA∩TP | Enhance, nonlinear | 0.70868 | +164.60% | +124.38% |
| 5 | DoNCPU∩NoM | Enhance, nonlinear | 0.67153 | +155.78% | +134.94% |
| 6 | NoM∩DoNATA | Enhance, nonlinear | 0.65917 | +130.62% | +146.12% |
| 7 | NoM∩DoNPoA | Enhance, nonlinear | 0.65731 | +129.96% | +139.15% |
| 8 | DoNATA∩GDP | Enhance, nonlinear | 0.64982 | +142.63% | +101.19% |
| 9 | CZ∩NoM | Enhance, nonlinear | 0.59091 | +255.13% | +106.73% |
| 10 | ELE∩CZ | Enhance, nonlinear | 0.35046 | +119.31% | +110.62% |
| 11 | RE∩LZ | Enhance, nonlinear | 0.18058 | +206.57% | +126.11% |
| 12 | RE∩URB | Enhance, nonlinear | 0.12489 | +112.02% | +219.48% |
Disclaimer/Publisher’s Note: The statements, opinions and data contained in all publications are solely those of the individual author(s) and contributor(s) and not of MDPI and/or the editor(s). MDPI and/or the editor(s) disclaim responsibility for any injury to people or property resulting from any ideas, methods, instructions or products referred to in the content. |
© 2023 by the authors. Licensee MDPI, Basel, Switzerland. This article is an open access article distributed under the terms and conditions of the Creative Commons Attribution (CC BY) license (https://creativecommons.org/licenses/by/4.0/).
Share and Cite
Nie, Z.; Chen, C.; Pan, W.; Dong, T. Exploring the Dynamic Cultural Driving Factors Underlying the Regional Spatial Pattern of Chinese Traditional Villages. Buildings 2023, 13, 3068. https://doi.org/10.3390/buildings13123068
Nie Z, Chen C, Pan W, Dong T. Exploring the Dynamic Cultural Driving Factors Underlying the Regional Spatial Pattern of Chinese Traditional Villages. Buildings. 2023; 13(12):3068. https://doi.org/10.3390/buildings13123068
Chicago/Turabian StyleNie, Zhongyi, Chen Chen, Wei Pan, and Tian Dong. 2023. "Exploring the Dynamic Cultural Driving Factors Underlying the Regional Spatial Pattern of Chinese Traditional Villages" Buildings 13, no. 12: 3068. https://doi.org/10.3390/buildings13123068
APA StyleNie, Z., Chen, C., Pan, W., & Dong, T. (2023). Exploring the Dynamic Cultural Driving Factors Underlying the Regional Spatial Pattern of Chinese Traditional Villages. Buildings, 13(12), 3068. https://doi.org/10.3390/buildings13123068