Abstract
This paper introduces a method to create a moment-resisting edge connection between two cross-laminated timber (CLT) panels. With this connection, two-way spanning cross-laminated timber slabs can be realised, where the span exceeds the manufacturing and transport-related width of the individual CLT panels. Until now, mostly on-site gluing solutions have been suggested for such connections. In this study, a solution using a timber–concrete–composite (TCC) system is proposed. For this, self-tapping screws are inserted along the edge face of the CLT component, enabling the formation of a lap splice between two adjacent CLT elements. This lap splice is reinforced by additional rebars and filled with concrete. This means that only familiar, easy-to-handle materials are used on-site, and there is no need for adhesives, which can be difficult to apply. To evaluate the load-bearing capacity of the connection, it was subjected to a pure bending load in four-point bending tests, where load-bearing capacities of up to 70% of the characteristic load-bearing capacity of the solid CLT elements were achieved. An analytical approach for a simplified engineering calculation model is introduced to determine the load acting upon the screws. Based on the experimental results, it is shown that the analytical approach is able to adequately represent the load-bearing capacity of the connection. The analytically determined forces on the screws may then be used to carry out further verifications on this connection method.
1. Introduction
1.1. General
For several years, numerous projects have demonstrated the successful use of timber in the construction of multi-storey buildings. Currently, two main timber construction methods are used for designing such structures. One approach involves the use of wall slab systems, while the other is a combination of columns and slabs with joists. However, there is one primary construction method for multi-storey buildings—predominantly associated with concrete structures—that has not yet been commonly adopted in timber construction: the point-supported flat slab. Designers favour this method due to its possibilities for flexible floor plans and reduced ceiling heights. However, there are several critical issues that need to be considered before applying this method in timber construction.
A major challenge in this construction method is the biaxial loading of the slab. The development of CLT has provided a product for timber construction that is basically suitable for biaxial loading due to its glued, crosswise-arranged lamellas. Another issue relates to the concentrated loads in the area of the columns. In recent years, intensive research has been carried out on this topic. This led to several different solutions, including the use of inclined screws as rolling shear reinforcement [1,2], the use of a system connector [3,4,5], or the possibility of using hardwood inserts in this area [6,7].
For spans from 5.0 to 7.0 m, which are common in concrete construction, the transport and manufacturing-related width (width: 2.5–3.5 m, length: ≤22 m) of the individual CLT elements are exceeded. Therefore, the individual elements must be connected at the construction site. To ensure the biaxial load-bearing behaviour of the slab, a bending-resistant edge connection must be constructed. This paper focuses on the development of such an edge connection. However, the use of CLT edge connections is not limited to the construction of point-supported flat slabs. It may also enhance the system stiffness of other CLT slabs, whether supported on all four sides or in the area of openings.
In the literature, various methods can be found for the construction of such edge connections, capable of transferring both shear forces and bending moments. Many of these methods involve the use of splice plates made of wood-based panels arranged on both sides of the CLT. These plates are fastened either by inclined self-tapping screws [8] or by screw-press gluing [9]. A similar approach can be found in [10], especially for the secondary direction of CLT elements. In addition to the screw-press gluing, here, finger-joint-like profiles are milled in the CLT and the laminated veneer lumber (LVL) splice plates are made of beech wood. However, apart from screw-press gluing, further methods using adhesives are presented in the literature. For instance, the connection method presented in [11,12] using glued-in perforated steel plates may also be adapted to the CLT edge connection. In the method presented in [13], a special two-component polyurethane adhesive is used for a butt bonding of the narrow faces of the CLT.
While the methods based on adhesives are often described as rigid connections, it is shown in [14] that a completely rigid edge connection is not absolutely necessary, even for an application in point-supported flat slabs. Therefore, in [14,15], different approaches were investigated in terms of their rotational stiffness without relying on on-site gluing. For this, a series of tests were conducted comparing various concepts against glued-in perforated plates and a butt joint bonding using a conventional two-component epoxy adhesive. In one of these variants, splice plates made of steel in combination with inclined self-tapping screws were investigated. One concept involved a planar scarf joint, reinforced with fully threaded screws. Also, the option of pre-stressing the entire slab was examined and the prototype of a new system connector based on micro-serrated steel plates was tested. However, for use in point-supported flat slabs, only the system connector with micro-serrated steel plates achieved a sufficient rotational stiffness.
In [16], a method is proposed where screws are arranged horizontally and coupled by a screw connector. Another approach for the edge connection, beyond those primarily based on adhesives, is presented in [4,17]. This concept involves a dovetail joint filled with a synthetic reaction resin. Another approach using a dovetail joint is presented by [18]. However, this edge connection is intended for use in TCC slabs [19]. In [20], an edge connection for two-way spanning TCC slabs with CLT is shown. Here, reinforcing bars are glued into the narrow faces of the CLT and poured with concrete. This approach of glued-in rebars was then applied by [15] to create an edge connection between two CLT elements. Forces are transferred via a lap splice of this reinforcement between two adjacent CLT elements. Our prior work in [14] confirmed the capability of this connection type for point-supported flat slabs and, therefore, laid the foundation for the edge connection presented in this paper.
1.2. Description of Connection
In contrast to the approach presented in [14,15,20], where glued-in reinforcement bars were used, here fully threaded self-tapping screws are inserted into both narrow faces of the CLT panels intended for the connection. This eliminates the need to bond in the fasteners. These screws extend beyond the CLT surface, creating a lap splice between the two adjacent panels. Afterwards, this splice is reinforced with additional reinforcing bars on the construction site and then the gap between the CLT panels is poured with concrete. The main advantage and novelty of this construction method, compared to the majority of other known moment-resisting edge connections, is the elimination of any gluing, whether in the factory or on the construction site, and its combination with concrete, a well-known construction material.
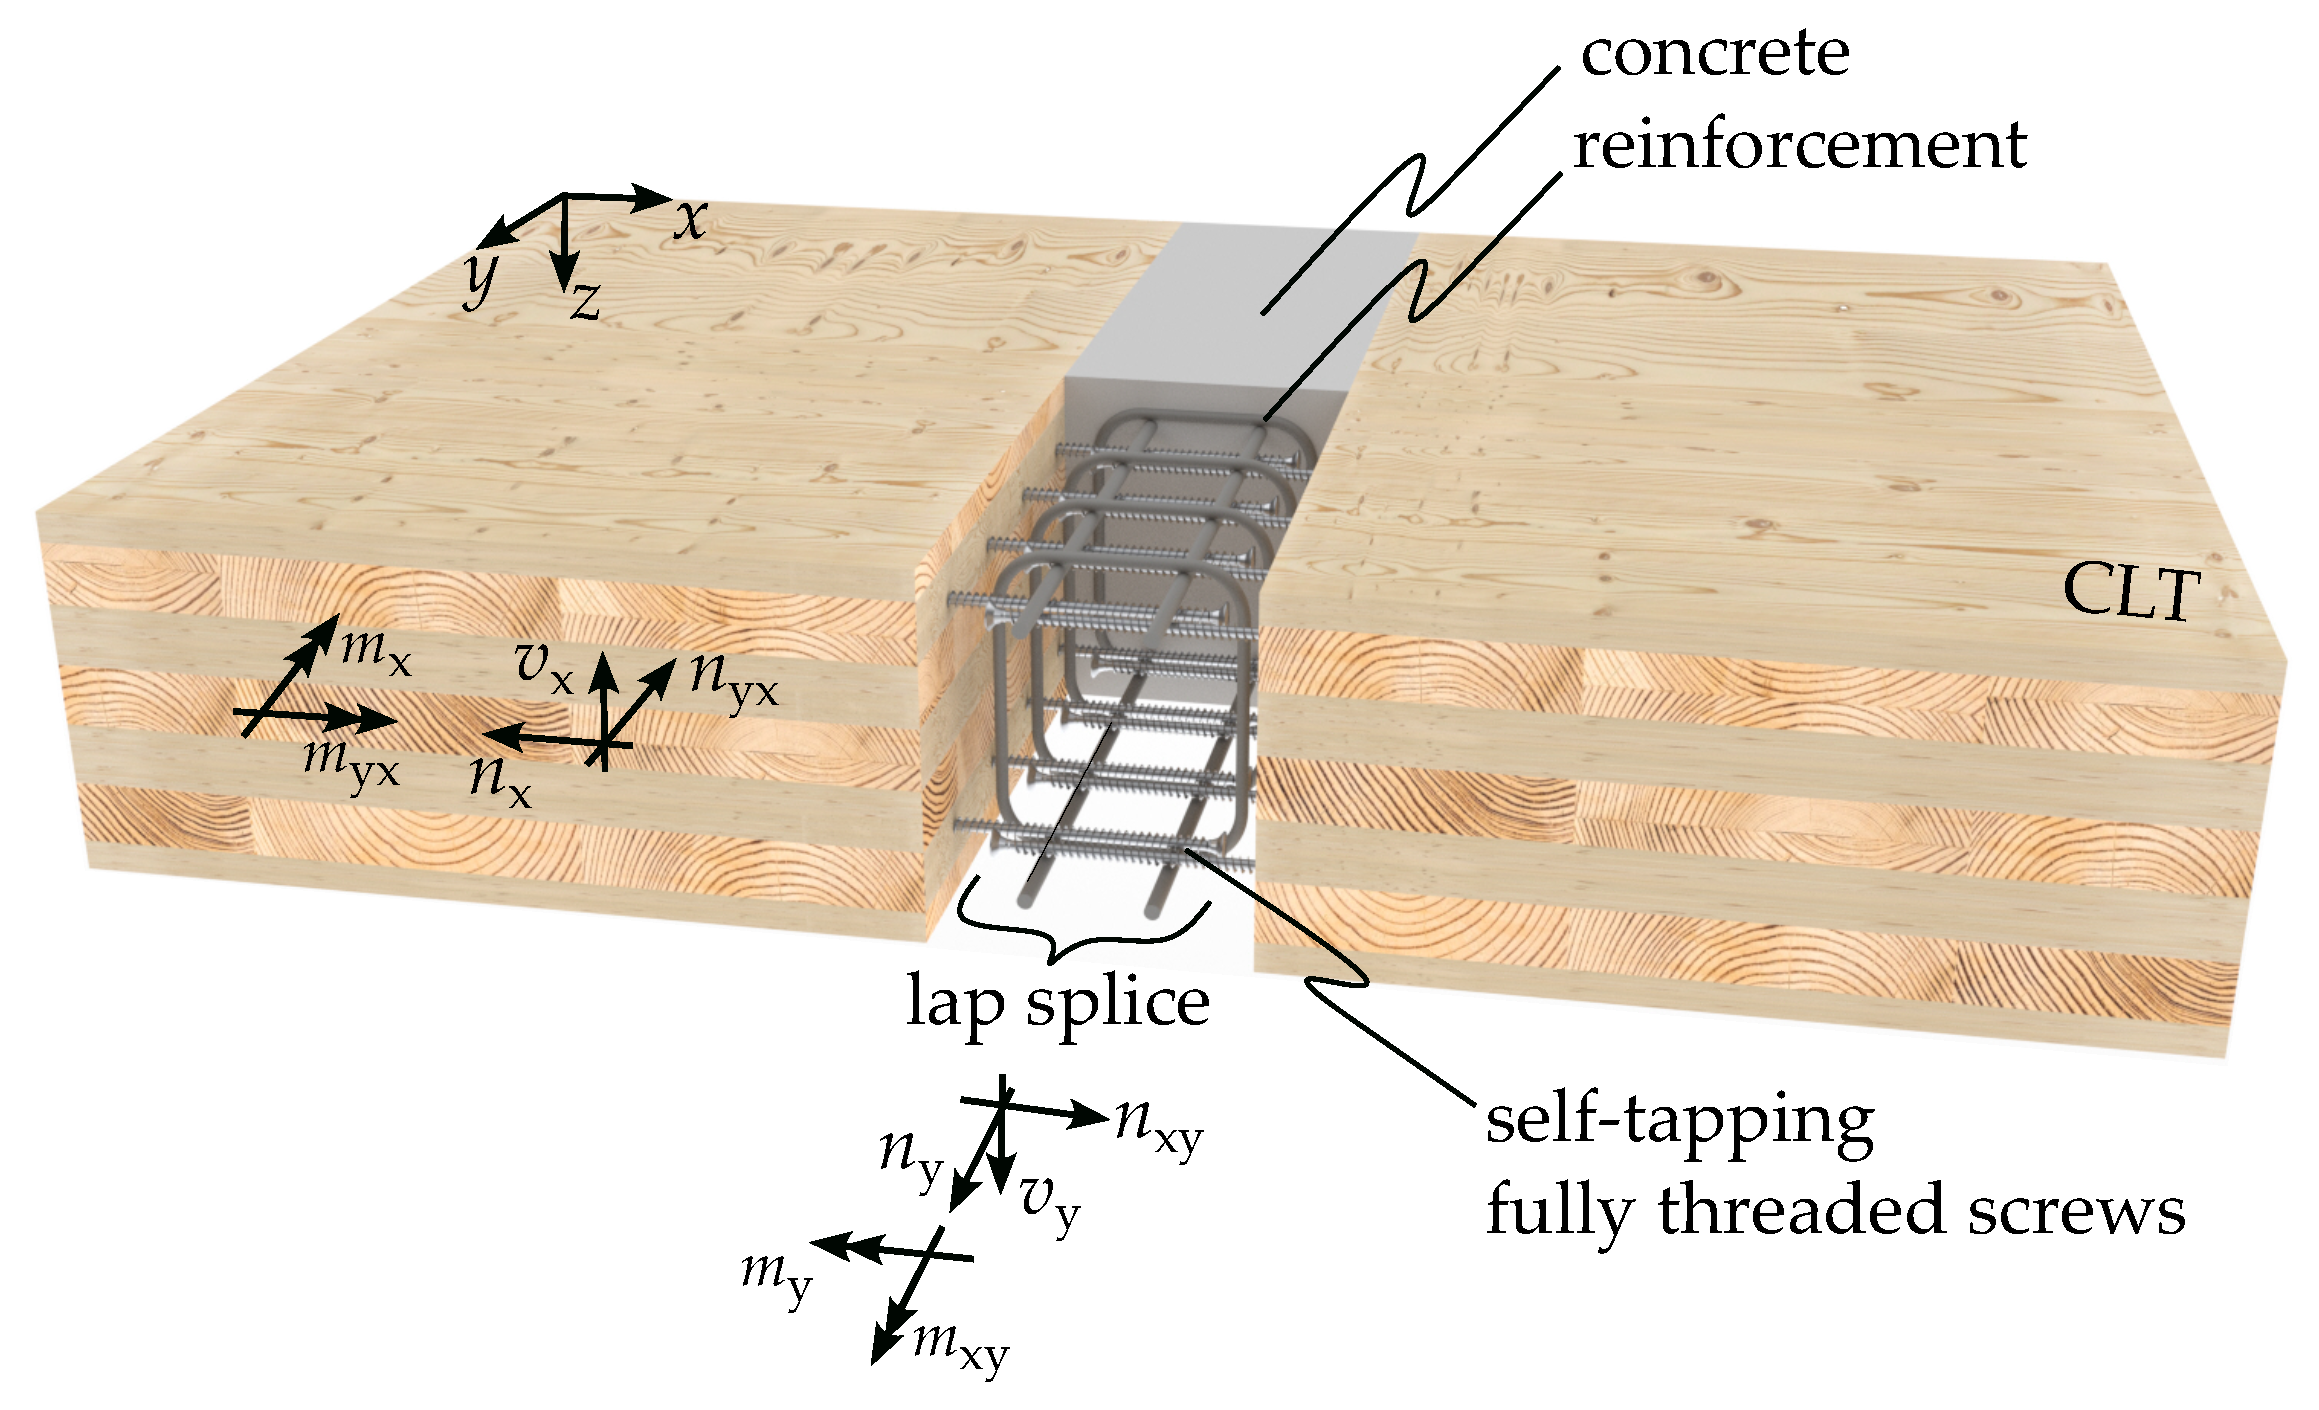
This type of joint is, in principle, suitable for enabling a two-way spanning CLT slab (see Figure 1). The transfer of forces resulting from loads perpendicular to the presented edge connection is based on the tensile load on the fasteners, combined with a contact joint between the CLT and the concrete in the compressed section. It is worth noting that any fasteners located within this compressed section of the joint may also contribute to the force transmission. Forces in the tension zone are transferred by the lap splice of the screws within the concrete. Bending moments parallel to the connection are carried by an adequate reinforcement of the concrete. Additional panel loads, such as shear forces or torsional moments, are transmitted through shear loads on the fasteners. Although the edge connection is potentially capable of carrying loads in different directions, the investigations presented in this paper focus on the primary load-bearing direction. Therefore, in this study, the loading of the connection by a pure bending moment perpendicular to the joint () is investigated.

Figure 1.
Concept of the connection and forces.
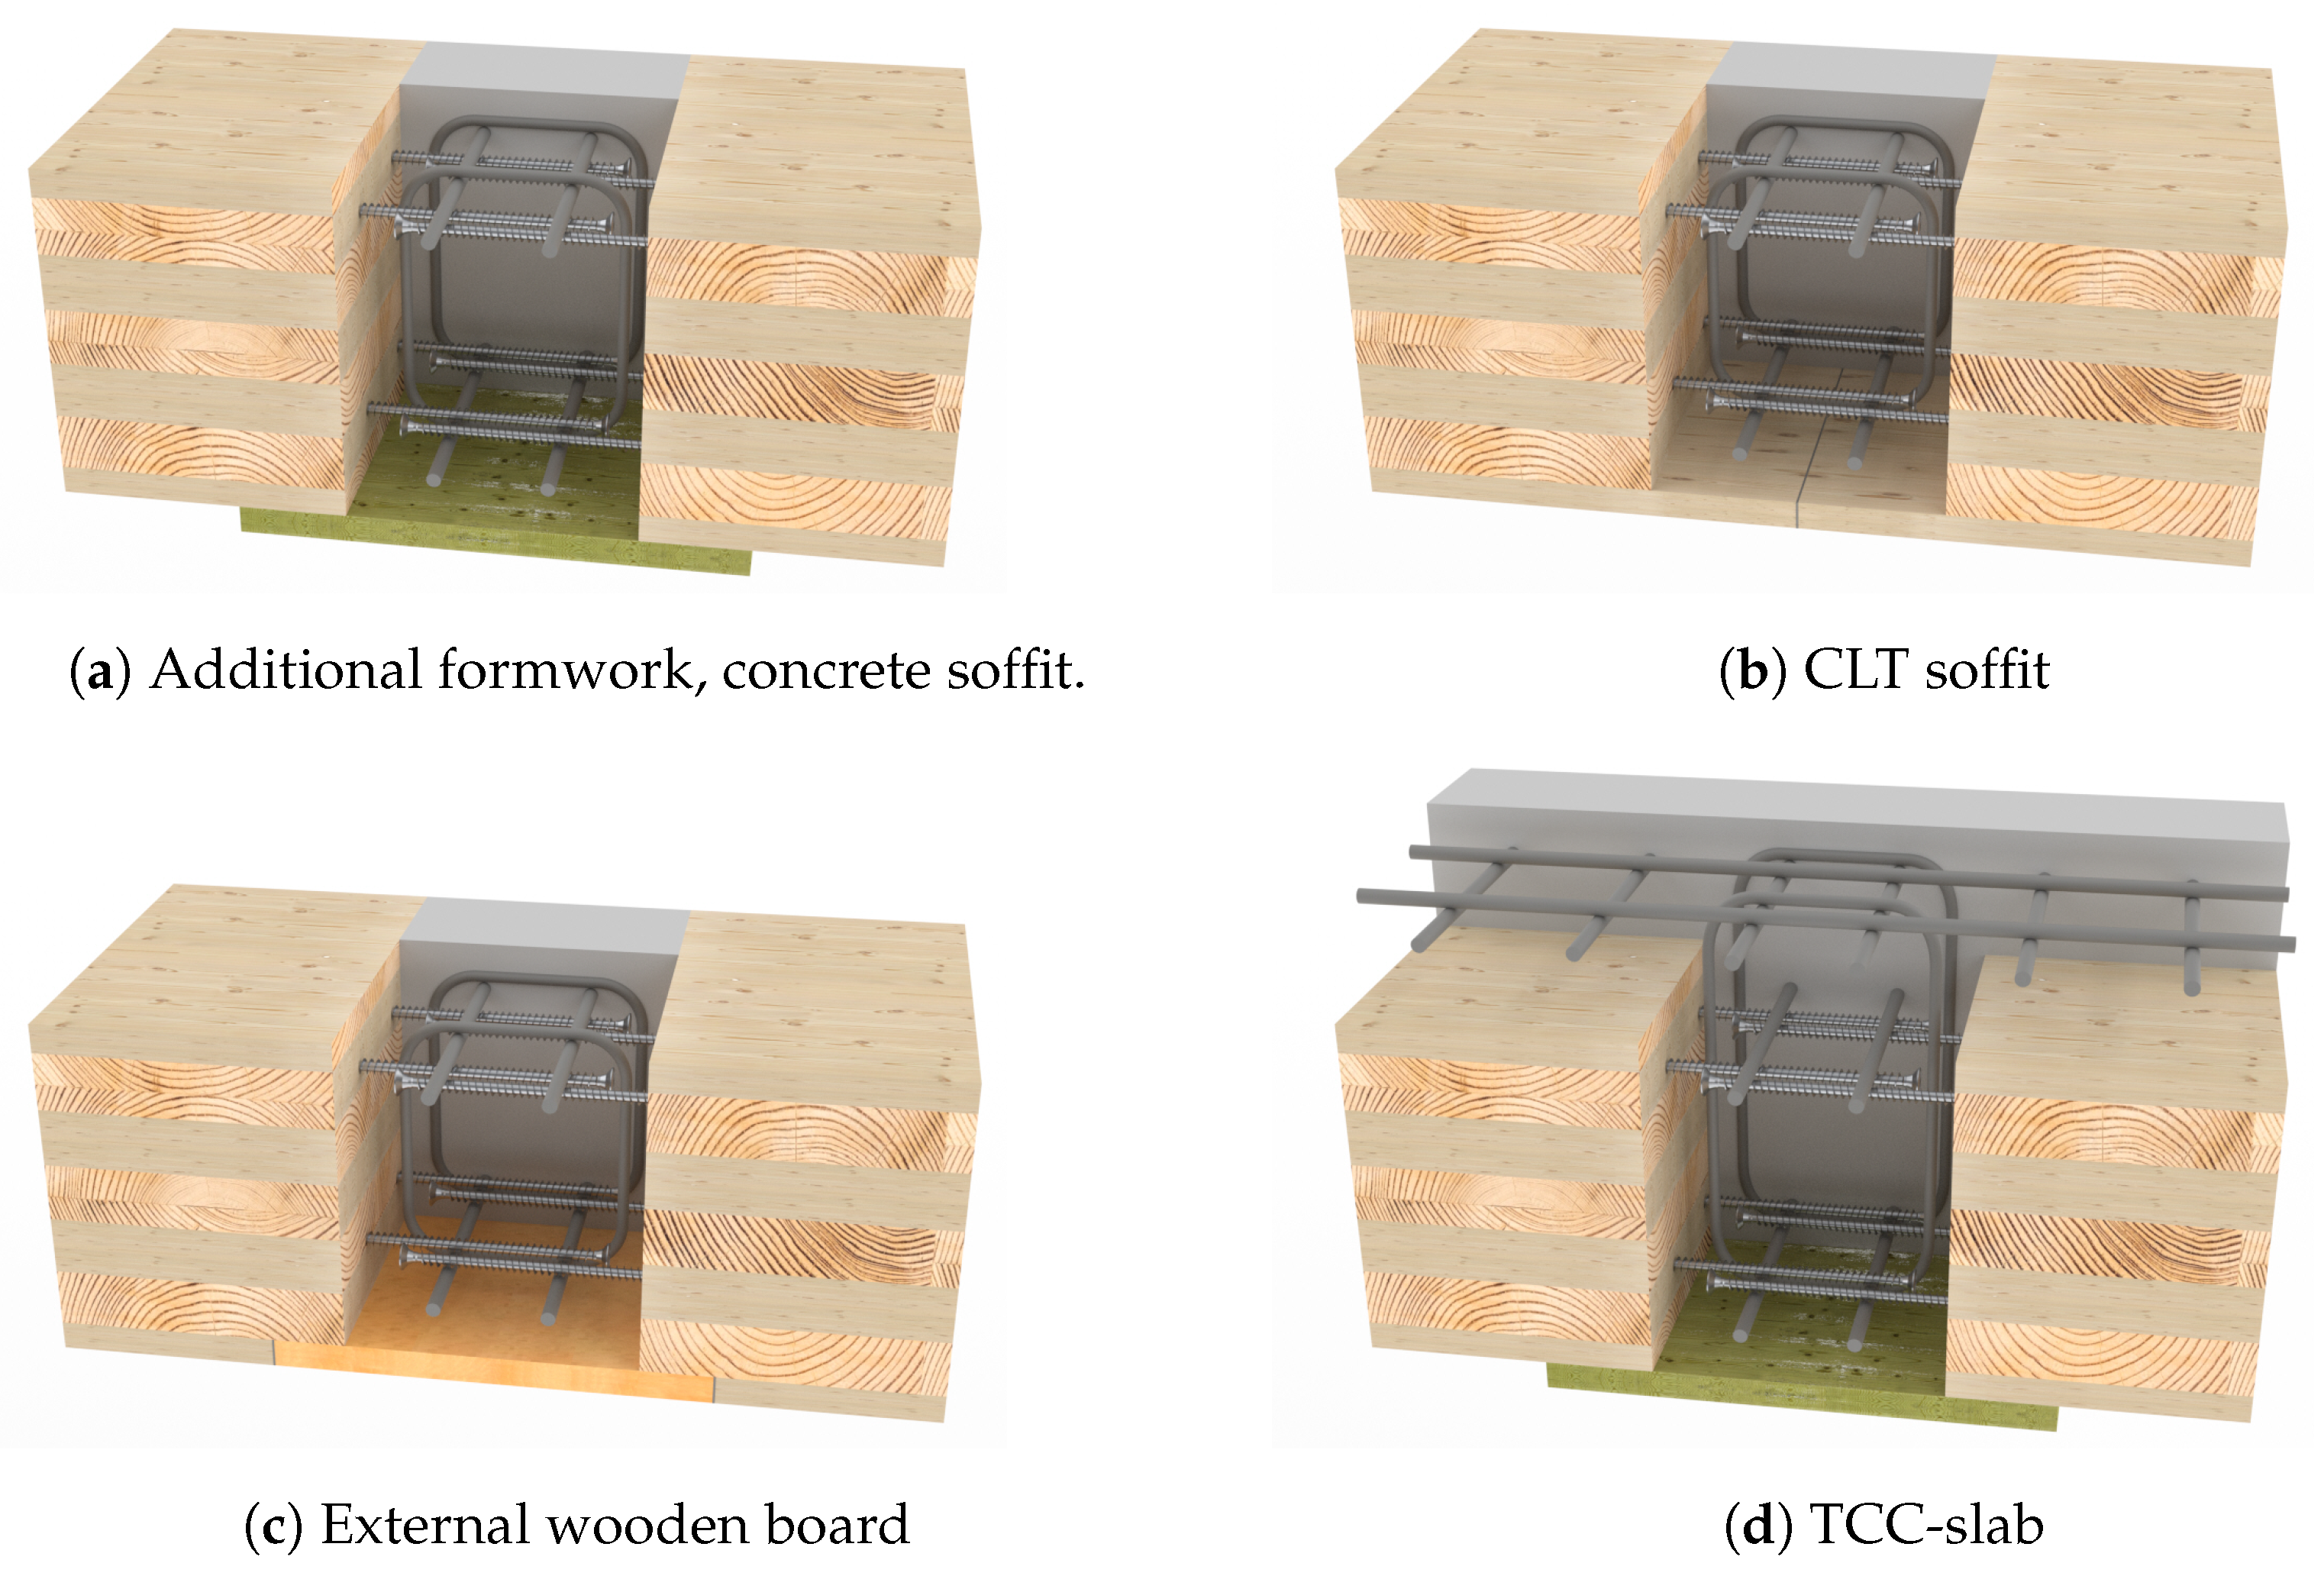
Since it is possible to insert the fasteners into the narrow faces of the CLT elements at the factory, the work on the construction site is limited to reinforcing the connection with stirrups and longitudinal reinforcement made of conventional reinforcement steel before pouring the concrete. During these construction phases, the slab has to be supported. Depending on the design of the bottom view (see Figure 2), formwork may be necessary. In principle, with this system, a timber soffit is also realisable. It is possible to cut out the concrete section from the CLT or use an external wooden board on the bottom side. Moreover, this edge connection may also be adaptable for the construction of a two-way spanning TCC slab. The connection is, in principle, also applicable to recent developments involving CLT, such as the diagonal laminated timber (DLT) presented by [21,22]. This is especially relevant since this product is well-suited for use in point-supported flat slabs [23].
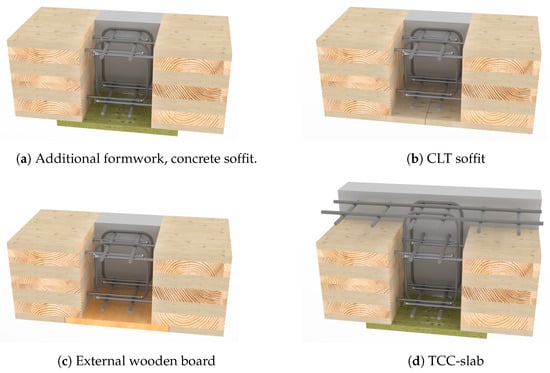
Figure 2.
Possible construction methods for the connection.
2. Materials and Methods
2.1. Experimental Investigations
2.1.1. Materials
For the production of the test specimens, CLT elements with a European Technical Assessment (ETA) [24] were used. According to the manufacturer, the total layup may be assigned to the strength class C24, whereby all outer lamellas have a strength class of T14 (C24) and 10% of class T10 (C16) can also be used for the inner lamellas. All the elements used had a width b of 800 mm, although with different lengths. For the tests, elements with different thicknesses and layups were used (Table 1). The arrangement of layers within the CLT elements was selected to achieve a balanced ratio of bending stiffness and (see Figure 1). This criterion was found to be advantageous for a possible application in a two-way spanning slab, such as point-supported flat slabs with similar distances to the supporting members. For the plates of the L5s series ( mm), the stiffness ratio is quantified as , while for the L9s series ( mm), this ratio is calculated as . The C5s and C9s series exhibit an inverse ratio.

Table 1.
CLT for the experimental investigations.
The used self-tapping screws comply with the ETA [25]. For the tests, fully threaded screws with carbon steel and nominal diameters mm (VGS-9, nominal length mm) and mm (VGS-13, mm) were used. In order to ensure a precise application, pilot holes (depth approximately 130 mm) with diameters smaller than the core diameter of the screws were pre-drilled.
The concrete used conformed to the strength class C 25/30-XC1 according to Eurocode 2 [26]. The nominal maximum aggregate size (, according to [26]), was selected with a diameter of 16 mm.
Furthermore, a water-tight barrier was installed at the contact area of the concrete and the CLT elements within the test specimens, in accordance with the recommendations given in [27,28]. This barrier is intended to prevent moisture interaction between the two components. Its installation aims to prevent the abstraction of water from the concrete, which could lead to a reduction of the compressive strength, as well as water absorption that might reduce the compressive strength and stiffness in the contact area to the CLT as a result (cf. [29]). Toward this aim, a one-sided self-adhesive tape with a polyethylene (PE) film is applied to the CLT narrow faces.
2.1.2. Test Specimens
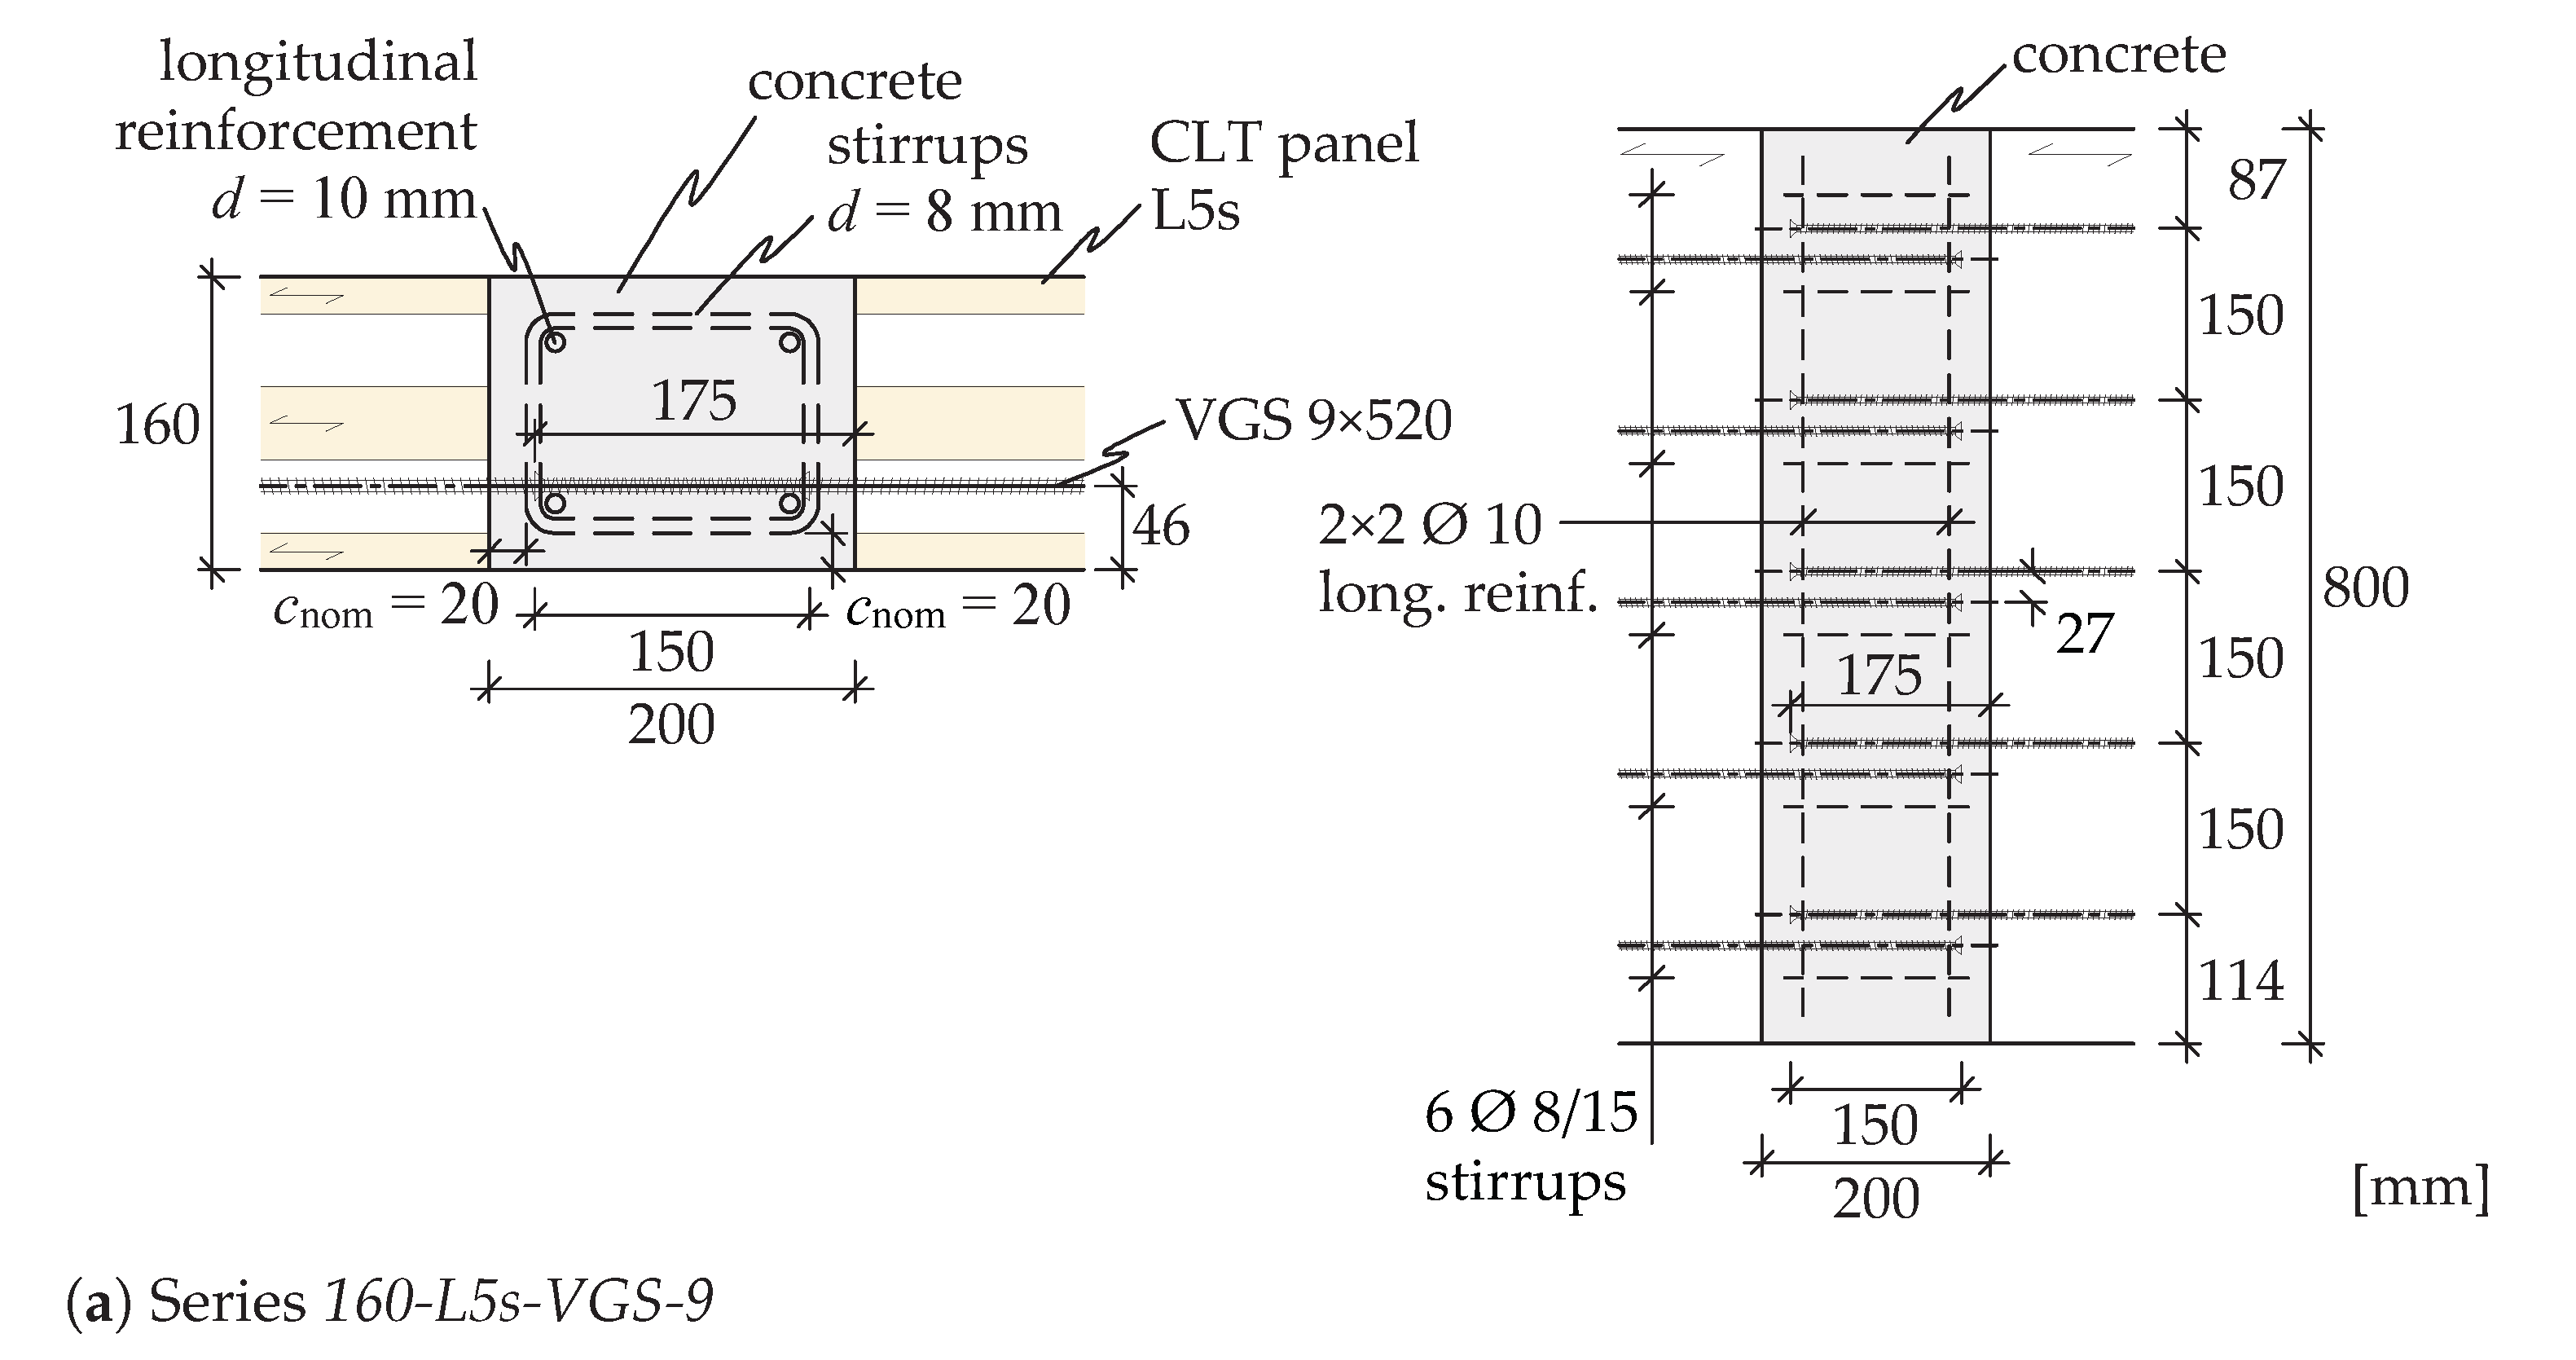
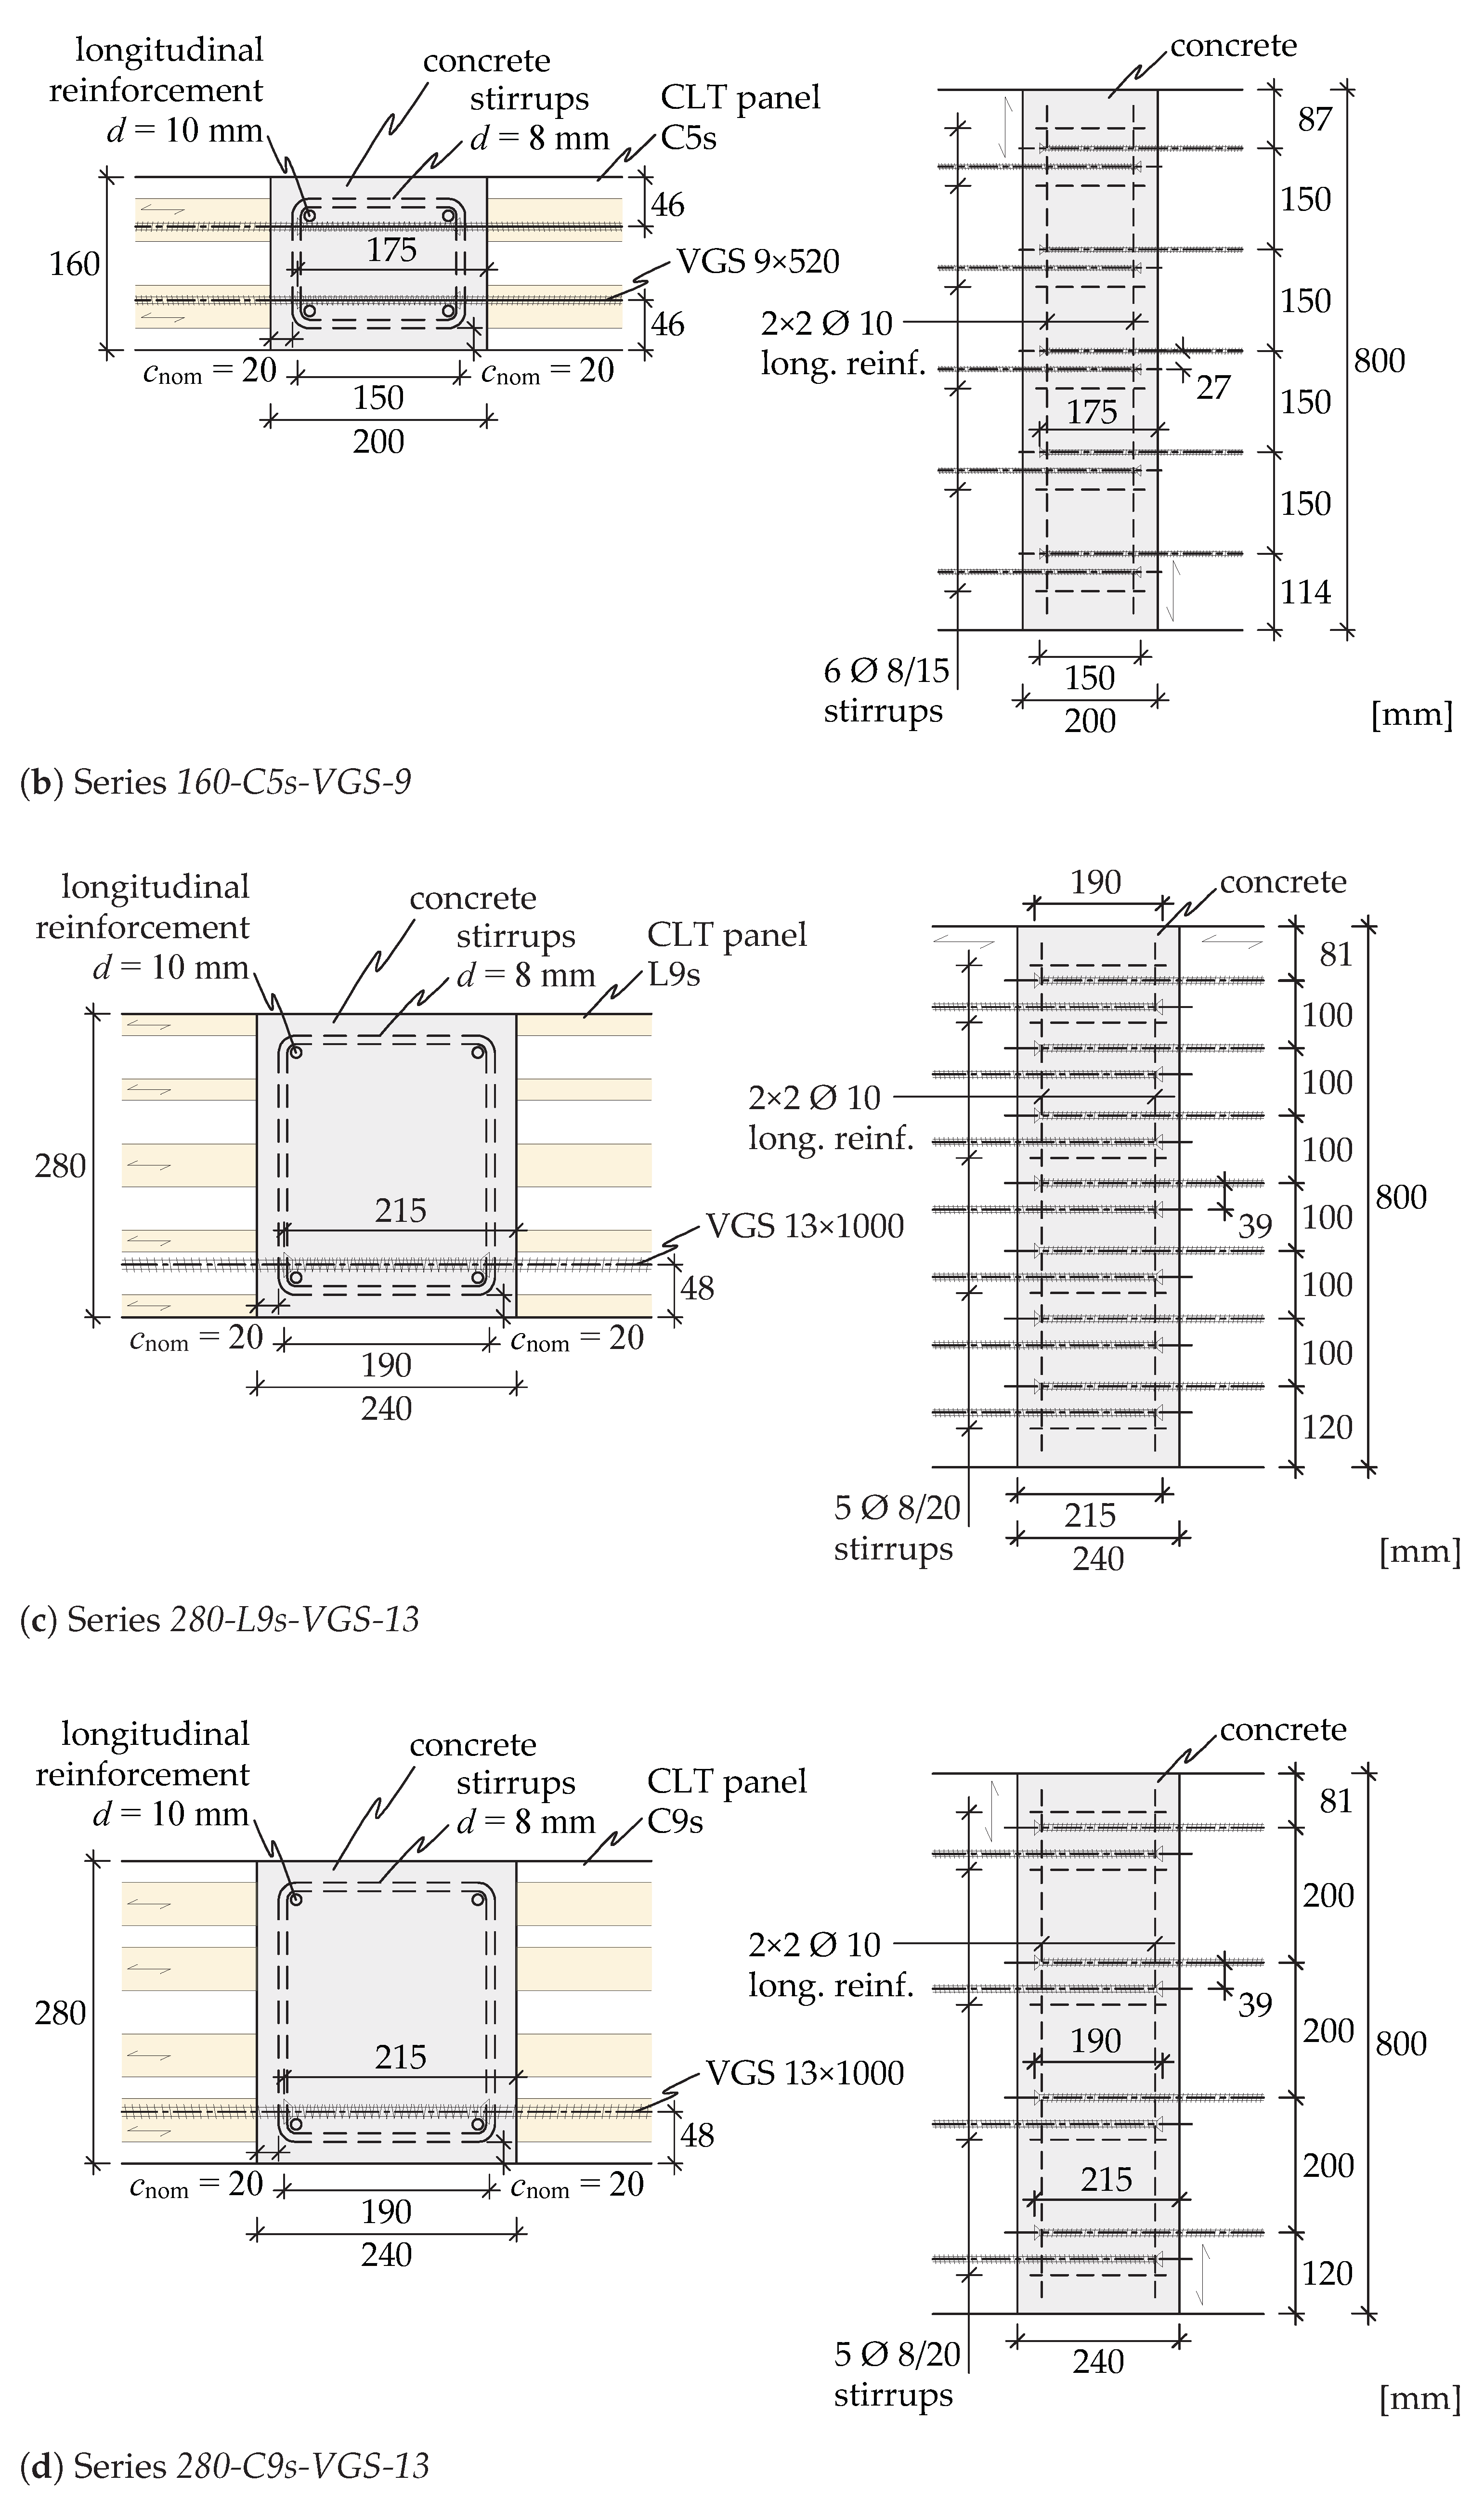
A total of 12 test specimens were tested in 4 series with 3 tests each. The test specimens for each series are illustrated in Figure 3. In these series, several parameters were varied, including the number and diameter of the screws, the height and layup of the CLT elements, as well as the width of the concrete. This selection was made to verify practical distances between the screws and validate the analytical approach on a wide range of parameters. The length of the lap splice was selected as a function of the screw diameter to prevent failure of the concrete following the regulations given in [26]. The fasteners, except for the 160-C5s-VGS-9 series, are only arranged in the tension area of the cross-section resulting from the test setup (see Figure 4). The screws are inserted at a spacing e of 100 mm to 200 mm, depending on the series. The distance between the screws in the lap splice is set to three times the nominal diameter d for all specimens. The concrete is reinforced with 8 mm diameter stirrups. A longitudinal reinforcement with a diameter of 10 mm is arranged in the corners of these stirrups. The concrete cover is taken as the minimum value according to Eurocode 2 [26], resulting from exposure class 1 (XC1). XC1 is assumed to be the equivalent of service class 1 according to Eurocode 5 [30]. The distance of the screws to the edge () results from the concrete cover and the nominal diameters of the reinforcements, including assembly clearance.
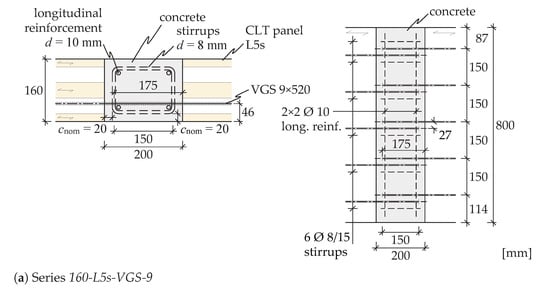
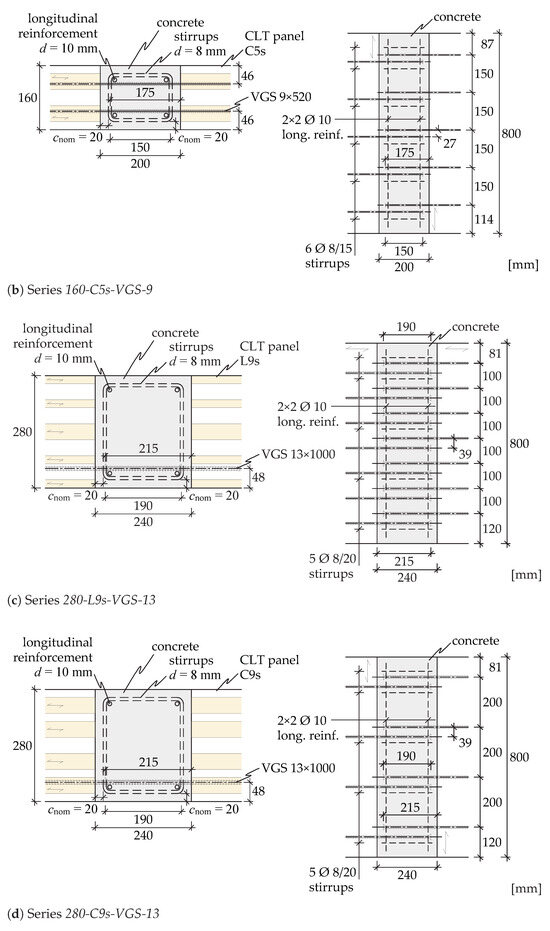
Figure 3.
Design drawings of the investigated connections—4 series with 3 tests each.
2.1.3. Test Methods
Four-point bending tests were carried out on the test specimens in accordance with the specifications given in [31,32,33]. The load was applied with a 630 kN hydraulic actuator. The load protocol was based on EN 26891 [34]. The estimated maximum load () as well as the loading rates () are given in Table 2. The maximum load () was estimated based on analytical assumptions. An adjustment of this load, as provided in [34], for a deviation of more than 20% compared to the maximum load achieved (), has not been made. The tests were stopped when a clear decrease in load occurred (≥).
Table 2.
Loading rates (vn) and estimated load bearing capacity (Fest) for four-point bending tests.
During the tests, the total load on the specimens (F), the global displacement (), and the local displacement () were measured at a frequency of 5 Hz. The deformations ( and ) were recorded on both sides of the plates using displacement transducers (LVDTs). In addition, the area of the connection was recorded by an optical measurement system on both sides of the specimens for 2D digital image correlation (DIC). The images from these cameras were recorded at a frequency of 2 Hz for post-processing by the DIC software Alpha (version 2022.0.41) [35]. For the test specimens with a height of 160 mm (series 160-L5s-VGS-9 and 160-C5s-VGS-9), the measurement of the local deflection () was also carried out using the optical measurement system (frequency 5 Hz). The entire test setup, including the measuring devices, is illustrated in Figure 4.
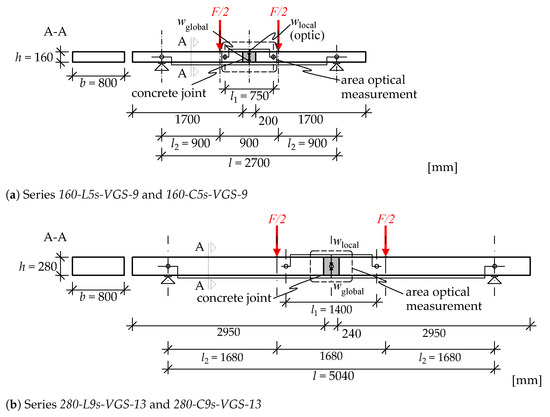
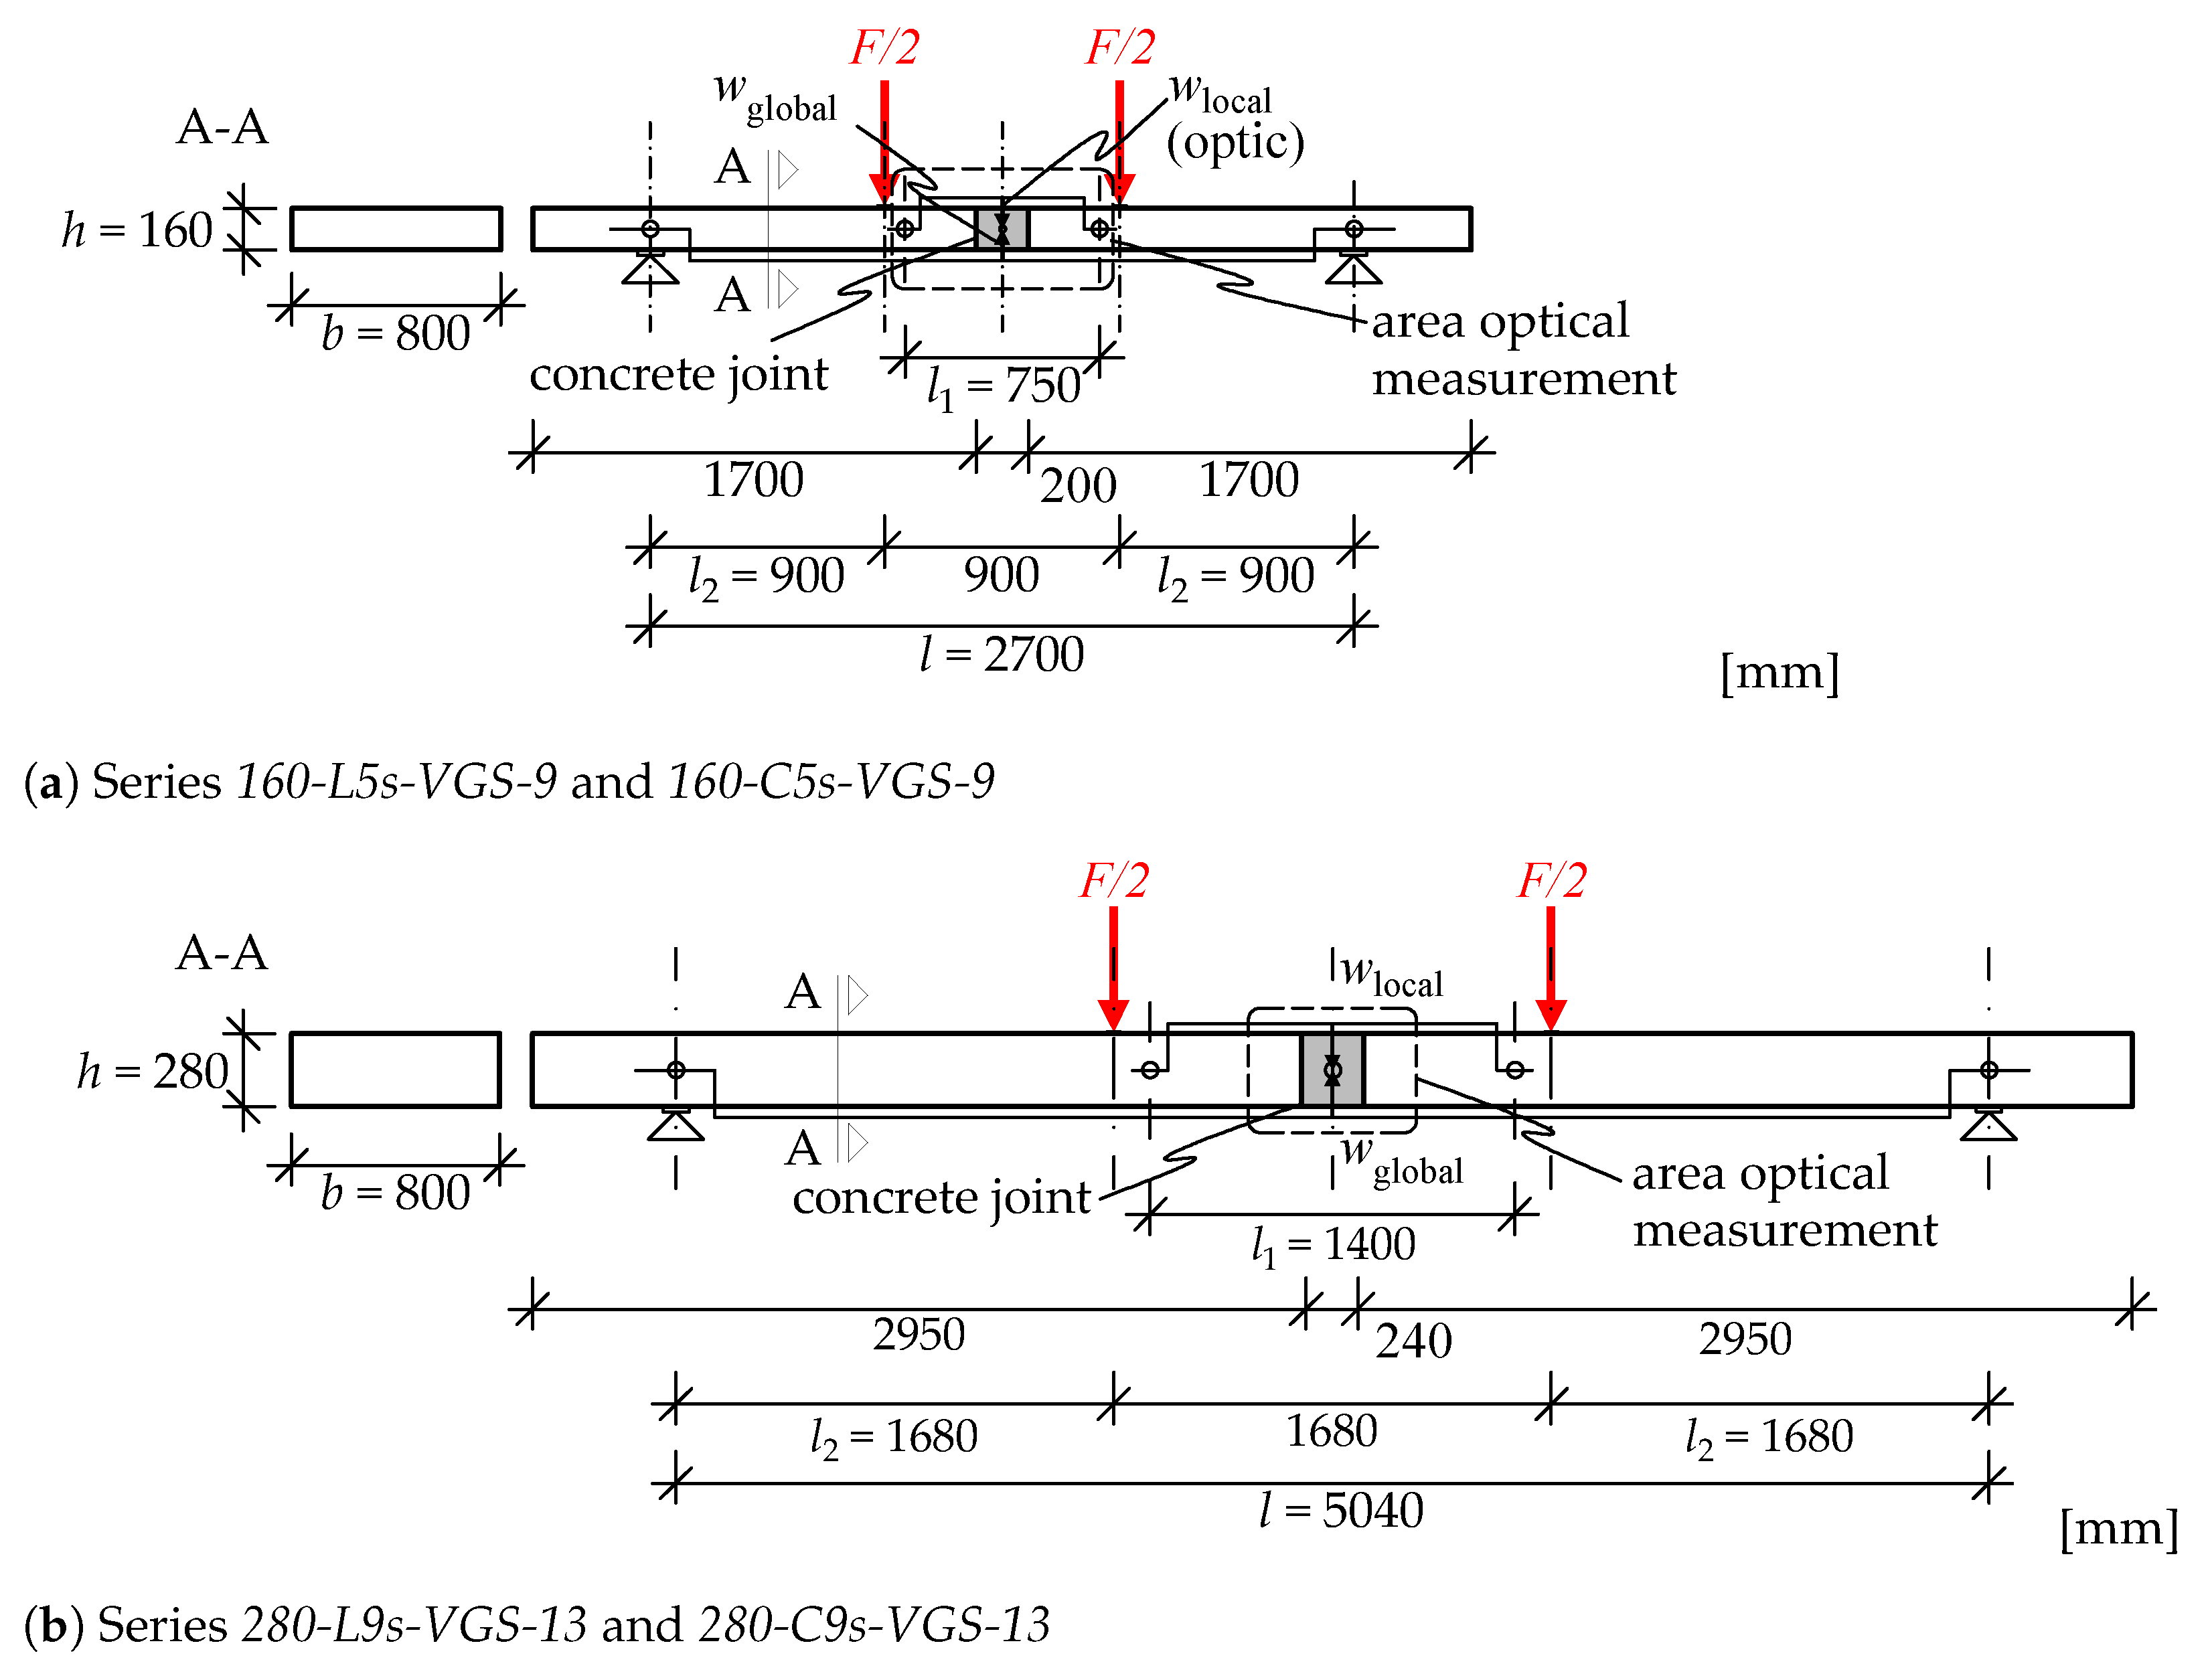
Figure 4.
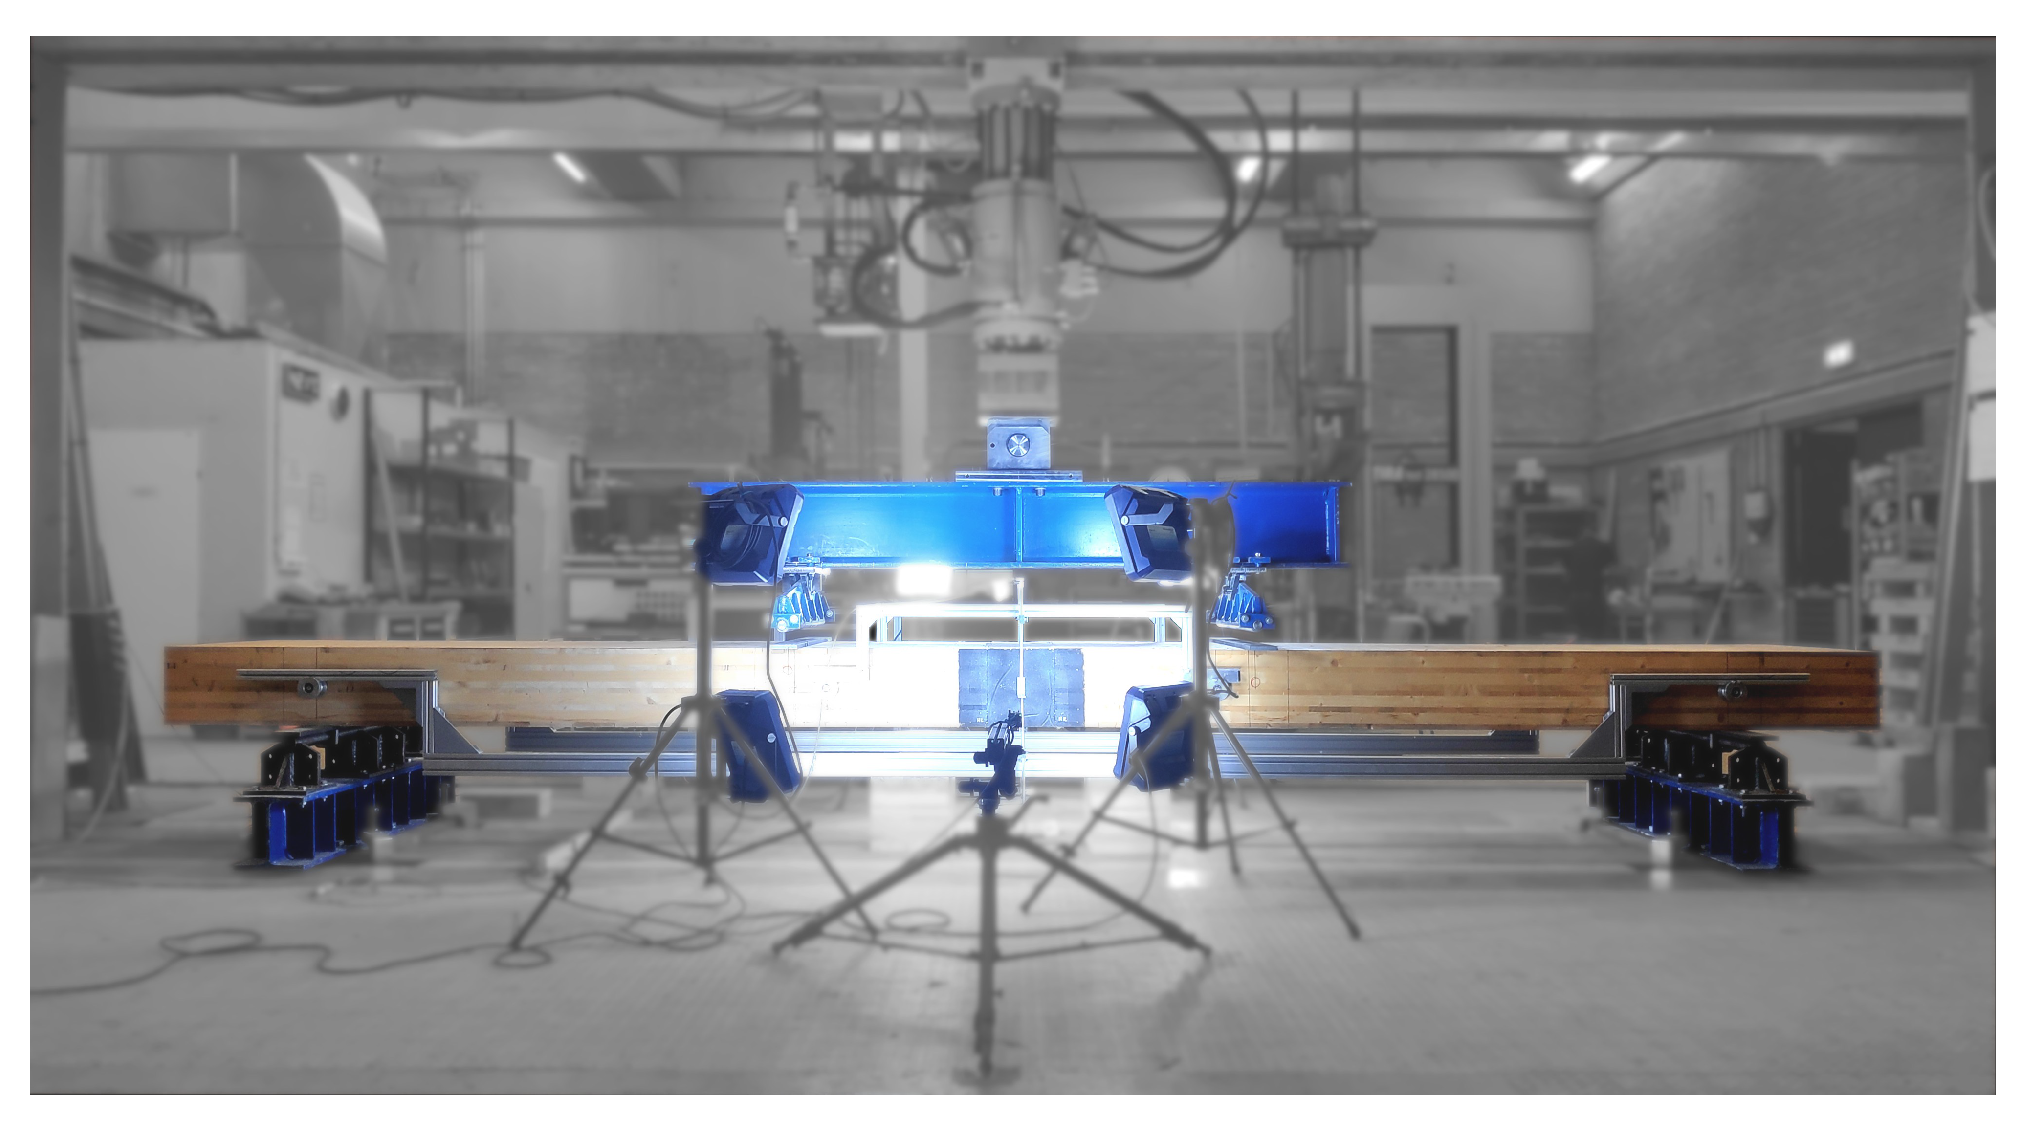
Four-point bending tests–test setup and equipment.
Figure 4.
Four-point bending tests–test setup and equipment.
Based on the measured load (F), the corresponding bending load (M) on the connection is calculated according to Equation (1) and the stiffness values, and in [N/mm], are determined through linear regression analysis in the load-deformation graph, utilising the measured deflections ( and ). This analysis is conducted within the linear elastic range, between 10% and 40% of the estimated maximum load (), on the initial loading path. Using these stiffness values, the effective global bending stiffness for the entire test specimens as well as the effective local bending stiffness may be calculated following Equations (2) and (3).
In addition to the four-point bending tests, tensile strength tests on the used screw types were conducted. These tests were performed according to [36,37,38]. The cube compressive strength of the concrete was also determined according to [39,40] to validate the quality.
2.2. Analytical Approach
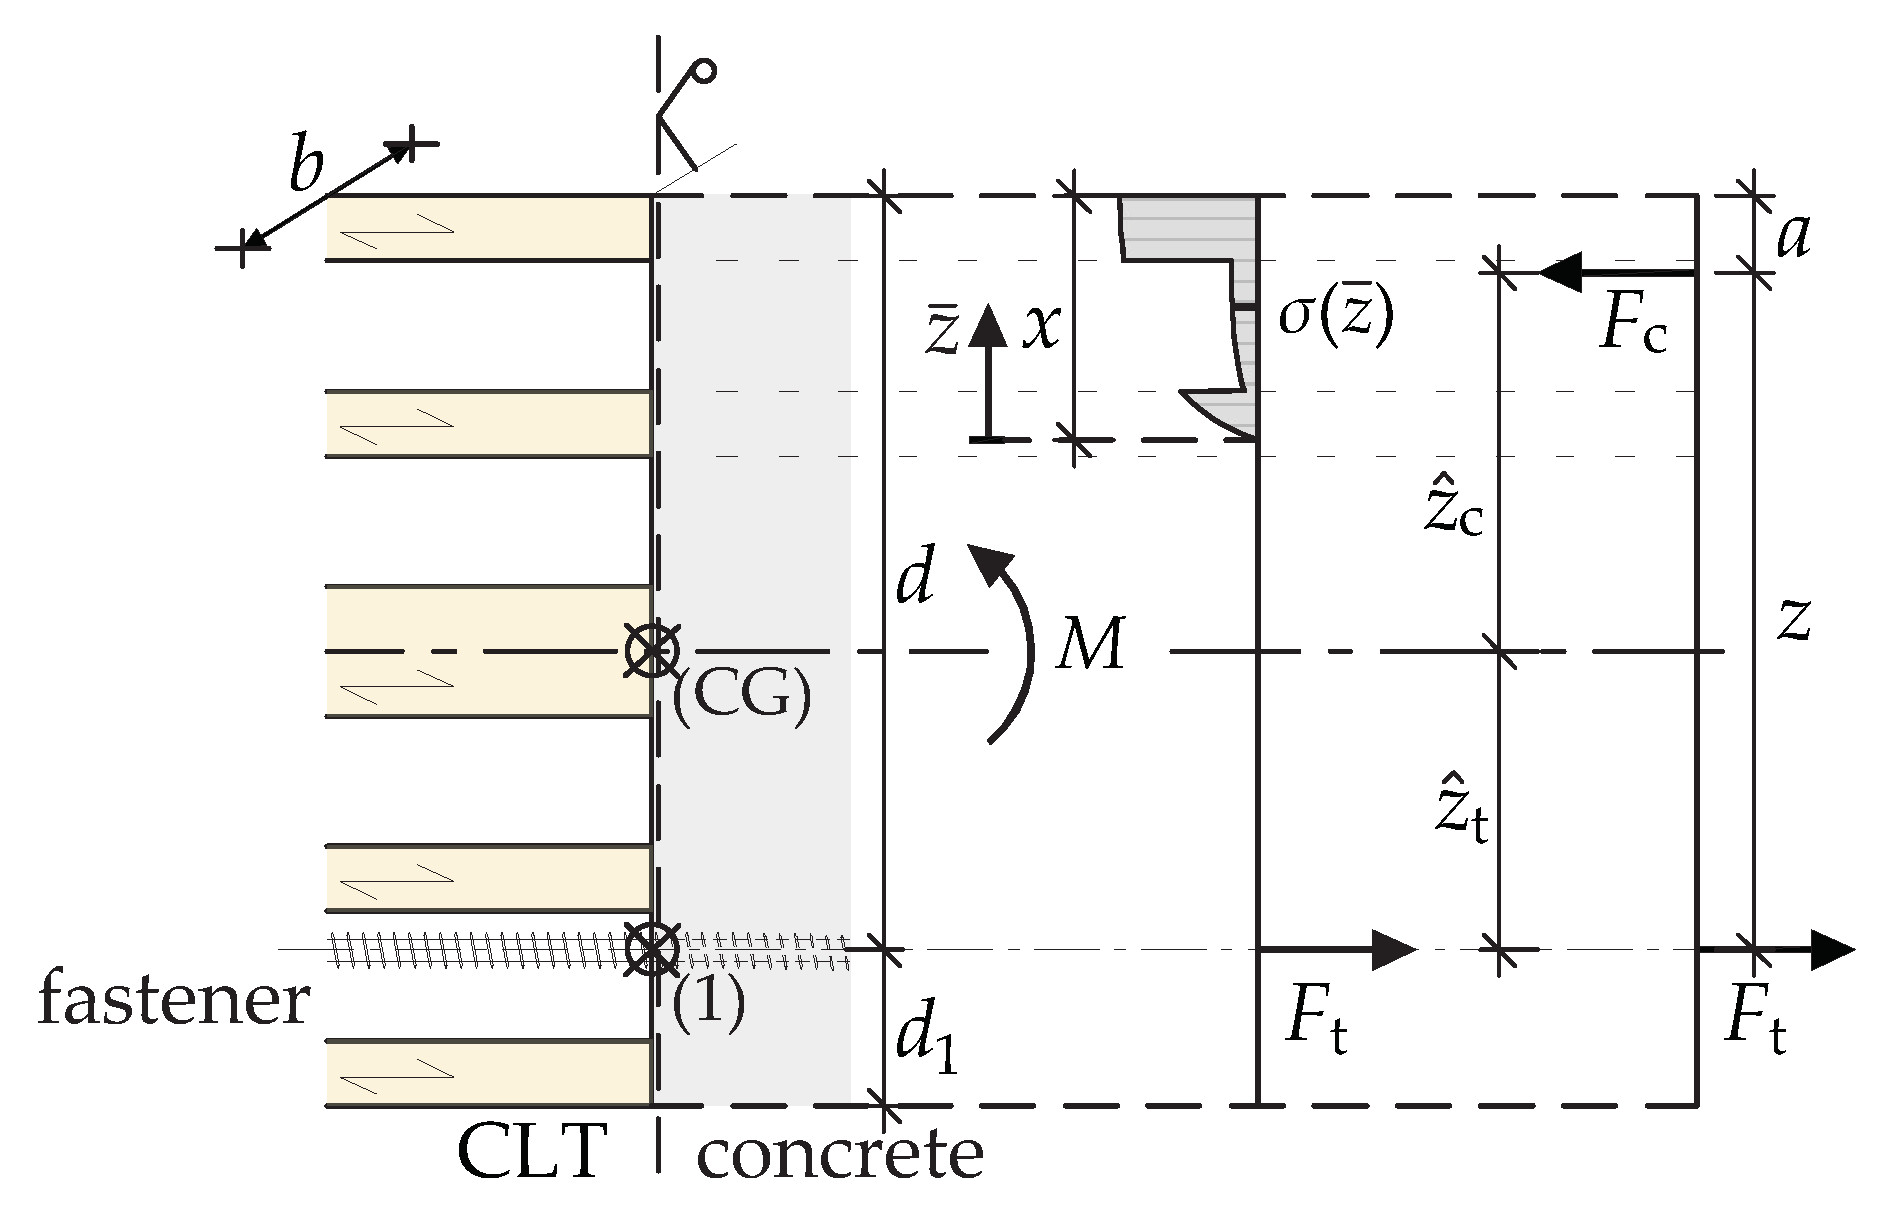
The analytical approach is focused on the evaluation of the forces acting on the fasteners when they are subjected to tensile loads due to a pure bending moment. For this, an equilibrium of forces is formed at the interface between the concrete and the cross-section of the CLT. The analytical approach does not consider rows of fasteners that are in the compression zone of the connection (as in series 160-L5s-VGS-9). In addition, the approach does not take into account the influence of the screw withdrawal stiffness. As a consequence, this approach’s scope should be limited to the evaluation of forces related to the load-bearing capacity. The design problem for a general case is illustrated in Figure 5 for a pure bending load (M).
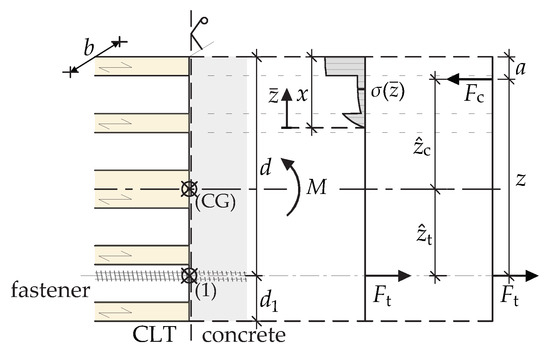
Figure 5.
Assumed stress distribution in the analytical approach for a general case under a pure bending load.
First, the resulting compressive force must be determined. This results from summing up the resulting compressive stresses over the entire compressed height x and the width b of the considered cross-section.
The distance of the resulting compressive force from the compressed edge a may be described for the general case via
In addition to the height of the compression zone x, the force in the connection has to be determined. These two values may be calculated by following the two equilibrium conditions:
Since only the pure bending of the cross-section is considered, the equilibrium for the normal forces N results in:
and the moment equilibrium around the centre of gravity for the gross section is
If the moment equilibrium is formed around the centre of gravity of the fasteners in tension, it follows from (8) to:
The height of the compression zone x is, therefore, obtained by solving the quadratic Equation (9). Using the compression zone height, the resultant compressive force may be determined according to Equation (4). The load on the fastener can be directly determined using Equation (7). For an engineering approach, it is reasonable to assume a constant compressive stress that is equal to the compressive strength . However, for CLT, this results from the orientation of the layers.
When considering the layer structure of the CLT, the following three principles have to be taken into account in this approach:
- 1.
- Within a single layer, constant compressive stress is considered.
- 2.
- The top layer in the compression zone must always be taken into account.
- 3.
- Layers exposed to compression perpendicular to the grain, situated between two layers subjected to compression parallel to the grain, should not be taken into account.
For three common cases (Figure 6, Figure 7 and Figure 8), the compression zone height x is obtained by solving Equation (9). Furthermore, the size of the resulting compressive force may be determined based on this height.
- 1.
- If the height of the compression zone is smaller than the thickness of the first layer :
 Figure 6. Compressed section .Figure 6. Compressed section .
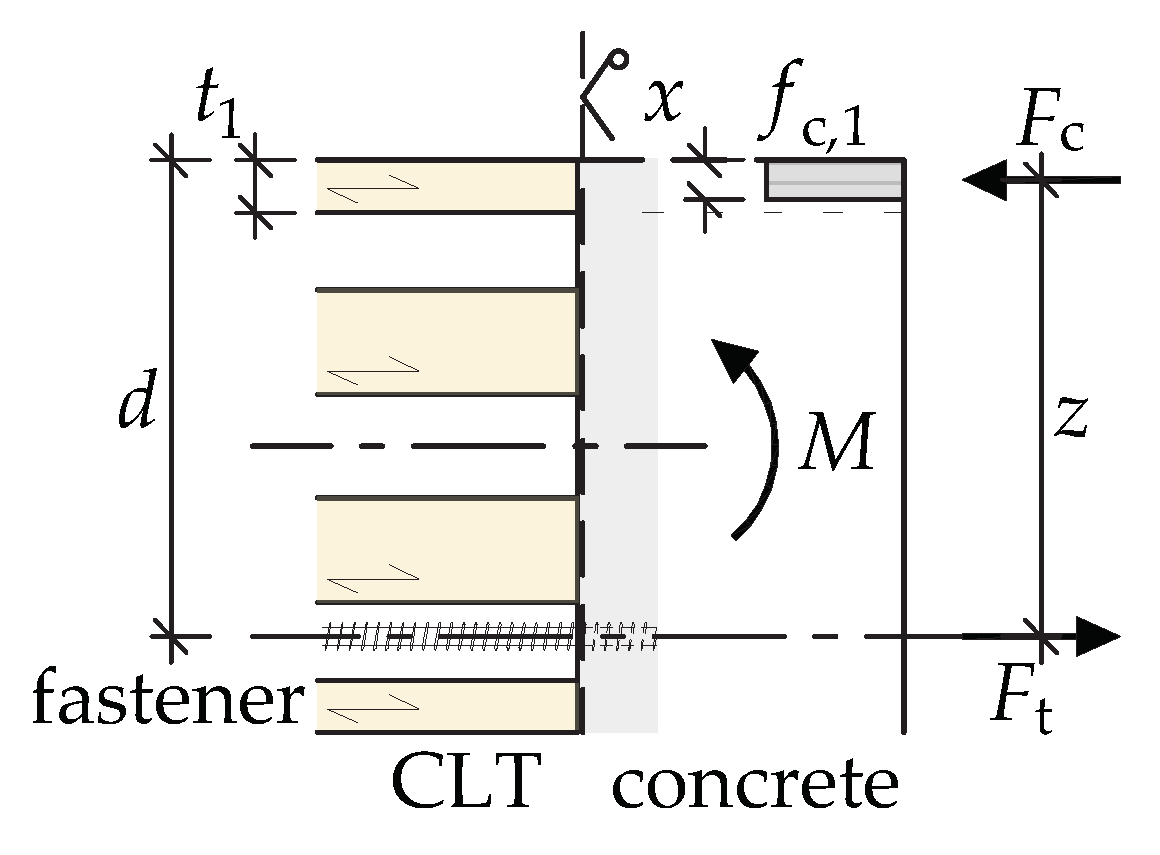
- 2.
- If the first layer is exposed to compression perpendicular to the grain and the compressed section is higher than the thickness of the first layer :
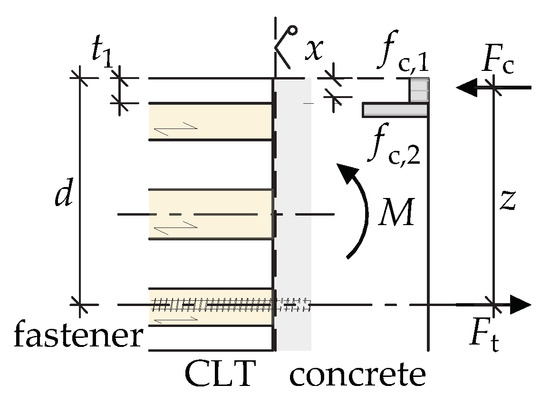 Figure 7. Compressed section and 1st layer transversal.Figure 7. Compressed section and 1st layer transversal.
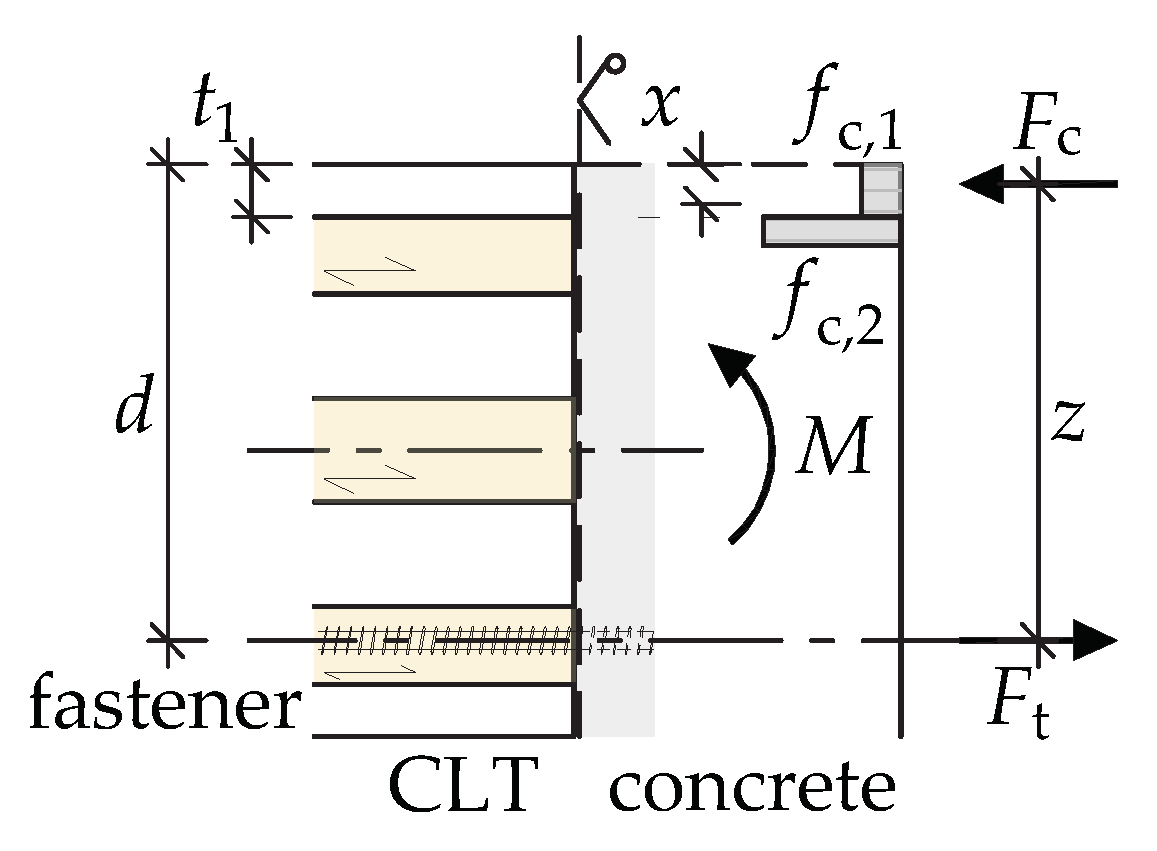
- 3.
- If the first layer is exposed to compression parallel to the grain and the compressed section is higher than the thickness of the first layer , then the second layer, which would be exposed to compression perpendicular to the grain, should not be taken into account:
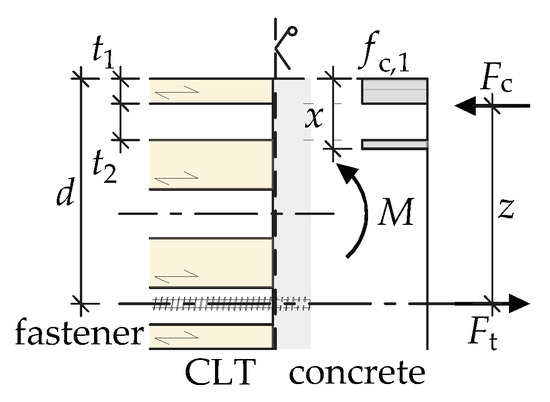 Figure 8. Compressed section and 2nd layer transversal.Figure 8. Compressed section and 2nd layer transversal.
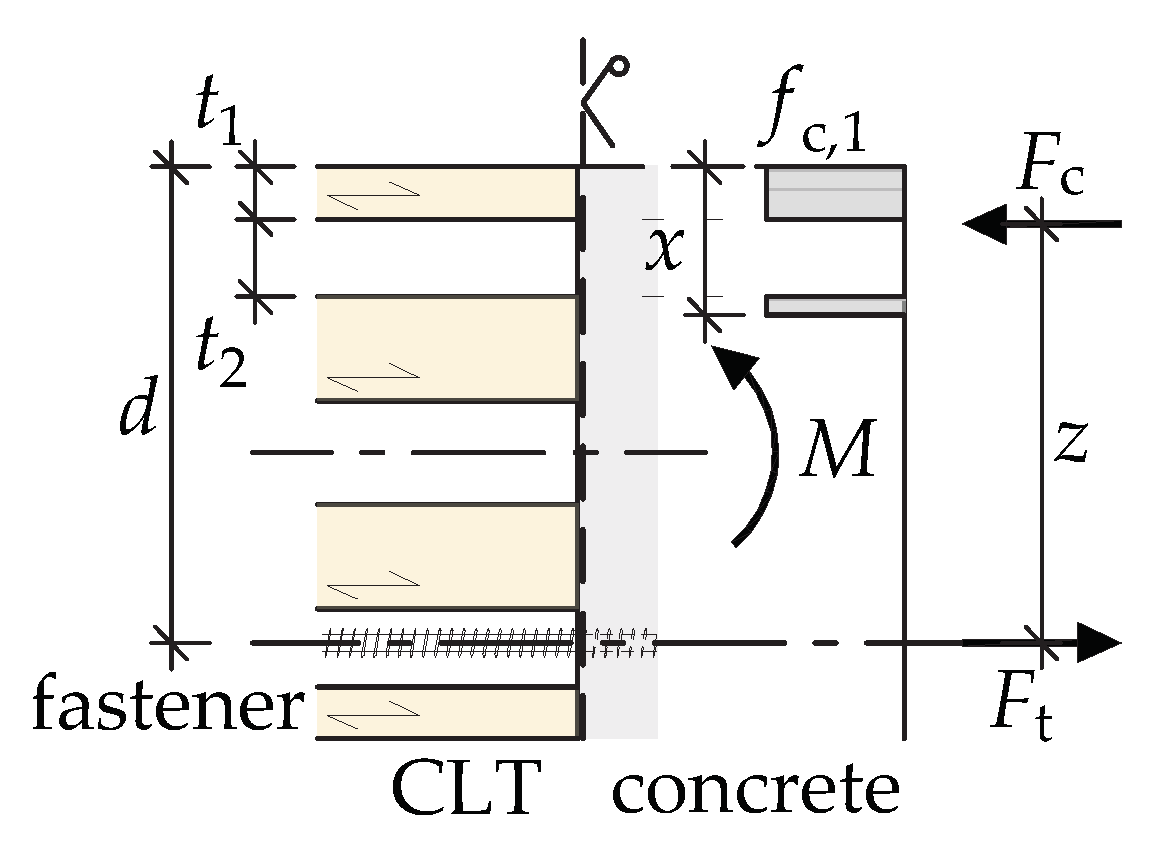
Once the axial load of the screws has been determined from the resulting compressive force with Equation (7), various possible forms of failure of the connection can be verified according to established design approaches. For example, these include:
- Withdrawal strength of the screws in the CLT panel;
- Tensile failure of the screws;
- Failure of the anchorage within the concrete;
- Failure of the lap splice within the concrete.
This study focuses on determining the tensile forces acting on the screws. For verification procedures, it is recommended to refer to the regulations of Eurocode 5 [30] in combination with the ETAs for the screws. To verify the screws within the concrete, references are given in [41]. In addition to verifying the connection, it is crucial to verify the materials themselves according to established regulations [26,30].
3. Results and Discussion of the Experimental Characterization
3.1. Experimental Results
3.1.1. Bending Tests—Deformations and Load-Carrying Capacity
The main results of the four-point bending tests, as illustrated in Figure 9, are summarised in Table 3. In addition to the load-carrying capacity of the individual test specimens, the results of the stiffness evaluation at the initial load paths and , in accordance with Equations (2) and (3), are also given. A comparison between the local and global effective bending stiffness reveals that this connection cannot be classified as a rigid connection. As already mentioned, in one of our previous papers [14], we demonstrated that a fully rigid edge connection is not required for point-supported flat slabs. It is shown that the influence on the vibration behaviour of the slab is negligible above a certain stiffness of the connection. However, the tests presented in the paper at hand were not designed to investigate the stiffness of the connection but to validate the design approach for the load-bearing capacity. Consequently, except for the series 160-C5s-VGS-9, a second row of fasteners in the compressed section was not included in the test series. Therefore, the stiffness of the connection will not be discussed further in this paper.

Figure 9.
Test setup: four-point bending tests with the 2D DIC-System.
Table 3.
Test results: four-point bending tests.
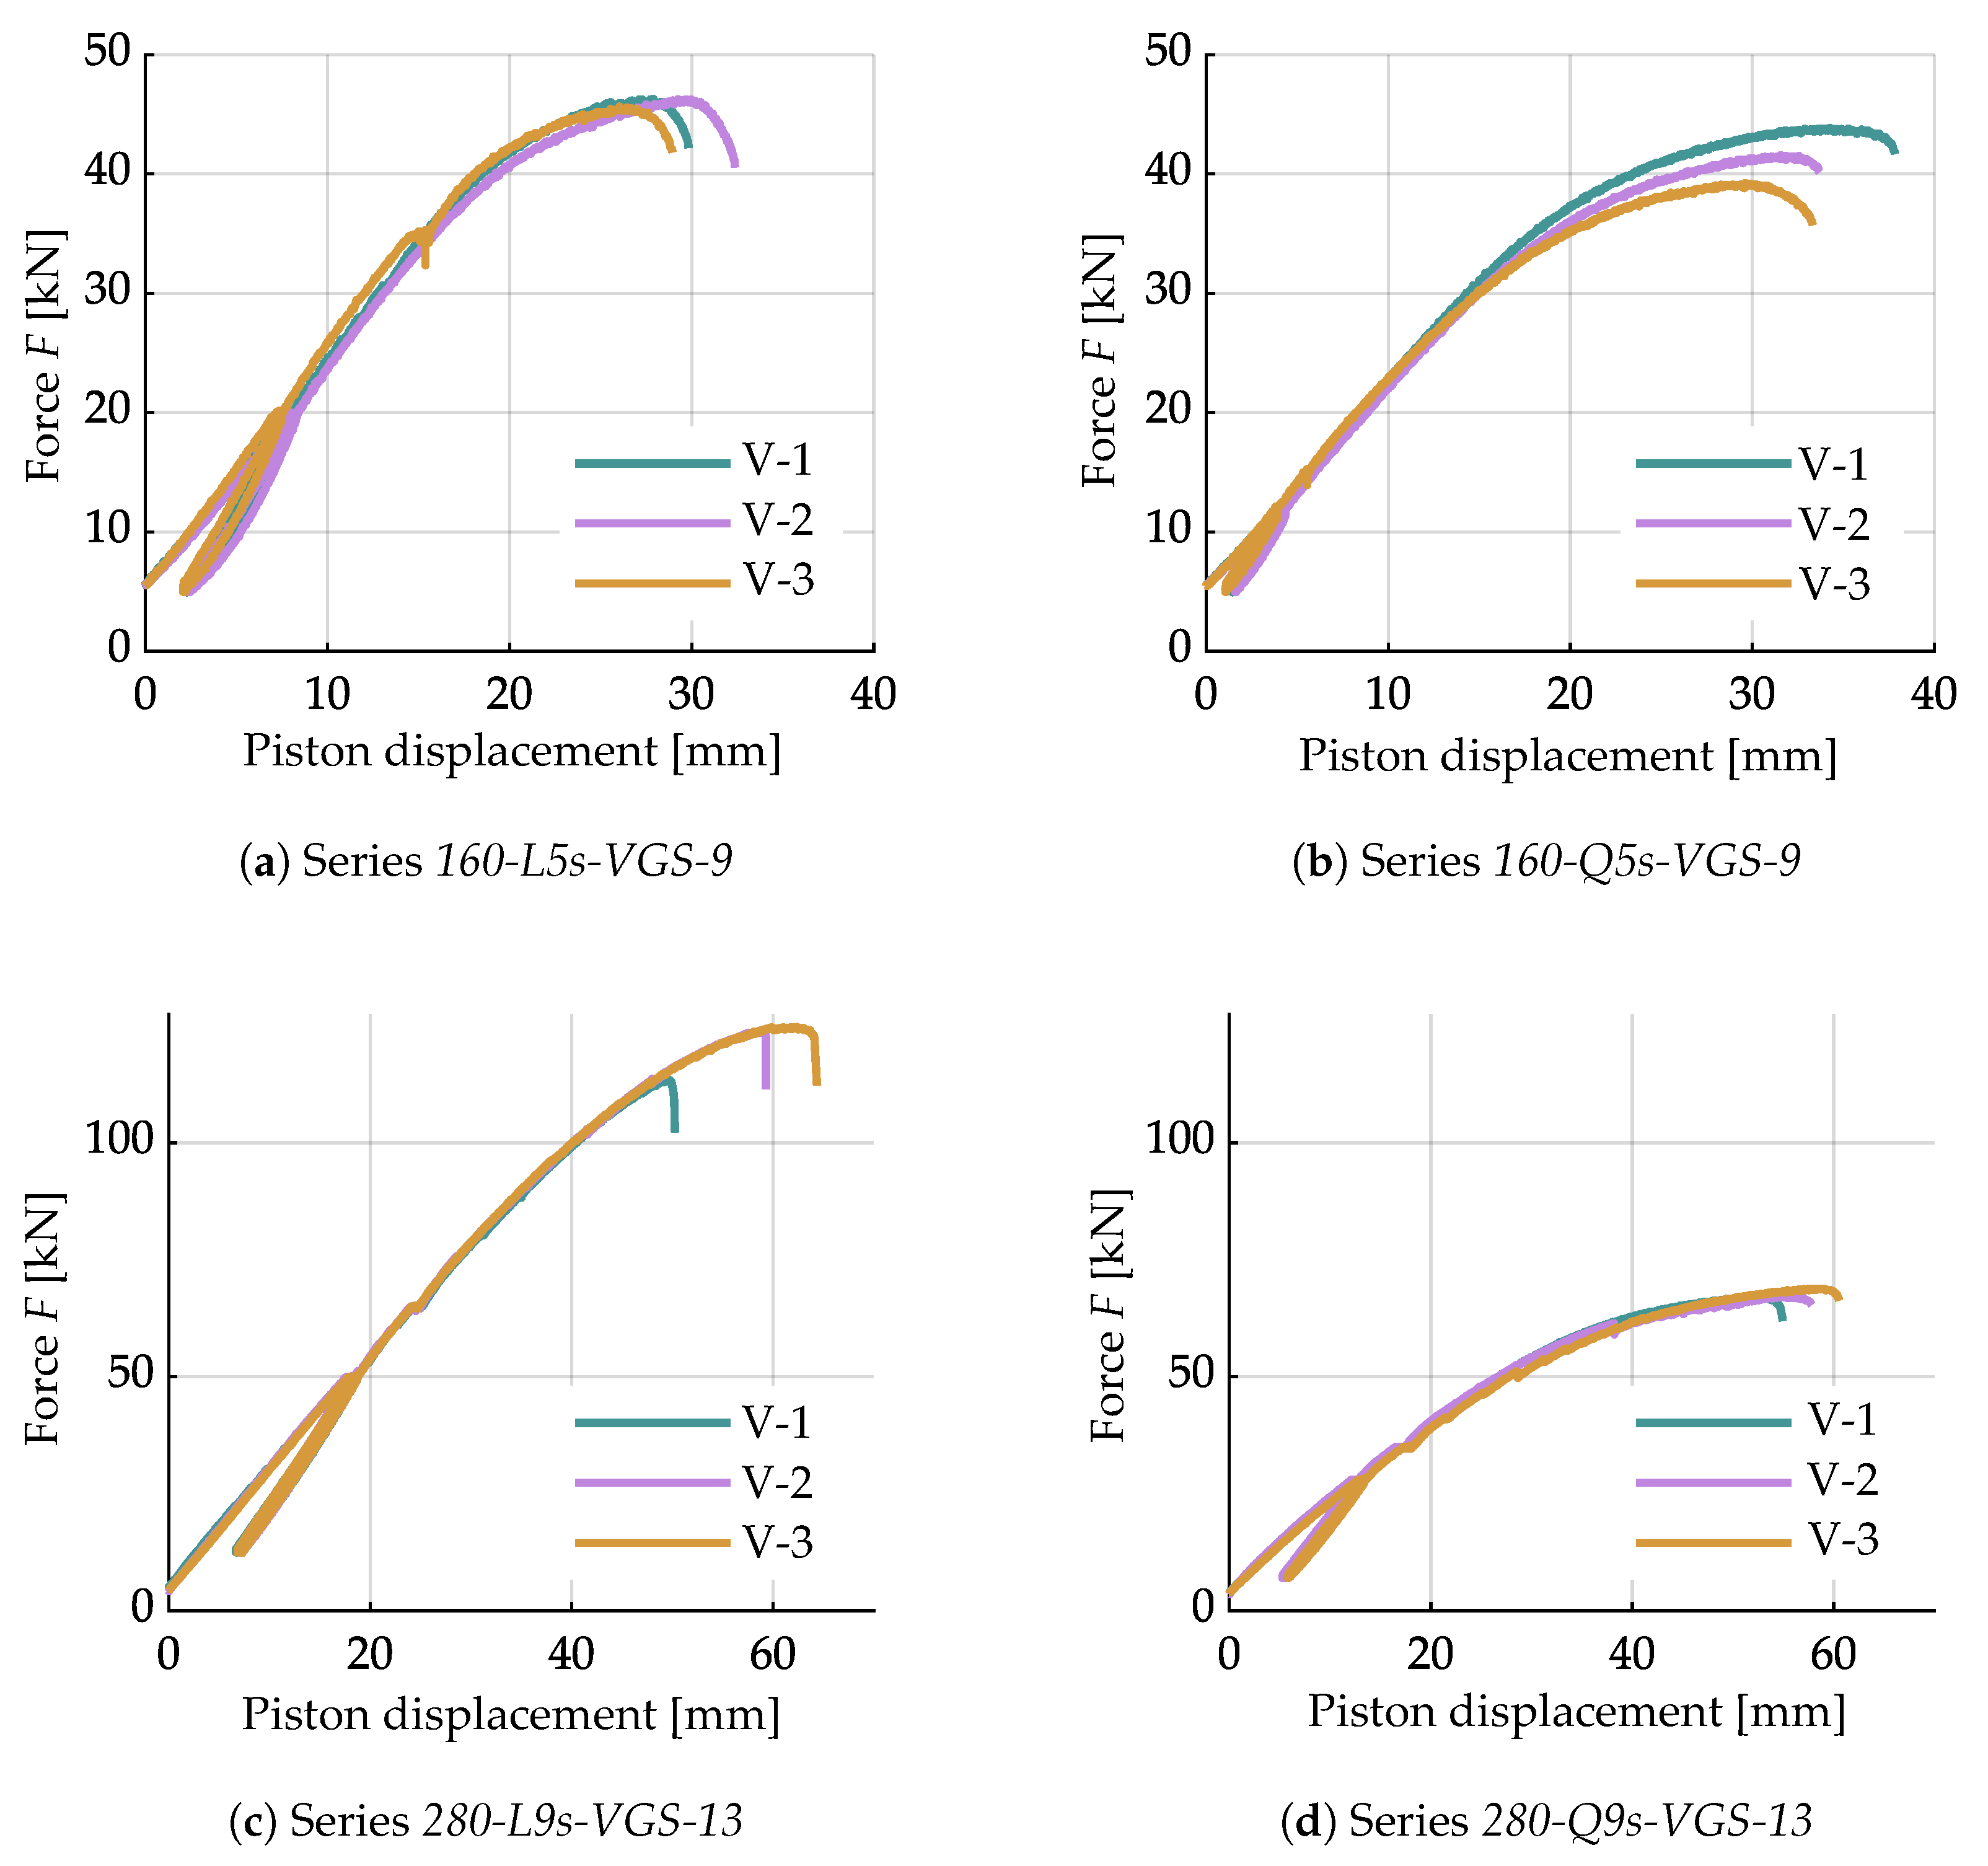
In Figure 10, the load-deformation curves of the tests are shown. The curves follow a linear trend up to a load level of approximately 60 to 70% of the maximum load (). It is noticeable that there is a clear increase in stiffness within the unloading and reloading paths. A clear decrease in load is observed only once the maximum load is reached, and this is characterised by an increase in deformations. The load plateaus in some test curves in the range of approximately are due to the test procedure. Here, the displacement transducers were removed from the test specimen to prevent damage while maintaining a constant load. As previously shown in Table 3, the load-deformation curves also show a small scatter within each test series regarding the stiffnesses as well as the maximum loads achieved. In all tests, failure occurred due to a tensile failure of the screws. Further information is presented in the following Section 3.1.2.
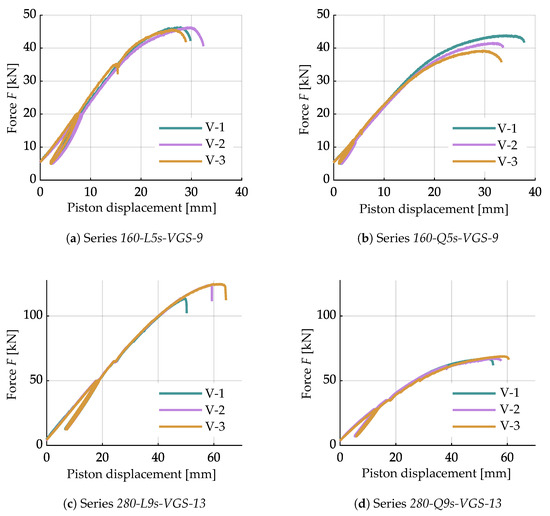
Figure 10.
Load-displacement curves of the tested series in the four-point bending tests.
3.1.2. Four-Point Bending Tests—Observations and Failure Modes
The optical measurements conducted during the experiments offer valuable further information. In this way, the strains in the area of the joint between the concrete and the CLT panels can be observed in more detail within post-processing. In Figure 11, an example of the evaluation based on test 280-L9s-VGS-13-V-2 is given. By plotting the strains perpendicular to the joint across the measured area, the regions that are subjected to compression or elongation can be identified. In addition, the strain across the joint itself is shown in the diagrams. For this, virtual displacement transducers are placed across the joint at a distance of 0.5 mm ( mm, see Figure 11). Subsequently, the strains are analysed over the entire height of the cross-section.
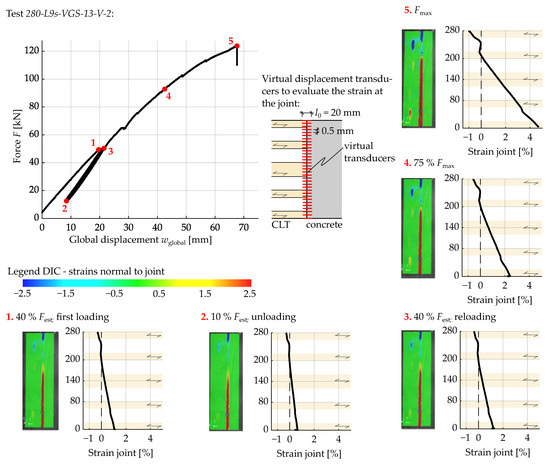
Figure 11.
DIC and strain results along the joint for a specific test (280-L9s-VGS-13-V-2) at different load stages.
By evaluating the strains on the surface in the area of the joint, the high elongation in the tension zone of the cross-section becomes obvious. As a consequence, the failure is announced by a noticeable opening of the joint. However, in this particular test, there was no distinct reduction in stiffness before the test specimens failed. In the compression zone of the cross-section, it can be seen that large strains only occur concentrated at the direct interface between CLT and concrete on the timber side. This behaviour of timber—where end-grain contacts under compression result in strain concentrations at the contact interface—has been reported in previous studies, such as [29,42]. This is accompanied by a decrease in stiffness in this region, which should be considered in investigations regarding the rotational stiffness of such connections. Strain concentrations outside the interface only occur in gaps between two transversal lamellas, as edge-glued layers were not used in these tests.
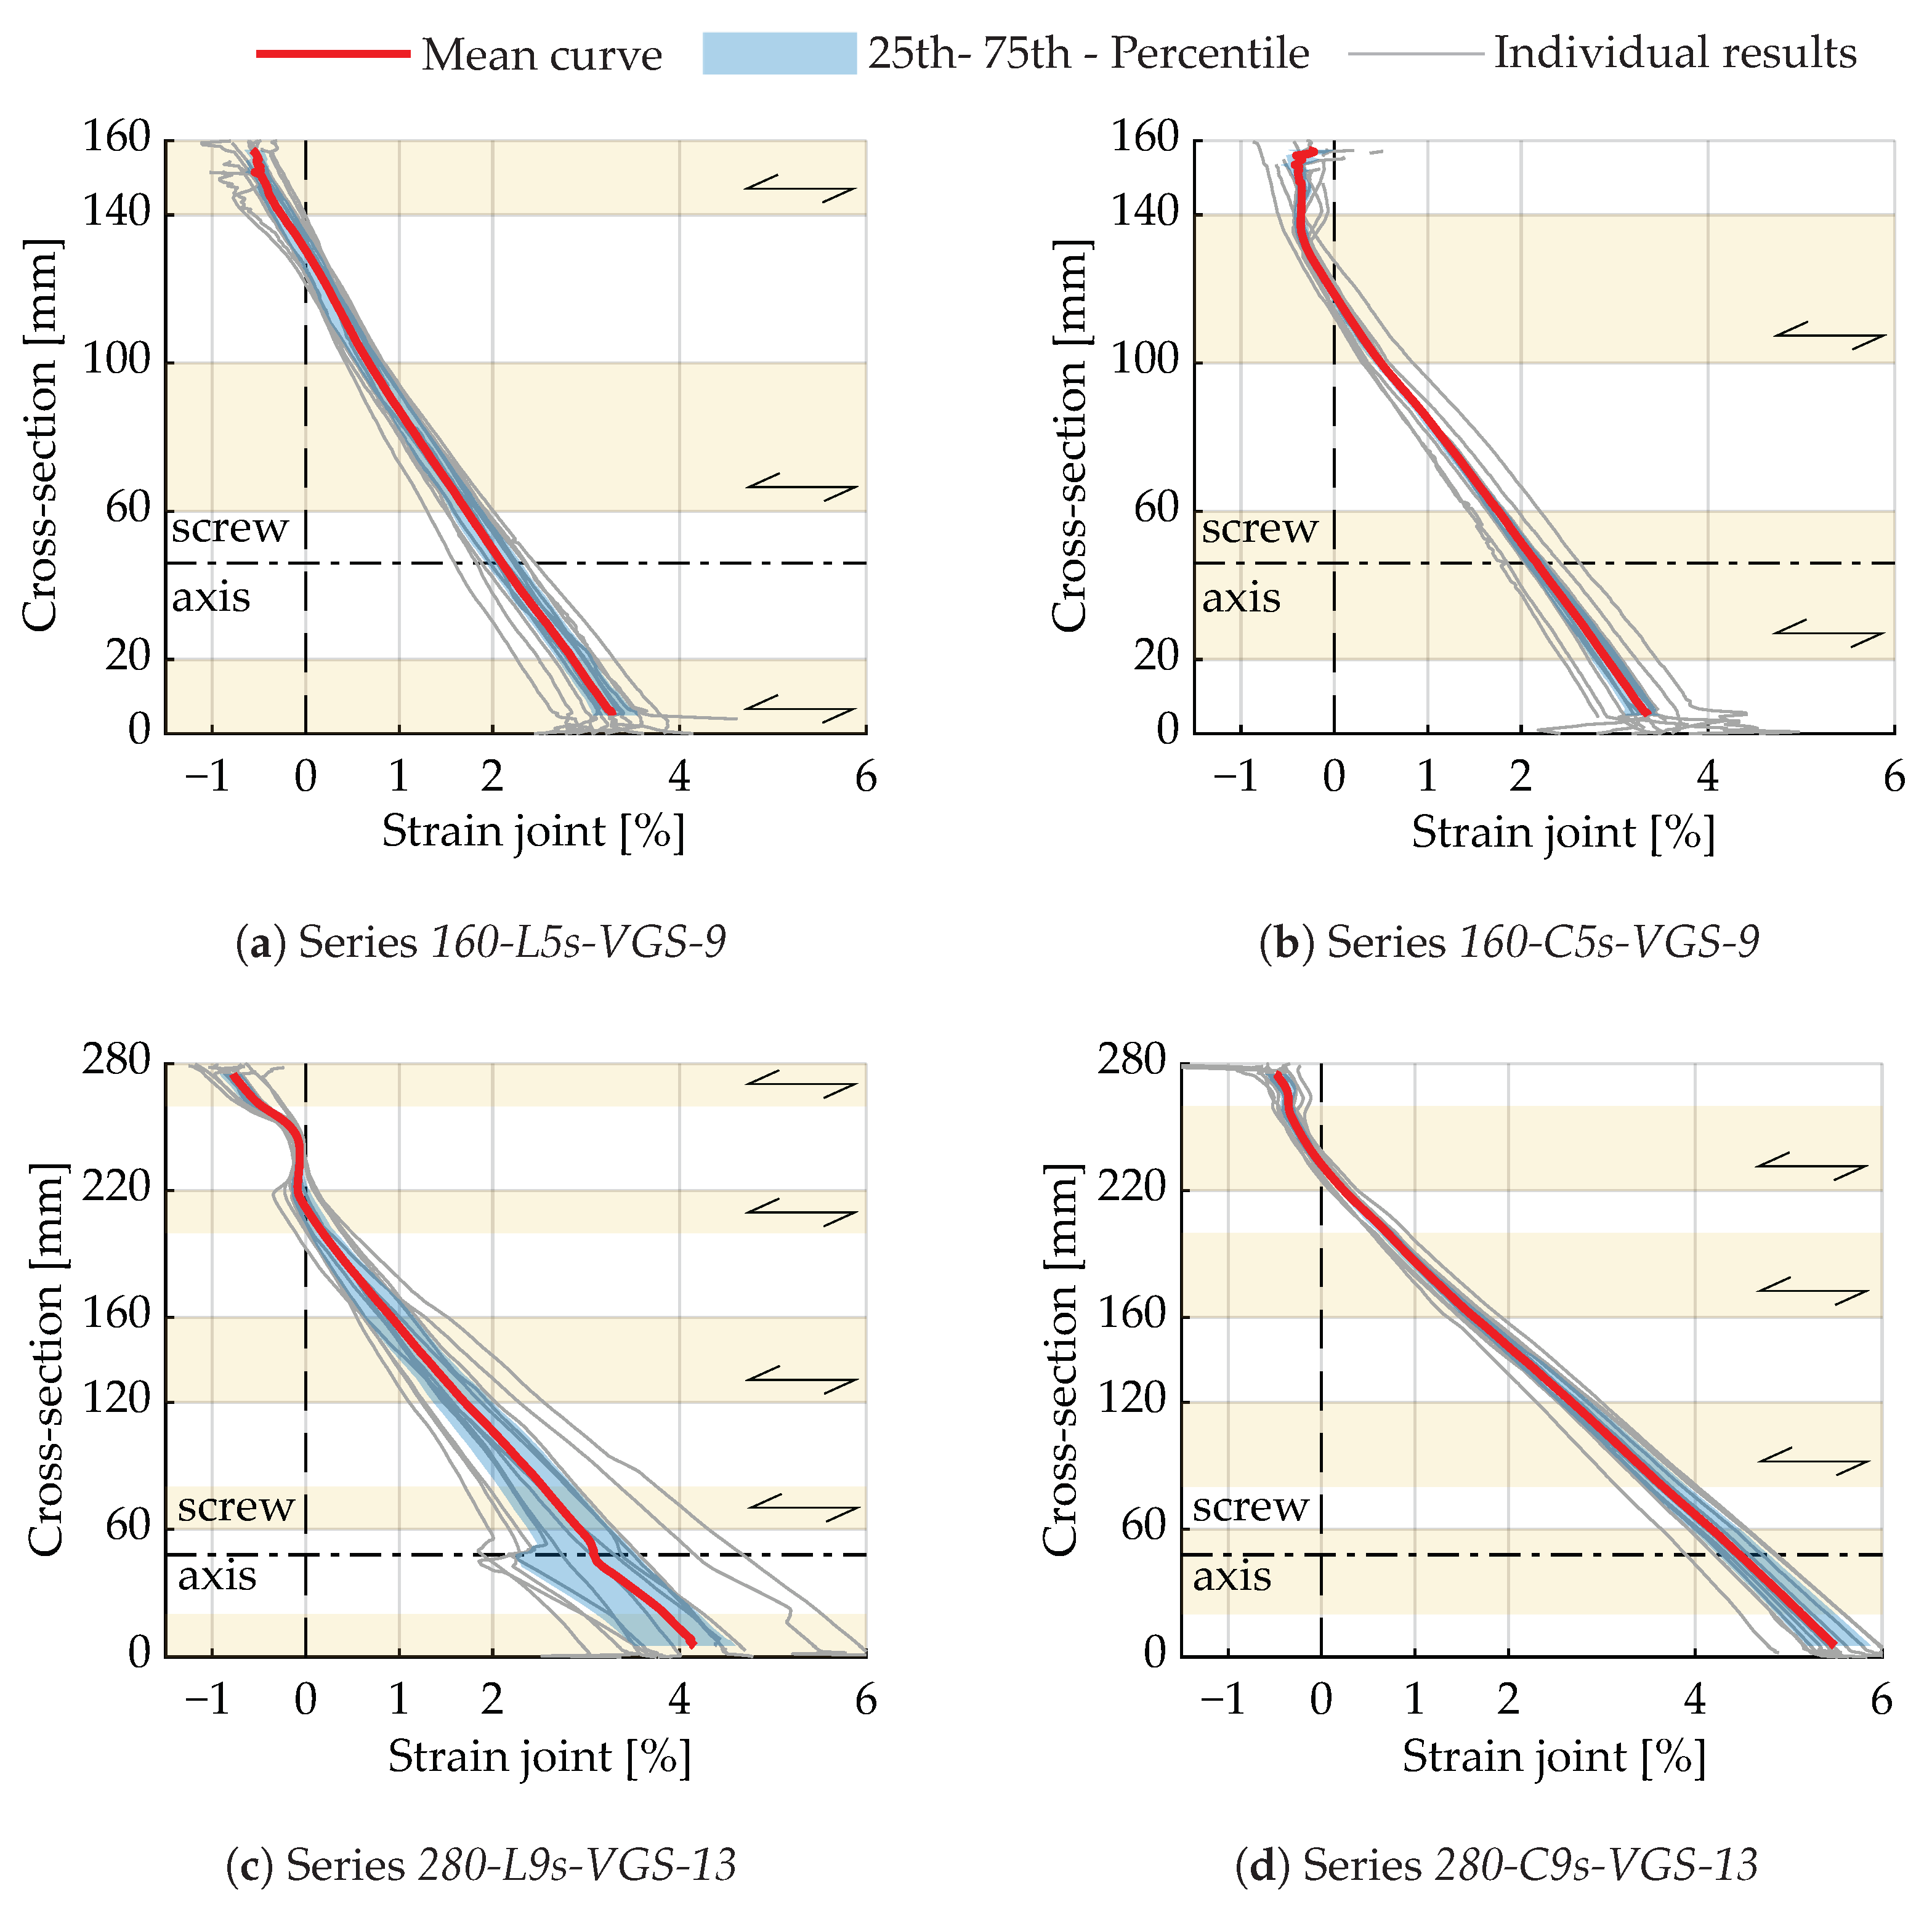
In Figure 12, the evaluation of the strains is summarised for all recorded joints (four each test) and all series at the maximum load . These diagrams align with the principles of the analytical approach described in Section 2.2. It is shown that there is always compressive strain in the top lamellas. Even when this layer is oriented parallel to the joint and the strain profile is no longer linear over the cross-section, distinct strains are observed when the maximum load is reached. This is in contrast to series 280-L9s-VGS-13, where only small strains occur in the transverse layer between two relatively stiffer longitudinal layer.
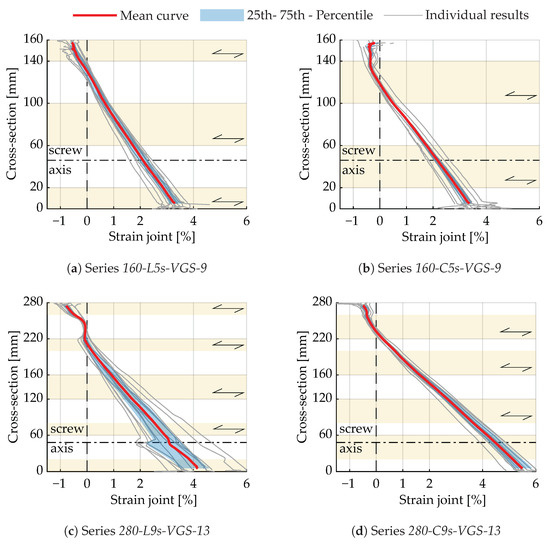
Figure 12.
Strains along the joint at maximum load .
In all tests, the screws finally failed in tension, accompanied by an abrupt decrease in load. Although this type of failure is considered brittle, reference should be made to the strain diagrams at the maximum load level. These diagrams reveal that the failure of this connection type is announced by an opening of the joint. This opening primarily results from the semi-rigid connection of the fasteners in the CLT panel. An upcoming failure is announced by a crack in the tension zone of the connection. In Figure 13, some pictures of the failed specimens are shown. In addition to the tensile failure of the screws in some tests, some spalling of the concrete on the contact surface in the area of the screws also occurred.
An exception is test 280-L9s-VGS-13-V-1. Here, the screws ultimately also failed in tension, but the concrete had already been previously damaged. The high anchorage stresses between the fasteners and the concrete caused the concrete to crush in this area. As a result, parts of the concrete cover were chipped off in some areas. It is assumed that, as a result, some of the screws were no longer able to transfer stresses around their entire circumference to the concrete. This may result in an eccentric transmission of the tensile force into the fastener, leading to an increase in the maximum tensile stresses in the inner diameter of the screws and, therefore, premature failure (approximately −8.5%).
No damage was observed on the CLT in any of the series, except for a slight withdrawal of the screws.
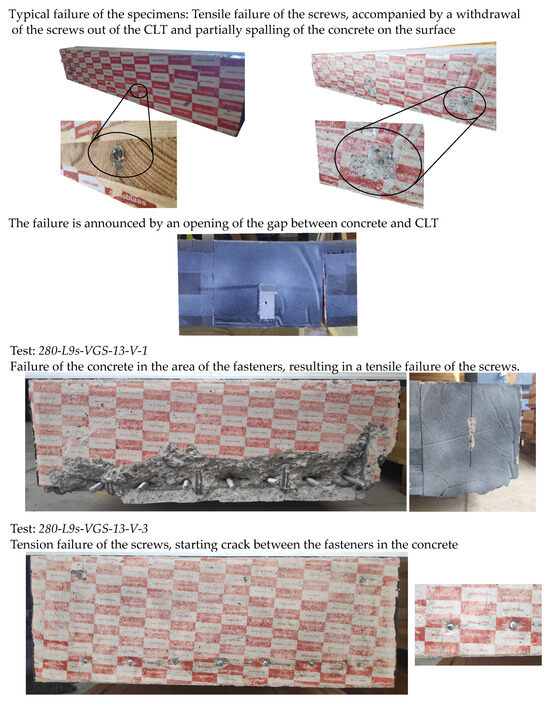
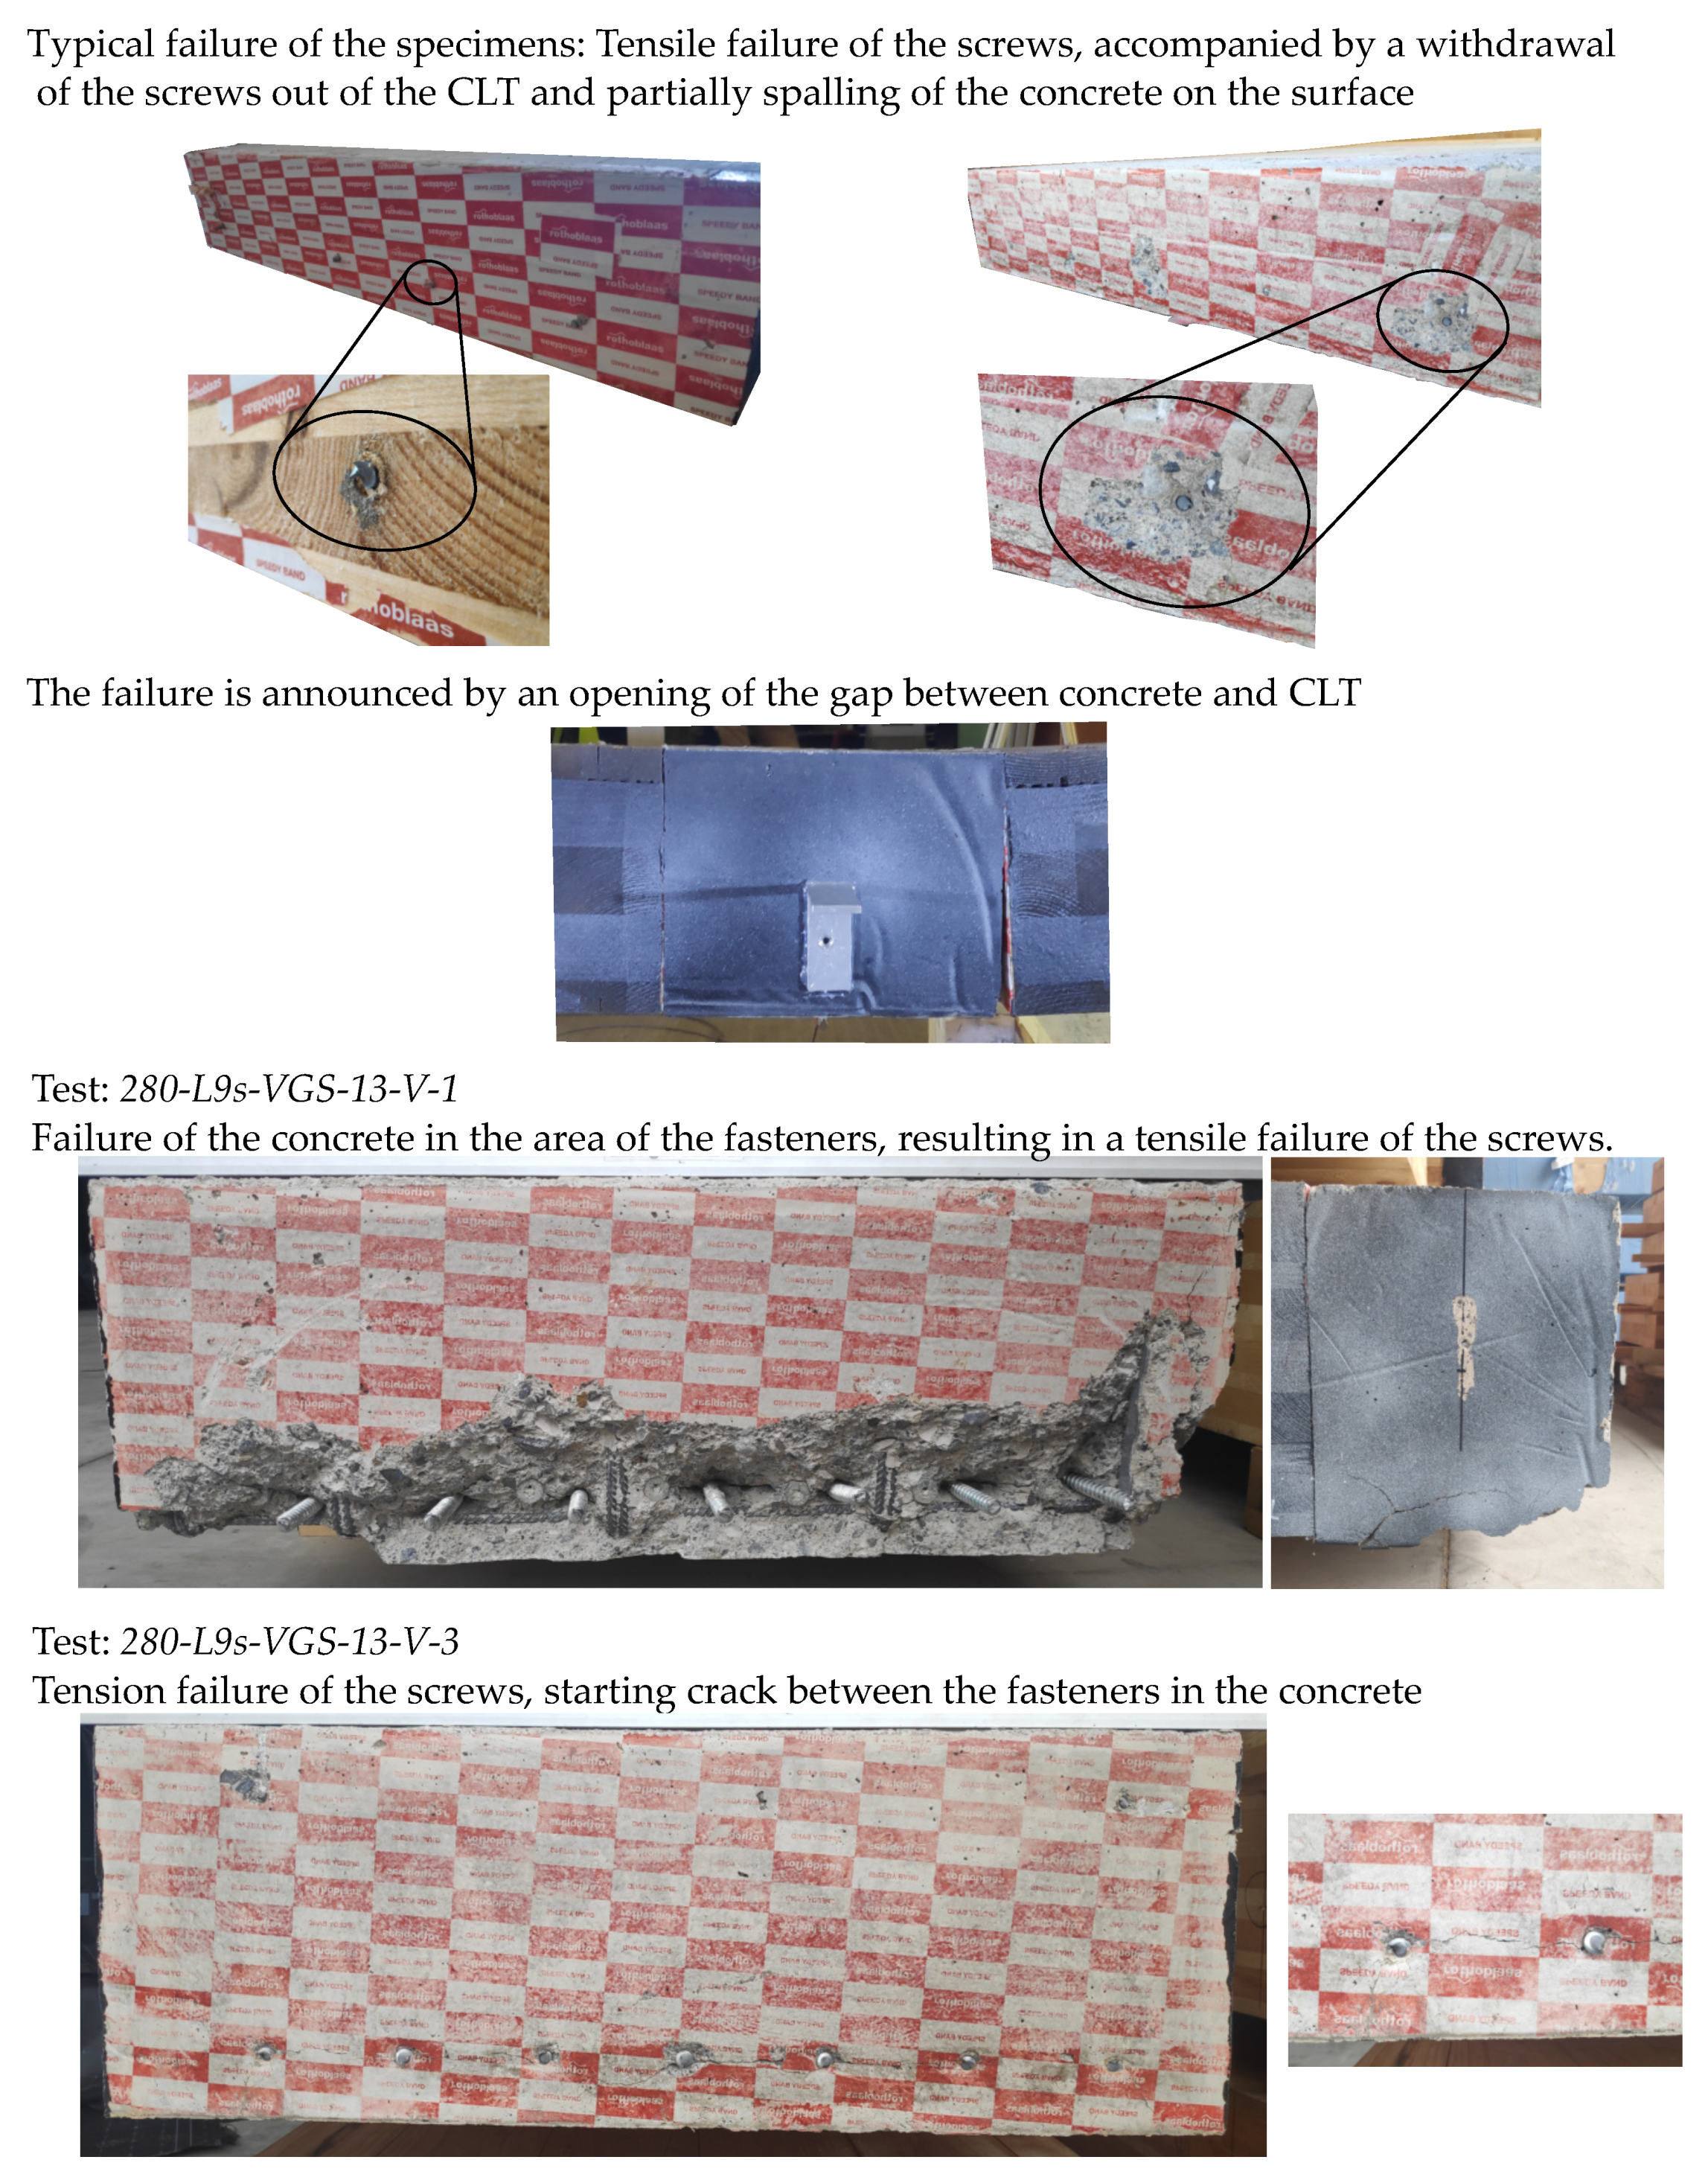
Figure 13.
Pictures of failed specimens.
Figure 13.
Pictures of failed specimens.
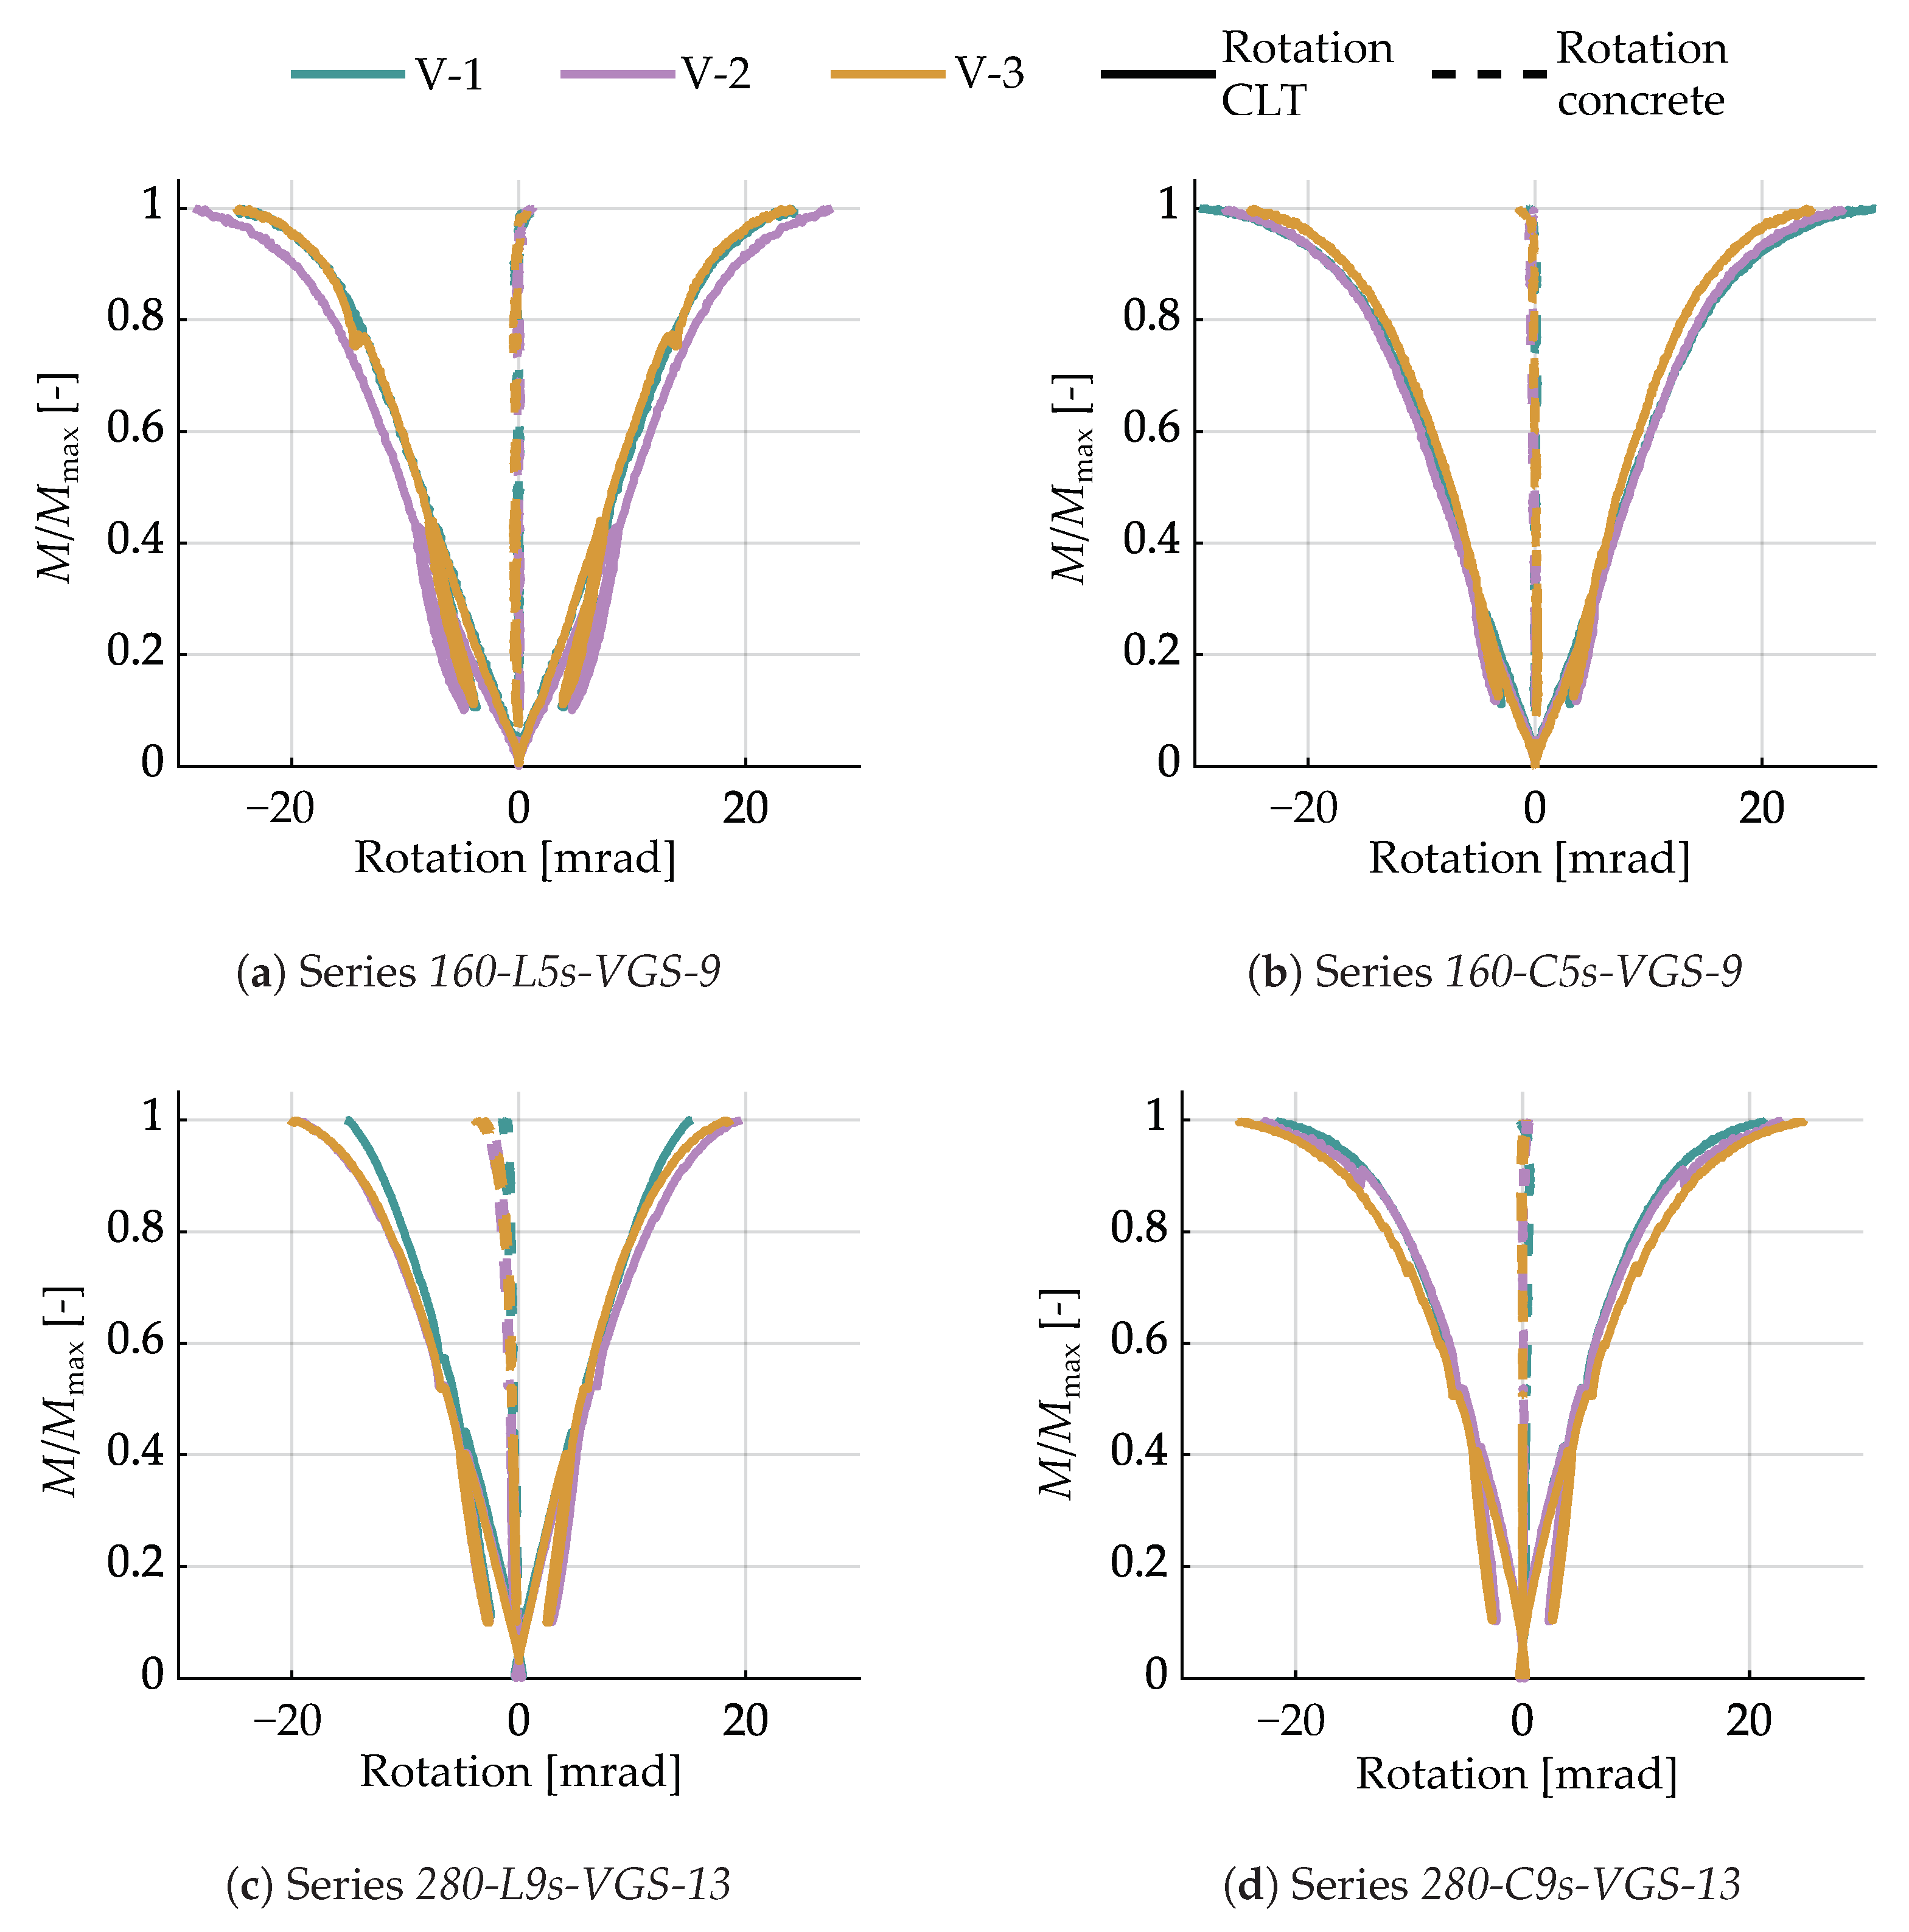
The opening of the joint between concrete and CLT may also be observed by considering the rotations of these two components. Therefore, the diagrams in Figure 14 show the rotations of the CLT cross-sections (continuous lines) as well as the rotations of the concrete cross-sections (dashed lines) in the area of the joint. The difference in the rotations of these two cross-sections represents the opening of the joint. It is evident in these diagrams that the rotations increase significantly before reaching the maximum load. In addition, it is shown for the concrete block that there is no significant rotation between the two end cross-sections, as well as a change in stiffness during the tests.

Figure 14.
Moment-rotation diagrams of the tested series, evaluated from the DIC measurement.
3.1.3. Compressive Strength—Concrete
In Table 4, the results of the cube compressive strength tests are summarised. With a mean cube compressive strength of MPa, the ordered concrete strength class C 25/30 is confirmed.
Table 4.
Results of compressive strength tests on concrete.
3.1.4. Tension Tests—Screws
The results of the tensile tests of the screws are summarised in Table 5. Apart from the mean maximum tensile strength (), additional values derived from a statistical evaluation are given. These values are used in Section 3.3.2 to validate the analytical approach. These additional values, including the 25th and 75th percentile values, are calculated from the test data, assuming normally distributed results. Additionally, the characteristic value for the tensile strength () is determined according to [43], assuming that the measured values follow a normal distribution.
Table 5.
Results tension tests .
3.2. Analytical Results
Firstly, the analytical approach is evaluated with a focus on the moment that corresponds to the maximum load achieved in the tests. In addition to the geometry of the connection (see Figure 3) and the maximum bending moment obtained in the tests (see Table 3), the compressive strength of the CLT must be applied. According to the European Technical Assessment of the CLT [24], the lamellas are classified as strength class C24 in accordance with EN 338 [44]. For this strength class, the characteristic compressive strength values are MPa parallel to the grain direction and MPa perpendicular to the grain. A system effect, as given in [30], for example, may be applied for the compressive strength parallel to the grain. On the other hand, several publications point out a loss of strength in end-grain contact joints subjected to compression (e.g., in [29] for CLT). In the presented evaluation of the analytical approach, both of these effects are not considered.
To compare the test results with the analytical model, the mean values for the compressive strength of the CLT are used in addition to the characteristic values from [44]. Since experimental investigations on the compressive strength of the specific CLT used were not conducted, these values were calculated using the 5% quantiles given in [44], along with the distributions and COVs given in [45], as shown in Table 6. In addition to the mean value, the 25th and 75th percentiles are also calculated. The values of the considered compressive strengths are given in Table 6.
Table 6.
Compressive strength values and distribution characteristics used in the study.
Using these assumptions and Equations (7)–(12) as presented in Section 2.2, one can calculate the tensile force in the screws. In the analytical approach, the compression stress applied for the maximum bending load varies at different depths within the cross-section. The results of the analytical evaluation are summarised in Table 7.
For series 160-L5s-VGS-9, the applied stress is limited to the upper, longitudinal layer of the CLT. However, in series 160-C5s-VGS-9 and 280-C9s-VGS-13, the applied stress extends from the first transverse layer to the second longitudinal layers. In series 280-L9s-VGS-13, the applied compressive stress may even reach the third layer. Due to the analytical approach, the second layer, which is a transverse layer, is not considered (see Figure 8). For this series, a higher compressive strength (e.g., ) may result in the constant compressive stress being applied only in the first layer (see Figure 6). That is the reason for a wider load range of the screws compared to the other series.
Already in advance, the height of the compression zone applied according to the analytical approach can be qualitatively compared with the measurements shown in Figure 12. The assumed heights correspond well with the measured compressed cross-section. However, a more detailed comparison of the analytical and experimental results is presented in the following Section 3.3.
Table 7.
Results for the tension force in the fasteners according to the analytical model under maximum load ().
Table 7.
Results for the tension force in the fasteners according to the analytical model under maximum load ().
| Series | Specimen | Mmax | Ft(fc,mean) | Ft(fc,0.25) | Ft(fc,0.75) | Ft(fc,k) |
|---|---|---|---|---|---|---|
| [kNm] | [kN] | [kN] | [kN] | [kN] | ||
| 160-L5s-VGS-9 | V-1 | 20.8 | 189.5 (1) | 190.6 (1) | 188.6 (1) | 192.4 (1) |
| V-2 | 20.8 | 189.4 (1) | 190.4 (1) | 188.5 (1) | 192.3 (1) | |
| V-3 | 20.5 | 186.7 (1) | 187.8 (1) | 185.9 (1) | 189.6 (1) | |
| Mean: | 20.7 | 188.5 | 189.6 | 187.7 | 191.4 | |
| COV (%): | 0.8 | 0.8 | 0.8 | 0.8 | 0.8 | |
| 160-C5s-VGS-9 | V-1 | 19.7 | 211.1 (2) | 212.6 (2) | 209.8 (2) | 215.4 (2) |
| V-2 | 18.7 | 199.4 (2) | 200.7 (2) | 198.2 (2) | 203.2 (2) | |
| V-3 | 17.7 | 187.4 (2) | 188.6 (2) | 186.4 (2) | 190.8 (2) | |
| Mean: | 18.7 | 199.3 | 200.6 | 198.1 | 203.1 | |
| COV: | 5.3 | 5.9 | 6.0 | 5.9 | 6.1 | |
| 280-L9s-VGS-13 | V-1 | 95.4 | 428.2 (1) | 436.2 (3) | 425.9 (1) | 459.7 (3) |
| V-2 | 104 | 469.2 (3) | 487.2 (3) | 466.0 (1) | 512.6 (3) | |
| V-3 | 104.8 | 473.5 (3) | 491.7 (3) | 469.5 (1) | 517.3 (3) | |
| Mean: | 101.4 | 457.0 | 471.7 | 453.8 | 496.5 | |
| COV: | 5.1 | 5.5 | 6.5 | 5.3 | 6.4 | |
| 280-C9s-VGS-13 | V-1 | 56.5 | 269.1 (2) | 270.1 (2) | 268.2 (2) | 271.9 (2) |
| V-2 | 56.4 | 268.9 (2) | 270.0 (2) | 268.1 (2) | 271.8 (2) | |
| V-3 | 57.8 | 275.8 (2) | 276.9 (2) | 274.9 (2) | 278.8 (2) | |
| Mean: | 56.9 | 271.3 | 272.3 | 270.4 | 274.2 | |
| COV: | 1.4 | 1.4 | 1.5 | 1.4 | 1.5 | |
3.3. Comparison of Analytical Results with the Experimental Results
3.3.1. Depth of Compressed Zone
The optical measurement can be used to find the point in the joint where the transition from tensile to compressive strain occurs. The result of this evaluation for the entire test duration is shown in Figure 15. In this diagram, the measurements are compared to the results of the analytical approach. For this purpose, the assumed height of the constant compressive stress zone (x), as well as the position of the resulting compressive force (a), are calculated and plotted. For the evaluation of the analytical approach, the range of compressive strengths, as given in Table 6 ( to and ), is also taken into account.
When comparing the analytical results with the optical measurement, it is evident that the assumed height of the constant compressive stress is in the compressed area of the cross-section. An exception is Series 280-L9s-VGS-13, where some measured joints are assumed to have compressive stresses in the analytical approach, even in a region where tensile strains have been measured. However, these exceedances only affect individual joints in single tests and are significantly dependent on the applied compressive strength. As already mentioned in Section 3.1.2, the joint will begin to open just before the maximum load is reached. This opening is caused by the failure of the screws. Since the screws start to yield before the steel fails in tension, there is a constriction of the compressed zone. This is reflected in the increase in some of the curves, as shown in Figure 15, just before reaching the maximum load.
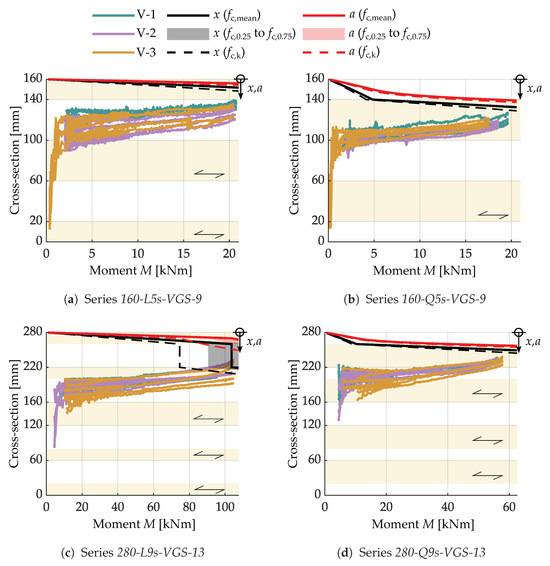
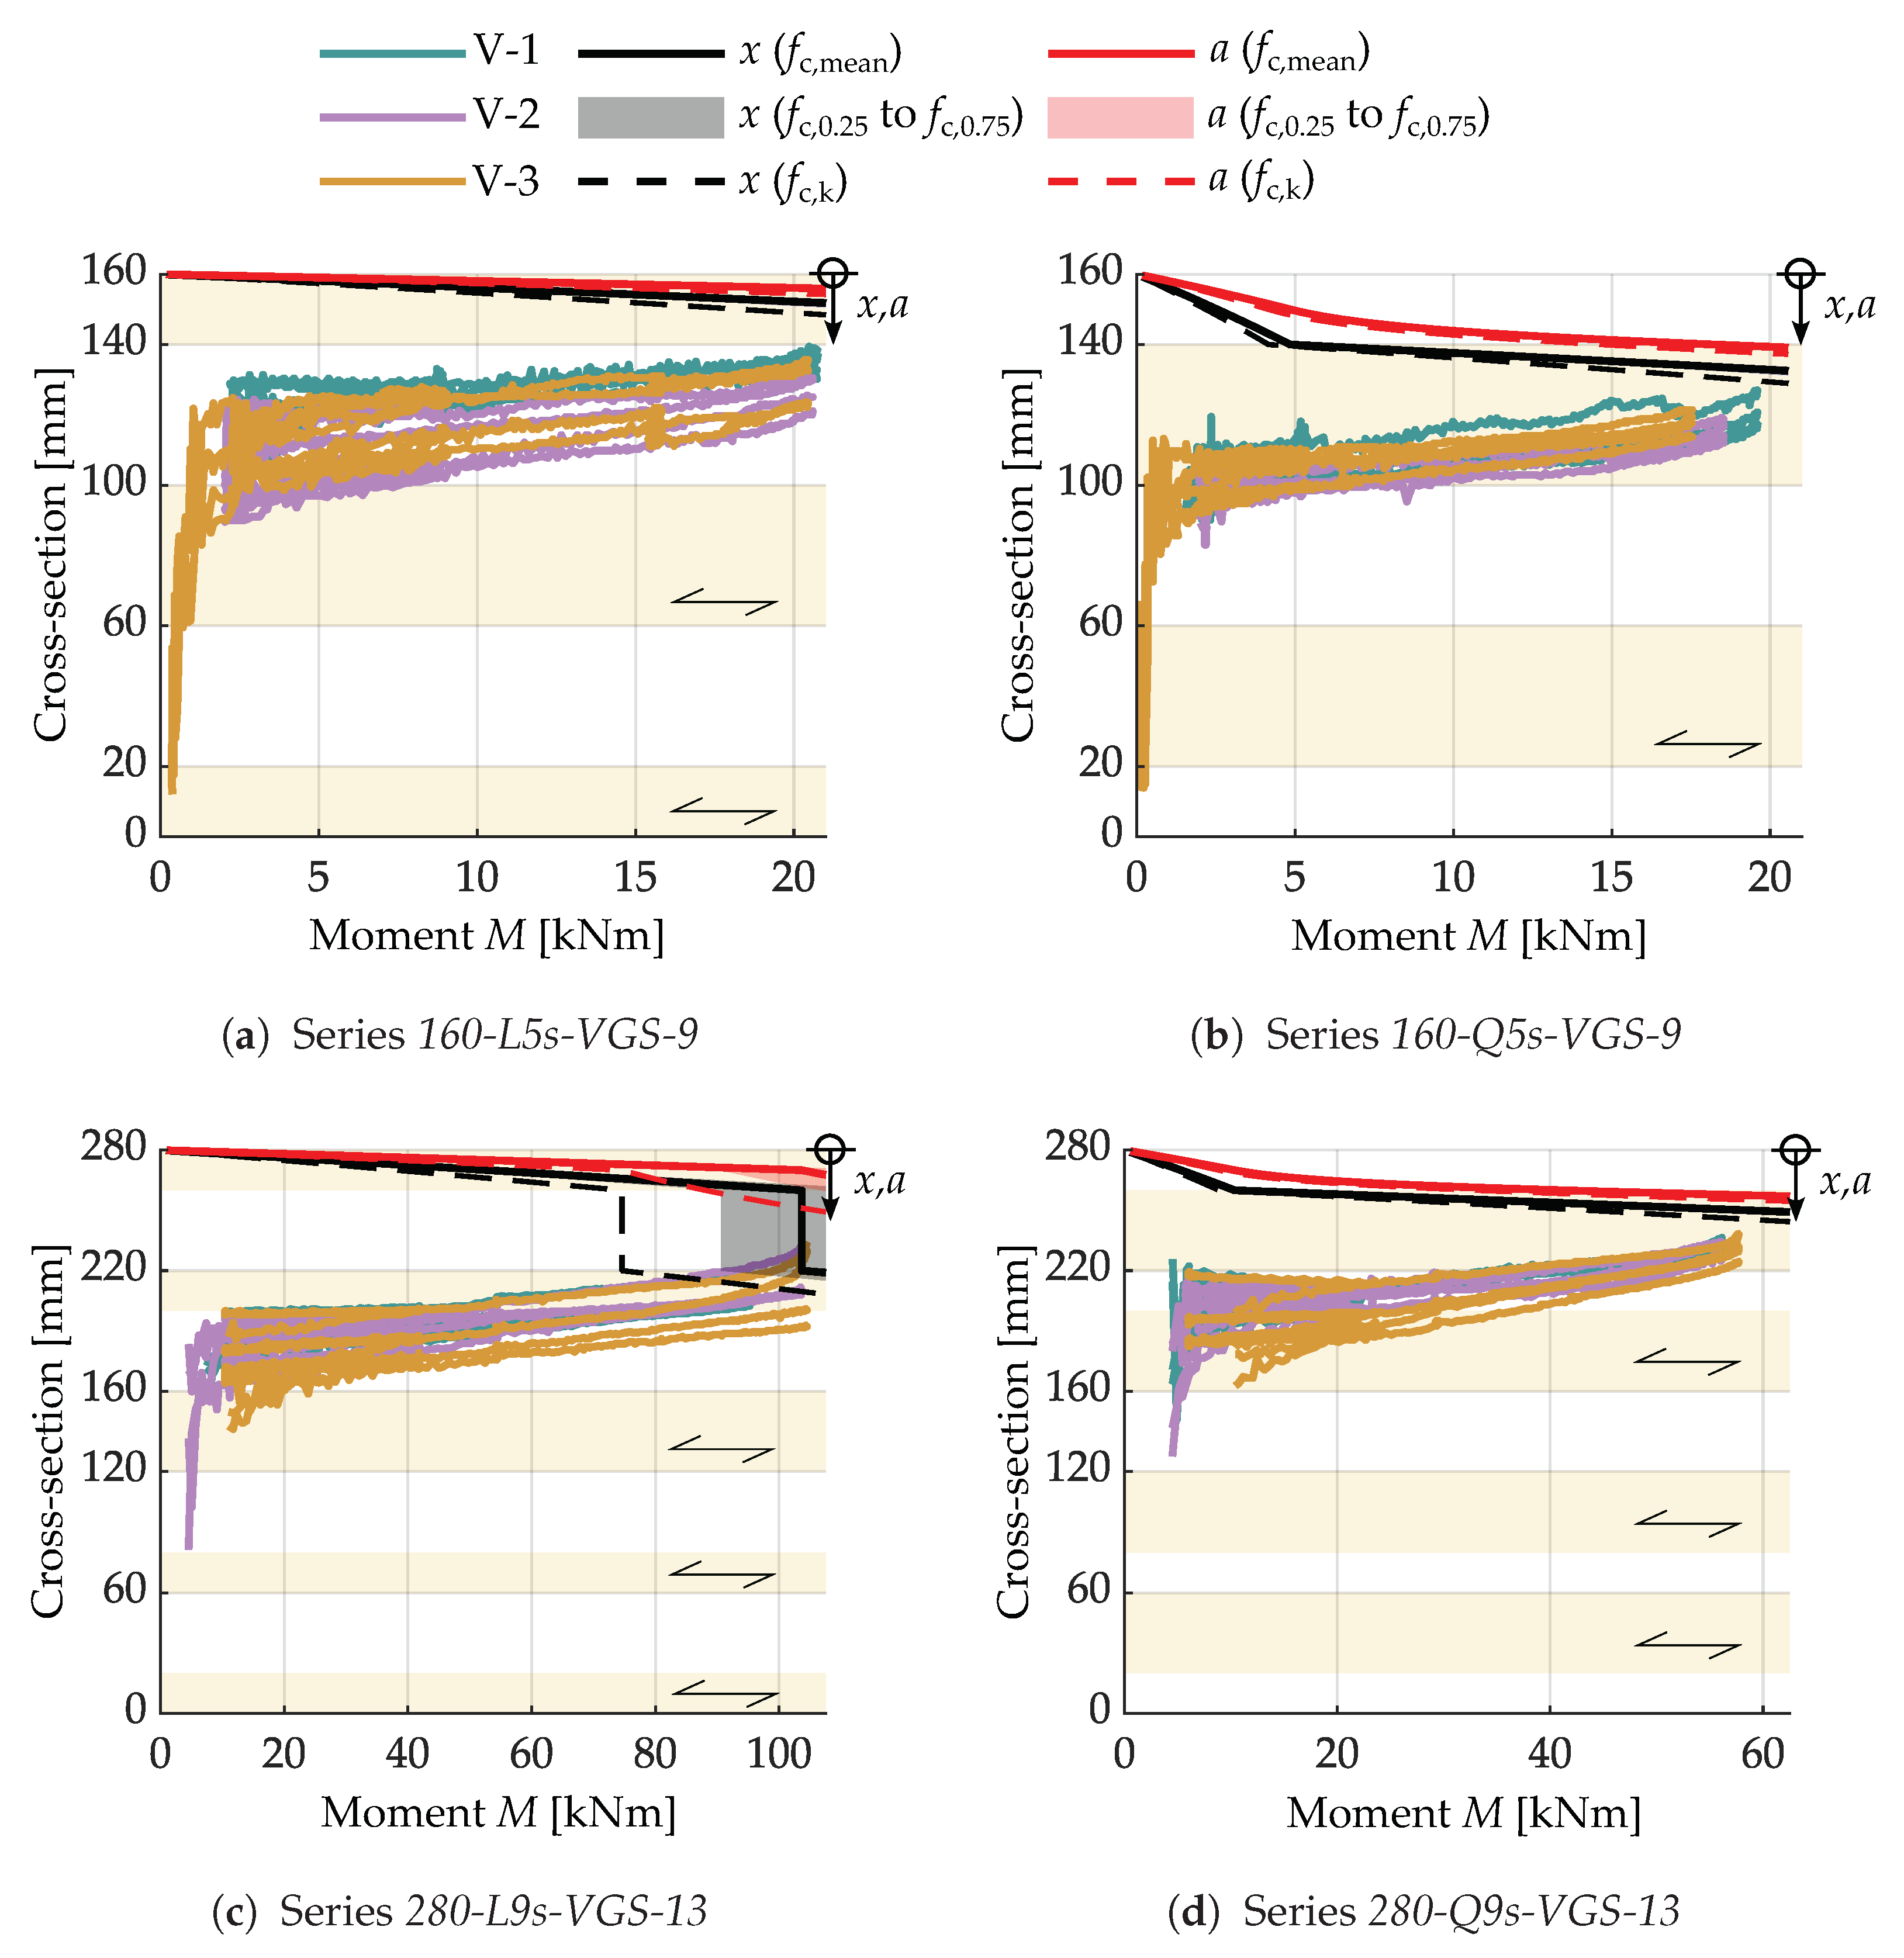
Figure 15.
Transition between cross-section in tension and compression (DIC-data) compared to the results of the analytical model (assumed compressed zone x and location of the resulting compressive force a).
Figure 15.
Transition between cross-section in tension and compression (DIC-data) compared to the results of the analytical model (assumed compressed zone x and location of the resulting compressive force a).
3.3.2. Force in the Screws at Failure
In Section 3.2, the total force on the fasteners in tension is calculated. To determine the force per screw, the total force is divided by the number of fasteners used, assuming that the force is uniformly distributed among the screws. As previously stated in Section 3.1.2, all tests ultimately failed due to a steel tensile failure of the screws. Consequently, we can compare the force obtained from the analytical model with the experimentally determined tensile strength, (as seen in Figure 16).
Another method for comparing the experimental results with the analytical model is shown in Figure 17. Here, a required inner lever arm is calculated for each test based on the maximum moment and the tensile strength of the screws , represented as , where n is the number of screws in the lower row of fasteners, assuming equal loading on all screws. The diagram considers the tensile test values at the 25th and 75th percentiles. This required inner lever arm is then compared with the result for the inner lever arm z according to the analytical model given in Section 2.2 for the maximum mean value of the series .
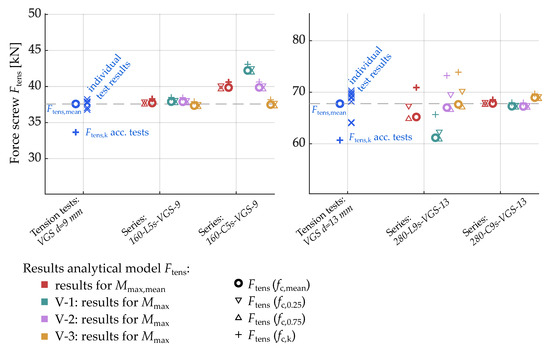
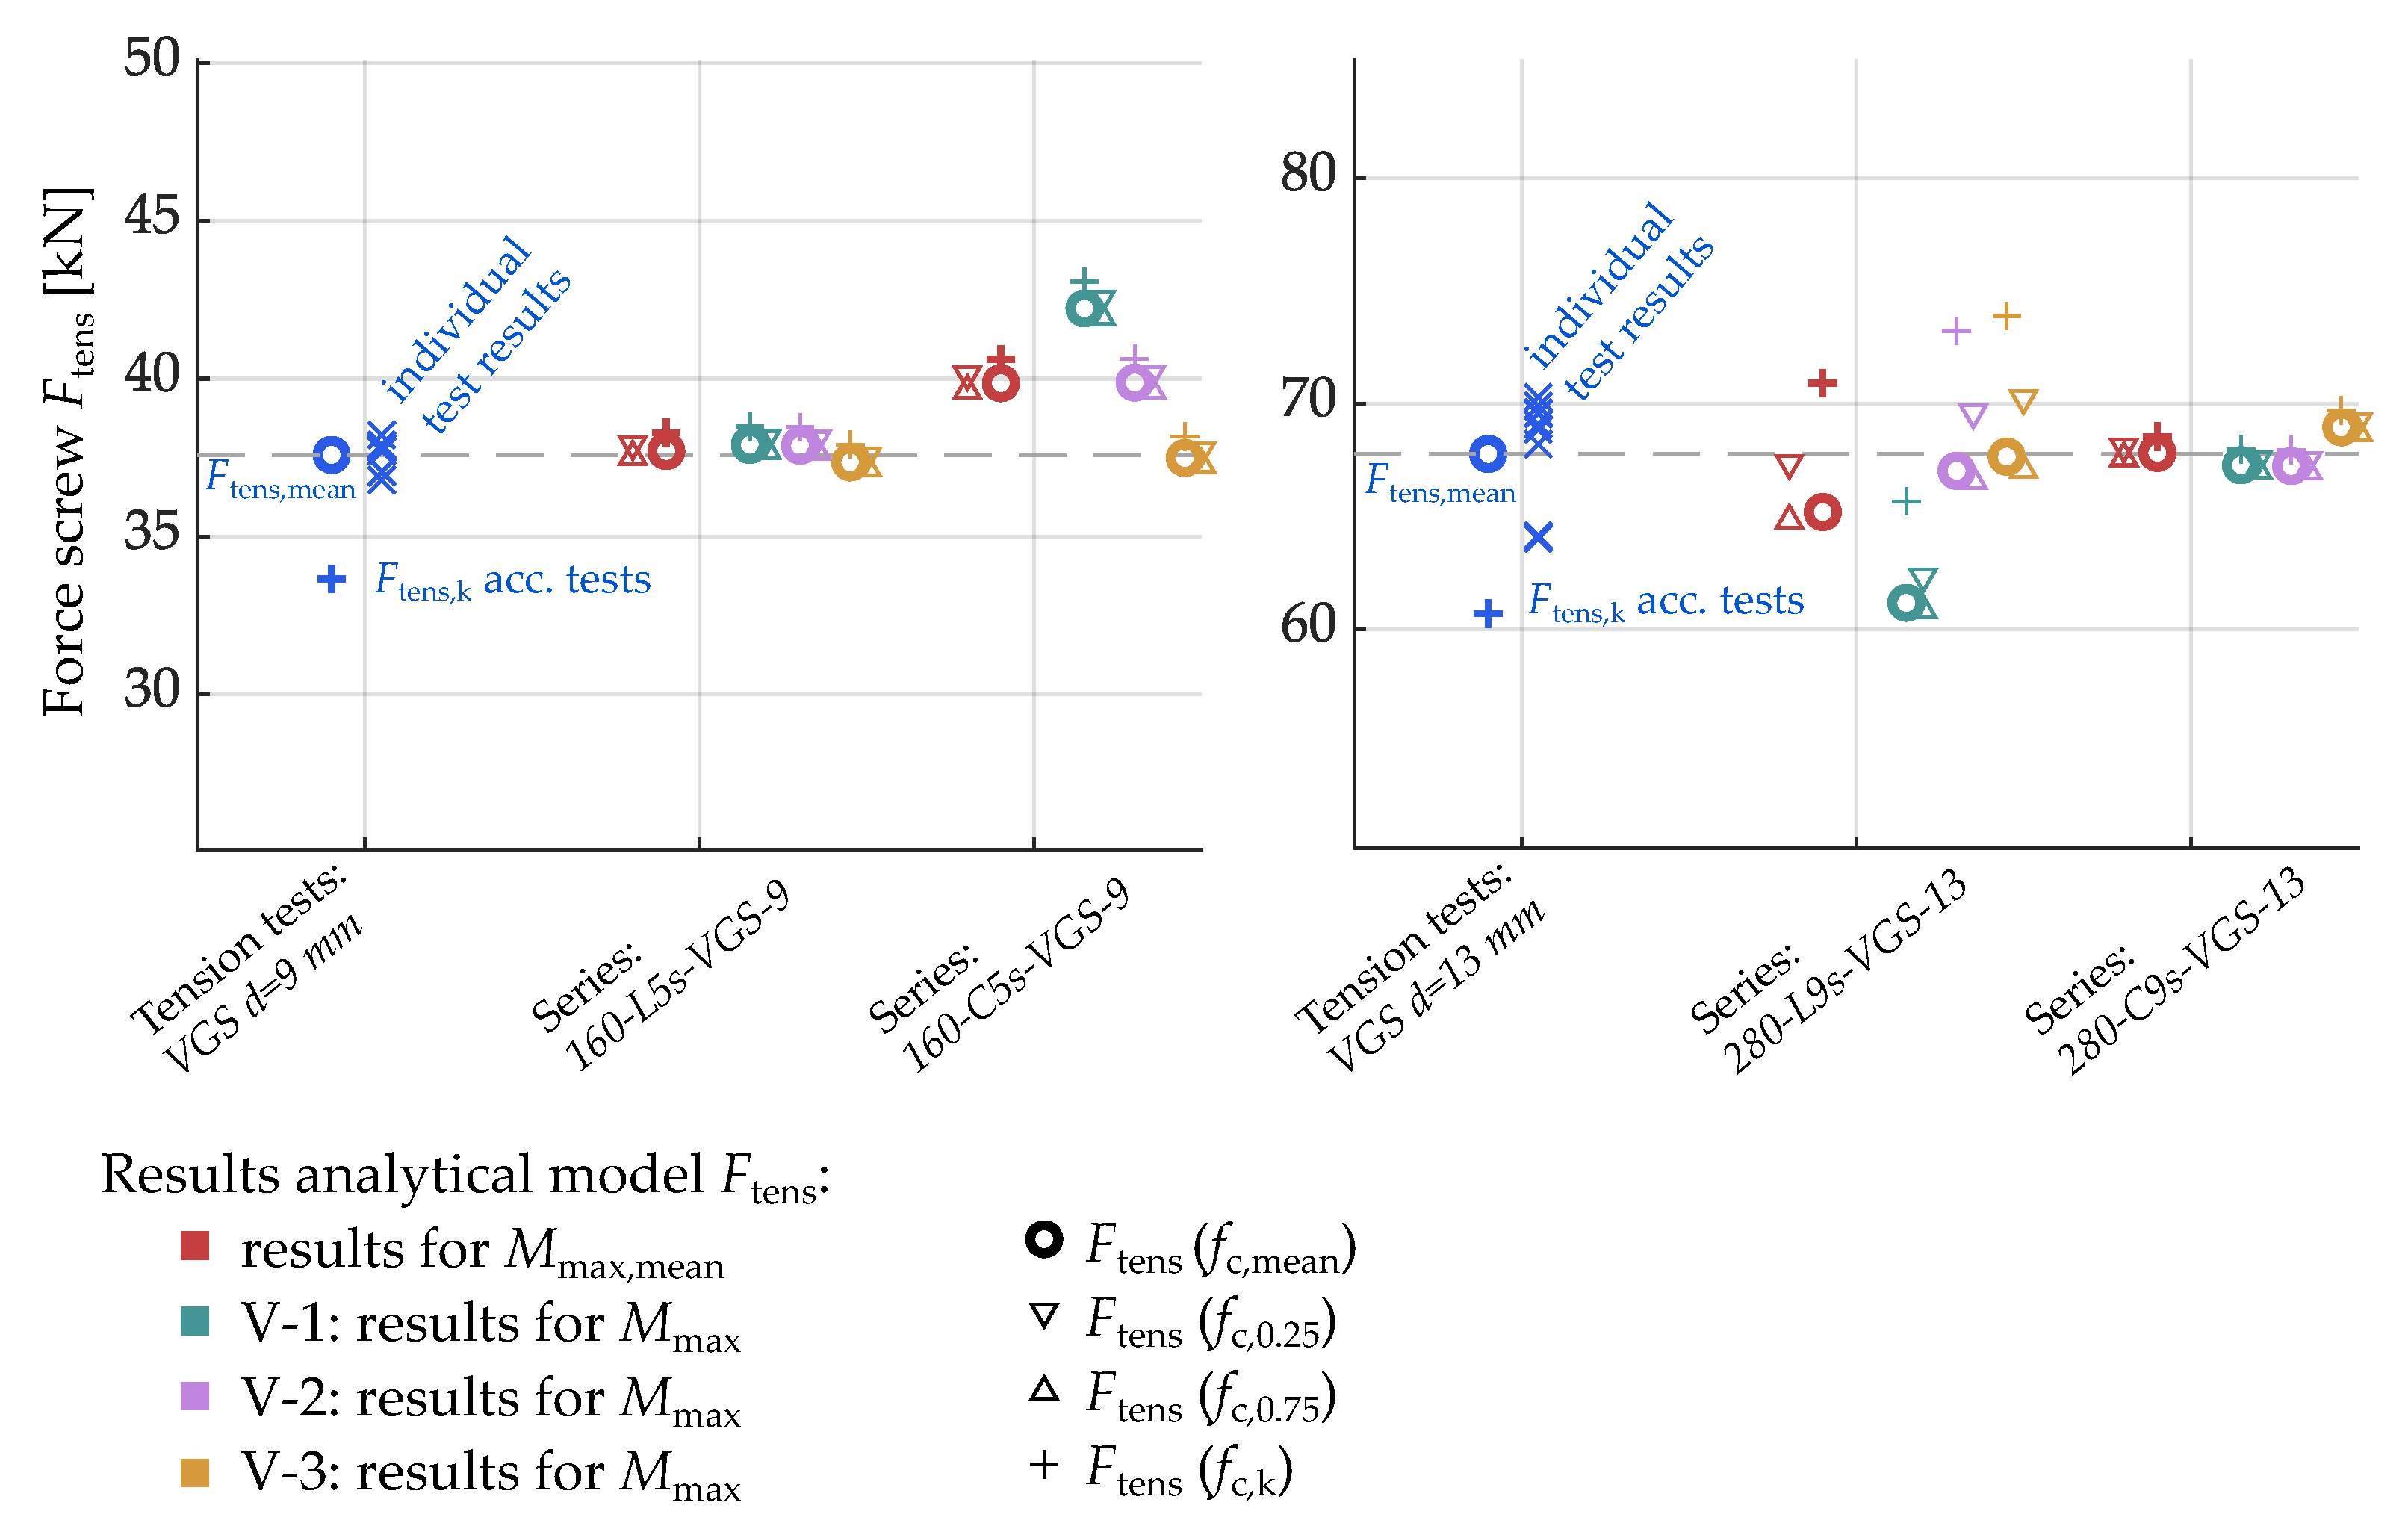
Figure 16.
Comparing the experimentally determined tensile strengths to the results of the analytical model.
Figure 16.
Comparing the experimentally determined tensile strengths to the results of the analytical model.
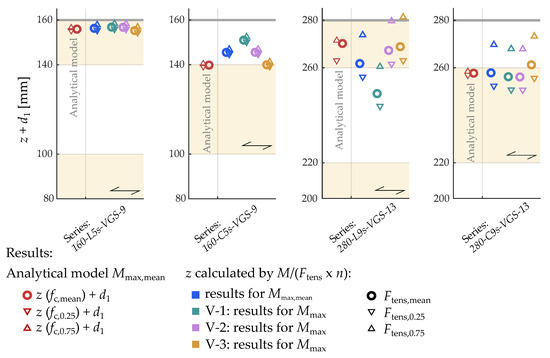
Figure 17.
Comparison of the required inner lever arm z determined via the tensile strength of the screws to the analytical model.
In general, both diagrams lead to the same conclusions. The experimental results for tests of series 160-L5s-VGS-9 and 280-C9s-VGS-13 are accurately represented by the analytical approach. The tensile force in the screws, as determined analytically, deviates by less than 1.2 kN from the tensile tests when comparing mean values. For the series 160-L5s-VGS-9, there is a maximum deviation between the tensile strength of the screw (tensile tests acc. Table 5, Ftens,mean = 37.6 kN | Standard deviation S = 0.5 kN) and the analytically determined tensile force for the maximum load using fc,mean acc. to Table 6 of 0.32 kN (test specimen V-1). The results for the series 280-C9s-VGS-13 are quite similar. Here, test specimen V-3 reveals the maximum deviation of 1.18 kN comparing the analytical solution (using fc,mean acc. to Table 6) and the tensile strength of the screws (Ftens,mean = 67.8 kN|S = 2.6 kN). As previously shown in Table 7, the effect of the applied compressive strength on the screw force is negligible for both series. When comparing the two applied quantile values of the compression strength ( and acc. to Table 6), the impact on the load of the individual screw only varies by approximately 0.5 kN, following the analytical approach. In detail, varying the compressive strengths results in a variation of the force in the screw of −0.18 kN ()|+0.21 kN () for series 160-L5s-VGS-9 and −0.23 kN ()|+0.27 kN () for series 280-C9s-VGS-13. Thus, the assumed position of the resulting compressive force is also accurately represented (see Figure 17). The assumption that compressive stress is applied in the first layer, even if it is a transverse layer, can, therefore, be seen as confirmed. However, a more conservative approach may be to neglect compressive stresses in the transverse layers in principle. This is due to shrinkage and gaps between the sides of two adjacent lamellas (see Figure 11), so that compressive stress equal to the compressive strength perpendicular to the grain cannot always be guaranteed.
For the 160-C5s-VGS-9 series, the analytical approach overestimates the screw’s tensile strength by approximately 8% on average for the three tests. This overestimation is due to the arrangement of a second row of fasteners in the upper section of this series. The strain evaluation in the joint between CLT and concrete indicates that in this series, the transition from the tensioned to the compressed cross-section occurs at the level of the upper row of fasteners (see Figure 12). Depending on the test and measured joint, compressive or tensile strains occurred at the level of these fasteners. Therefore, a more precise statement on the effect of the upper row of fasteners cannot be made based on this series. However, it should be noted that the analytical approach, which disregards the upper row of fasteners, is on the safe side. To provide a more accurate representation of the load-bearing capacity, further investigations are underway to extend the analytical approach in this regard [46].
In contrast, the 280-L9s-VGS-13 series shows an average underestimation of the force in the fasteners under tension over the three tests. However, it should be noted that in one of these tests (V-1), concrete spalling occurred even before the screws failed in tension (see Figure 13). When comparing the results of the other two tests with the analytical results, a good agreement is observed. In these two tests, the analytically calculated force in the fastener at the maximum load differs from the experimentally determined tensile strength of the individual screw by a maximum of 1%. The mean tensile strength was determined at 67.8 kN (S = 2.6 kN). For the two test specimens, there is a deviation of only 0.75 kN (V-2) and 0.12 kN (V-3) if the mean compressive strength (fc,mean acc. to Table 6) is used in the analytical approach. As mentioned in Section 3.2, the applied compressive strength has a more significant influence on the analytically calculated force in the fasteners in this series of tests. This is because a lower assumed compressive strength in the analytical approach also assumes compressive stress in the third layer (see Figure 8). Applying this to a single screw, a difference of about 3.2 kN is obtained by comparing the analytical results for the two quantiles of compressive strength (+2.6 kN using and −0.6 kN using according to Table 6). Referring to the plot in Figure 17 and considering the results for the average values of the analytically calculated lever arm z compared to the required lever arm , based on the tensile tests of the screws, it is noted that there is a deviation of 4.2 mm (V-2) and 2.6 mm (V-3). However, it has to be taken into account that the standard deviation of the tensile strength of the screws (S = 2.6 kN) already has an influence of more than ±8 mm on the result of in this series.
4. Summary
This publication introduces a new approach for a bending-resistant connection of two CLT elements using a timber–concrete–composite edge connection in order to form two-way spanning CLT slabs. This connection is particularly needed when the slab’s span exceeds the width of the individual CLT elements due to manufacturing or transportation reasons. To achieve this connection, self-tapping screws are installed in the narrow faces of the CLT elements. These screws are used to form a lap splice between two adjacent CLT panels. Concrete is then poured into the gap, where the additionally reinforced lap splice is formed. In this way, two CLT panels can be joined together, regardless of their lay-up and depth, resulting in a biaxially spanning CLT slab. An advantage of this approach is that it eliminates the need for gluing and can accommodate installation tolerances.
The effectiveness of this connection was demonstrated through four-point bending tests conducted in this study, which focused on a pure moment load perpendicular to the edge connection. To complement the experimental investigations, an analytical approach is proposed. This approach allows the determination of the load in the fasteners due to a pure bending moment in the ultimate limit state. This analytical approach provides a good representation of the experimentally determined load-carrying capacities. The tests show that this edge connection can achieve high load-bearing capacities. It is experimentally demonstrated that this connection can transfer bending moments of up to 70% of the characteristic bending resistance of the solid CLT element (acc. to [24]) (up to 130 kNm/m within series 280-L9s-VGS-13). These values, however, do not represent the upper limit of the connection, as the bending resistance can be easily adapted to specific structural requirements by adjusting the screw spacing or diameter.
This type of connection is currently under further investigation [46]. More tests are planned in order to statistically analyse the analytical approach more precisely. This will be supported by numerical models validated in these experiments. For ductility reasons, the replacement of self-tapping screws with rods with wood screw thread is being investigated. Future research will also extend the analytical approach by considering a second row of fasteners in the upper part of the cross-section, to provide a better representation of the load-bearing behaviour of the connection. Apart from the pure bending behaviour presented here, further investigations on the shear force behaviour must be carried out. These investigations will also serve as the foundation for studying the biaxial load-bearing behaviour of the edge connection. Investigations are also planned, with a focus on the biaxial load-bearing behaviour, including experimental and numerical studies on point-supported and continuously supported slabs. In addition to the load-bearing capacity, serviceability issues, particularly for point-supported flat slabs, need to be considered. Here, the stiffness of the connection is of major interest for the vibration behaviour of a slab. Furthermore, ongoing research is addressing questions about the long-term behaviour of this type of connection. Another point that should be considered, apart from the structural issues, relates to the question of sustainability. The edge connection introduces a non-detachable connection between concrete and CLT, which has a negative impact on the dismantling of the structure and its carbon footprint. Therefore, the authors are also working on alternatives to create the edge connection in addition to the presented solution. Here, the system connector mentioned in [14,15] represents a very promising, detachable, and dry approach.
Author Contributions
Conceptualization, T.S., R.M. and P.D.; methodology, T.S. and R.M.; writing—original draft preparation, T.S.; writing—review and editing, P.D. and R.M.; supervision, R.M.; project administration, R.M.; funding acquisition, R.M. All authors have read and agreed to the published version of the manuscript.
Funding
The work on the edge connection was funded by the Research Funding Association of Austria (FFG) within the research project “STS—slab to slab”, grant number 883687, and the commercial partner ROTHOBLAAS SRL from Cortaccia, Italy.
Data Availability Statement
Data are contained within the article.
Acknowledgments
The authors would like to thank the team of the Technical Laboratory for Research and Testing (TVFA) of the University of Innsbruck for carrying out the experimental campaign. Special thanks are extended to the partners of the research project “STS—Slab to Slab”—the Research Funding Association of Austria (FFG) and the company ROTHOBLAAS SRL from Cortaccia, Italy. Thanks also to the company Rubner from Kiens, Italy, for providing the CLT panels.
Conflicts of Interest
The authors declare no conflict of interest.
References
- Mestek, P.; Winter, S. Cross Laminated Timber (CLT)—Reinforcements with self-tapping screws. In Proceedings of the 11th World Conference on Timber Engineering (WCTE 2010), Trentino, Italy, 20–24 June 2010. [Google Scholar]
- Mestek, P. Punktgestützte Flächentragwerke aus Brettsperrholz (BSP)—Schubbemessung unter Berücksichtigung von Schubverstärkungen. Ph.D. Thesis, TU München, Munich, Germany, 2011. [Google Scholar]
- Zingerle, P.; Maderebner, R.; Flach, M. System Solutions for point supported wooden flat slabs. In Proceedings of the World Conference on Timber Engineering (WCTE 2016), Vienna, Austria, 22–25 August 2016. [Google Scholar]
- Maurer, B.; Maderebner, R.; Zingerle, P.; Färberböck, I.; Flach, M. Point-supported flat slabs with CLT panels. In Proceedings of the World Conference on Timber Engineering (WCTE 2018), Seoul, Republic of Korea, 20–23 August 2018. [Google Scholar]
- Maurer, B.; Maderebner, R. Cross Laminated Timber under Concentrated Compression Loads—Methods of Reinforcement. Eng. Struct. 2021, 245, 112534. [Google Scholar] [CrossRef]
- Muster, M. Column-Slab Connection in Timber Flat Slabs. Ph.D. Thesis, ETH Zürich, Zürich, Switzerland, 2021. [Google Scholar]
- Tapia, C.; Amtsberg, F.; Münzer, A.; Aicher, S.; Menges, A. Rotational Stiffness of Newly Developed LVL-based Column-Head Reinforcement for Point-Supported Slab-Column Building Systems. In Proceedings of the World Conference on Timber Engineering (WCTE 2023), Oslo, Norway, 19–22 June 2023; Nyrud, A.Q., Malo, K.A., Eds.; Curran Associates, Inc.: New York, NY, USA, 2023; pp. 688–697. [Google Scholar]
- Asselstine, J.; Lam, F.; Zhang, C. New edge connection technology for cross laminated timber (CLT) floor slabs promoting two-way action. Eng. Struct. 2021, 233, 111777. [Google Scholar] [CrossRef]
- Wallner-Novak, M.; Koppelhuber, J.; Pock, K. Cross-Laminated Timber Structural Design—Basic Design and Engineering Principles According to Eurocode; proHolz Austria: Wien, Austria, 2014. [Google Scholar]
- Tapia, C.; Claus, M.; Aicher, S. A finger-joint based edge connection for the weak direction of CLT plates. Constr. Build. Mater. 2022, 340, 127645. [Google Scholar] [CrossRef]
- Bathon, L.; Bletz-Mühldorfer, O.; Diehl, F.; Schmidt, J.; Wagner, A.; Weil, M. Anwendungen von eingeklebten Lochblechen unter statischen sowie ermüdenden Einwirkungen. In Proceedings of the 20 Internationales Holzbau-Forum IHF 2014, Garmisch, Germany, 3–5 December 2014. [Google Scholar]
- Maurer, B. Lösungsansätze für Punktgestützte Flachdecken aus Brettsperrholz. Ph.D. Thesis, University of Innsbruck, Innsbruck, Austria, 2020. [Google Scholar]
- Zöllig, S.; Frangi, A.; Franke, S.; Muster, M. Timber structures 3.0—New technology for multi-axial, slim, high performance timber structures. In Proceedings of the World Conference on Timber Engineering (WCTE 2016), Vienna, Austria, 22–25 August 2016. [Google Scholar]
- Stieb, T.; Maurer, B.; Bestler, M.; Dietsch, P.; Maderebner, R. Solutions for edge connections to build two-way spanning cross laminated timber slabs. In Proceedings of the World Conference on Timber Engineering (WCTE 2023), Oslo, Norway, 19–22 June 2023; Nyrud, A.Q., Malo, K.A., Eds.; Curran Associates, Inc.: New York, NY, USA, 2023; pp. 1322–1329. [Google Scholar]
- Bestler, M. Plattenstoßausführungen von Brettsperrholz: Ein Beitrag für punktgestützte Flachdecken aus Brettsperrholz. Master’s Thesis, University of Innsbruck, Innsbruck, Austria, 2021. [Google Scholar]
- Broger, H. Schraubverbinder für Brettsperrholzelemente. Master’s Thesis, University of Innsbruck, Innsbruck, Austria, 2019. [Google Scholar]
- Stufferin, A. Biegesteifer Plattenstoß von Brettsperrholzplatten. Master’s Thesis, University of Innsbruck, Innsbruck, Austria, 2017. [Google Scholar]
- Jaaranen, J.; Fink, G. Experimental and numerical investigations of a timber-concrete dovetail splice joint. J. Build. Eng. 2021, 43, 103179. [Google Scholar] [CrossRef]
- Jaaranen, J.; Fink, G. Experimental and numerical investigations of two-way LVL–concrete composite plates with various support conditions. Eng. Struct. 2022, 256, 114019. [Google Scholar] [CrossRef]
- Loebus, S.; Dietsch, P.; Winter, S. Two-way Spanning CLT-Concrete-Composite-Slabs. In Proceedings of the International Network on Timber Engineering Research INTER, Meeting 50, Kyoto, Japan, 28–31 August 2017. INTER/50-12-7. [Google Scholar]
- Maderebner, R. European Manufacturing: What’s next. In Proceedings of the International Mass Timber Conference, Portland, OR, USA, 30 March–1 April 2021. [Google Scholar]
- Arnold, M.; Dietsch, P.; Maderebner, R.; Winter, S. Diagonal laminated timber—Experimental, analytical, and numerical studies on the torsional stiffness. Constr. Build. Mater. 2022, 322, 126455. [Google Scholar] [CrossRef]
- Arnold, M.; Maderebner, R.; Dietsch, P.; Winter, S. Diagonallagenholz (DLH) Ressourceneffizienz durch diagonale Orientierung einzelner Lagen: Bestimmung der Steifigkeitsparameter und Verformungsanalysen. Bautechnik 2023, 100, 442–462. [Google Scholar] [CrossRef]
- ETA 18/0303; Rubner XLAM—Rubner CL. Rubner Holding AG. OIB: Vienna, Austria, 2018.
- ETA 11/0030; Rotho Blaas Self-Tapping Screws and Threaded Rods. Rotho Blaas s.r.l. ETA-Danmark: Kopenhagen, Denmark, 2020.
- ÖNORM EN 1992-1-1; Eurocode 2: Design of Concrete Structures—Part 1-1: General Rules and Rules for Buildings (Consolidated Version). Austrian Standards International (ASI): Vienna, Austria, 2015.
- Ceccotti, A. Timber-concrete composite structures. In Timber Engineering—STEP 2; Blass, H.J., Aune, P., Choo, B.S., Görlacher, R., Griffiths, D.R., Hilson, B.O., Racher, P., Steck, G., Eds.; Publishing House: Centrum Hout, The Netherlands, 1995; p. E13/1-12. [Google Scholar]
- FprCEN/TS 19103; Eurocode 5: Design of Timber Structures—Structural Design of Timber-Concrete Composite Structures—Common Rules and Rules for Buildings. European Committee for Standardization (CEN): Brussels, Belgium, 2021.
- Flaig, M.; Schmidt, T.; Blass, H.J. Compressive strength and stiffness of end grain contact joints in glulam and CLT. In Proceedings of the International Network on Timber Engineering Research INTER, Meeting 52, Tacoma, WA, USA, 26–29 August 2019. INTER/52-12-5. [Google Scholar]
- ÖNORM EN 1995-1-1; Eurocode 5: Design of Timber Structures—Part 1-1: General—Common Rules and Rules for Buildings (Consolidated Version). Austrian Standards International (ASI): Vienna, Austria, 2019.
- EN 408; Timber Structures—Structural Timber and Glued laminated Timber—Determination of Some Physical and Mechanical Properties. European Committee for Standardization (CEN): Brussels, Belgium, 2012.
- EN 16351; Timber Structures—Timber Structures—Cross Laminated Timber—Requirements. European Committee for Standardization (CEN): Brussels, Belgium, 2021.
- EAD 130005-00-0304; Solid Wood Slab Element to Be Used as a Structural Element in Buildings. European Organisation for Technical Assessment (EOTA): Brussels, Belgium, 2015.
- EN 26891; Timber Structures—Joints Made with Mechanical Fasteners—General Principles for the Determination of Strength and Deformation Characteristics. European Committee for Standardization (CEN): Brussels, Belgium, 1991.
- X-Sight s.r.o. Alpha, Version: 2022.0.41; X-Sight s.r.o.: Brno, Czech Republic, 2022.
- EAD 130118-01-0603; Screws and Threaded Rods for Use in Timber Constructions. European Organisation for Technical Assessment (EOTA): Brussels, Belgium, 2019.
- EN 14592; Timber Structures—Dowel-Type Fasteners—Requirements. European Committee for Standardization (CEN): Brussels, Belgium, 2022.
- EN 1383; Timber Structures—Test Methods—Pull through Resistance of Timber Fasteners. European Committee for Standardization (CEN): Brussels, Belgium, 2016.
- EN 12390-2; Testing Hardened Concrete—Part 2: Making and Curing Specimens for Strength Tests. European Committee for Standardization (CEN): Brussels, Belgium, 2019.
- EN 12390-3; Testing Hardened Concrete—Part 3: Compressive Strength of Test Specimens. European Committee for Standardization (CEN): Brussels, Belgium, 2019.
- ETA 22/0806; Rotho Blaas TIMBER-CONCRETE FUSION System TC FUSION. Rotho Blaas s.r.l. ETA-Danmark: Kopenhagen, Denmark, 2022.
- Totsuka, M.; Jockwer, R.; Kawahara, H.; Aoki, K.; Inayama, M. Experimental study of compressive properties parallel to grain of glulam. J. Wood Sci. 2022, 68, 33. [Google Scholar] [CrossRef]
- EN 14358; Timber Structures—Calculation and Verification of Characteristic Values. European Committee for Standardization (CEN): Brussels, Belgium, 2016.
- EN 338; Structural Timber—Strength Classes. European Committee for Standardization (CEN): Brussels, Belgium, 2016.
- JCSS: Probabilistic Model Code: Part 3: Resistance Models—3.05 Properties of Timber; Joint Committee on Structural Safety: Berlin, MD, USA, 2006.
- Stieb, T. Biegesteife Verbindungen von Brettsperrholzelementen (Working Title). Ph.D. Thesis, University of Innsbruck, Innsbruck, Austria, 2024. manuscript under preperation. [Google Scholar]


Disclaimer/Publisher’s Note: The statements, opinions and data contained in all publications are solely those of the individual author(s) and contributor(s) and not of MDPI and/or the editor(s). MDPI and/or the editor(s) disclaim responsibility for any injury to people or property resulting from any ideas, methods, instructions or products referred to in the content. |
© 2023 by the authors. Licensee MDPI, Basel, Switzerland. This article is an open access article distributed under the terms and conditions of the Creative Commons Attribution (CC BY) license (https://creativecommons.org/licenses/by/4.0/).