
Thermal Analysis of Air-Cooled Channels of Different Sizes in Naturally Ventilated Photovoltaic Wall Panels

Abstract
:1. Introduction
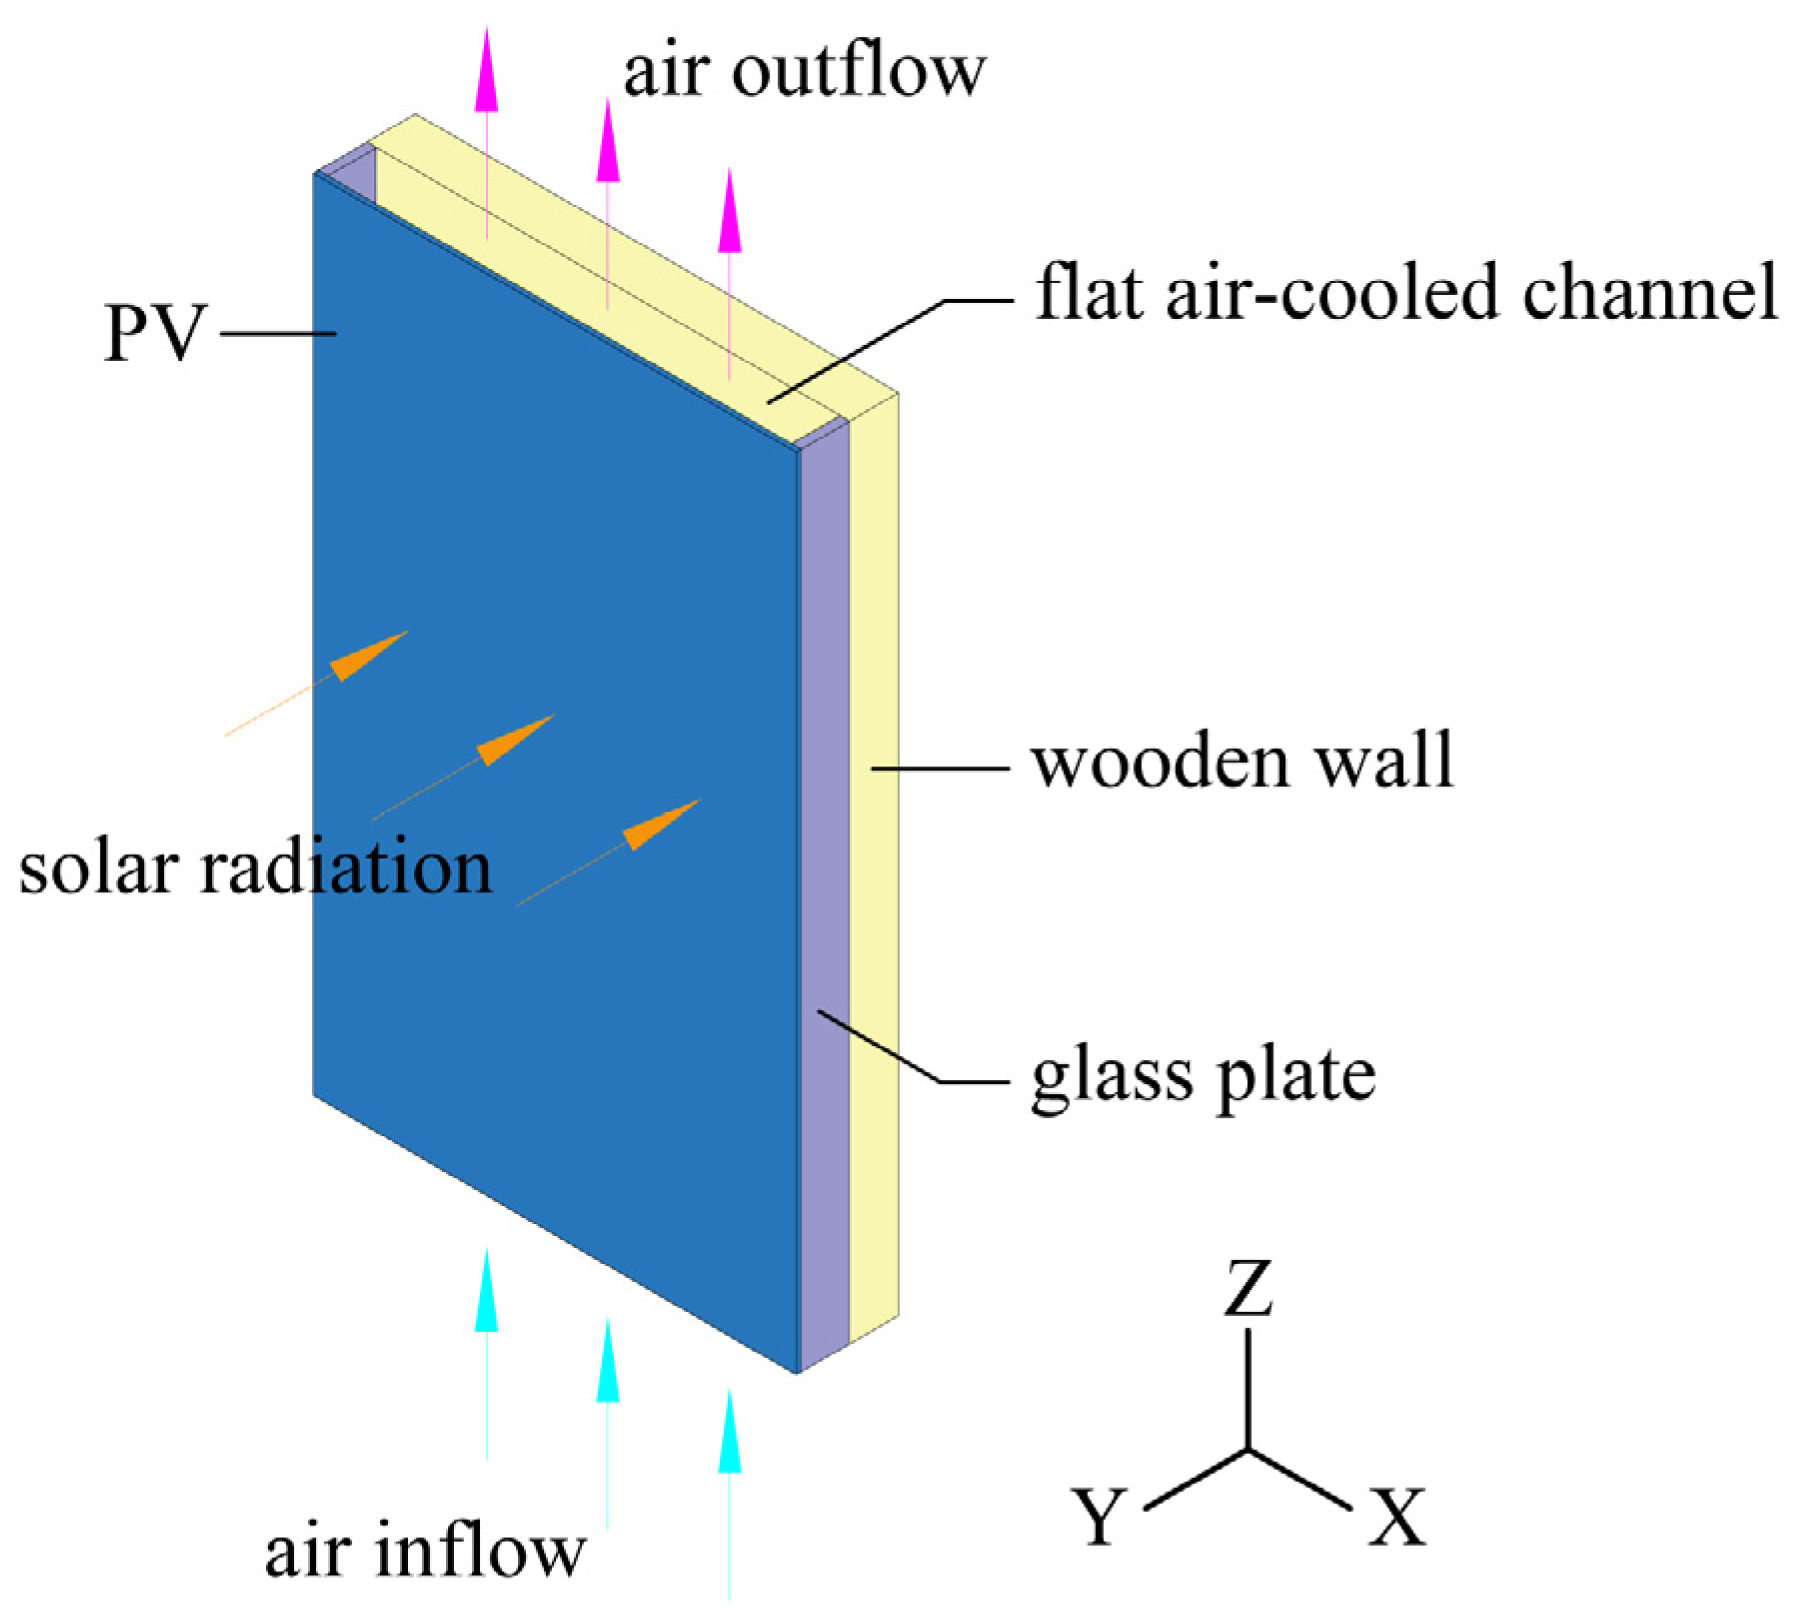
2. System Description
3. Methodology
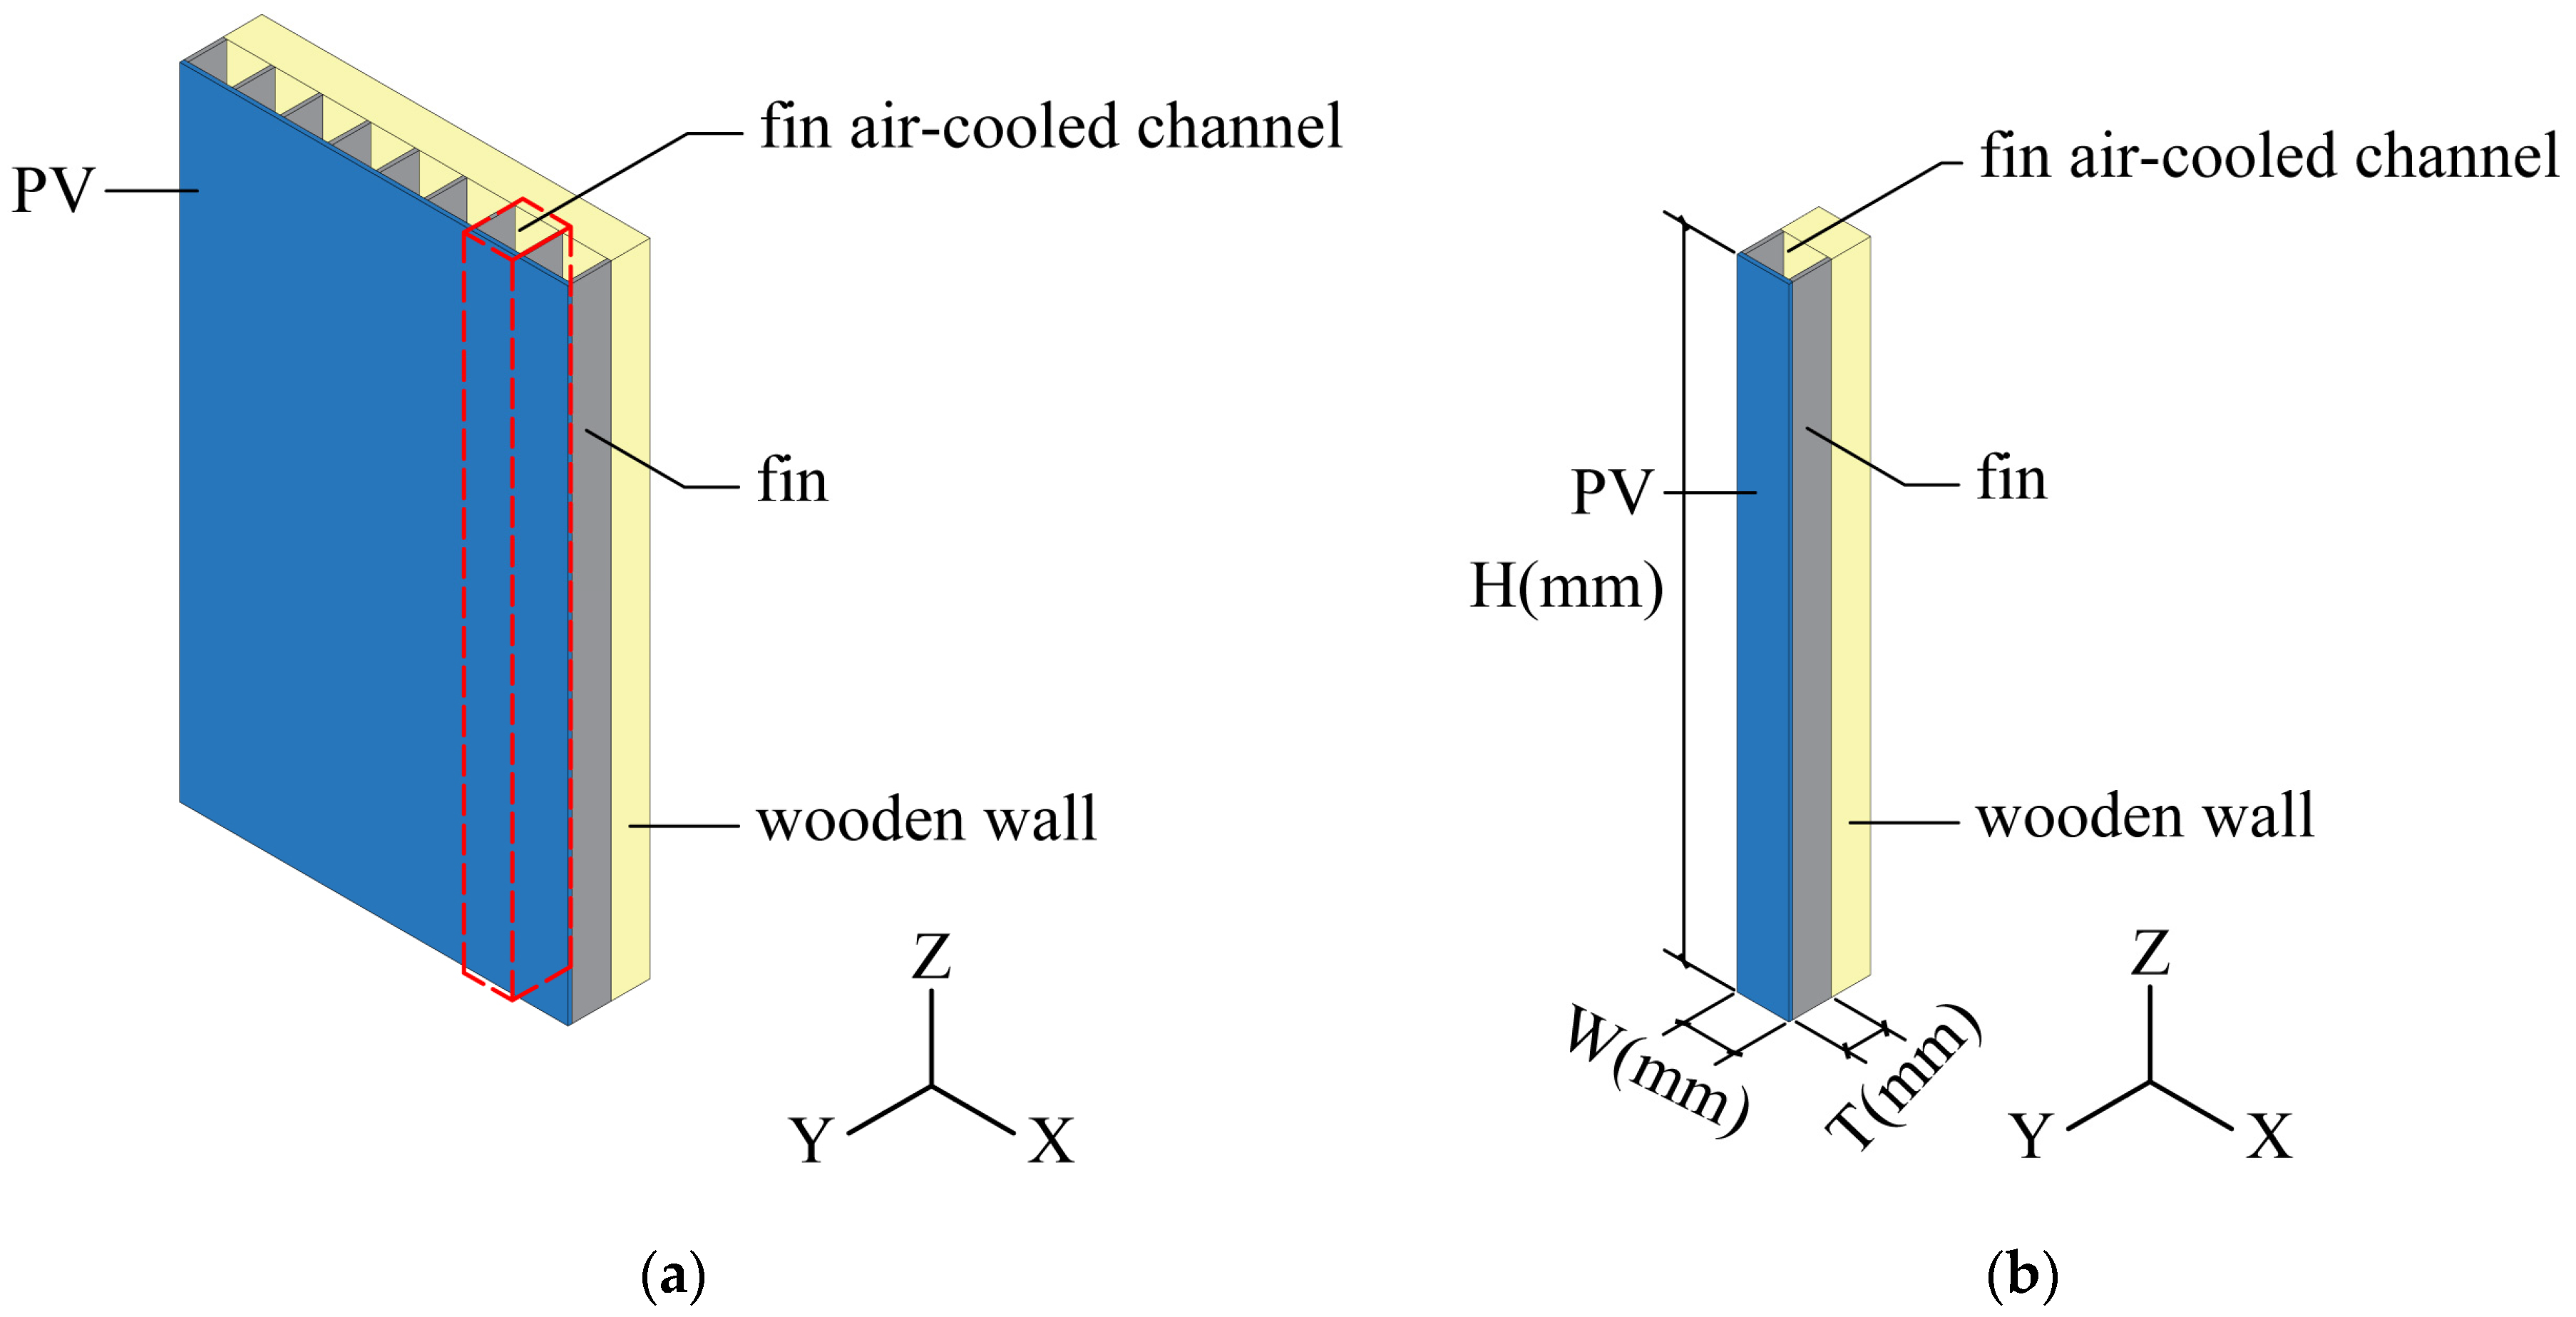
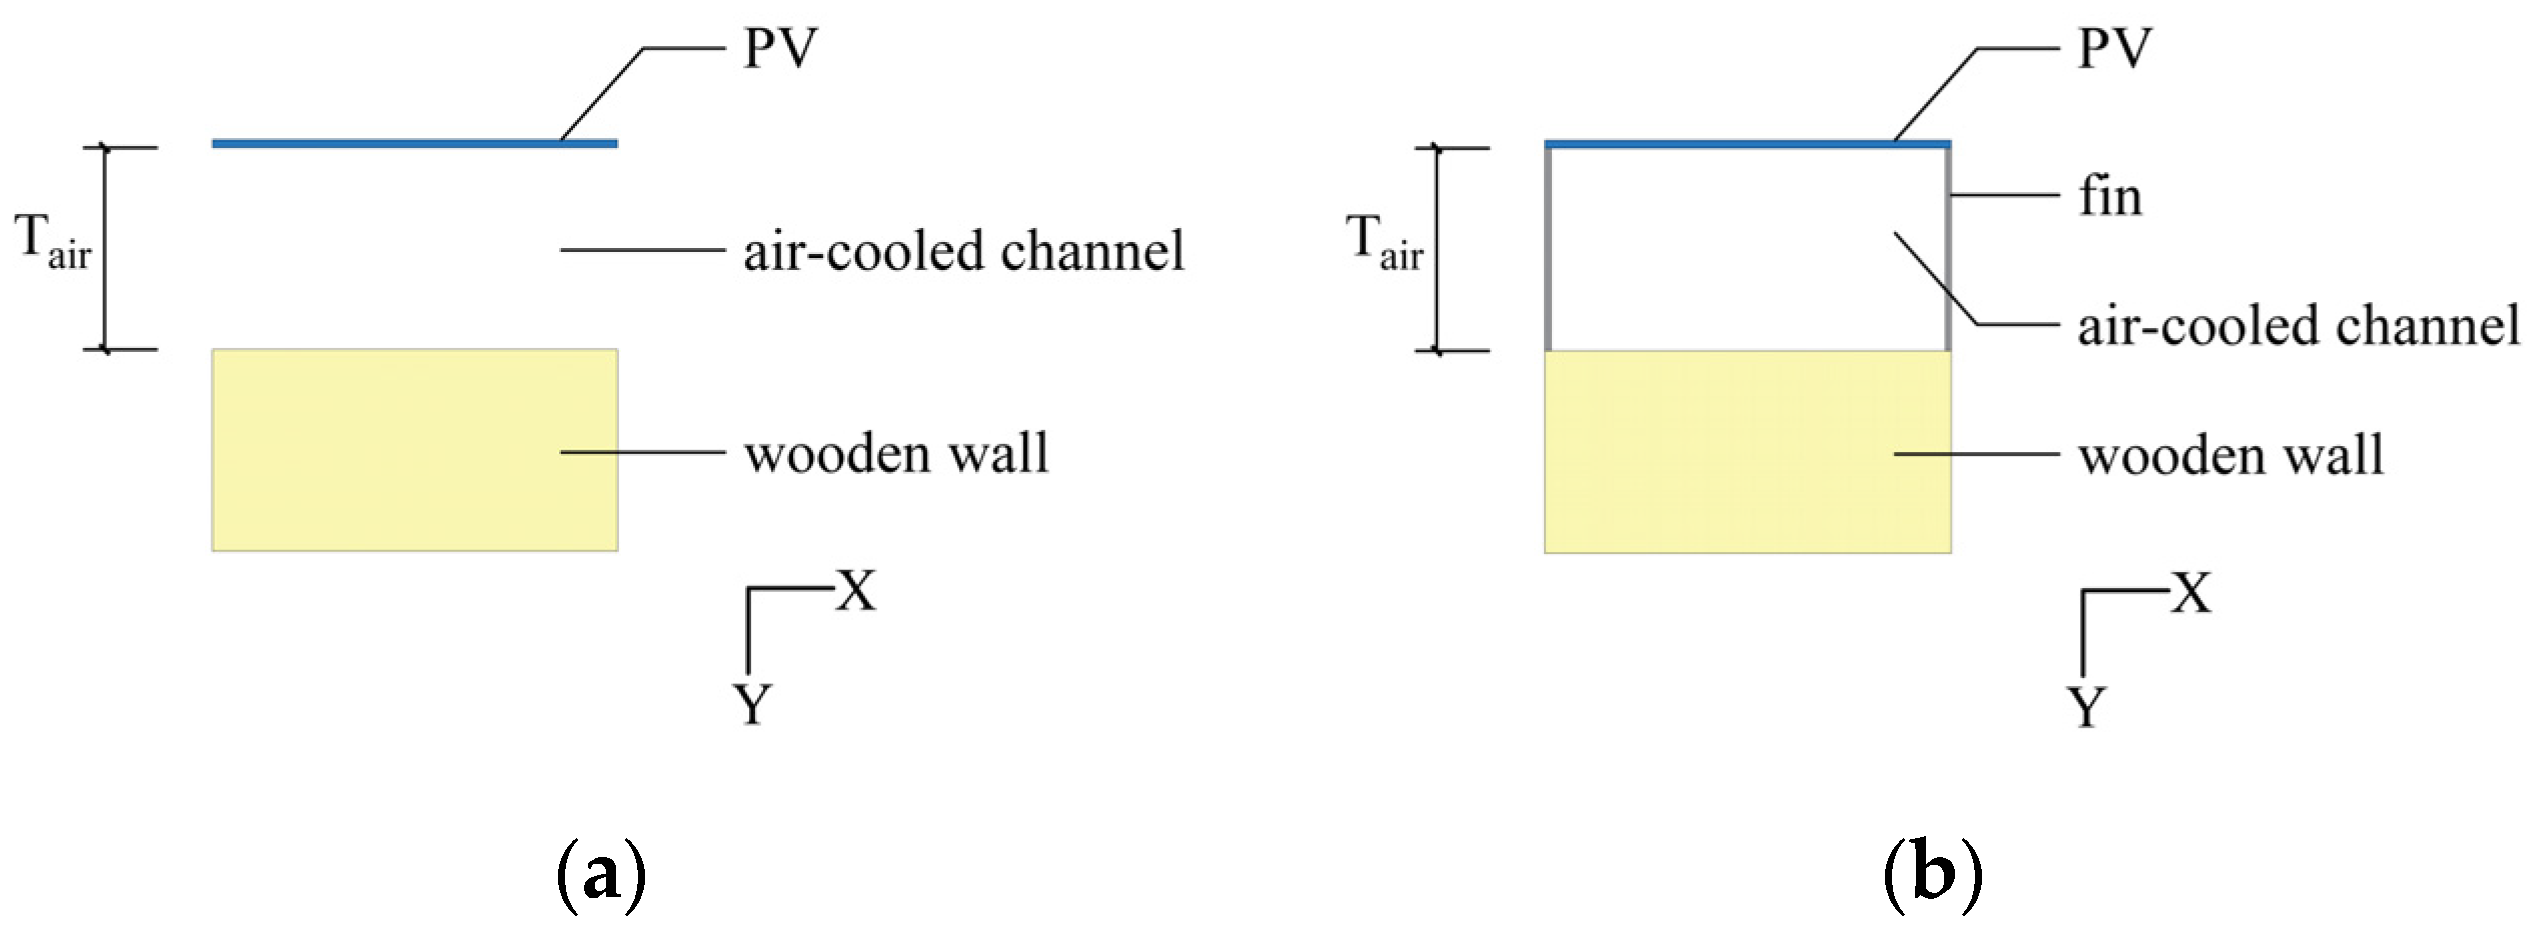
3.1. Geometry Model
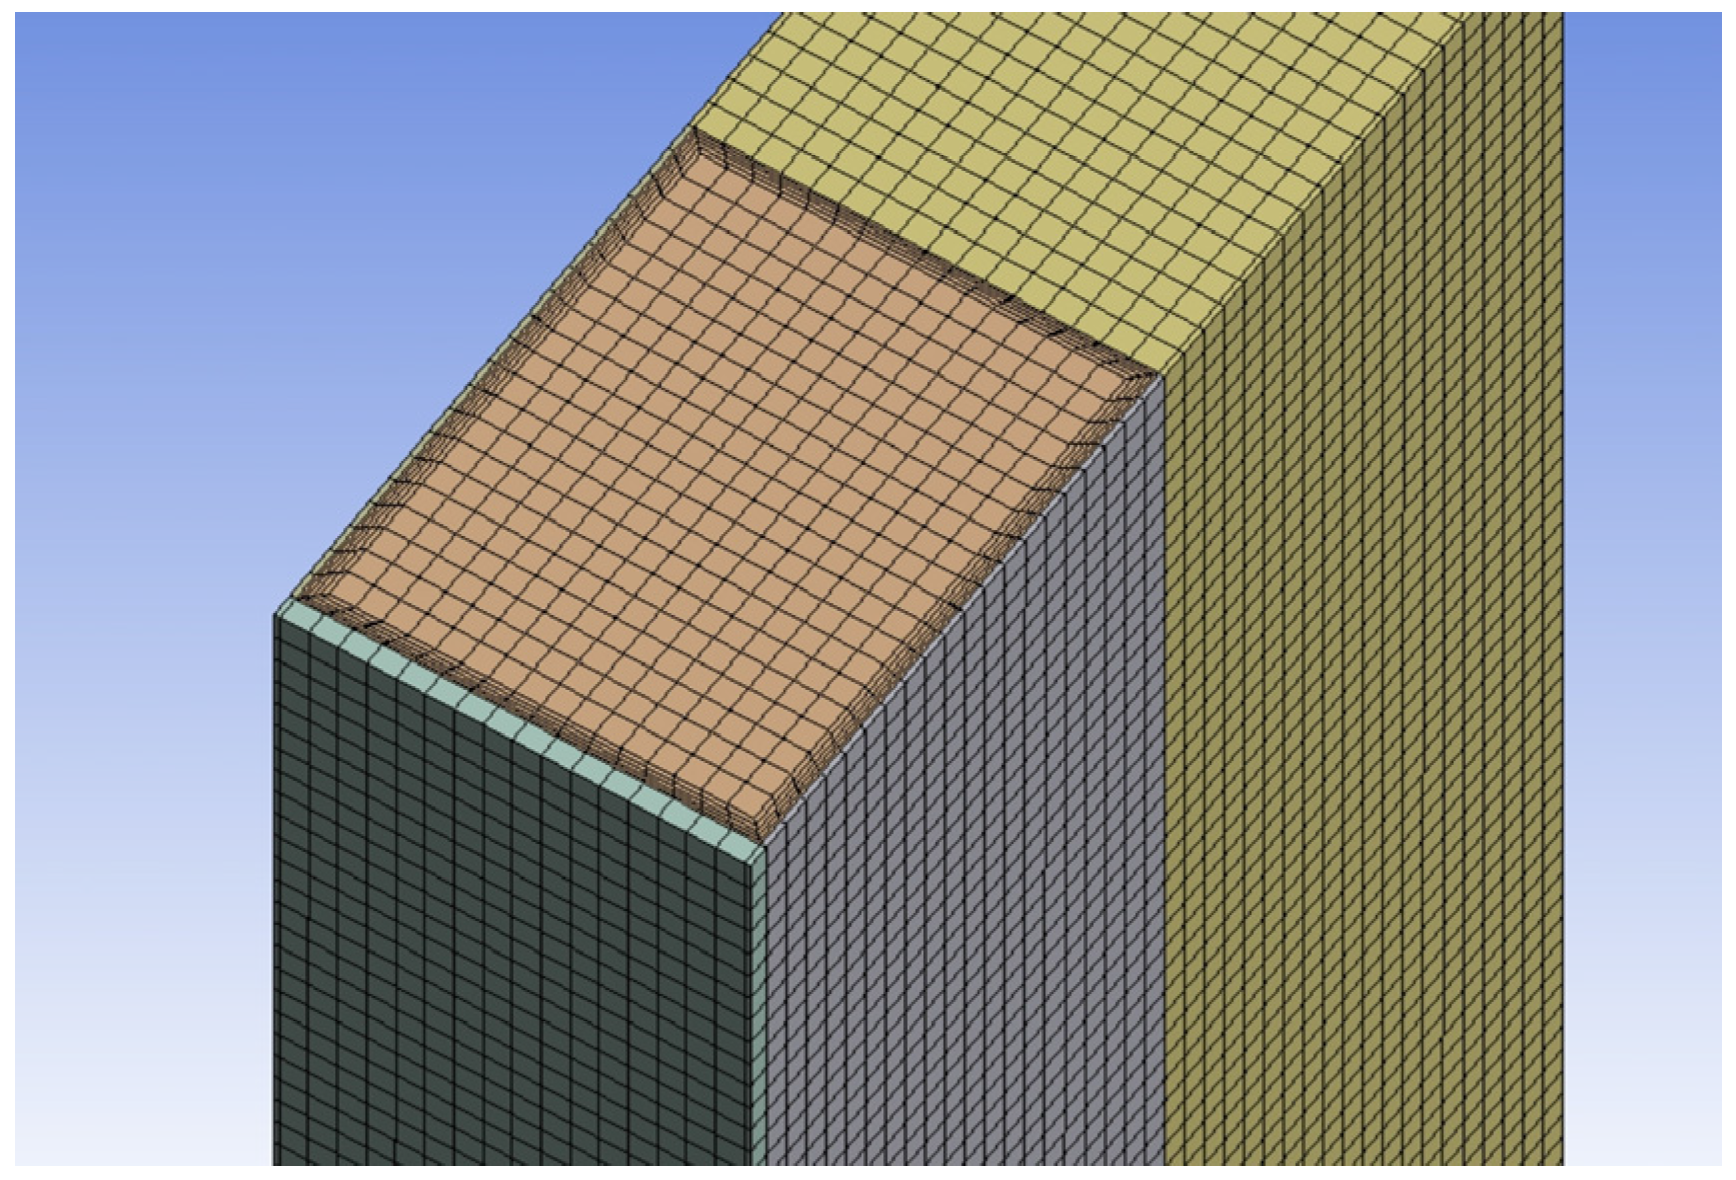
3.2. Mesh Generation
3.3. Grid Independence Verification
3.4. Assumptions
3.5. Governing Equation
3.6. Boundary Conditions
3.7. Solution Method
3.8. Model Validation
4. Results and Discussion
4.1. Study on Different Thicknesses of Air-Cooled Channels
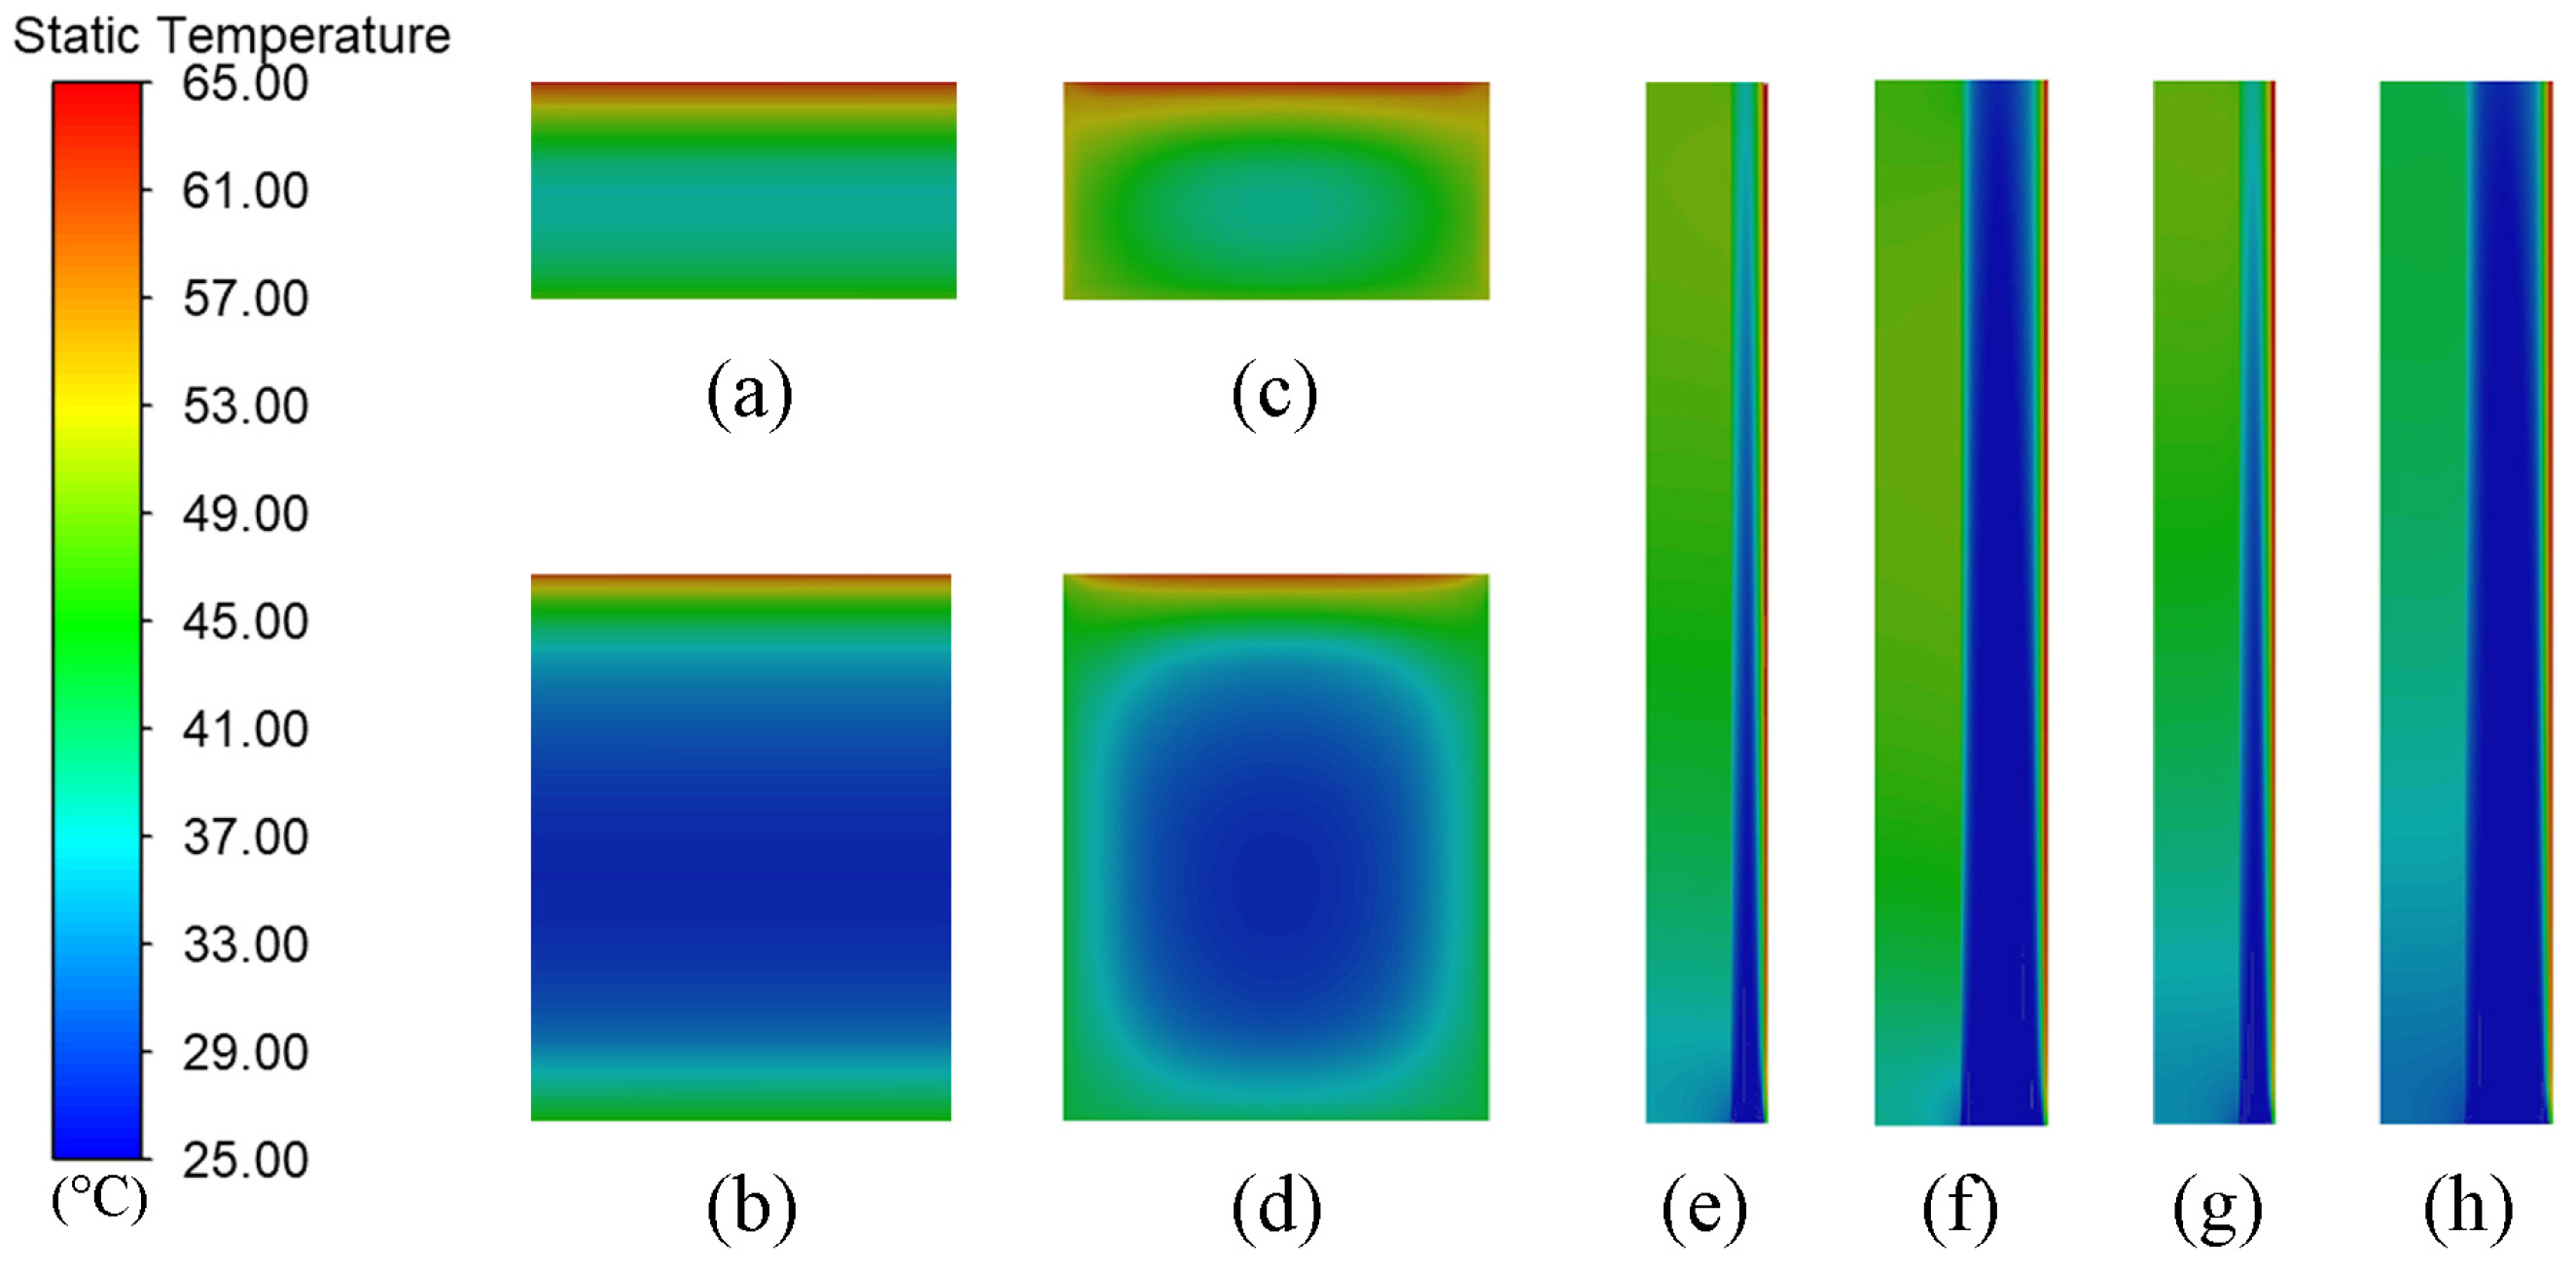
4.1.1. The Temperature Distribution of BIPV System
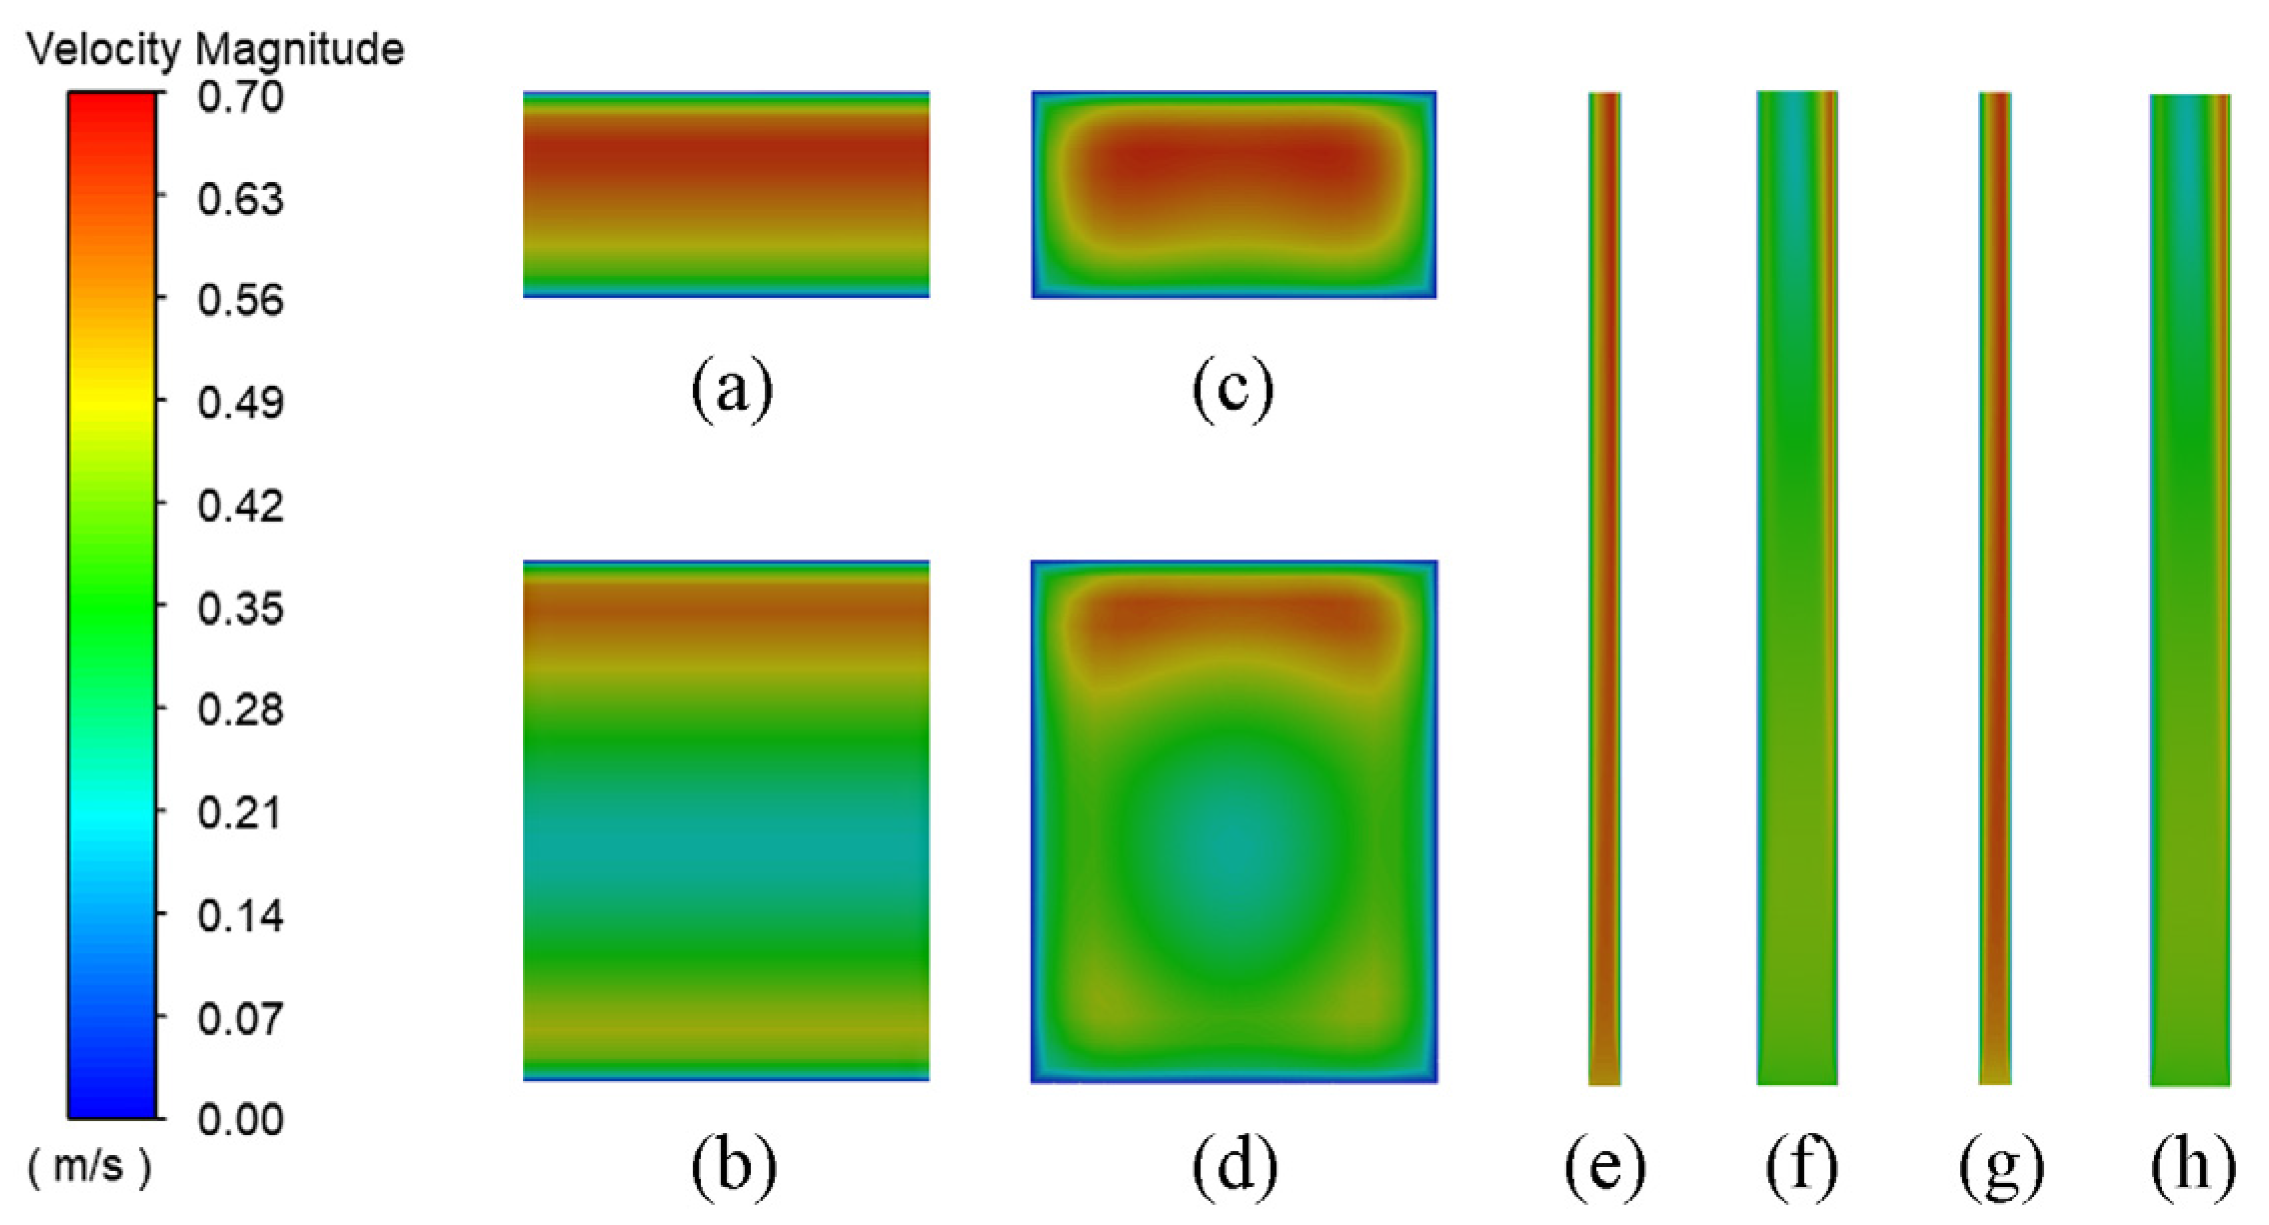
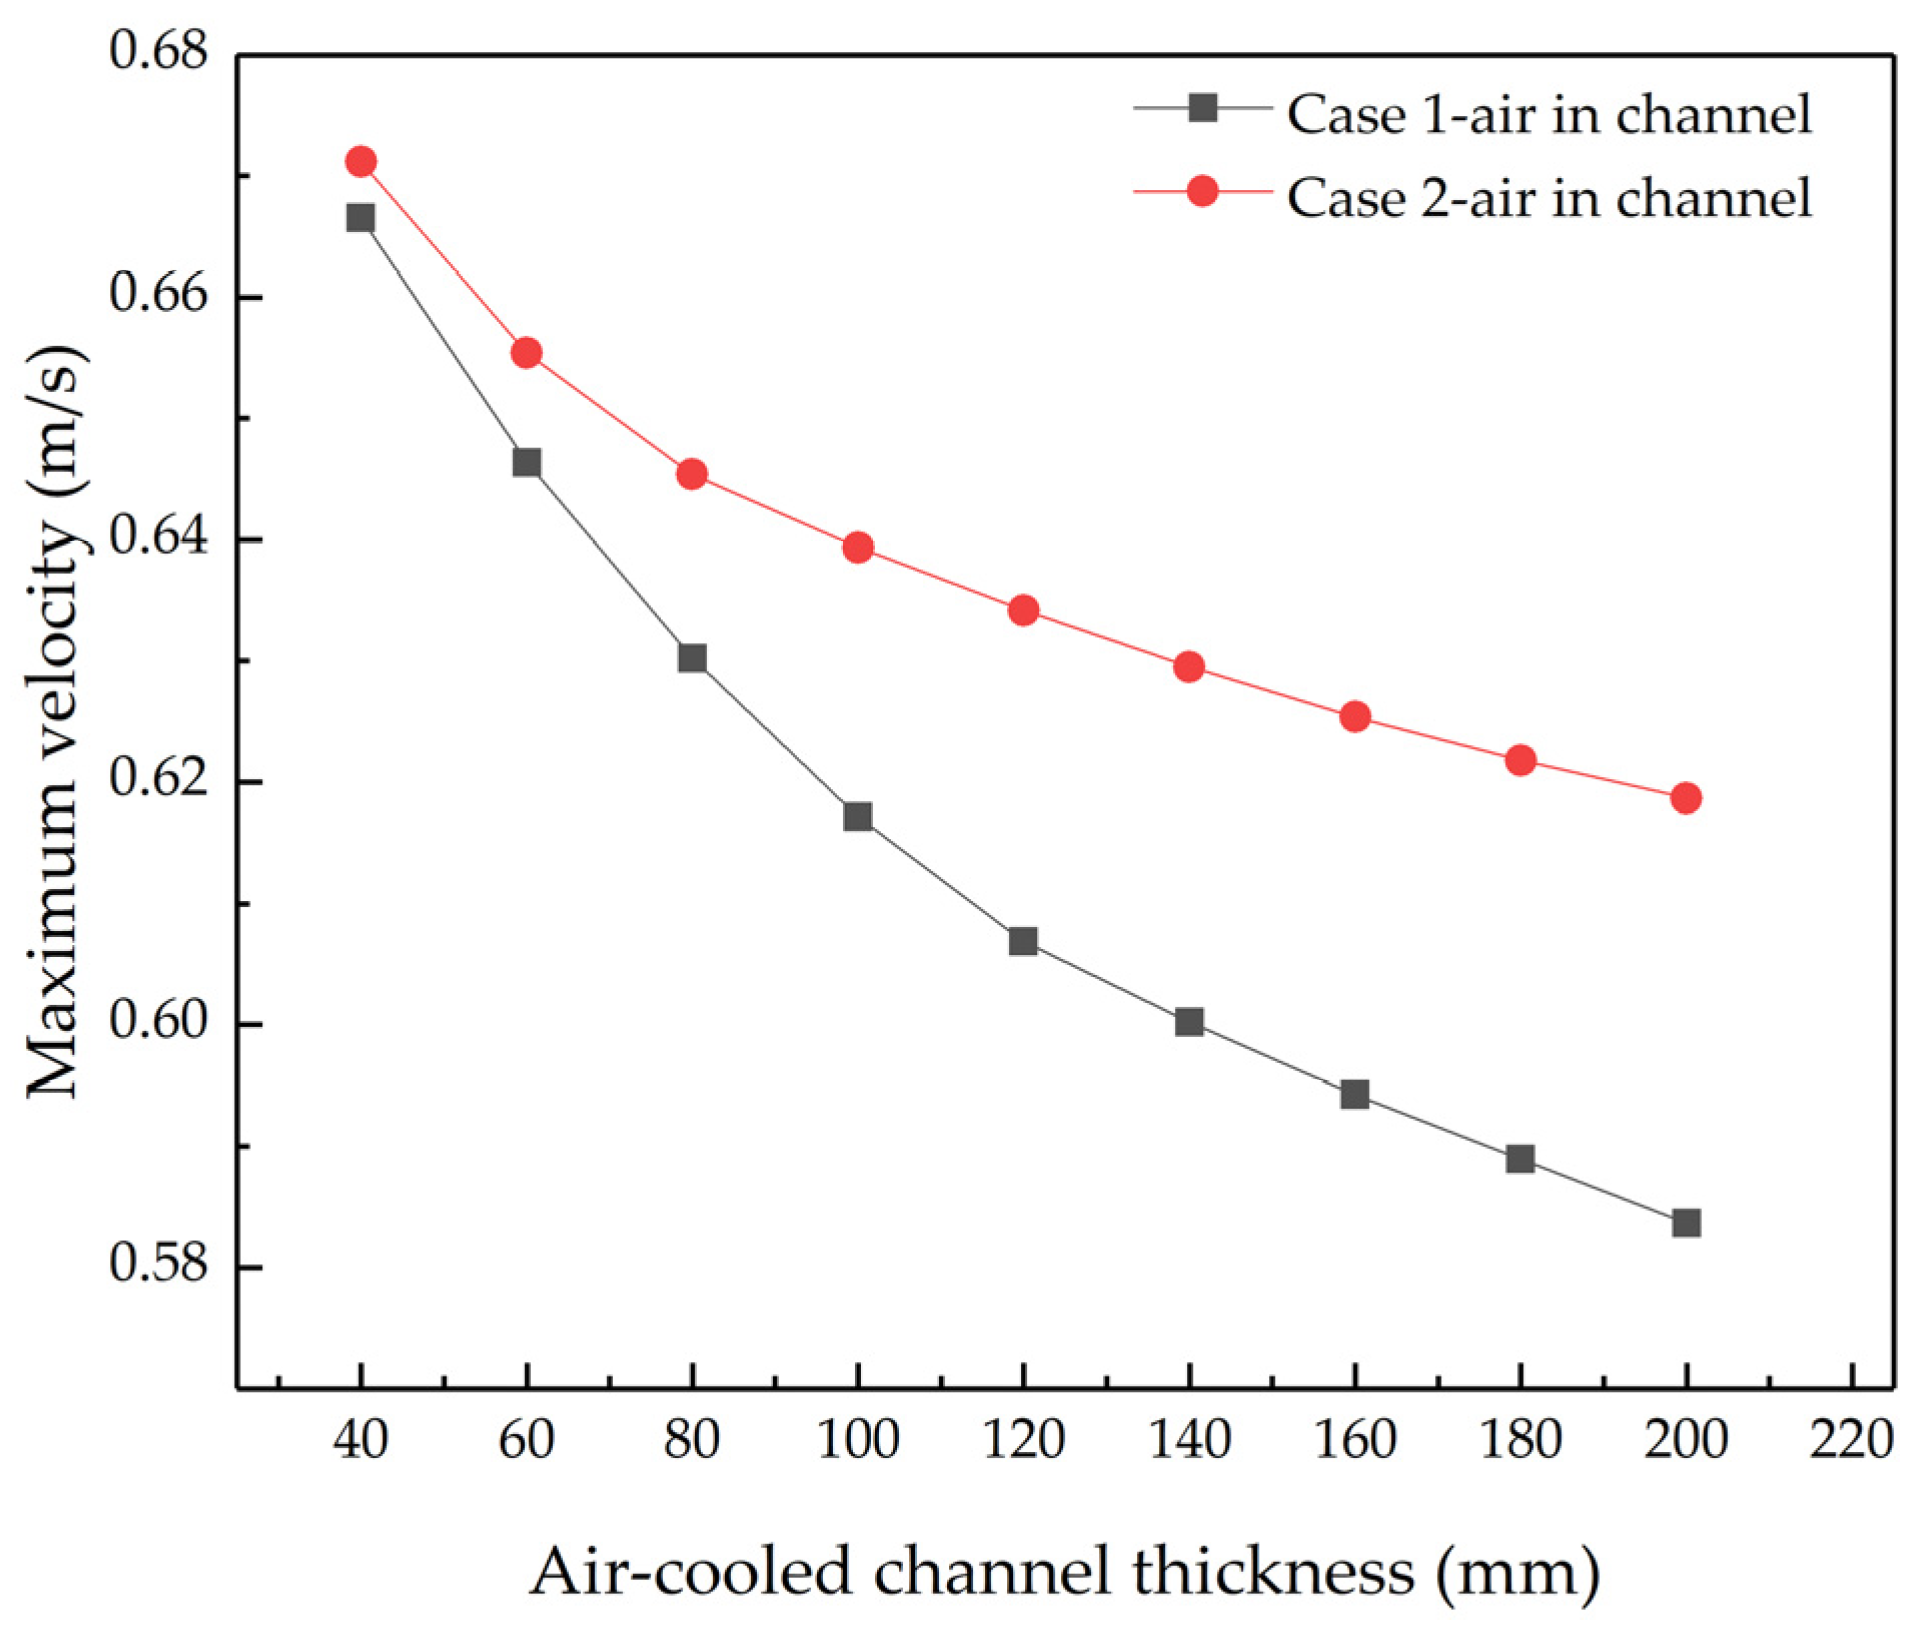
4.1.2. Velocity Distribution of Air-Cooled Channels
4.2. Study on Different Widths of Air-Cooled Channel
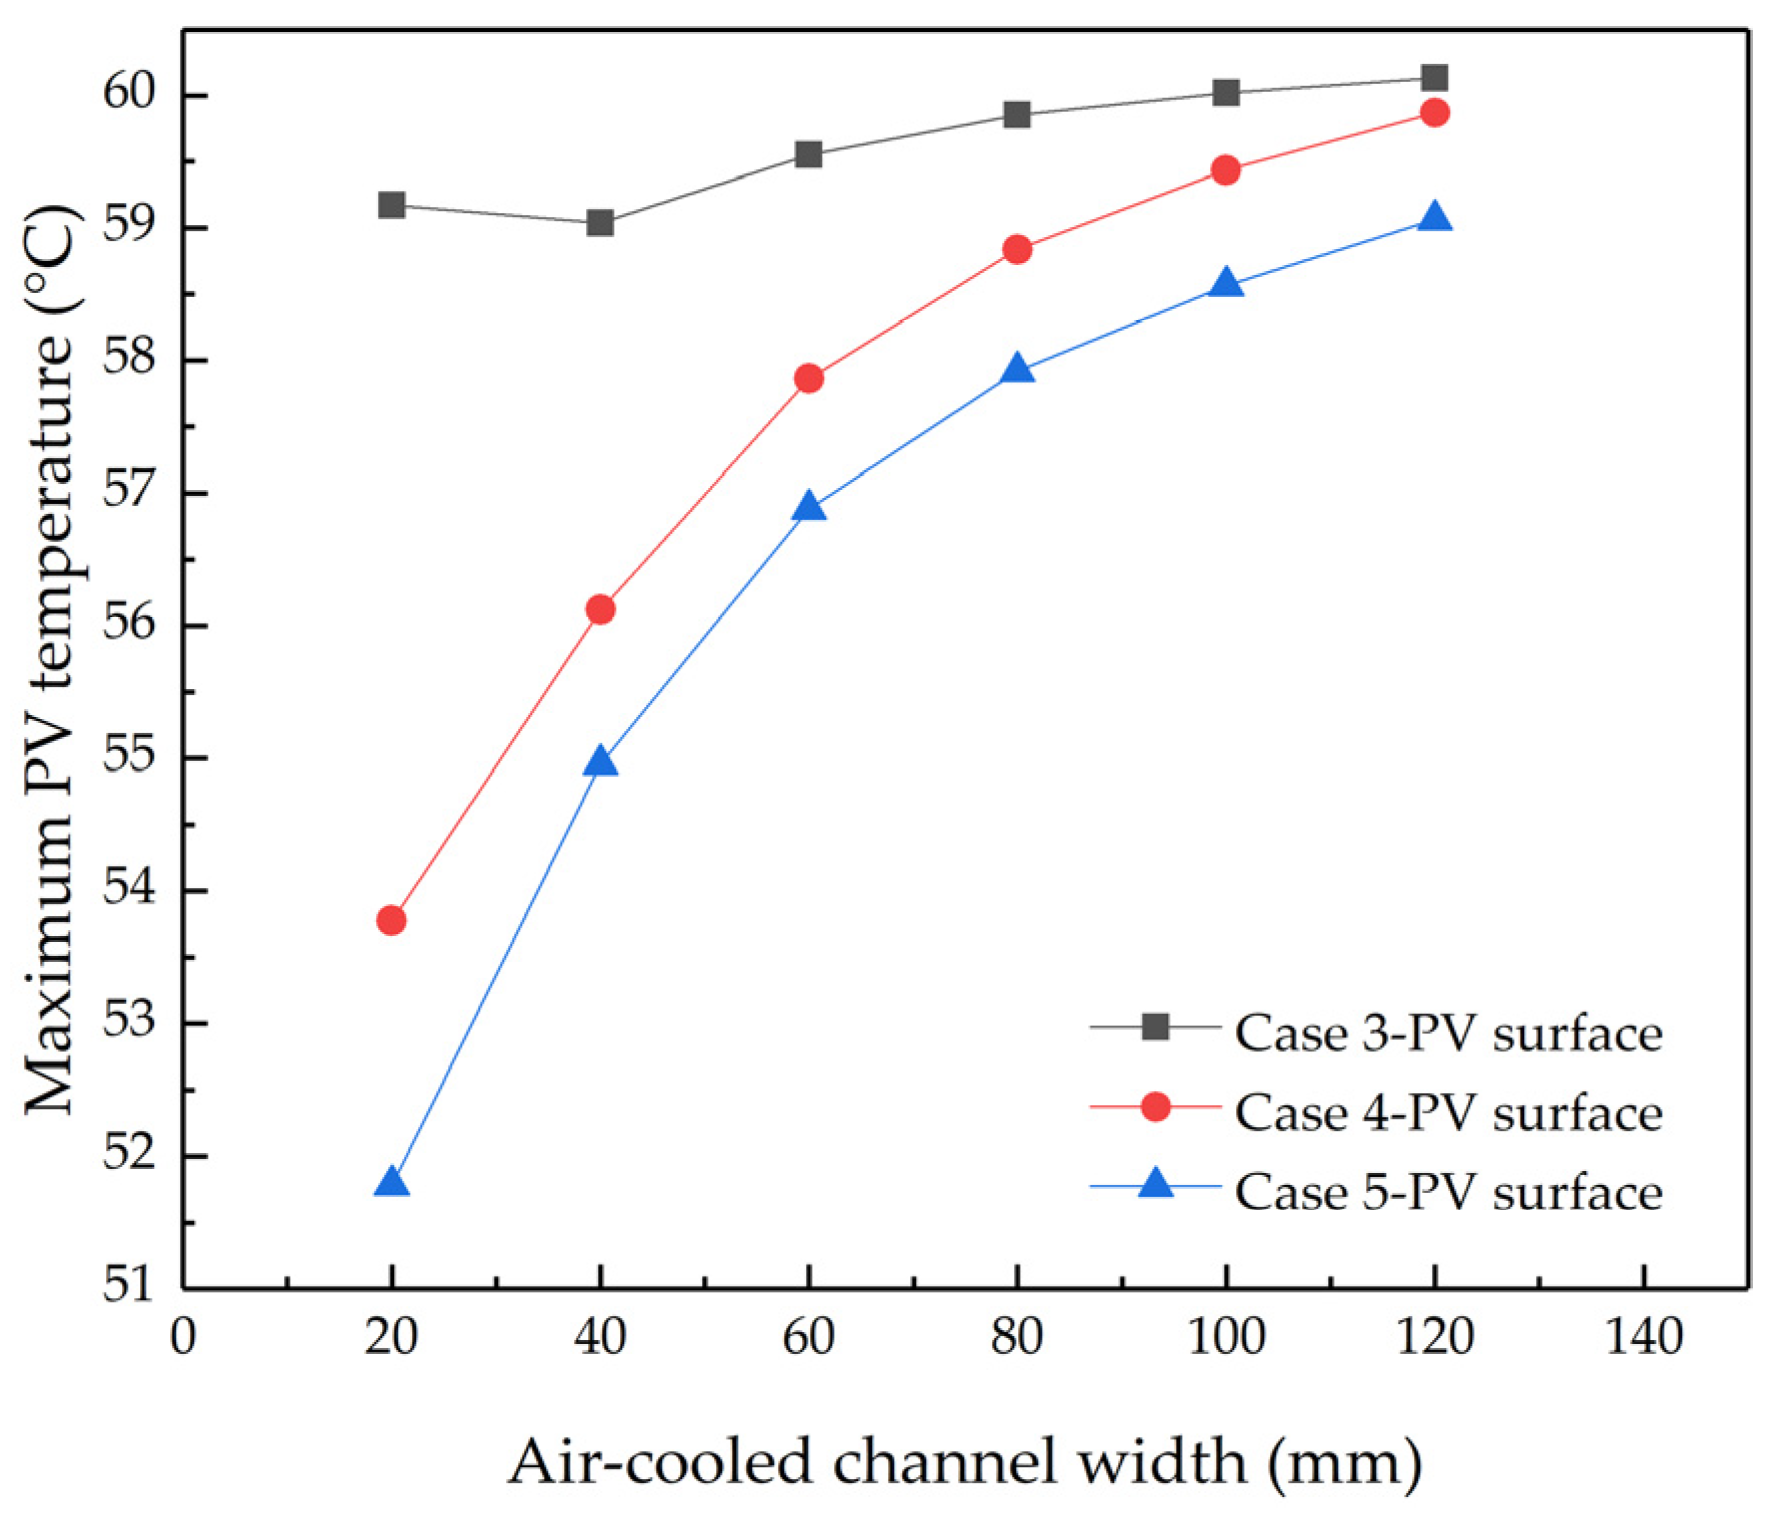
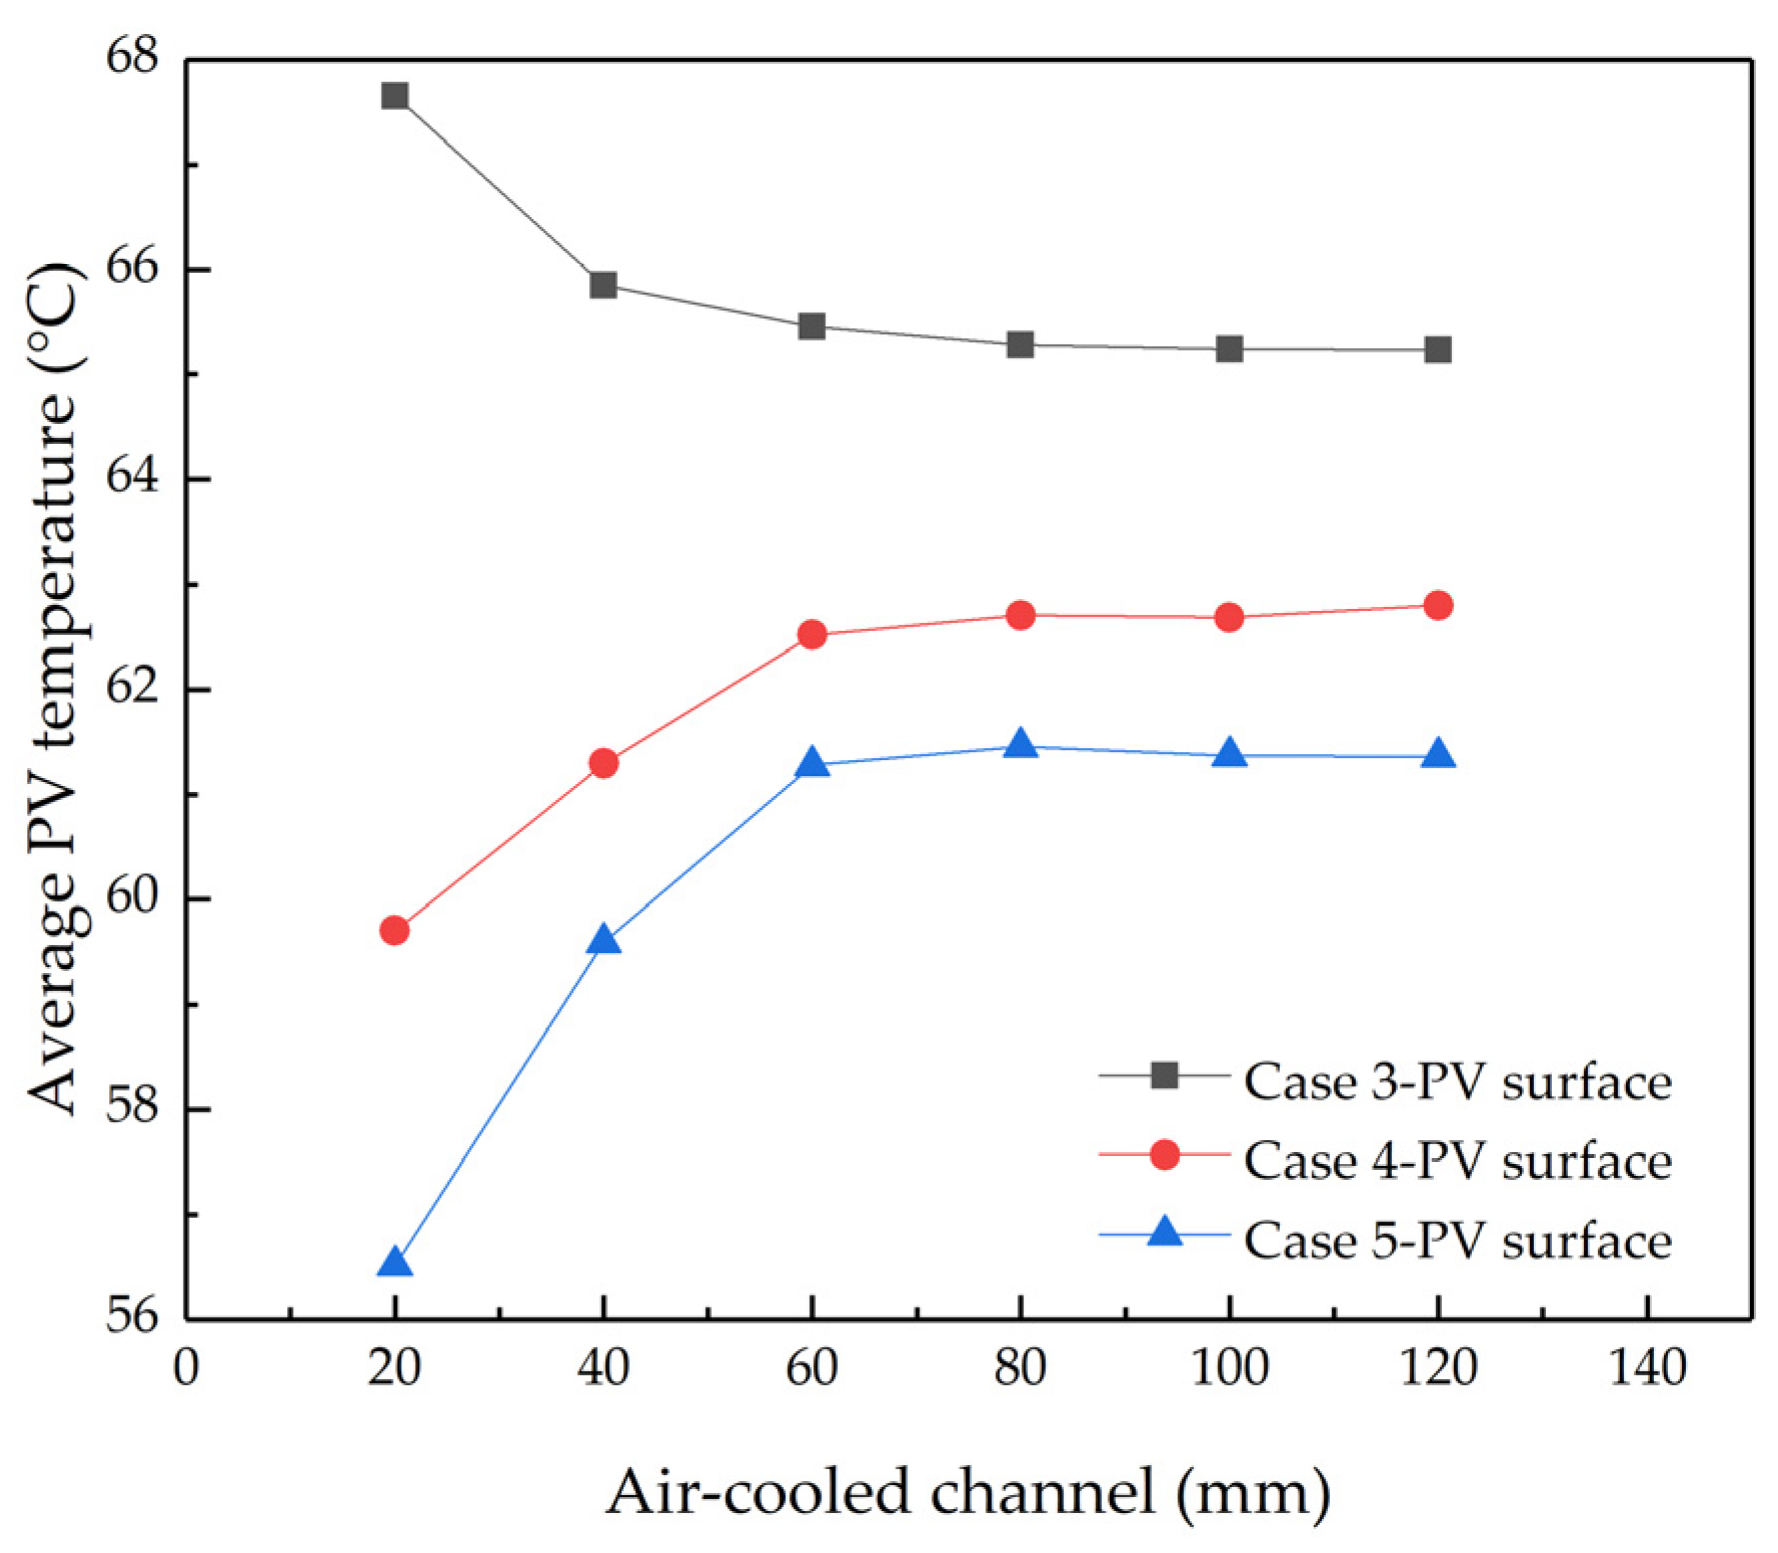
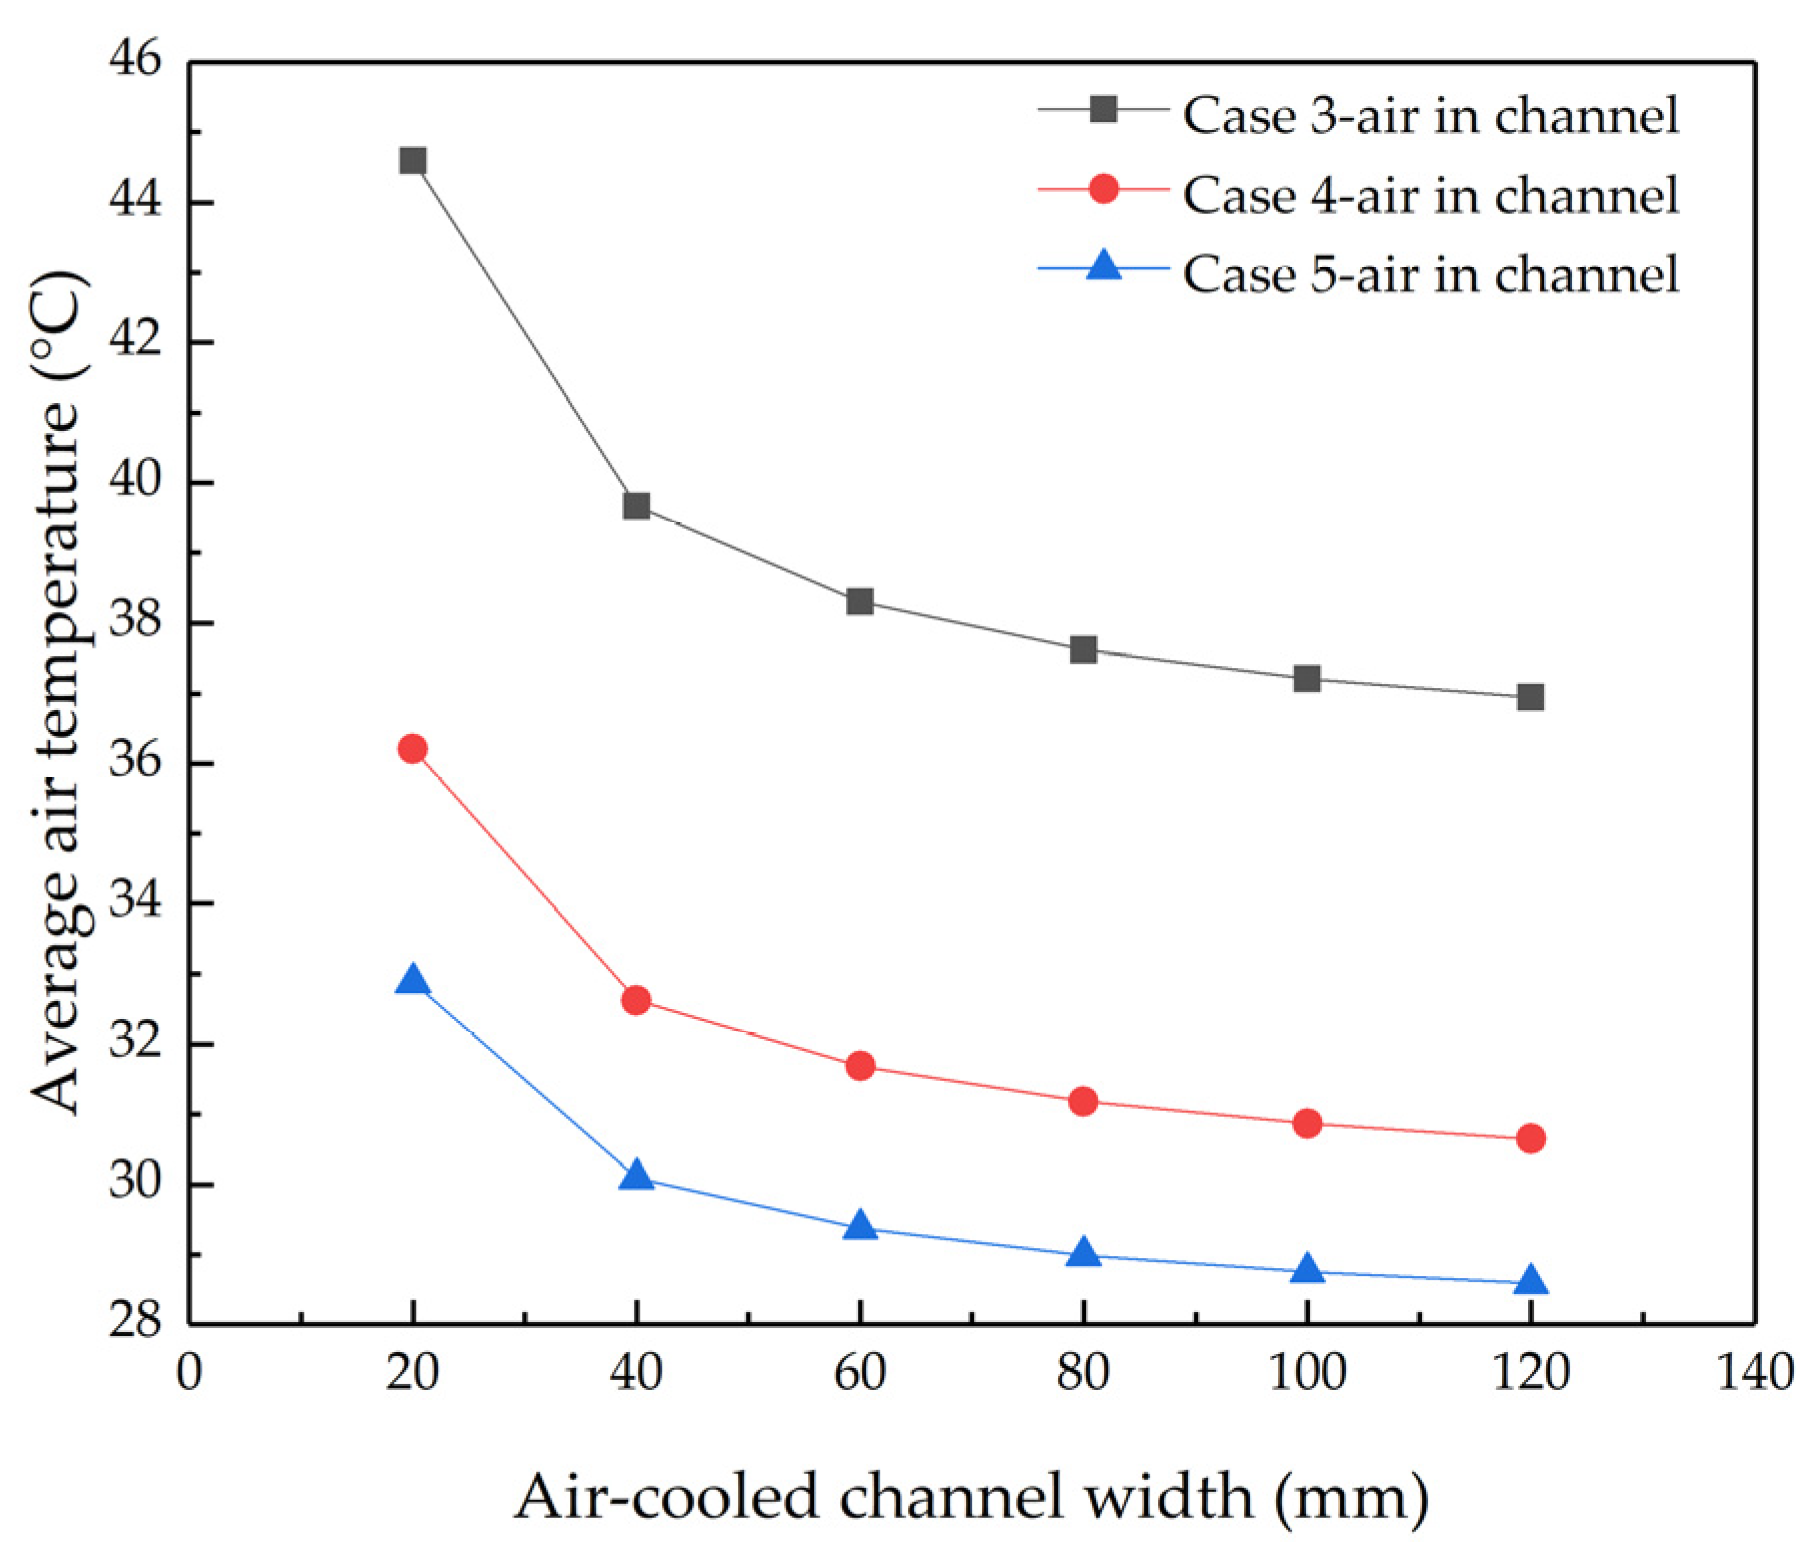
4.2.1. The Temperature Distribution of Air-Cooled Channels
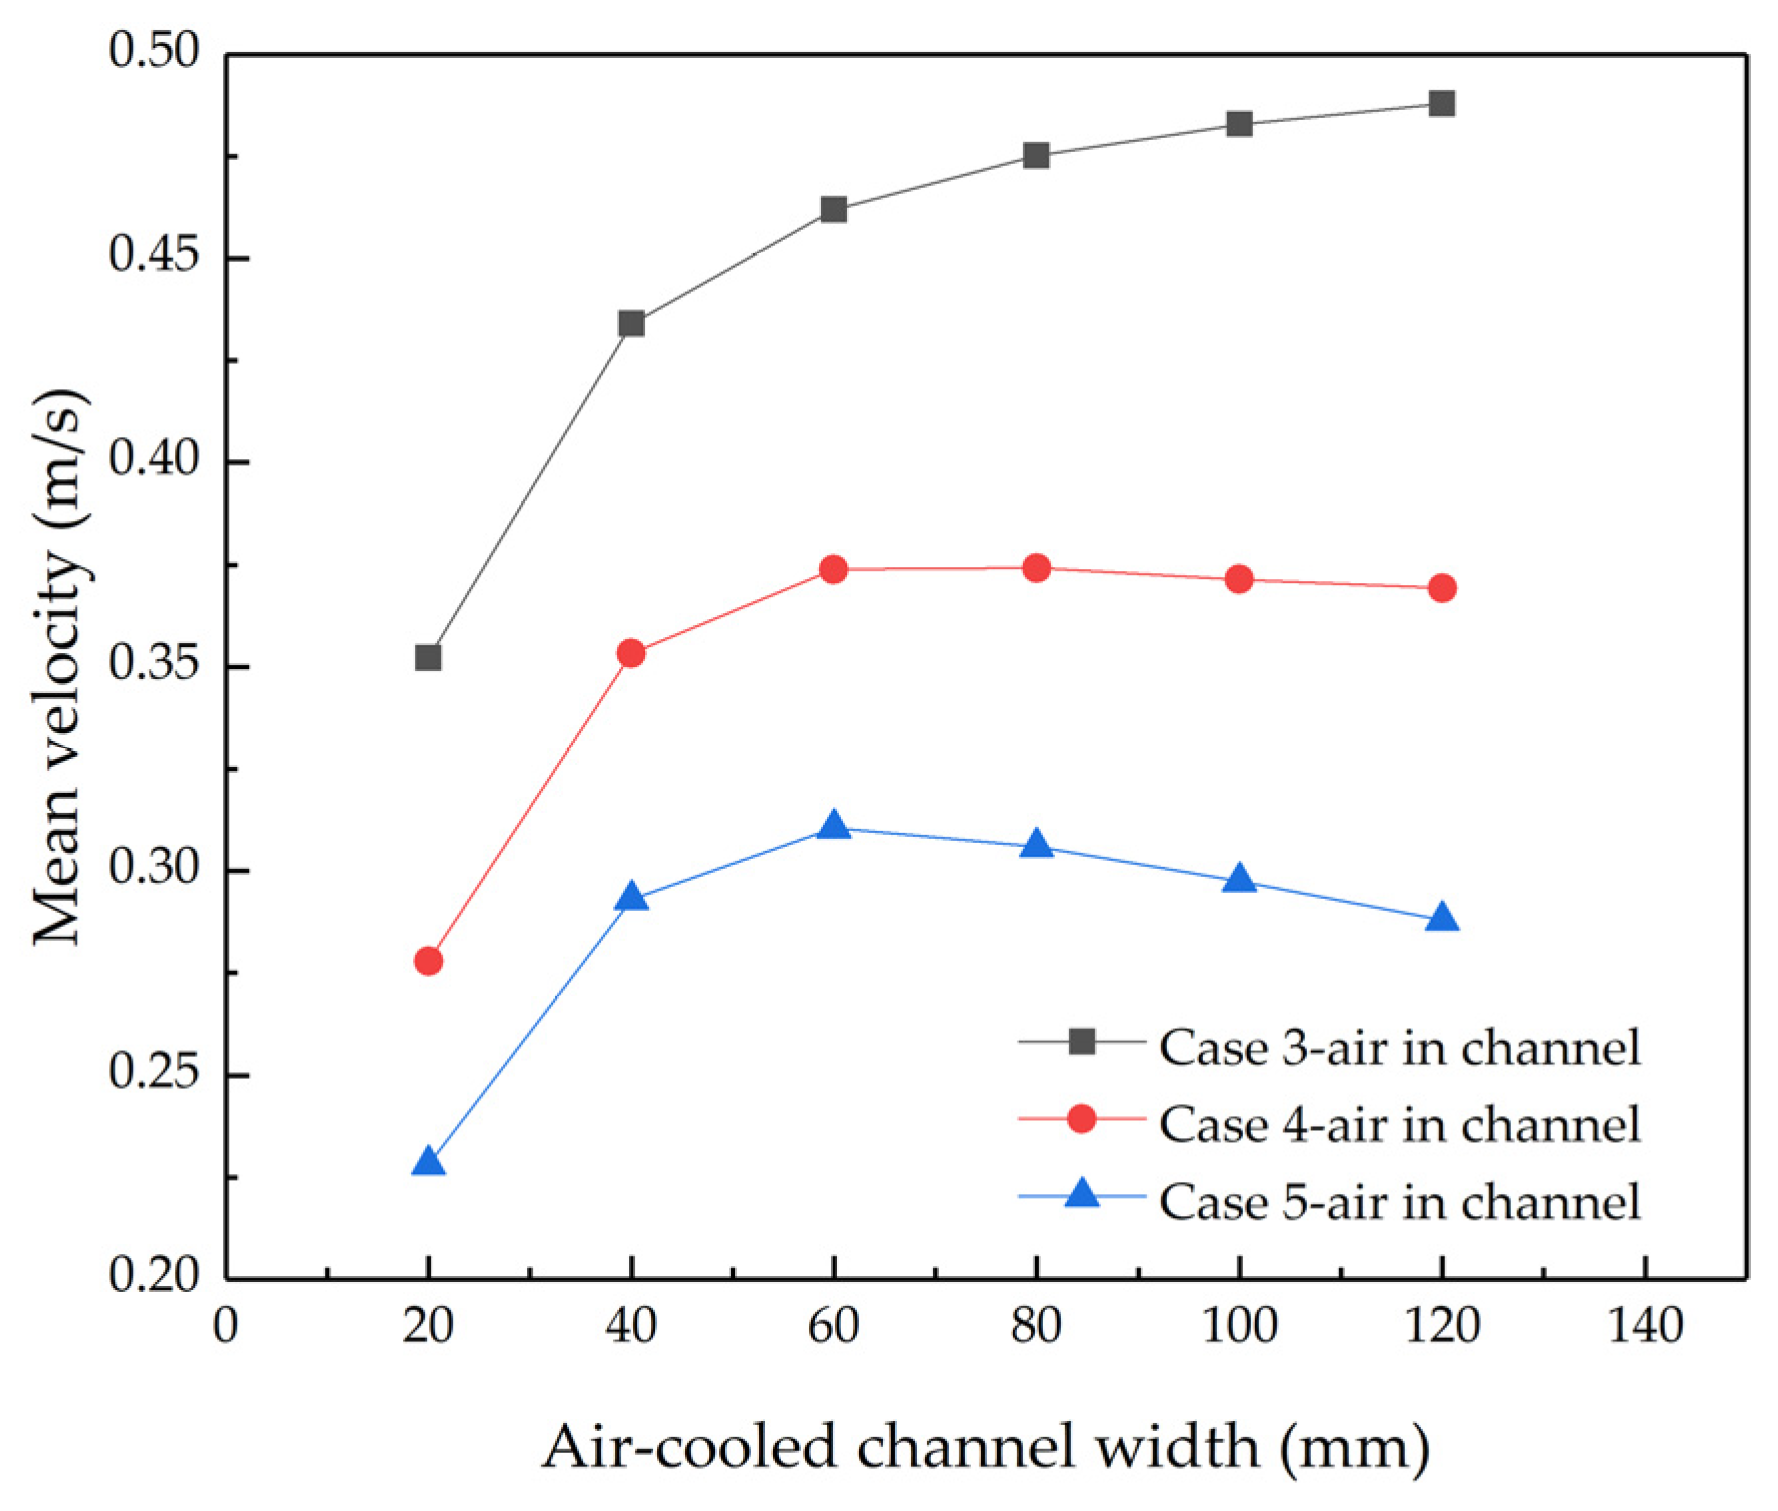
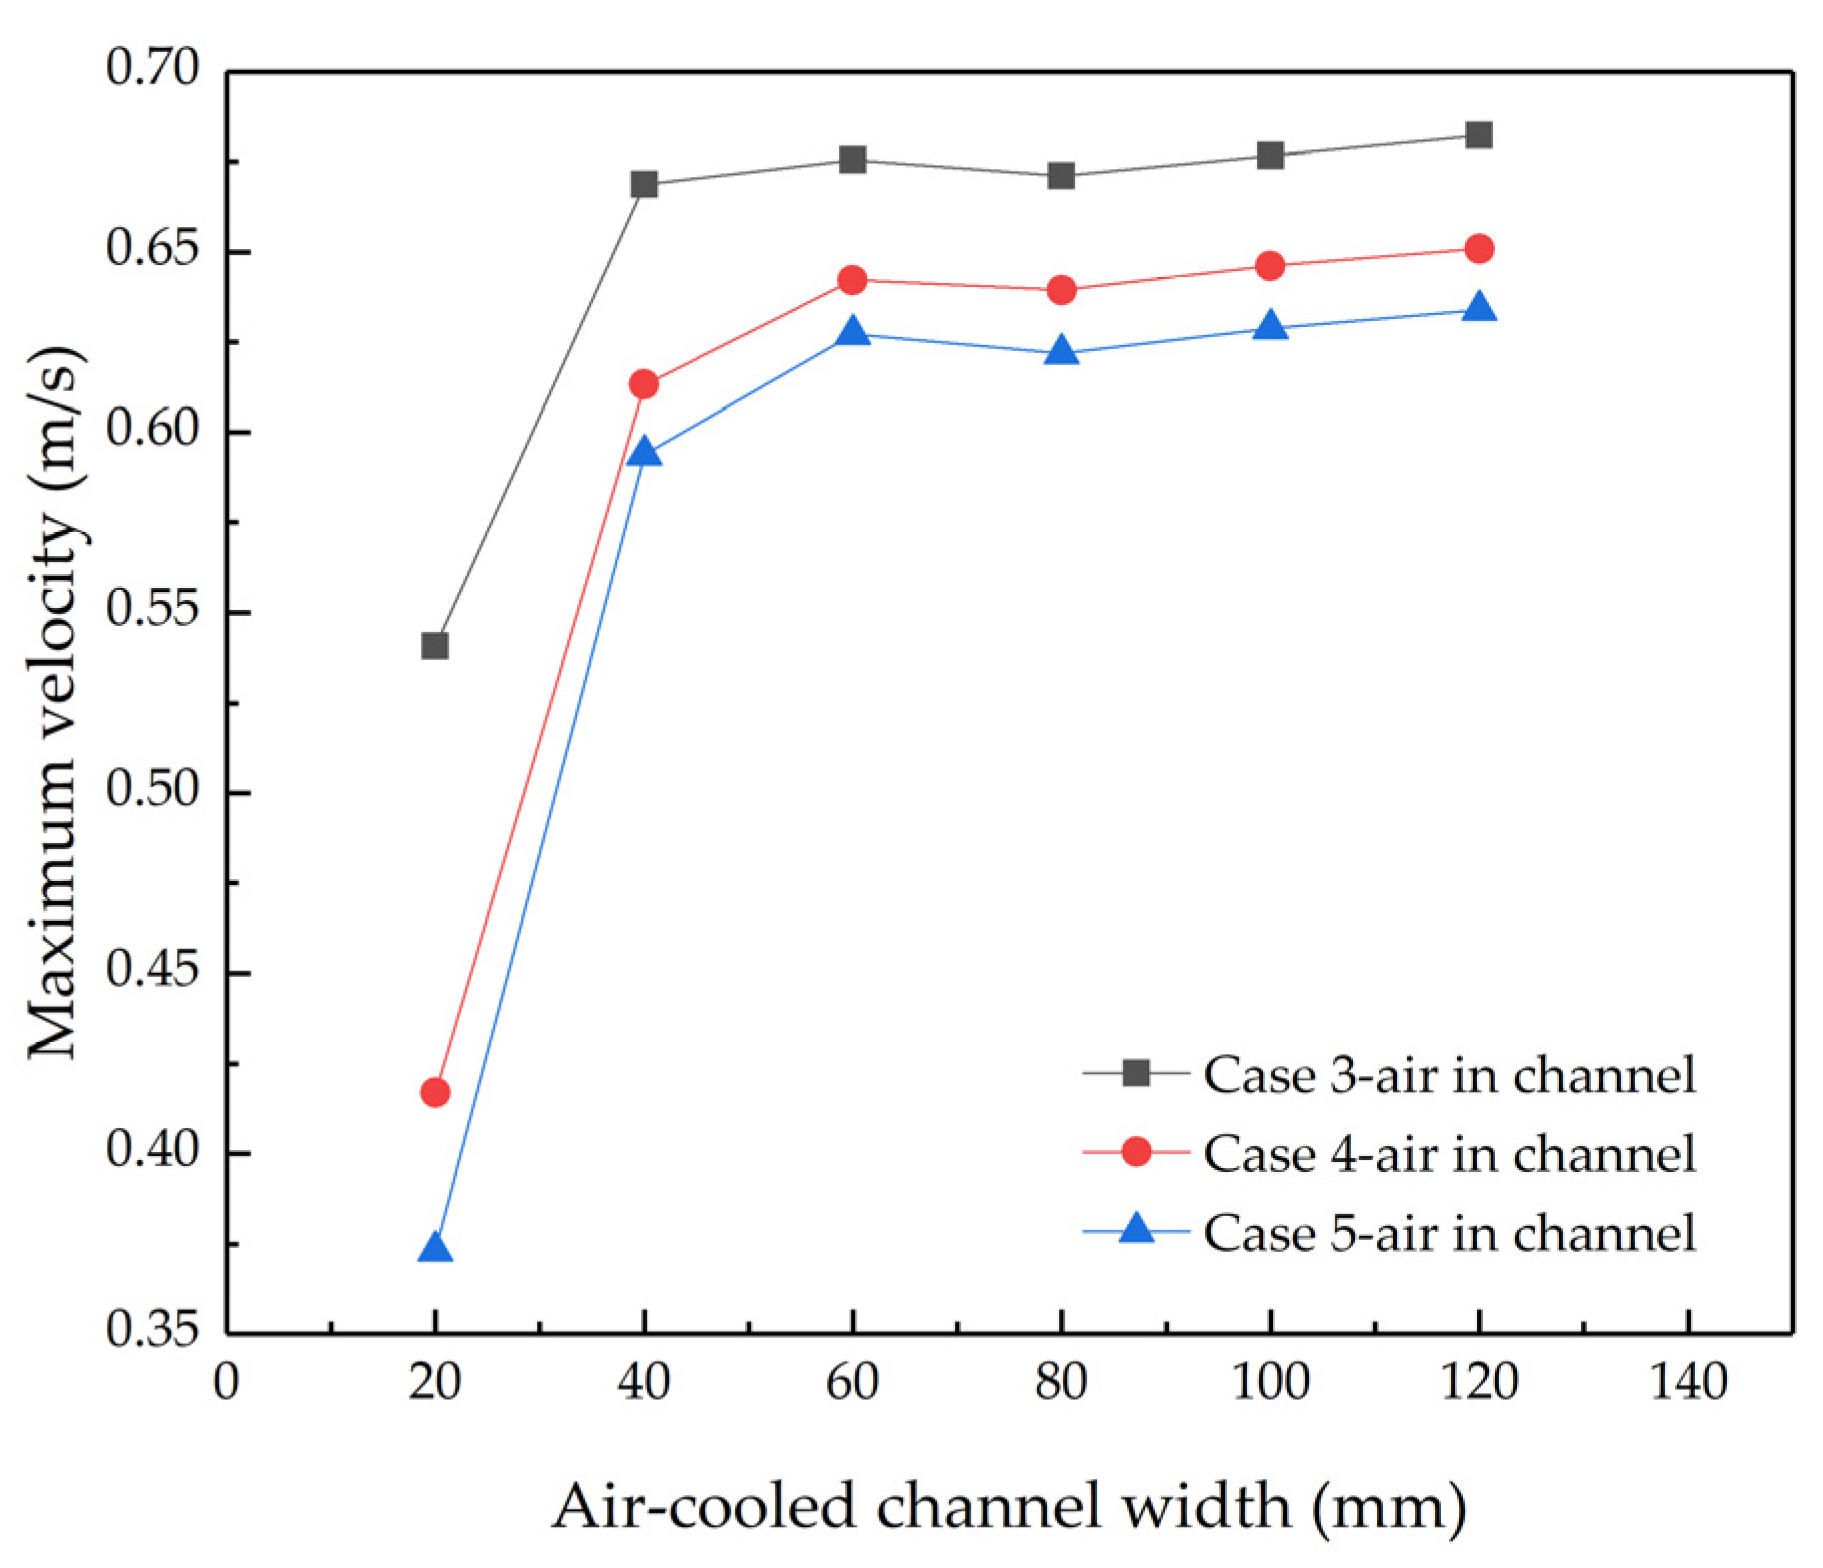
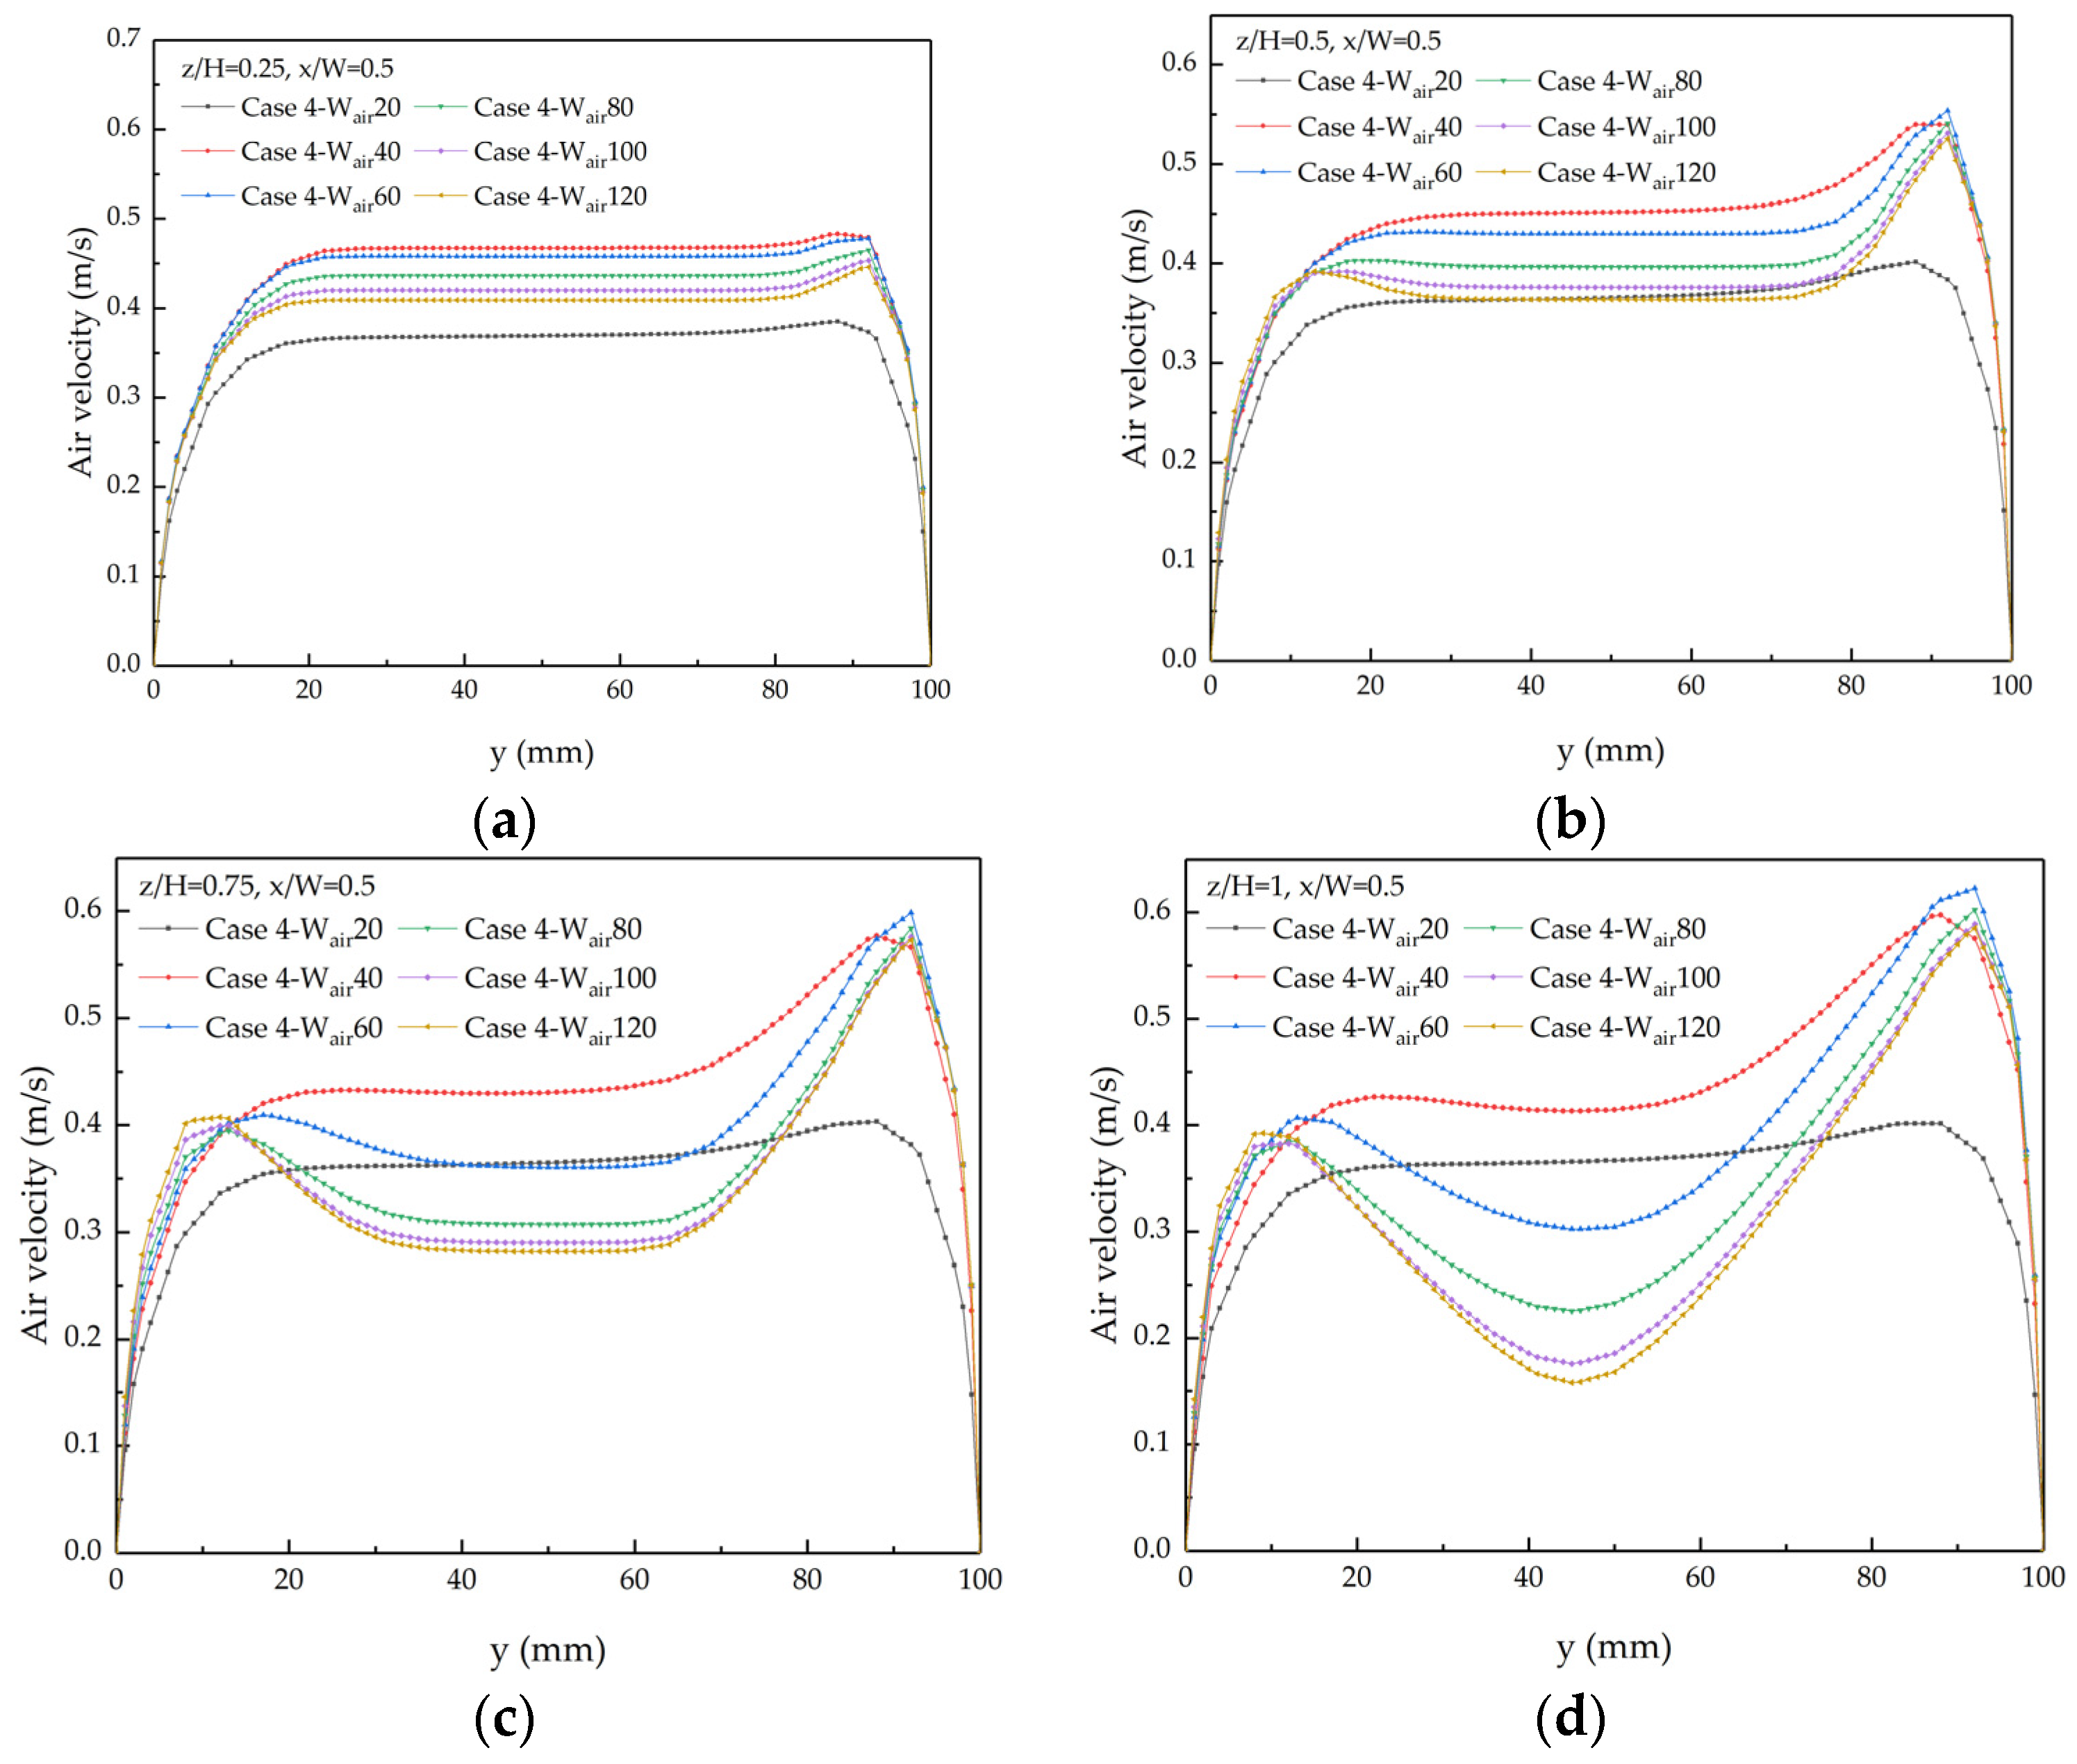
4.2.2. Velocity Distribution of Air-Cooled Channels
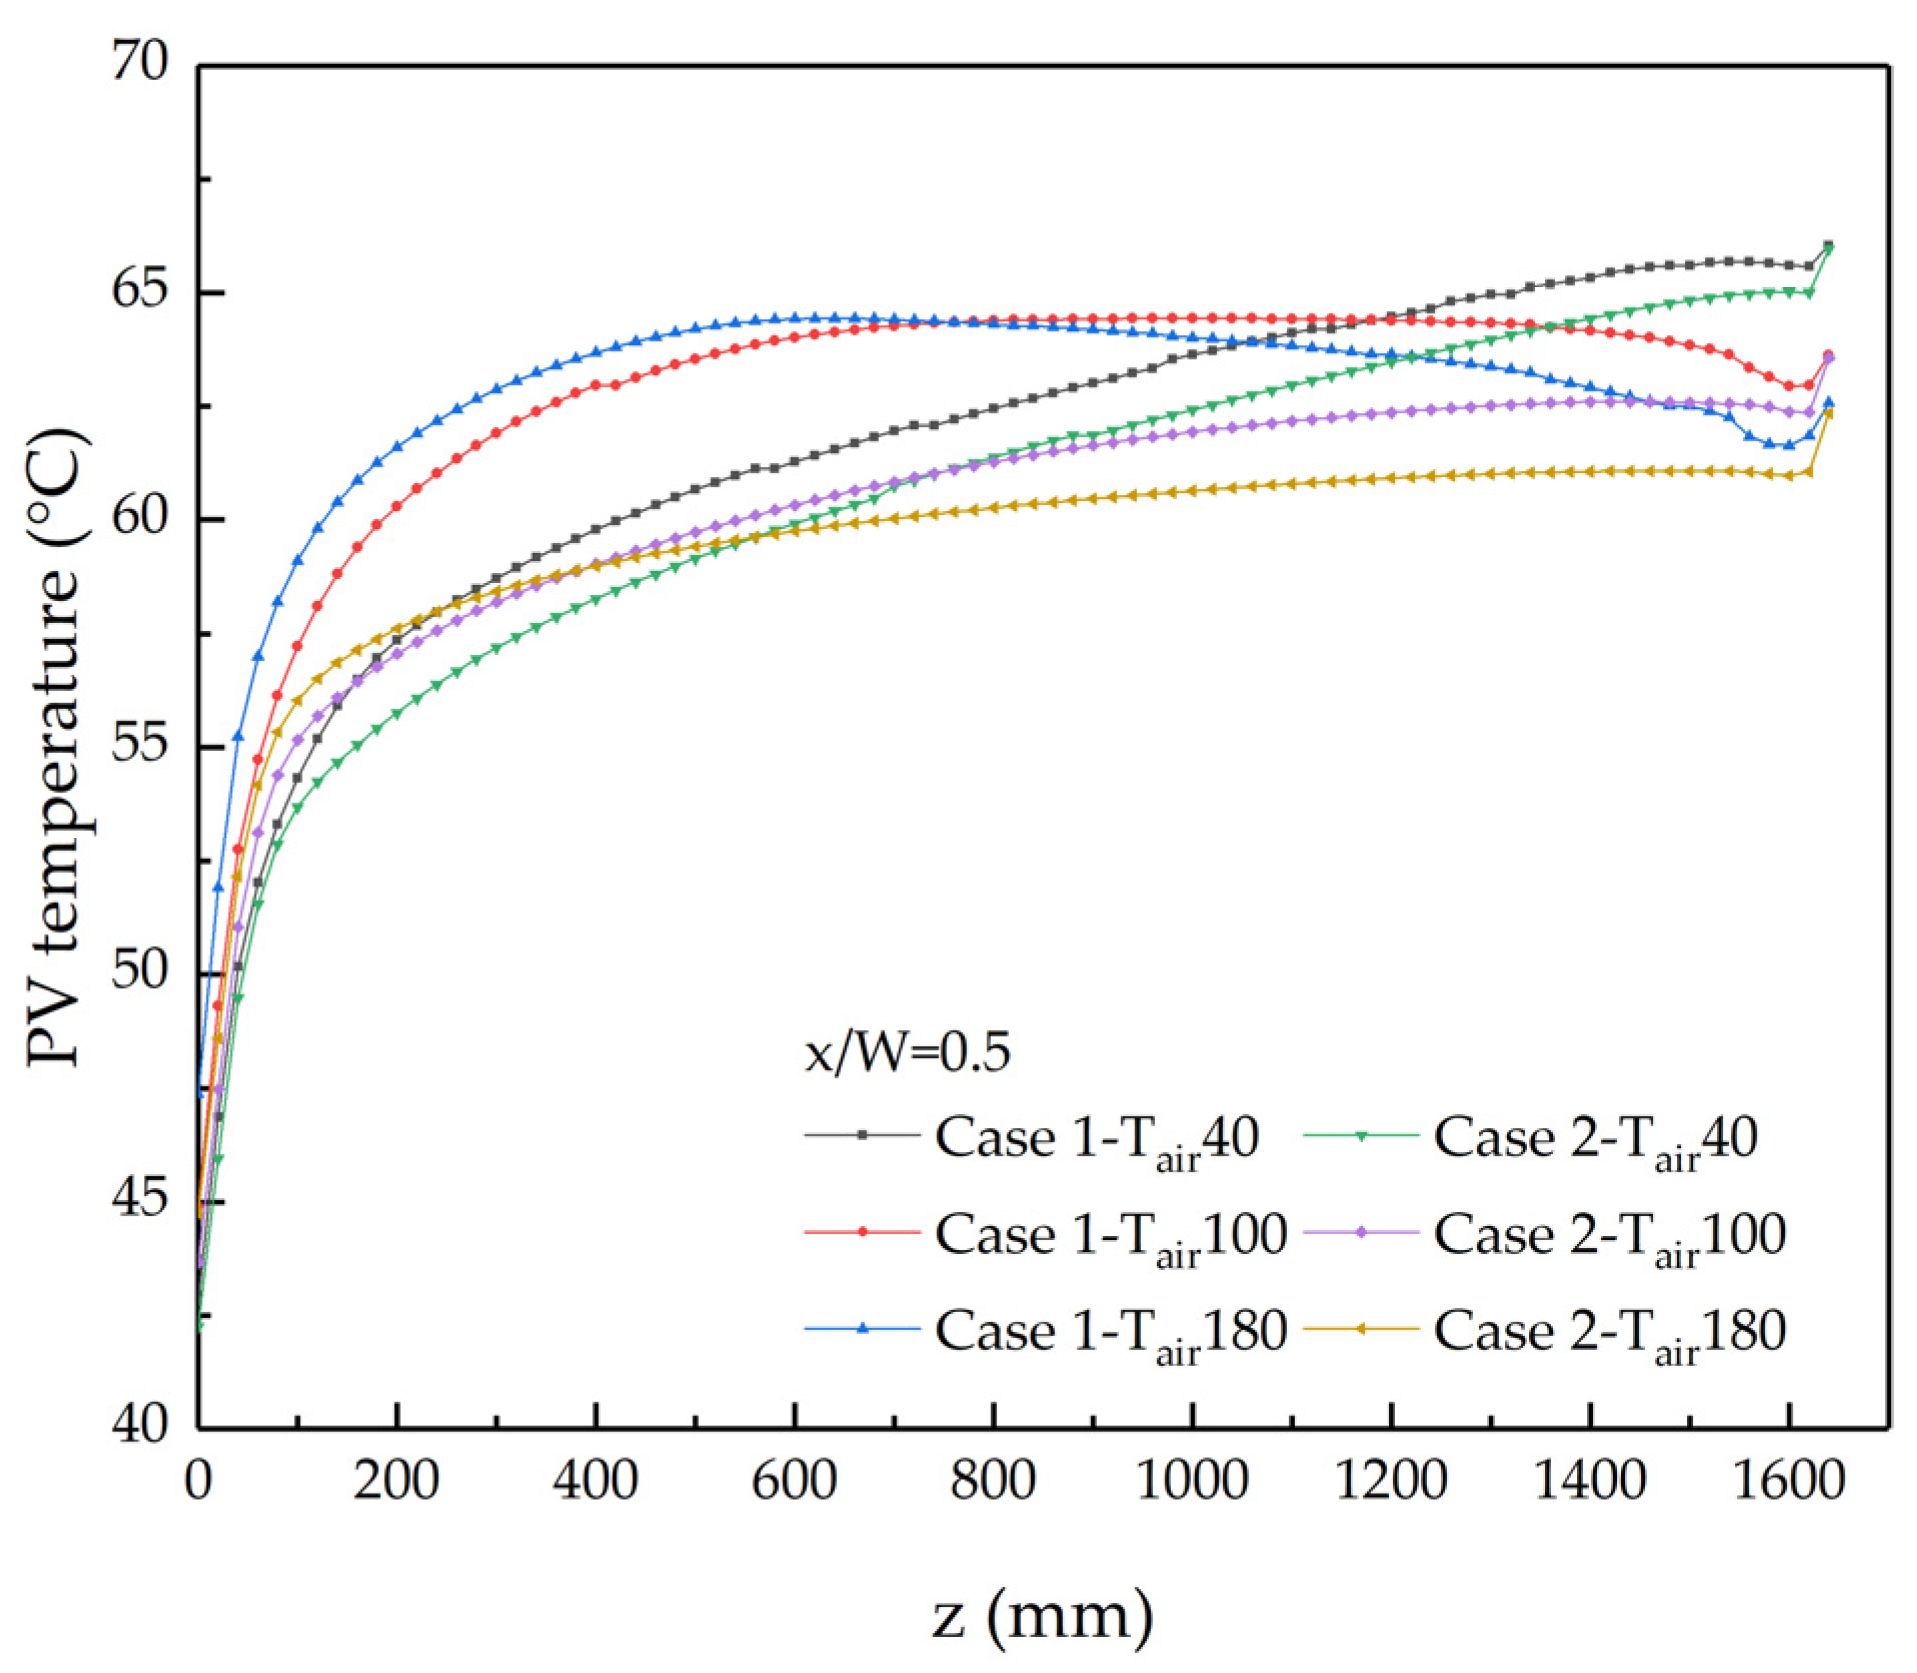
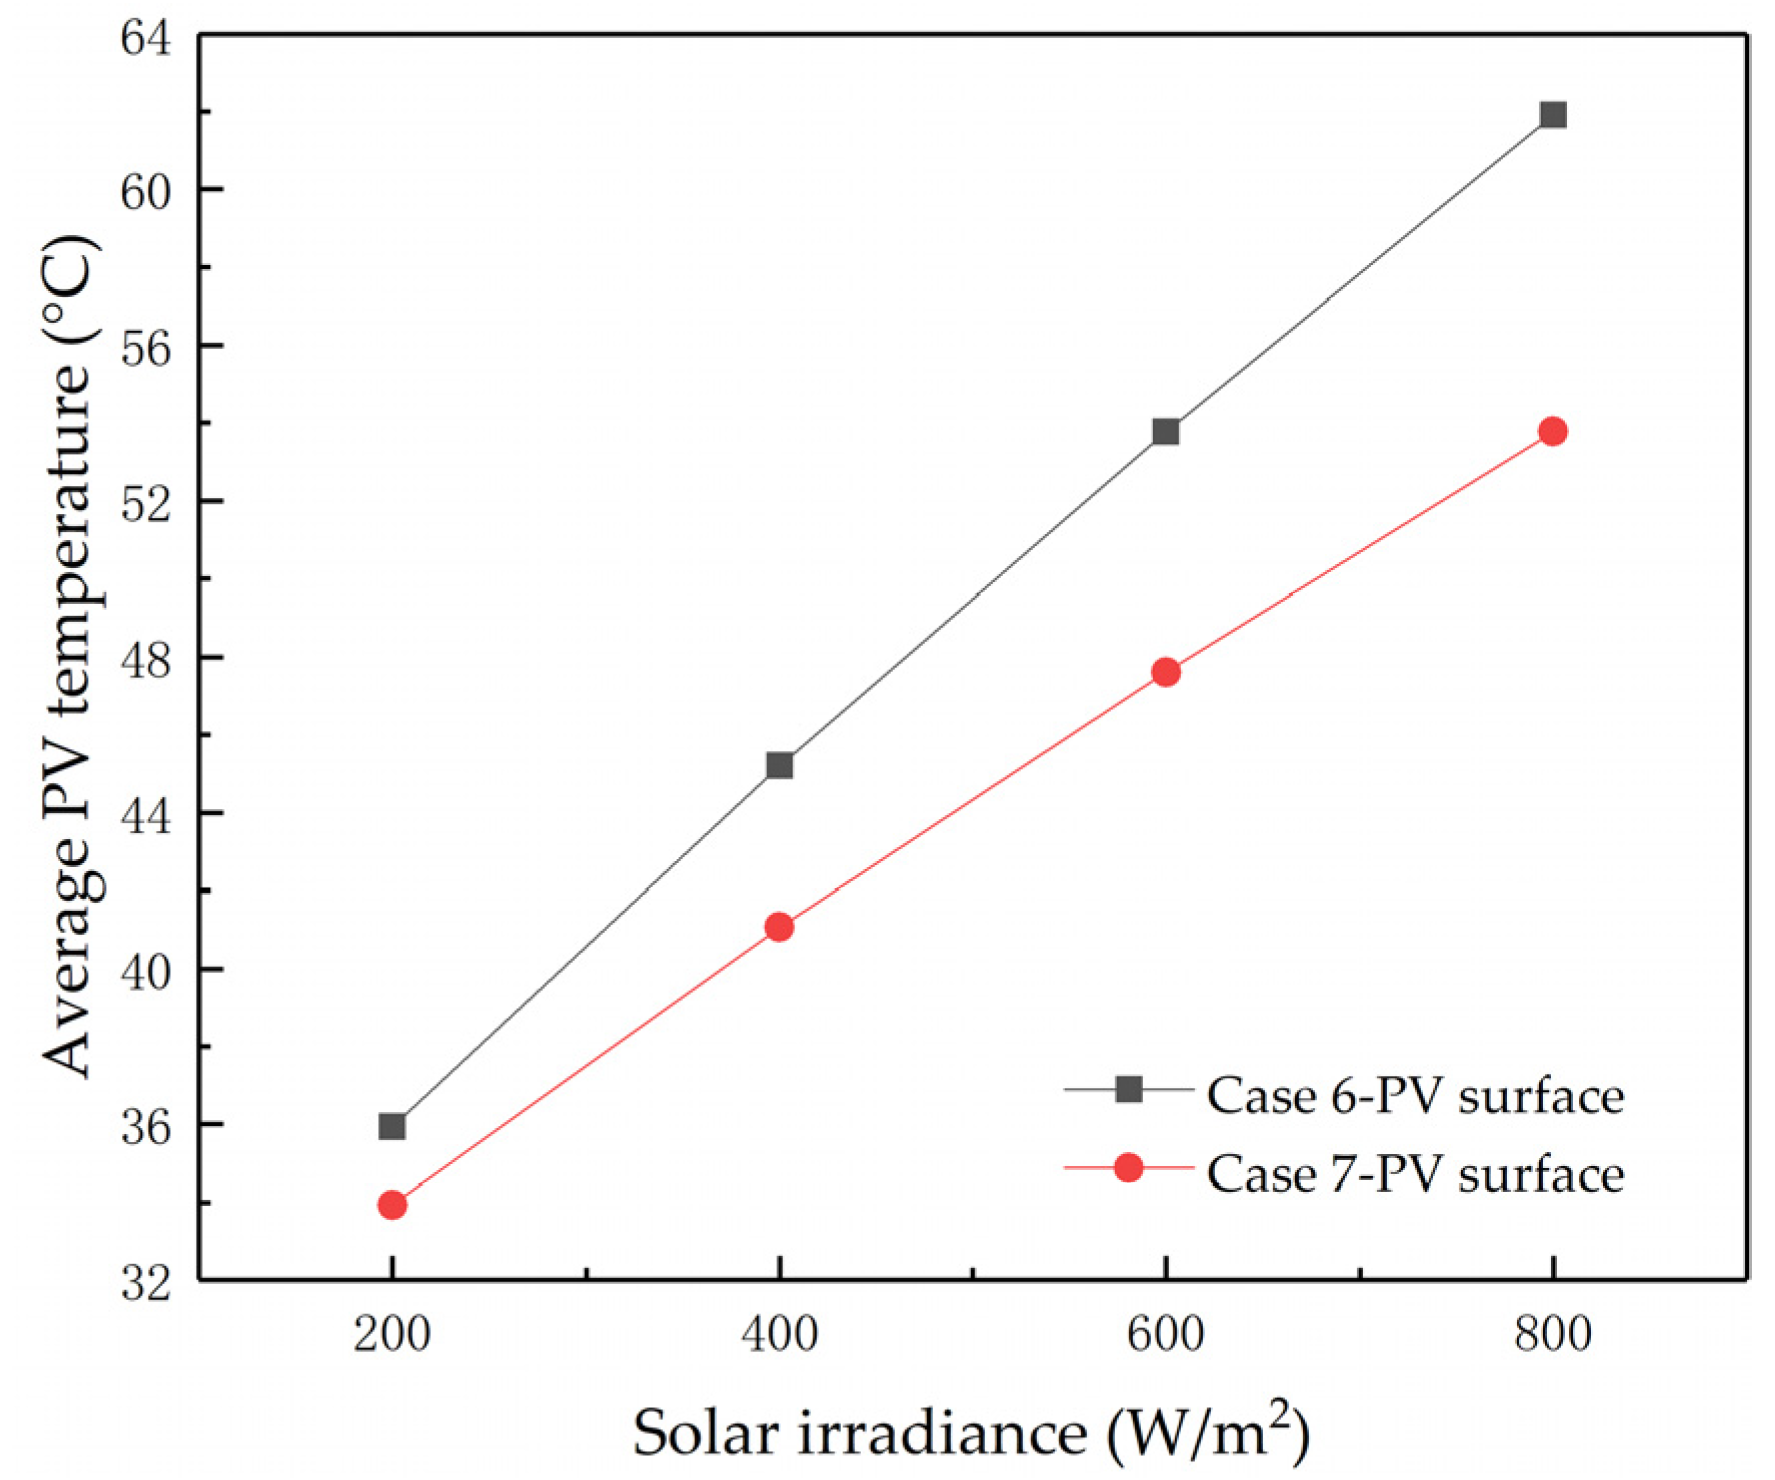
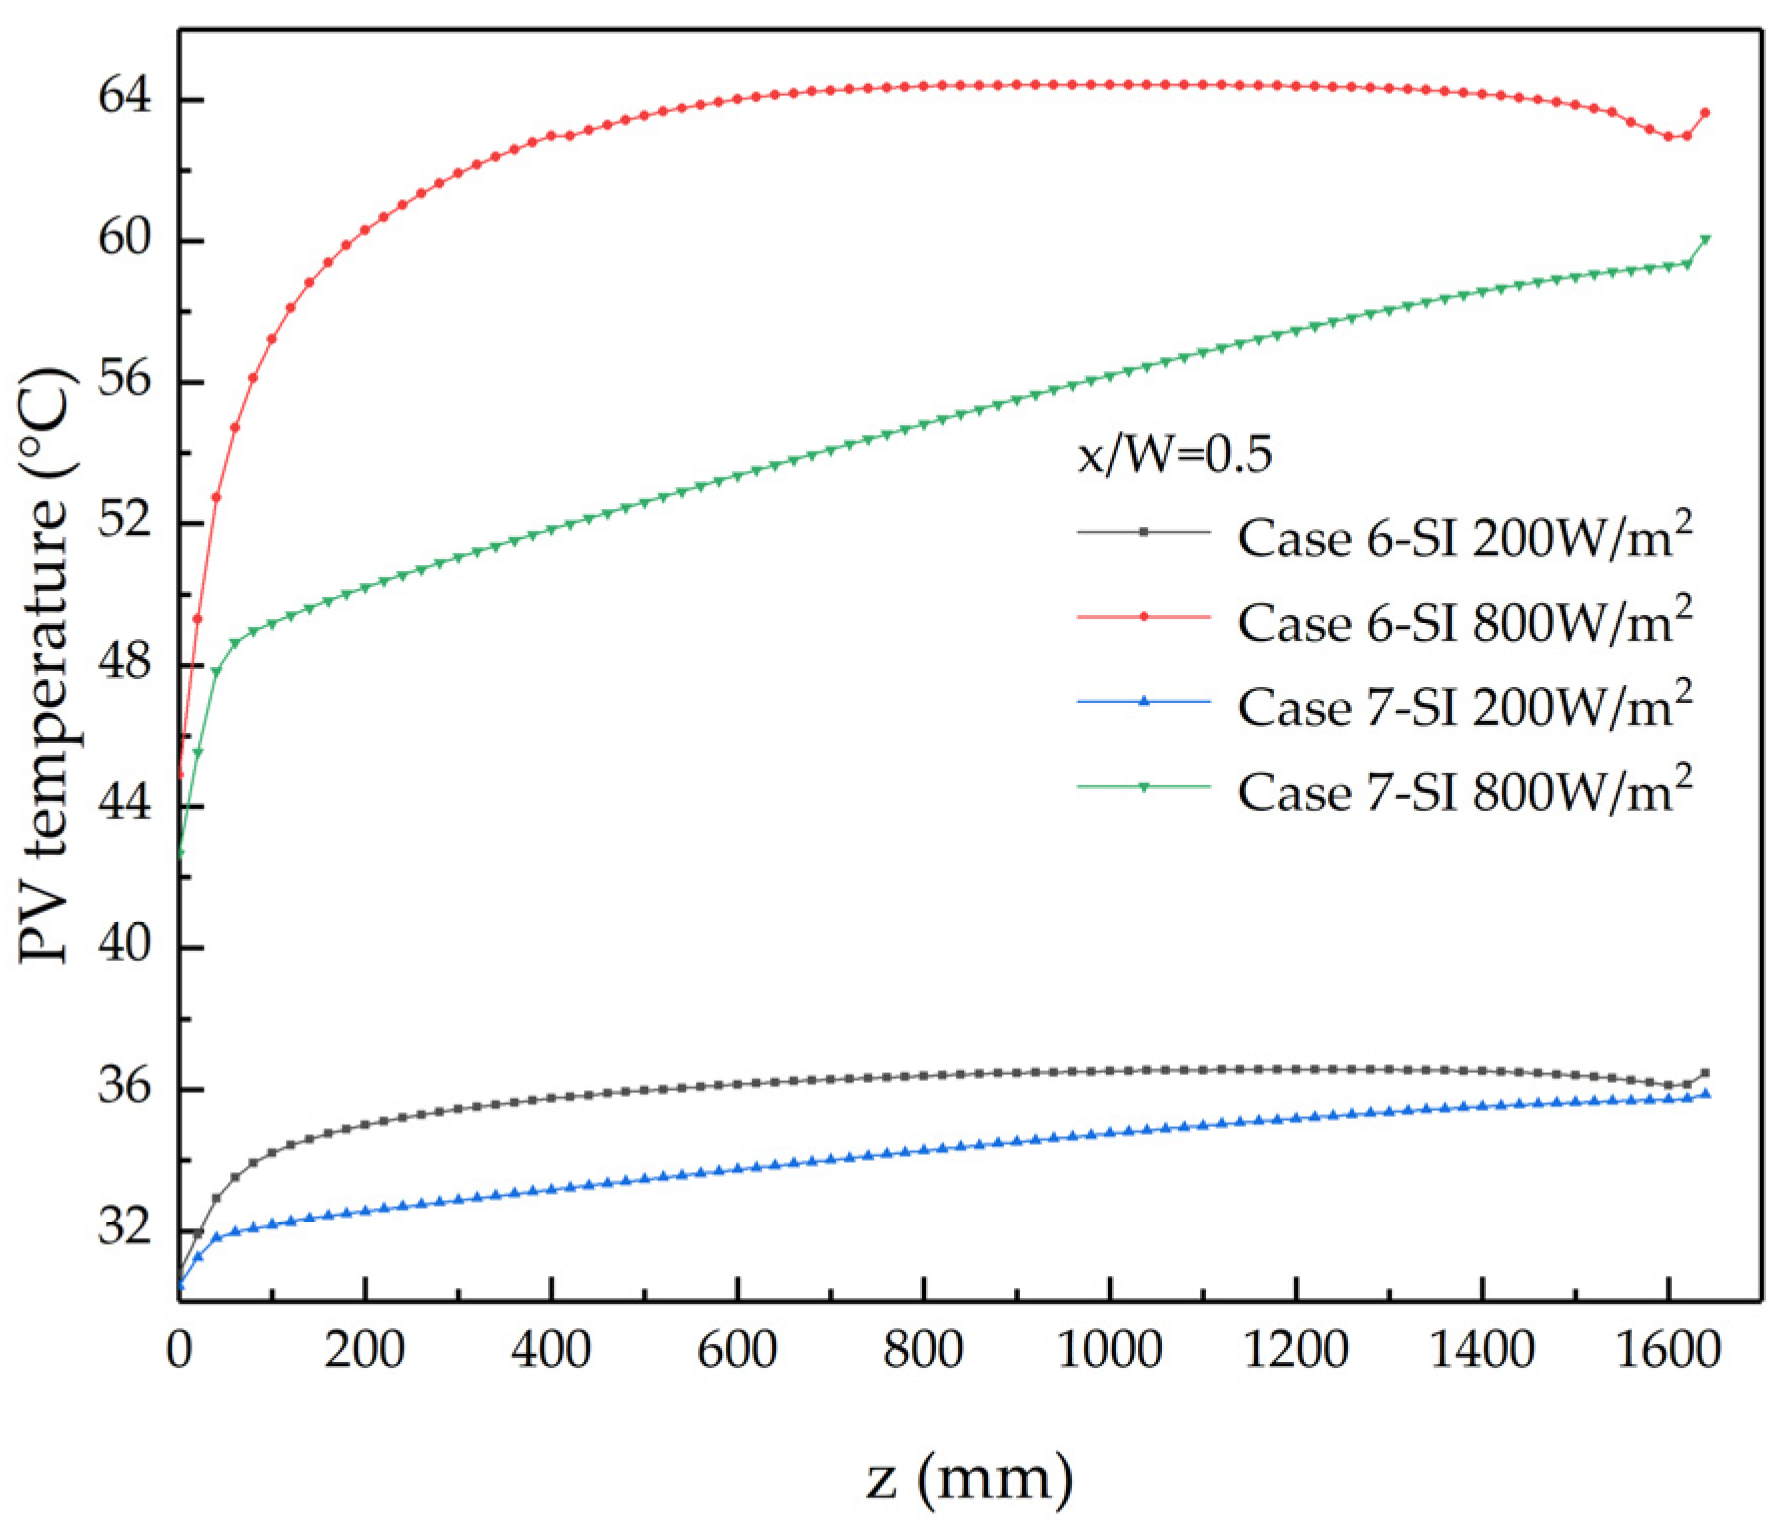
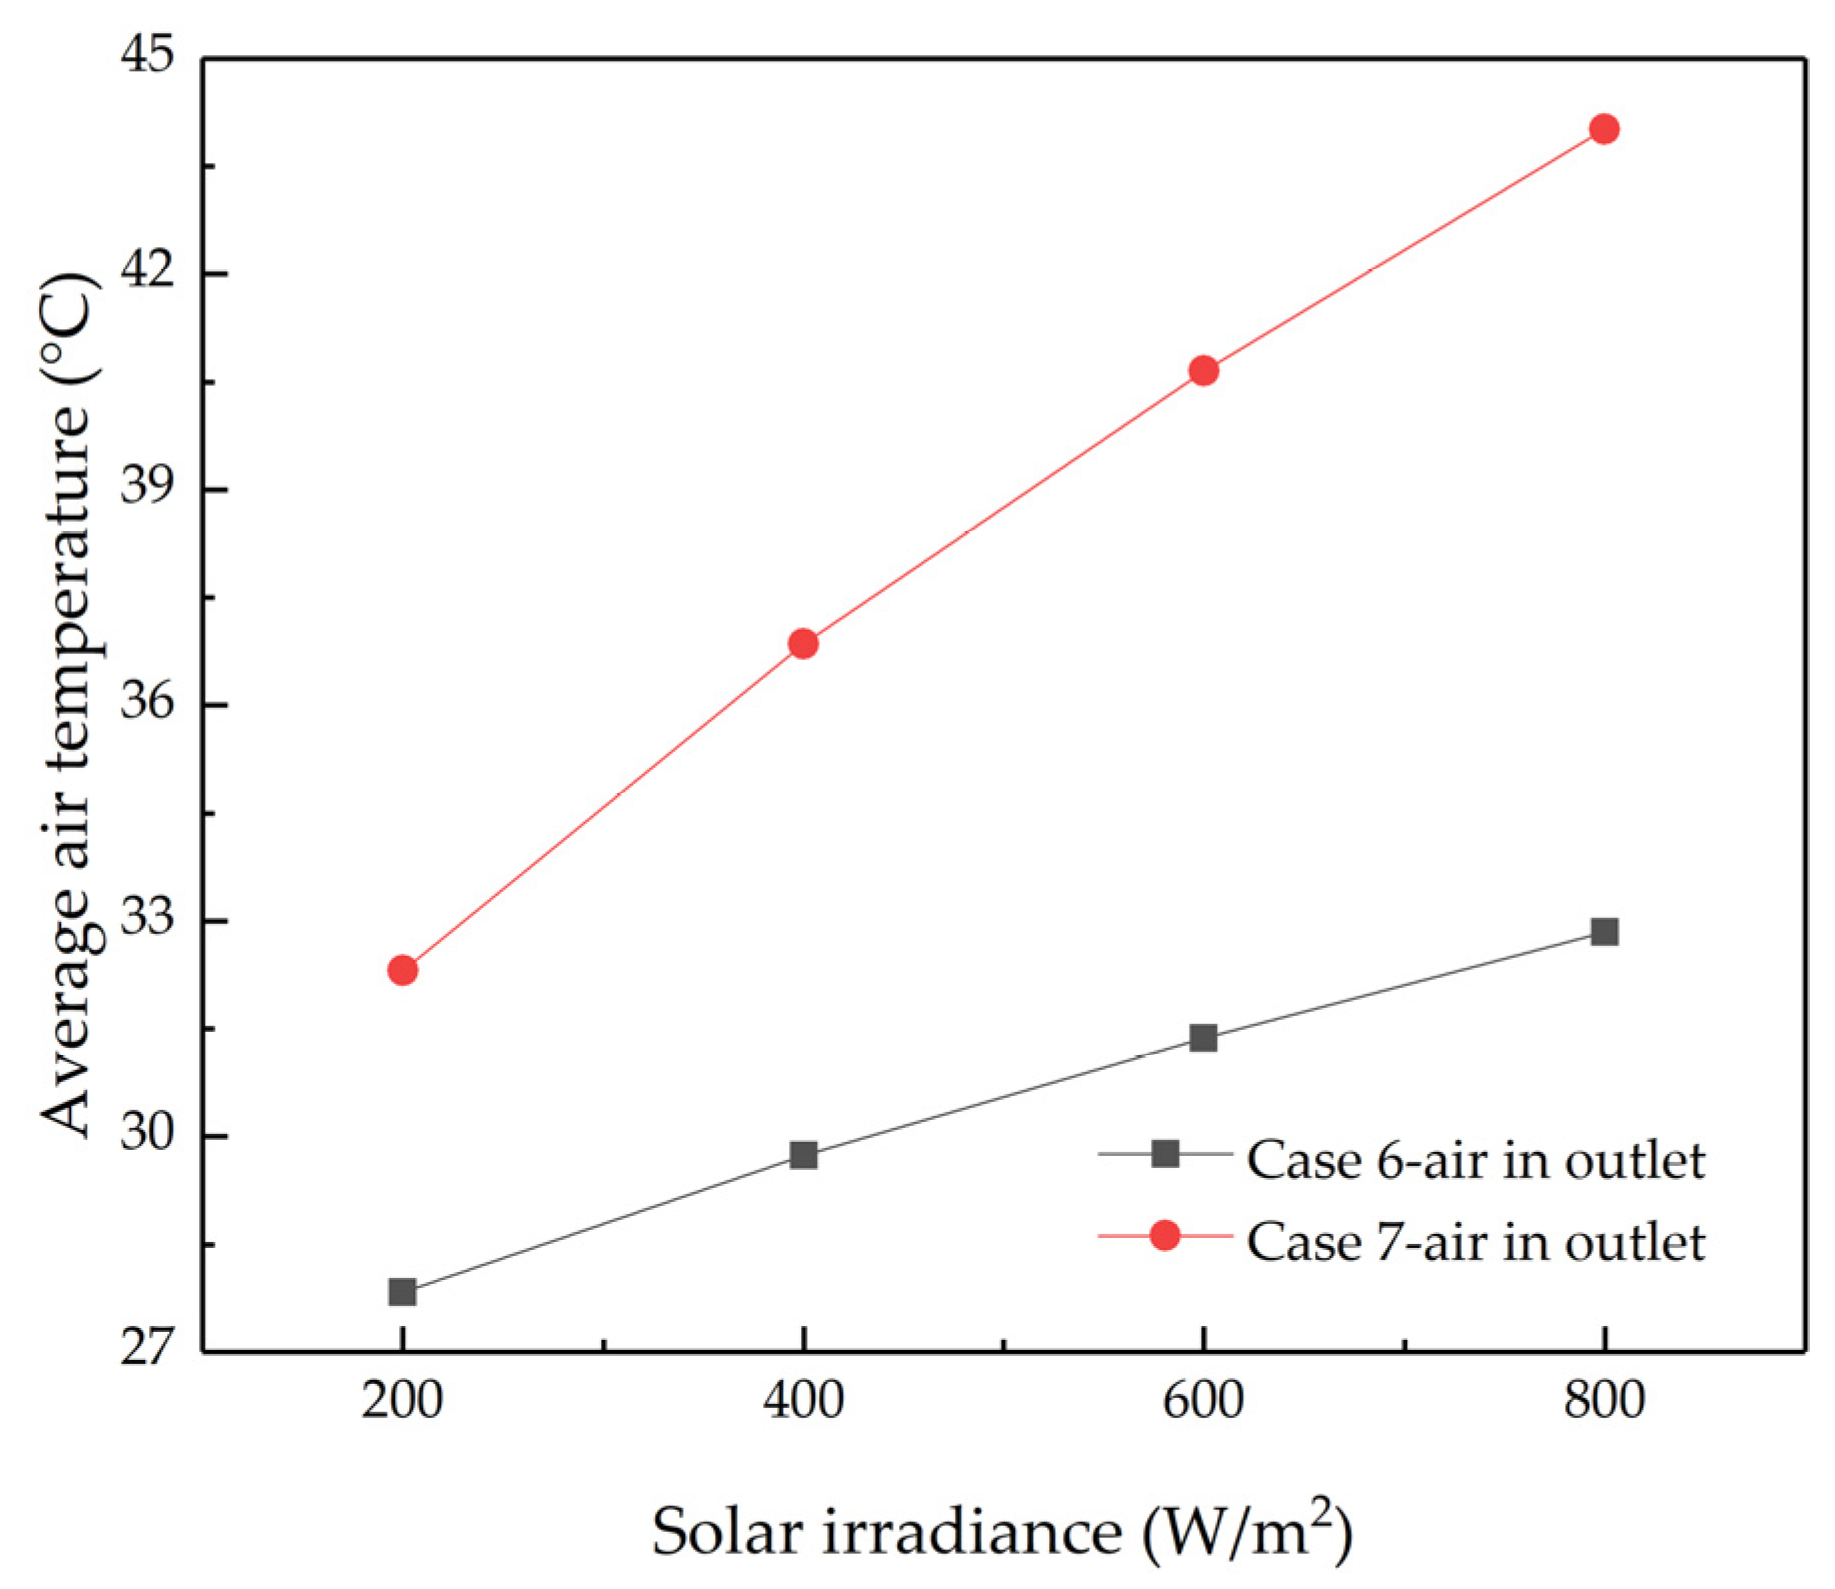
4.3. Study on Different Solar Irradiations
5. Conclusions
- (1)
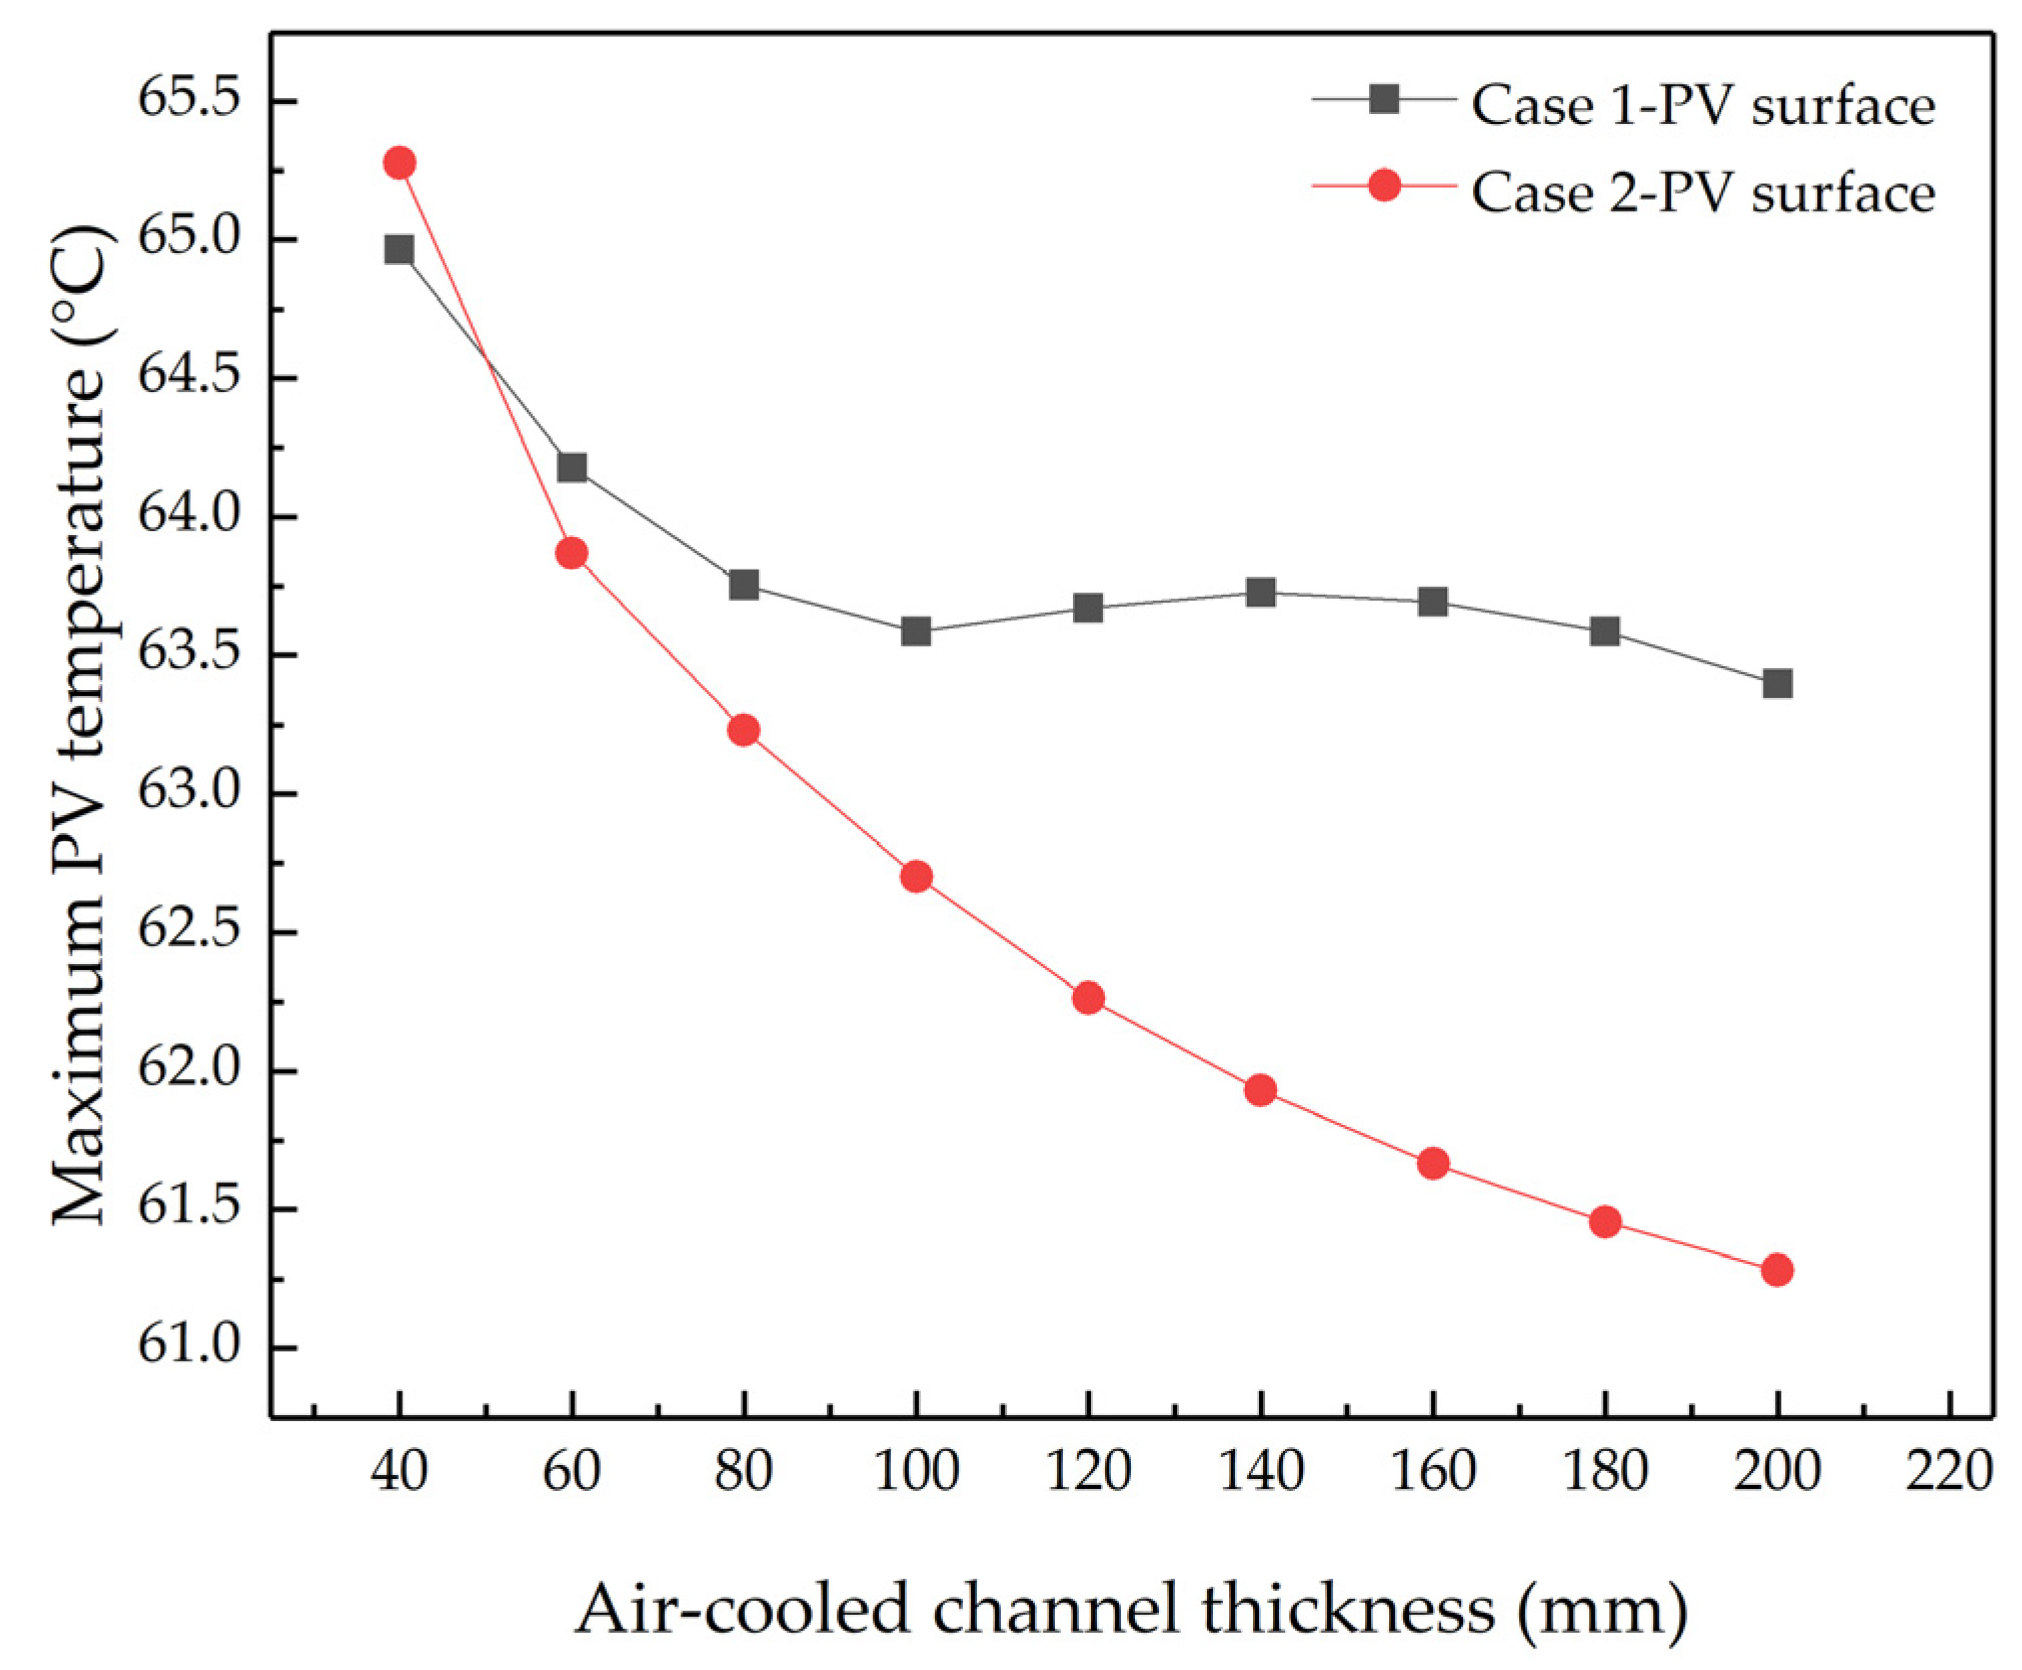
- Finned air-cooled channels provide enhanced cooling for PV panels. As the thickness of the finned air-cooled channel increases or the width decreases, the peak and average temperatures at the back of the PV panel decrease significantly. When the thickness of the finned air-cooled channel is 100 mm and the width is 20 mm, the maximum and average temperatures on the surface of the PV panels decrease by 3.9 °C and 8.1 °C, respectively, compared with the flat-plate air-cooled channel with a thickness of 100 mm;
- (2)
- Finned air-cooled channels have a better air heat collection effect. As the thickness of the finned air-cooled channel decreases or the width decreases, the air temperature at the outlet of the air-cooled channel increases significantly. When the thickness of the finned air-cooled channel is 100 mm and the width is 20 mm, the average temperature of the air at the outlet increases by 11.2 °C compared with that of the flat-plate air-cooled channel with a thickness of 100 mm;
- (3)
- In the flat-plate air-cooled channel, the airflow rate distribution shows that the flow rate is fast in the area near the hot wall and slow in the middle area of the air-cooled channel. The vertical installation of cooling fins will increase the airflow rate in the middle area of the air-cooled channel, and, as the width of the air-cooled channel becomes smaller, the airflow rate in the middle area will increase more obviously;
- (4)
- Finned air-cooled channels have better photovoltaic-plate-cooling and air heat collection capacities than flat-plate air-cooled channels. With the increase in the solar radiation intensity, this trend becomes more obvious.
Author Contributions
Funding
Data Availability Statement
Conflicts of Interest
References
- Maturi, L.; Lollini, R.; Moser, D.; Sparber, W. Experimental investigation of a low cost passive strategy to improve the performance of Building Integrated Photovoltaic systems. Sol. Energy 2015, 111, 288–296. [Google Scholar] [CrossRef]
- de Paulo, A.F.; Porto, G.S. Solar energy technologies and open innovation: A study based on bibliometric and social network analysis. Energy Policy 2017, 108, 228–238. [Google Scholar] [CrossRef]
- Skočilas, J.; Palaziuk, I. CFD Simulation of the Heat Transfer Process in a Chevron Plate Heat Exchanger Using the SST Turbulence Model. Acta Polytech. 2015, 55, 267. [Google Scholar] [CrossRef]
- Jäger-Waldau, A.; Kougias, I.; Taylor, N.; Thiel, C. How photovoltaics can contribute to GHG emission reductions of 55% in the EU by 2030. Renew. Sustain. Energy Rev. 2020, 126, 109836. [Google Scholar] [CrossRef]
- Gonçalves, J.E.; van Hooff, T.; Saelens, D. Understanding the behaviour of naturally-ventilated BIPV modules: A sensitivity analysis. Renew. Energy 2020, 161, 133–148. [Google Scholar] [CrossRef]
- Shahsavar, A.; Entezari, S.; Askari, I.B.; Ali, H.M. The effect of using connecting holes on heat transfer and entropy generation behaviors in a micro channels heat sink cooled with biological silver/water nanofluid. Int. Commun. Heat Mass Transf. 2021, 123, 104929. [Google Scholar] [CrossRef]
- Mojumder, J.C.; Chong, W.T.; Ong, H.C.; Leong, K.; Mamoon, A.A. An experimental investigation on performance analysis of air type photovoltaic thermal collector system integrated with cooling fins design. Energy Build. 2016, 130, 272–285. [Google Scholar] [CrossRef]
- Stodolny, M.K.; Janssen, G.J.; Van Aken, B.B.; Tool, K.C.; Lamers, M.W.; Romijn, I.G.; Venema, P.R.; Renes, M.R.; Siarheyeva, O.; Granneman, E.H.; et al. PID-and UVID-free n-type Solar Cells and Modules. Energy Procedia 2016, 92, 609–616. [Google Scholar] [CrossRef]
- Liu, Z.; Zhang, L.; Gong, G.; Li, H.; Tang, G. Review of solar thermoelectric cooling technologies for use in zero energy buildings. Energy Build. 2015, 102, 207–216. [Google Scholar] [CrossRef]
- Dash, P.; Gupta, N.; Rawat, R.; Pant, P. A novel climate classification criterion based on the performance of solar photovoltaic technologies. Sol. Energy 2017, 144, 392–398. [Google Scholar] [CrossRef]
- Yang, T.; Braun, P.V.; Miljkovic, N.; King, W.P. Phase Change Material Heat Sink for Transient Cooling of High-Power Devices. Int. J. Heat Mass Transf. 2021, 170, 121033. [Google Scholar] [CrossRef]
- Elghamry, R.; Hassan, H.; Hawwash, A. A parametric study on the impact of integrating solar cell panel at building envelope on its power, energy consumption, comfort conditions, and CO2 emissions. J. Clean. Prod. 2020, 249, 119374. [Google Scholar] [CrossRef]
- Peng, J.; Lu, L.; Yang, H.; Han, J. Investigation on the annual thermal performance of a photovoltaic wall mounted on a multi-layer façade. Appl. Energy 2013, 112, 646–656. [Google Scholar] [CrossRef]
- Bahaidarah, H.M.; Baloch, A.A.; Gandhidasan, P. Uniform cooling of photovoltaic panels: A review. Renew. Sustain. Energy Rev. 2016, 57, 1520–1544. [Google Scholar] [CrossRef]
- Hu, A.; Levis, S.; Meehl, G.A.; Han, W.; Washington, W.M.; Oleson, K.W.; van Ruijven, B.J.; He, M.; Strand, W.G. Strand. Impact of solar panels on global climate. Nat. Clim. Chang. 2016, 6, 290–294. [Google Scholar] [CrossRef]
- Hosenuzzaman, M.; Rahim, N.A.; Selvaraj, J.; Hasanuzzaman, M.; Malek, A.B.M.A.; Nahar, A. Global prospects, progress, policies, and environmental impact of solar photovoltaic power generation. Renew. Sustain. Energy Rev. 2015, 41, 284–297. [Google Scholar] [CrossRef]
- Siecker, J.; Kusakana, K.; Numbi, B. A review of solar photovoltaic systems cooling technologies. Renew. Sustain. Energy Rev. 2017, 79, 192–203. [Google Scholar] [CrossRef]
- Nižetić, S.; Jurčević, M.; Čoko, D.; Arıcı, M. A novel and effective passive cooling strategy for photovoltaic panel. Renew. Sustain. Energy Rev. 2021, 145, 111164. [Google Scholar] [CrossRef]
- Mirzaei, P.A.; Paterna, E.; Carmeliet, J. Investigation of the role of cavity airflow on the performance of building-integrated photovoltaic panels. Sol. Energy 2014, 107, 510–522. [Google Scholar] [CrossRef]
- Saadon, S.; Gaillard, L.; Giroux-Julien, S.; Ménézo, C. Simulation study of a naturally-ventilated building integrated photovoltaic/thermal (BIPV/T) envelope. Renew. Energy 2016, 87, 517–531. [Google Scholar] [CrossRef]
- Verma, S.; Mohapatra, S.; Chowdhury, S.; Dwivedi, G. Cooling techniques of the PV module: A review. Mater. Today Proc. 2021, 38, 253–258. [Google Scholar] [CrossRef]
- Agathokleous, R.A.; Kalogirou, S.A. Double skin facades (DSF) and building integrated photovoltaics (BIPV): A review of configurations and heat transfer characteristics. Renew. Energy 2016, 89, 743–756. [Google Scholar] [CrossRef]
- Amanlou, Y.; Hashjin, T.T.; Ghobadian, B.; Najafi, E.G. Air cooling low concentrated photovoltaic/thermal (LCPV/T) solar collector to approach uniform temperature distribution on the PV plate. Appl. Therm. Eng. 2018, 141, 413–421. [Google Scholar] [CrossRef]
- Özcan, Z.; Gülgün, M.; Şen, E.; Çam, N.Y.; Bilir, L. Cooling channel effect on photovoltaic panel energy generation. Sol. Energy 2021, 230, 943–953. [Google Scholar] [CrossRef]
- Ma, T.; Kazemian, A.; Habibollahzade, A.; Salari, A.; Gu, W.; Peng, J. A comparative study on bifacial photovoltaic/thermal modules with various cooling methods. Energy Convers. Manag. 2022, 263, 115555. [Google Scholar] [CrossRef]
- Mankani, K.; Chaudhry, H.N.; Calautit, J.K. Optimization of an air-cooled heat sink for cooling of a solar photovoltaic panel: A computational study. Energy Build. 2022, 270, 112274. [Google Scholar] [CrossRef]
- Agrawal, Y.; Mishra, A.; Gautam, A.; Phaldessai, G.; Yadav, A.S.; Vyas, M. Performance analysis of photovoltaic thermal air collector having rectangular fins. Mater. Today Proc. 2023, 84, 6–15. [Google Scholar] [CrossRef]
- Zhao, Z.; Zhu, L.; Wang, Y.; Huang, Q.; Sun, Y. Experimental investigation of the performance of an air type photovoltaic thermal collector system with fixed cooling fins. Energy Rep. 2023, 9 (Suppl. S4), 93–100. [Google Scholar] [CrossRef]
- Ekoe, A.; Akata, A.M.; Njomo, D.; Agrawal, B. Thermal Energy Optimization of Building Integrated Semi-Transparent Photovoltaic Thermal Systems. Int. J. Renew. Energy Dev. 2015, 4, 113–123. [Google Scholar] [CrossRef]
- Grubišić-Čabo, F.; Nižetić, S.; Čoko, D.; Kragić, I.M.; Papadopoulos, A. Experimental investigation of the passive cooled free-standing photovoltaic panel with fixed aluminum fins on the backside surface. J. Clean. Prod. 2018, 176, 119–129. [Google Scholar] [CrossRef]
- Lau, S.-K.; Zhao, Y.; Shabunko, V.; Chao, Y.; Lau, S.S.-Y.; Tablada, A.; Reindl, T. Optimization and Evaluation of Naturally Ventilated BIPV Façade Design. Energy Procedia 2018, 150, 87–93. [Google Scholar] [CrossRef]
- Agathokleous, R.A.; Kalogirou, S.A. Part I: Thermal analysis of naturally ventilated BIPV system: Experimental investigation and convective heat transfer coefficients estimation. Sol. Energy 2018, 169, 673–681. [Google Scholar] [CrossRef]
- Alkaragoly, M.; Maerefat, M.; Targhi, M.Z.; Abdljalel, A. An innovative hybrid system consists of a photovoltaic solar chimney and an earth-air heat exchanger for thermal comfort in buildings. Case Stud. Therm. Eng. 2022, 40, 102546. [Google Scholar] [CrossRef]
- Benzarti, S.; Chaabane, M.; Mhiri, H.; Bournot, P. Performance improvement of a naturally ventilated building integrated photovoltaic system using twisted baffle inserts. J. Build. Eng. 2022, 53, 104553. [Google Scholar] [CrossRef]
- Arslan, E.; Aktaş, M.; Can, F. Experimental and numerical investigation of a novel photovoltaic thermal (PV/T) collector with the energy and exergy analysis. J. Clean. Prod. 2020, 276, 123255. [Google Scholar] [CrossRef]
- Maadi, S.R.; Khatibi, M.; Ebrahimnia-Bajestan, E.; Wood, D. Coupled thermal-optical numerical modeling of PV/T module—Combining CFD approach and two-band radiation DO model. Energy Convers. Manag. 2019, 198, 111781. [Google Scholar] [CrossRef]
- Li, M.; Ma, T.; Liu, J.; Li, H.; Xu, Y.; Gu, W.; Shen, L. Numerical and experimental investigation of precast concrete facade integrated with solar photovoltaic panels. Appl. Energy 2019, 253, 113509. [Google Scholar] [CrossRef]
- Swinbank, W.C. Long-wave radiation from clear skies. Q. J. R. Meteorol. Soc. 1963, 89, 339–348. [Google Scholar] [CrossRef]


| Geometry | Height (mm) | Width (mm) | Thickness (mm) | Density (kg/m3) | Thermal Conductivity (W/(m·K)) | Specific Heat Capacity (J/(kg·K)) |
|---|---|---|---|---|---|---|
| Photovoltaic panels | 1642 | 992 | 4 | 1500 | 0.36 | 1760 |
| Wooden wall | 1642 | 992 | 100 | 2000 | 0.46 | 1500 |
| Air-cooled channel | 1642 | 992 | 100 | 1.177 | 0.0242 | 1006.43 |
| Vertical fins (aluminum) | 1642 | 100 | 2 | 2719 | 202.4 | 871 |
| Basic Photovoltaic Wallboard | Photovoltaic Wallboard with Fins | ||
|---|---|---|---|
| Grid Numbers | Tpv (°C) | Grid Numbers | Tpv (°C) |
| 3400 | 63.92 | 5750 | 62.98 |
| 4712 | 63.76 | 9672 | 62.86 |
| 11,316 | 63.62 | 20,500 | 62.75 |
| 28,536 | 63.60 | 47,970 | 62.72 |
| 192,864 | 63.59 | 270,108 | 62.70 |
| Simulated Conditions | Case | Air-Cooled-Channel Thicknesses (mm) | Air-Cooled-Channel Widths (mm) | Solar Irradiance (W/m2) | Ambient Temperature (°C) |
|---|---|---|---|---|---|
| Group 1 | Case 1 | 40, 60, 80, 100, 120, 140, 160, 180, 200 | - | 800 | 25 |
| Case 2 | 40, 60, 80, 100, 120, 140, 160, 180, 200 | 80 | |||
| Group 2 | Case 3 | 40 | 20, 40, 60, 80, 100, 120 | 800 | 25 |
| Case 4 | 100 | 20, 40, 60, 80, 100, 120 | |||
| Case 5 | 180 | 20, 40, 60, 80, 100, 120 | |||
| Group 3 | Case 6 | 100 | - | 200, 400, 600, 800 | 25 |
| Case 7 | 100 | 20 | 200, 400, 600, 800 |
Disclaimer/Publisher’s Note: The statements, opinions and data contained in all publications are solely those of the individual author(s) and contributor(s) and not of MDPI and/or the editor(s). MDPI and/or the editor(s) disclaim responsibility for any injury to people or property resulting from any ideas, methods, instructions or products referred to in the content. |
© 2023 by the authors. Licensee MDPI, Basel, Switzerland. This article is an open access article distributed under the terms and conditions of the Creative Commons Attribution (CC BY) license (https://creativecommons.org/licenses/by/4.0/).
Share and Cite
Zheng, Y.; Miao, J.; Yu, H.; Liu, F.; Cai, Q. Thermal Analysis of Air-Cooled Channels of Different Sizes in Naturally Ventilated Photovoltaic Wall Panels. Buildings 2023, 13, 3002. https://doi.org/10.3390/buildings13123002
Zheng Y, Miao J, Yu H, Liu F, Cai Q. Thermal Analysis of Air-Cooled Channels of Different Sizes in Naturally Ventilated Photovoltaic Wall Panels. Buildings. 2023; 13(12):3002. https://doi.org/10.3390/buildings13123002
Chicago/Turabian StyleZheng, Yongxiao, Jikui Miao, Hongwen Yu, Fang Liu, and Qingfeng Cai. 2023. "Thermal Analysis of Air-Cooled Channels of Different Sizes in Naturally Ventilated Photovoltaic Wall Panels" Buildings 13, no. 12: 3002. https://doi.org/10.3390/buildings13123002
APA StyleZheng, Y., Miao, J., Yu, H., Liu, F., & Cai, Q. (2023). Thermal Analysis of Air-Cooled Channels of Different Sizes in Naturally Ventilated Photovoltaic Wall Panels. Buildings, 13(12), 3002. https://doi.org/10.3390/buildings13123002