Article

Quantifying Energy Savings from Optimal Selection of HVAC Temperature Setpoints and Setbacks across Diverse Occupancy Rates and Patterns

Department of the Built Environment, National University of Singapore, Singapore 117566, Singapore
*
Author to whom correspondence should be addressed.
Buildings 2023, 13(12), 2998; https://doi.org/10.3390/buildings13122998
Submission received: 29 October 2023 / Revised: 23 November 2023 / Accepted: 28 November 2023 / Published: 30 November 2023

Abstract

:
With the advent of flexible working arrangements, we are observing a dramatic shift in how buildings are occupied today, which presents an opportunity to optimize Heating, Ventilation, and Air Conditioning system temperature setpoints based on variations in occupancy. Guidelines often suggest the adoption of the highest or lowest setpoint or setback to minimize energy consumption in hot or cold climates, respectively. However, at outdoor temperatures where variations in occupancy heat loads prompt buildings to fluctuate across cooling, free-running, and heating mode, optimal setpoints and setbacks are not always the lowest or highest. In addition, the perturbations caused by rapid switching between setpoint and setback could diminish energy savings due to system destabilization. This paper aims to systematically compare the potential energy savings from fixed and optimal setpoints and setbacks across wide-ranging occupancy scenarios (four occupancy rates and 14 patterns). Energy simulations were conducted using the Department of Energy reference models for small, medium, and large office buildings to enable an exhaustive search of optimal setpoint/setbacks in 17 climate zones. Explored setpoints were 19.5 °C to 25.5 °C with intervals of 1 °C, and setbacks were 17 °C/19 °C for heating and 26 °C/28 °C for cooling. The findings indicate that, on average, while lower occupancy heat loads results in 5.48% energy reduction, a conventional fixed setpoint and setback strategy provides an additional 11.80%, and optimal selection of setpoints and setbacks could provide an additional 34.36–38.08%, emphasizing the untapped potential energy saving. To facilitate practical applications, this paper presents an interactive graphical interface: Optimal Temperature Setpoint Tool.

1. Introduction

Heating, Ventilation, and Air Conditioning (HVAC) systems are responsible for approximately 40% of the total energy consumption in buildings, making them the most energy-intensive service and a significant contributor to greenhouse gas emissions [1]. HVAC systems often employ closed-loop controllers that are regulated by temperature setpoints [2], which directly influence energy consumption and occupants’ thermal comfort [3,4]. Temperature setpoints are typically selected by facility managers based on prevailing standards and guidelines [5,6,7,8] and often remain fixed unless occupants raise a complaint [8,9]. In addition, most HVAC systems operate based on static occupancy schedules [10] that often assume maximum occupancy during working hours [11]. However, occupancy behavior is stochastic and can deviate substantially from these set values [12], often leading to unnecessary air conditioning [13,14,15]. The issue of HVAC systems operating on fixed schedules that do not match actual building occupancy is further amplified by growing workplace flexibility and remote working trends, triggered by the COVID-19 pandemic. Even after the pandemic restrictions are mostly lifted, about 25% of workers are expected to continue remote work either partially or fully [16]. With more flexible working hours, unoccupied periods might increase, and occupancy rates might drop. Consequently, leveraging occupancy data to select HVAC temperature setpoints could provide a promising solution to reduce energy waste without negatively impacting occupant comfort.
Previous studies often utilize occupancy data in the form of occupancy presence to select fixed temperature setpoints during occupied periods, and fixed setbacks when unoccupied [17,18,19,20,21,22,23], as guided by ASHRAE 36 [24]. The adoption of the highest or lowest setpoint and setback is widely used to minimize the heat transfer with outdoors and, thereby, energy consumption in hot or cold climates, respectively. By adopting the rule-based setpoint/setback selection strategies, these studies achieved 20% energy savings, on average. However, even if there was no change to setpoints (i.e., no setbacks), the lower occupant-generated heat loads at lower occupancy would provide up to a 4.34% energy reduction, on average [25], that is currently not reported or acknowledged by these studies. Nevertheless, there is an additional energy-saving potential of shifting from fixed to optimally selected setpoints and setbacks with respect to occupancy and weather. This occurs at outdoor temperatures where variations in occupancy heat loads prompt buildings to fluctuate across cooling, free-running, and heating mode, and optimal setpoint and setback might not always be the lowest or highest [25]. Selecting the optimal temperature setpoints and setbacks in response to changes in occupancy and outdoor weather conditions can, therefore, minimize the HVAC energy required to maintain a heat balance between indoor heat loads (governed mainly by varying occupancy) and outdoor heat transfer (governed mainly by outdoor air temperature) [26,27,28,29,30]. In addition, it is important to consider the potential impact of rapid switching between temperature setpoints and setbacks which can cause frequent on–off cycles of HVAC equipment, resulting in increased energy consumption. Therefore, augmenting HVAC systems operation through optimal selection of temperature setpoints and setbacks with respect to occupancy and weather variability could minimize heat transfers and perturbations, thereby enhancing system stability and minimizing HVAC energy consumption.
This paper systematically compares energy savings from fixed and optimal HVAC temperature setpoints and setbacks across wide-ranging occupancy scenarios. Three setpoint and setback selection strategies are investigated: (1) a conventional fixed setpoint and setback, (2) optimal setpoint and fixed setback, and (3) optimal setpoint and setback. Four scenarios as proxies for the building occupancy rate (100%, 75%, 50%, 25% of the maximum occupancy) and 14 patterns (unoccupied periods from 0 to 6 h) were generated to account for increasing workplace flexibility and remote working trends. Three U.S. DOE energy models of office buildings were simulated across 17 climates to account for variations in building sizes (small, medium, and large) and a wide variety of outdoor air temperatures. Seven setpoints with an interval of 1 °C between 19.5 °C and 25.5 °C were investigated during occupied periods, with two setbacks for heating (17 °C and 19 °C) and two for cooling (26 °C and 28 °C), implemented during unoccupied periods. An exhaustive search algorithm was adopted to determine the optimal setpoint and setback temperature based on variations in occupancy and weather, i.e., setpoint and setback that minimizes HVAC energy usage during occupied and unoccupied periods, respectively.
In this study, the HVAC system is controlled through setpoints and setbacks falling within a range of temperatures that guarantee thermal satisfaction [29,30]. This approach allows to reformulate the optimization problem, treating the minimization of energy consumption as a single objective while carefully constraining thermal comfort. Therefore, rather than tackling the complex interplay of energy and thermal comfort as a multi-objective problem, this approach strikes a balance to investigate energy efficiency without compromising occupant thermal satisfaction. This can be achieved since occupants experience comfort within a nuanced spectrum of thermal conditions [31]. Various human-related and environmental factors, including acclimation and weather conditions, exert influence on thermal comfort, rendering it a dynamic parameter and susceptible to alteration over time [32,33]. However, the capacity for adaptation is a key feature of human response to uncomfortable changes, aligning with the fundamental concept of adaptive thermal comfort [31]. Therefore, leveraging the adaptive capabilities of occupants within the optimization framework enables to quantify the maximum potential for energy savings by investigating the variation of optimal temperature setpoints and setbacks across varying occupancy scenarios, without compromising thermal comfort. The structure of this paper is as follows. Section 2 reviews the literature focusing on research exploring energy savings achieved with the selection of setpoint and setback temperatures and extrapolates the gaps in research. Section 3 outlines the methodological workflow employed in the study, covering the generation of the data, data mining, followed by the evaluation framework. Section 4 presents and discusses the findings, while the limitations of this study and suggestions for future research are highlighted in Section 5. Section 6 provides a breakdown of the results and serves as the concluding section of the study.

2. Literature Review

In recognizing the dynamic landscape of energy efficiency measurement methodologies in buildings, this literature review is tailored to encompass studies specifically focused on energy savings achieved through HVAC temperature setpoint and setback strategies, offering a targeted exploration of our primary research objective. Acknowledging the effects of temperature setpoints on HVAC energy consumption, several research efforts focused on the development of various smart setpoint selection strategies and control systems in order to reduce energy consumption over the past few years. HVAC systems typically operate through a univariate control logic, which triggers cooling or heating with respect to a single input (temperature setpoint) and single output (indoor air temperature) [34]. Hence, the setpoint is treated as a singular parameter, without separate exploration of heating and cooling setpoints. In general, the simplest approach to achieve energy conservation is by widening temperature setpoints. This broadens the spectrum of temperatures within which HVAC systems function, subsequently reducing heating and cooling demand. Hoyt et al. [35] quantified energy reduction resulting from decreasing the reference heating setpoint (21.1 °C) up to 17.7 °C and raising the cooling setpoint (22.2 °C) up to 30 °C. This analysis was performed across a set of six medium-sized offices simulated across seven climates of the U.S. The findings revealed that by raising the reference cooling setpoint to 25 °C and lowering the reference heating setpoint to 20 °C, 29% cooling energy savings and 34% for heating could be achieved, while maintaining acceptable temperature levels. It was also found that a broader setpoint temperature range of 18.3 °C to 27.8 °C could lead to energy savings of up to 73% of overall HVAC energy consumption. Although this research systematically quantified energy savings across diverse climate conditions, it is important to note that widening the temperature difference between heating and cooling setpoints would consistently result in energy savings. Furthermore, the optimal heating and cooling setpoints for specific climates remain unclear. Papadopoulos et al. [28] addressed this gap by quantifying the energy saving potential of optimal heating and cooling setpoints in large office buildings across various climate zones, accounting for the trade-off between energy consumption and thermal comfort. For moderate to cold climate zones, it was found that thermostat setpoints selected based on international standards, such as ASHRAE 55 [2] employed in DOE models, yield sub-optimal results. Specifically, energy savings of up to 60% can be achieved in moderate climates without compromising occupant thermal comfort, while minimal savings were highlighted in regions with high cooling loads. Nevertheless, the influence of outdoor weather on energy consumption at varying setpoints was not explored, and the energy savings were solely measured at fixed temperature setpoints. Ghahramani et al. [36] suggested determining daily and yearly optimal setpoints based on weather fluctuations and investigated optimal setpoint selection across various building sizes, climate zones, and building vintages. Their findings indicated that daily optimal setpoints in the range of 22.5 ± 3 °C lead to savings of up to 16.4%, compared to a 22.5 °C baseline setpoint. Daily optimal setpoints resulted in energy savings ranging from 10.09% to 37.03% for small office buildings, 11.43% to 21.01% for medium office buildings, and 6.78% to 11.34% for large office buildings. While this study delves into the possibility of choosing optimal setpoints with respect to outdoor weather, it overlooks the influence of occupancy. In summary, none of the previous studies investigated optimal setbacks during unoccupied periods.
Research investigations into HVAC system controls that consider occupancy have encompassed the development of algorithms rooted in machine learning and model predictive control methodologies. In their evaluation conducted at the University of Florida, Goyal et al. [20] analyzed a feedback controller and a model predictive control (MPC) system that incorporated real-time optimization of setpoints and setbacks. In comparison to a conventional controller, the study revealed that both occupancy-based approaches resulted in approximately 40% energy reduction. Importantly, these controls were able to achieve thermal comfort and maintain indoor air quality within acceptable levels. However, the setpoint for occupied periods was fixed at 21.1 °C and the static nighttime setback was set to 22.8 °C. In another study, Baldi et al. [17] presented an occupancy-driven controller for setpoints and setbacks, employing three rules: a pre-cooling setpoint to activate the energy system before occupancy, a fixed setpoint of 24 °C and 25 °C during occupancy, and a setback of 30 °C during unoccupied periods. The findings indicated that compared to fixed pre-programmed approaches, this approach could achieve energy savings of 15% while simultaneously increasing the level of thermal satisfaction among occupants. Although the contribution of both setpoints and setbacks was included in the quantification of the energy-saving potential, heating and cooling were supplied at fixed temperatures during occupied or unoccupied periods. A step forward in the development of dynamic setpoints dependent on occupancy is represented by the research conducted by Wang et al. [37] where they optimized HVAC temperature setpoints using predicted internal heat gain values. The occupancy-driven optimal algorithm demonstrated energy reductions of up to 36.8% for heating and 33.9% for cooling. Furthermore, it was noted that occupant discomfort lessened by 3–5% during summer and winter, respectively. While this study showcased the advantages of optimal setpoints with respect to occupancy, it did not take into account the influence of outdoor temperatures, concentrating solely on modifying the setpoint in response to internal heat generation. Finally, Peng et al. [22] conducted a study that delved into the adoption of occupancy data to deduce cooling setpoints in real time. They implemented a learning-based controller in 11 office rooms, which encompassed a range of typical office scenarios. The findings demonstrated energy savings ranging from 7% to 52% compared to a conventional controller for cooling systems. This study investigated four occupancy patterns, each with distinct arrival and departure times, and total occupied durations and assigned setpoints or setbacks, respectively. However, this study evaluated a control algorithm based on rules and static temperatures, offering just four temperature choices: a comfort temperature setpoint, a setback 1 °C higher than the comfort temperature, a deep setback 0.5 °C higher than the setback, and a 35 °C economy temperature. While previous studies investigated varying the setpoint based on outdoor temperature or estimated energy savings depending on occupancy, there is a lack of research focusing on the combined effects of outdoor temperature and occupancy variability.
The existing literature investigating energy efficiency in buildings using setpoints and setbacks has predominantly focused on rule-based strategies utilizing fixed temperature setpoints and setbacks based on occupancy presence. While these studies have demonstrated significant average energy savings, the literature lacks exploration into the additional energy-saving potential that arises from transitioning to optimally selected setpoints and setbacks, considering the dynamic interplay between occupancy and outdoor weather conditions. The significance of this gap lies in the potential for minimizing HVAC energy consumption by selecting temperature setpoints and setbacks in response to changes in occupancy and outdoor conditions, thereby achieving a more nuanced balance between indoor heat loads and outdoor heat transfer. Additionally, the literature currently overlooks the potential impact of rapid switching between temperature setpoints and setbacks on HVAC system stability, presenting an avenue for further investigation. This gap underscores the need for comprehensive investigations that integrate both outdoor temperature fluctuations and occupancy dynamics, providing a more holistic understanding of the factors influencing optimal setpoints and setbacks for HVAC systems in buildings.

3. Methodology

The methodological approach in this study involves three key components: (1) data generation: it defines the investigated factors and their values (Section 3.1); (2) data mining: it presents the simulation process and the identification of optimal setpoints and setbacks and respective energy usages, in Section 3.2; and (3) evaluation framework: it illustrates the computation of energy savings resulting from 3 selection strategies (Section 3.3). A total of 7 temperature setpoints and 4 setbacks, 14 unoccupied patterns and 4 occupancy rates, 17 climates and 3 building sizes are explored (Section 3.1). This study used the U.S. Department of Energy (DOE) reference office buildings (small, medium, and large) energy simulation models which are compatible with EnergyPlus software version 8.9 [
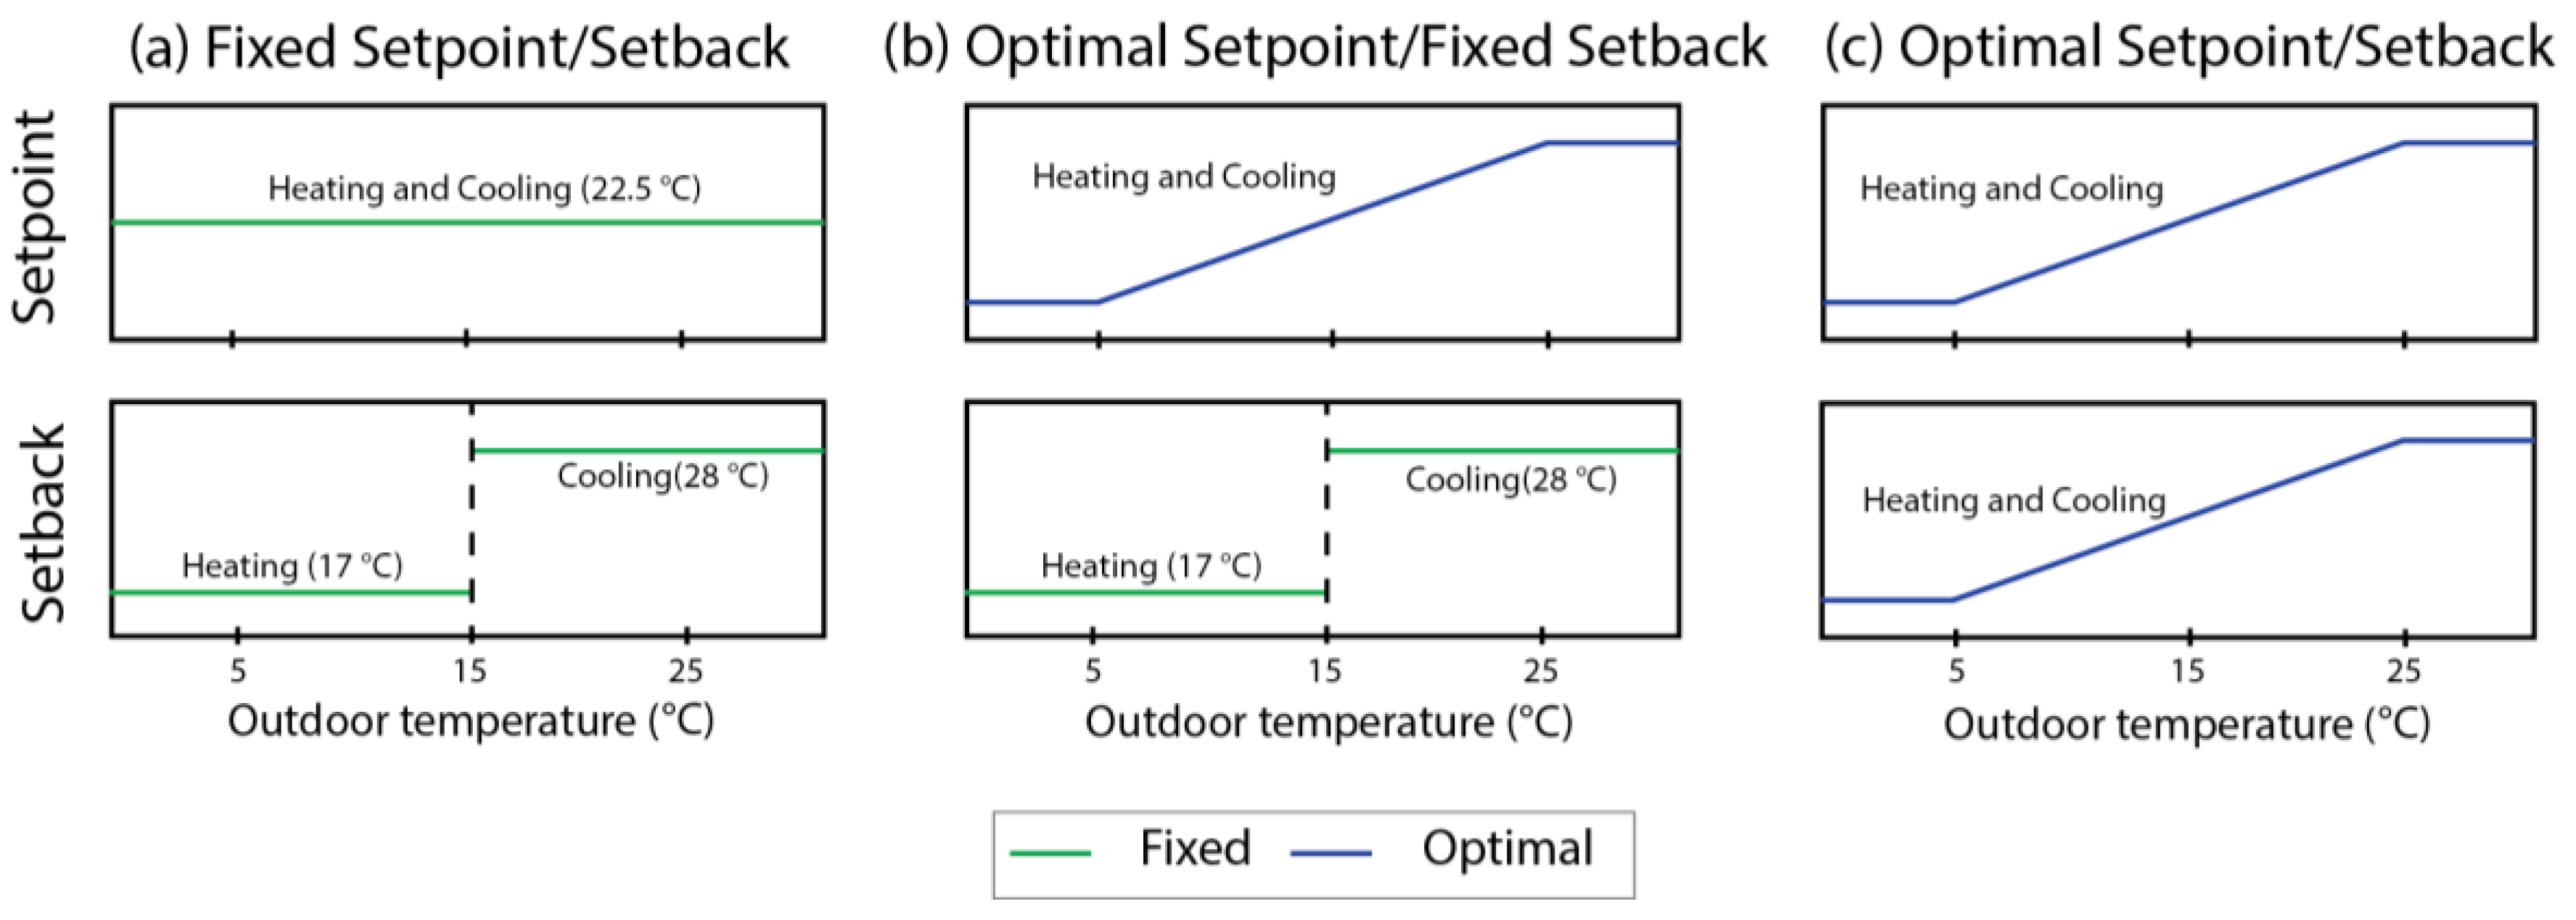
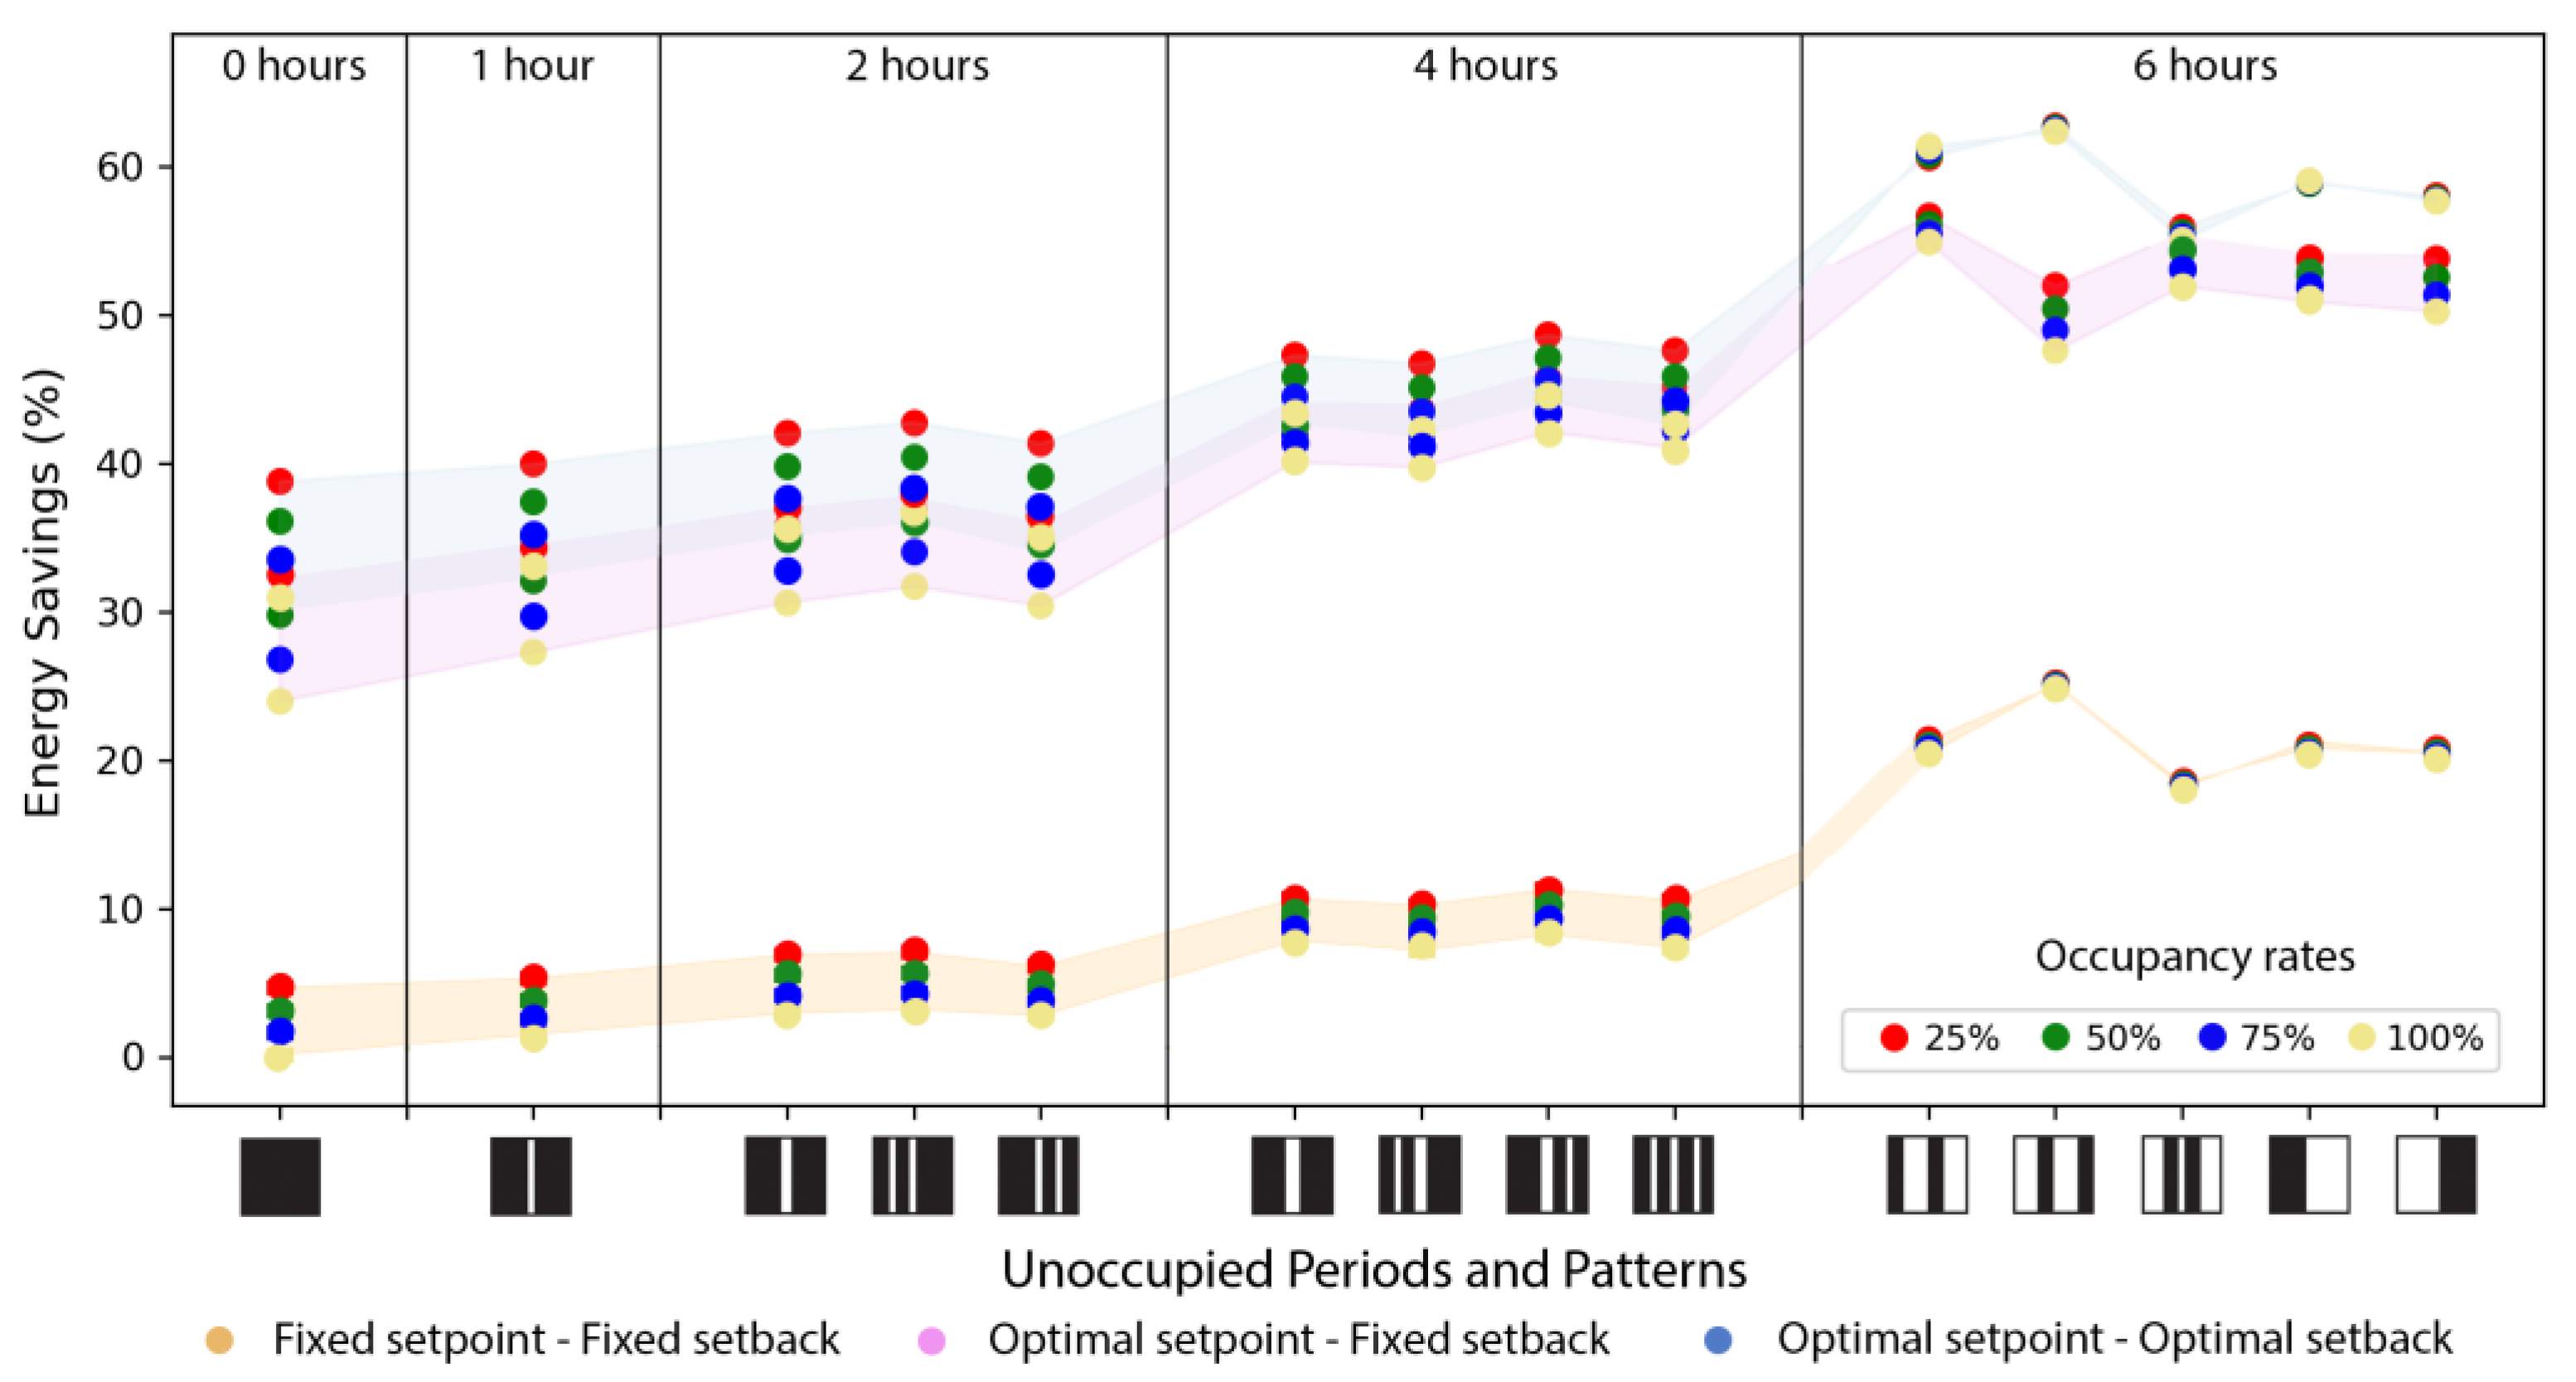
38]. This paper evaluates 3 setpoint and setback selection strategies: a conventional fixed setpoint and setback, optimal setpoint with fixed setback, and optimal setpoints and setbacks (Figure 1) and quantifies the resulting energy savings compared to a baseline value of 22.5 °C (Section 3.3).

3.1. Data Generation

The variables and the corresponding investigated values are presented in Table 1. To discretize the temperature setpoints, a 1 °C interval was assigned to seven values ranging from 19.5 °C to 25.5 °C. The range was chosen based on temperatures that enable occupants to remain thermally comfortable [5,6]. Given that setbacks should fall outside the setpoint range, this paper explored them by selecting two values lower than the lowest setpoint (19.5 °C), 17 °C and 19 °C for heating, and higher than the highest setpoint (25.5 °C), 26 °C and 28 °C for cooling. In order to represent variations in occupant heat loads, this research defined 4 ratios as proxies for the average rate of occupancy with respect to a fully occupied building (100%), namely 25%, 50%, 75%, and 100%. The occupancy rates are to be considered homogeneous throughout the occupied periods, allowing the quantification of maximum potential energy savings, achievable while reducing uncertainty due to the stochastic behavior of occupants.
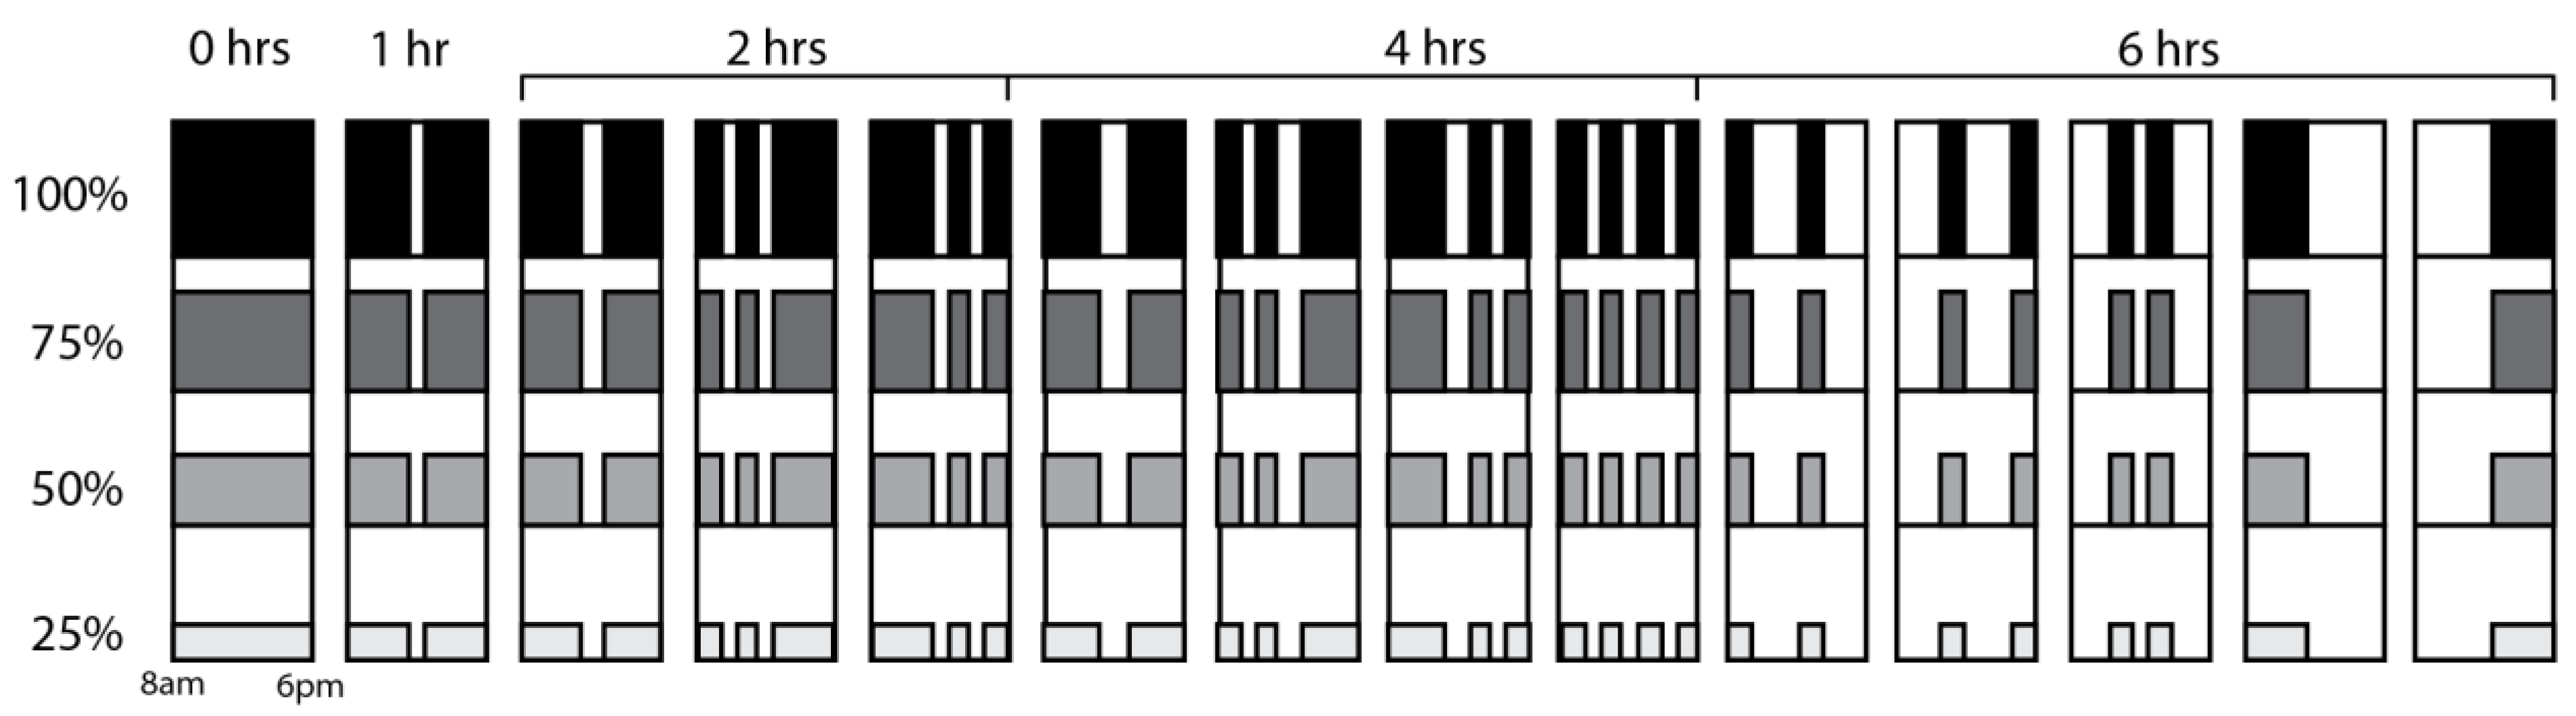
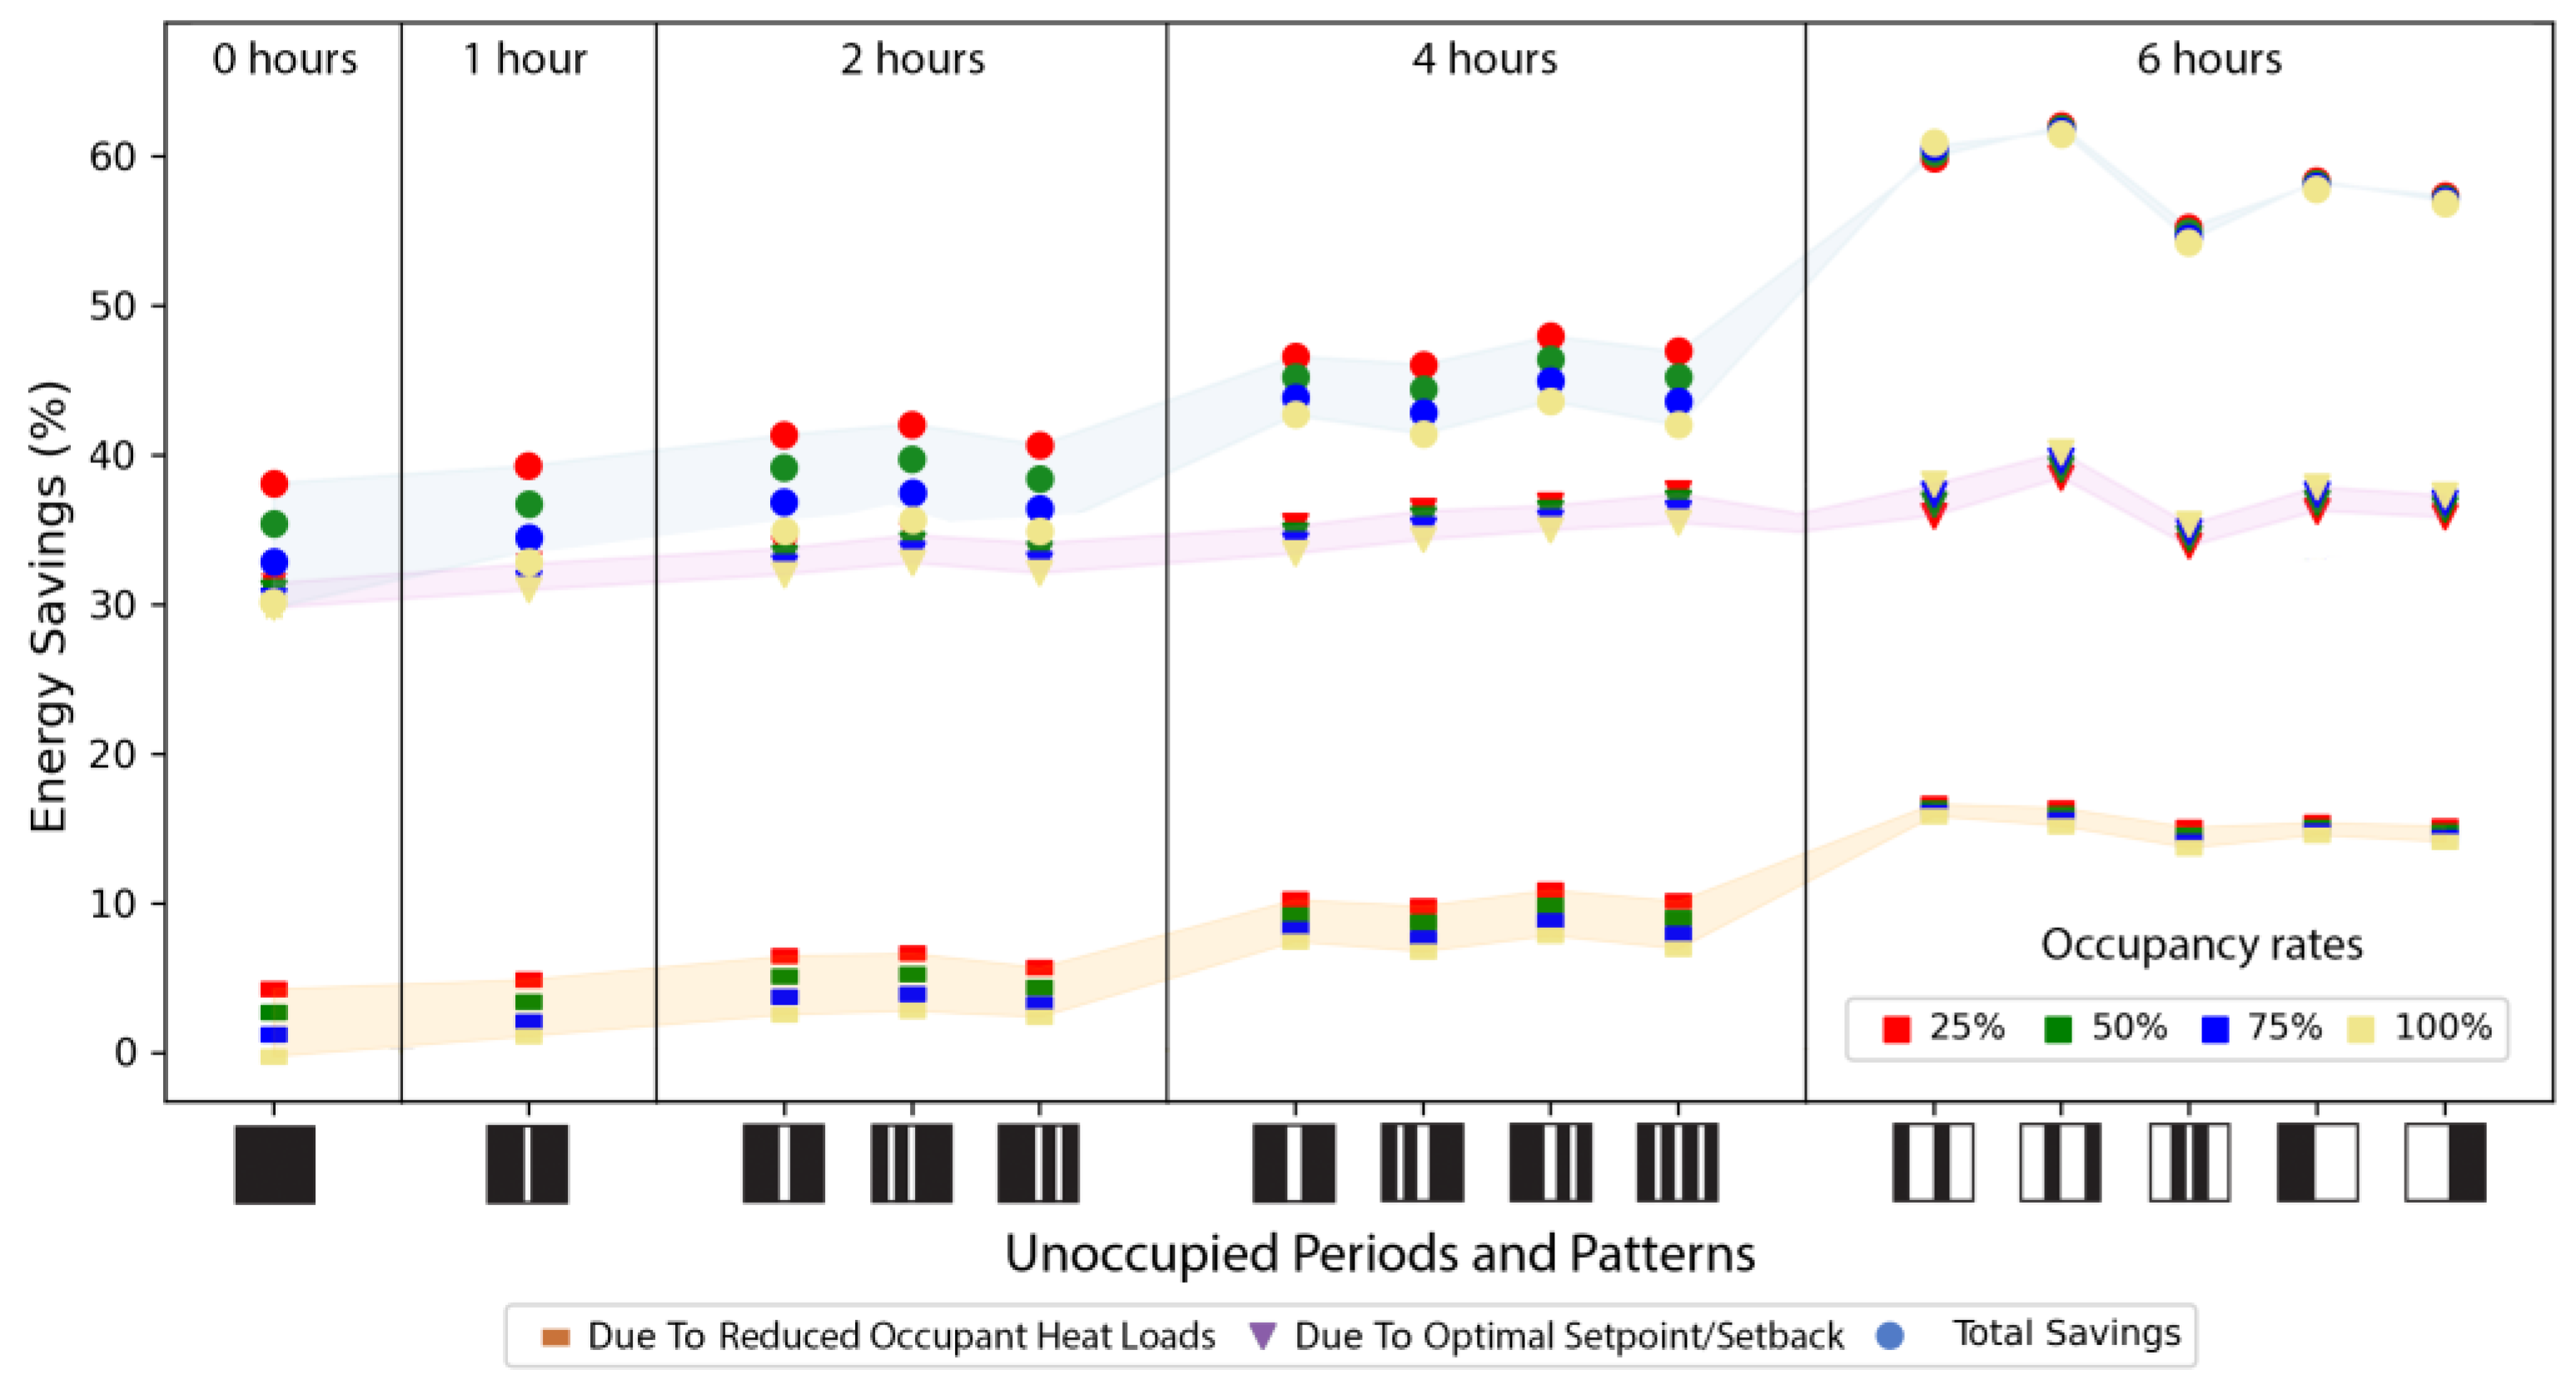
Figure 2 depicts the investigated 14 unoccupied patterns across five unoccupied periods (0 h, 1 h, 2 h, 4 h, and 6 h). They represent different distributions of unoccupied periods that account for growing workplace flexibility and remote working trends in office buildings. They were defined according to a rule-based strategy by iterating the length (from 0 to 6 h), frequency (from a single unoccupied period to multiple unoccupied periods), and distribution (early morning: 8–10 a.m., late morning: 10 a.m.–12 p.m., early afternoon: 2–4 p.m., late afternoon: 4–6 p.m.) of unoccupied periods.
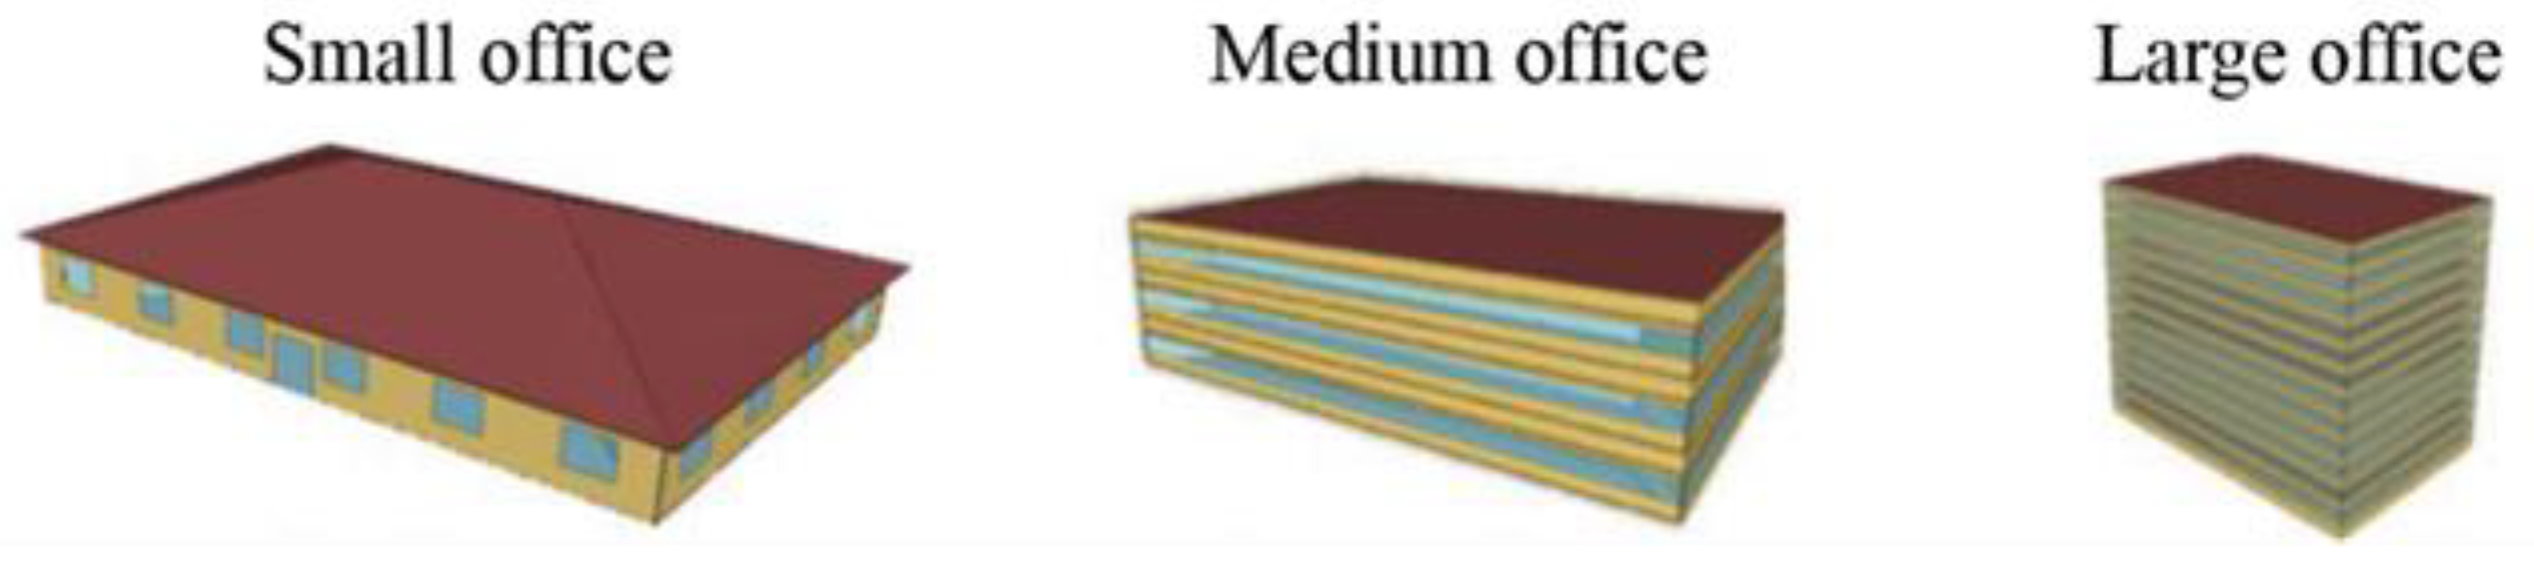
In total, 17 different climates ranging from extremely hot and humid (0A) (Singapore) to subarctic (8) (Fairbanks, Alaska) were simulated to generalize the findings across a range of climate zones. In addition, the investigation across various climates allows the selection of optimal setpoints and setbacks with respect to a wide range of outdoor air temperatures. To study the effects of outdoor conditions on the size and geometry of buildings, the study encompasses 3 building sizes: a small, single-story building, a medium-sized building with 3 floors, and a large, twelve-story building. Since smart control systems can only be operated in modern energy systems, only newly built buildings (after 2004) were included. These models accurately simulate building construction materials and methods, adjusting roof and wall U-values, slab-on-grade and underground R-values, window U-values, and solar heat gain coefficients (SHGCs), in accordance with prevailing climate conditions. Furthermore, these models incorporate various energy systems based on specific building types. Figure 3 portrays the small, medium, and large office buildings. Table 2 details the construction materials and equipment systems based on ASHRAE standards 90.1-2004 and 62.1-2004 [38].
The reference building models are assigned HVAC operational profiles that align with the occupancy patterns under investigation. On weekdays, setpoints are assigned for occupied periods, with setbacks applied during unoccupied periods. On Saturdays, Sundays, and holidays, the HVAC system remains off throughout the entire day.

3.2. Data Mining

The daily energy consumption for every combination of variables was simulated to determine daily optimal setpoints, as they provide energy savings compared to annual setpoints [36] and can dynamically respond to outdoor temperatures and occupancy variations. Weekends and holidays were not considered since offices are mostly unoccupied, which leads to the HVAC systems being either turned off or operated for a shorter period compared to patterns identified above. In order to sample the whole search space, an exhaustive (full factorial) approach was utilized to generate the solutions (79,968 combinations: 7 setpoints × 4 setbacks × 4 occupancy rates × 14 unoccupied patterns × 3 building sizes × 17 climates). The daily optimal setpoints and setbacks are temperatures that minimize the energy required by the energy system to maintain a heat balance between the interior and exterior environment and are constrained to a defined range (i.e., constraints in Equations (1) and (2)). The exhaustive search algorithm analyzes the energy consumption resulting from various temperature setpoints and setbacks. It then identifies the combination with the lowest energy consumption along with its associated setpoint and setback values for each permutation of unoccupied pattern and occupancy rate. The exhaustive search algorithms (Equations (1) and (2)) identify the daily optimal setpoint and setback and the associated energy consumptions for (1) optimal setpoint with fixed setback strategy and (2) optimal setpoint and setback strategy. The conventional fixed strategy entails a temperature setpoint of 22.5 °C, while the heating and cooling setbacks are, respectively, 17 °C and 28 °C. Note that this study covers analyses across diverse climates where building envelope parameters are adjusted based on distinct climate conditions to establish broad applicability. Due to space limitations, reported energy savings are averaged across climates, recognizing the varied thermal loads associated with different building envelopes in these regions.
Optimal setpoint and fixed setback strategy:
Occupied   period :   m i n S P H V A C E n e r g y i ( S P , O T , O R )
Subject to 19.5 °C < SP < 25.5 °C, i = 1:365
Unoccupied period: SBheating = 17 °C, SBcooling = 28 °C
Optimal setpoint and setback strategy:
Occupied   period :     m i n S P H V A C E n e r g y i ( S P , O T , O R )
Subject to 19.5 °C < SP < 25.5 °C
Unoccupied   period :   m i n S B     H V A C E n e r g y i ( S B , O T )
Subject to 15 °C < SBheating < 19 °C, 26 °C < SBcooling < 30 °C
  • where:
SP = Daily Setpoint,
SBheating = Daily Setback for heating,
SBcooling = Daily Setback for cooling,
OT = Daily Outdoor Air Temperature,
OR = Daily Occupancy Rate.
EnergyPlus simulations were executed using the Python programming language, with each simulation employing a customized building energy model file (.idf file) run with parallel computing techniques to reduce the computational time. The script systematically scanned the text file of each model to identify the variables, and their values were replaced in a parametric manner.

3.3. Setpoints and Setbacks and Energy Evaluation Framework

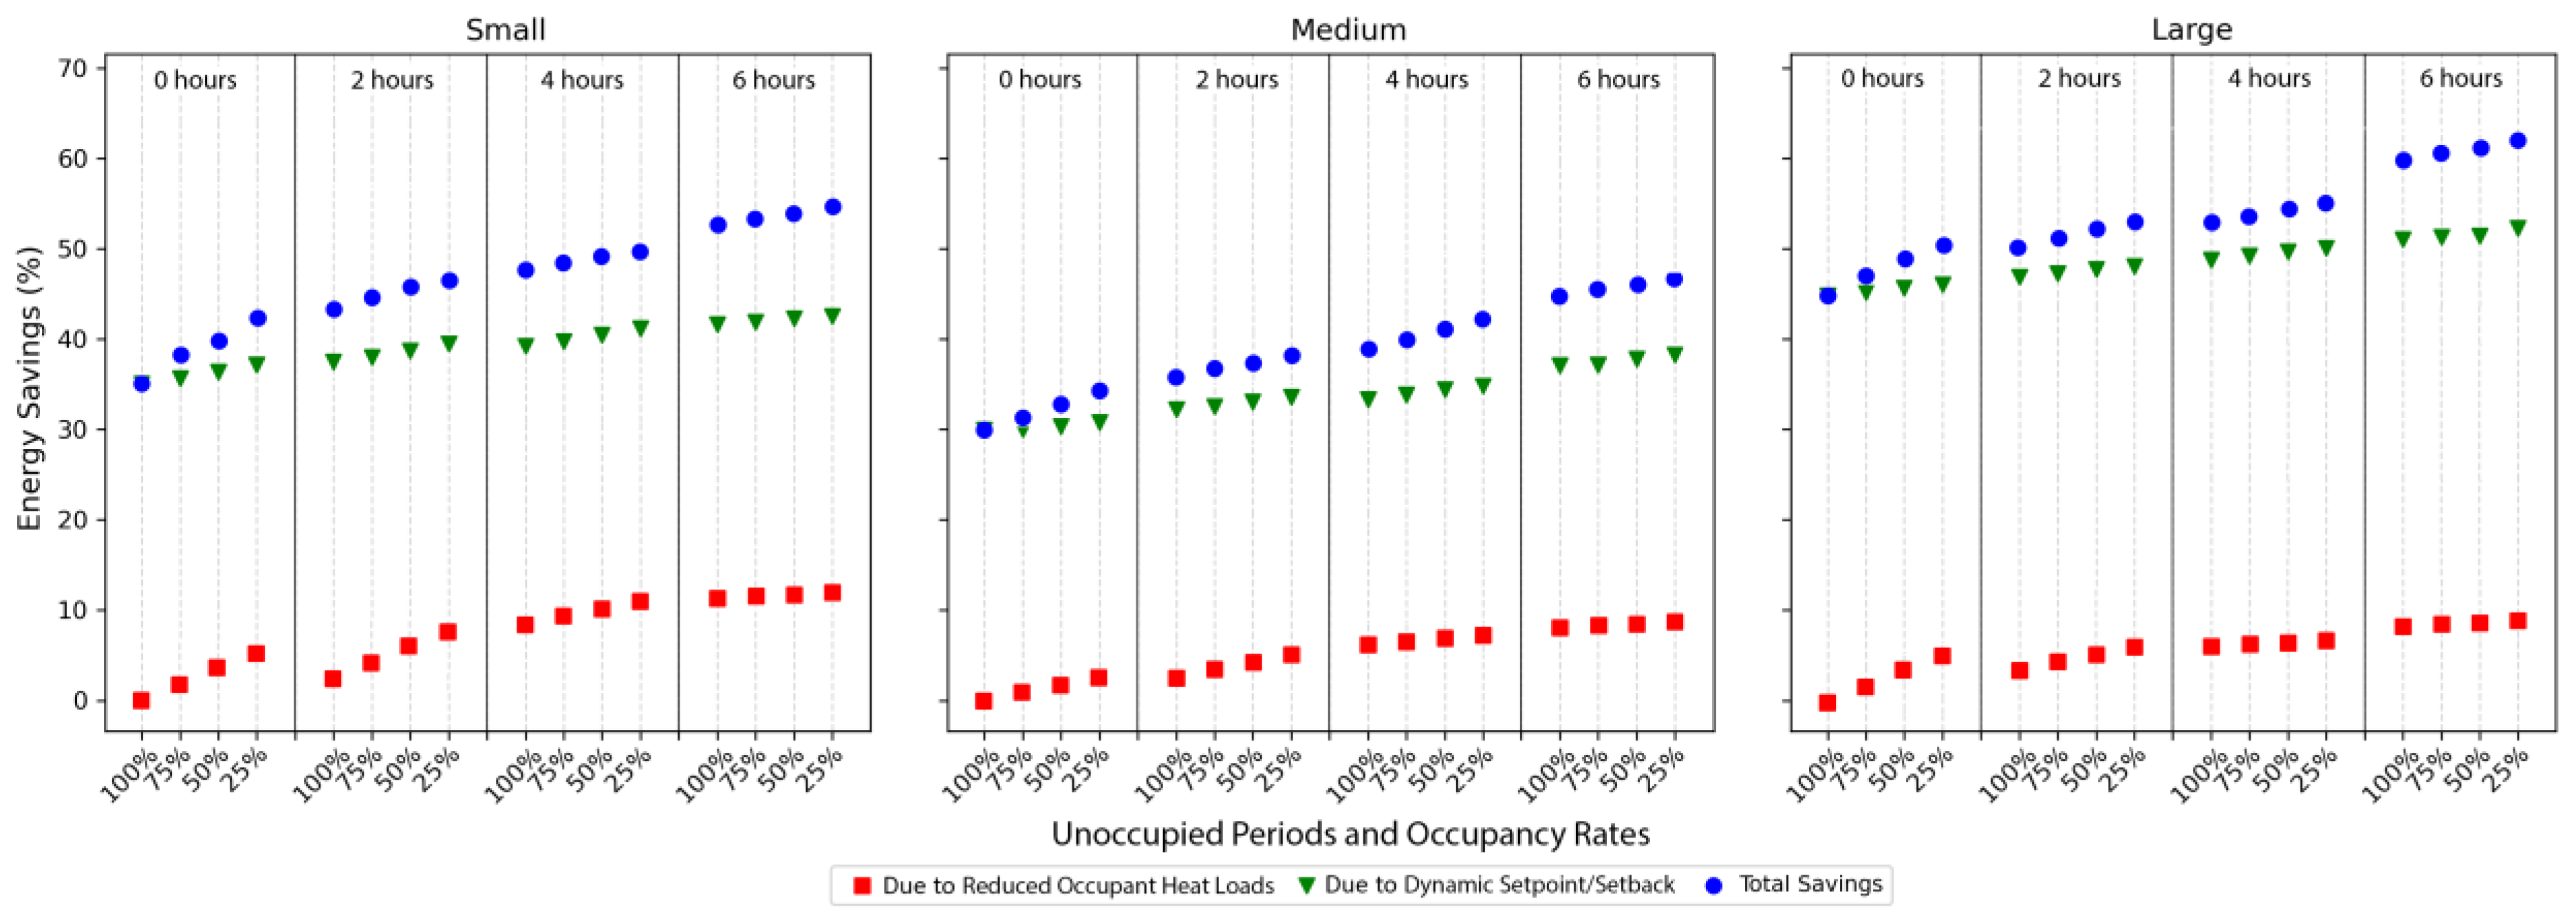
In order to ensure an equitable assessment of different setpoint selection strategies, this study quantifies the effect of reduced heat loads during lower occupancy rates and extended unoccupied periods on HVAC energy consumption. This portion of savings occurs regardless of adopting any setpoint selection strategy. The average daily energy reduction resulting from occupancy heat loads was determined in relation to the HVAC energy consumption observed in a building that remained continuously occupied (no unoccupied periods), and at 100% occupancy (used as the baseline reference). The variation in HVAC energy consumption for each change in occupancy rate and unoccupied period, when compared to the baseline, was calculated as a percentage of savings using Equation (3).
E n e r g y   R e d u c t i o n h e a t   l o a d s % = d = 1 365 E b a s e l i n e d E p a t t e r n , r a t e d E b a s e l i n e d × 100 % 365  
where:
  • E b a s e l i n e d = reference daily energy usage from 0 unoccupied periods, at 100% occupancy rate.
  • E p a t t e r n , r a t e d = daily energy consumption at 1 h, 2 h, 4 h and 6 h unoccupied period and 75%, 50% and 25% occupancy rate.
Subsequently, the additional average daily energy saving resulting from each selection strategy was computed. The energy savings across occupancy rates and unoccupied periods were determined with respect to the HVAC energy consumption when fixed setpoints were applied (used as baseline reference). The variance in HVAC energy consumption between the energy usage resulting from each selection strategy at various occupancy rates and unoccupied periods, compared to the baseline, was computed as a percentage of savings using Equation (4).
E n e r g y   S a v i n g x % = d = 1 365 E b a s e l i n e , p a t t e r n , r a t e d E x , p a t t e r n , r a t e d E b a s e l i n e , p a t t e r n , r a t e d × 100 % 365
where:
  • x = setpoint and setback selection strategy (fixed setpoint and setback, optimal setpoint and fixed setback, optimal setpoint and setback).
  • E ( b a s e l i n e ,   p a t t e r n ,   r a t e ) d = baseline daily energy consumption for a fixed setpoint strategy at 0 h, 1 h, 2 h, 4 h and 6 h unoccupied period and 75%, 50% and 25% occupancy rate.
  • E x ,   p a t t e r n , r a t e d = daily energy consumption for each selection strategy at 0 h, 1 h, 2 h, 4 h and 6 h unoccupied period and 75%, 50% and 25% occupancy rate.

4. Results and Discussion

4.1. Conventional Fixed Setpoint and Setback Selection Strategy

4.1.1. Energy Savings from Fixed Setpoints and Setbacks

Figure 4 portrays the climate-averaged daily energy savings from a fixed setpoint and setback strategy (setpoint of 22.5 °C, heating setback of 17 °C, and cooling setback of 28 °C) obtained across occupancy rates and unoccupied periods, for small, medium, and large office buildings.
It appears that extended unoccupied periods and decreased occupancy rates result in greater energy reduction owing to reduced occupant heat loads, regardless of the building size. Small office buildings can attain greater daily average energy savings from fluctuations in heat loads because they rely more heavily on indoor heat loads in contrast to larger buildings. For a lightly occupied (25% occupancy rate) small, medium, and large building with an unoccupied period of 6 h, energy reduction of up to 11.95%, 7.25%, and 9.73% can be achieved. While lower occupancy rates consistently lead to increased energy savings, as unoccupied periods increase, the influence of occupancy rates on energy reduction diminishes. On average across building sizes, an unoccupied period of 6 h results in an energy reduction of 8.64%.
In addition to the energy reduction resulting from decreased heat loads, adopting a conventional fixed setpoint and setback selection strategy also yields energy savings derived from selecting setbacks when the spaces are unoccupied. Energy savings increase with longer unoccupied periods since an increasing portion of energy consumption is attributable to setbacks that operate at a lower or higher temperature for heating or cooling, respectively, compared to setpoints during occupied periods. Energy savings for a small building range from 6.97% to 22.06% for an unoccupied period of 2 to 6 h, from 6.12% to 13.25% for a medium building, and from 7.33% to 15.05% for a large building. Averaged across building sizes and occupancy rates, the conventional setpoint/setback strategy can achieve 10.85%, 17.64%, and 25.05% total energy savings at unoccupied periods of 2, 4, and 6 h, respectively. In total, the fixed setpoint and setback strategy can, on average, achieve 22.76% energy savings, distributed as 5.78% from reduced occupant heat loads and 11.80% from the setpoint and setback selection strategy.
Figure 5 dives deeper into HVAC energy savings across patterns, while averaging the savings across building sizes.
It can be seen that longer unoccupied periods and lower occupancy rates result in lower occupant heat loads, leading to increased energy reduction. However, while the extent of energy reductions does not significantly vary across different patterns with continuous or intermittent occupancy for up to 4 h of unoccupancy, greater variations can be observed during longer unoccupied periods (6 h). This is due to the interactions between indoor and outdoor heat loads. A combination of high heat loads from both outdoors and occupants results in lower energy reductions across predominantly unoccupied patterns (6 h). In addition, as unoccupied periods increase, the sensitivity of energy consumption to occupancy rates becomes negligible. Comparatively, the impact of fixed setpoints and setbacks on energy savings across different patterns appears to increase with longer unoccupied periods. On average, the impact of the selection of setpoints and setbacks was 8.68% and occupant heat loads was 4.72%. It is noticeable that rapidly switching between setpoint and setback during high heat loads results in lower energy savings due to the short on–off cycle of the HVAC system which causes destabilization. This is evident for the pattern characterized by a short 1 h unoccupied period in between two longer periods of occupancy of 3 h each, where daily energy savings are 3.12% lower compared to a pattern that ensures enough time for the system to achieve and maintain the desired temperature.

4.2. Optimal Temperature Setpoints and Fixed Setbacks Selection Strategy

4.2.1. The Impact of Occupancy Rates and Unoccupied Periods on Optimal Temperature Setpoints with Fixed Setbacks

Figure 6 illustrates optimal setpoints for the small building (computed using Equation (1)) in relation to outdoor air temperature, unoccupied periods, and occupancy rates. Due to space limitations and the stronger influence of outdoor temperatures on optimal setpoints in comparison to larger buildings, only the results for the small building size are showcased [25]. Applying a regularized linear regression on the optimal setpoints reveals a robust correlation in the form of a monotonic behavior between setpoints and the outdoor conditions across various occupancy rates and unoccupied periods. Generally, as the outdoor environment becomes hotter, the optimal setpoint increases. However, the variation in occupant heat loads due to different occupancy rates and unoccupied periods also appears to impact optimal setpoints. Consequently, different optimal setpoints are identified for the same outdoor air temperature. This is evident from the diverging color-coded regression lines representing different lengths of unoccupied periods.
Figure 7 details the variation in optimal setpoints across occupancy rates and unoccupied periods, averaged building size, and climate. Building upon the findings presented in [25], the lowest assessed setpoint (i.e., 19.5 °C) was optimal when the outdoor temperature remained below 5 °C, and it gradually rose as the outdoor temperature increased. When outdoor temperature exceeded 32 °C, the optimal setpoint temperature was 25.5 °C, the highest among those evaluated. Hence, in the case of an outdoor temperature below 5 °C and above 32 °C, the optimal setpoints (19.5 °C and 25.5° C) exhibited no alteration across different occupancy rates and unoccupied periods. Nonetheless, in the outdoor temperature range of 5 °C to 32 °C, differing occupancy led to distinct optimal setpoints, contingent on the extent of unoccupied periods and occupancy rates. This variability can lead buildings to switch between cooling, free-running, and heating mode.
Compared to the optimal setpoint identified for a building continuously occupied (no unoccupied periods), and at 100% occupancy (baseline reference), a higher setpoint was found to be optimal for cooling and a lower setpoint for heating for longer unoccupied periods and lower occupancy rates. Within the moderate outdoor temperature range of 5 °C to 32 °C, the optimal setpoints at an occupancy rate of 25% were, on average, 1 °C lower when below 17 °C, or higher when above 17 °C, than those at 100% occupancy rate due to lower occupant-generated heat. Additionally, the optimal setpoints for an unoccupied period of 6 h were found to be, on average, 2 °C lower (heating) or higher (cooling) compared to the optimal setpoint identified for no unoccupied periods.

4.2.2. Energy Savings from Optimal Setpoints and Fixed Setbacks

Figure 8 illustrates the daily energy savings averaged across different climates, achieved through an optimal temperature setpoint and fixed setbacks strategy (calculated using Equation (3)). These savings are presented across various occupancy rates and unoccupied periods for a small, medium, and large building.
As highlighted in Section 4.1.1, an energy reduction of up to 11.95%, 7.25%, and 9.73% can be obtained from lower heat loads. The implementation of an optimal setpoint and fixed setback strategy provides energy savings derived from selecting setpoints that minimize heat transfer with the outdoor environment. It could be due to the fact that larger office buildings tend to have a lower surface area to volume ratio compared to smaller buildings. This lower ratio means that larger buildings have less exposed surface area relative to their interior volume. As a result, they are typically less sensitive to variations in outdoor temperature; thus, optimal setpoints can result in larger energy savings when occupancy heat loads are reduced. Furthermore, energy savings increase at lower occupancy rates and for longer unoccupied periods. Energy savings for a small building range from 29.2% to 35.46% for an unoccupied period of 2 to 6 h, from 24.78% to 30.92% for a medium building, and from 39.79% to 46.05% for a large building. On average across building sizes and occupancy rates, 38.67%, 32.85%, and 48.88% total energy savings can be obtained for an unoccupied period of 2, 4, and 6 h, respectively. In total, the optimal setpoint and setback strategy can, on average, achieve 40.14% energy savings distributed as 5.78% from reduced occupant heat loads and 34.36% from the setpoint and setback selection strategy. This represents an increase of 22.56% compared to fixed setpoints and setbacks.
Figure 9 depicts the breakdown of HVAC energy savings across different occupancy rates and patterns, resulting from reduced heat loads and an optimal setpoint with the fixed setback strategy. These averages are calculated considering different climates and building sizes.
As discussed in Section 4.1.1, extended unoccupied periods and decreased occupancy rates lead to reduced occupant heat loads, which in turn, result in greater energy savings. Compared to occupant heat loads, the impact of optimal setpoints and fixed setbacks on energy consumption across different patterns appears to be higher. Additionally, only across predominantly unoccupied patterns (6 h), significant differences across patterns can be identified, where most of the energy consumption is dictated by the optimal setpoint. In this scenario, the highest energy consumption is obtained from a pattern with three unoccupied hours early in the morning and three early in the afternoon, where a fixed setback is implemented to contrast high outdoor heat loads (44.67% energy savings, averaged across occupancy rates). Comparatively, the lowest energy consuming pattern involves three unoccupied hours during late morning and three during late afternoon, where outdoor heat loads are lower and optimal setpoints are implemented during high heat loads (48.82% energy savings, averaged across occupancy rates).

4.3. Optimal Temperature Setpoints and Setbacks Selection Strategy

4.3.1. The Impact of Occupancy Rates and Unoccupied Periods on Optimal Temperature Setpoints and Setbacks

Figure 10 depicts optimal setpoints and setbacks (calculated using Equation (4)) in relation to outdoor temperatures, occupancy rates, and unoccupied periods. The findings are only presented for the small building due to limited space and the stronger impact of outdoor temperatures on the optimal setpoint compared to larger buildings [25]. Using regularized linear regression, this study demonstrates a robust correlation in the form of a monotonic behavior between the optimal setpoint and outdoor conditions across different occupancy rates and unoccupied periods. In general, as outdoor conditions become warmer, the optimal setpoint tends to increase. However, compared to solely optimizing setpoints, the simultaneous selection of setbacks reduces the impact of occupancy rates and unoccupied periods on optimal setpoint selection. It is worth noting that a significant portion of optimal setpoints remains the same, regardless of the duration of unoccupied periods and occupancy rates. This is evident from the overlapping color-coded regression lines, representing different lengths of unoccupied periods.
As depicted in Figure 11 and in line with the findings of [25], the optimal setpoint exhibited its lowest value (i.e., 19.5 °C) for outdoor temperature below 5 °C, and it rose as outdoor temperatures increased. Beyond the outdoor temperature reaching 32 °C, the optimal setpoint shifted to the highest value assessed, which was 25.5 °C. Therefore, for an outdoor temperature below 5 °C and above 32 °C, it was observed that optimal setpoints (19.5 °C and 25.5 °C) remained unchanged regardless of fluctuations in occupancy rates and unoccupied periods. Nonetheless, when the outdoor temperature fell within the range of 5 °C to 32 °C, the optimal setpoints showed variability in response to shifts in occupancy conditions. Similarly, when outdoor temperatures fell below −5 °C, the optimal setback was determined to be the lowest evaluated value (17 °C), whereas temperatures above 22 °C indicated that the highest evaluated setback (28 °C) was optimal. Consequently, for outdoor temperatures below −5 °C and above 22 °C, optimal setbacks (17 °C and 28 °C) remained consistent regardless of changes in occupancy rates and unoccupied periods. However, for outdoor temperatures ranging between −5 °C and 22 °C, the optimal setbacks varied depending on varying occupancy conditions. In general, outdoor temperatures were observed to exert a greater influence on the selection of optimal setpoints and setbacks compared to variations in occupancy. It is worth noting that although the temperature range where occupancy affects the optimal selection of setbacks is the same as for setpoints, it is shifted towards cooler outdoor temperatures.

4.3.2. Energy Savings from Optimal Setpoints and Setbacks

Figure 12 illustrates the daily energy savings averaged across different climates, obtained from an optimal setpoint and setback strategy, for small, medium, and large building.
Total energy savings can be attributed to reduced occupant heat loads by up to 11.95%, 7.25%, and 9.73% for small, medium, and large building sizes, respectively. In addition, energy savings for an unoccupied period of 2 to 6 h from optimal selection of setpoints and setbacks range from 35.12% to 40.87% for a small building size, from 31.57% to 38.03% for a medium building, and from 47.28% to 51.39% for a large building. As reported for the optimal setpoint and fixed setback strategy, a larger office building can achieve higher daily average energy savings since it is less sensitive to occupant heat loads and heat transfer from outdoors. Furthermore, energy savings increase at lower occupancy rates and longer unoccupied periods. On average across building sizes and occupancy rates, 45.65%, 38.34%, and 49.74% total energy savings can be obtained for an unoccupied period of 2, 4, and 6 h, respectively. In total, the optimal setpoint and setback strategy can, on average, achieve 43.86% energy savings, distributed as 5.78% from reduced occupant heat loads and 38.08% from the setpoint and setback selection strategy. This represents an increase of 27.08% compared to fixed setpoints and setbacks.
Figure 13 illustrates the HVAC energy savings resulting from variations in occupancy rates and patterns, attributable to reduced heat loads and the optimal setpoint and setback strategy. These averages are calculated considering various climates and building sizes.
As discussed in Section 4.1.1, prolonged periods of unoccupancy and reduced occupancy rates lead to diminished occupant heat loads, which in turn, contribute to heightened energy savings. Compared to the optimal setpoints and fixed setback strategy, the impact of optimal setpoints and setbacks on energy consumption across different patterns appears to be around 9.21% larger. However, similarly to all three setpoints and setbacks election strategies, only across predominantly unoccupied patterns (6 h) can significant differences across patterns be identified. In this situation, it is evident that frequent switching between optimal setpoint and setback during periods of high heat loads leads to reduced energy savings. This is due to the short on–off cycles of the HVAC system, which causes destabilization. This effect is particularly noticeable in a pattern where there is a short 1 h unoccupied period sandwiched between two longer 3 h occupancy periods. In comparison to a different pattern characterized by 3 h unoccupied periods early in the morning and afternoon, which allows sufficient time for the system to reach and maintain the desired temperature, the daily energy savings are 9.33% lower.

4.4. Comparing Fixed Setpoints and Setbacks, Optimal Setpoints and Fixed Setbacks, and Optimal Setpoints and Setbacks

Figure 14 illustrates the variation in setpoints and setbacks across outdoor temperatures for the three setpoint and setback selection strategies evaluated in this study: fixed setpoint and setback (blue line), optimal setpoint and fixed setback (red line), and optimal setpoint and setback (green line), averaged by climate and building size. In addition, the light and dark grey areas depict the variation due to occupancy rates and unoccupied periods. While fixed setpoints and setbacks remain constant across outdoor temperatures, both strategies involving optimization result in increasing optimal setpoints and setbacks as the outdoor environment becomes warmer. However, the impact of occupancy on optimal setpoints varies depending on whether the setbacks are fixed or optimized. When fixing the setback, reduced occupant-generated heat (25% occupancy rate) resulted in an average difference of 1 °C in optimal setpoints compared to a fully occupied building (100% occupancy). When the outdoor temperature was below 17 °C, optimal setpoints were lower than the ones at full occupancy since heating occurred. Contrarily, when the outdoor temperature exceeded 17 °C, optimal cooling setpoints were higher than when at 100% occupancy. Longer unoccupied periods instead resulted in an average difference of 2 °C compared to occupancy all the time. The optimal setpoints for an unoccupied period of 6 h were found to be, on average, 2 °C lower (heating) or higher (cooling) compared to the optimal setpoint identified for no unoccupied periods. When both setpoints and setbacks were simultaneously optimized, the effect of varying occupancy on optimal setpoints was lower compared to fixing the setbacks. Therefore, when in combination with optimal setbacks, optimal setpoints show less variation across different occupancy rates and unoccupied periods. Hence, regardless of the length of unoccupied periods and occupancy rates, a substantial portion of the optimal setpoints remains identical. While the influence of occupancy rates on optimal setpoint selection appears to be negligible, the difference in optimal setpoints during longer unoccupied periods is reduced to 1 °C, on average, compared to 2 °C observed when the setbacks are fixed. Note that the maintenance practices of HVAC systems have a substantial impact on optimal setpoints and setbacks. In fact, regular maintenance prevents malfunctions and ensures operation at peak efficiency and better adherence to the identified optimal setpoints and setbacks. Maintenance practices often involve calibrating sensors and controls. Accurate sensors are critical for maintaining the desired setpoints, as they inform the HVAC system about the current outdoor environmental conditions and occupancy. Reliable operation ensures that these sensors function correctly, preventing inaccuracies that could lead to deviations from optimal setpoints once indoor and outdoor conditions change.
Figure 15 presents the trends of HVAC energy savings across patterns for each setpoint and setback selection strategy, averaged across climates and building sizes. In general, longer unoccupied periods and lower occupancy rates lead to increased energy savings, irrespective of the chosen selection strategy. The trends of energy savings across patterns with continuous or intermittent occupancy remain consistent for different selection strategies for unoccupied periods lasting up to 4 h. However, when considering the same occupancy pattern, the energy savings achieved through optimal setpoints and setbacks are greater compared to optimal setpoints with fixed setbacks or fixing setpoints and setbacks. In this scenario, occupancy rates play a significant role in energy consumption. In fact, a lightly occupied building (25% occupancy rate) with optimal setpoints and fixed setbacks can obtain equivalent energy saving values to a fully occupied building (100% occupancy rate) where setpoints and setbacks are optimally selected. Contrarily, during a longer unoccupied period (6 h), the impact of occupancy rates becomes negligible, and greater variations in energy savings can be observed across patterns. In this scenario, different selection strategies result in different energy consumption across patterns. In fact, a pattern with three unoccupied hours early in the morning and three early in the afternoon is the highest or lowest energy consuming when fixing or optimally selecting the setbacks, respectively. Therefore, the selection of selection strategy affects energy consumption across patterns due to the interactions between indoor and outdoor heat loads. In addition, rapid changes in setpoints and setbacks diminish energy savings by up to 9.33% due to the short on–off cycle of HVAC systems which causes destabilization.
Figure 16 demonstrates the energy savings from reduced occupant heat loads and the additional savings derived from the three setpoint and setback selection strategies investigated in this paper. While occupant heat loads results in a 5.48% energy reduction for lower occupancy rates and during longer unoccupied periods, the conventional fixed setpoint and setback selection strategy provides an additional 11.80% energy savings. Furthermore, optimal setpoint selection provides an additional 34.36% savings, and simultaneous optimization of setpoints and setbacks provides an additional 38.08%, averaged across building sizes and climates. Implementing adaptive predictive controls in HVAC systems enables dynamic adjustments of optimal setpoints and setbacks based on forecasted occupancy and weather, potentially leading to additional energy savings. Adaptive control mechanisms, integrating machine learning algorithms, continuously learn from historical data to optimize energy efficiency over time. These mechanisms facilitate proactive adjustments like pre-cooling or pre-heating spaces based on occupancy forecasts and prioritizing areas with anticipated high occupancy, directing energy resources where needed and scaling back in less utilized space. The integration of IoT devices and real-time data analysis enhances the refinement of optimal setpoints and setbacks. Continuous monitoring of weather conditions allows dynamic adjustments, while real-time occupancy data enable the system to respond based on current occupancy levels. Machine learning algorithms process real-time data, facilitating continuous learning and adaptation for optimal setpoints. Feedback loops enable ongoing monitoring, and automatic adjustments are made in response to deviations, ensuring ongoing optimization and flexibility in unpredictable situations.

4.5. Optimal Temperature Setpoint Tool

This paper presents an interactive graphical interface, the Optimal Temperature Setpoint Tool, to facilitate practical applications. As depicted in Figure 17, the online tool allows users to identify the optimal setpoint based on occupancy rates, patterns, and outdoor air temperature values. Building stakeholders can select: (1) the desired temperature scale for results visualization (Celsius—°C and Fahrenheit—°F), (2) the climate zone (from 0A to 8), (3) the patterns of unoccupied periods (14 unoccupied patterns across five unoccupied periods—0 h, 1 h, 2 h, 4 h, and 6 h, as described in Figure 2), (4) the occupancy rate (from a lightly occupied, 25%, to a fully occupied building, 100%), (5) and the outdoor air temperature value based on the climate zone. With respect to these inputs, the tool returns the temperature setpoint that minimizes energy consumption (Equation (1)). Multiple scenarios with various inputs can be tested and the results can be downloaded as a .csv file.

5. Limitations and Recommendations for Future Research

Although this paper explored a relatively wide-ranging set of occupancy rates and patterns (4 × 16 = 64 occupancy scenarios), they represent a finite number of scenarios due to the computational expense of energy simulation. In addition, they represent proxies for building occupancy and may not fully capture the nuances of real-world occupancy dynamics and patterns within buildings. In reality, the rate of occupancy in the zones and the occupied or unoccupied patterns are not constant but vary stochastically, dictated by occupant behaviors. Furthermore, although the study simulates three different building sizes (small, medium, and large) across 17 climate zones, the extent to which findings can be generalized across diverse building types is limited to office settings. Moreover, exhaustive search algorithms are computationally intensive. The feasibility of implementing such an algorithm in real-world HVAC control systems may be challenging due to potential time and resource constraints. In addition, this study assumed uniform temperature setpoints/setbacks across all building zones. However, a more detailed spatial and temporal resolution could increase energy savings and might enhance the effectiveness of HVAC operation. For example, heightened solar heat gain in a zone positioned at a building’s perimeter could influence the optimal setpoint and setback. Similarly, the heat loads from diverse occupancy rates, patterns, appliances, and lighting systems may vary among different zones based on their unique end uses. Furthermore, it could be possible to compute optimal values on an hourly basis or group them according to specific periods, such as “seasons”. Further research is needed to define periods based on similar variations in outdoor air temperatures. Nevertheless, when making decisions about the selection of spatial and temporal granularity, considering the balance between the controller’s complexity and the potential energy savings is of utmost importance.
While this paper serves a basis to provide a systematic methodology to study the of impact of varying occupancy on optimal setpoints and setbacks, future research could focus on specific use cases and develop and implement techniques that can efficiently select optimal setpoints and setbacks depending on outdoor weather and occupancy variability. Given that exhaustive search methods are impractical for real building HVAC controllers, we anticipate the emergence of data-driven algorithms for HVAC operation that rely on minimal data prerequisites. Further research efforts will focus on the development of a data-driven algorithm based on occupancy and weather and its deployment in a real-world office setting. The findings will be compared against simulated data to provide insights of the actual energy consumption data and potential savings. Adaptive predictive control algorithms based on machine learning will be incorporated in future research. This will include the forecasting of occupancy and weather to enhance the responsiveness of HVAC systems and the ability to learn from historical data to refine predictions and adapt over time. By leveraging IoT devices and real-time data analysis, building management systems can create a responsive and adaptive environment that not only validates optimal setpoints but also continually refines them based on evolving conditions. Further research avenues will include a comprehensive assessment of maintenance practices, considering their influence on the long-term reliability of HVAC systems, to ascertain practical viability of the optimization of setpoints and setbacks based on outdoor weather and occupancy. As maintenance plays a pivotal role in sustaining the efficiency and functionality of HVAC systems over time, this evaluation will involve a detailed examination of how these systems perform under varying conditions and stresses based on real-world scenarios. Furthermore, the assessment under recommended setpoints and setbacks will provide valuable insights into potential challenges and practical implications. Integrating optimal setpoint and setback strategies within a broader EMS necessitates a holistic evaluation to identify and capitalize on synergies, while also addressing potential conflicts with other energy-saving strategies and operational considerations. This approach, ensuring a comprehensive and optimized energy management solution, will be investigated in future research.

6. Conclusions

This study systematically compared the energy-saving potential between fixed and optimal HVAC temperature setpoints and setbacks under typical occupancy scenarios. Three strategies were examined: conventional fixed setpoints and setbacks, optimal setpoints with fixed setbacks, and optimal setpoints and setbacks. The investigation considered four occupancy rates (25%, 50%, 75%, 100%) and 14 patterns (unoccupied periods from 0 to 6 h) to reflect workplace flexibility and remote working trends. Seven setpoints (19.5–25.5 °C at 1 °C intervals) were explored during occupied periods, with two heating (17 °C and 19 °C) and two cooling (26 °C and 28 °C) setbacks during unoccupied periods. U.S. DOE reference models for small, medium, and large office buildings were simulated for 17 climate zones to account for a wide variety of outdoor air temperatures. An exhaustive search algorithm was adopted to determine the optimal setpoint and setback temperature based on variations in occupancy and weather, i.e., setpoint and setback that minimizes HVAC energy usage during occupied and unoccupied periods, respectively. Energy reduction due to occupant heat loads and the additional savings from each setpoint and setback selection strategy were calculated in comparison to the sole implementation of fixed setpoints regardless of flexible occupancy. The primary findings are outlined as follows:
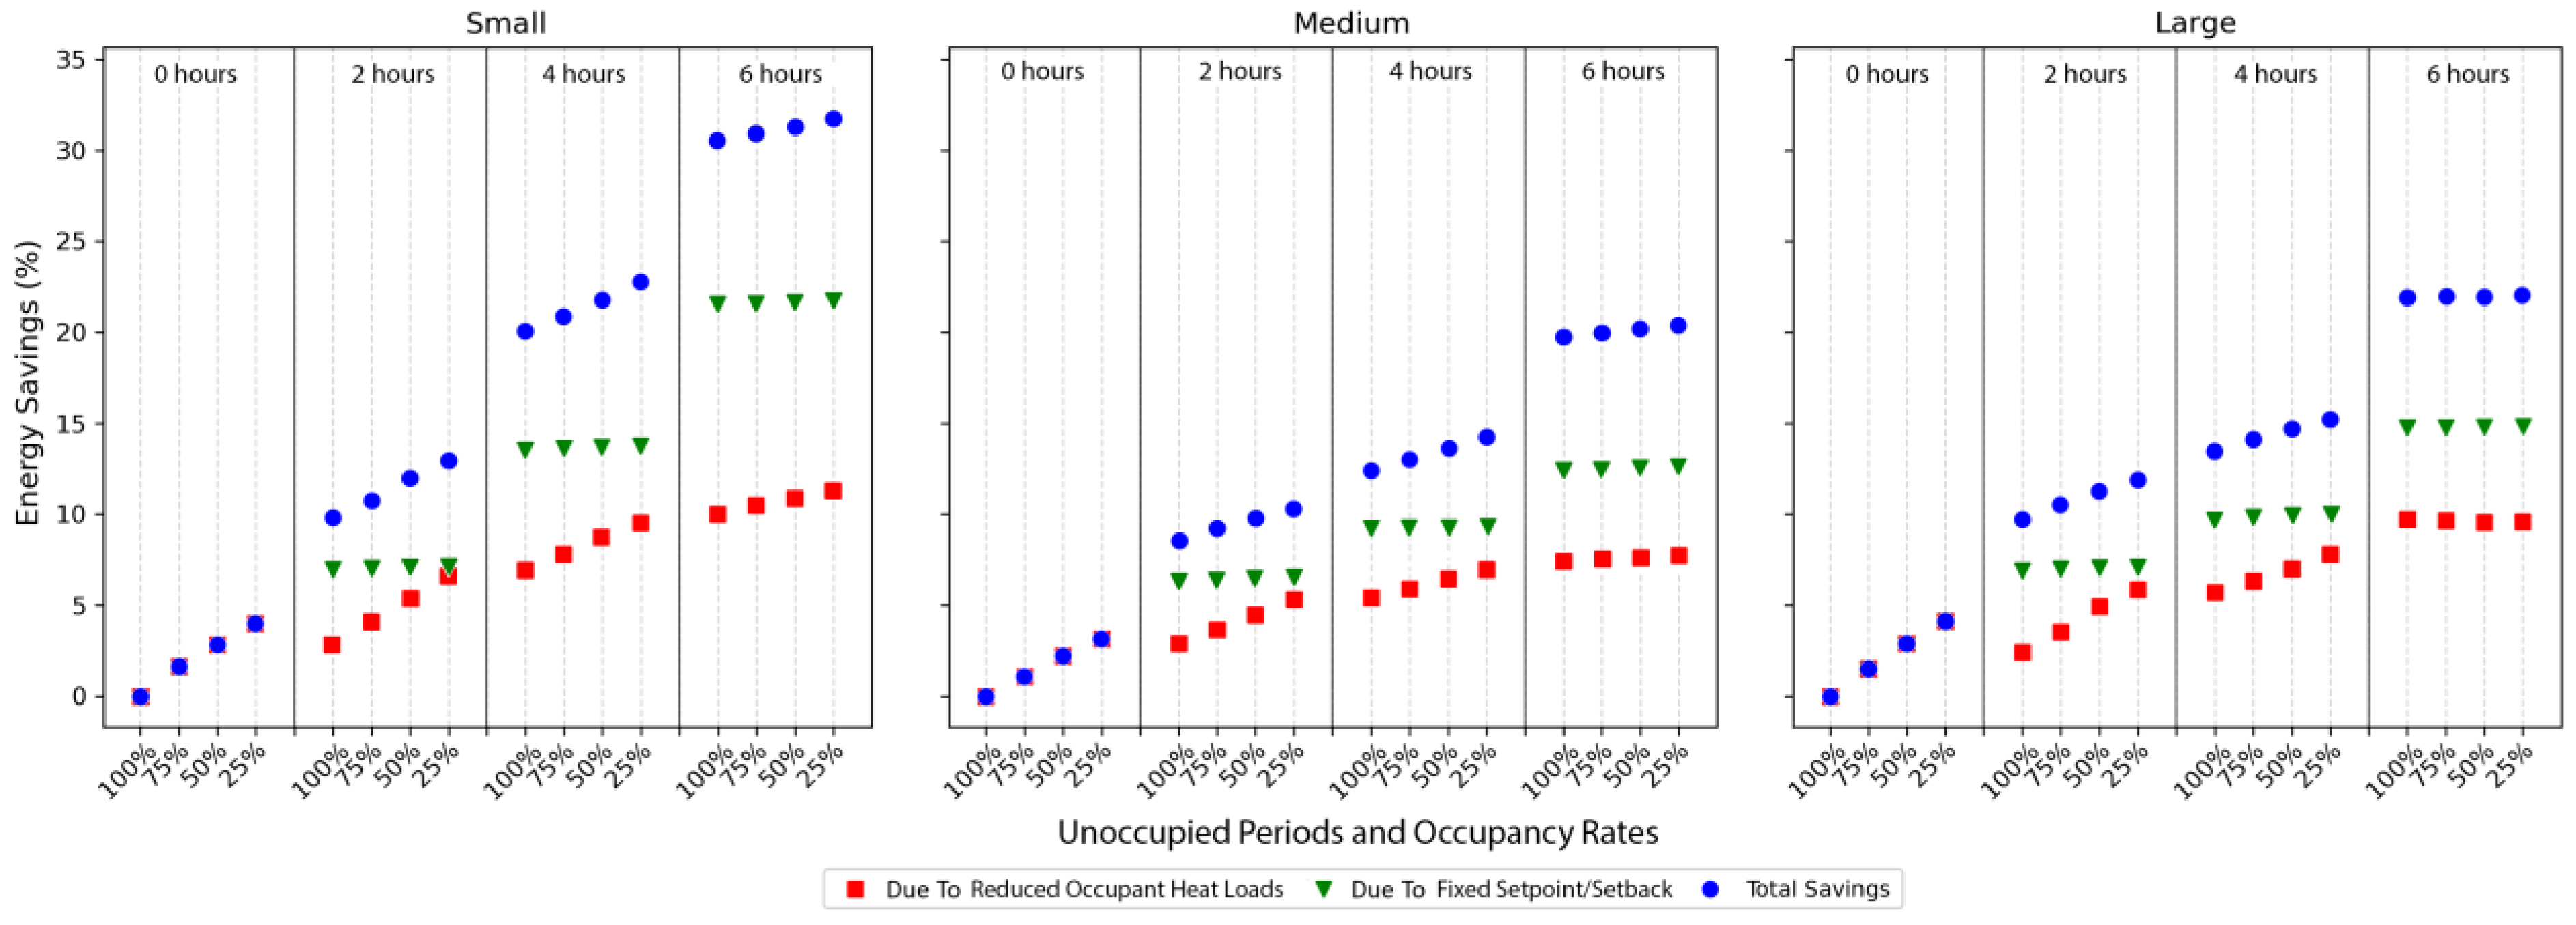
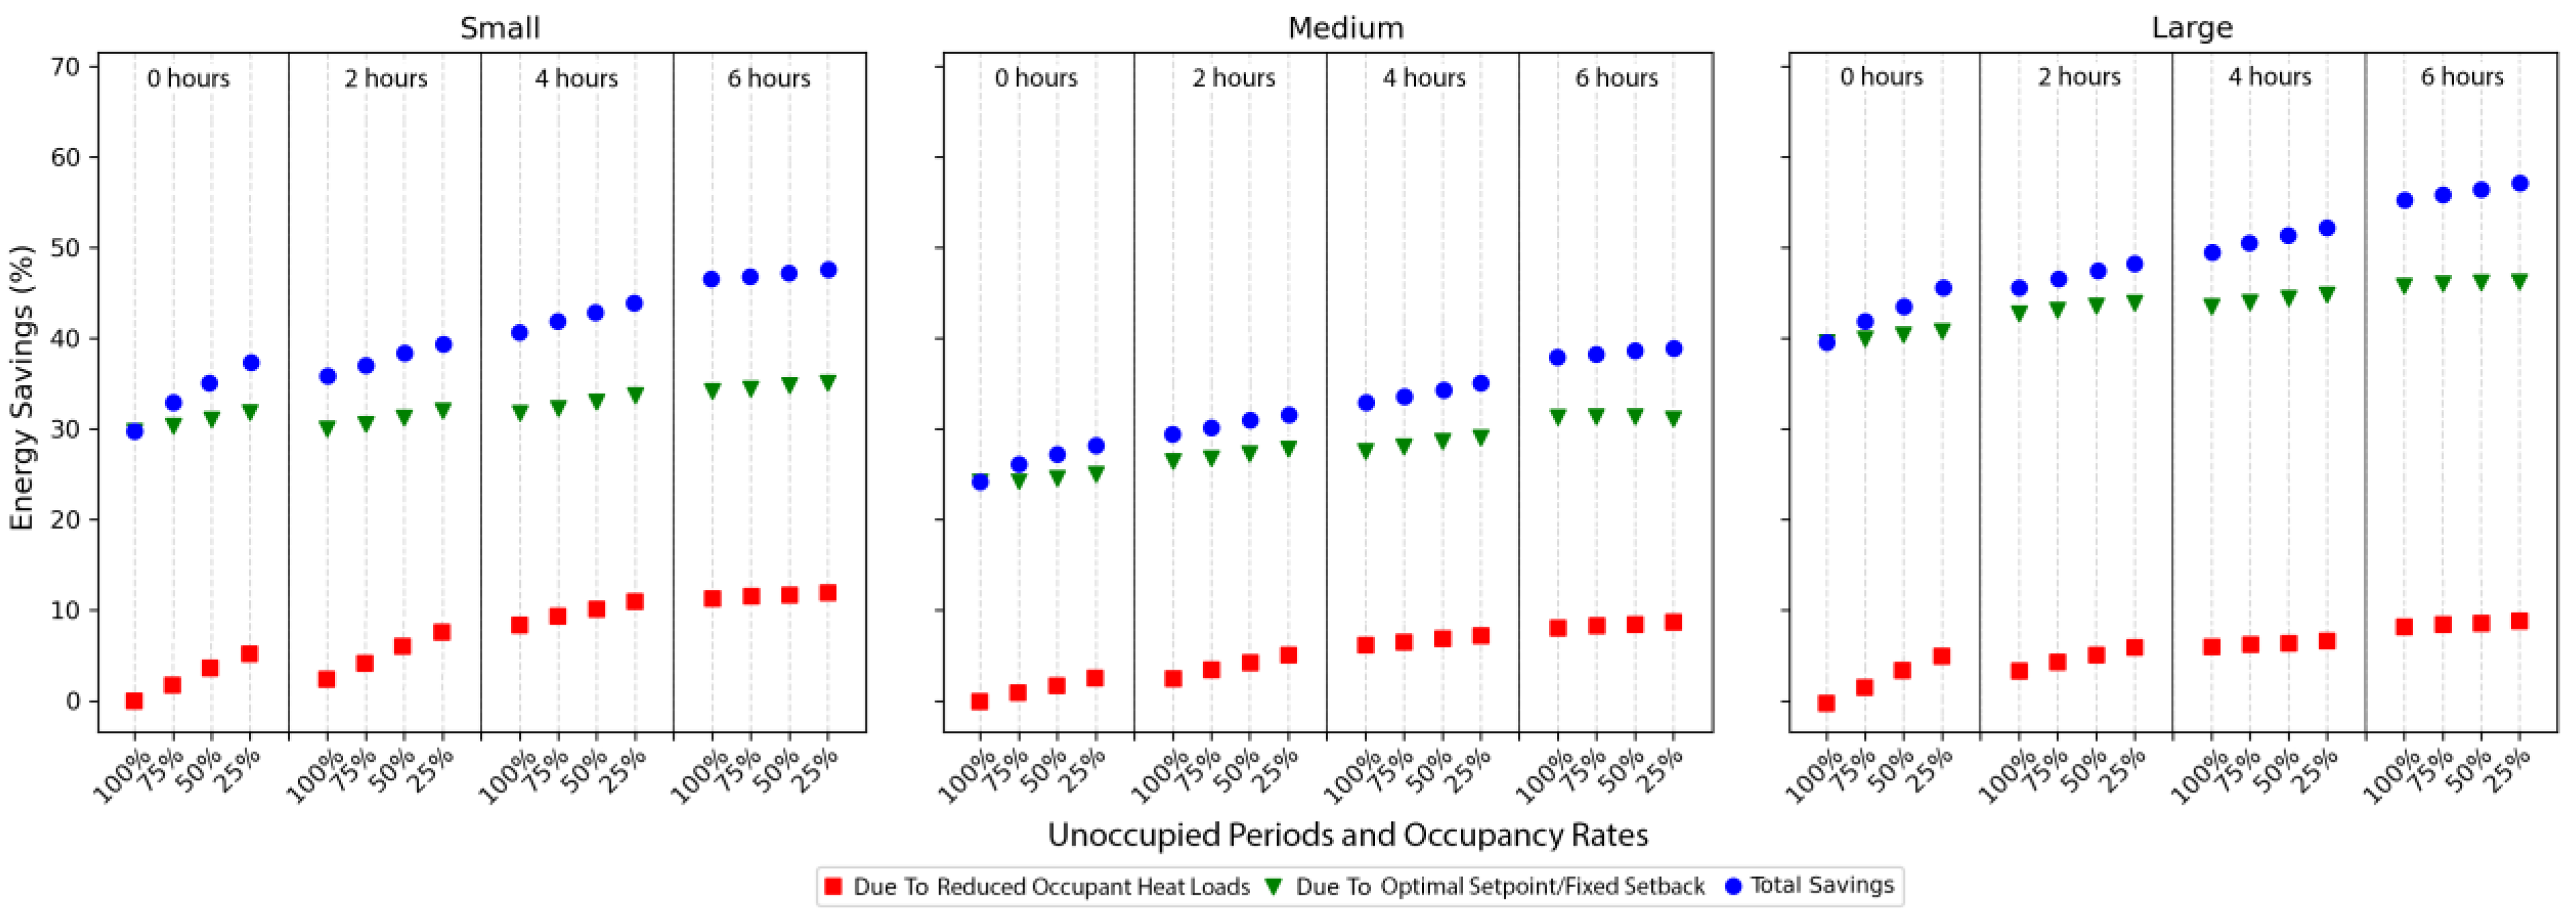
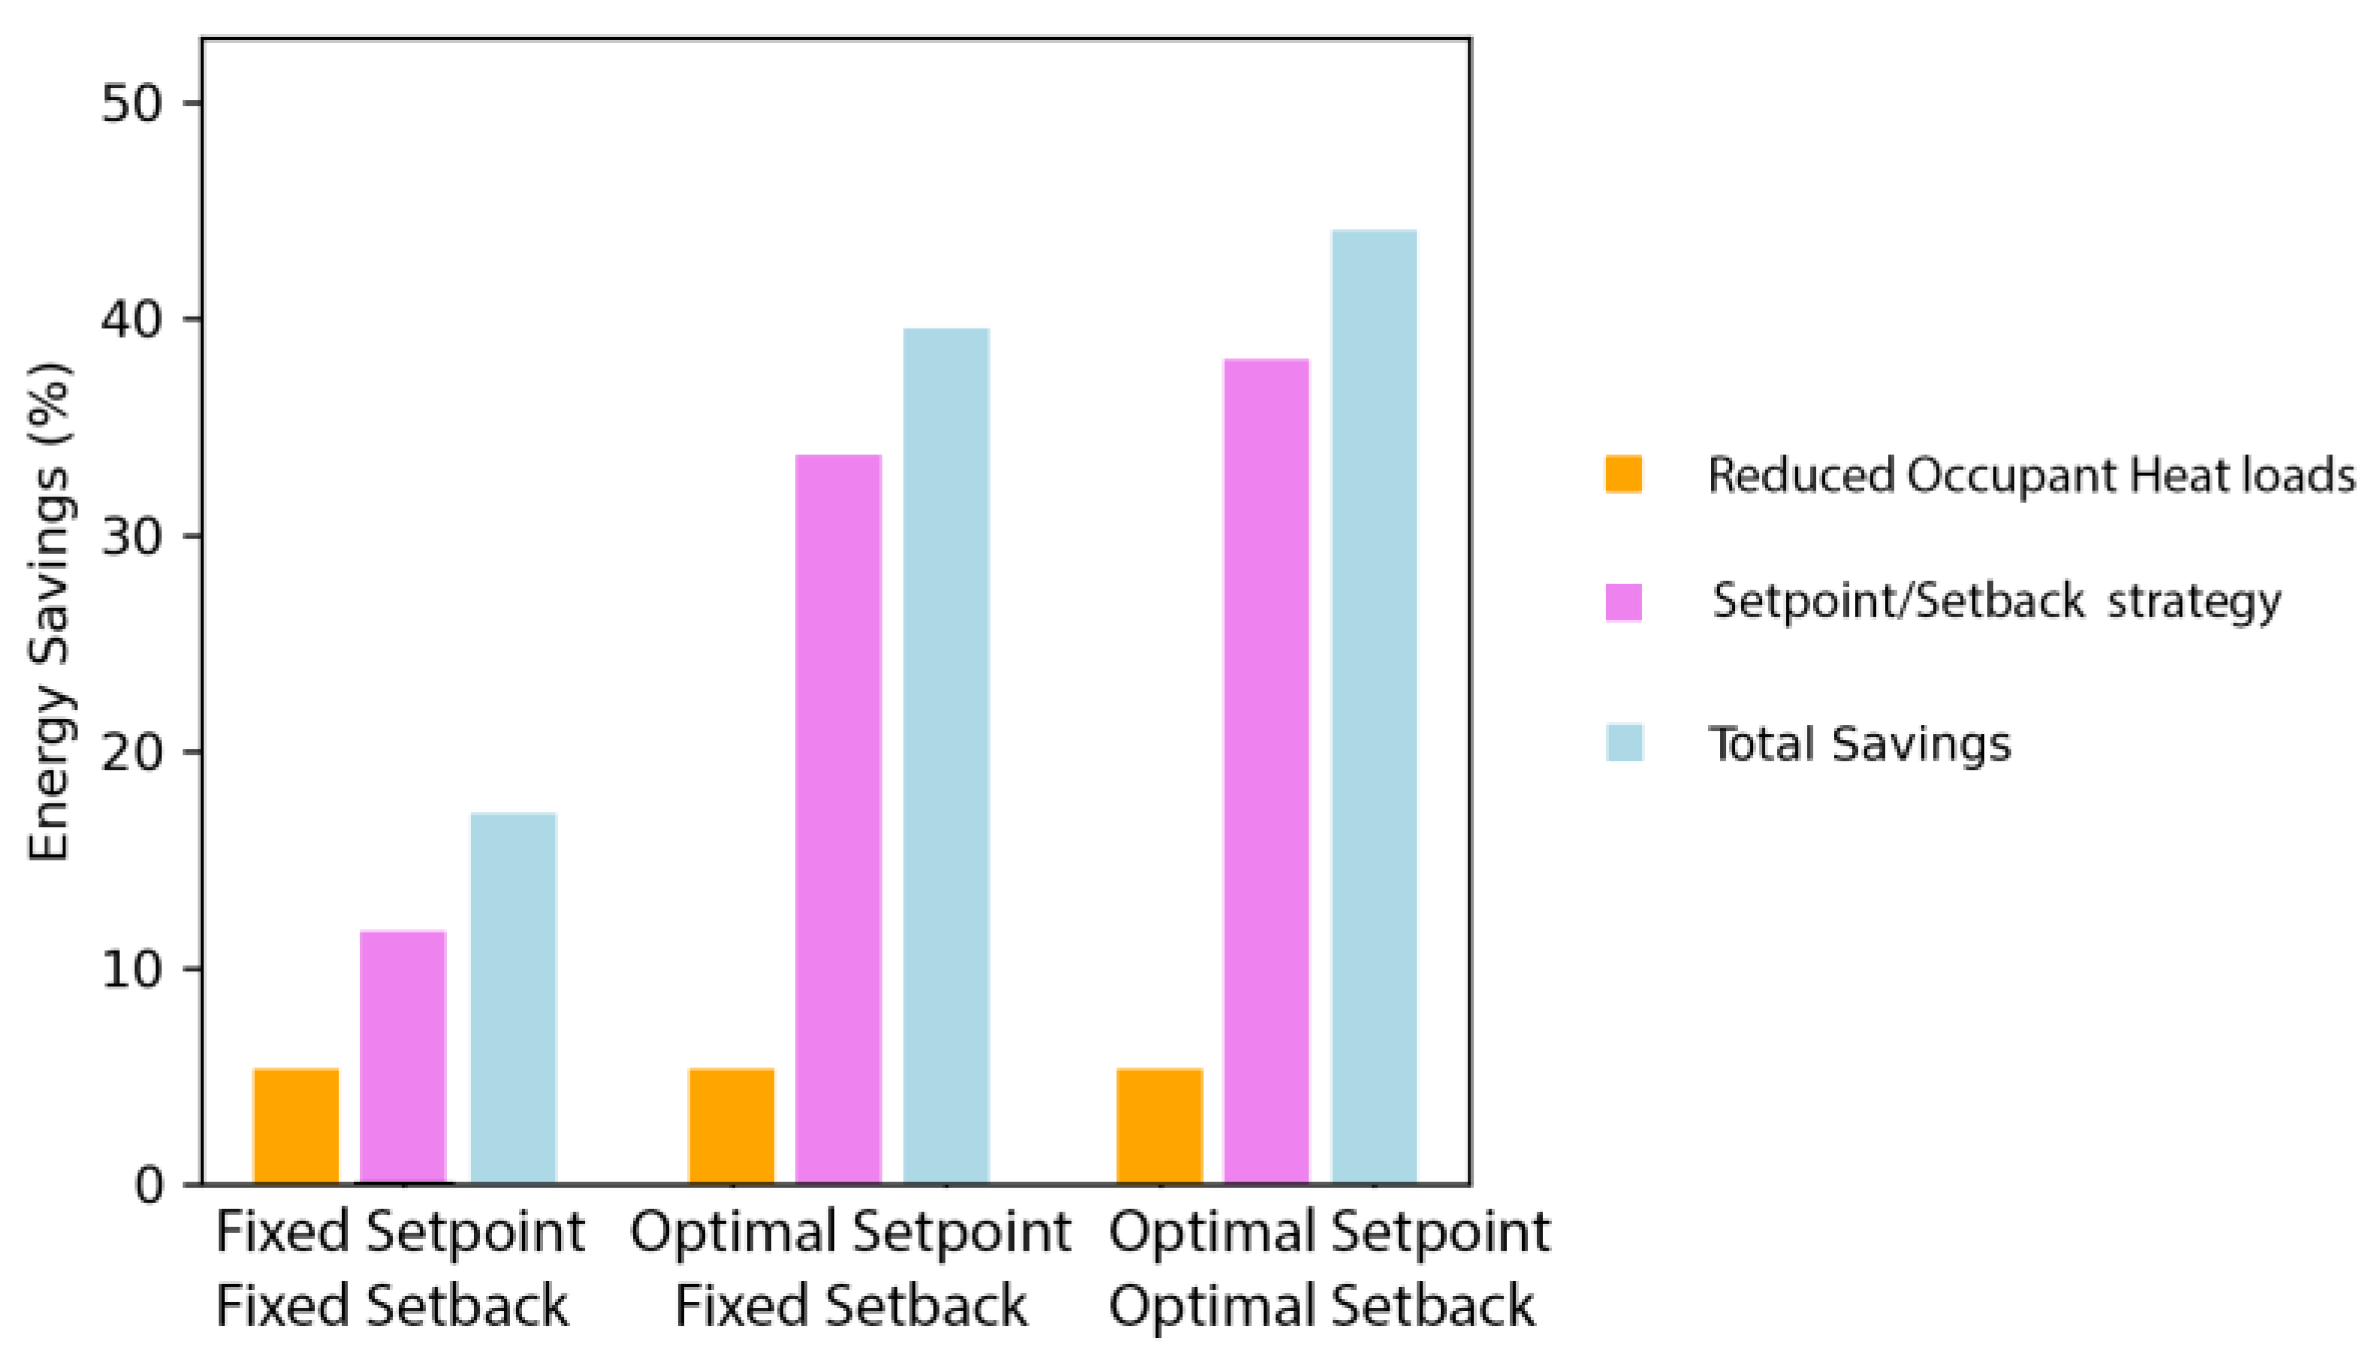
  • Occupant heat loads results in a 5.48% energy reduction for lower occupancy rates and during longer unoccupied periods. In addition, a conventional fixed setpoint and setback selection strategy provides 11.80% energy savings, optimal setpoint selection provides 34.36% savings, and simultaneous optimization of setpoints and setbacks provides 38.08% savings.
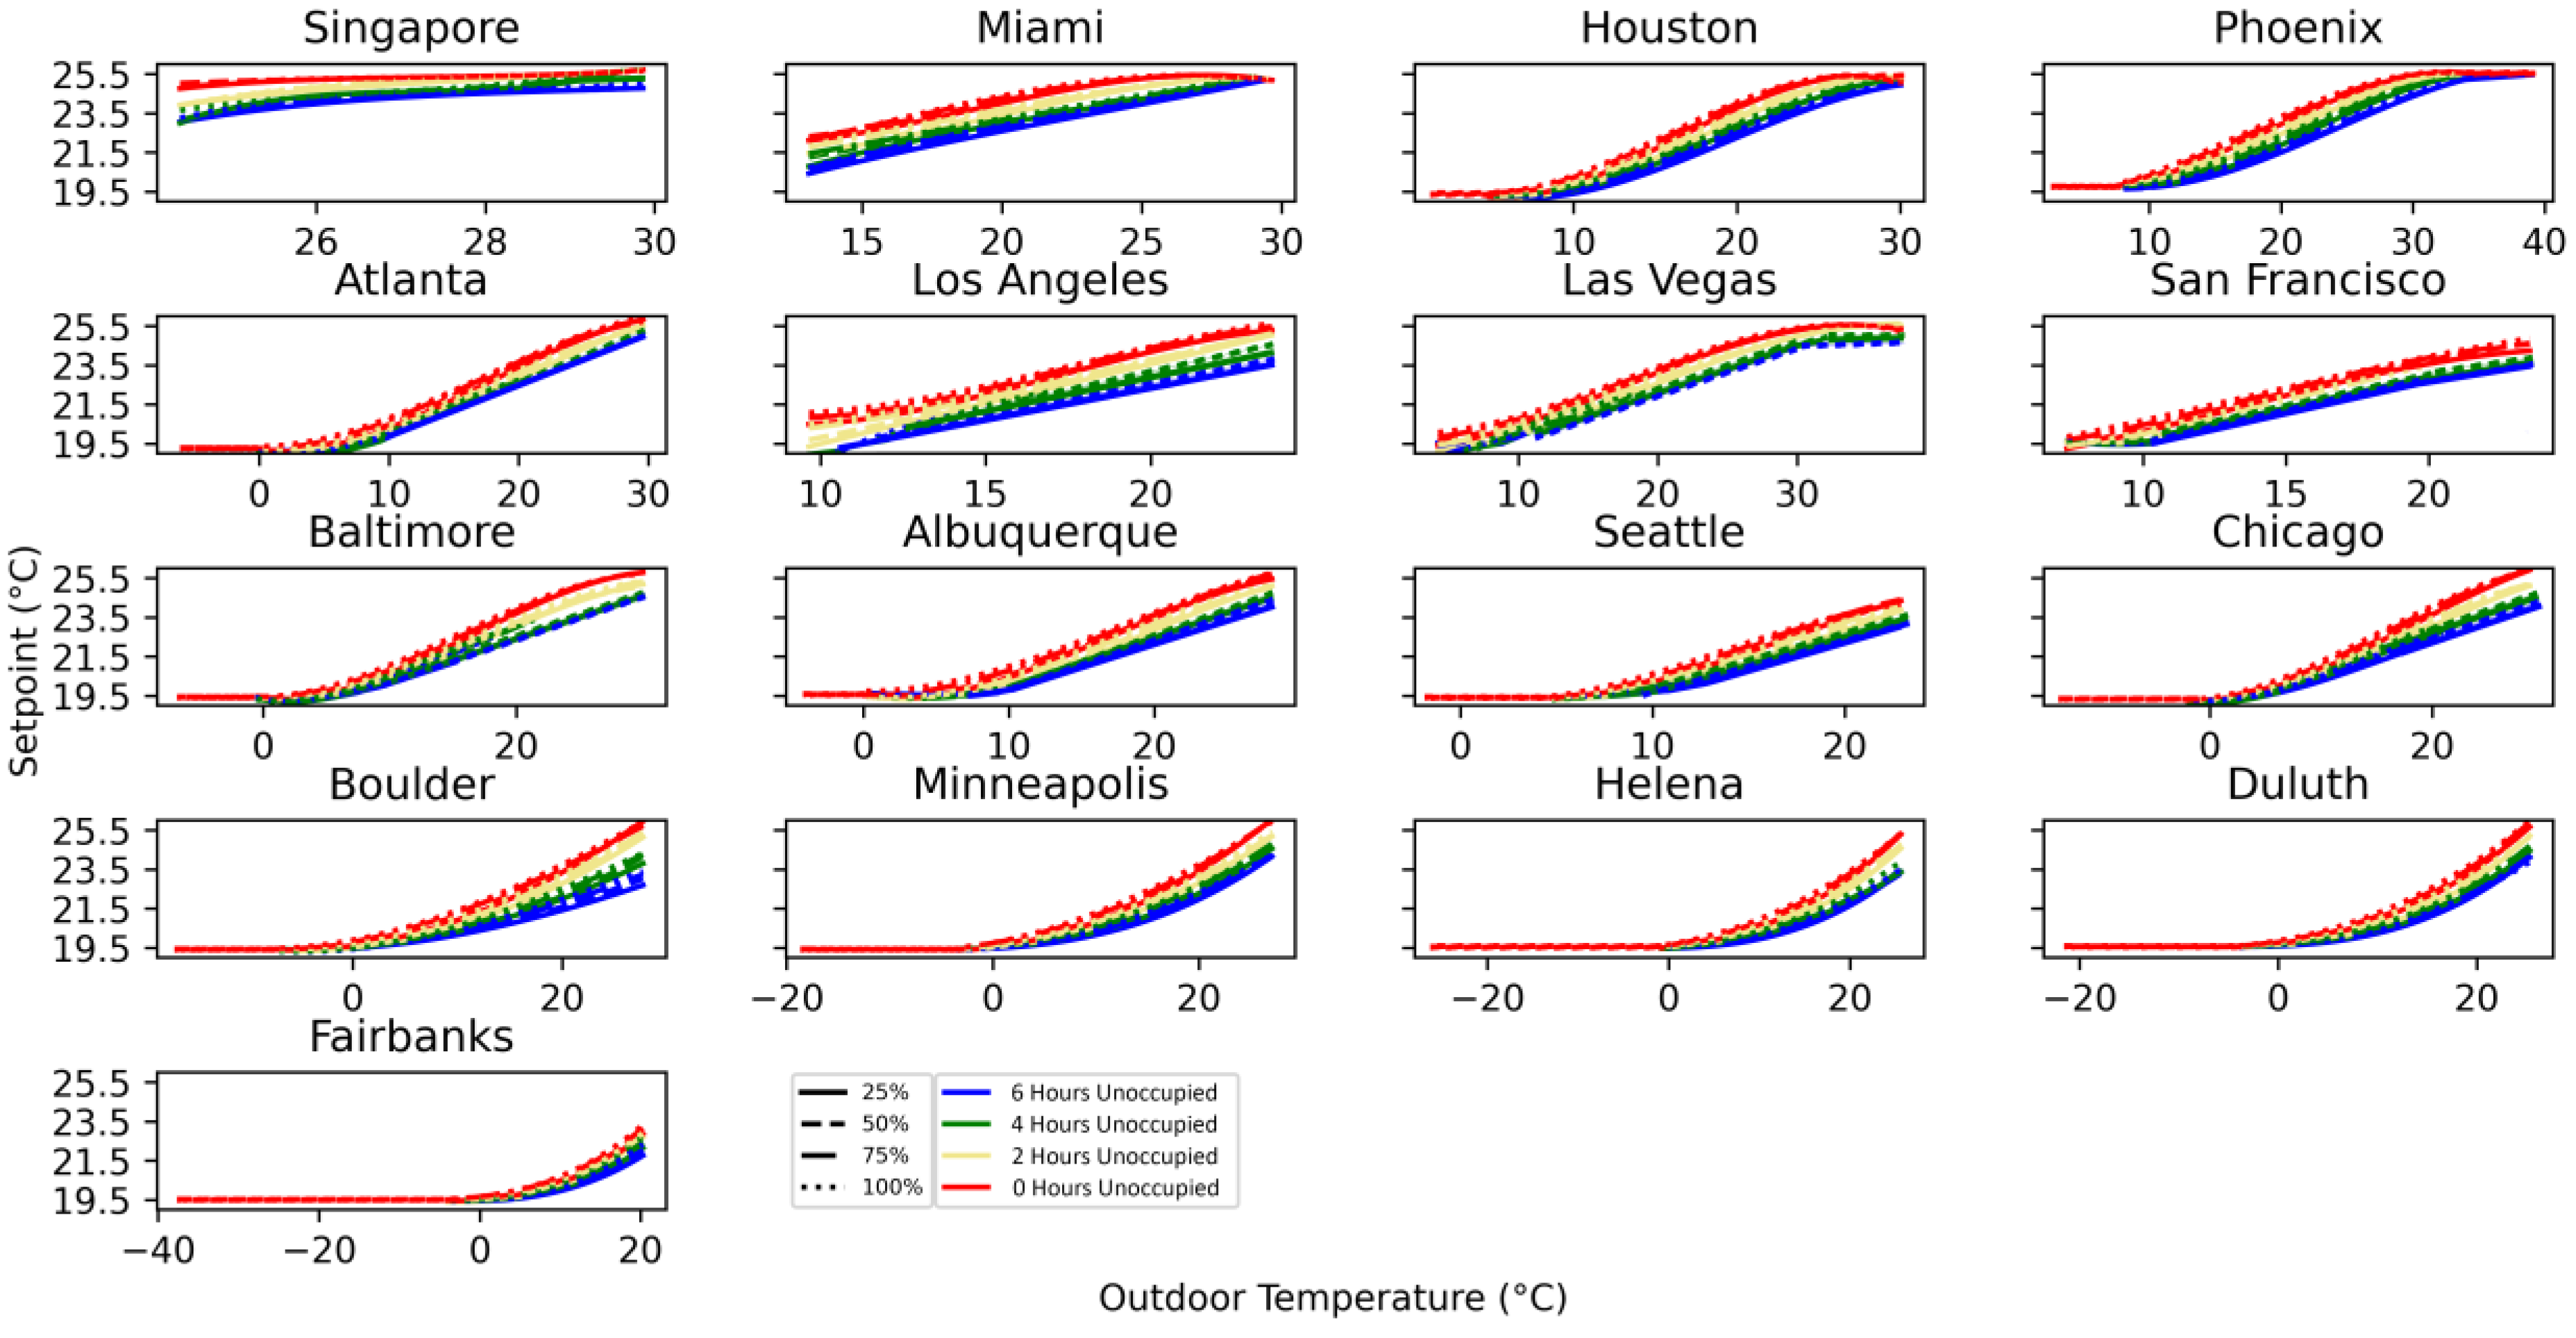
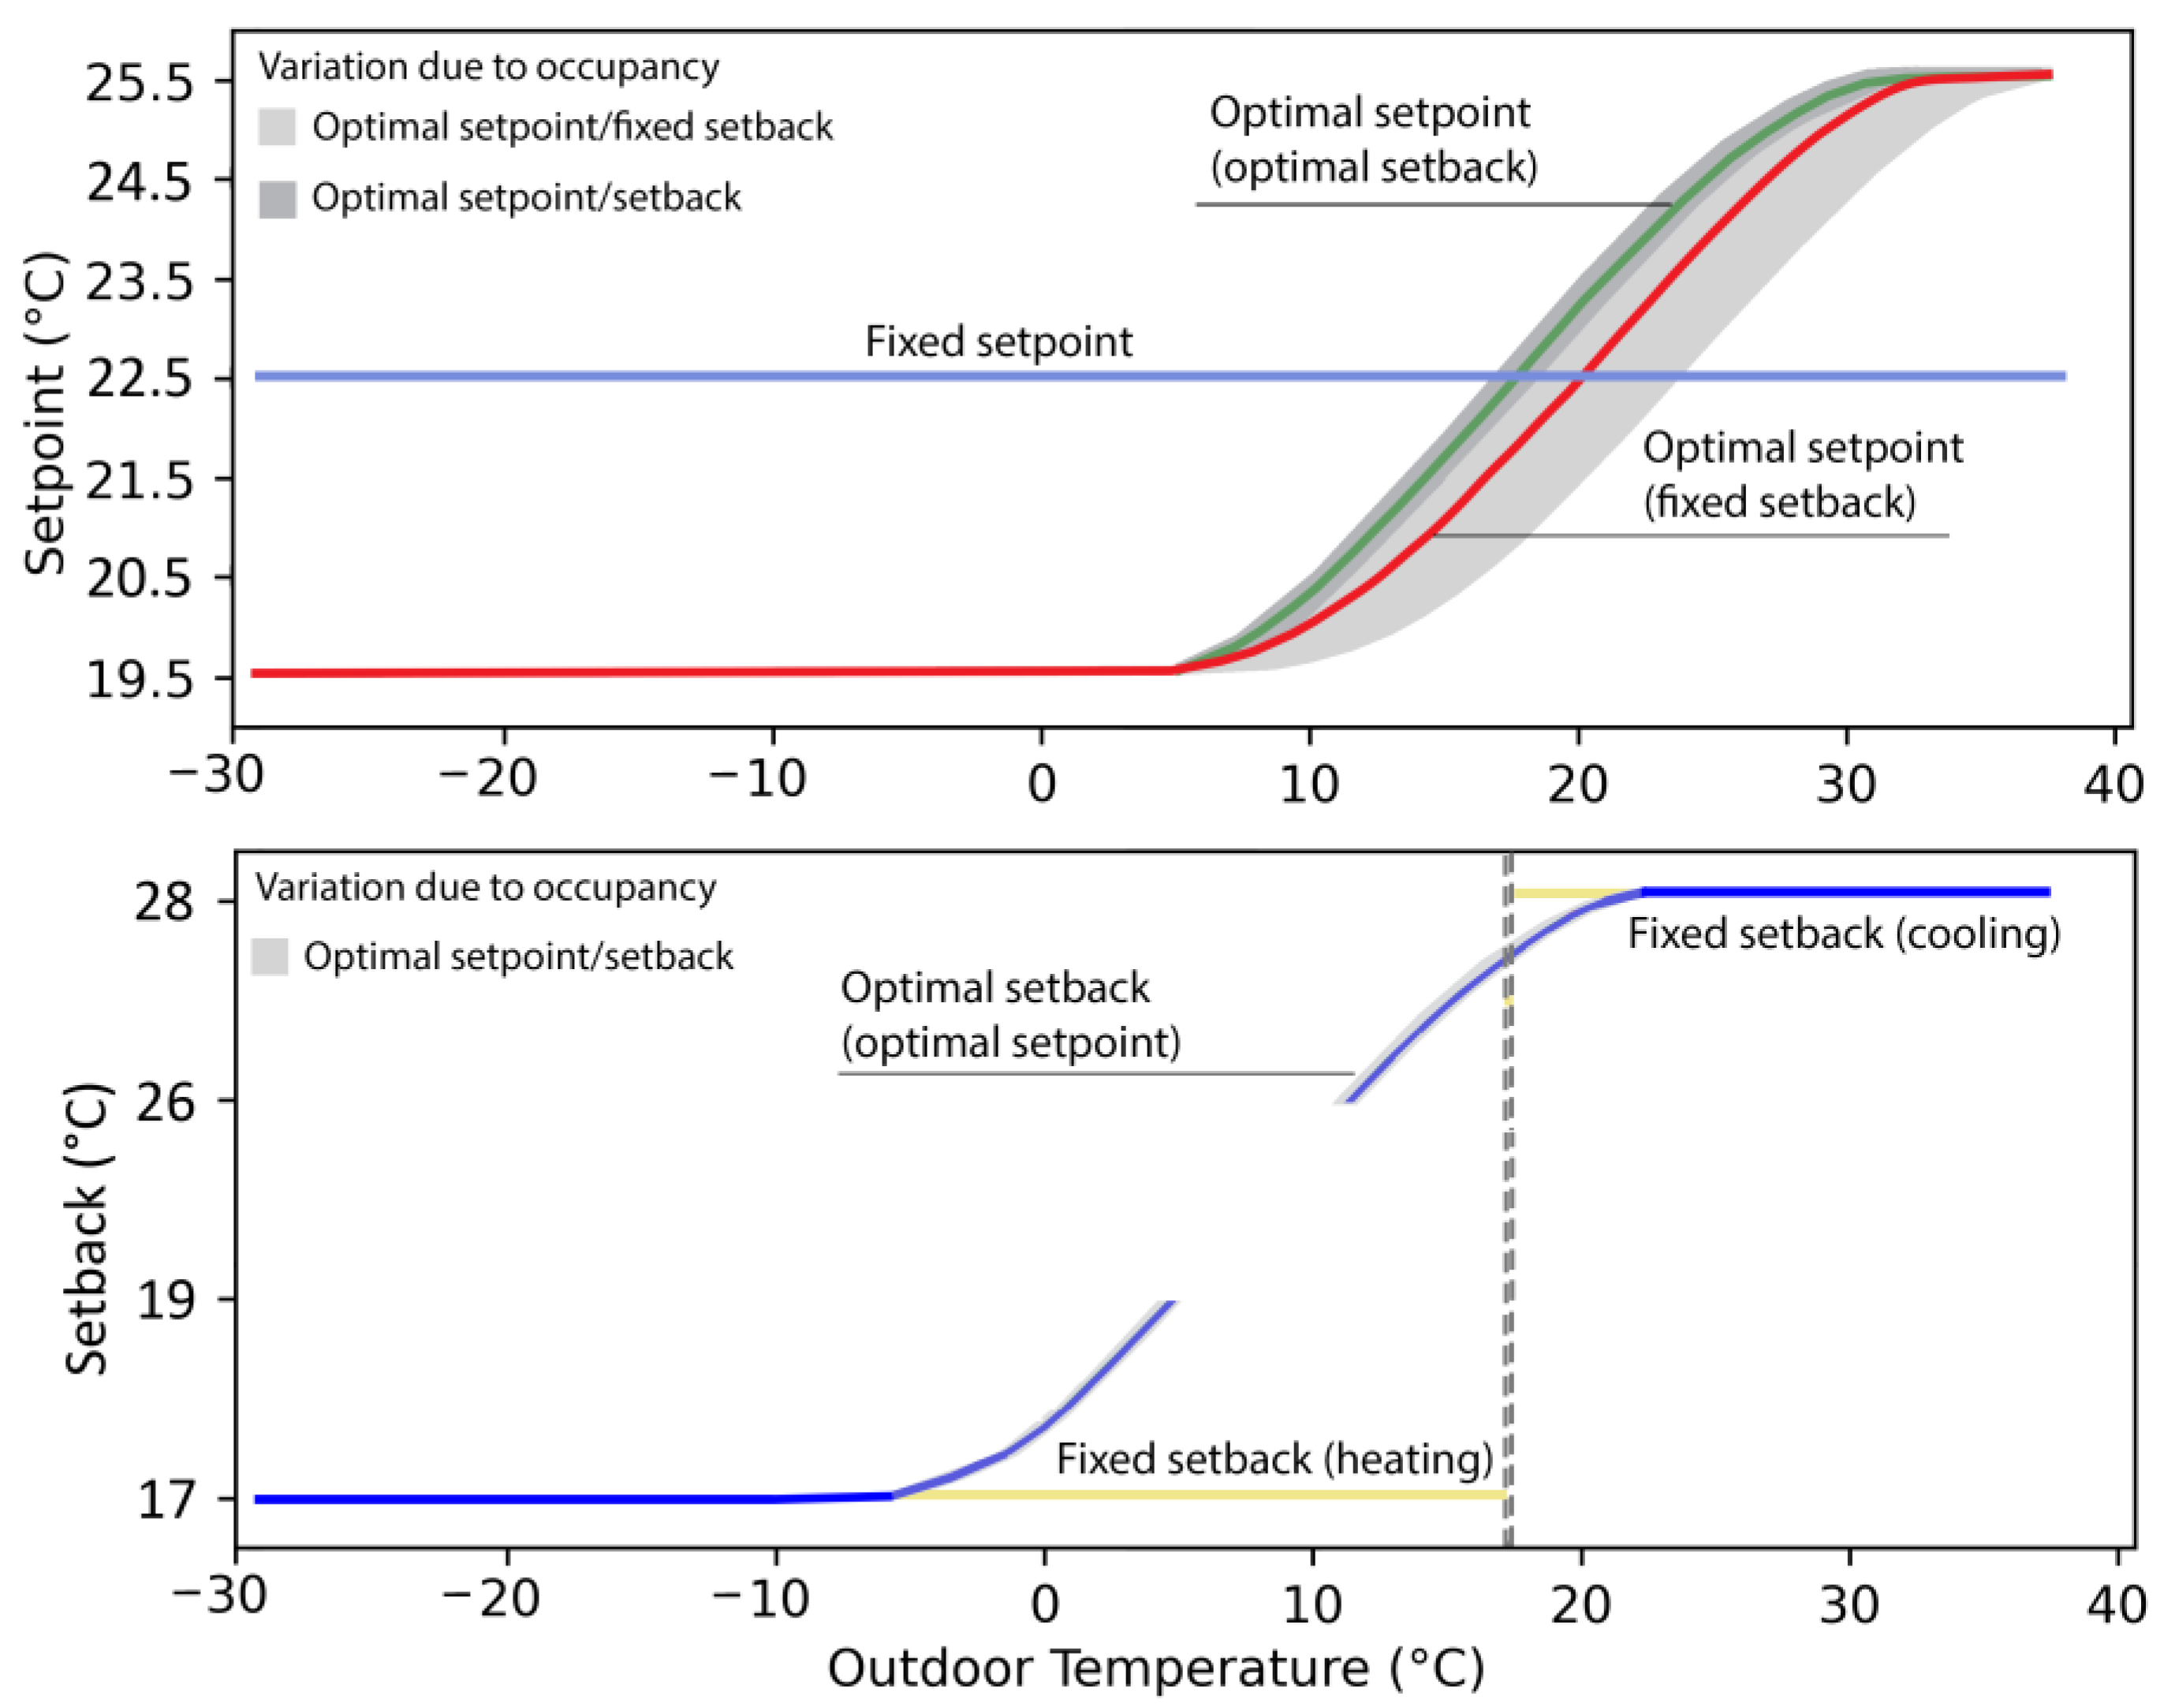
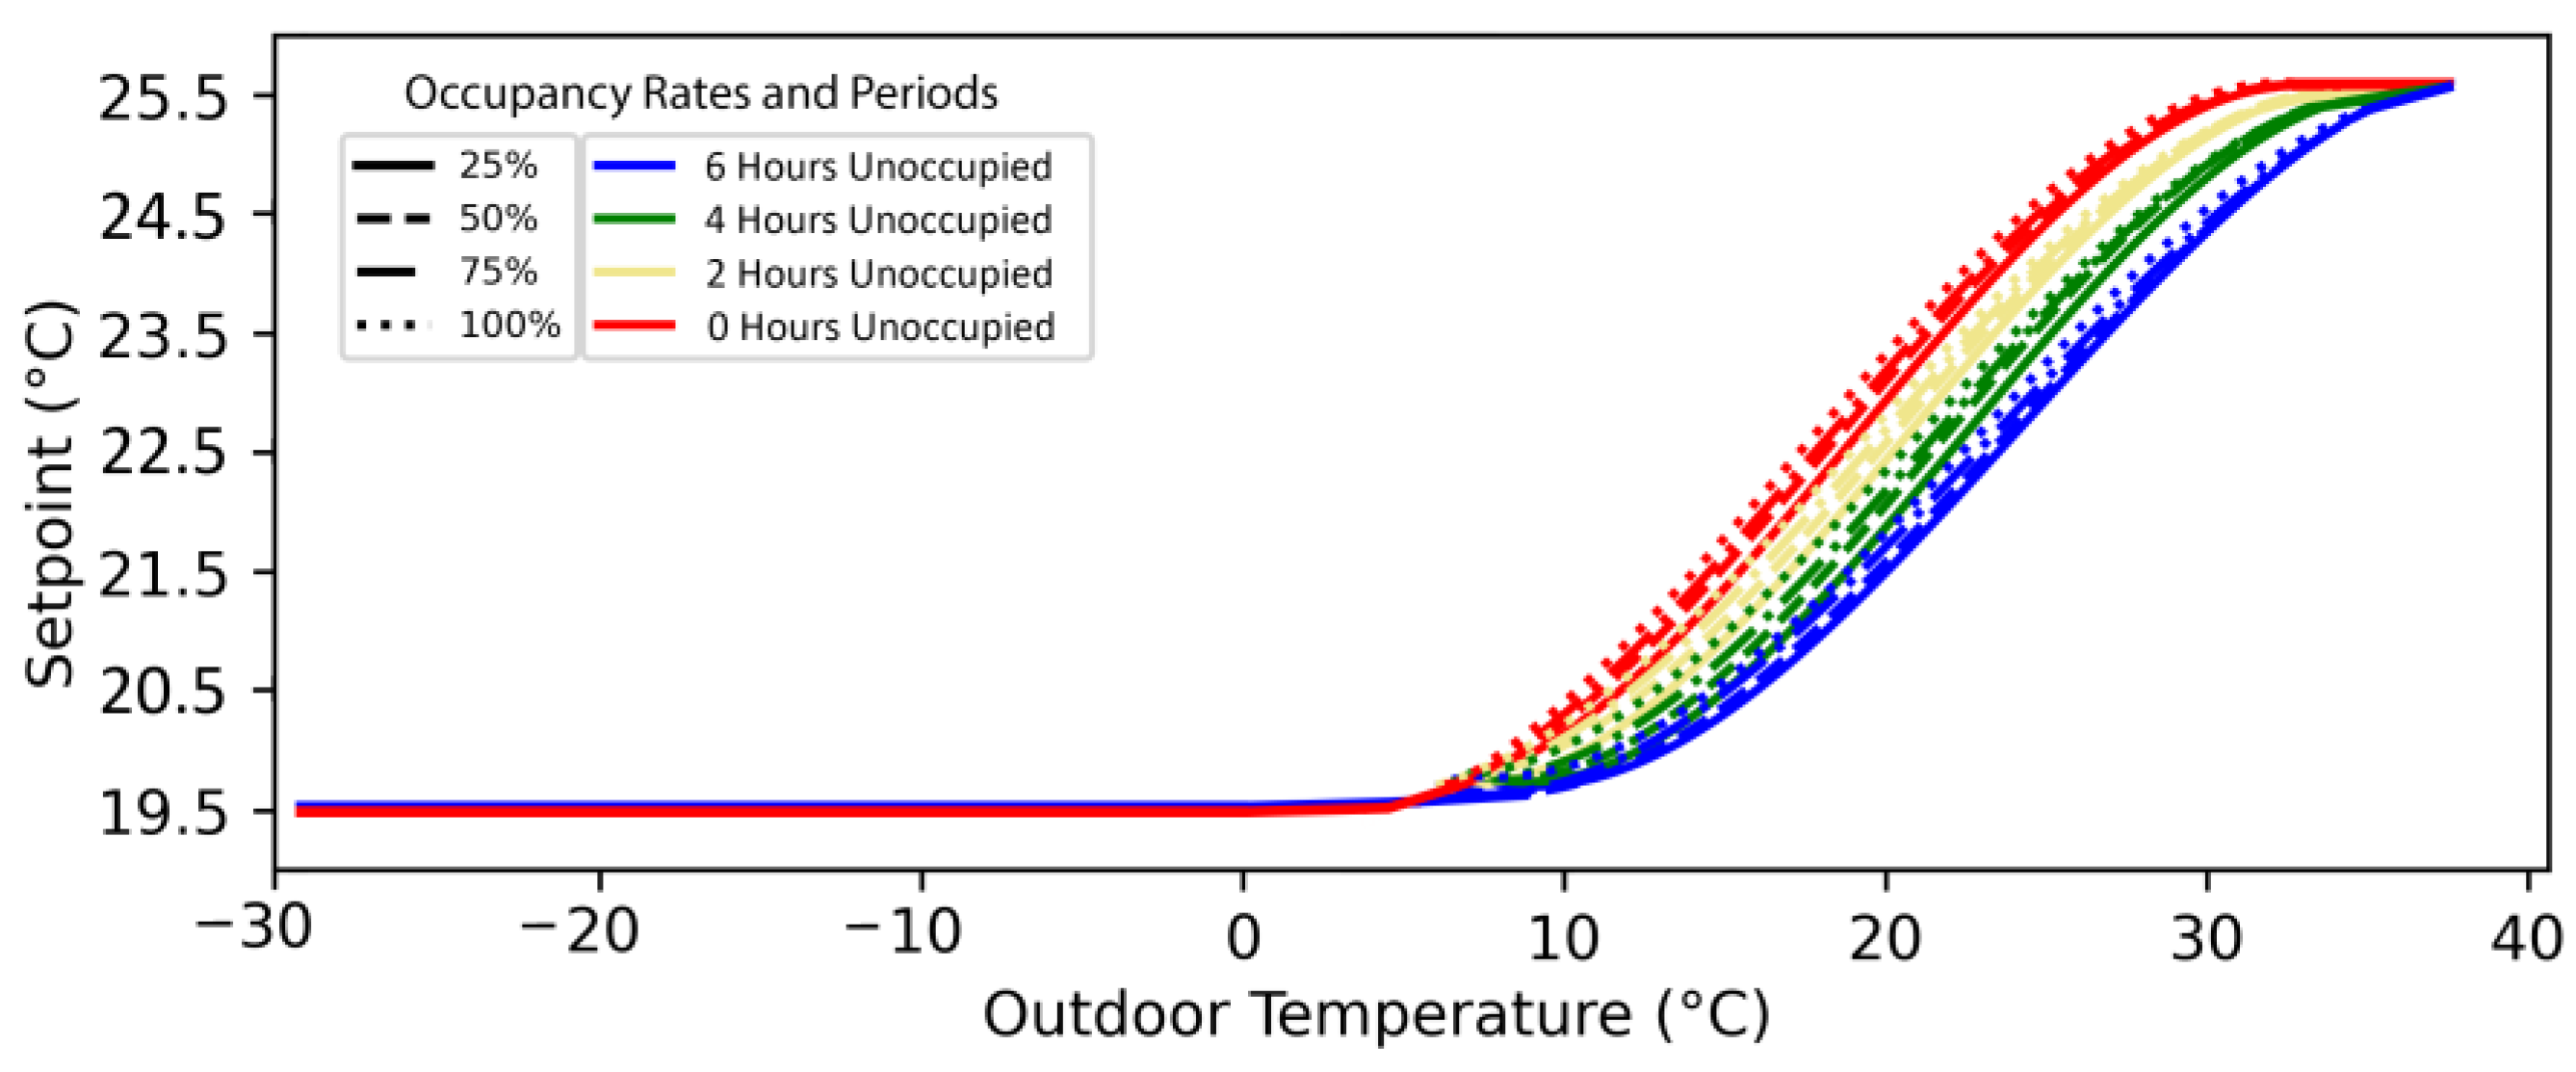
  • Optimal setpoints (19.5 °C and 25.5 °C) remain constant regardless of occupancy, for outdoor temperatures below 5 °C and above 32 °C. However, in the case of outdoor temperatures spanning from 5 °C to 32 °C, fluctuations in occupancy can shift buildings between cooling, free-running, and heating modes.
  • A lower occupancy rate (25%) results in a 1 °C lower or higher optimal setpoint compared to a fully occupied building (100% occupancy rate) for heating and cooling, respectively. Optimal setpoints for a predominantly unoccupied building (6 h) were found to be, on average, 2 °C lower or higher compared to the optimal setpoint identified for a building occupied all the time (no unoccupied hours) for heating and cooling, respectively.
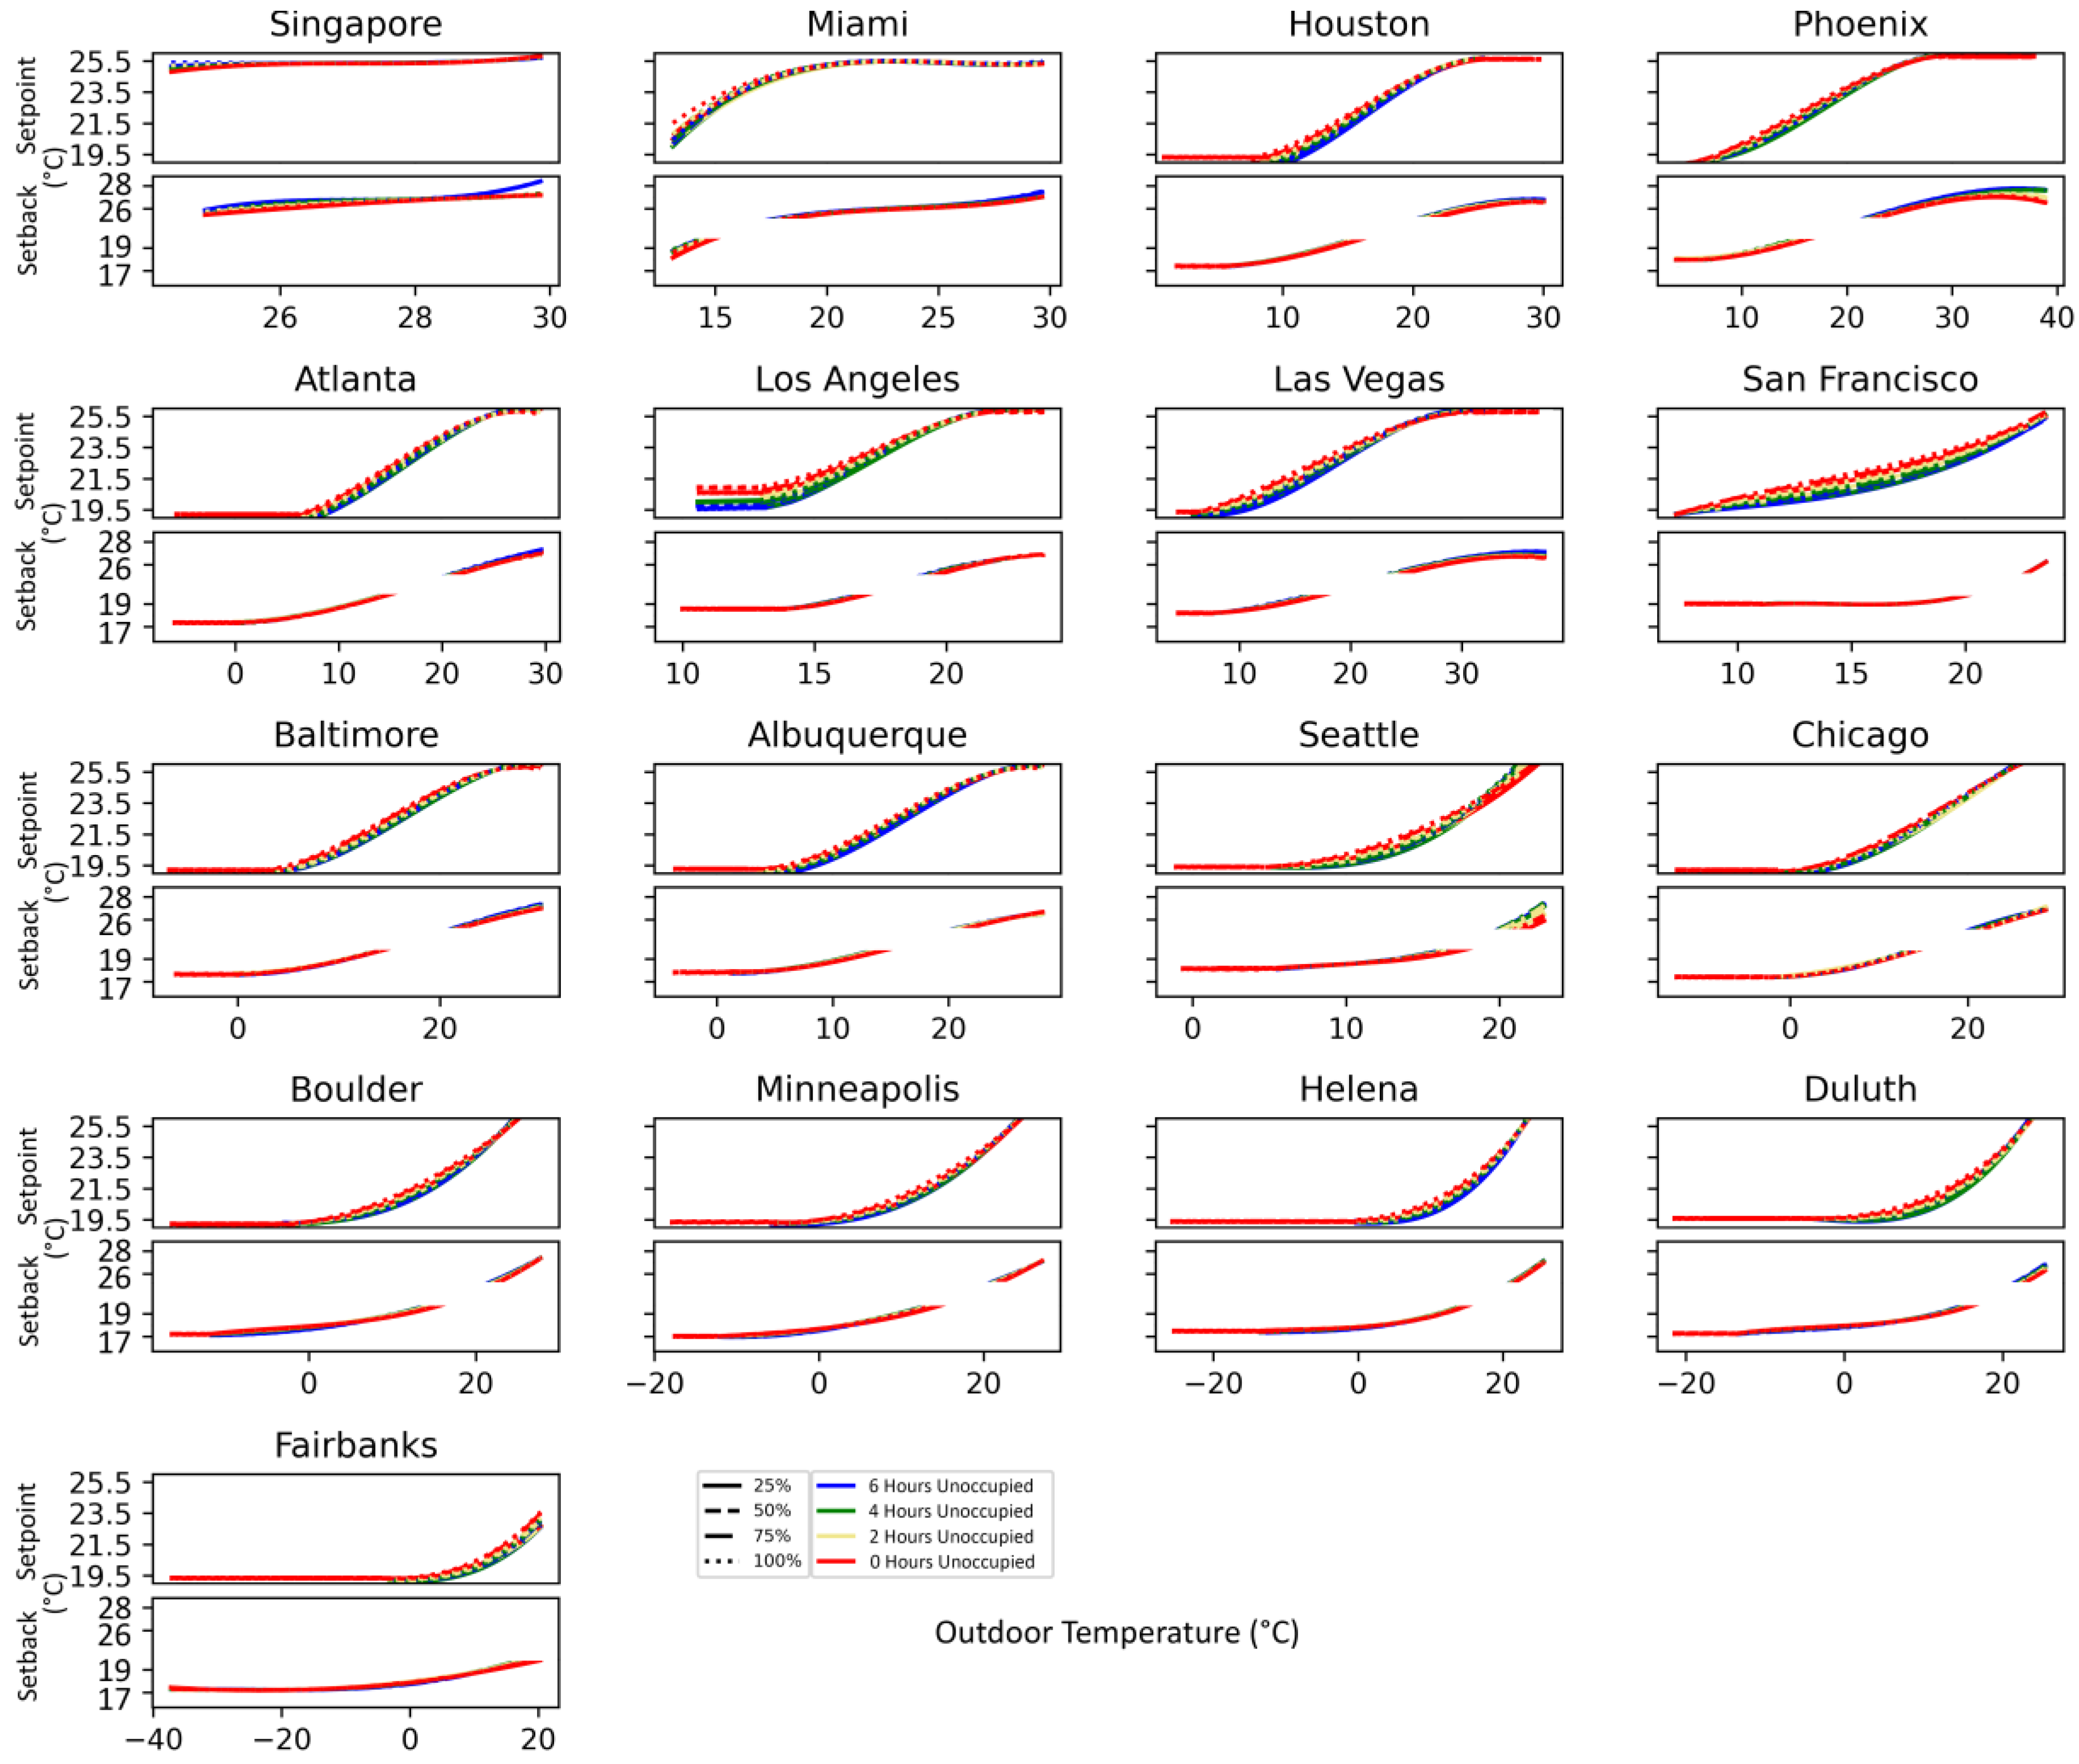
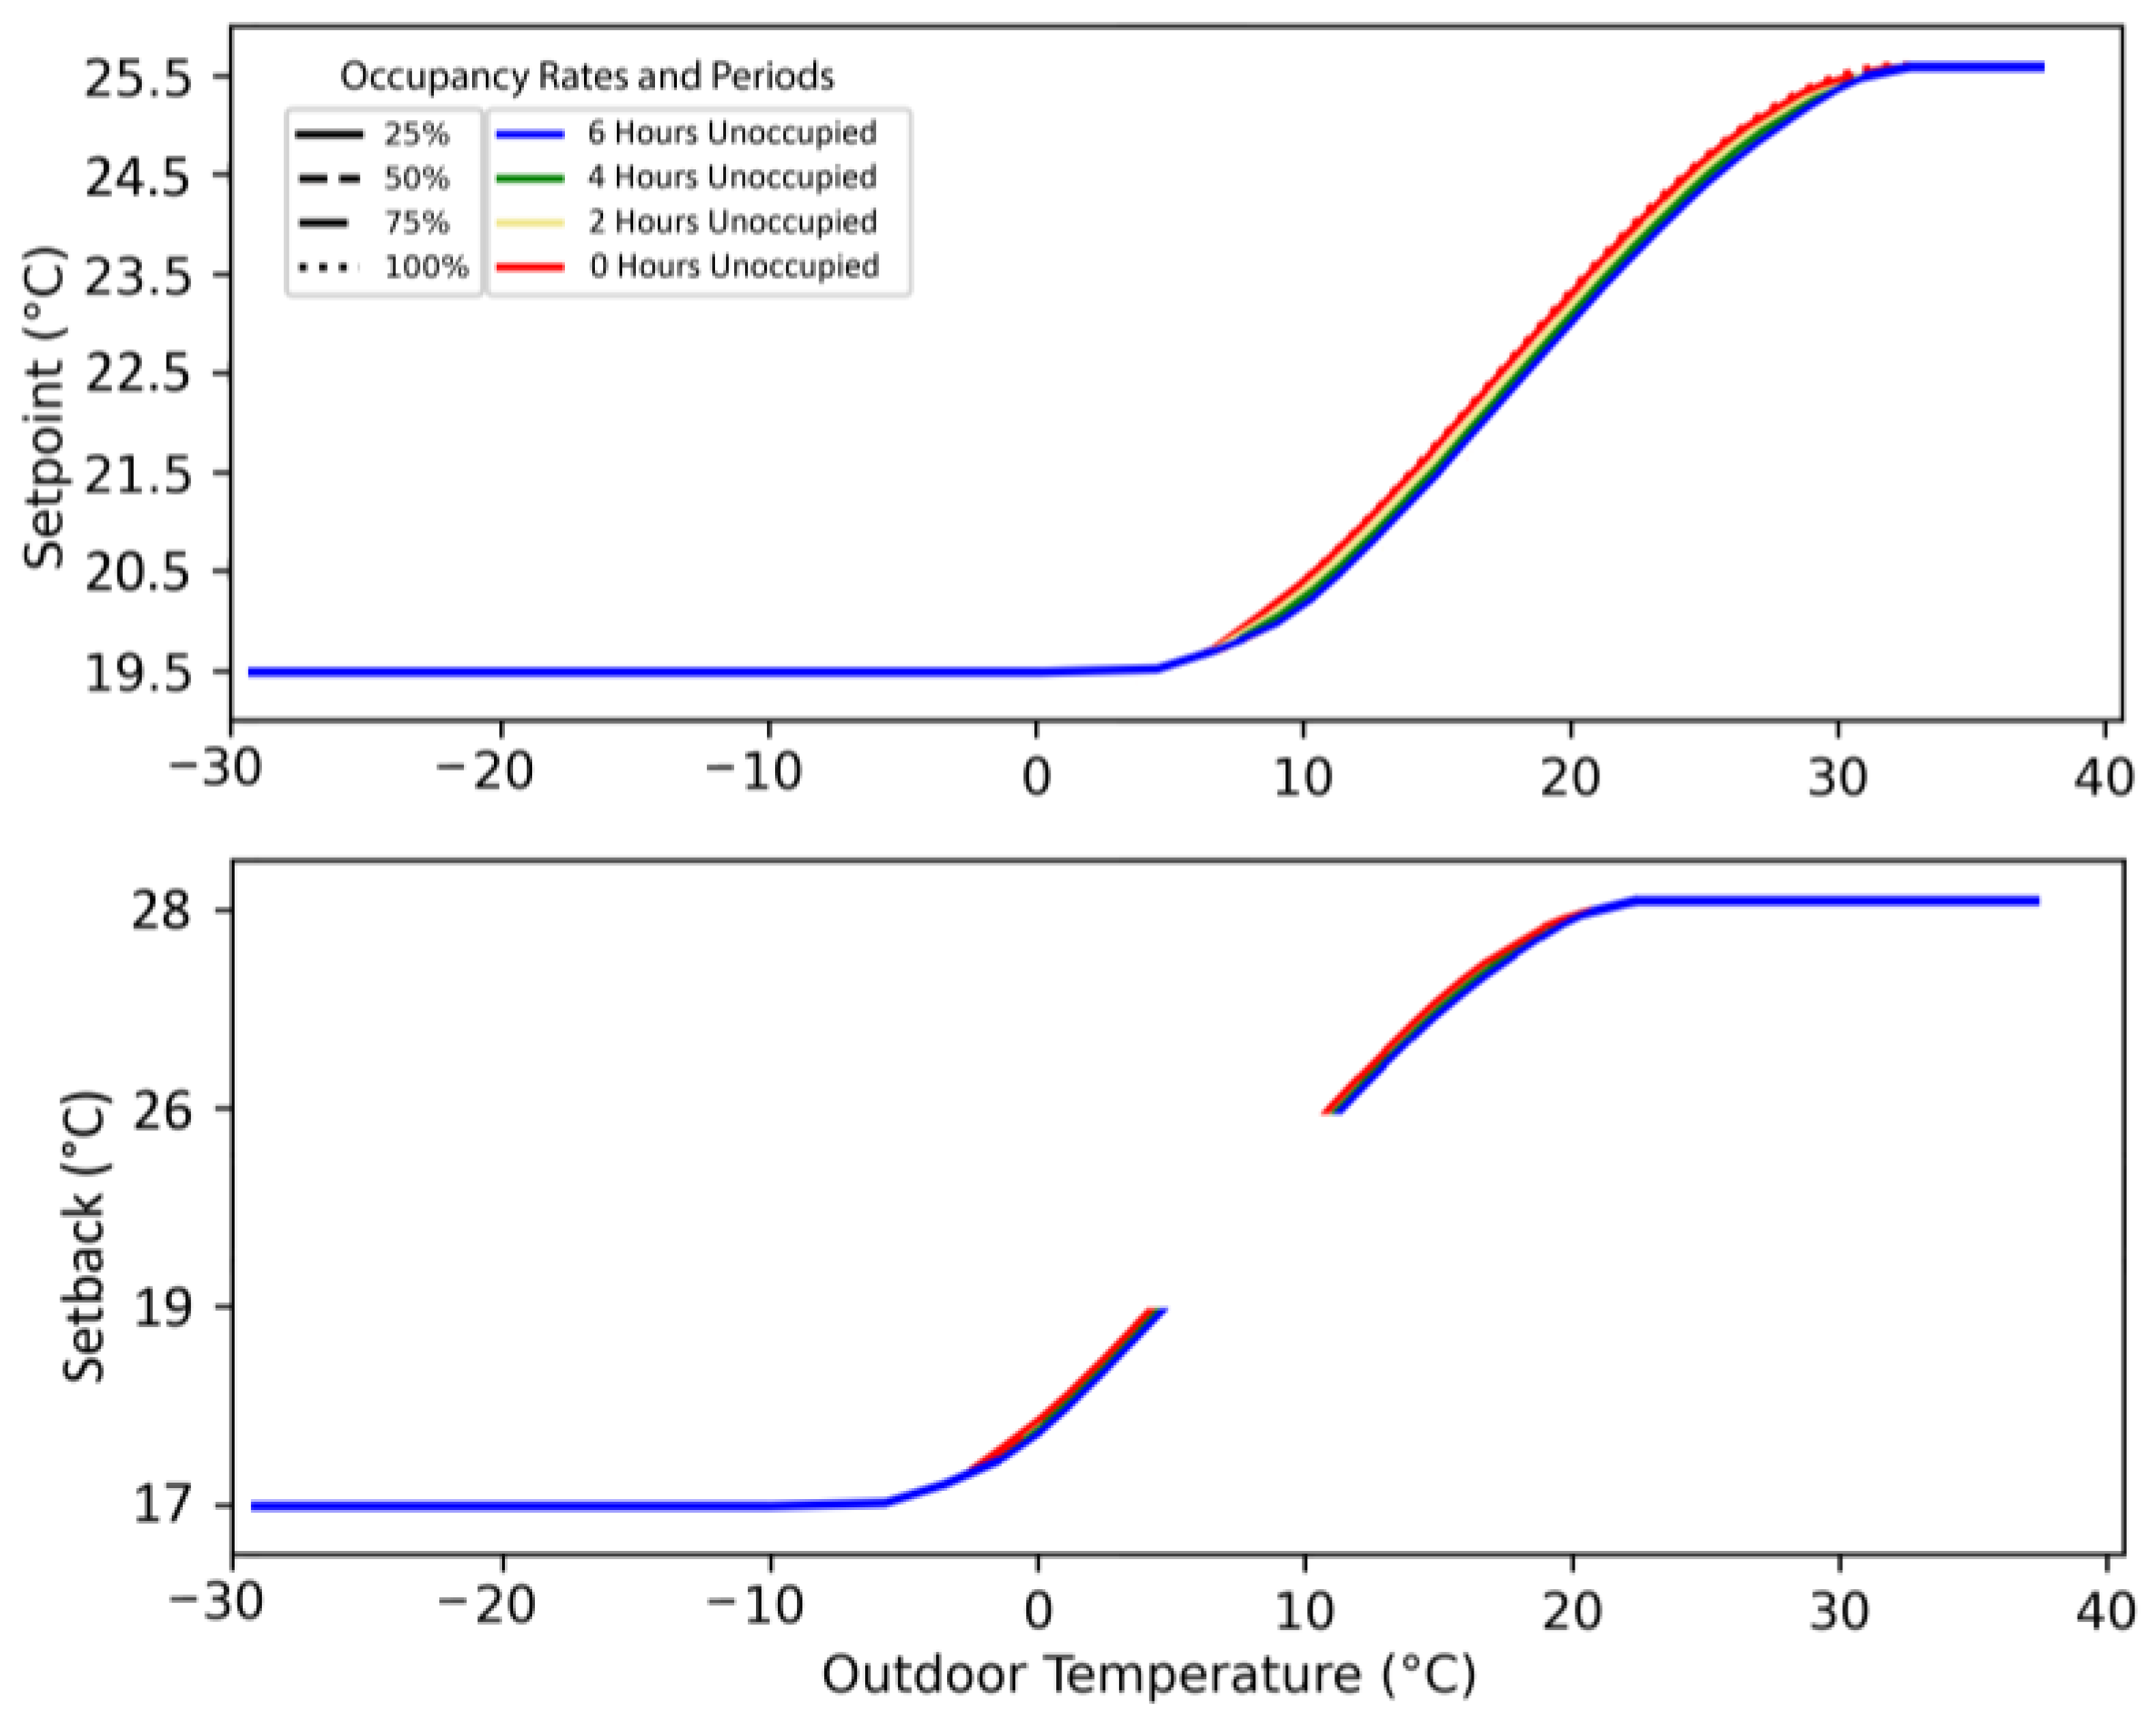
  • When simultaneously optimizing setpoints and setbacks, the effect of varying occupancy on optimal setpoints is lower compared to optimal setpoints and fixed setbacks (Figure 11). This results in a significant portion of identical optimal setpoints, regardless of the duration of unoccupied periods and occupancy rates.
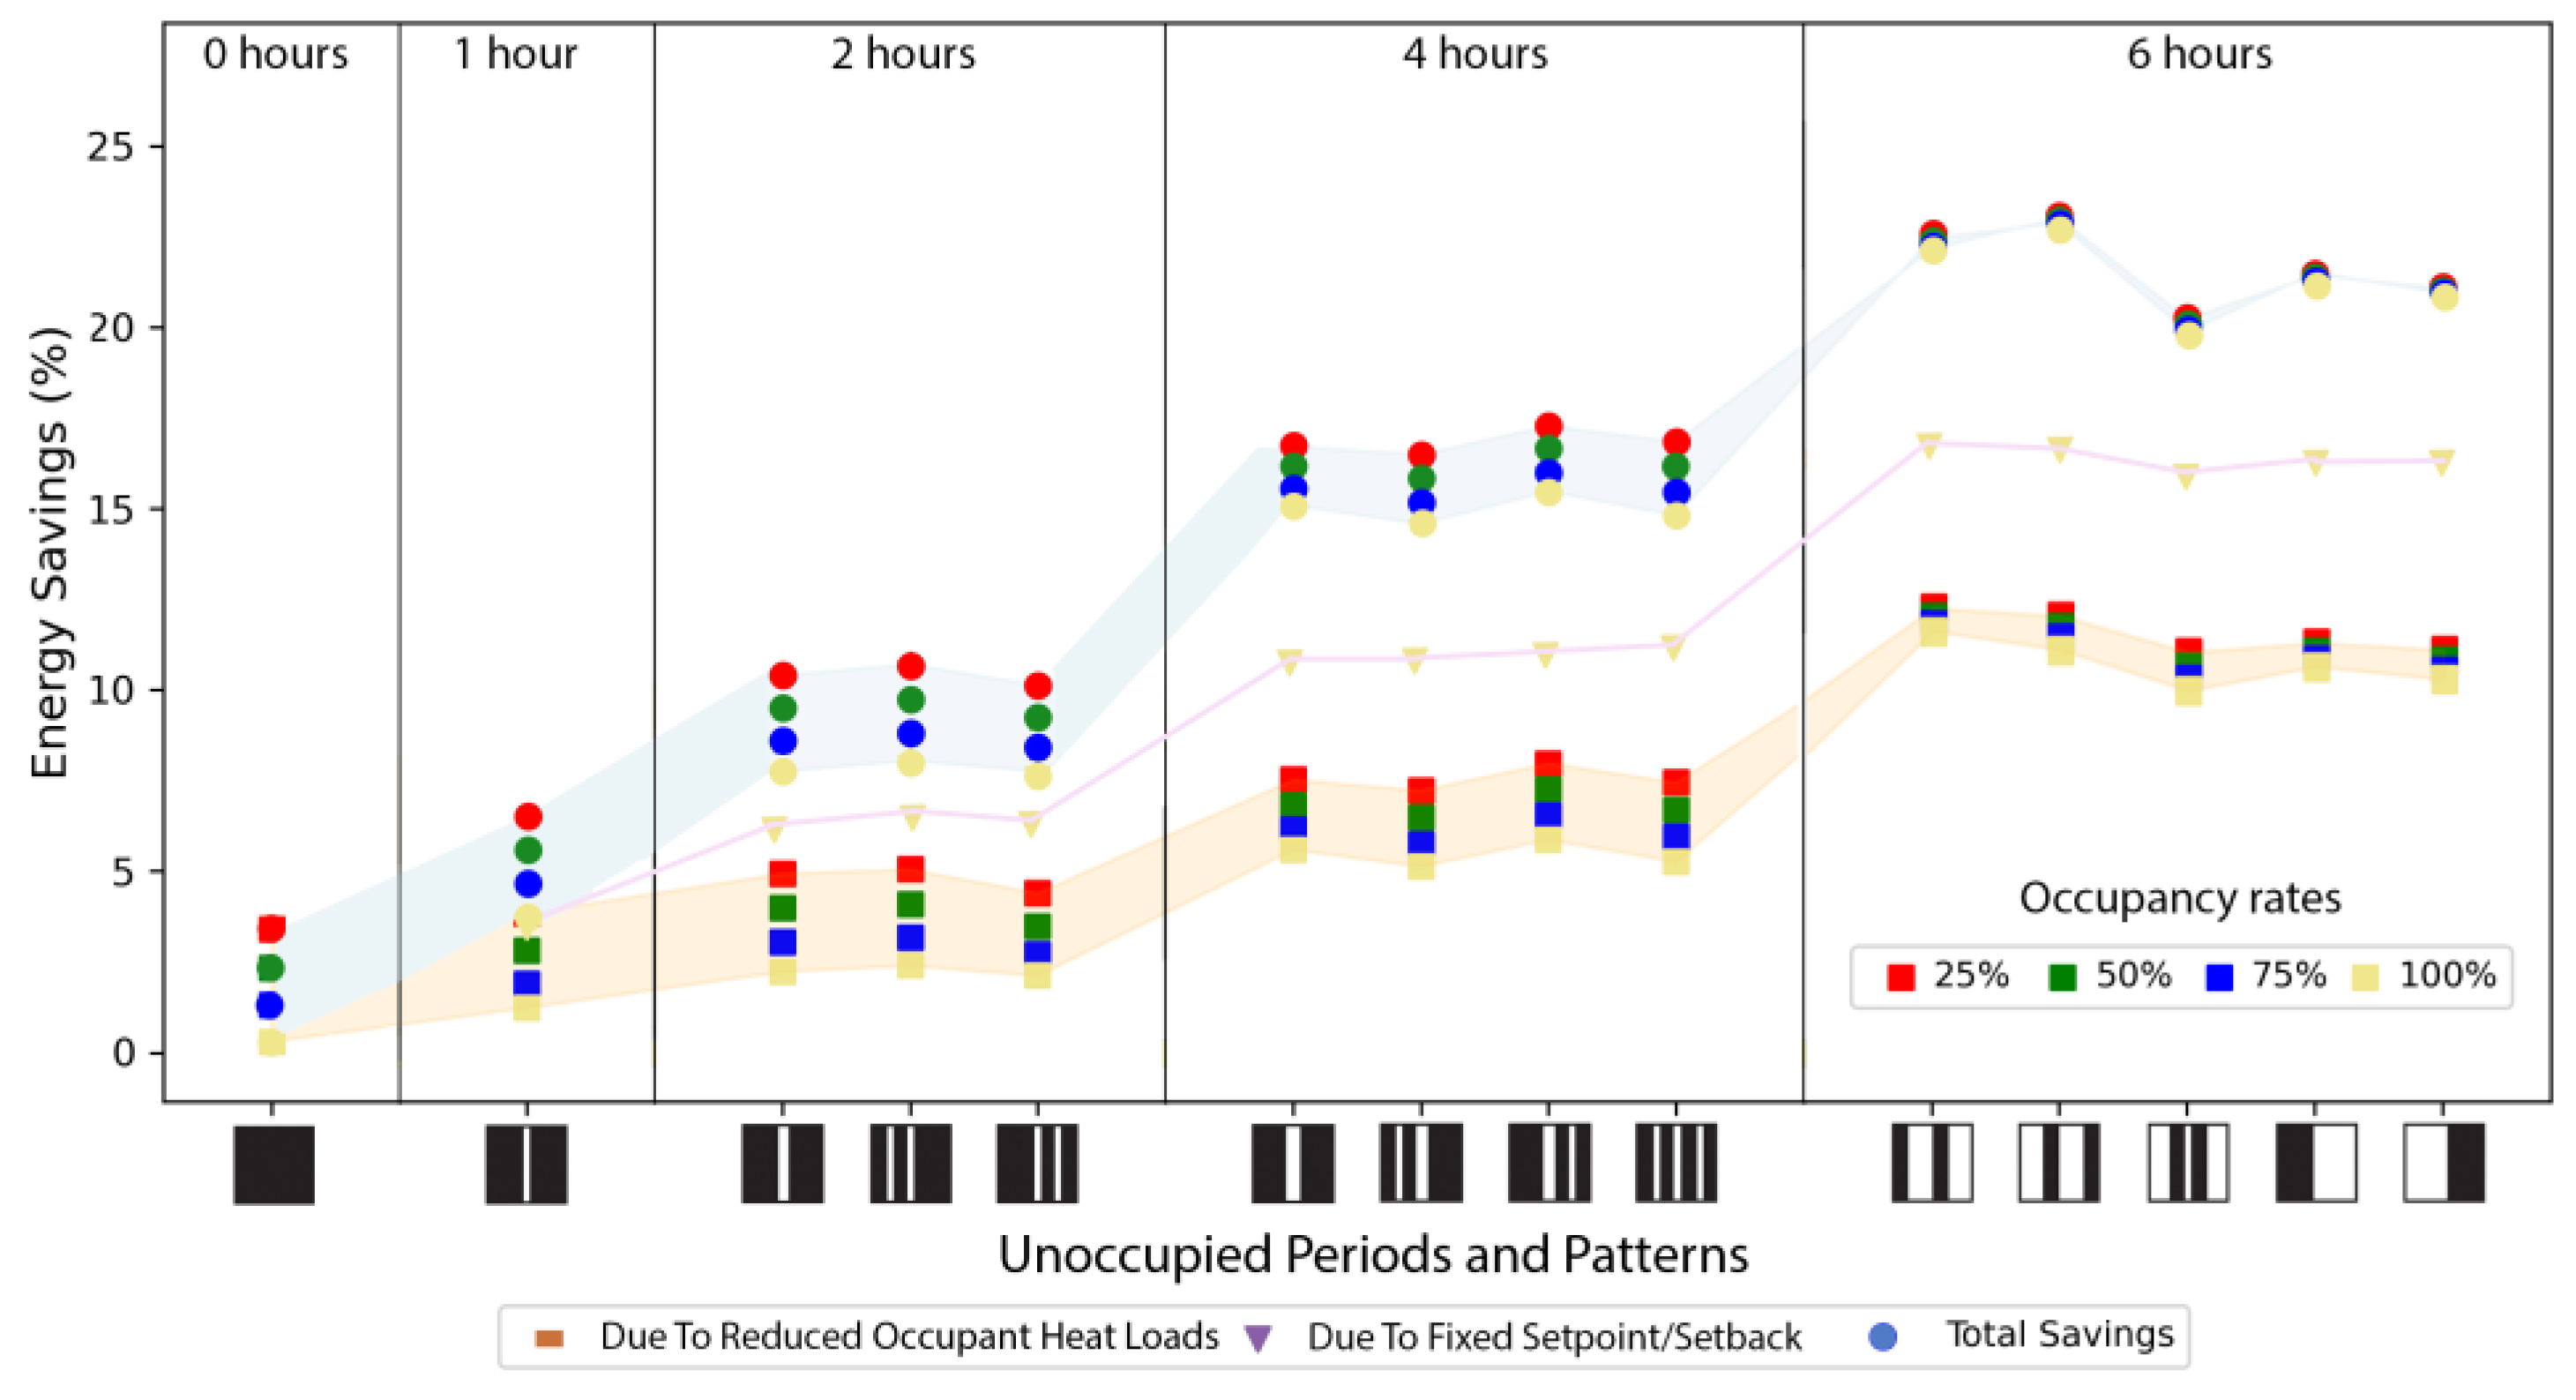
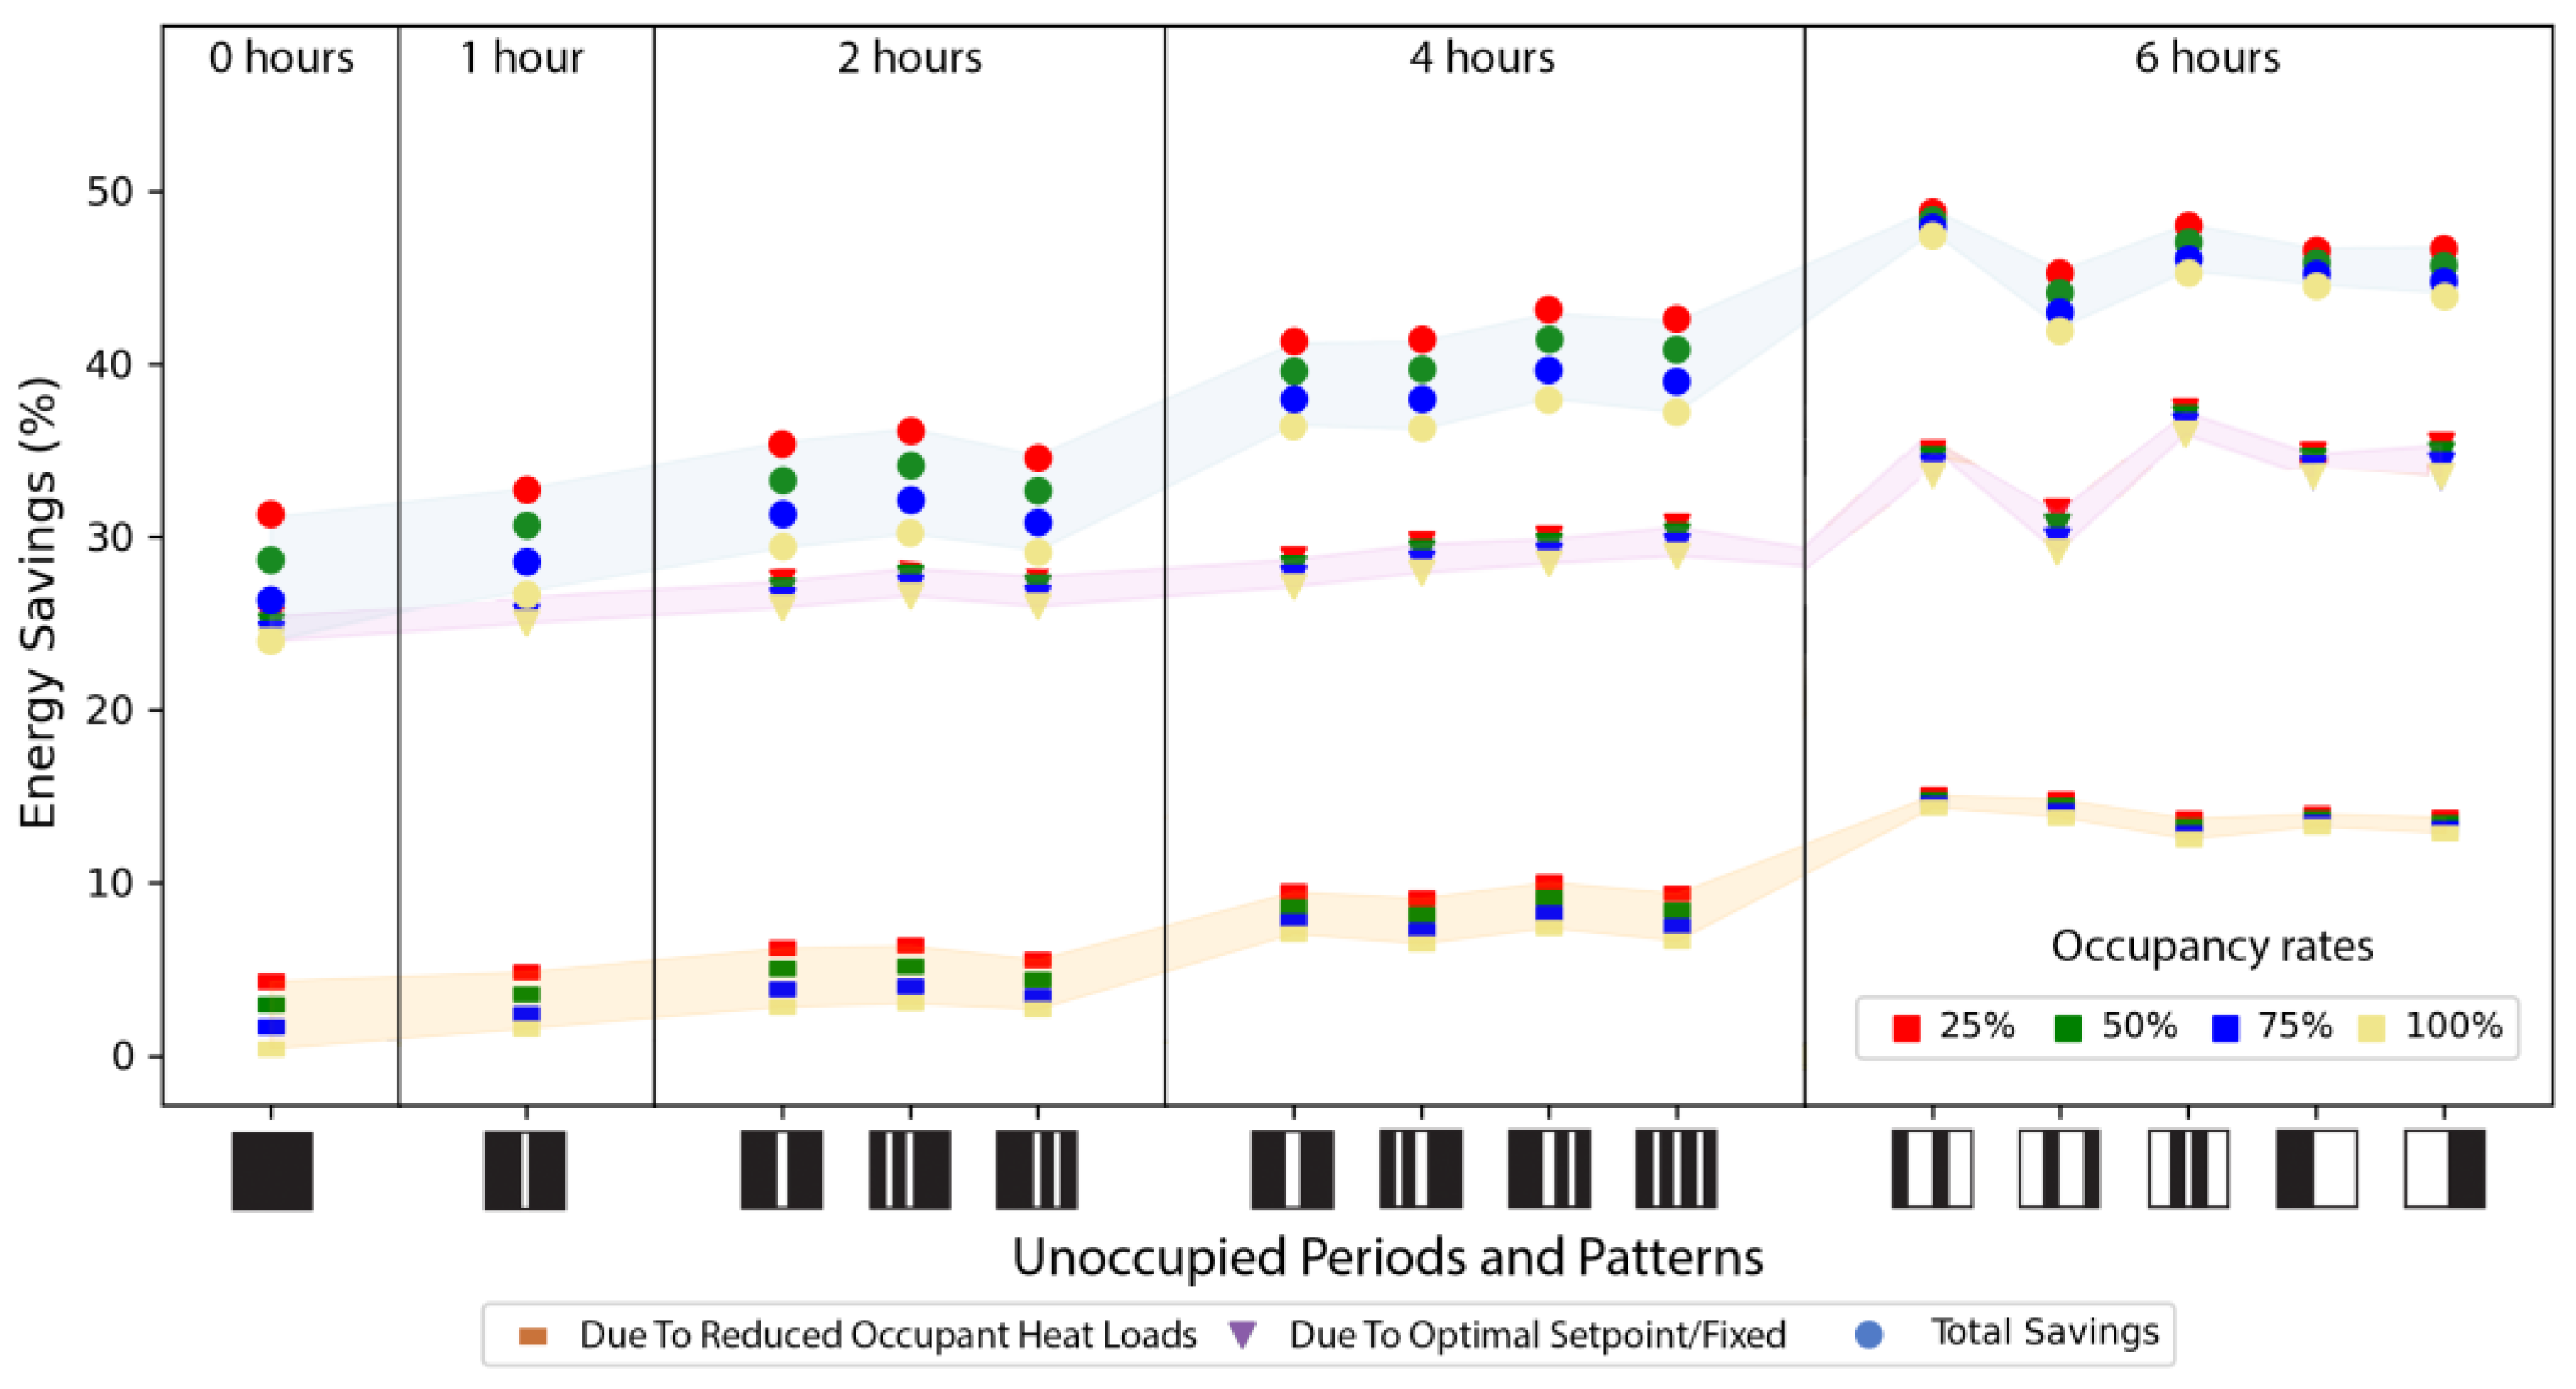
  • The energy savings trends for various setpoint and setback selection strategies remain consistent across patterns with continuous or intermittent occupancy for short unoccupied periods (up to 4 h), where occupancy rates impact energy consumption. However, during longer unoccupied periods (6 h), the influence of occupancy rates becomes insignificant, and the adoption of different setpoint and setback strategies affects energy consumption across patterns, resulting in varying energy savings. In such cases, rapid changes in setpoints and setbacks during periods characterized by high heat loads may not allow sufficient time for the system to reach and maintain the desired temperature, leading to system destabilization and reducing energy savings by up to 9.33%.
The results presented in this paper can assist stakeholders in the building industry in evaluating the energy savings that can be obtained by integrating weather and occupancy data into fixed and optimal setpoint and setback selection strategies. Moreover, this research establishes the groundwork for future research avenues focused on developing efficient techniques for selecting optimal HVAC setpoints and setbacks based on outdoor weather and occupancy variability, moving beyond exhaustive search methods to embrace data-driven algorithms with minimal prerequisites. This includes deploying and validating such algorithms in real-world office settings, integrating adaptive predictive control algorithms based on machine learning for enhanced system responsiveness, and conducting a comprehensive assessment of maintenance practices’ impact on HVAC system reliability. Additionally, further research will explore the integration of optimal setpoint and setback strategies within broader Energy Management Systems for a comprehensive evaluation of energy management solutions.

Author Contributions

Conceptualization, R.T. and A.G.; methodology, R.T. and A.G.; software, R.T. and I.D.; formal analysis, R.T. and I.D.; investigation, R.T.; data curation, R.T. and I.D.; writing—original draft preparation, R.T.; writing—review and editing, R.T. and A.G.; visualization, R.T. and I.D.; supervision, A.G.; project administration, A.G.; funding acquisition, A.G. All authors have read and agreed to the published version of the manuscript.

Funding

This research was funded by the Singapore Ministry of Education under grant nos. A-0008302-02-00 and A-8000136-01-00. Any opinions, findings, and conclusions expressed in this material are those of the authors and do not necessarily reflect the views of the Singapore Ministry of Education.

Data Availability Statement

Publicly available datasets were analyzed in this study. This data can be found here: https://building-robotics-lab.github.io/brlab/#/otst.

Conflicts of Interest

The authors declare no conflict of interest.

References

  1. Pérez-Lombard, L.; Ortiz, J.; Pout, C. A review on buildings energy consumption information. Energy Build. 2008, 40, 394–398. [Google Scholar] [CrossRef]
  2. ASHRAE. ASHRAE Handbook—Fundamentals; American Society of Heating, Refrigerating and Air-Conditioning Engineers: Atlanta, GA, USA, 2017. [Google Scholar]
  3. Talami, R.; Jakubiec, J.A. Early-design sensitivity of radiant cooled office buildings in the tropics for building performance. Energy Build. 2020, 223, 110177. [Google Scholar] [CrossRef]
  4. Talami, R.; Jakubiec, J.A. Sensitivity of Design Parameters on Energy, System and Comfort Performances for Radiant Cooled Office Buildings in the Tropics. In Proceedings of the 16th IBPSA International Conference, Rome, Italy, 2–4 September 2019; pp. 1786–1793. [Google Scholar] [CrossRef]
  5. EN ISO 7730. Ergonomics of the Thermal Environment—Analytical Determination and Interpretation of Thermal Comfort Using Calculation of the PMV and PPD Indices and Local Thermal Comfort Criteria. International Organization for Standardization: Geneva, Switzerland, 2015.
  6. ANSI/ASHRAE Standard 55-2017; Thermal Environmental Conditions for Human Occupancy. American Society of Heating, Refrigerating and Air-Conditioning Engineers: Atlanta, GA, USA, 2017.
  7. Jazizadeh, F.; Ghahramani, A.; Becerik-Gerber, B.; Kichkaylo, T.; Orosz, M. Human-Building Interaction Framework for Personalized Thermal Comfort-Driven Systems in Office Buildings. J. Comput. Civ. Eng. 2014, 28, 2–16. [Google Scholar] [CrossRef]
  8. Karjalainen, S.; Koistinen, O. User problems with individual temperature control in offices. Build. Environ. 2007, 42, 2880–2887. [Google Scholar] [CrossRef]
  9. Aryal, A.; Becerik-Gerber, B. Energy consequences of Comfort-driven temperature setpoints in office buildings. Energy Build. 2018, 177, 33–46. [Google Scholar] [CrossRef]
  10. Agarwal, Y.; Balaji, B.; Dutta, S.; Gupta, R.K.; Weng, T. Duty-Cycling Buildings Aggressively: The Next Frontier in HVAC Control. In Proceedings of the 10th International Conference on Information Processing in Sensor Networks, Chicago, IL, USA, 12–14 April 2011. [Google Scholar]
  11. Erickson, V.L.; Carreira-Perpiñán, M.Á.; Cerpa, A.E. OBSERVE: Occupancy-Based System for Efficient Reduction of HVAC Energy. In Proceedings of the 10th International Conference on Information Processing in Sensor Networks, Chicago, IL, USA, 12–14 April 2011. [Google Scholar]
  12. Duarte, C.; Van Den Wymelenberg, K.; Rieger, C. Revealing occupancy patterns in an office building through the use of occupancy sensor data. Energy Build. 2013, 67, 587–595. [Google Scholar] [CrossRef]
  13. Erickson, V.L.; Cerpa, A.E. Occupancy Based Demand Response HVAC Control Strategy. In Proceedings of the 2nd ACM Workshop on Embedded Sensing Systems for Energy-Efficiency in Building, Zurich, Switzerland, 3–5 November 2010; pp. 7–12. [Google Scholar] [CrossRef]
  14. Esrafilian-Najafabadi, M.; Haghighat, F. Occupancy-based HVAC control systems in buildings: A state-of-the-art review. Build. Environ. 2021, 197, 107810. [Google Scholar] [CrossRef]
  15. Dong, J.; Winstead, C.; Nutaro, J.; Kuruganti, T. Occupancy-Based HVAC Control with Short-Term Occupancy Prediction Algorithms for Energy-Efficient Buildings. Energies 2018, 11, 2427. [Google Scholar] [CrossRef]
  16. Peters, S.E.; Dennerlein, J.T.; Wagner, G.R.; Sorensen, G. Work and worker health in the post-pandemic world: A public health perspective. Lancet Public Health 2022, 7, e188–e194. [Google Scholar] [CrossRef]
  17. Baldi, S.; Korkas, C.D.; Lv, M.; Kosmatopoulos, E.B. Automating occupant-building interaction via smart zoning of thermostatic loads: A switched self-tuning approach. Appl. Energy 2018, 231, 1246–1258. [Google Scholar] [CrossRef]
  18. Pang, Z.; Chen, Y.; Zhang, J.; O’Neill, Z.; Cheng, H.; Dong, B. How much HVAC energy could be saved from the occupant-centric smart home thermostat: A nationwide simulation study. Appl. Energy 2021, 283, 116251. [Google Scholar] [CrossRef]
  19. Krarti, M. Evaluation of occupancy-based temperature controls on energy performance of KSA residential buildings. Energy Build. 2020, 220, 110047. [Google Scholar] [CrossRef]
  20. Goyal, S.; Barooah, P.; Middelkoop, T. Experimental study of occupancy-based control of HVAC zones. Appl. Energy 2015, 140, 75–84. [Google Scholar] [CrossRef]
  21. He, Y.; Chen, Y.; Chen, Z.; Deng, Z.; Yuan, Y. Impacts of Occupant Behavior on Building Energy Consumption and Energy Savings Analysis of Upgrading ASHRAE 90.1 Energy Efficiency Standards. Buildings 2022, 12, 1108. [Google Scholar] [CrossRef]
  22. Peng, Y.; Rysanek, A.; Nagy, Z.; Schlüter, A. Using machine learning techniques for occupancy-prediction-based cooling control in office buildings. Appl. Energy 2018, 211, 1343–1358. [Google Scholar] [CrossRef]
  23. Peng, Y.; Rysanek, A.; Nagy, Z.; Schlüter, A. Occupancy learning-based demand-driven cooling control for office spaces. Build. Environ. 2017, 122, 145–160. [Google Scholar] [CrossRef]
  24. ASHRAE. ASHRAE Guideline 36-2021: High Performance Sequence of Operation for HVAC Systems; American Society of Heating, Refrigerating and Air-Conditioning Engineers: Atlanta, GA, USA, 2021. [Google Scholar]
  25. Talami, R.; Dawoodjee, I.; Ghahramani, A. Demystifying energy savings from dynamic temperature setpoints under weather and occupancy variability. Energy Built Environ. 2023. [Google Scholar] [CrossRef]
  26. Holthaus, A.; Rafaie, M.; Alsaleem, F. Comfort-Based Optimal Temperature Setpoint Calculation. In Proceedings of the 5th International High Performance Buildings Conference, Purdue, West Lafayette, IN, USA, 9–12 July 2021. [Google Scholar]
  27. Ghahramani, A.; Dutta, K.; Becerik-Gerber, B. Energy trade off analysis of optimized daily temperature setpoints. J. Build. Eng. 2018, 19, 584–591. [Google Scholar] [CrossRef]
  28. Papadopoulos, S.; Kontokosta, C.E.; Vlachokostas, A.; Azar, E. Rethinking HVAC temperature setpoints in commercial buildings: The potential for zero-cost energy savings and comfort improvement in different climates. Build. Environ. 2019, 155, 350–359. [Google Scholar] [CrossRef]
  29. Ghahramani, A.; Jazizadeh, F.; Becerik-Gerber, B. A knowledge based approach for selecting energy-aware and comfort-driven HVAC temperature set points. Energy Build. 2014, 85, 536–548. [Google Scholar] [CrossRef]
  30. Xu, X.; Culligan, P.J.; Taylor, J.E. Energy Saving Alignment Strategy: Achieving energy efficiency in urban buildings by matching occupant temperature preferences with a building’s indoor thermal environment. Appl. Energy 2014, 123, 209–219. [Google Scholar] [CrossRef]
  31. Nicol, J.F.; Humphreys, M.A. Adaptive thermal comfort and sustainable thermal standards for buildings. Energy Build. 2002, 34, 563–572. [Google Scholar] [CrossRef]
  32. Brager, G.S.; de Dear, R.J. Thermal adaptation in the built environment: A literature review. Energy Build. 1998, 27, 83–96. [Google Scholar] [CrossRef]
  33. Hensen, J.L.M. Literature review on thermal comfort in transient conditions. Build. Environ. 1990, 25, 309–316. [Google Scholar] [CrossRef]
  34. Haines, R.W.; Myers, M. HVAC Systems Design Handbook, 5th ed.; McGraw Hill Education: New York, NY, USA, 2009. [Google Scholar]
  35. Hoyt, T.; Arens, E.; Zhang, H. Extending air temperature setpoints: Simulated energy savings and design considerations for new and retrofit buildings. Build. Environ. 2015, 88, 89–96. [Google Scholar] [CrossRef]
  36. Ghahramani, A.; Zhang, K.; Dutta, K.; Yang, Z.; Becerik-Gerber, B. Energy savings from temperature setpoints and deadband: Quantifying the influence of building and system properties on savings. Appl. Energy 2016, 165, 930–942. [Google Scholar] [CrossRef]
  37. Wang, Z.; Calautit, J.; Wei, S.; Tien, P.W.; Xia, L. Real-time building heat gains prediction and optimization of HVAC setpoint: An integrated framework. J. Build. Eng. 2022, 49, 104103. [Google Scholar] [CrossRef]
  38. Deru, M.; Field, K.; Studer, D.; Benne, K.; Griffith, B.; Torcellini, P.; Liu, B.; Halverson, M.; Winiarski, D.; Rosenberg, M.; et al. U.S. Department of Energy Commercial Reference Building Models of the National Building Stock; NREL/TP-5500-46861; National Renewable Energy Lab. (NREL): Golden, CO, USA, 2011; p. 1009264. [Google Scholar] [CrossRef]
Figure 1. Conventional fixed setpoint and setback (a), optimal setpoint and fixed setback (b), and optimal setpoint and setback (c) selection strategies.
Buildings 13 02998 g001
Figure 2. Patterns of unoccupied periods (white spaces) for each occupancy rate scenario.
Buildings 13 02998 g002
Figure 3. Shapes and window geometry of the small, medium, and large office building.
Buildings 13 02998 g003
Figure 4. Energy savings from reduced occupant heat loads and a conventional fixed setpoint and setback strategy for each occupancy rate and unoccupied period, averaged across building sizes.
Buildings 13 02998 g004
Figure 5. Energy savings across occupancy rates and patterns from occupant heat loads and fixed setpoints and setbacks, averaged by climate and building size.
Buildings 13 02998 g005
Figure 6. Climate-based optimal setpoints based on outdoor temperatures, unoccupied periods, and occupancy rates for the small-sized building.
Buildings 13 02998 g006
Figure 7. Climate- and size-averaged optimal setpoints based on outdoor temperatures, unoccupied periods, and occupancy rates.
Buildings 13 02998 g007
Figure 8. Energy savings from reduced occupant heat loads and an optimal setpoint with fixed setback strategy for each occupancy rate and unoccupied period, averaged across building sizes.
Buildings 13 02998 g008
Figure 9. Energy savings across occupancy rates and patterns from occupant heat loads and optimal setpoints with fixed setbacks, averaged by climate and building size.
Buildings 13 02998 g009
Figure 10. Optimal setpoints and setbacks based on outdoor temperatures, unoccupied periods, and occupancy rates across various climate conditions for the small-sized building.
Buildings 13 02998 g010
Figure 11. Climate- and size- averaged optimal setpoints and setbacks based on outdoor temperatures, unoccupied periods, and occupancy rates.
Buildings 13 02998 g011
Figure 12. Energy savings from reduced occupant heat loads and optimal setpoint and setback strategy for each occupancy rate and unoccupied period, averaged across building sizes.
Buildings 13 02998 g012
Figure 13. Energy savings across occupancy rates and patterns from occupant heat loads and optimal setpoints and setbacks, averaged by climate and building size.
Buildings 13 02998 g013
Figure 14. Variations in setpoints and setbacks influenced by outdoor conditions and varying occupancy, compared between fixed and optimal selection strategies and averaged across different climates and building size.
Buildings 13 02998 g014
Figure 15. Energy savings across patterns for different selection strategies, averaged by climate and building size.
Buildings 13 02998 g015
Figure 16. Comparison of energy savings across different selection strategies: fixed setpoints and setbacks, optimal setpoints with fixed setbacks, and optimal setpoints and setbacks.
Buildings 13 02998 g016
Figure 17. User interface displaying inputs and outputs of the Optimal Temperature Setpoint Tool.
Buildings 13 02998 g017
Table 1. Parameters and discrete values of the problem formulation.
ParametersValues
Setpoint (°C)19.5/20.5/21.5/22.5/23.5/24.5/25.5
Setback (°C)
Occupancy rate (%)
Patterns
17/19/26/28
25/50/75/100
See Figure 2
Building sizeSmall/Medium/Large
Climate zones (City)0A (Singapore)
1A (Miami, Florida)
2A (Houston, Texas)
2B (Phoenix, Arizona)
3A (Atlanta, Georgia)
3B (Los Angeles, California)
3B (Las Vegas, Nevada)
3C (San Francisco, California)
4A (Baltimore, Maryland)
4B (Albuquerque, New Mexico)
4C (Seattle, Washington)
5A (Chicago, Illinois)
5B (Denver, Colorado)
6A (Minneapolis, Minnesota)
6B (Helena, Montana)
7 (Duluth, Minnesota)
8 (Fairbanks, Alaska)
Table 2. Construction materials and HVAC systems of small, medium, and large office buildings.
SmallMediumLarge
Floors (n) 1 3 12
Floor Space (m2) 511 4982 46,320
Window-to-wall Ratio (%) 0.21 0.33 0.38
Exterior Walls Construction Wood-frame walls (40 cm), 2.5 cm stucco, 1.6 cm gypsum board, wall insulation, 1.6 cm gypsum board Steel-frame walls (40 cm) 1 cm stucco, 1.6 cm gypsum board, wall insulation, 1.6 cm gypsum board Pre-cast concrete panel of 20 cm heavy-weight concrete, wall insulation, 1.3 cm gypsum board
Roof Construction Attic roof with wood joist: roof insulation, 1.6 cm gypsum board Roof membrane, insulation, and metal decking Roof membrane, insulation, and metal decking
Heating Furnace Furnace Boiler
Cooling Packaged Air Conditioning (AC) Unit Packaged AC Unit Water-cooled centrifugal chillers
Air distribution Single-Zone Constant Air Volume Multi-zone VAV system Multi-zone VAV system
Disclaimer/Publisher’s Note: The statements, opinions and data contained in all publications are solely those of the individual author(s) and contributor(s) and not of MDPI and/or the editor(s). MDPI and/or the editor(s) disclaim responsibility for any injury to people or property resulting from any ideas, methods, instructions or products referred to in the content.

