Abstract
This study aims to investigate the local elastic buckling behavior of simply-supported prismatic web plates under pure shear loading. Comprehensive finite element analysis is conducted to analyze the effects of various geometric parameters, such as tapering ratio, aspect ratio, and web slenderness, on the local elastic buckling behavior with simply-supported boundary conditions. An eigenvalue analysis is conducted to determine web plates’ natural frequencies and corresponding shape modes with varying geometric parameters. Particular attention is given to the effect of the slenderness ratio, since current formulas do not consider the impact of the slenderness ratio on the elastic shear buckling coefficient. A sensitivity analysis is conducted to examine the importance of the web slenderness ratio for estimating the critical buckling coefficient of a prismatic plate under pure shear loading. Finally, a formula of the elastic local critical buckling coefficient for a simply-supported prismatic web considering the web slenderness effect is proposed, which can be used in international codes.
1. Introduction
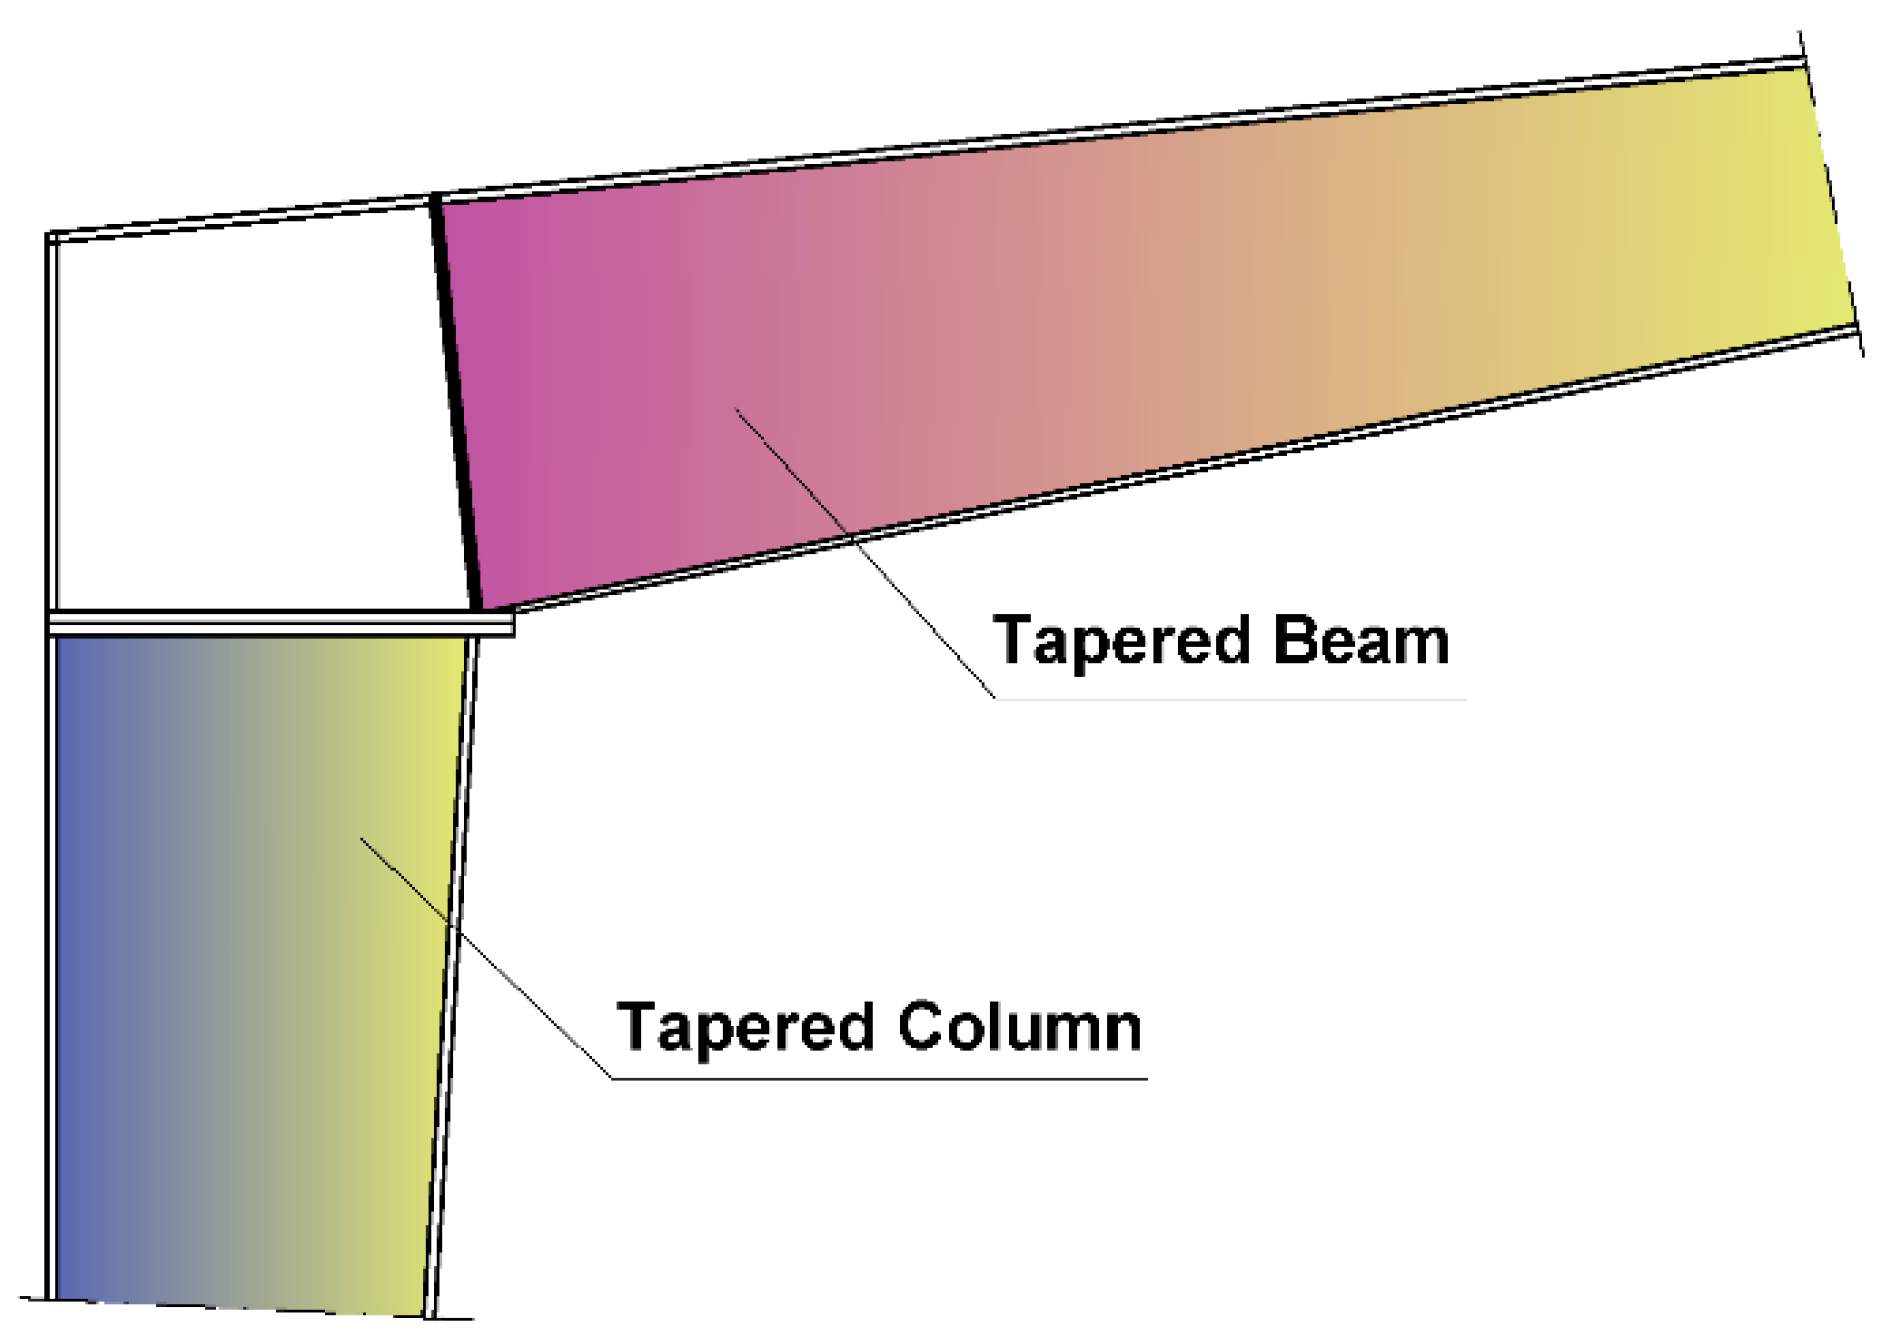
Prismatic web plates are a cost-effective choice when dealing with scenarios that involve long distances between supports, heavy loads, or when the weight of the structure itself significantly impacts the design. In such cases, deep slender tapered plate girders are typically selected to achieve an efficient design. By using tapered web plates, it becomes possible to find a suitable solution that minimizes the need for excessive materials. In addition, tapered steel beams can influence architectural design inside buildings. For example, the sloped shape of tapered beams can add visual interest and character to interior spaces. The beam slope draws the eye and creates angled lines within the space. Figure 1 shows the use of tapered girders in several steel structures. However, the slenderness of the web leads to the girder panel’s instability due to the shear stress effects [1,2]. In addition, the primary mode of failure of the thin-walled steel plates or members is the local buckling of the plate. Research into the local buckling of thin-walled steel members has experienced a resurgence due to the growing utilization of thin-walled members [3,4,5,6,7,8,9]. To avoid this type of failure, the depth of the web is designed carefully for the area with high moments, and thicker webs are often used when there is high shear. Moreover, the material can be saved by making webs shallower and thinner in areas with less critical moments and shear strengths. Thus, the significance of research into the behavior of web plates becomes important, as discussed by Kim [10]. It appears from the above that, whenever the critical shear buckling load is accurately calculated, an economic section can be obtained. The importance of this point becomes evident since the international codes significantly underestimate the shear buckling coefficient, as will be clarified later. Therefore, this study aims to investigate the elastic local buckling of prismatic plates under shear load.
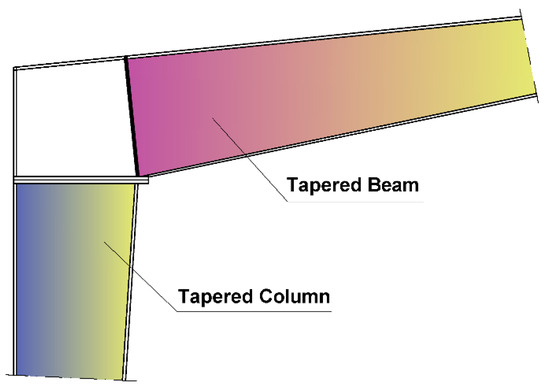
Figure 1.
Steel tapered sections in frame structure.
According to elastic buckling theory, the web plate’s boundary conditions are the most useful factor in determining the elastic shear buckling strength. The behavior of tapered web plates has been studied using various models to develop design formulas for elastic shear buckling. The first model was suggested by Timoshenko et al. [11] to estimate the buckling shear stress of rectangular simply-supported plates. They ignored the flange role in constraining the web.
Given the notable slender nature of the web in tapered plate girders, web buckling often occurs in the elastic range prior to steel yielding. Consequently, it is crucial to thoroughly examine the elastic buckling of prismatic web plates under pure shear loading, taking into account the slenderness effect of the steel plates. Researchers developed several models to predict the behavior of tapered members for design purposes. Pope [12] developed a theoretical technique for the buckling analysis of a plate with a symmetrical taper and parallel ends under uniform axial loading. The research examined how the buckling of the plates was affected by equal and different uniform loads applied normally to the ends. Either the plates were simply supported, or they were clamped. One of the earliest references that investigated the plate buckling effect on the failure of the tapered members was conducted by Prawel et al. [13]. Bedynek et al. [14] developed numerical models to determine the shear buckling strength of the trapezoidal web panel. The impact of the flanges was ignored in the numerical investigation and the tapered web panel was treated as a plate with trapezoidal geometry with simple support edges. A variety of aspect ratios, tapering angles, and geometrical typologies were used to develop predictive models, including typologies 1 and 3, which signify the trapezoidal web plate with a tension zone in the short direction, and typologies 2 and 4, representing the tension zone in the long direction. Additionally, it was found that Eurocode 3 (EC3) [15] underestimates the ultimate strength of trapezoidal web panels by 15%. Lee et al. [16] estimated the shear buckling coefficient using 300 finite element models of hypothetical plate girders. It was found that the shear buckling coefficient depends on the flange-to-web thickness ratio between the coefficients for hinged and rigid web-to-flange connections.
Mirambell et al. [17] developed formulas to estimate the critical elastic shear buckling coefficient based on numerical studies of plate instability of slender trapezoidal web panels. The geometric parameters and the flange inclination were considered to estimate shear buckling strength. Abu-Hamd et al. [2] conducted an approximate empirical formula for the shear buckling strength of trapezoidal web plate girders with intermediate panels subjected to combined pure bending and shear stresses. The impact of several design variables, such as the slenderness ratio of the web and flange, aspect ratio, and taper angle of the trapezoidal web panels, on the behavior has previously been explored by researchers [18,19,20,21]. Moreover, Serror et al. [22] investigated the effects of various design parameters on the prediction of the elastic shear buckling and nominal shear strengths of trapezoidal-end web panels. Studer et al. [23] carried out an experimental program to find the most exact ways to calculate the panel’s shear strength. It was concluded that the Modified Shear Method accurately expected the shear to resist. AbdelAleem et al. [24] used the effective soft computing technique to create a design expression to determine the elastic critical shear buckling of trapezoidal web plate girders. The developed computing models were trained, validated, and tested using a dataset of 427 experiment results. However, the proposed design models seemed too lengthy and complex, which prevented their use in design procedures. As a result of the lack of studies on the shear buckling strength of tapered web plate girders, EC3 [15] adopted a design recommendation with some changes to the original formula, given in Equation (1), suggested by Timoshenko et al. [11] to determine the shear buckling coefficient for tapered plate girders. These changes incorporated utilizing the greater panel depth for larger taper angles (more than 10°) and the smaller panel depth for smaller taper angles (less than 10°). In AISC 360-22 [25] and EC3 [15], the shear buckling coefficient is used to determine the shear strength of web plates. The accuracy of the estimation of the shear buckling coefficient influences the accuracy of the prediction of the shear resistance of web plates. It is also concluded that these codes use plate buckling coefficients that are used for constant depth members, which will not provide a reasonable prediction for tapered members.
In contrast with trapezoidal plates, few studies have been conducted to estimate shear buckling for prismatic plates. Ibrahim et al. [26] proposed new formulas for prismatic web plates for the shear buckling coefficient from extensive finite element models. Three web boundary conditions were considered: fixed edges, simply-supported edges, and flange-restrained edges. Two parameters were used in the predictive model, including the tapering ratio () and the normalized length ratio (α). It is worth mentioning that the range of these parameters is 1–5 and 3–10, respectively. It was found that the formula proposed by Ibrahim et al. [26] has a good approximation within the specified range. However, the accuracy of the equation beyond that range is uncertain and may come into question.
The previous study indicates that the current expressions either assume the prismatic plate to have a constant depth or provide results for a specific geometry range. In all cases, none of these expressions consider the influence of plate slenderness on the shear buckling coefficient. This highlights the necessity for further research to investigate the buckling behavior of prismatic plates subjected to shear load. In this study, comprehensive numerical analyses are performed to evaluate how the shear buckling coefficient of prismatic web plates with simply-supported boundaries is influenced by three factors: the panel tapering ratio, the normalized length ratio, and, critically, the previously unexamined slenderness ratio. The consideration of slenderness effects represents a novel contribution, providing initial evidence of their significance in evaluating shear buckling factors for tapered and prismatic sections. By encompassing practical geometric ranges and identifying the role of slenderness, this study significantly advances the understanding of shear instability in prismatic web plates. This research establishes a basis for incorporating slenderness effects into the prediction of shear buckling coefficient, allowing improved accuracy in critical shear buckling load estimates. This will support the optimized structural design and promote the continued adoption of efficient tapered members.
2. Methodology
2.1. Analysis Procedure
The following procedures were used to develop the prediction models:
- Determined the variables (inputs) that may impact the local shear buckling coefficient (output) estimate. The selected parameters were based on outcomes from previous studies.
- The ANSYS V.2021 software program was used to estimate the theoretical shear buckling stress of the prismatic web plates.
- The elastic buckling load was determined for each model from eigenvalue analysis, and the local shear buckling coefficient was determined using the Timoshenko and Gere formula (Equation (1)).
- Constructed the dependence charts, which revealed the interactions between the input parameters and the local shear buckling coefficient.
- Carried out the regression analysis of the dataset by using MATLAB V.2020 software to obtain a conservative model for design purposes.
2.2. Influencing Parameters
The fundamental parameters governing the predicted shear buckling coefficient for prismatic web plate girders based on outcomes from previous studies [11,13,14,15,16,17,18,19,20,21,22,23,24,26,27,28,29,30] are:
- i.
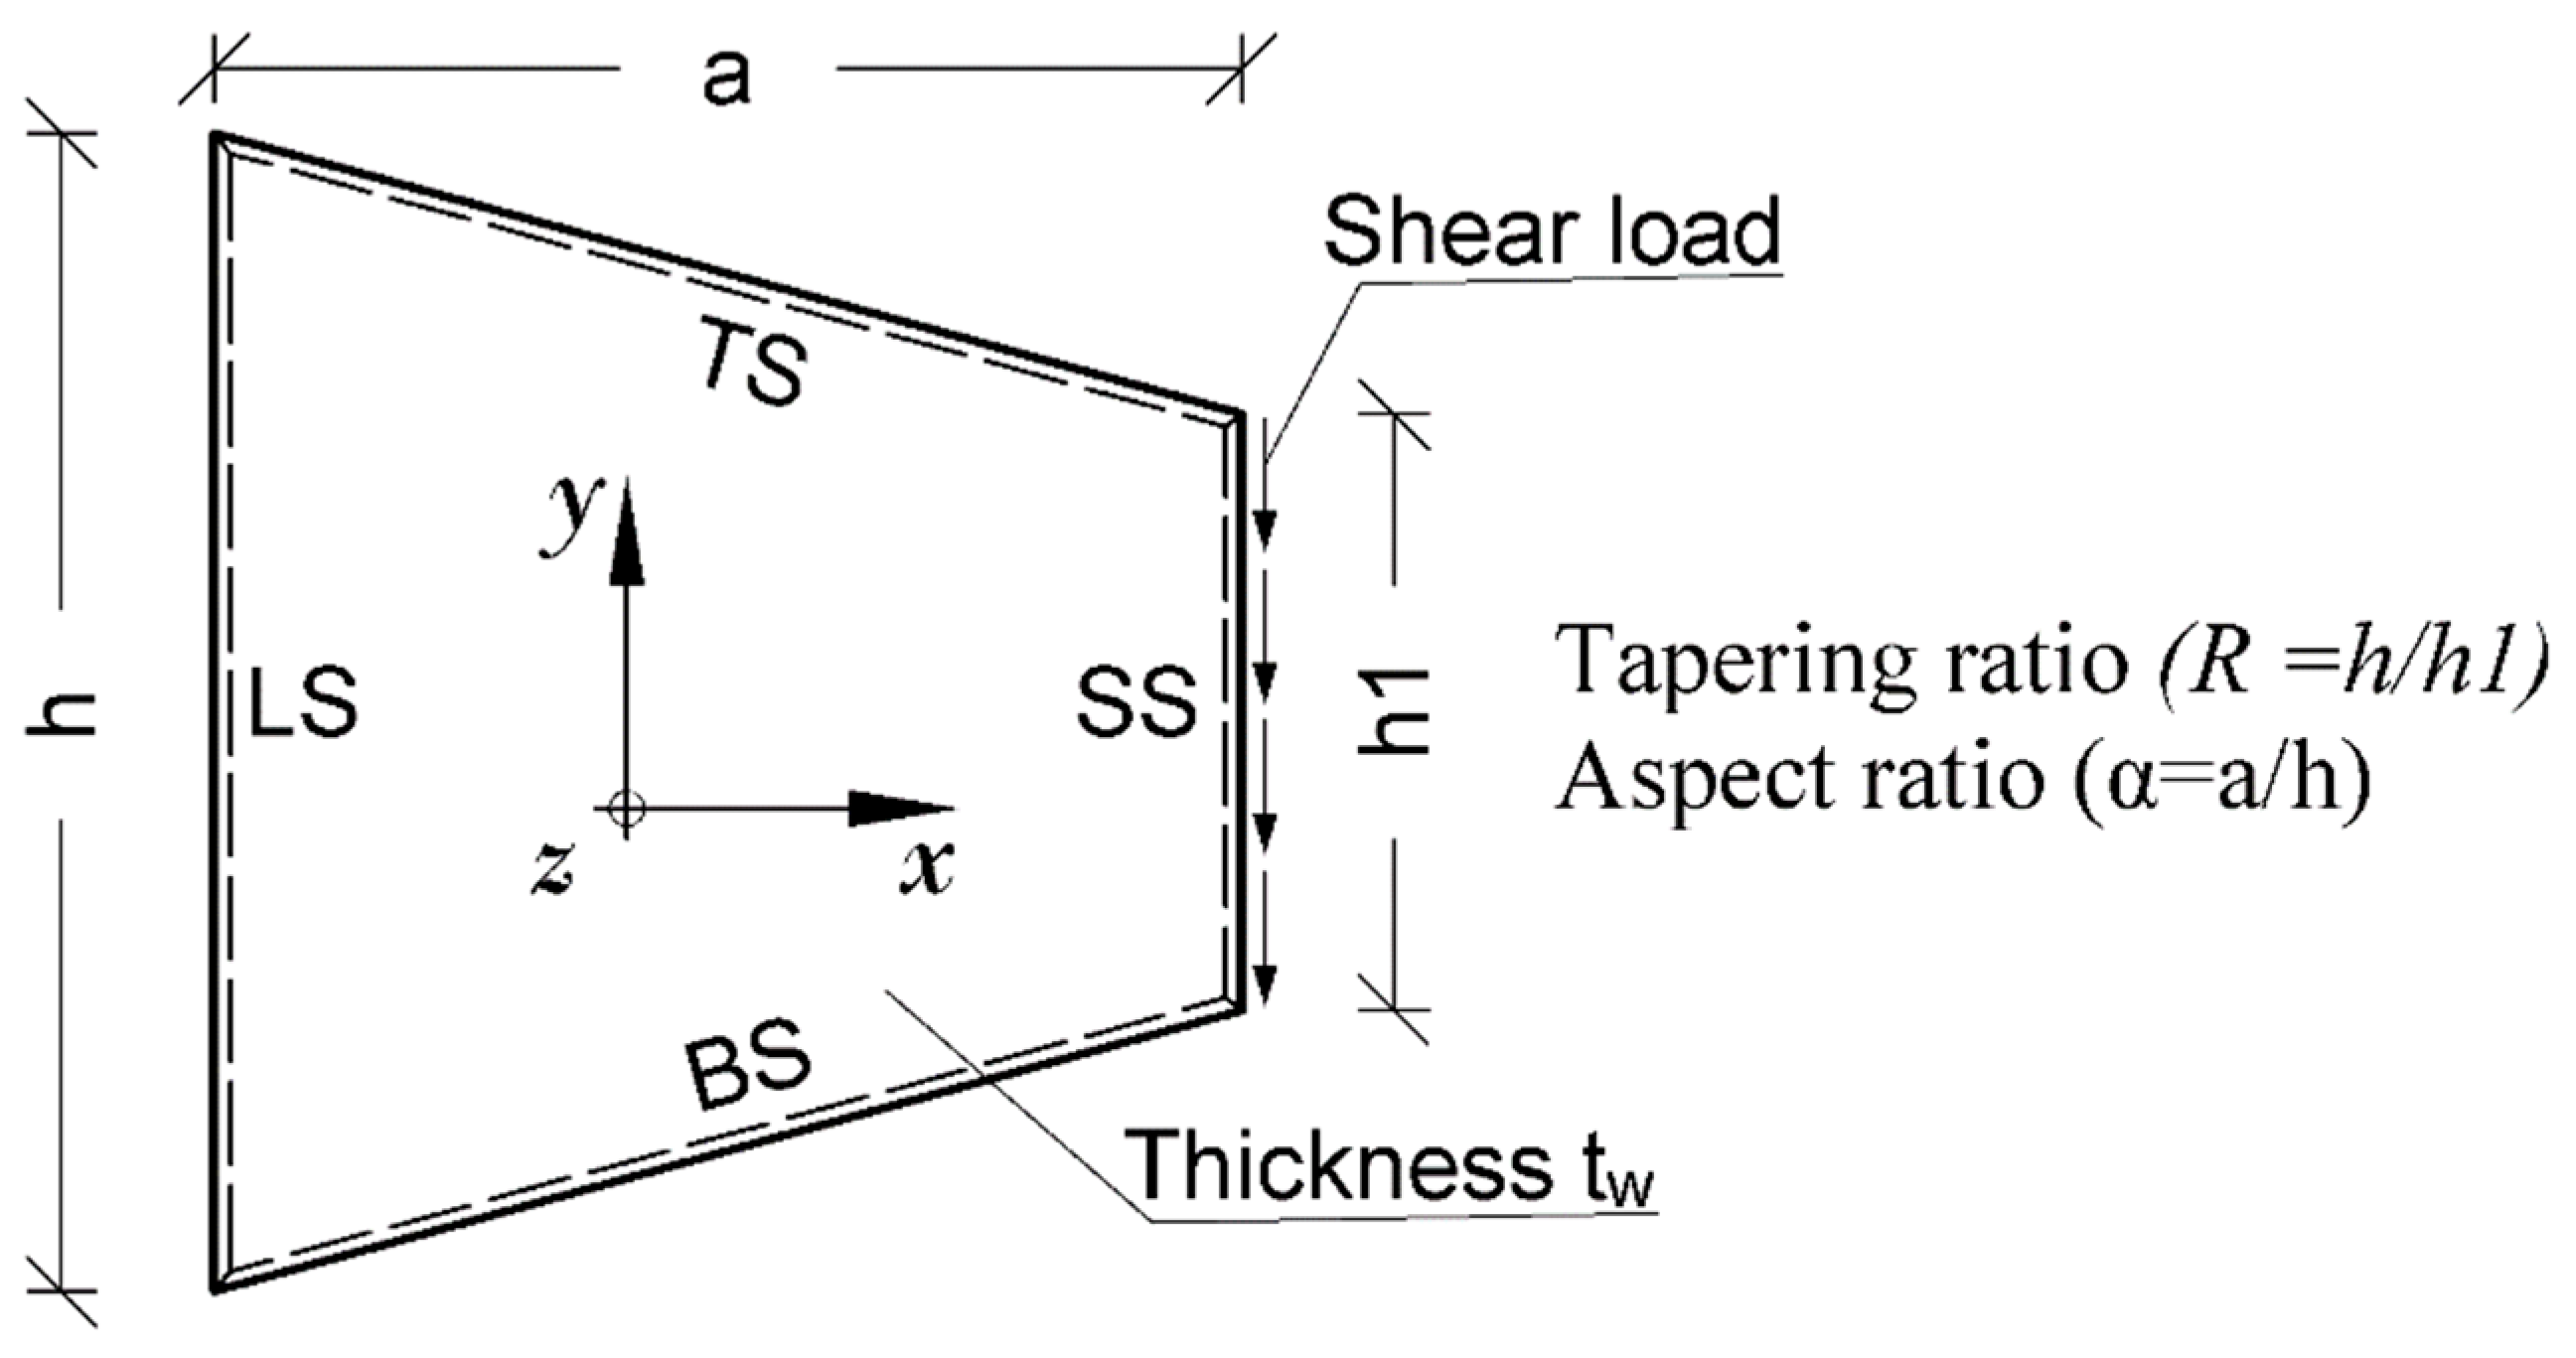
- The geometric characteristics of the web panels include aspect ratio (α = a/h), where is the aspect ratio and h is the larger width, tapering ratio (R = h/h1) or inclination angle, where is the tapering ratio and h1 is the smaller width, and web slenderness ratio , where is the plate thickness, as well as boundary and loading conditions, as illustrated in Figure 2.
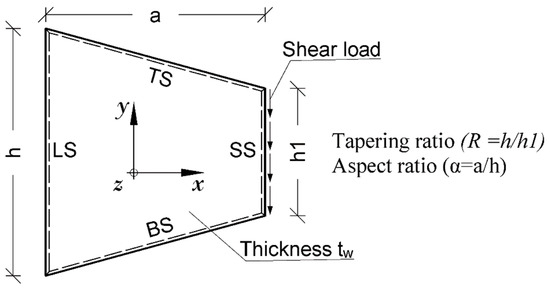 Figure 2. Parameters and schematic drawing for pure shear loading models.
 - ii.
- Material properties such as modulus of elasticity (E) and Poisson’s ratio (ν).
The previous studies [11,14,27,31,32,33] on trapezoidal plate girders showed that the shear buckling stress is contingent on the aspect ratio (α = a/h), tapering ratio R (h/h1), and web slenderness ratio (inverse relationship). The tapering ratio and aspect ratio are incorporated in the shear buckling coefficient, whereas the web slenderness ratio is given in the critical shear buckling formulas. Since the study is limited to simply-supported prismatic plates subjected to shear load, the influence of the flanges on the elastic local buckling coefficient is ignored, since the boundary conditions of the plate are four simply-supported edges. The limits of each parameter are shown in Table 1. The tapering ratio R ranges from 1 to 8 to cover a large domain of prismatic geometry, and the aspect ratio α ranges from 0.3 to 8 for pure shear loading. The web slenderness ratio equals 30, 60, 100, 150, 200, 250, and 300. The steel has a linear properties with a Poisson’s ratio ν = 0.3 and modulus of elasticity E = 200 GPa [26].

Table 1.
Different ranges of the geometric and material parameters.
3. Finite Element Modeling (FEM)
3.1. General
The prismatic web plate girders are represented by the iso-parametric finite strain shell element from the software package ANSYS to study the behavior of the prismatic plate under pure shear loading by eigenvalue analysis. Eigenvalue analysis aims to obtain dynamic properties of structure such as natural frequencies, mode shape, and participation factors of the model. A four-node shell element (SHELL181) is used to construct the geometrical details of prismatic web plate models to simulate different buckling modes deformations explicitly. The SHELL181 element contains six degrees of freedom at each node, including translations in the x, y, and z directions as well as rotations about the x, y, and z-axes. Additionally, SHELL181 can model shell structures that range in thickness from thin to moderate.
3.2. Boundary Conditions
Figure 2 shows the schematic drawing of the loading location used in FEM for shear loading, where h is the larger width, h1 is the smaller width, and a is the web plate length. In the case of shear loading, the nodal force is applied and evenly distributed among the boundary nodes.
While the predicted buckling coefficient depends on the boundary conditions, simply-supported edges are considered for the panel’s transverse and longitudinal edges [34]. Table 2 shows the structural boundary conditions of prismatic web plates for simply-supported edge conditions, as suggested by Bedynek et al. [35].

Table 2.
The structural boundary conditions of prismatic web plates (0 denotes free, and 1 constrained, boundary conditions).
3.3. Mesh Size
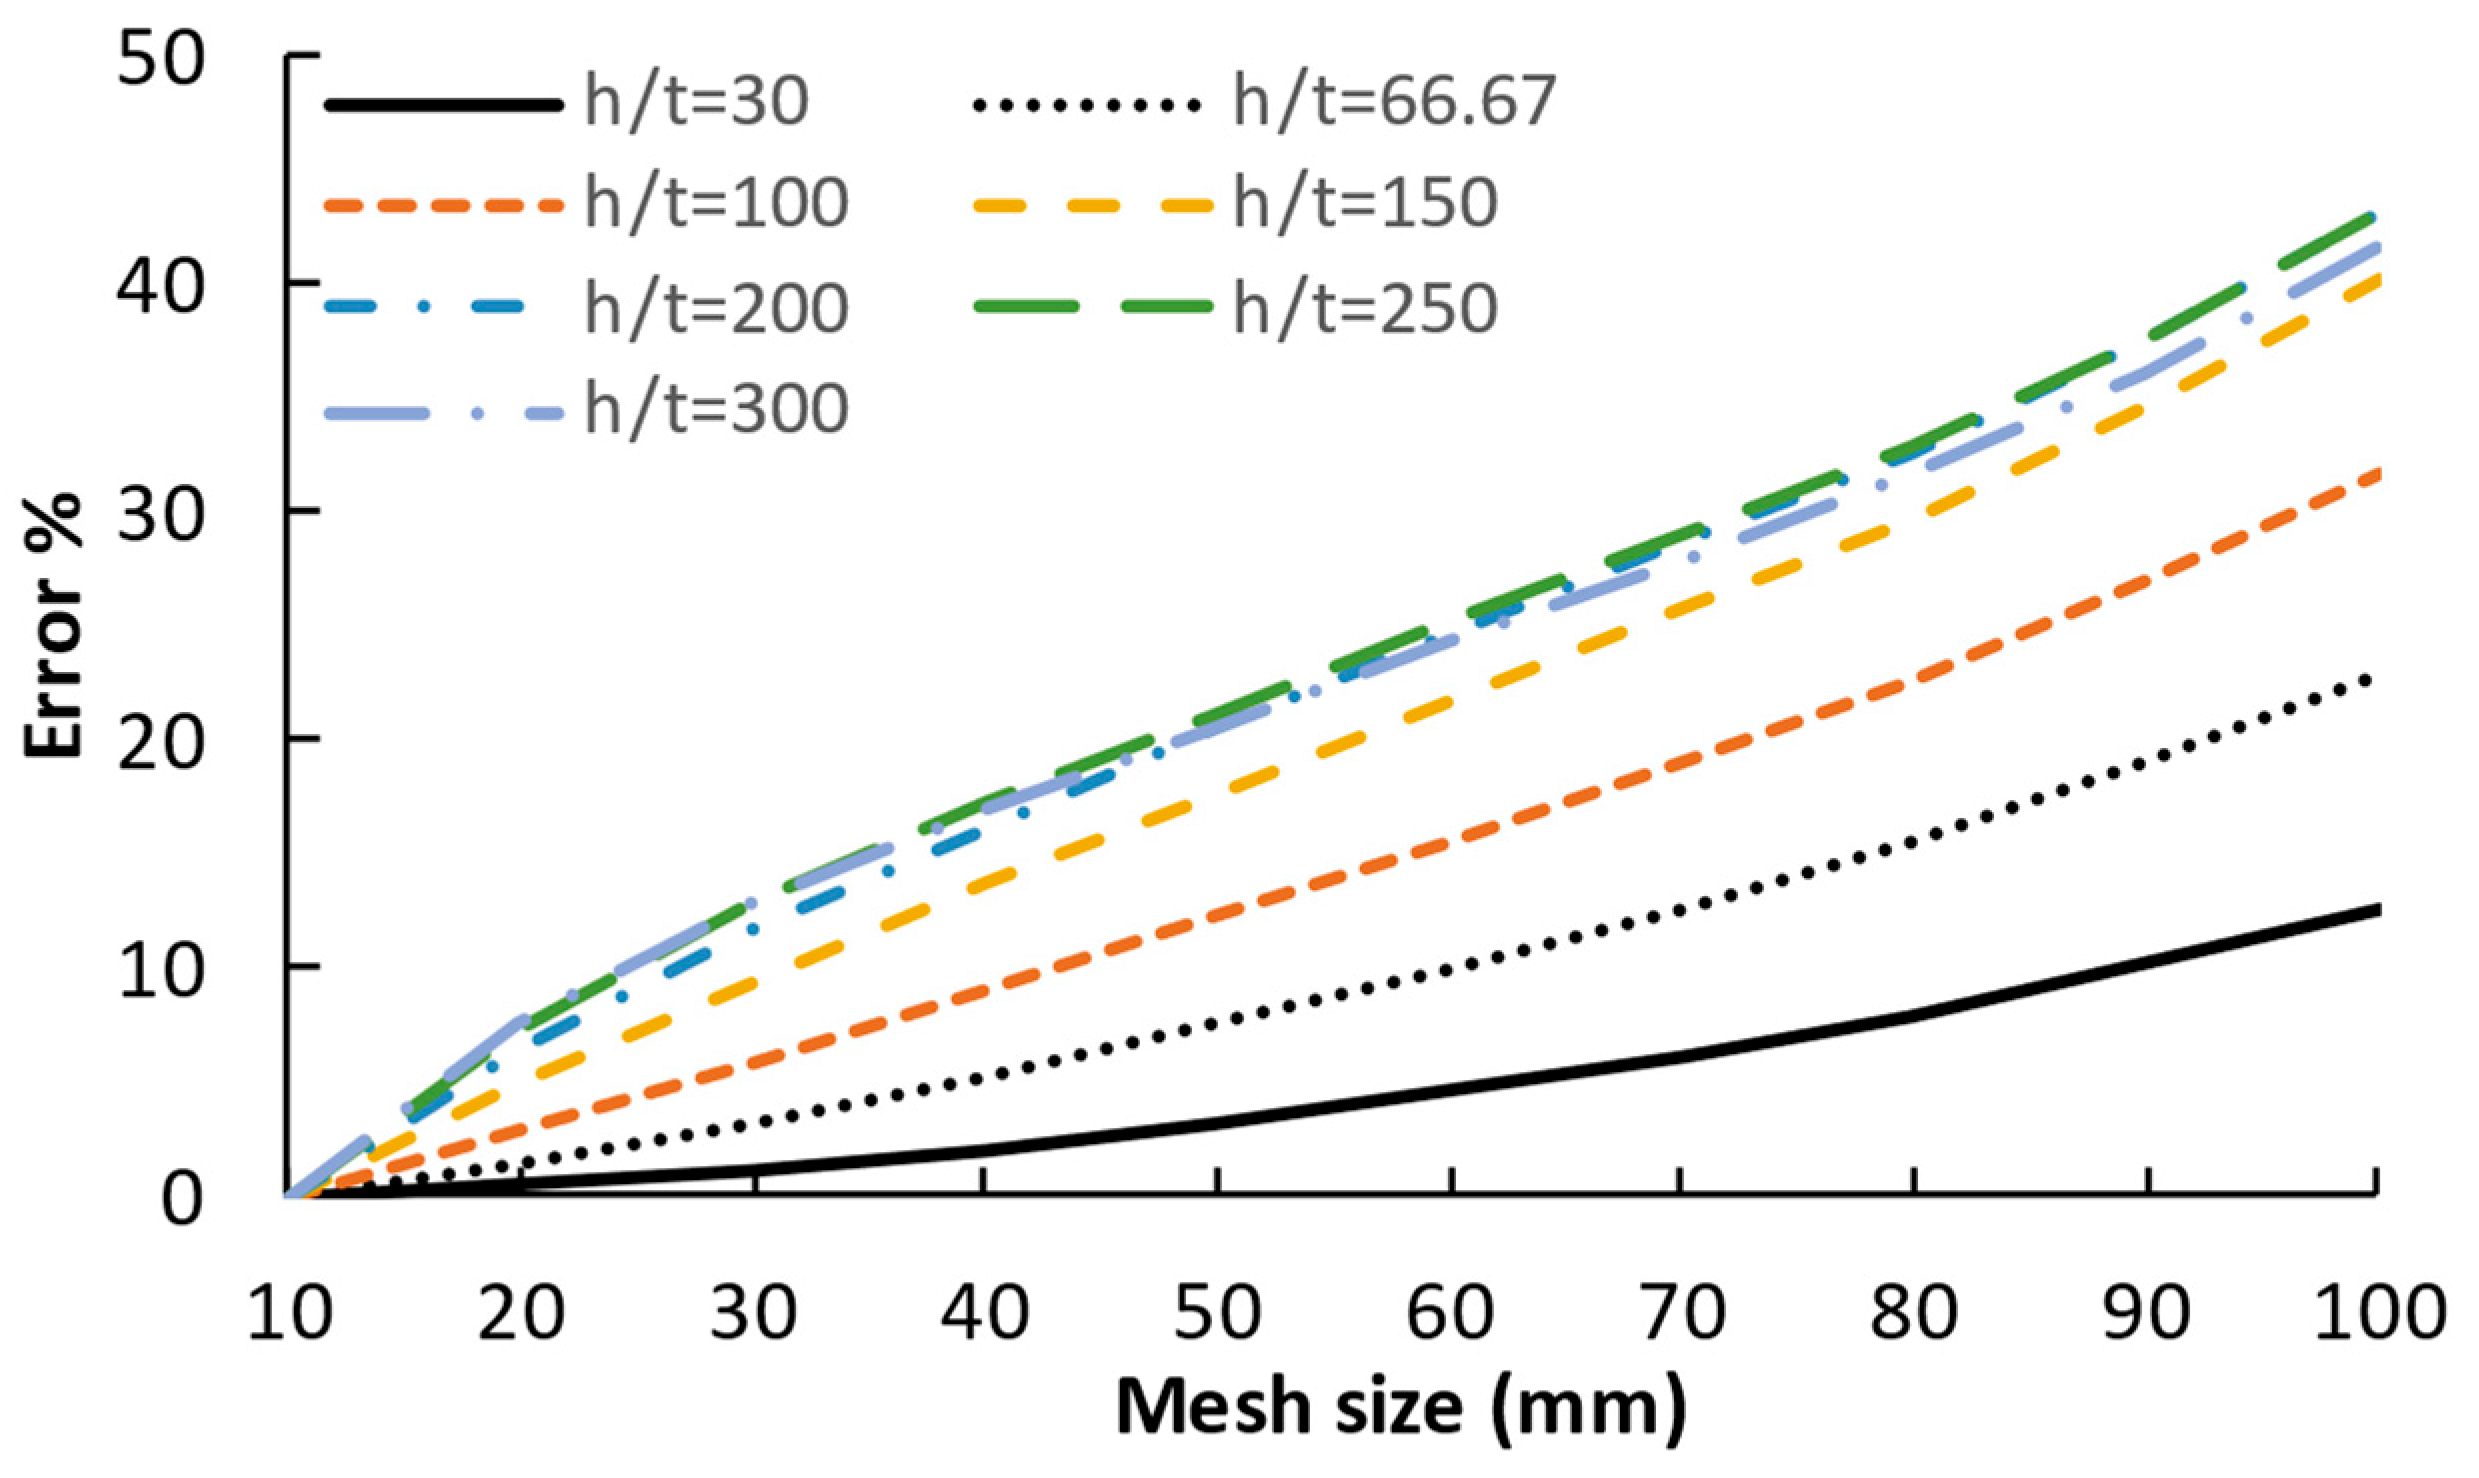
Lee et al. [28] found, based on the convergence analysis results of web plate loading in the shear case, that when the mesh size is 25 mm, the relative error between the finite element and the exact solution of shear buckling stress was 0.72. In this study, convergence analysis is conducted to choose a suitable mesh size, where the web slenderness ratios range from 30 to 300, and the mesh size ranges from 10 to 100 mm. It can be noticed from Figure 3 that, when the mesh size is 25 mm, the error percentage is 0.73%, 2.28%, 4.33%, 7.23%, 9.16%, 10.09%, and 10.28% for web slenderness 30, 66.7, 100, 150, 200, 250, and 300, respectively. So, this mesh refinement is acceptable for web slenderness 30, 66.7, and 100. For other cases, the mesh size is 10 mm to keep the error percentage below 5%. The chosen mesh sizes are employed in FEM validation as shown next.
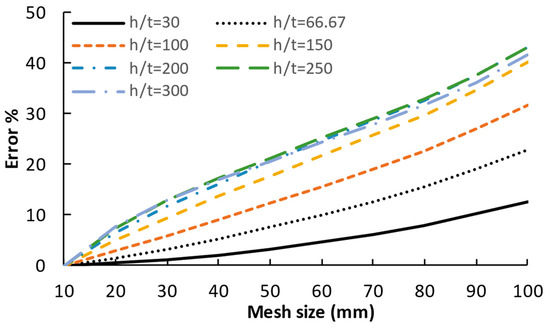
Figure 3.
Convergence analysis of FEM and accuracy results.
Generating surface mesh is a major task in tapered geometry. To achieve a reasonable meshing with a tapering geometry, the growth rate is set to 1.2. This growth rate indicates the increase in the element edge length with each subsequent layer of elements, resulting in a 20% increase in the element edge length for each successive layer. It shall be noted that reducing the growth rate closer to 1 would generate a finer mesh further away from the boundary. While this can improve accuracy, it also significantly increases the computational cost. On the other hand, increasing the growth rate would lead to a coarser surface mesh with triangular elements, which is not recommended for the SHELL181 element.
4. Validation of the Finite Element Model
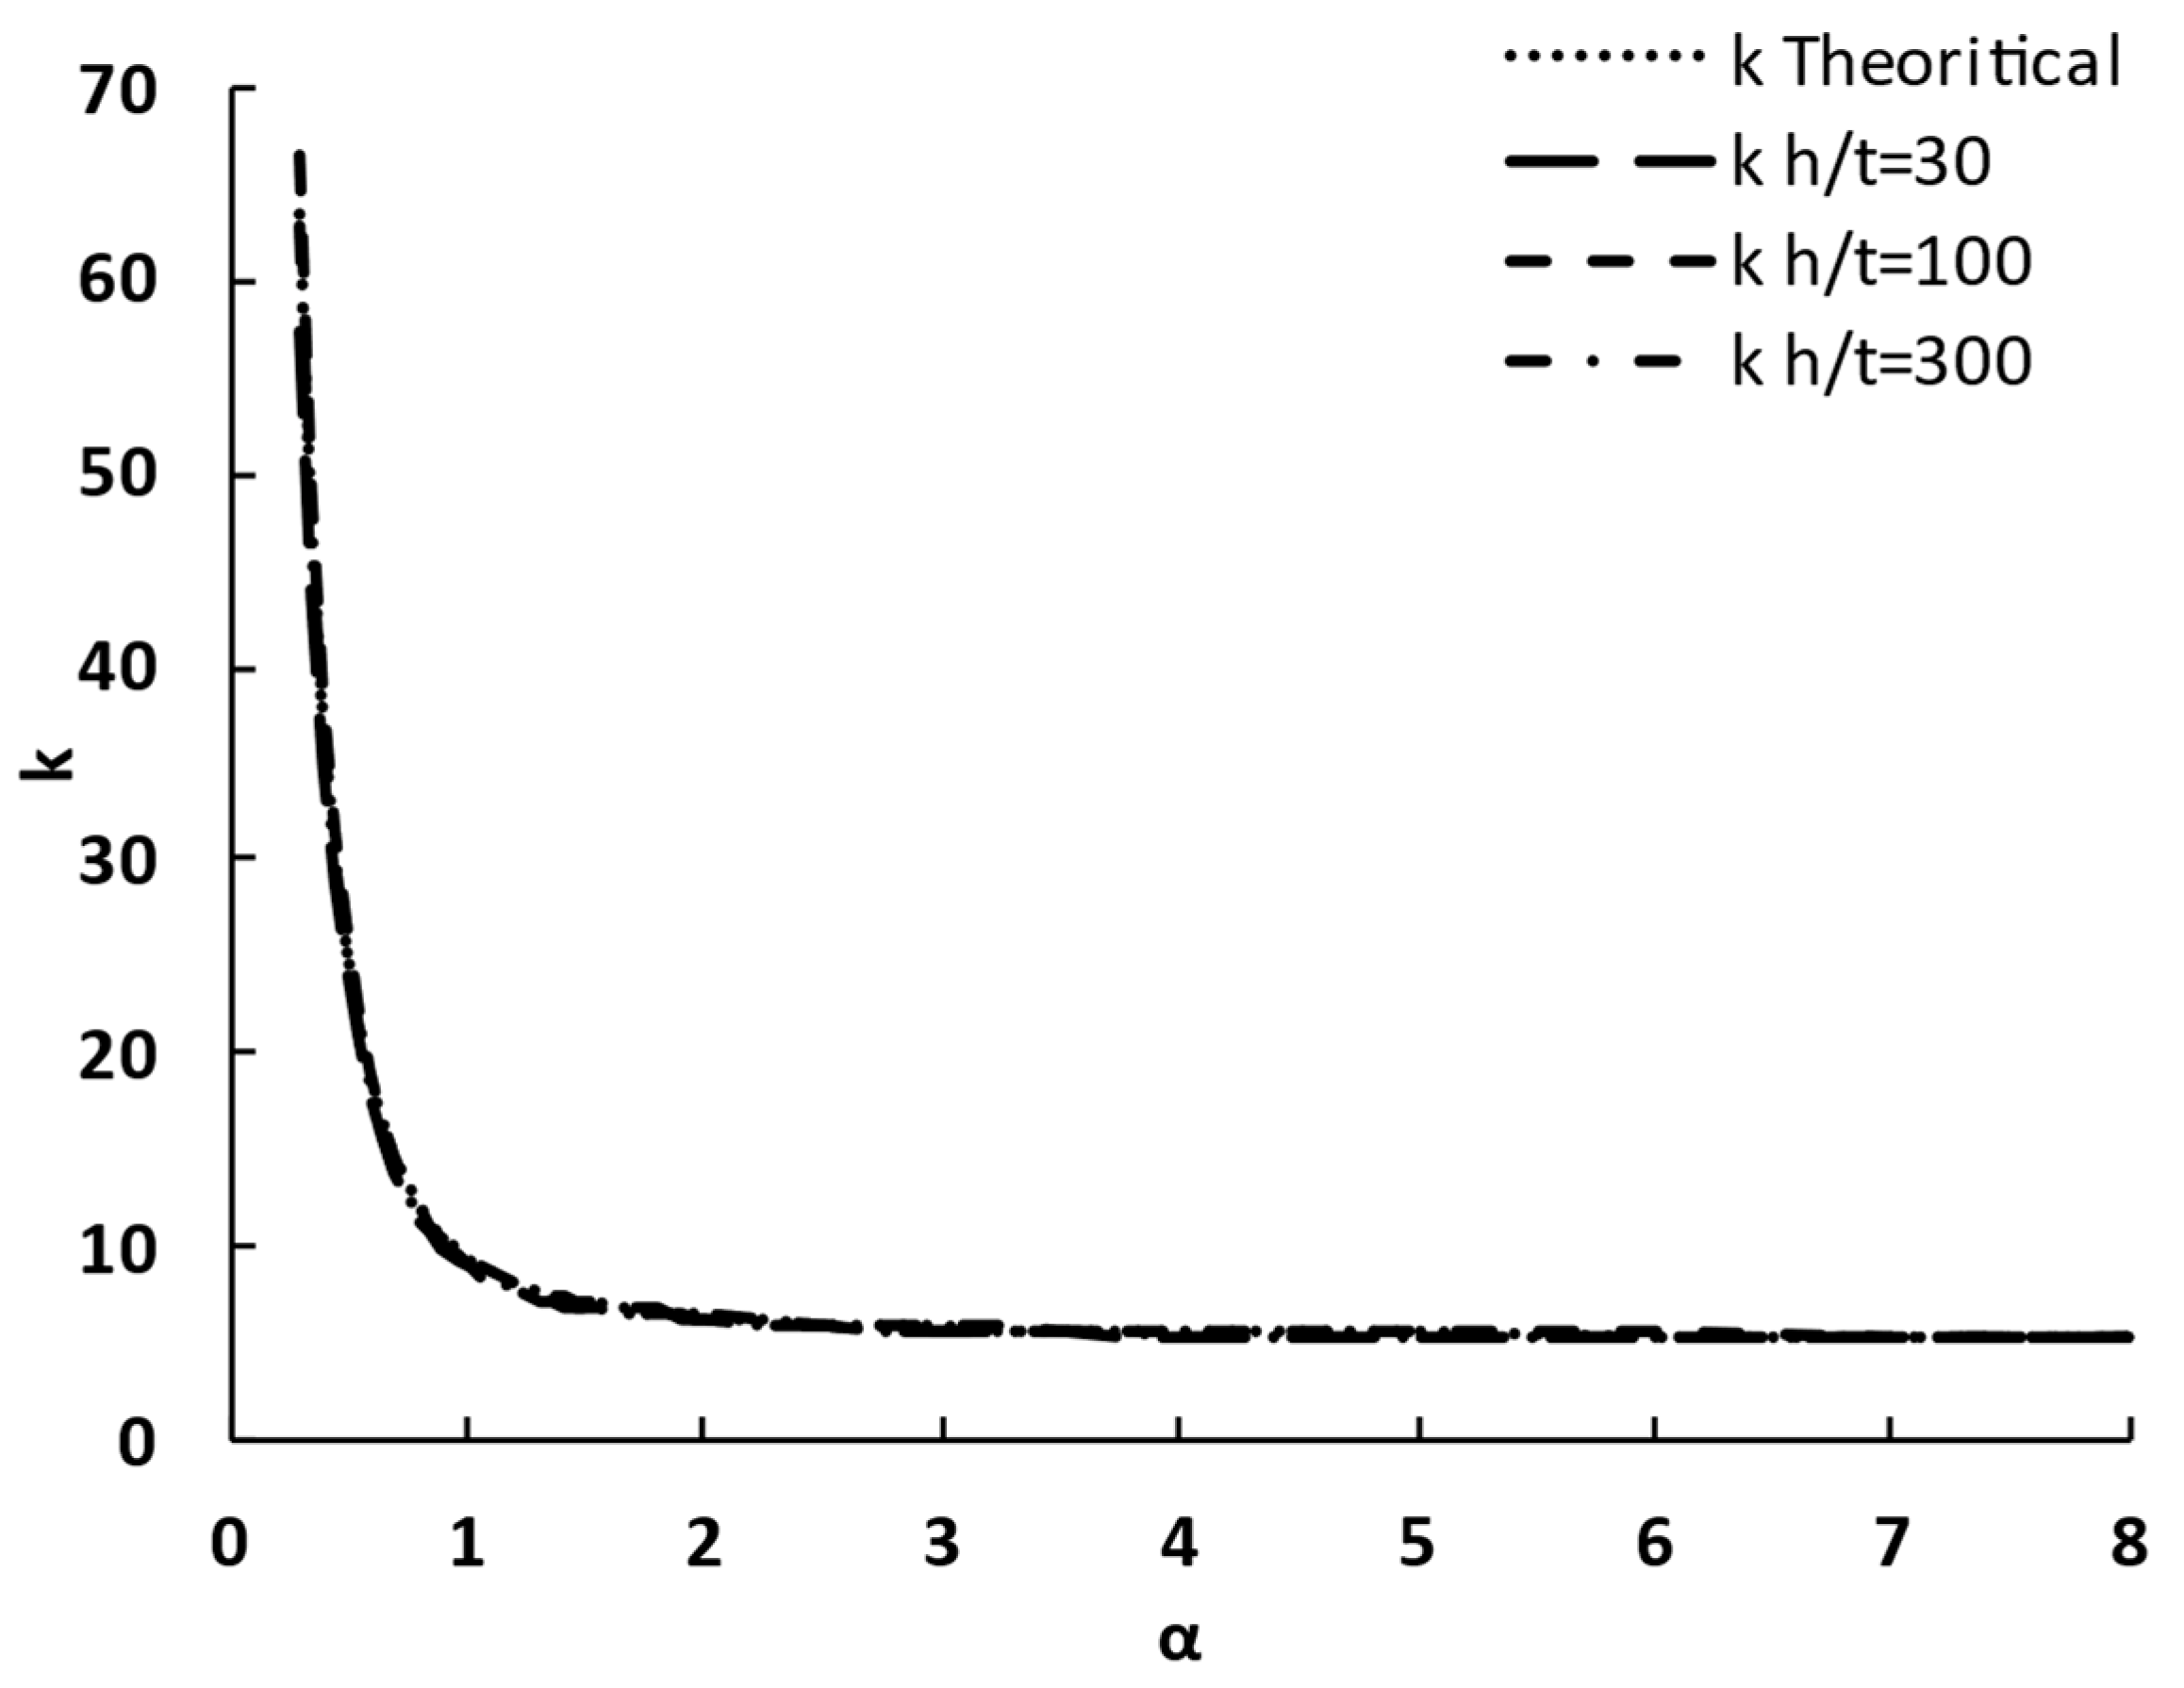
The proposed (FE) model has been validated against the theoretical buckling coefficient proposed by Timoshenko et al. [11]; the formula given in Equation (1). The predicted values from (FE) model were obtained using eigenvalue analysis. Table 3 and Figure 4 show the comparisons of the theoretical and predicted critical buckling coefficient of simply-supported rectangular plates (R = 1.00) subject to pure shear loading conditions. The last column of Table 3 shows that the differences between theoretical and FEM values are very small. In addition, the findings from Figure 4 show that the FEM results align well with the theoretical result. Therefore, the proposed (FE) model can be employed to accurately forecast the elastic buckling of prismatic web plates under pure shear loading.
where is the length of the panel and is the depth of the panel.

Table 3.
Validation of the FE model for predicting the critical buckling coefficient under shear load “tapering ratio (R =1.00)”.
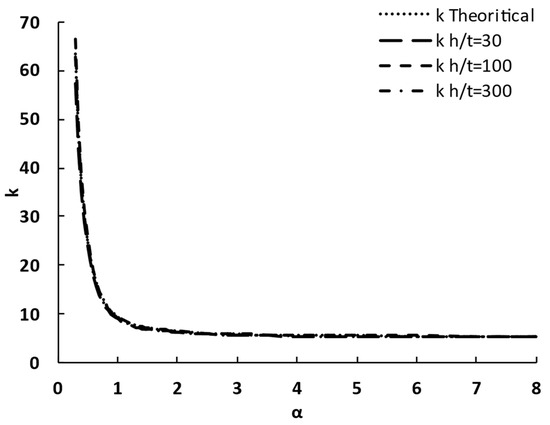
Figure 4.
Theoretical and FEM buckling coefficient for rectangular web plates.
It is important to highlight that Timoshenko’s analysis considered only equations that allowed for a buckling pattern symmetric about the midpoint of the plate. However, this approach had a limitation, leading to a small error in critical stress for cases where the governing buckling pattern was antisymmetric rather than symmetric, as presented by Stein et al. [36]. The largest effect of antisymmetric buckling occurs when the plate is subjected to two large buckles, and this occurs when the value of α ranges between 2.1 and 3.4. So, the FEM results are validated with antisymmetric buckling findings proposed by Stein and Neff as shown in Table 4. It is determined that the maximum difference between FEM results and the theoretical results does not exceed 1.36%, concluding that the FE modeling approach is appropriate.

Table 4.
Validation of the FE model for predicting the critical buckling coefficient with the ones proposed by Stein et al. [36].
In addition, the (FE) model was verified with the experimental work done by Bedynek et al. [14], where the shear critical buckling load is measured for tapered steel beams. It can be concluded from Table 5 that the proposed (FE) model proposes a reasonable approximation with the experimental work, since the maximum difference between FEM and actual results does not exceed 2%.

Table 5.
Comparison between experimental work done by Bedynek et al. [14] and the proposed FE model of critical shear buckling load and ultimate shear load.
5. Parametric Study and Finite Element Results
The developed finite element model is employed to conduct a comprehensive parametric investigation to analyze the effects of various geometric parameters on the shear buckling coefficient. The studied parameters are the aspect ratio, tapering ratio, and web slenderness ratio. The range of parameters studied covers a broad spectrum, ensuring that they remain within a practical range, as explained in Table 1.
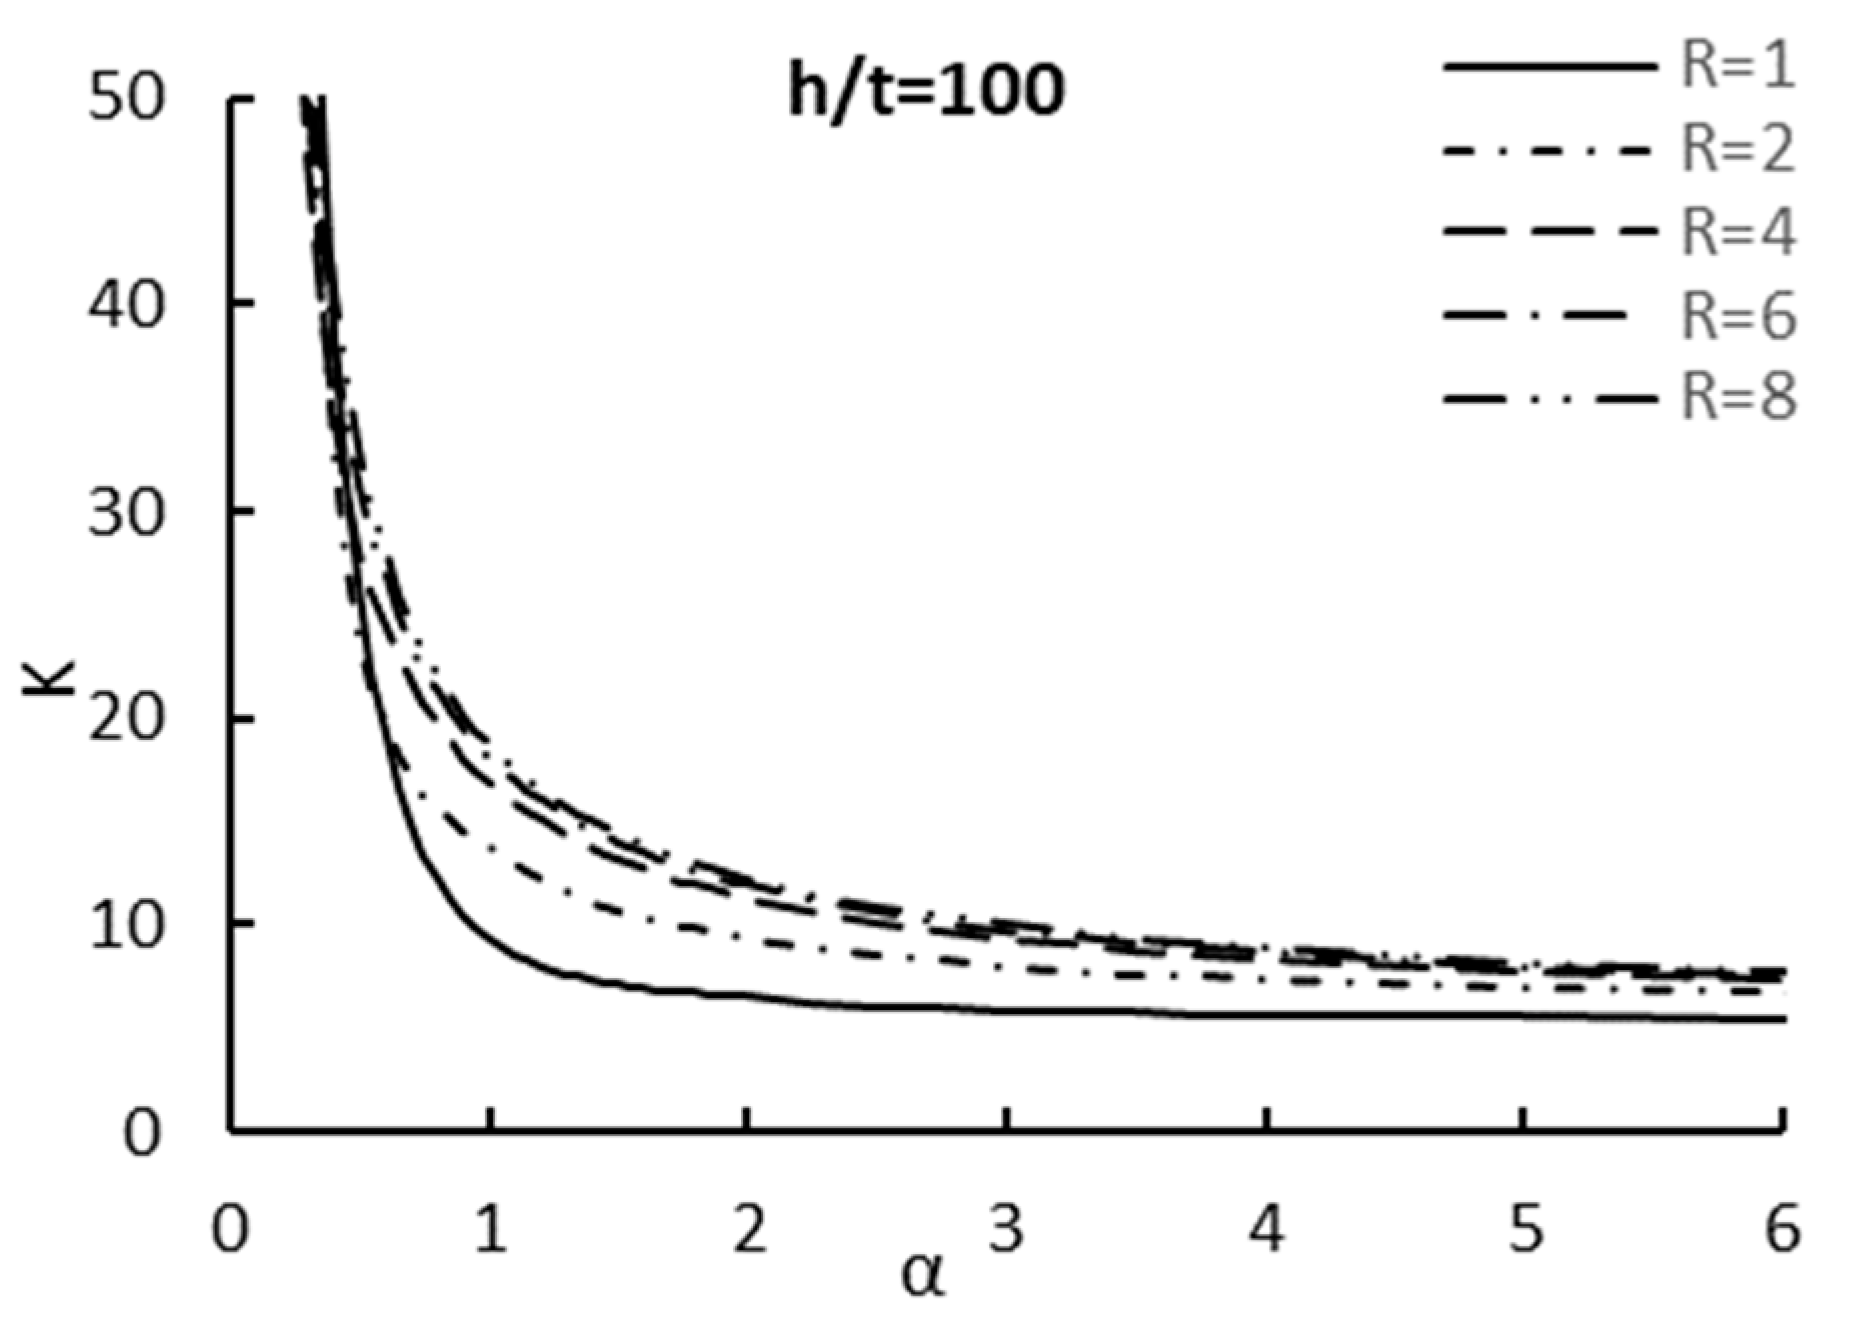
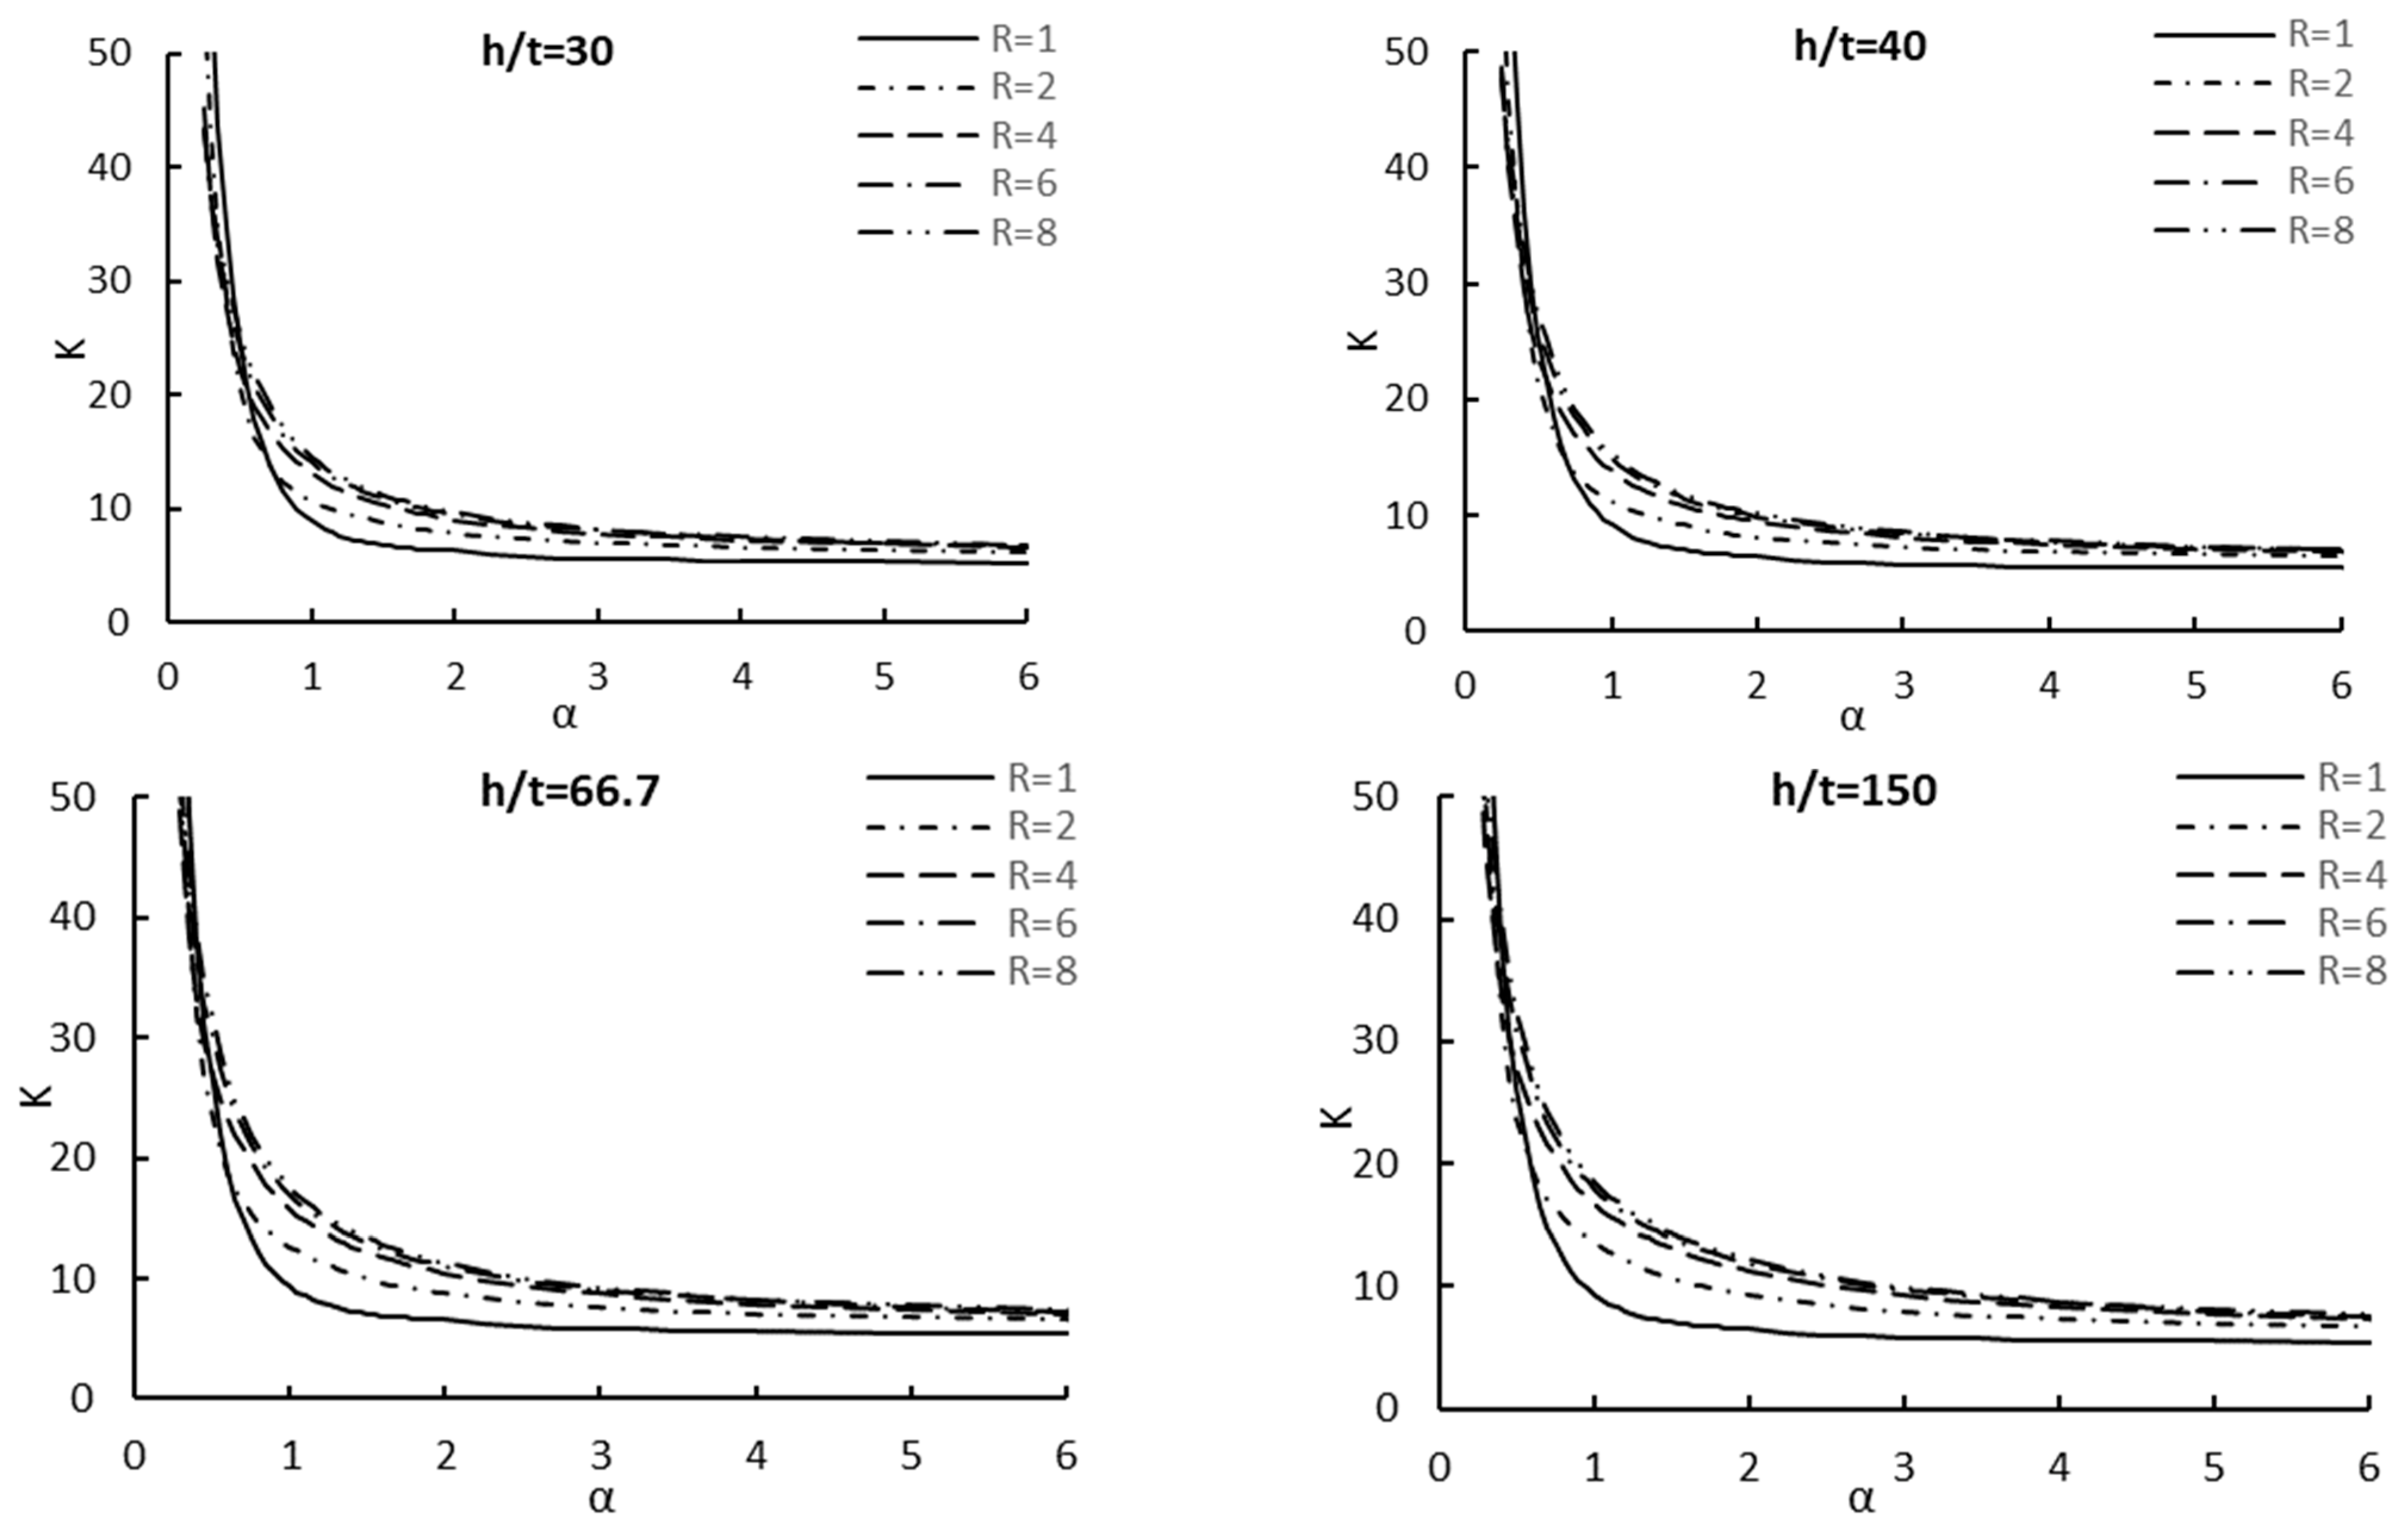
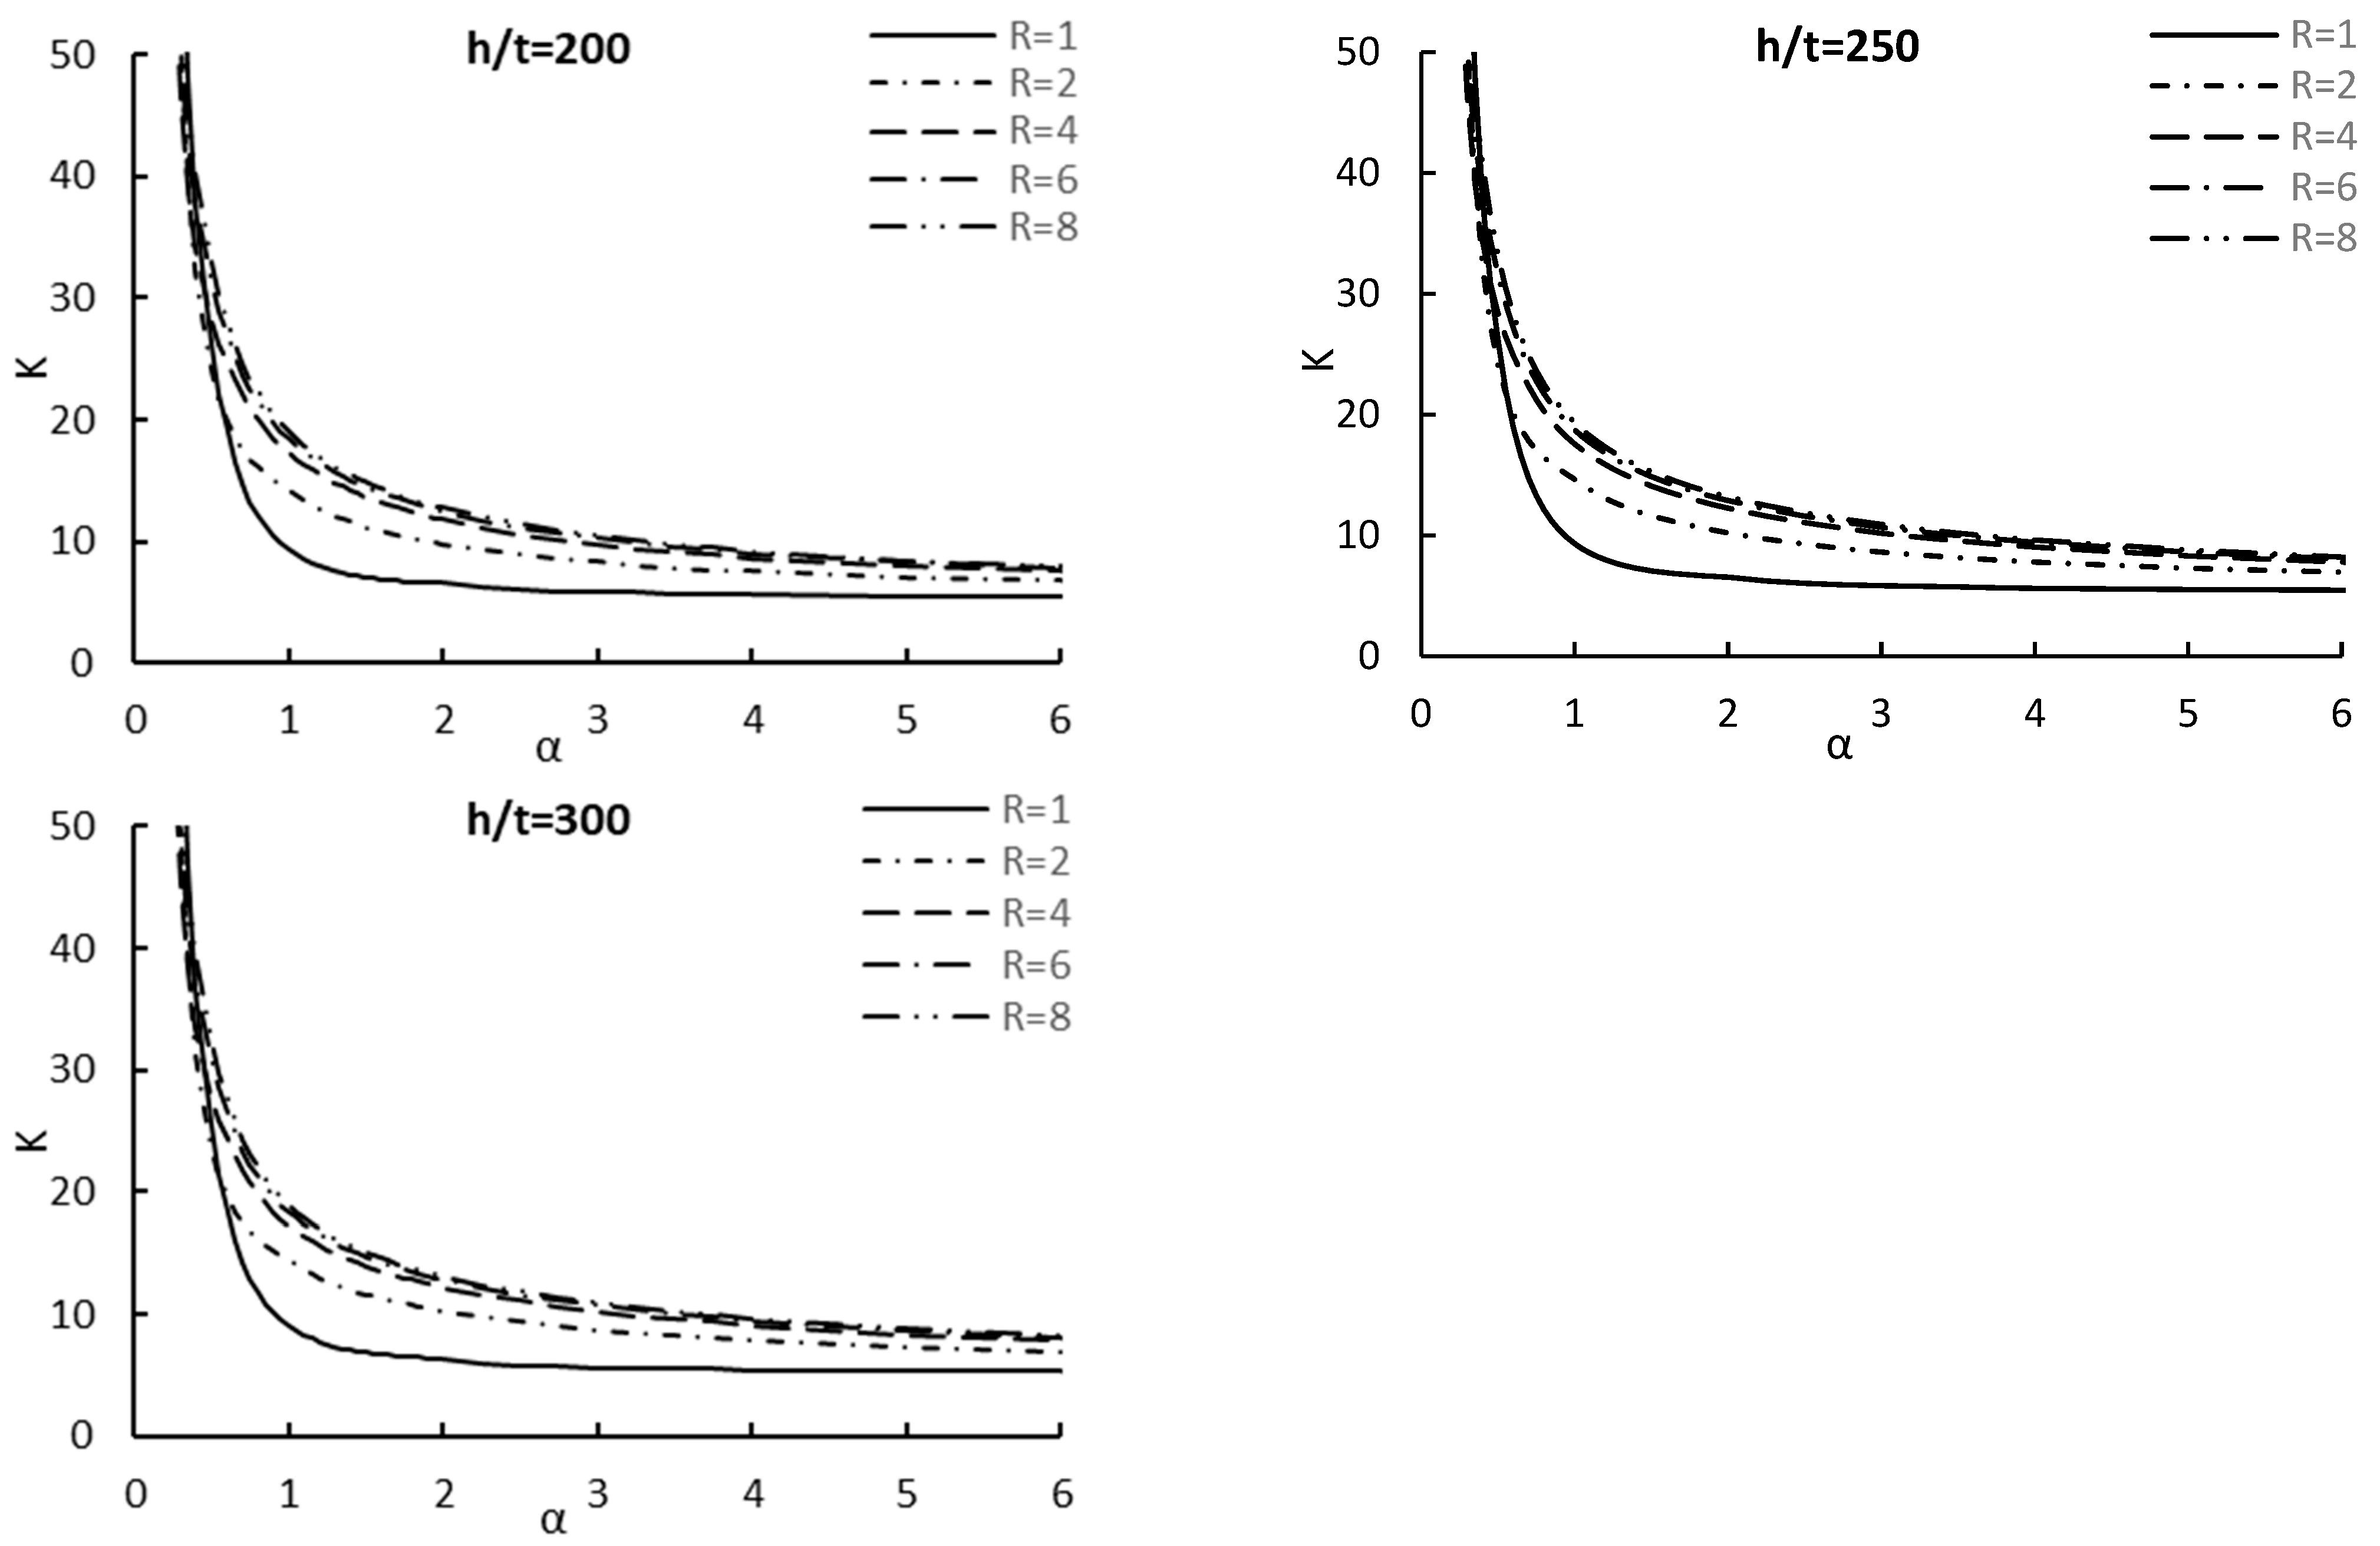
The outcomes of the parametric study are shown in Figure 5 for a slenderness ratio equal to 100, where the outcomes for other slenderness ratios are illustrated in Appendix A. It can be observed that, for all values, declines sharply with a raise of α up to 1.00, after which the rate of decrease becomes smaller. The plate under shear loading experiences both tensile and compressive stresses. For a rectangular plate, these principal stresses are oriented at 45 degrees to the shearing direction and have a magnitude equivalent to the applied shear stress. The resulting compressive stresses promote buckling, which is resisted by tensile stresses developing perpendicular to them. This tension–compression stress interaction, called “tension field action”, contributes to the buckling behavior. Unlike pure edge compression, the shear buckling mode shape involves multiple overlapping waveforms, complicating prediction. Despite that, the buckling coefficient-aspect ratio curve under shear loading resembles the corresponding one under compression loading [34] in having a sharp decline in the first part of the curve, which represents the first half wave buckled mode in the compression case. In addition, as the tapering ratio R increases, the smaller depth becomes stiffer compared to the wider depth, resulting in an increased k value. However, this stiffening effect diminishes as the aspect ratio α increases because it separates the stiffer zone “at edge” of the web from the less stiff zone “at edge”, which may lead to the occurrence of a different buckling mode.
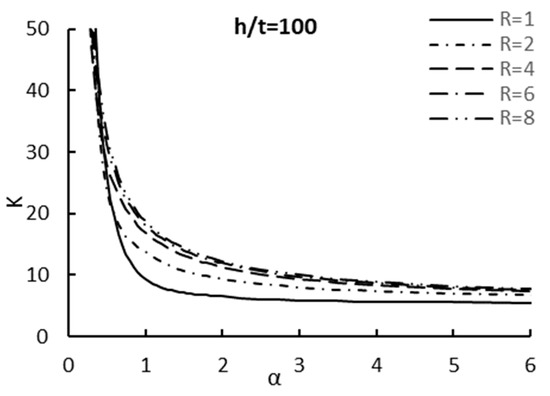
Figure 5.
Shear buckling coefficient vs. aspect ratio for slenderness ratio equals to 100.
6. Proposed Formula for the Shear Buckling Coefficient
6.1. Development of the Proposed Formula
This study proposes a formula to estimate the shear buckling coefficient of prismatic web plates. From the parametric study, it can be concluded that the shear buckling is mainly dependent on , and is inversely proportional to . However, other parameters, such as and the coupling effect of and , are employed to enhance the prediction accuracy of the proposed formula. By performing regression analysis of the generated FEM data, the following equation is proposed to predict :
where is a correction factor.
As discussed earlier, the influence of the slenderness ratio on the elastic shear buckling is considered in this study. Sensitivity analysis has been employed to study the impact of the slenderness ratio, where the effect of the slenderness ratio is expressed by the normalized slenderness ratio . Sensitivity analysis provides valuable insights for the estimation of formulas by identifying which input parameters have the most significant impact on the formula’s output. It quantifies the relationships between variables, validates assumptions, and assesses the formula’s robustness. This analysis guides data collection efforts, and helps optimize the formula’s structure by understanding the uncertainties associated with the formula’s predictions. In this study, sensitivity analysis has been employed using the cosine amplitude method given by Monjezi et al. [29] to study the influence of input parameters on the output “critical buckling coefficient ”, and the following expression measures the strength ratio () between independent input and dependent output variable within the range (0 ≤ ≤ 1) [30]:
where is the size of the test samples.
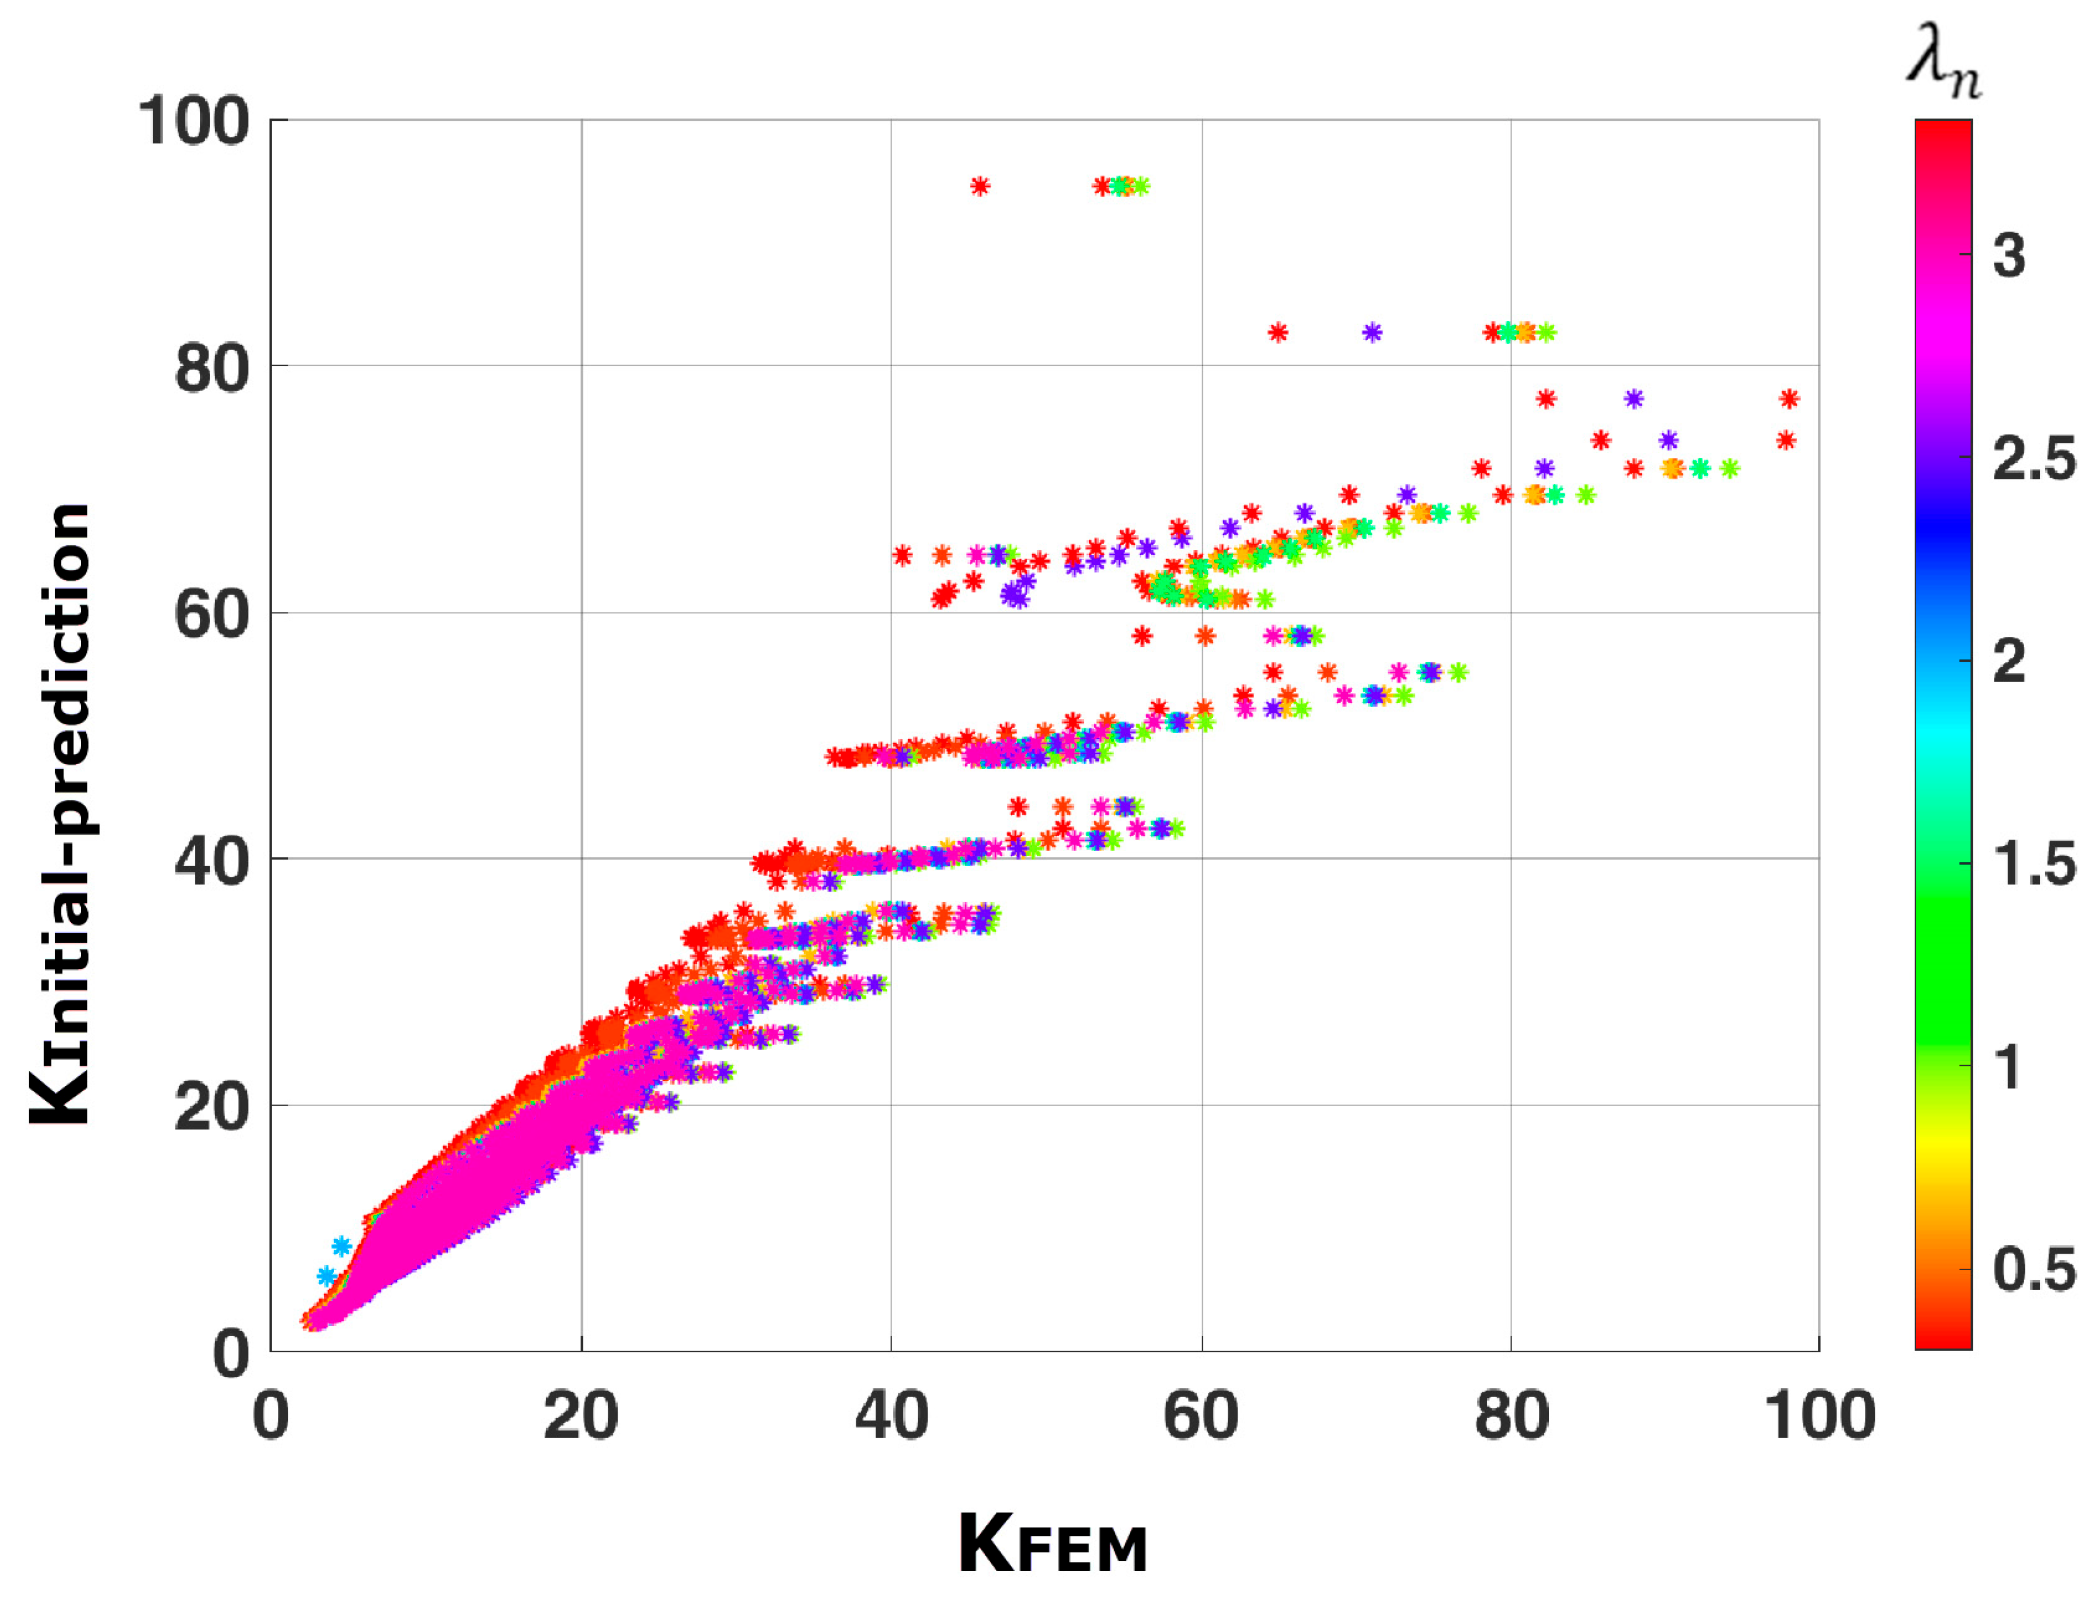
As discussed, k is inversely proportional to . So, is employed in the sensitivity analysis to measure the aspect ratio’s strength ratio. To investigate the relationship between and , the initial prediction of the buckling coefficient is calculated by setting the slenderness correction factor in Equation (2) to 1. The performance of for several normalized slenderness ratios is shown in Figure 6. The difference between the FEM and predicted values is related to the change in , and the difference is more significant with large values. So, is employed in the sensitivity analysis to measure its strength ratio.
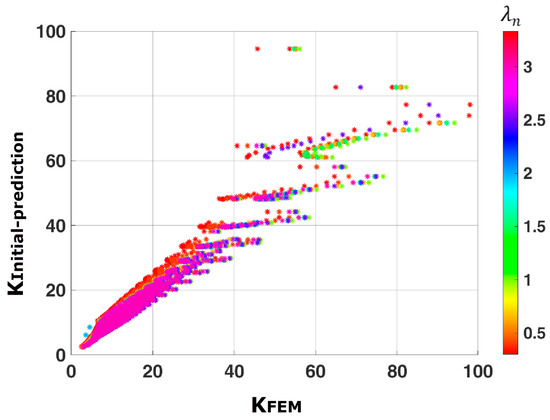
Figure 6.
Initial prediction to evaluate the effect of the slenderness ratio.
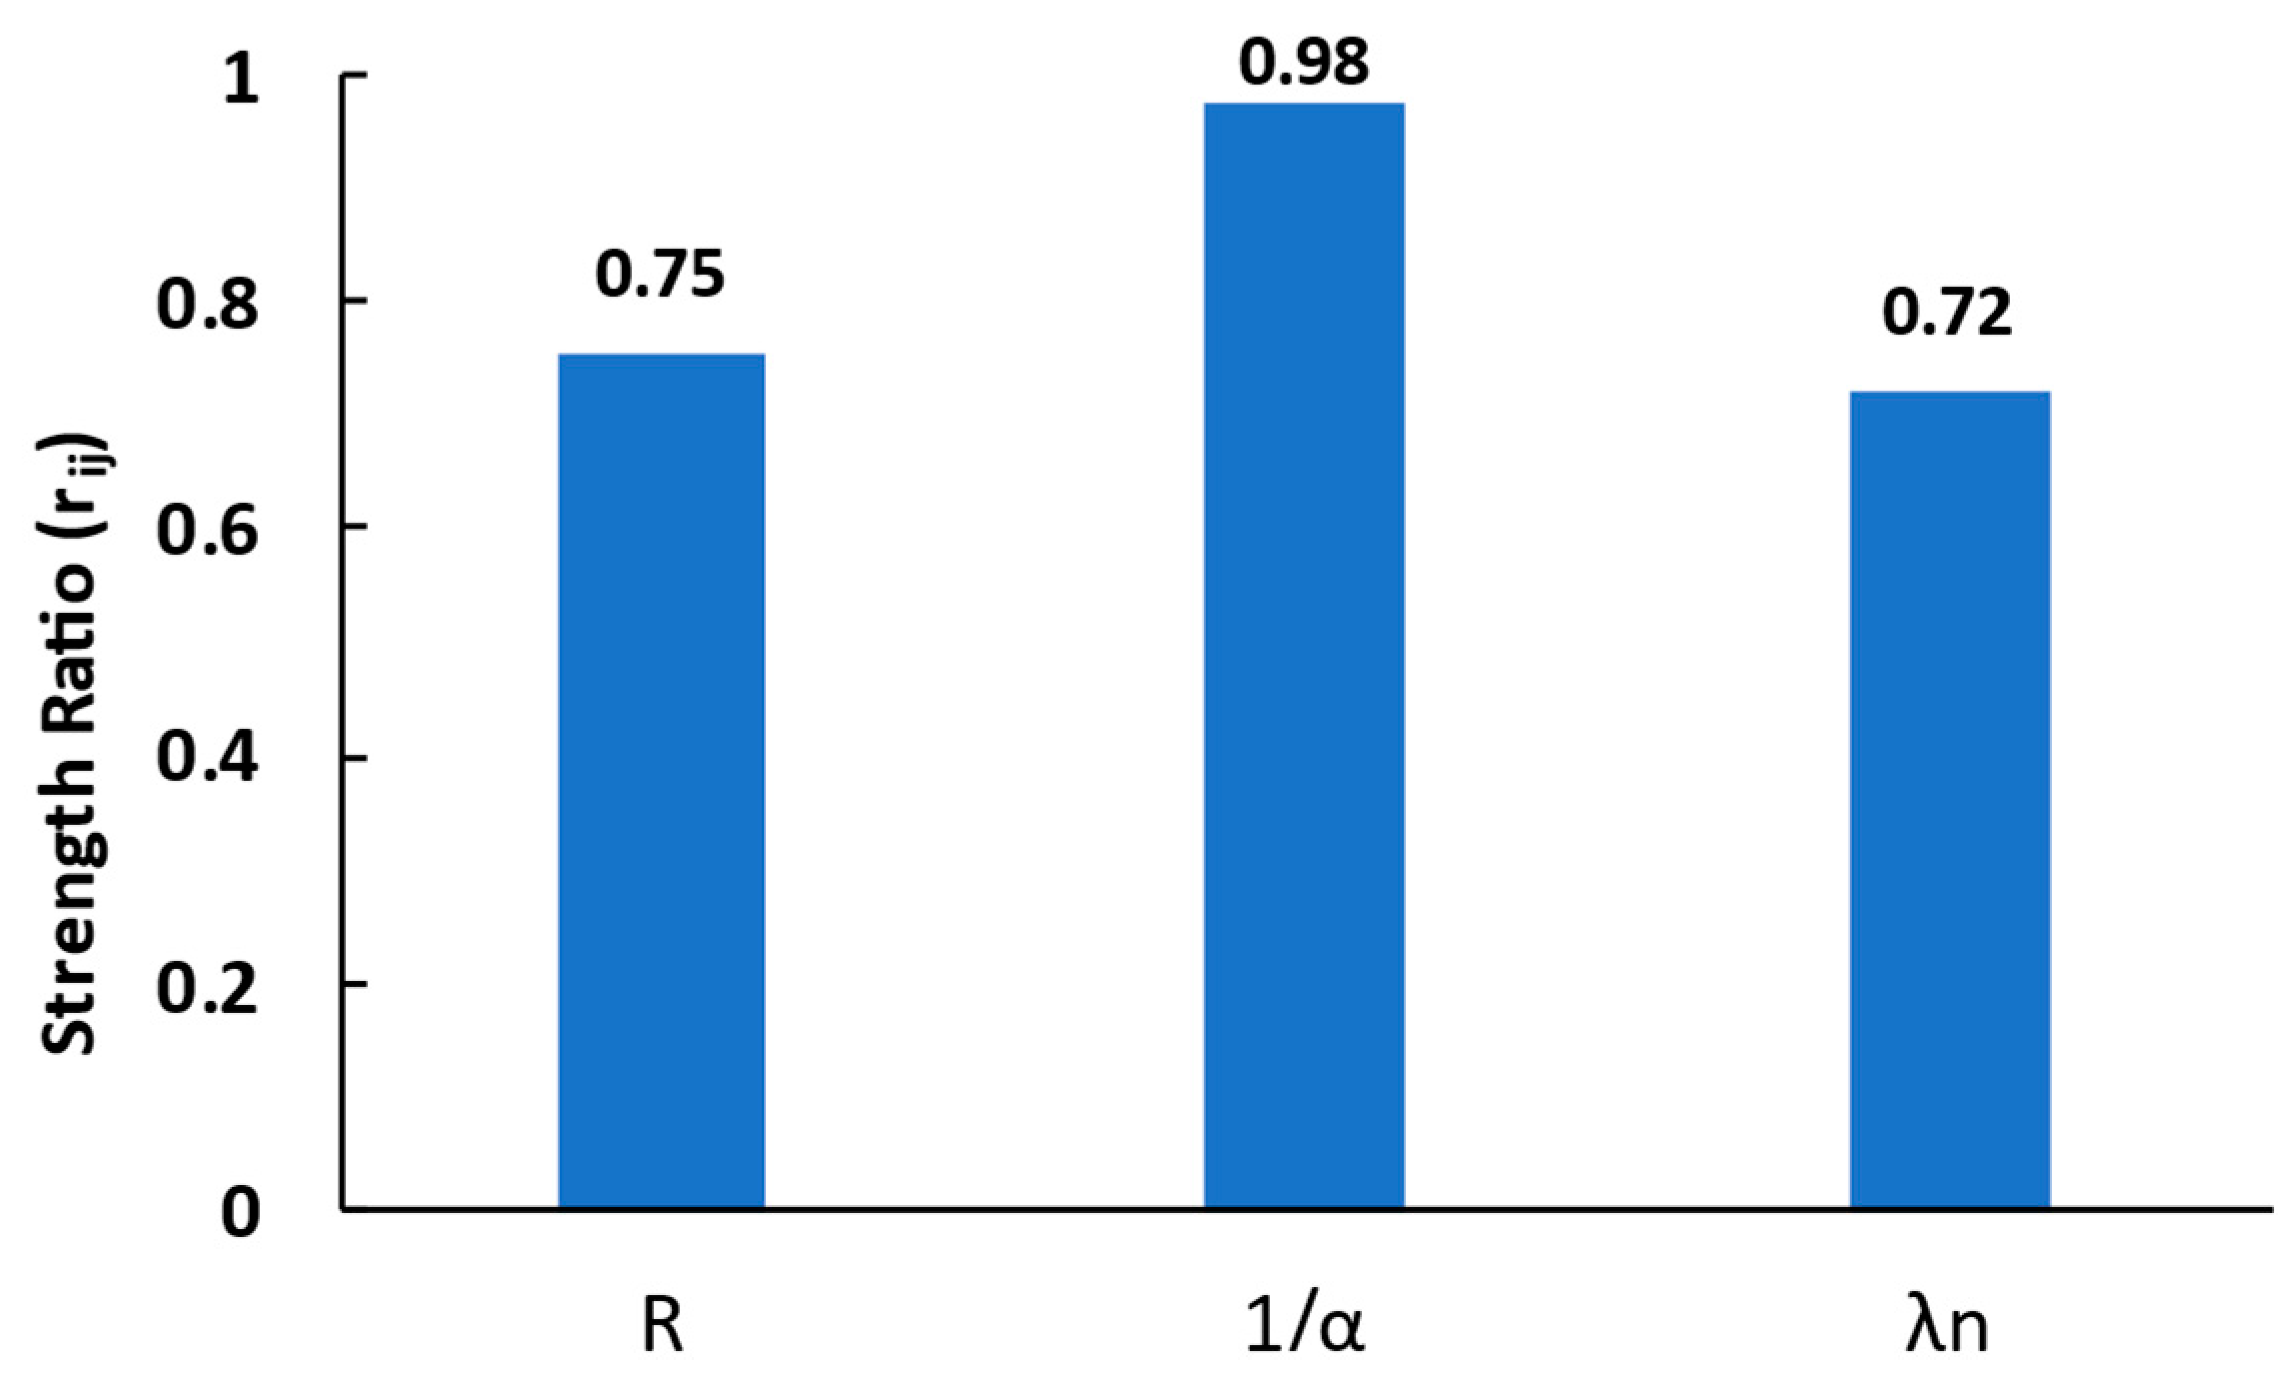
Figure 7 shows the challenges in estimating a reasonable approximation for the critical buckling coefficient since the importance factor for the normalized slenderness ratio is very close to that of the tapering ratio , indicating they have the same effect. Considering that the slenderness ratio has not been previously taken into account in the current formulas, it becomes evident that including this factor is necessary to achieve an accurate prediction of the critical buckling coefficient.
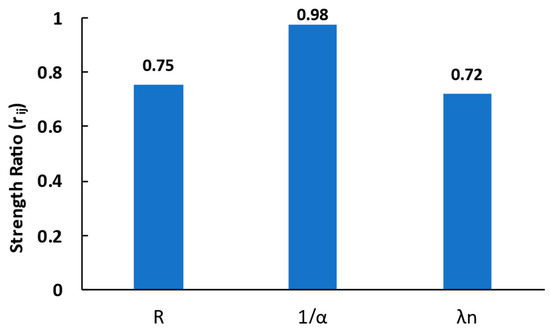
Figure 7.
Sensitivity analysis for input parameters.
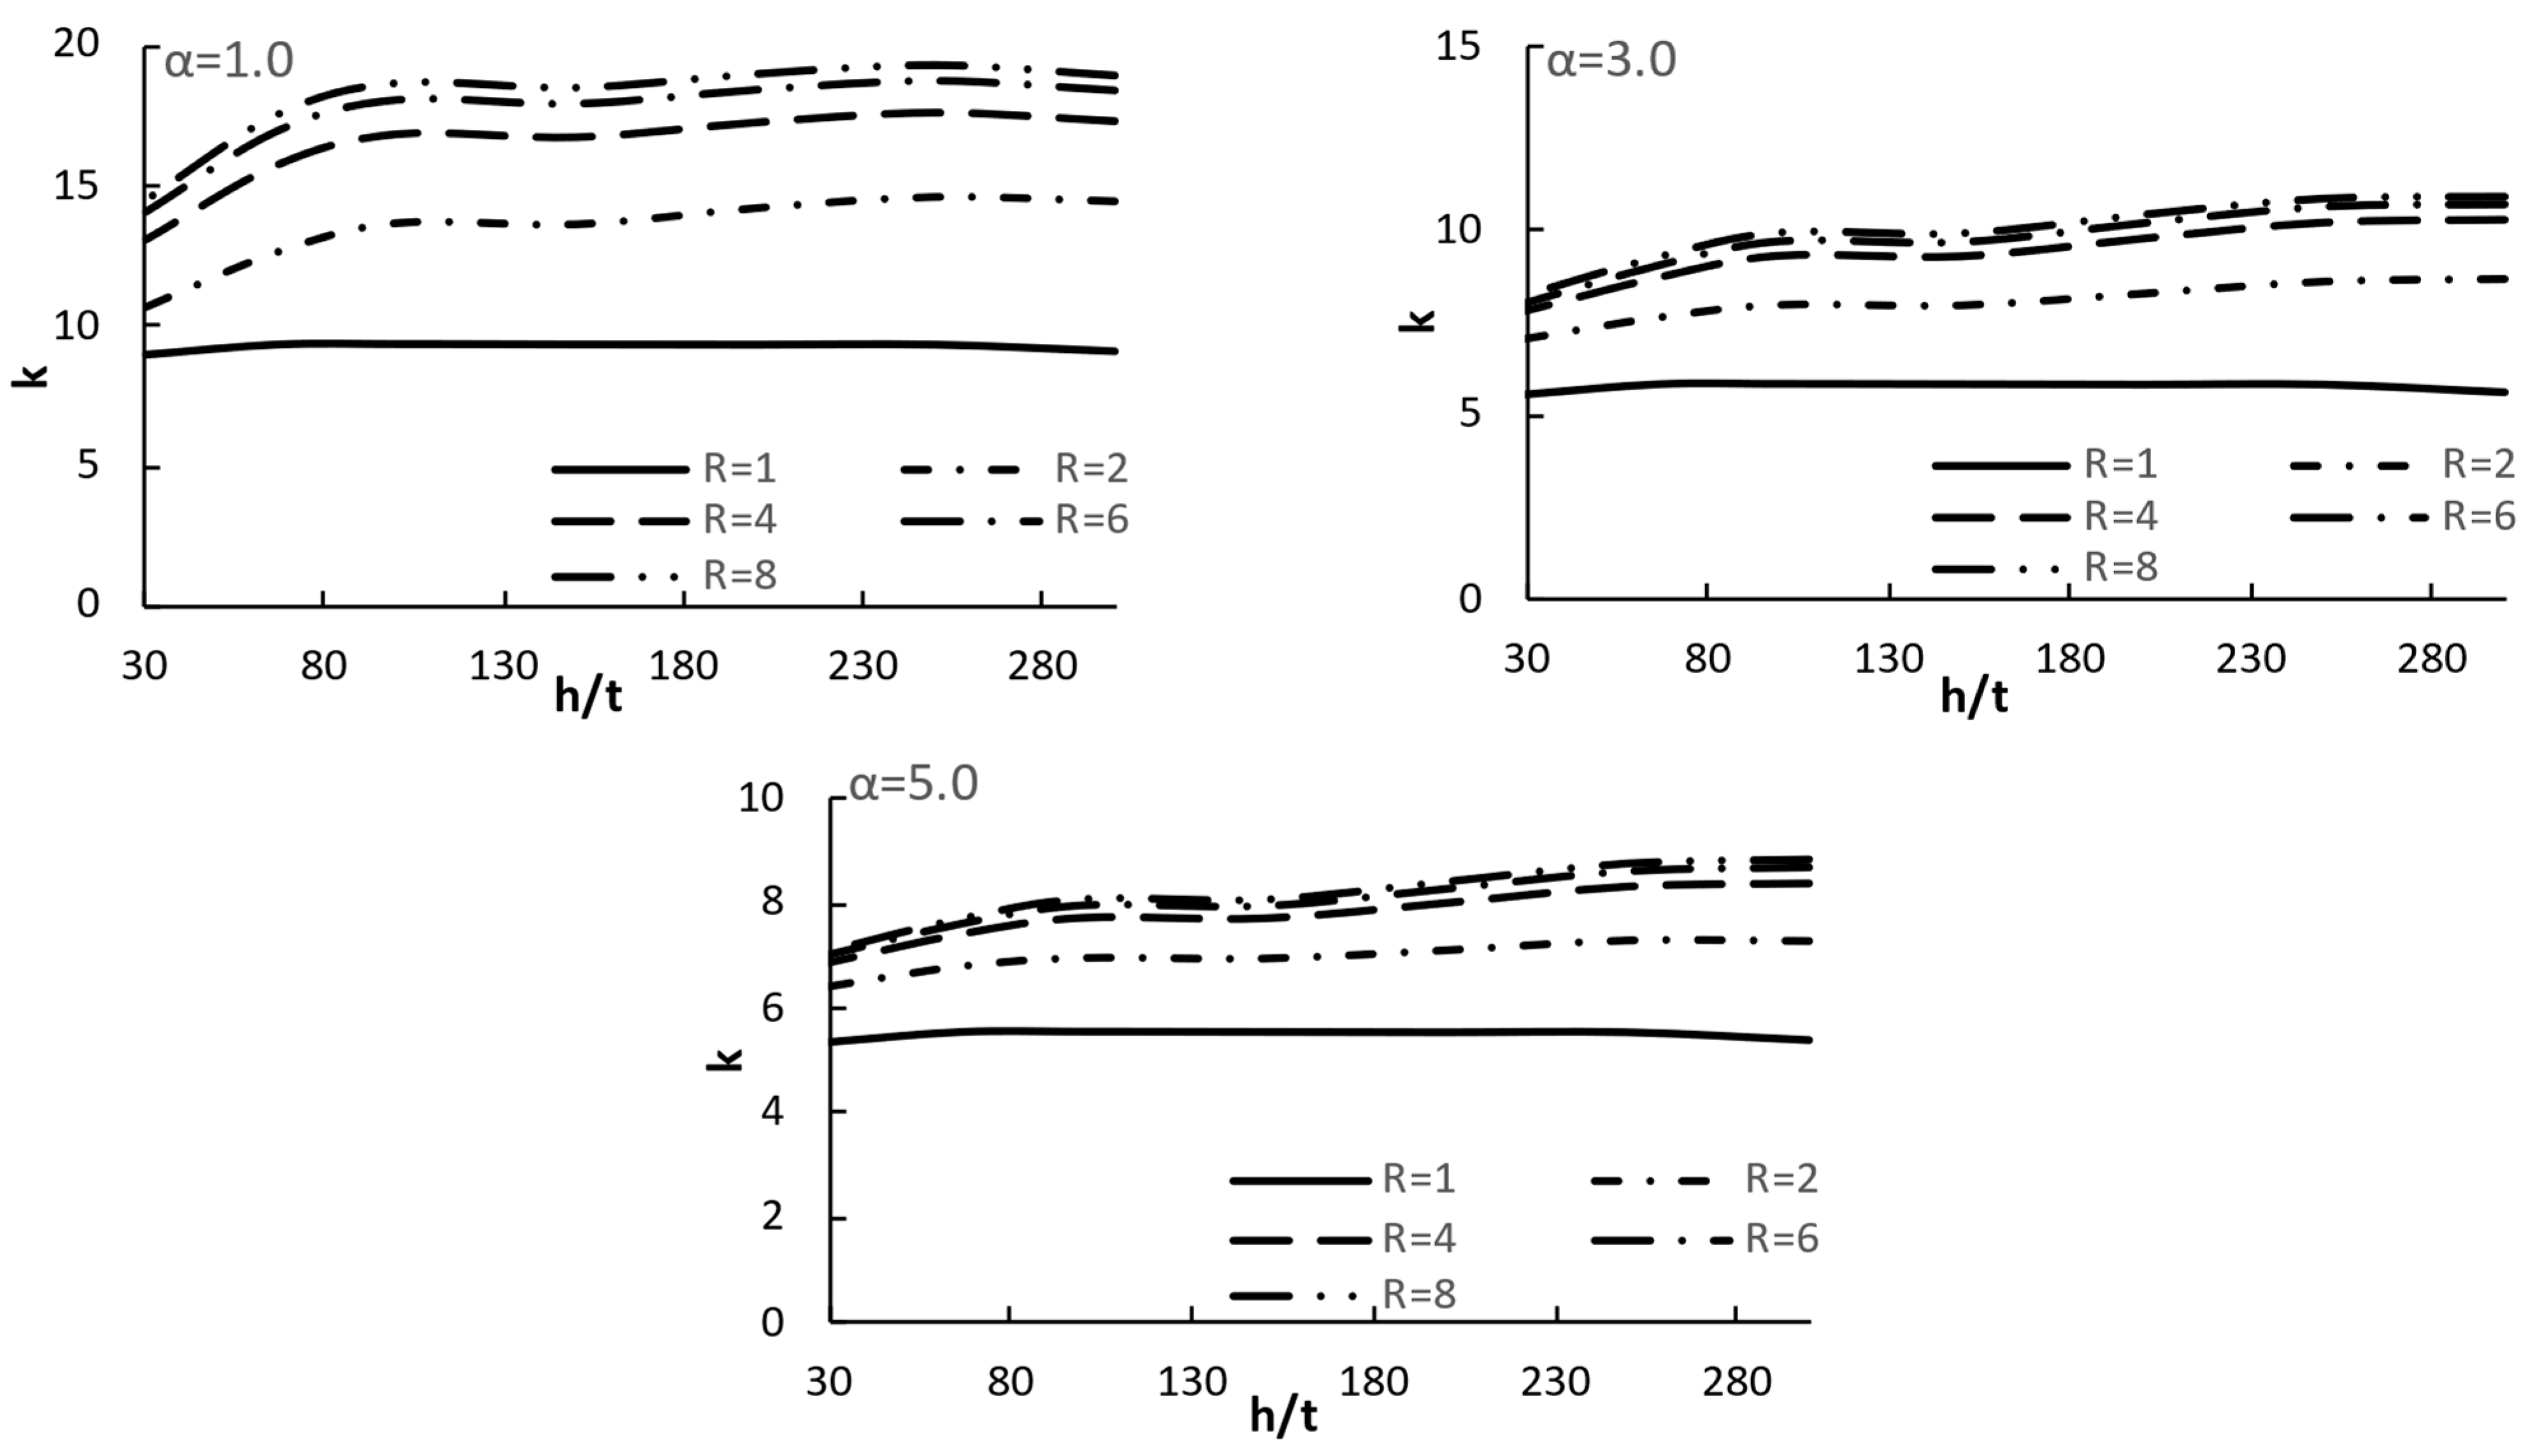
Accordingly, the shear buckling coefficient for prismatic members should consider more than just the tapering ratio. The impact of the slenderness ratio should also be employed since it improves the prediction of the critical buckling coefficient. Figure 8 shows the change in buckling coefficient () with slenderness ratio () for several tapering ratios (). The increase rate is affected by the tapering ratios () and aspect ratio (α). Furthermore, it can be observed that tends to increase as the increases. For rectangular sections, where , is almost constant for different ratios, as shown in Figure 8. Therefore, a correction factor is introduced into Equation (2) to account for the slenderness ratio effect for prismatic sections. The Levenberg–Marquardt (nonlinear least-squares) algorithm is implemented for model fitting, and the most suitable value is presented to achieve the least square error between the FEM and the predicted one using the proposed formula. Accordingly, the obtained values can be defined as a function of the normalized slenderness ratio .
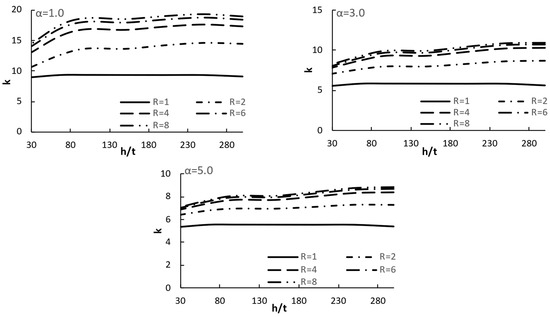
Figure 8.
Shear buckling coefficient () vs. slenderness ratio () for several tapering ratios ().
6.2. Validation of the Proposed Formula
The proposed formula for the shear buckling coefficient of prismatic web plates is verified by FEM results obtained in this study. Figure 9 shows the FEM results obtained for several and values. These results are compared to the predicted elastic buckling coefficient of shear load using Equation (2). It can be observed that the proposed model can accurately predict the buckling coefficient obtained from FEM results.


Figure 9.
FEM and predicted buckling coefficient.
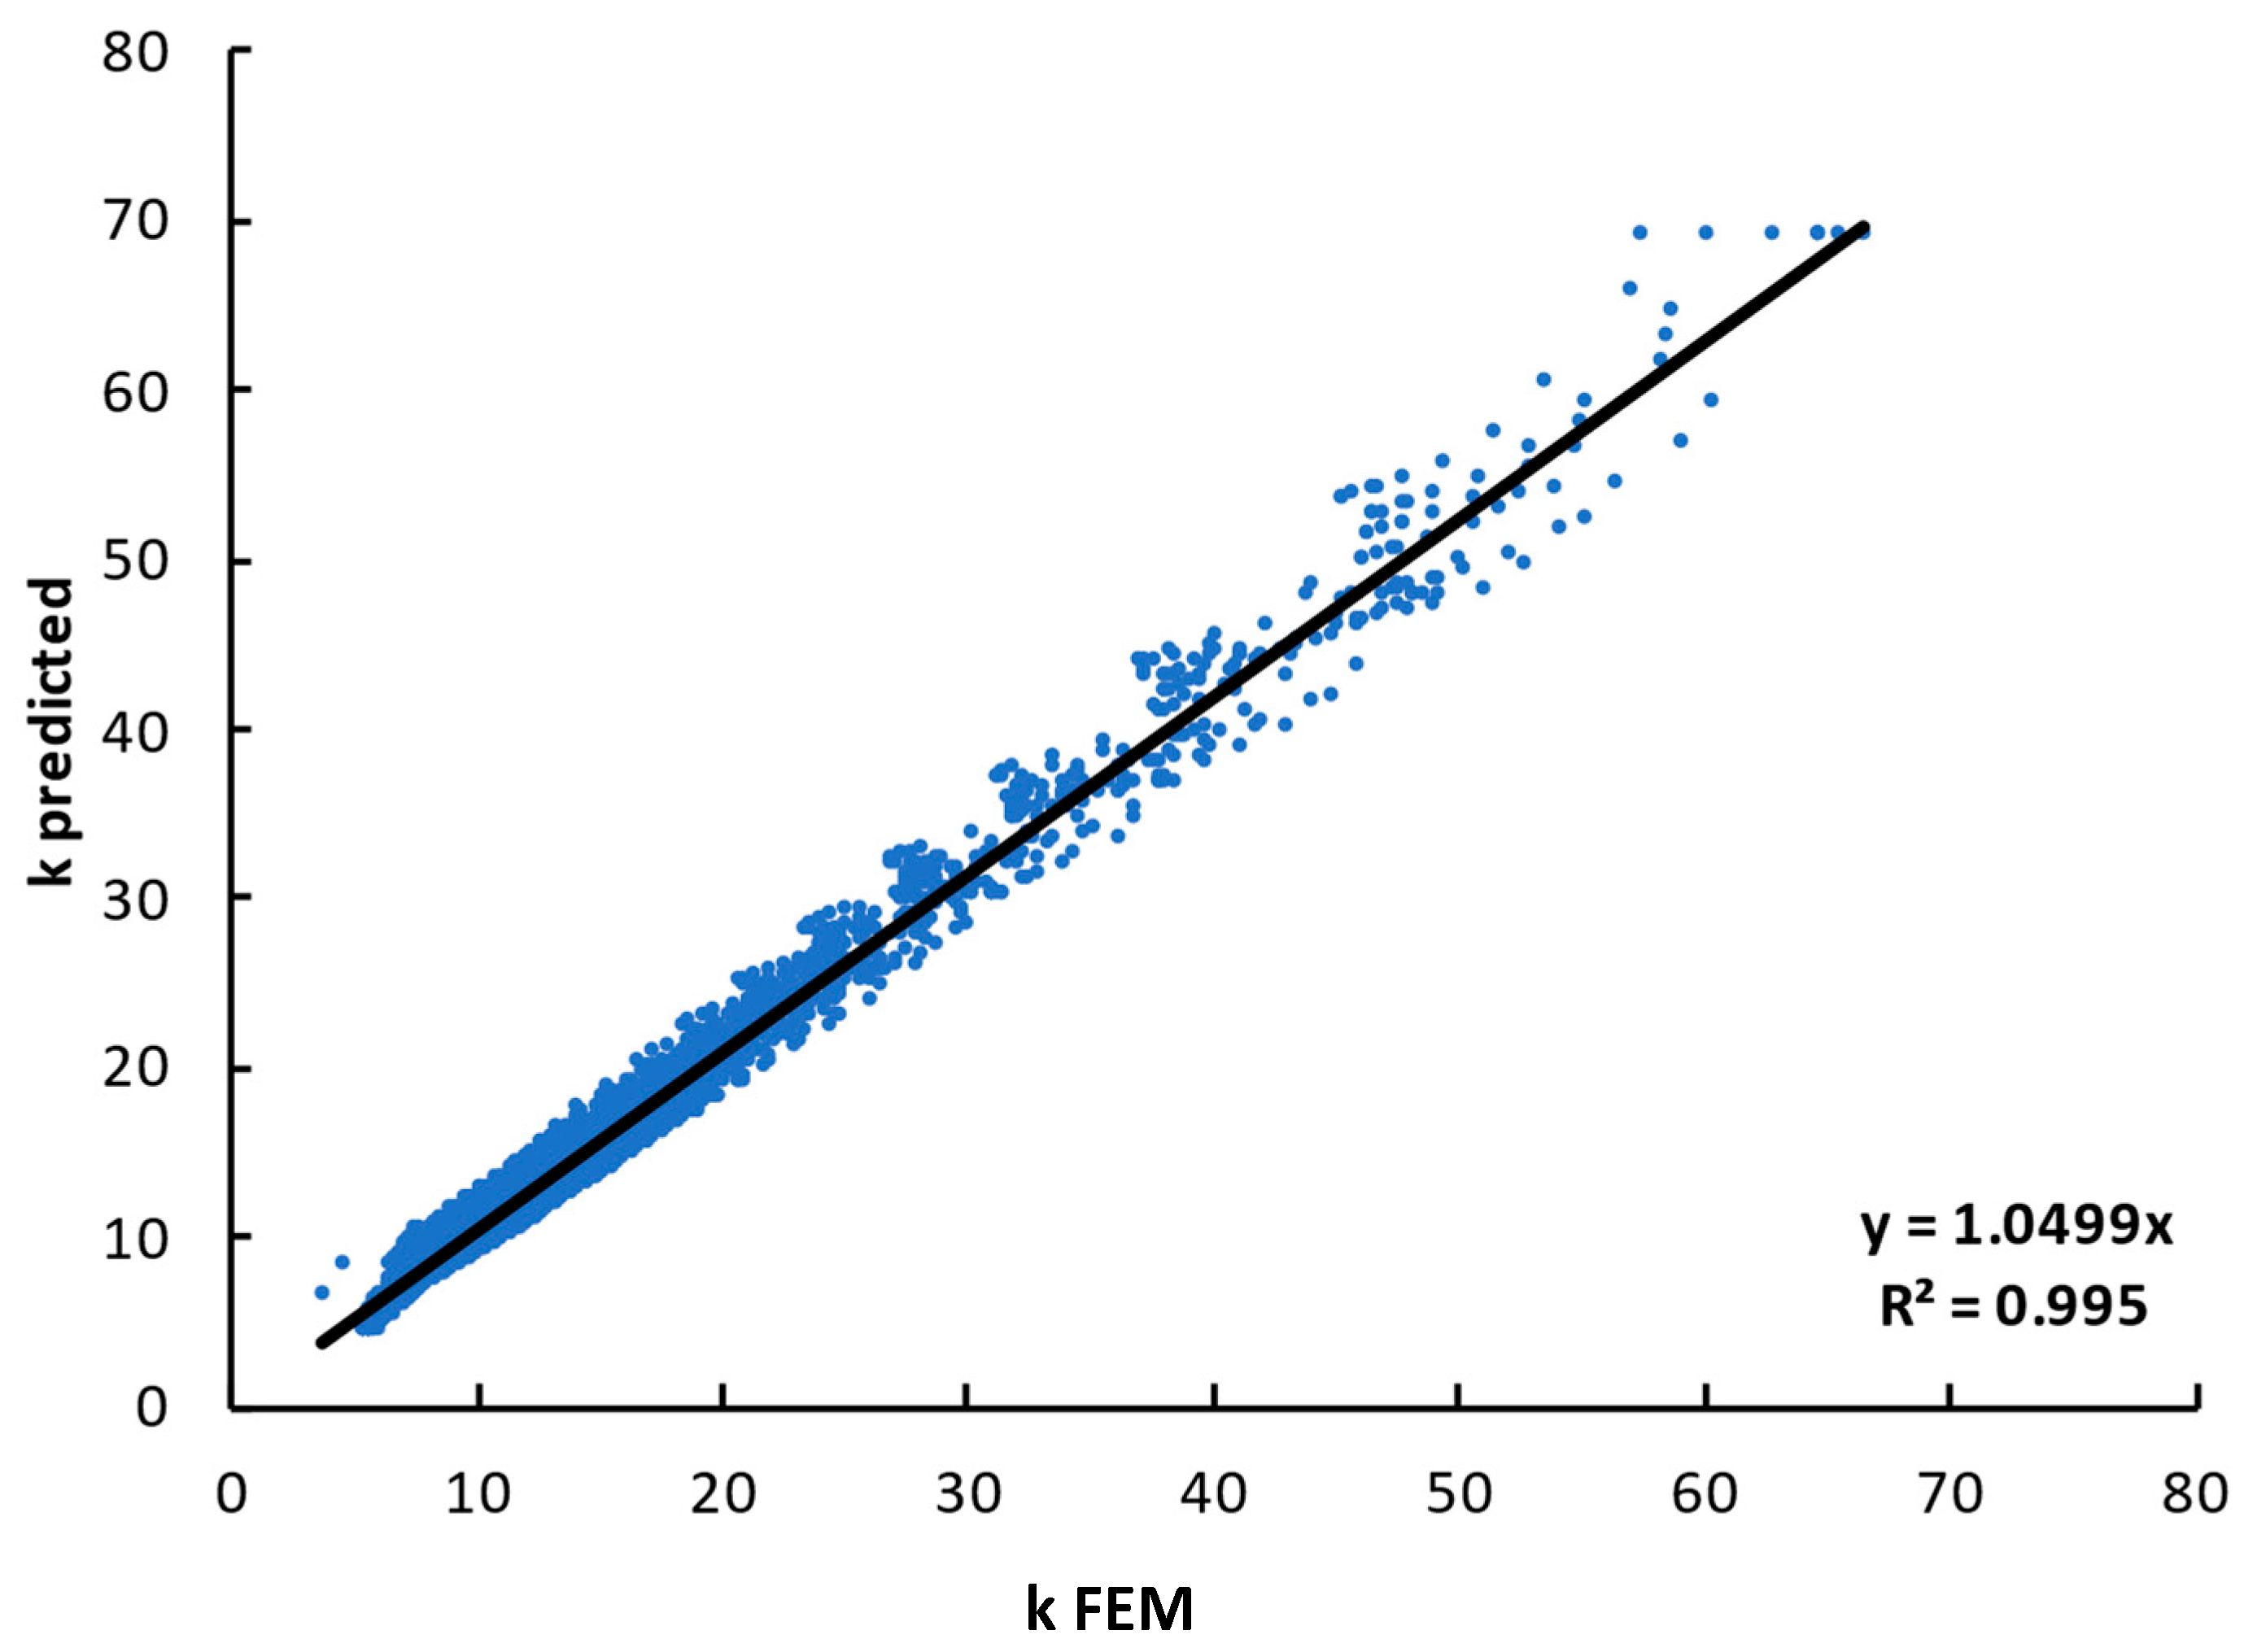
Figure 10 compares the expected buckling coefficient of the prismatic web plates of shear load with the expected buckling coefficient from the FEM modeling. The coefficient of determination indicates a very strong fit since it is very close to 1. In comparison with Figure 6, it is clear that considering the slenderness ratio contributed to reducing the dispersion between the predicted and FEM values.
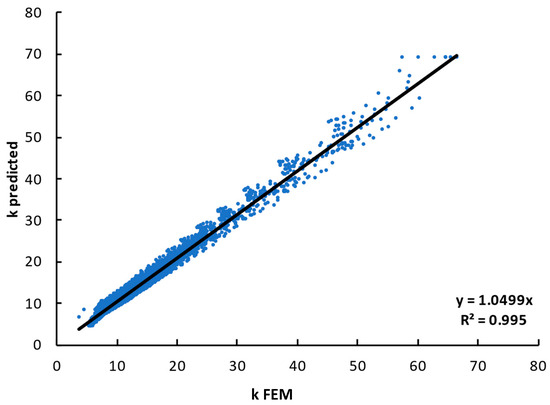
Figure 10.
Verification of the predicted buckling coefficient of prismatic web plate of shear load.
The mean error and the mean square error of the proposed formula are −0.65 and 2.4, respectively. The mean (μ), which defines the average of two or more numbers for the ratio , is equal to 0.972, and the corresponding standard deviation () calculated using Equation (5) for the ratio is determined as 0.11.
where n = the total number of the data set, = data point, and = the average of the data set.
In general, good predictions of the elastic buckling coefficient have been obtained from the proposed formula.
Since the proposed formula was developed to best match the collected data, it is important to validate the formula with data not used in the best-fit process. So, the proposed formula is compared with the finite element results for the following cases:
- R = 3.5 and h/t = 80.
- R = 1.6 and h/t = 220.
The comparison between the predicted and FE results illustrated in Figure 11 shows that the proposed formula also provides values close to the FE readings, as there is near agreement and the difference between the predicted and FE results is small. This confirms the high capability of the presented equation to predict the shear buckling coefficient for prismatic plates.

Figure 11.
Verification of the proposed formula with new cases not included in the best fit process.
7. Comparisons with Current Code Formulas
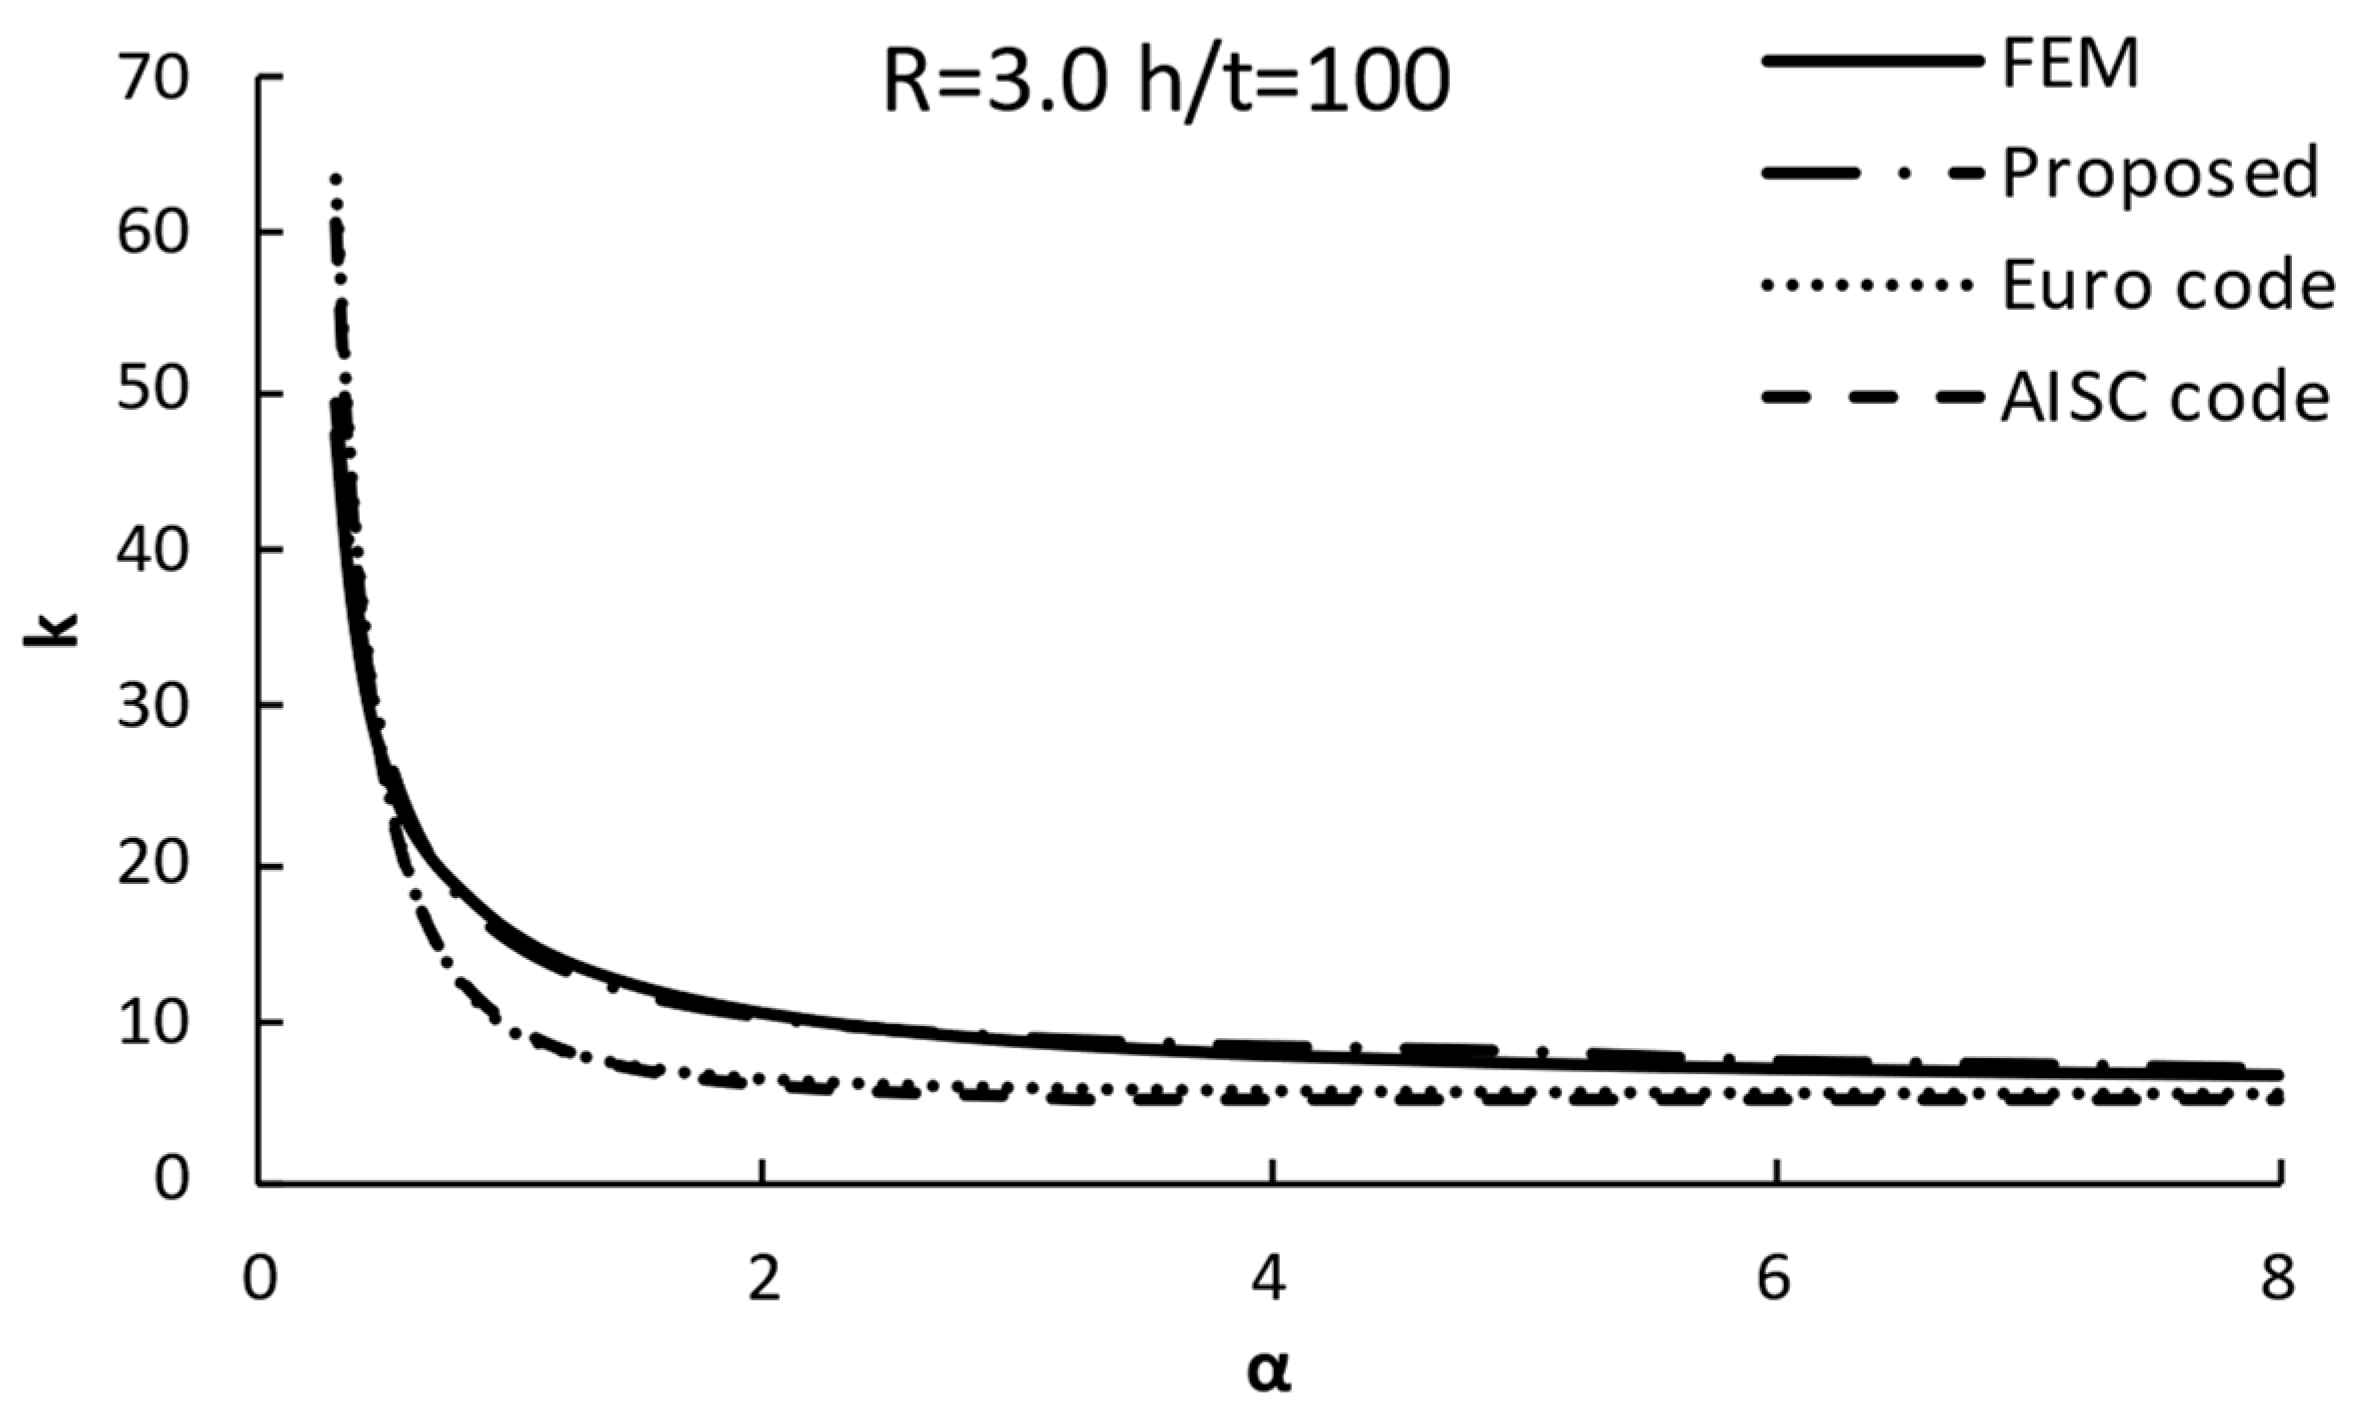
Figure 12 shows the values of the buckling coefficient using the FEM, the expected results using the proposed equation, and the values obtained from the AISC and EC3. It is worth mentioning that the shear buckling coefficient is determined in the AISC code as follows:
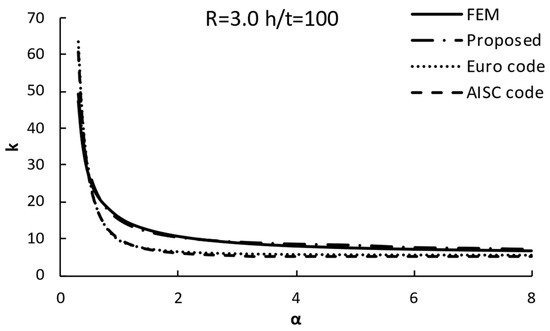
Figure 12.
Comparison between proposed expression and code formulas.
The figure indicates that the proposed model aligns well with the FEM data, while the AISC code and European code overestimated values when the value of α is greater than 0.5, and underestimated values for α less than 0.5. Therefore, using the proposed equation contributes to obtaining a safe and optimized design for prismatic sections.
8. Comparisons with the Existing Model Proposed by Ibrahim et al. [26]
In this section, the accuracy of the proposed formulas is compared with the formula proposed by Ibrahim et al. [26], where Equation (7) is proposed to estimate the shear buckling coefficient as a function of tapering ratios () within the range 1 to 5 and aspect ratio (α) within the range 3–10.
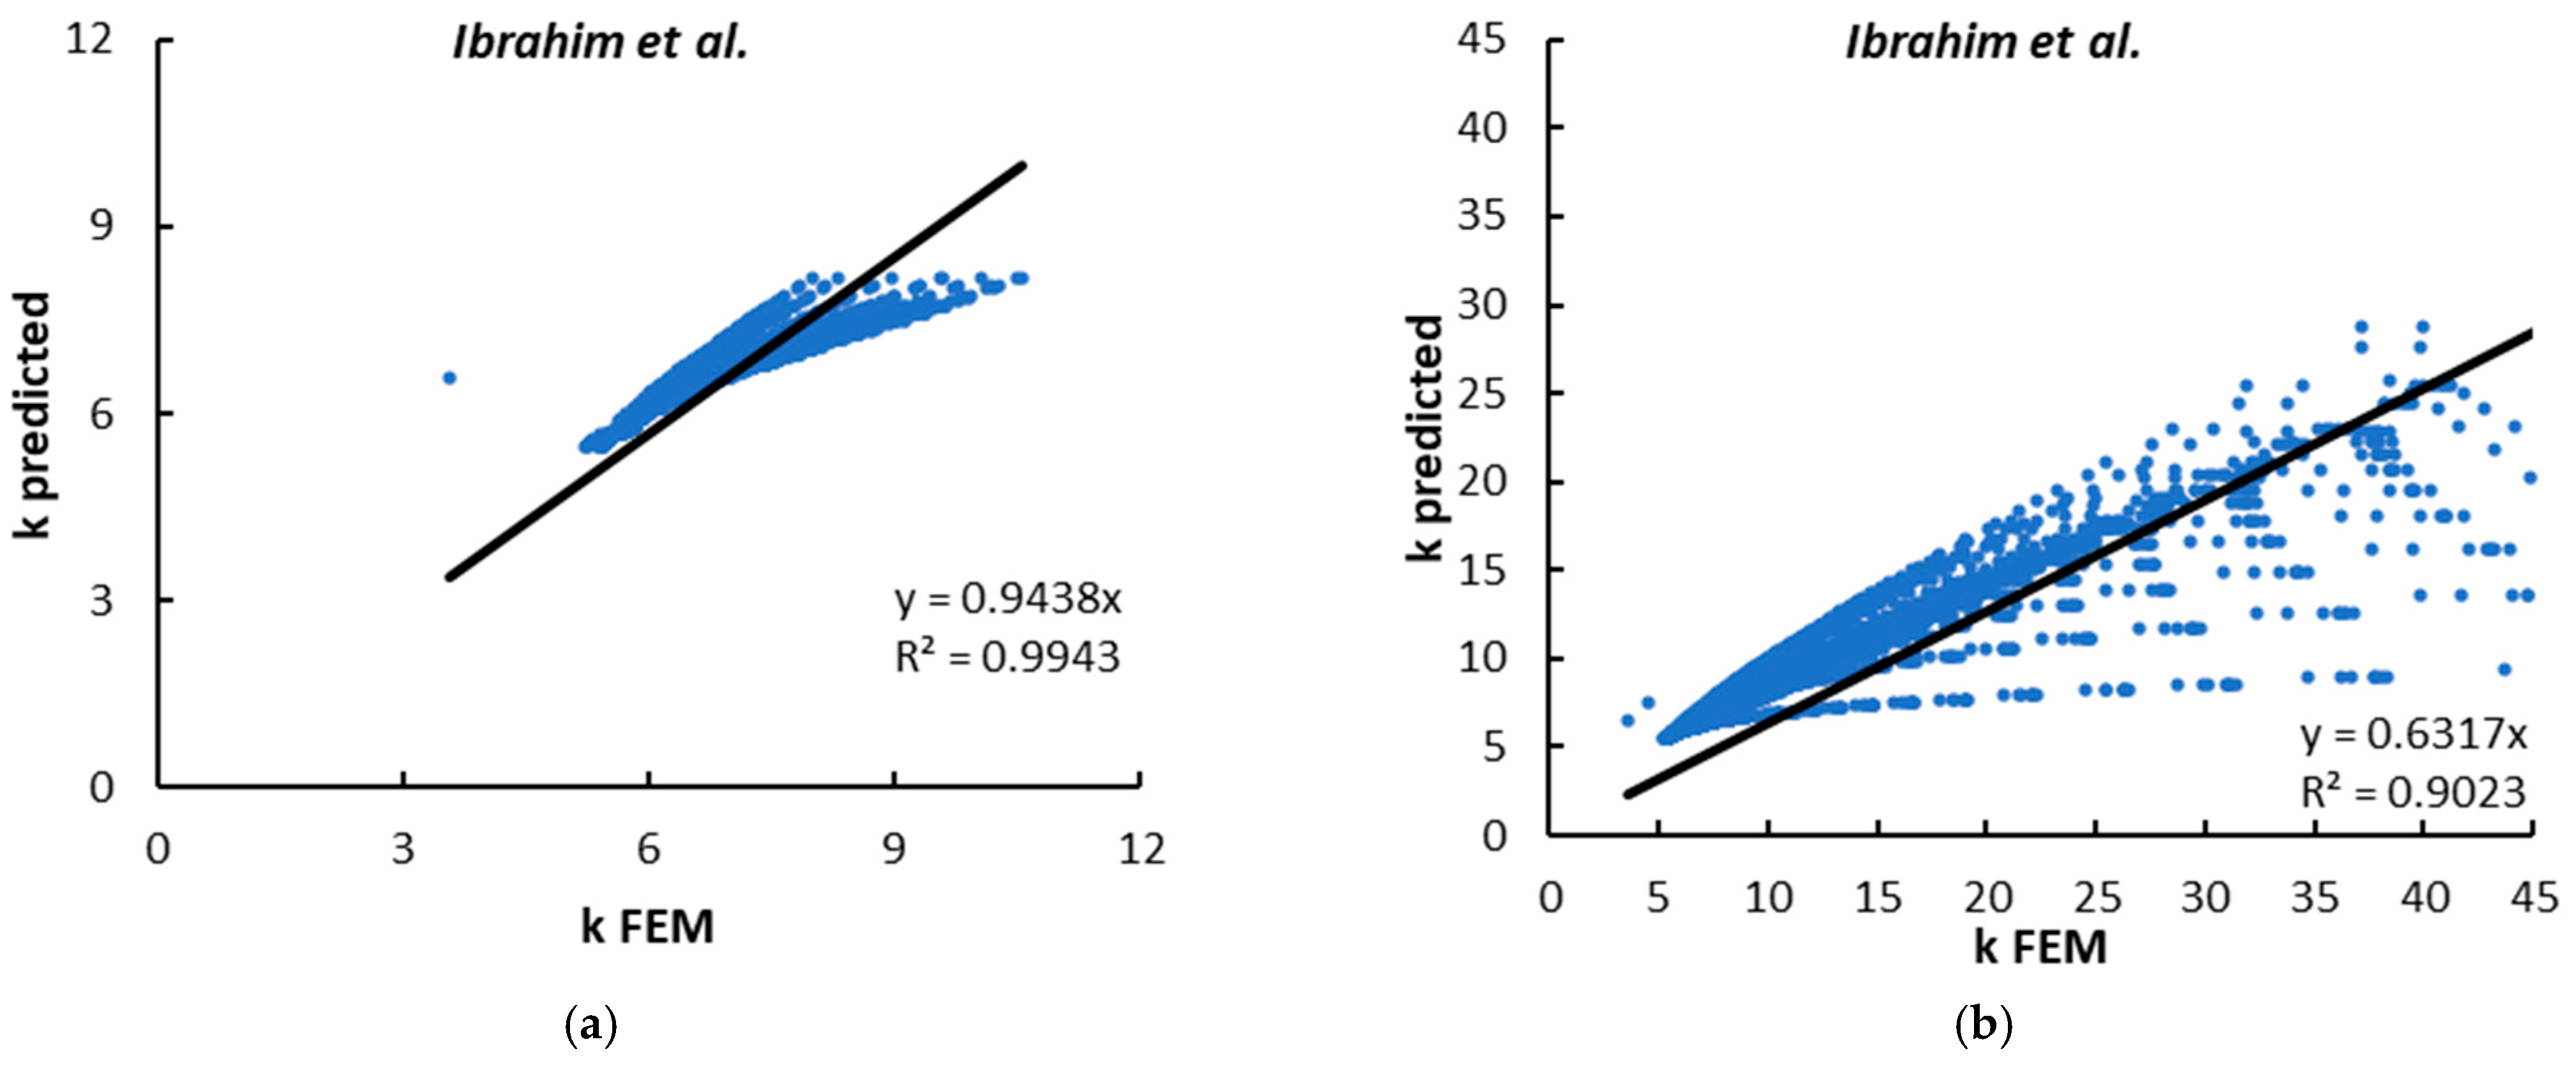
It was found that the formula proposed by I Ibrahim et al. [26] has a good approximation within the specified range, as shown in Figure 13a, but, outside this range, the formula cannot provide a satisfactory prediction. Specifically, for less than 3, Ibrahim’s formula gives unreasonable predictions. For example, the predicted value for is 8.2, where the actual value is 24.5. So, for comparison purposes, it was decided to increase the study range of α from [3,4,5,6,7,8] to [0.3–8].
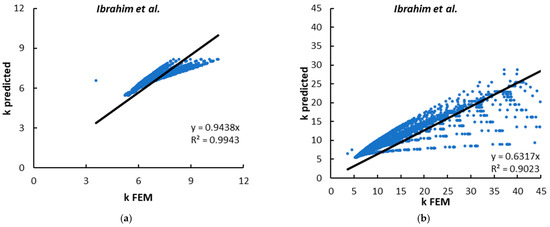
Figure 13.
Performance of Ibrahim et al. [26] models: (a) for between 1–5 and α between 3–8, and (b) for between 1–5 and α between 0.3–8.
A comparison of the proposed formula predictions in Figure 10 to those from the Ibrahim et al. formula in Figure 13b reveals less scatter in the proposed model results. The data points closely follow the 1:1 trendline, indicating stronger agreement with FEM outcomes. Conversely, the Ibrahim formula trendline exhibits a 1:0.6 slope, suggesting an under-prediction of the FEM buckling coefficient. Additionally, the higher coefficient of determination () for the proposed formula reflects its improved correlation. Evidently, the newly developed expression offers superior accuracy compared to the existing Ibrahim equation, providing a more reliable analytical solution within the specified parameter ranges investigated. By reducing deviation from FEM data, the proposed formula allows for enhanced precision in the estimation of the shear buckling capacity.
The histogram in Figure 14 represents the distribution of the predicted to FEM ratio. It provides a visual depiction of how frequently different ranges of ratios occur, which are divided into bins or classes. The x-axis of the histogram represents the range of the ratio, while the y-axis indicates the frequency or count of occurrences within each bin.

Figure 14.
Prediction/FEM distribution histogram for between 1–5 and α between 0.3–8 [26].
By analyzing the histogram, it can be observed that the proposed formula exhibits a symmetrical distribution with a peak around a ratio (0.96–1.05). In contrast, Ibrahim et al.’s approach shows a left-skewed distribution with a peak at a ratio (0.7–0.79). This suggests that the proposed model provides a better approximation to the FEM results compared to Ibrahim et al.’s approach.
9. Conclusions
This research presented numerical investigations on the elastic local buckling behavior of prismatic web plates under shear loading. Simply-supported conditions were assumed for a comprehensive parametric study analyzing the effects of aspect ratio (), tapering ratio (), and slenderness on shear buckling response. The study covered a practical range of aspect ratios from 0.3 to 8, tapering ratios from 1 to 8, and slenderness ratios from 30 to 300. Extensive finite element simulations were performed to generate results over practical geometric ranges. New predictive equations were proposed through curve fitting of the numerical datasets. Validation illustrated the accuracy of the proposed shear buckling coefficient formulation. The key conclusions that can be drawn from this study are:
- Incorporating the impact of the slenderness ratio improves the prediction of the shear buckling coefficient, as the buckling coefficient exhibits sensitivity to slenderness variations. Further examination of this relationship for trapezoidal web plates is recommended.
- As the tapering ratio R increases, the stiffness in the smaller depth region becomes greater than the stiffness in the wider depth region and the geometry becomes closer to a triangle section. This, in turn, leads to an increase in the buckling coefficient. Meanwhile, at higher aspect ratios, the stiffening influence diminishes, likely indicating altered buckling modal behavior.
- The proposed shear buckling coefficient formula enables reliable critical shear buckling evaluation of prismatic webs, advancing design standards.
Future work should investigate the interactive effects of slenderness and flange restraints for tapered sections.
Author Contributions
Conceptualization, R.I.S. and S.A.Y.; Methodology, R.I.S. and S.A.Y.; Software, R.I.S. and S.A.Y.; Validation, R.I.S. and S.A.Y.; Formal analysis, R.I.S. and S.A.Y.; Investigation, R.I.S., M.A. and S.A.Y.; Data curation, R.I.S., M.A. and S.A.Y.; Writing—original draft, R.I.S. and S.A.Y.; Writing—review & editing, M.A.; Visualization, M.A.; Project administration, R.I.S., M.A. and S.A.Y.; Funding acquisition, M.A. All authors have read and agreed to the published version of the manuscript.
Funding
This research received no external funding.
Data Availability Statement
Data will be made available on request. The data are not publicly available due to privacy.
Conflicts of Interest
The authors declare no conflict of interest.
Nomenclature
| Plate length | |
| Flexural rigidity | |
| E | Elasticity modulus |
| Axial critical buckling stress | |
| Steel yield stress | |
| h | Larger width |
| Smaller width | |
| Shear buckling coefficient | |
| Shear buckling coefficient as suggested by Timoshinko and Gree | |
| Shear buckling coefficient as suggested by Ibrahim et al. | |
| Shear buckling coefficient according to AISC code | |
| Tapering ratio (h/h1) | |
| Plate thickness | |
| Flange thickness | |
| Standard deviation | |
| α | Aspect ratio (a/h) |
| λ | Slenderness ratio of the web (h/t) |
| normalized slenderness ratio . | |
| ν | Poisson’s ratio |
| Correction factor |
Appendix A
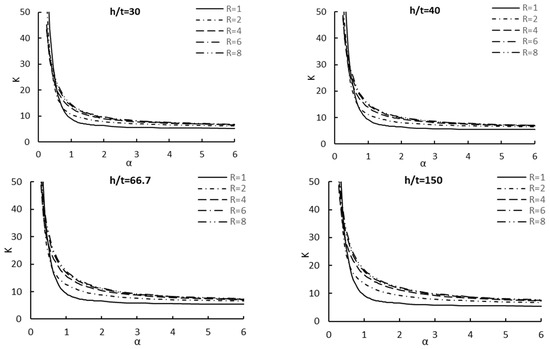
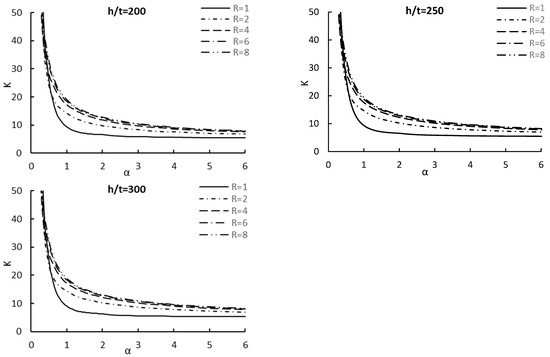
Figure A1.
Shear buckling coefficient vs. normalized length for different slenderness ratios.
Figure A1.
Shear buckling coefficient vs. normalized length for different slenderness ratios.
References
- Attaalla, S.A. Inelastic buckling strength of unsymmetrical tapered plates. Adv. Struct. Eng. 2002, 5, 165–171. [Google Scholar] [CrossRef]
- Abu-Hamd, M.; El Dib, F.F. Buckling strength of tapered bridge girders under combined shear and bending. HBRC J. 2016, 12, 163–174. [Google Scholar] [CrossRef]
- Bradford, M.; Azhari, M. Buckling of plates with different end conditions using the finite strip method. Comput. Struct. 1995, 56, 75–83. [Google Scholar] [CrossRef]
- Liang, Q.Q.; Uy, B.; Wright, H.D.; Bradford, M.A. Local buckling of steel plates in double skin composite panels under biaxial compression and shear. J. Struct. Eng. 2004, 130, 443–451. [Google Scholar] [CrossRef]
- Liang, Q.Q.; Uy, B.; Liew, J.Y.R. Local buckling of steel plates in concrete-filled thin-walled steel tubular beam–columns. J. Constr. Steel Res. 2007, 63, 396–405. [Google Scholar] [CrossRef]
- Shi, Y.; Xu, K.; Shi, G.; Li, Y. Local buckling behavior of high strength steel welded I-section flexural members under uniform moment. Adv. Struct. Eng. 2018, 21, 93–108. [Google Scholar] [CrossRef]
- Wan, J.; Cai, J.; Long, Y.-L.; Chen, Q.-J. Local buckling of rectangular concrete-filled steel tubular columns with binding bars under eccentric compression. Adv. Struct. Eng. 2020, 23, 2204–2219. [Google Scholar]
- Ahmed, M.; Tran, V.-L.; Ci, J.; Yan, X.-F.; Wang, F. Computational analysis of axially loaded thin-walled rectangular concrete-filled stainless steel tubular short columns incorporating local buckling effects. Structures 2021, 34, 4652–4668. [Google Scholar] [CrossRef]
- Ahmed, M.; Sheikh, M.N.; Hadi, M.N.S.; Liang, Q.Q. Nonlinear analysis of square spiral-confined reinforced concrete-filled steel tubular short columns incorporating novel confinement model and interaction local buckling. Eng. Struct. 2023, 274, 115168. [Google Scholar] [CrossRef]
- Kim, Y.D. Behavior and Design of Metal Building Frames Using General Prismatic and Web-Tapered Steel I-Section Members; Georgia Institute of Technology: Atlanta, GA, USA, 2010. [Google Scholar]
- Timoshenko, S.P.; Gere, J.M. Theory of Elastic Stability; Courier Corporation: Chelmsford, MA, USA, 2009. [Google Scholar]
- Pope, G.G. The Buckling of Plates Tapered in Planform; Report No-3324; Ministry of Aviation: London, UK, 1962. [Google Scholar]
- Prawel, S.; Morrell, M.; Lee, G. Bending and buckling strength of tapered structural members. Weld. Res. Suppl. 1974, 53, 75–84. [Google Scholar]
- Bedynek, A.; Real, E.; Mirambell, E. Tapered plate girders under shear: Tests and numerical research. Eng. Struct. 2013, 46, 350–358. [Google Scholar] [CrossRef]
- Eurocode 3: Design of Steel Structures-Part 1-1: General Rules and Rules for Buildings. 2005. Available online: https://www.unirc.it/documentazione/materiale_didattico/599_2010_260_7483.pdf (accessed on 23 October 2023).
- Lee, S.C.; Davidson, J.; Yoo, C. Shear buckling coefficients of plate girder web panels. Comput. Struct. 1996, 59, 789–795. [Google Scholar] [CrossRef]
- Mirambell, E.; Zarate, A. Web buckling of tapered plate girders. Proc. Inst. Civ. Eng. Struct. Build. 2000, 140, 51–60. [Google Scholar] [CrossRef]
- Abu-Hamd, M.; Abu-Hamd, I. Buckling strength of tapered bridge girders under shear and bending. In Proceedings of the Annual Stability Conference, Pittsburgh, PA, USA, 10–14 May 2011. [Google Scholar]
- Abdelbaset, B.H. Evaluation of Shear Strength of Tapered Plate-Girder Web. Master’s Thesis, Cairo University, Cairo, Egypt, 2015. [Google Scholar]
- Sediek, O.A.; Safar, S.S.; Hassan, M.M. Numerical investigation on shear strength of tapered perfect end web panels. Structures 2020, 28, 354–368. [Google Scholar] [CrossRef]
- Sediek, O. Numerical Investigation on Shear Strength and Design Requirements of Tapered end Web Panels. Ph.D. Thesis, Cairo University, Cairo, Egypt, 2017. [Google Scholar]
- Serror, M.H.; Abdelbaset, B.H.; Sayed, H.S. Shear strength of tapered end web panels. J. Constr. Steel Res. 2017, 138, 513–525. [Google Scholar] [CrossRef]
- Studer, R.P.; Binion, C.D.; Davis, D.B. Shear strength of tapered I-shaped steel members. J. Constr. Steel Res. 2015, 112, 167–174. [Google Scholar] [CrossRef]
- AbdelAleem, B.H.; Ismail, M.K.; Haggag, M.; El-Dakhakhni, W.; Hassan, A.A. Interpretable soft computing predictions of elastic shear buckling in tapered steel plate girders. Thin-Walled Struct. 2022, 176, 109313. [Google Scholar] [CrossRef]
- AISC 360-22; Specification for Structural Steel Buildings. American Institute of Steel Construction: Chicago, IL, USA, 2022.
- Ibrahim, M.M.; El Aghoury, I.M.; Ibrahim, S.A.-B. Finite element investigation on plate buckling coefficients of tapered steel members web plates. Structures 2020, 28, 2321–2334. [Google Scholar] [CrossRef]
- Bedynek, A. Structural Behaviour of Tapered Steel Plate Girders Subjected to Shear; Polytechnic University of Catalonia, Barcelona Tech: Barcelona, Spain, 2014. [Google Scholar]
- Lee, S.C.; Lee, D.S.; Yoo, C.H. Ultimate shear strength of long web panels. J. Constr. Steel Res. 2008, 64, 1357–1365. [Google Scholar] [CrossRef]
- Monjezi, M.; Hasanipanah, M.; Khandelwal, M. Evaluation and prediction of blast-induced ground vibration at Shur River Dam, Iran, by artificial neural network. Neural Comput. Appl. 2013, 22, 1637–1643. [Google Scholar] [CrossRef]
- Ross, T.J. Fuzzy Logic with Engineering Applications; John Wiley & Sons: Hoboken, NJ, USA, 2009. [Google Scholar]
- Chern, C.; Ostapenko, A. Ultimate Strength of Plate Girders under Shear; Rep. No. 328.7; Fritz Laboratory Reports; Lehigh Univiversity: Bethlehem, PA, USA, 1969. [Google Scholar]
- Porter, D.M.; Rockey, K.C.; Evans, H.R. The collapse behaviour of plate girders loaded in shear. Struct. Eng. 1975, 53, 313–325. [Google Scholar]
- Sharp, M.L.; Clark, J.W. Thin aluminum shear webs. J. Struct. Div. 1971, 97, 1021–1038. [Google Scholar] [CrossRef]
- Shahin, R.I.; Ahmed, M.; Yehia, S.A.; Liang, Q.Q. ANN model for predicting the elastic critical buckling coefficients of prismatic tapered steel web plates under stress gradients. Eng. Struct. 2023, 294, 116794. [Google Scholar] [CrossRef]
- Bedynek, A.; Real, E.; Mirambell, E. Shear buckling coefficient: Proposal for tapered steel plates. Proc. Inst. Civ. Eng. Struct. Build. 2014, 167, 243–252. [Google Scholar] [CrossRef]
- Stein, M.; Neff, J. Buckling Stresses of Simply Supported Rectangular Flat Plates in Shear; NACA: Washington, DC, USA, 1947. Available online: https://ntrs.nasa.gov/api/citations/19930082111/downloads/19930082111.pdf (accessed on 23 October 2023).
Disclaimer/Publisher’s Note: The statements, opinions and data contained in all publications are solely those of the individual author(s) and contributor(s) and not of MDPI and/or the editor(s). MDPI and/or the editor(s) disclaim responsibility for any injury to people or property resulting from any ideas, methods, instructions or products referred to in the content. |
© 2023 by the authors. Licensee MDPI, Basel, Switzerland. This article is an open access article distributed under the terms and conditions of the Creative Commons Attribution (CC BY) license (https://creativecommons.org/licenses/by/4.0/).

