Optimizing Window Glass Design for Energy Efficiency in South Korean Office Buildings: A Hierarchical Analysis Using Energy Simulation
Abstract
:1. Introduction
2. Materials and Methods
2.1. Experimental Method
- (1)
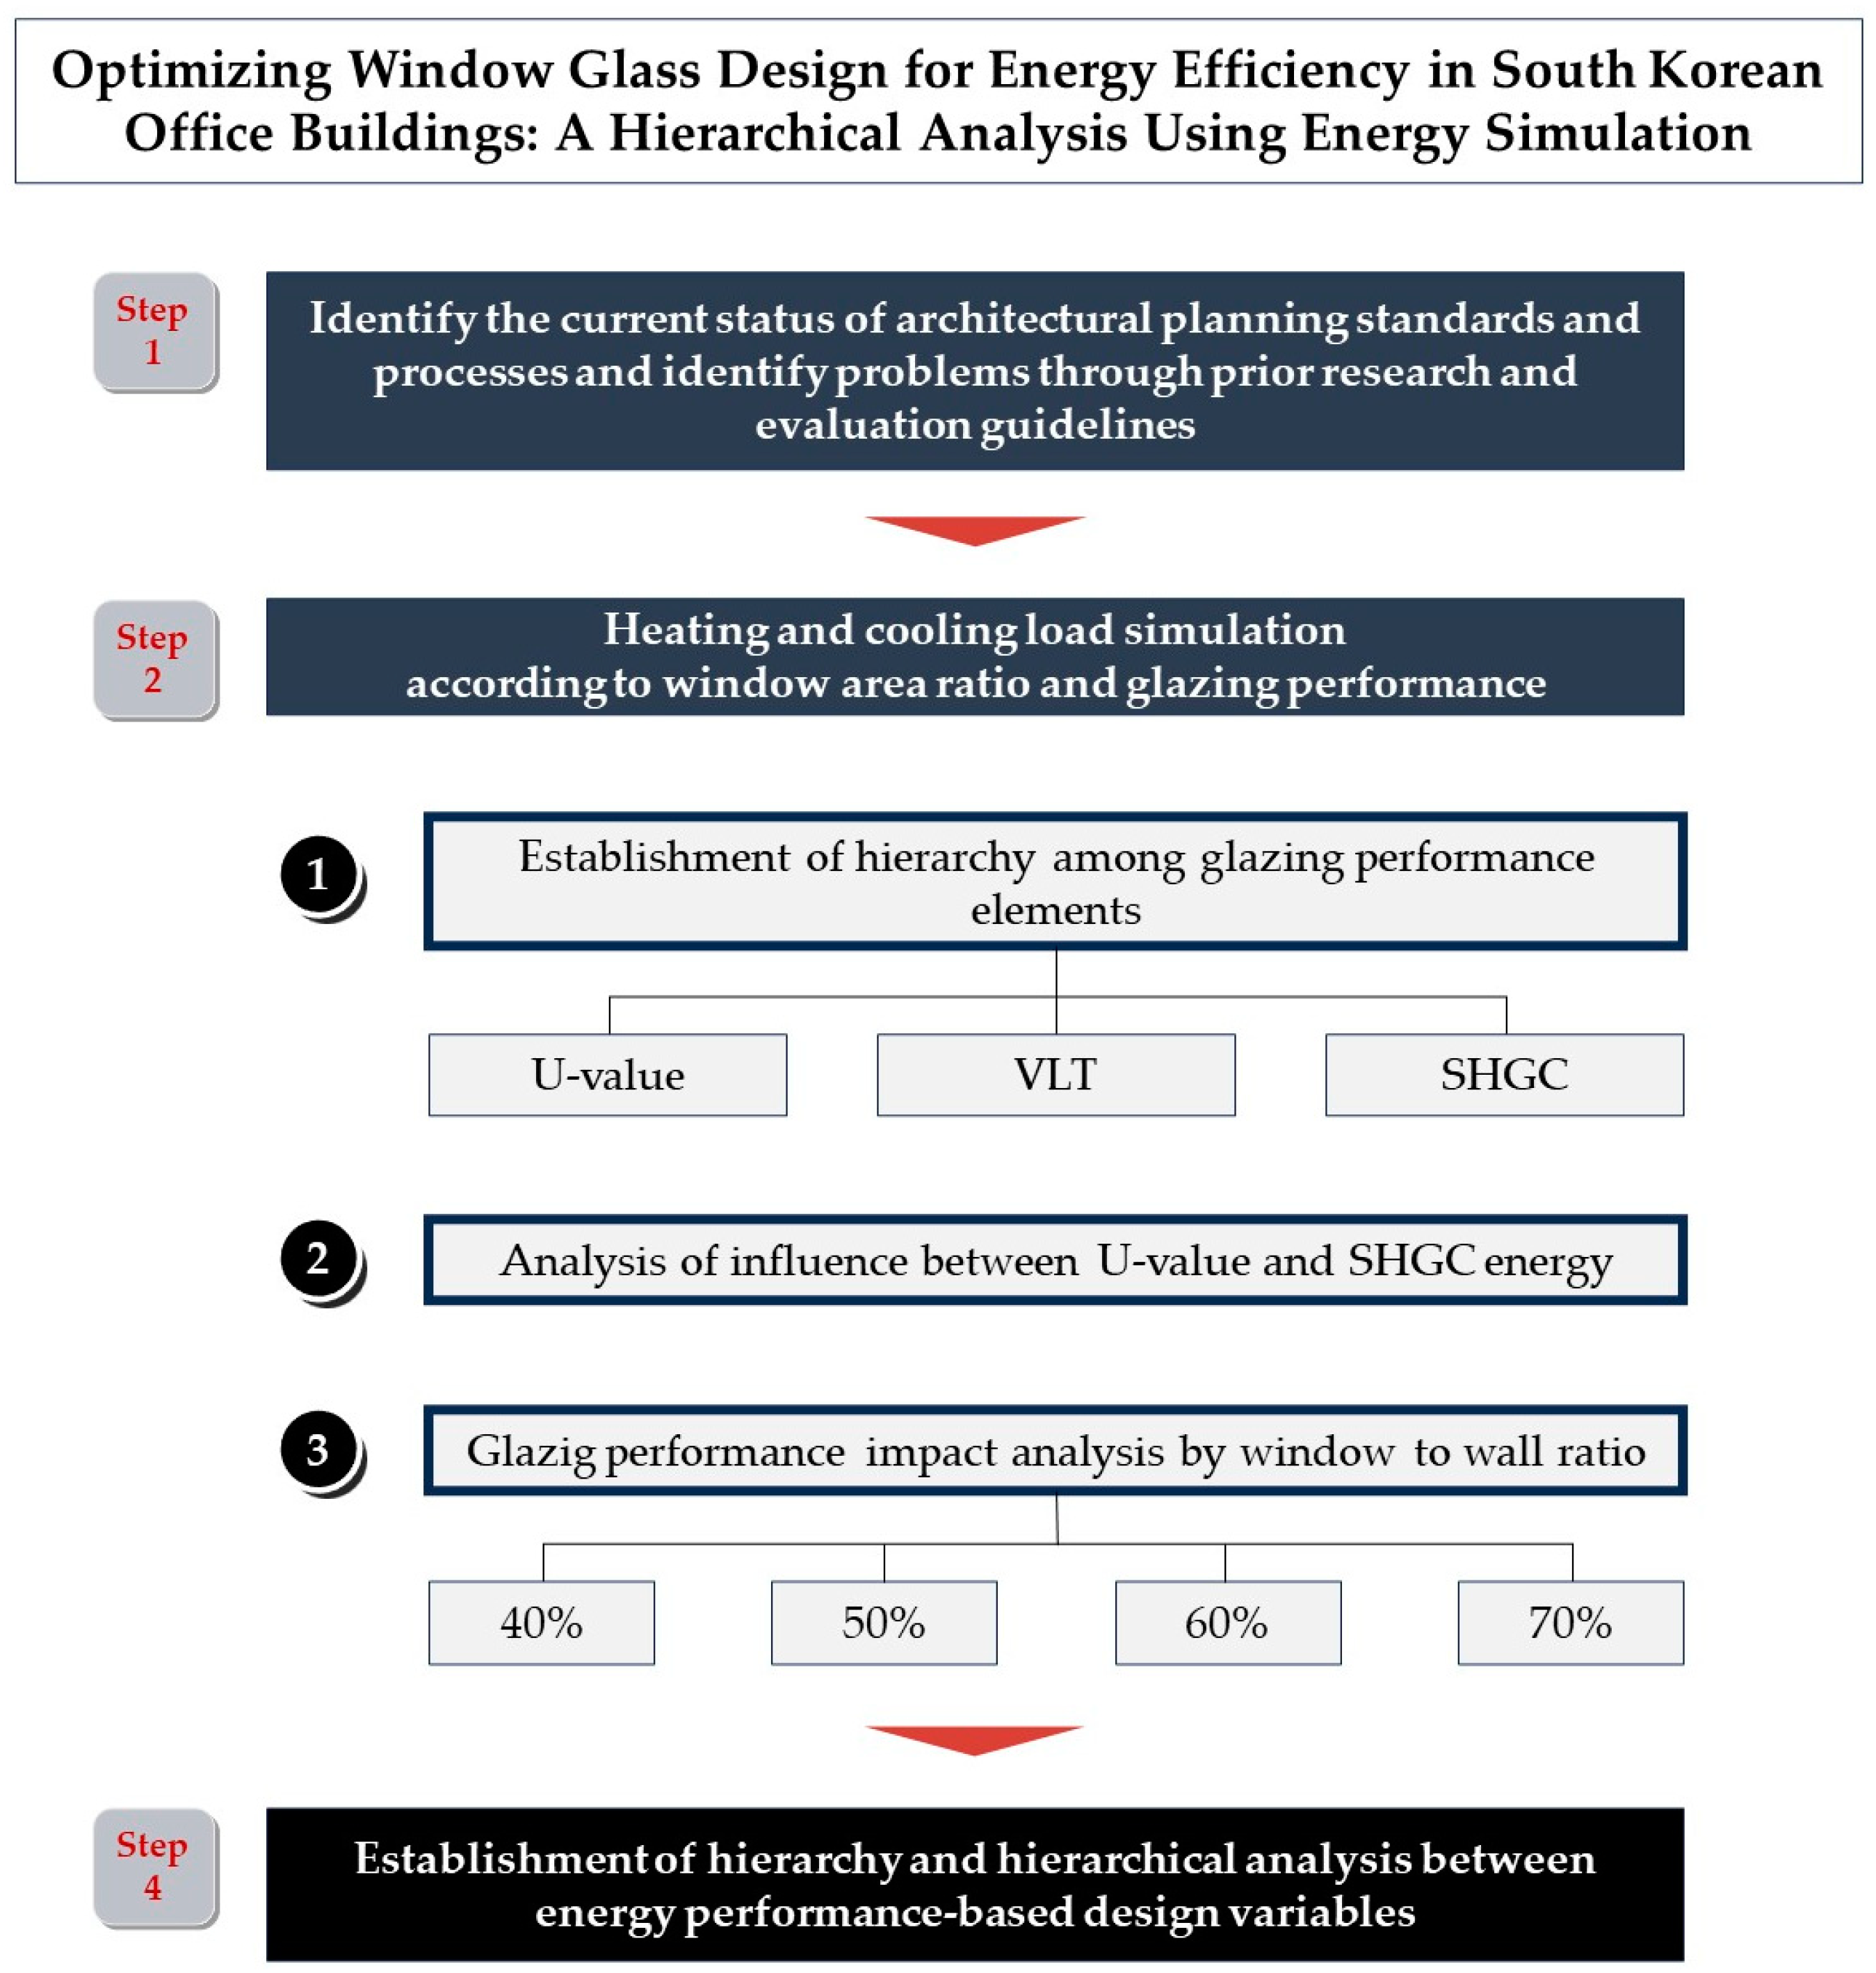
- First, the impact of each performance element (U-value, VLT, SHGC) on building load was analyzed by fixing the WWR of the mass at 50% and changing the windows’ performance composition. The window area was modeled so that all four sides have the same ratio for each direction.
- (2)
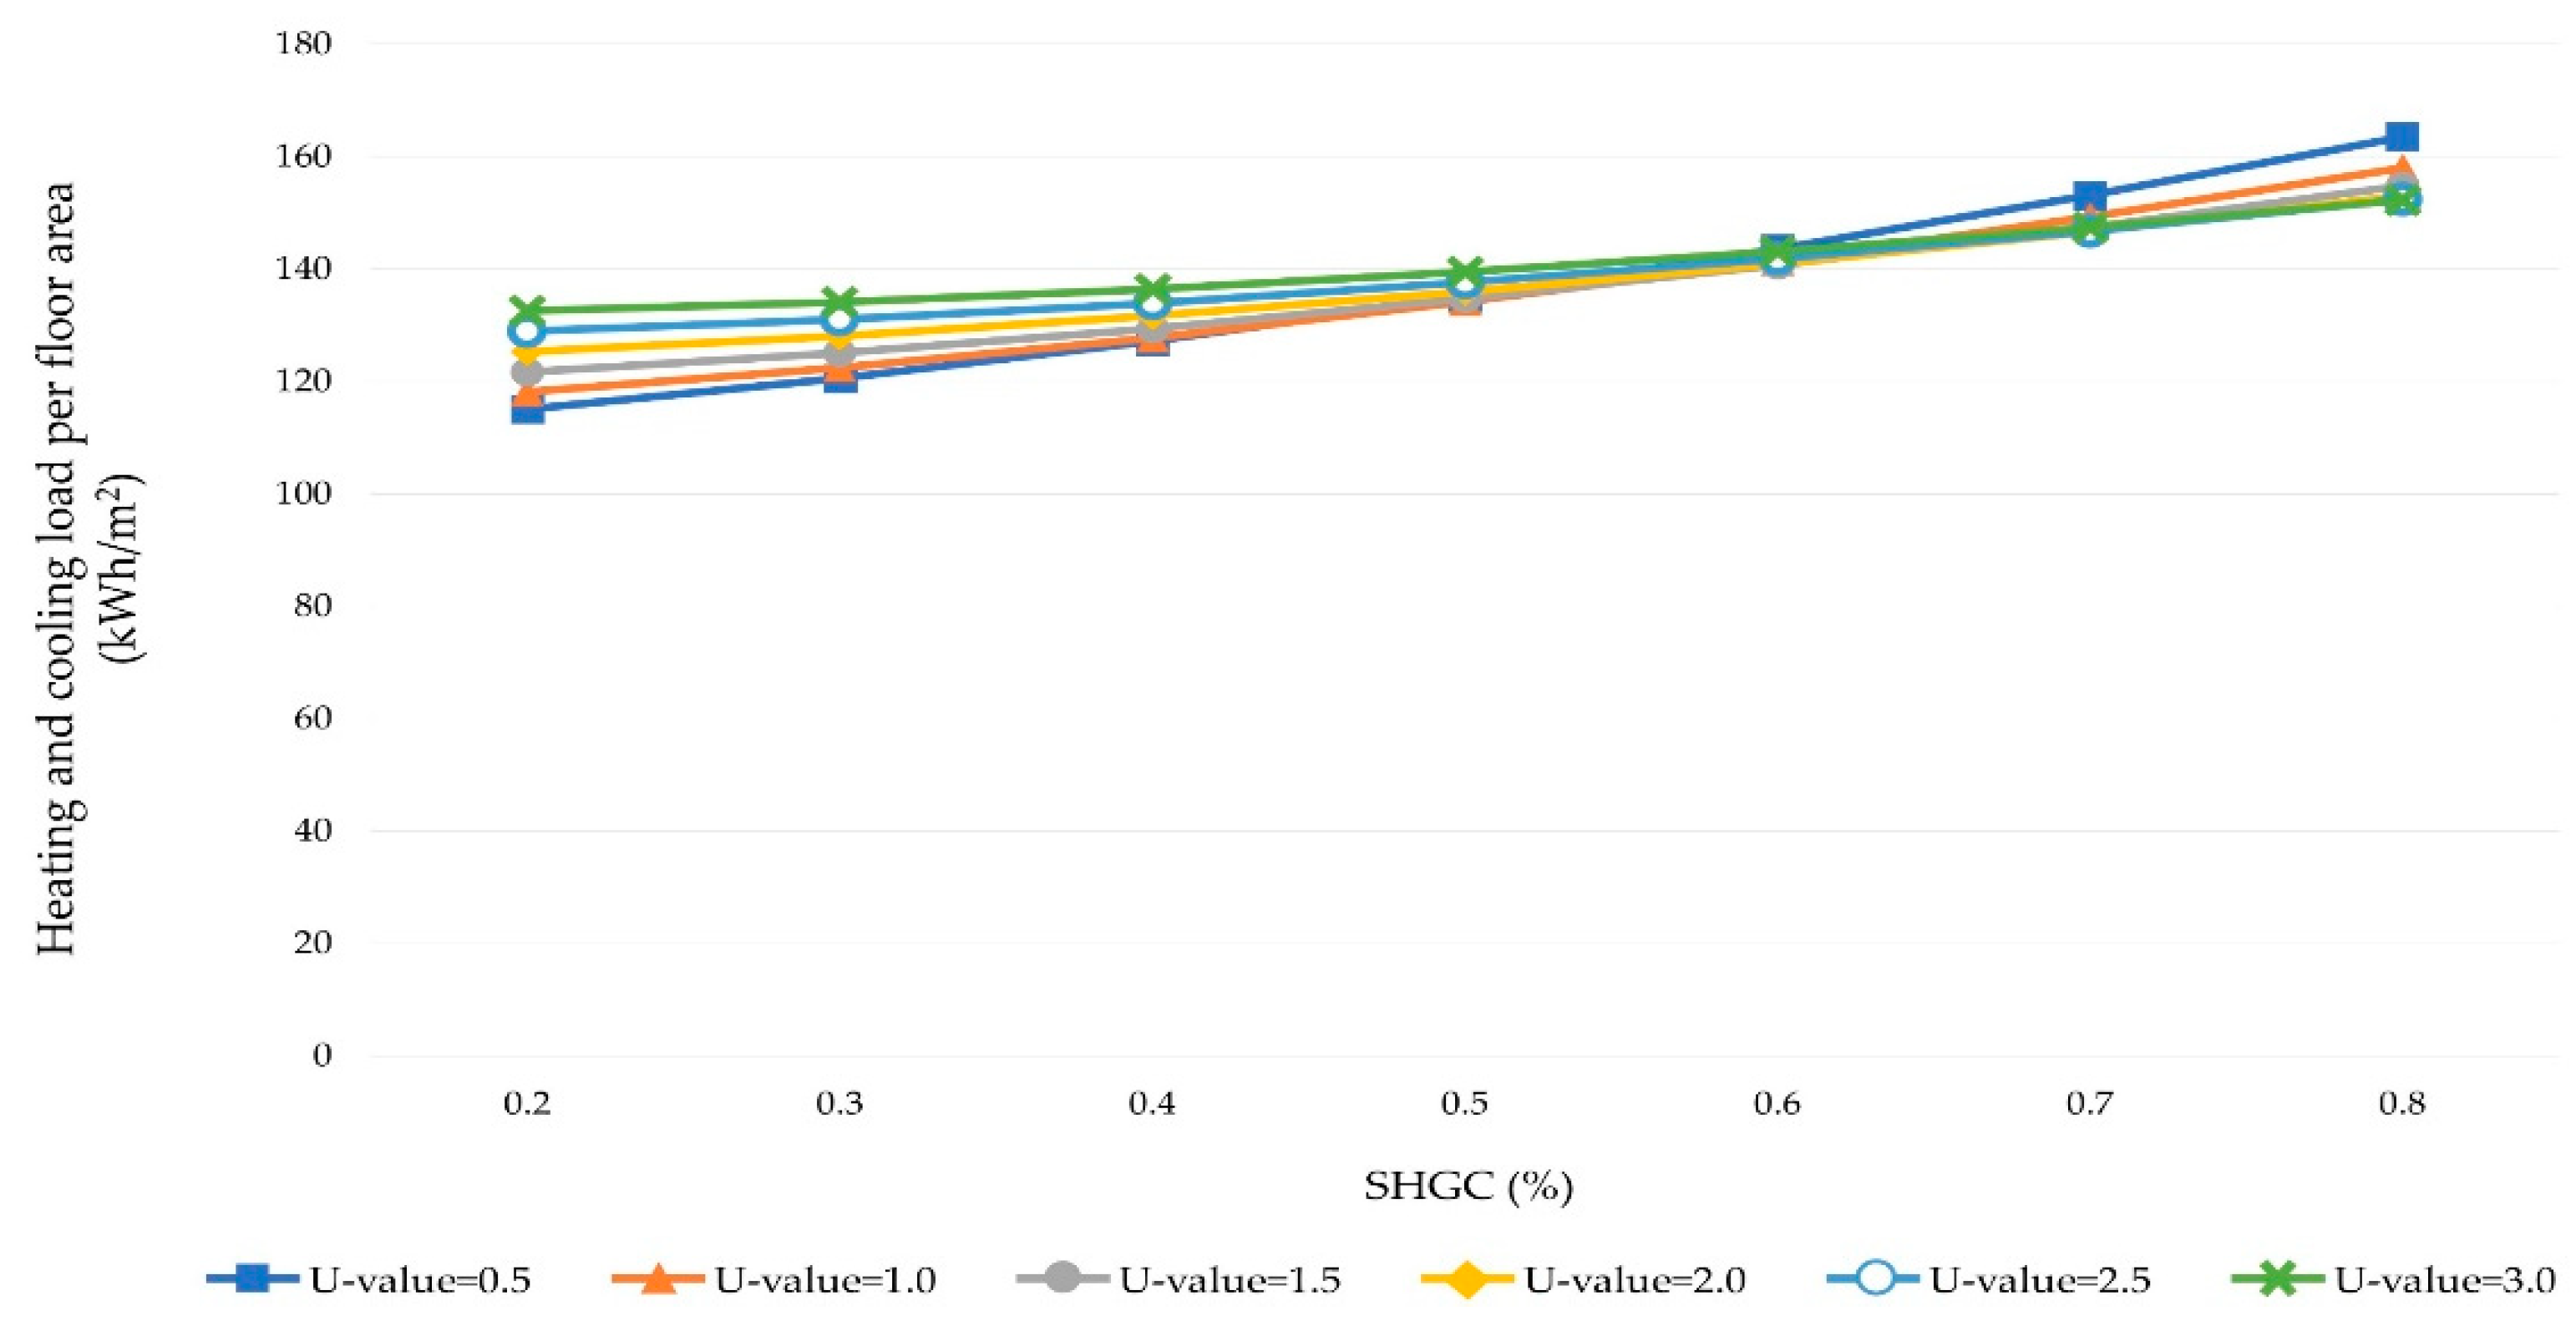
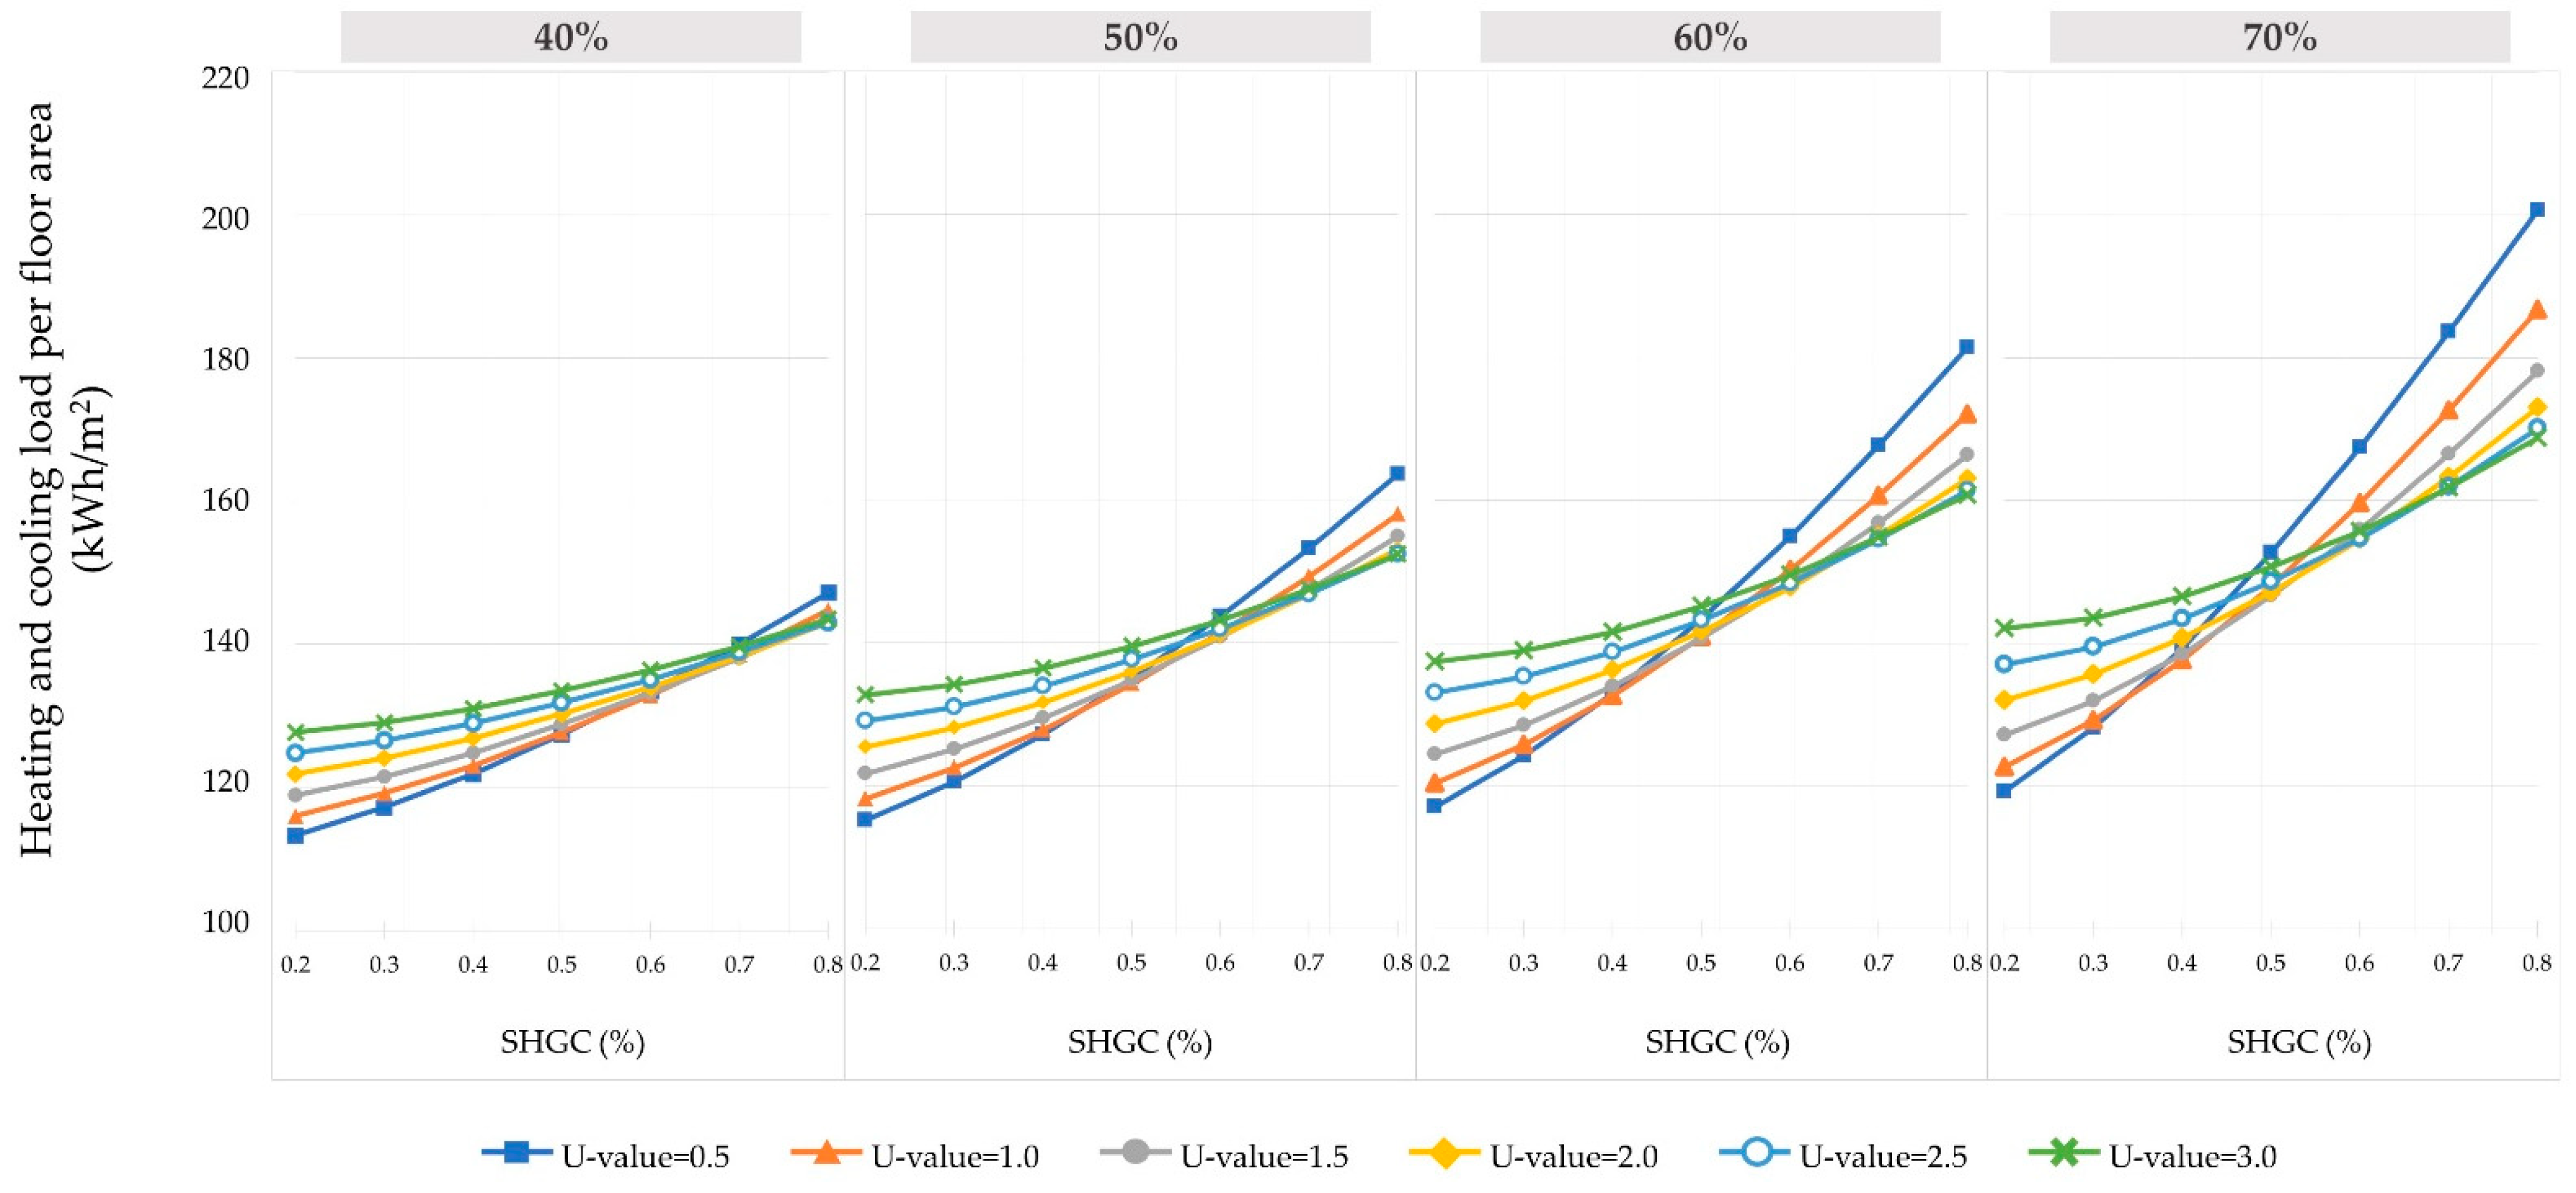
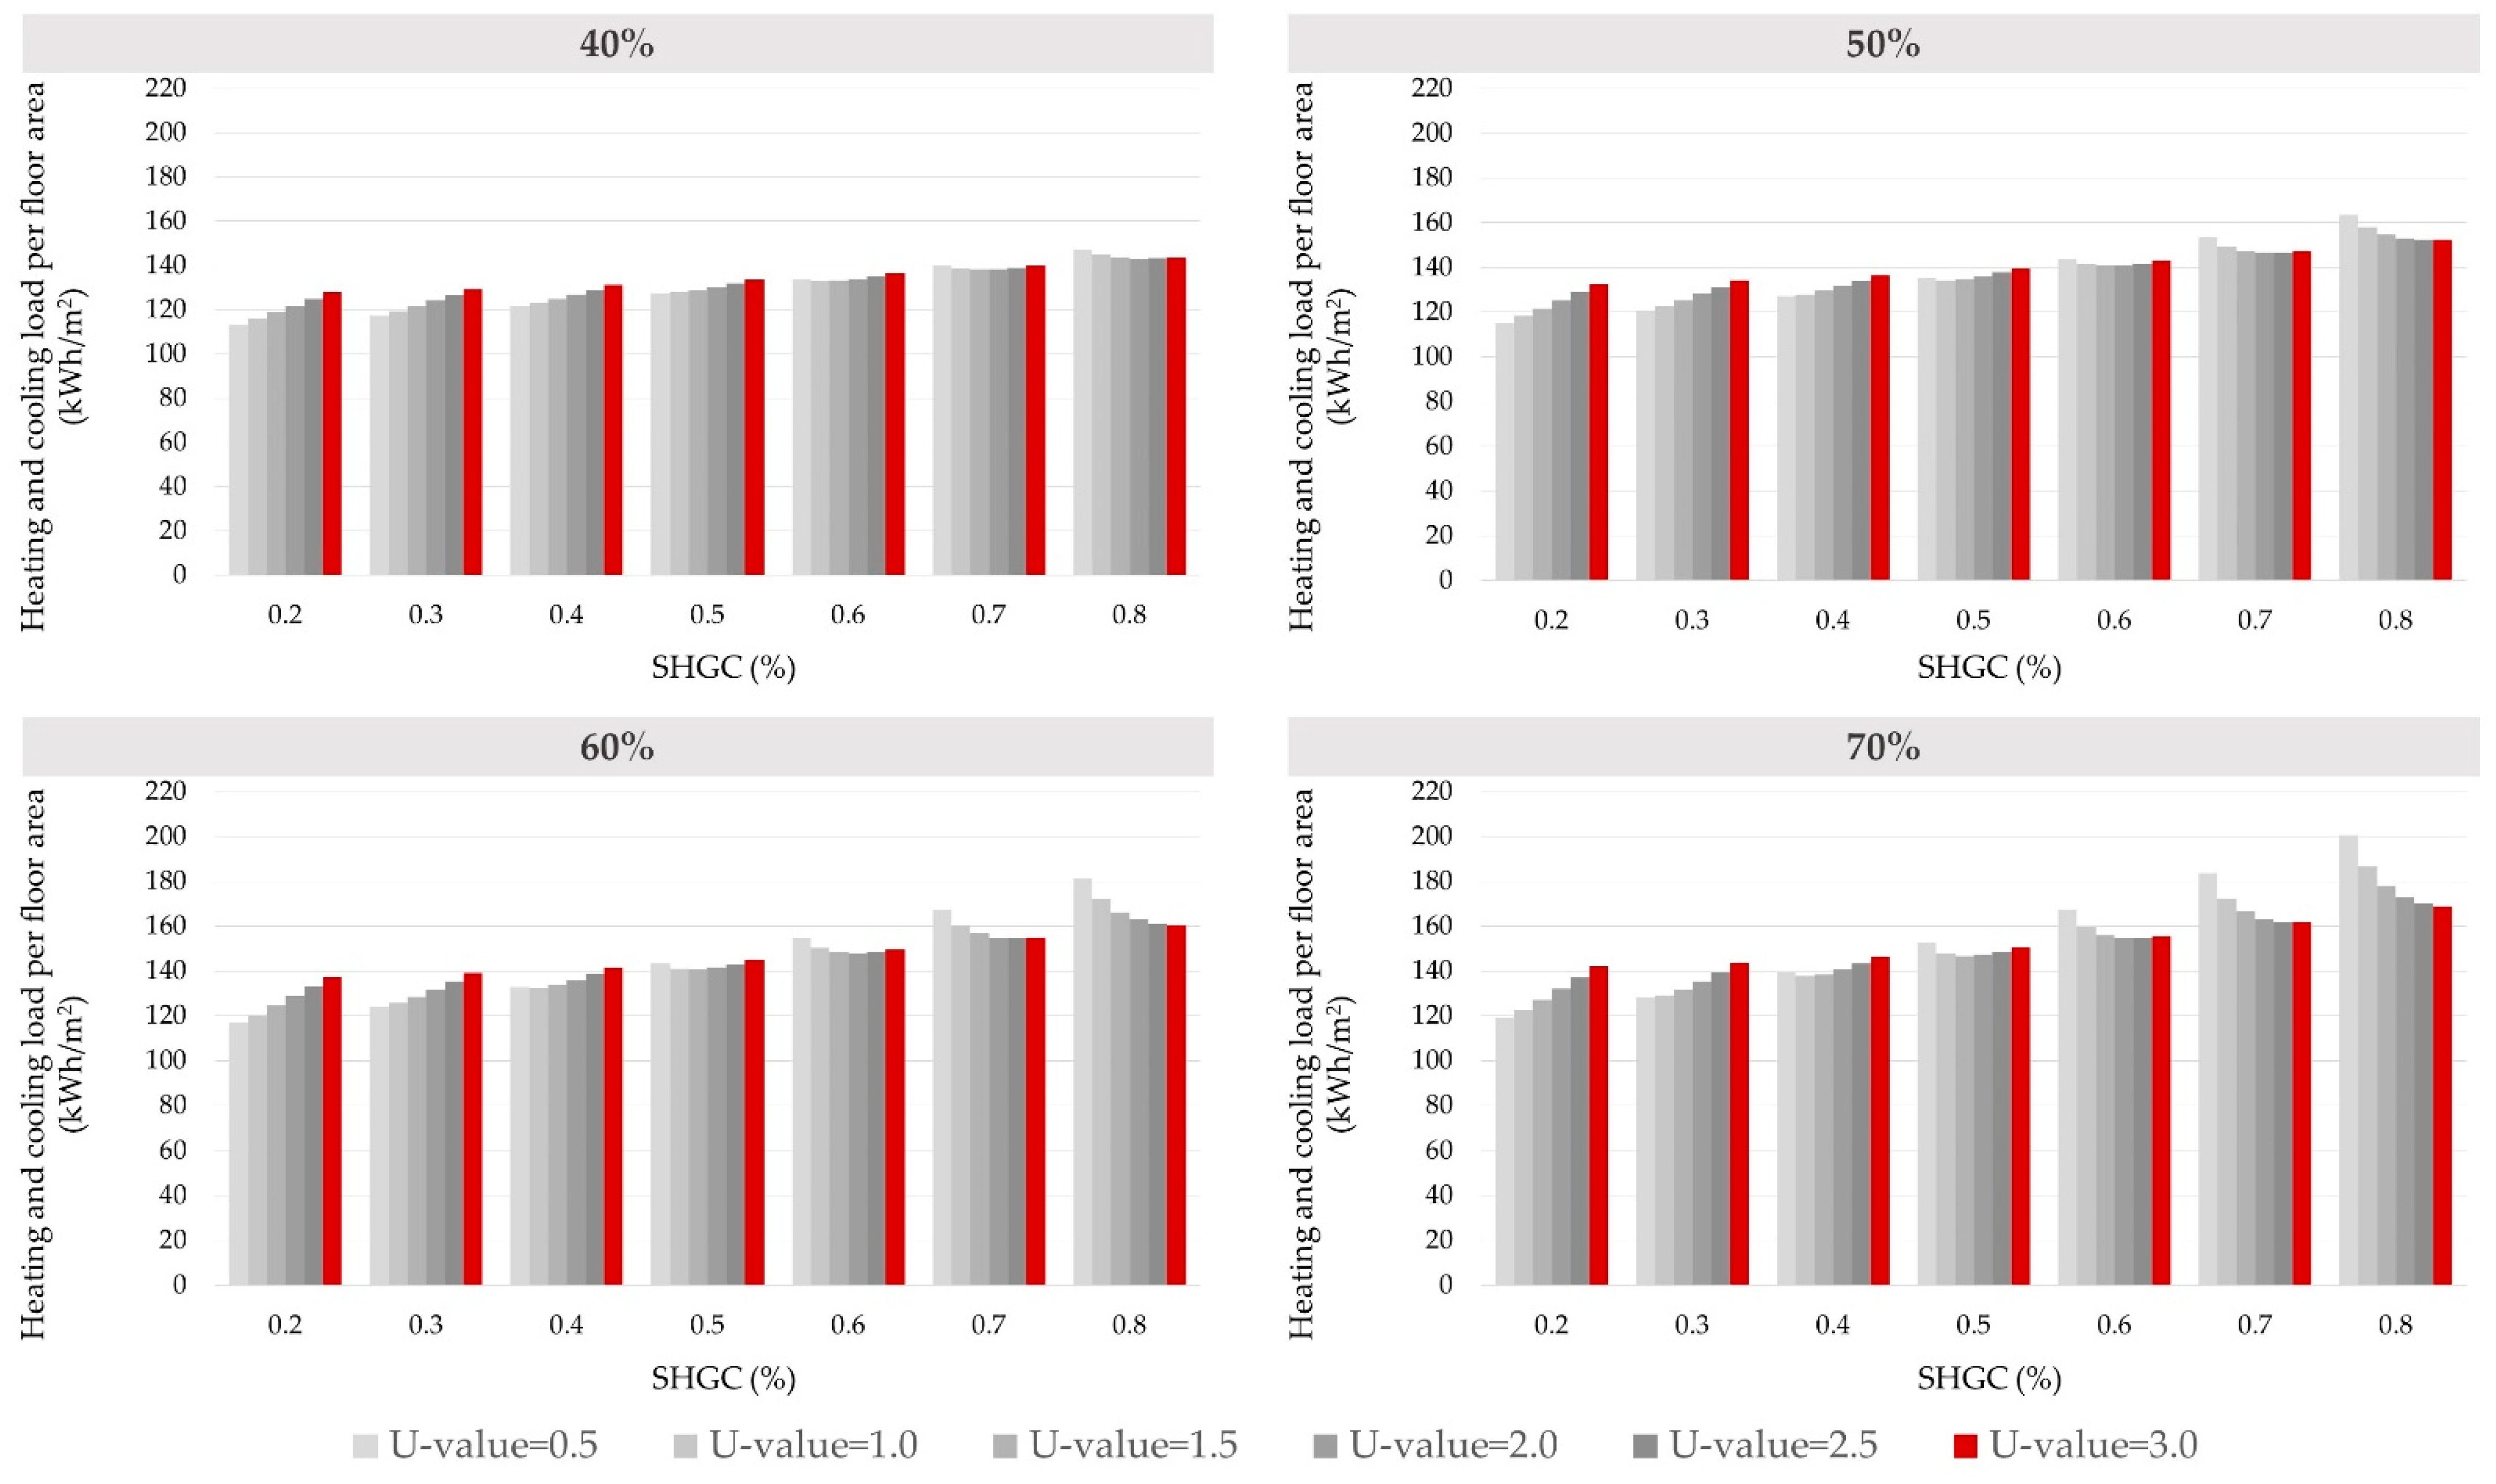
- Based on the experimental results above, the second experiment was conducted with a focus on the U-value and SHGC, which are performance elements with a great impact on energy load. This study analyzed the influence of each variable on energy load and performance differences according to the WWR. This is to provide a rational window plan applying the U-value and SHGC.
2.2. Simulation Verification Method
2.3. Configuring Window Performance for Experimental Models
- (1)
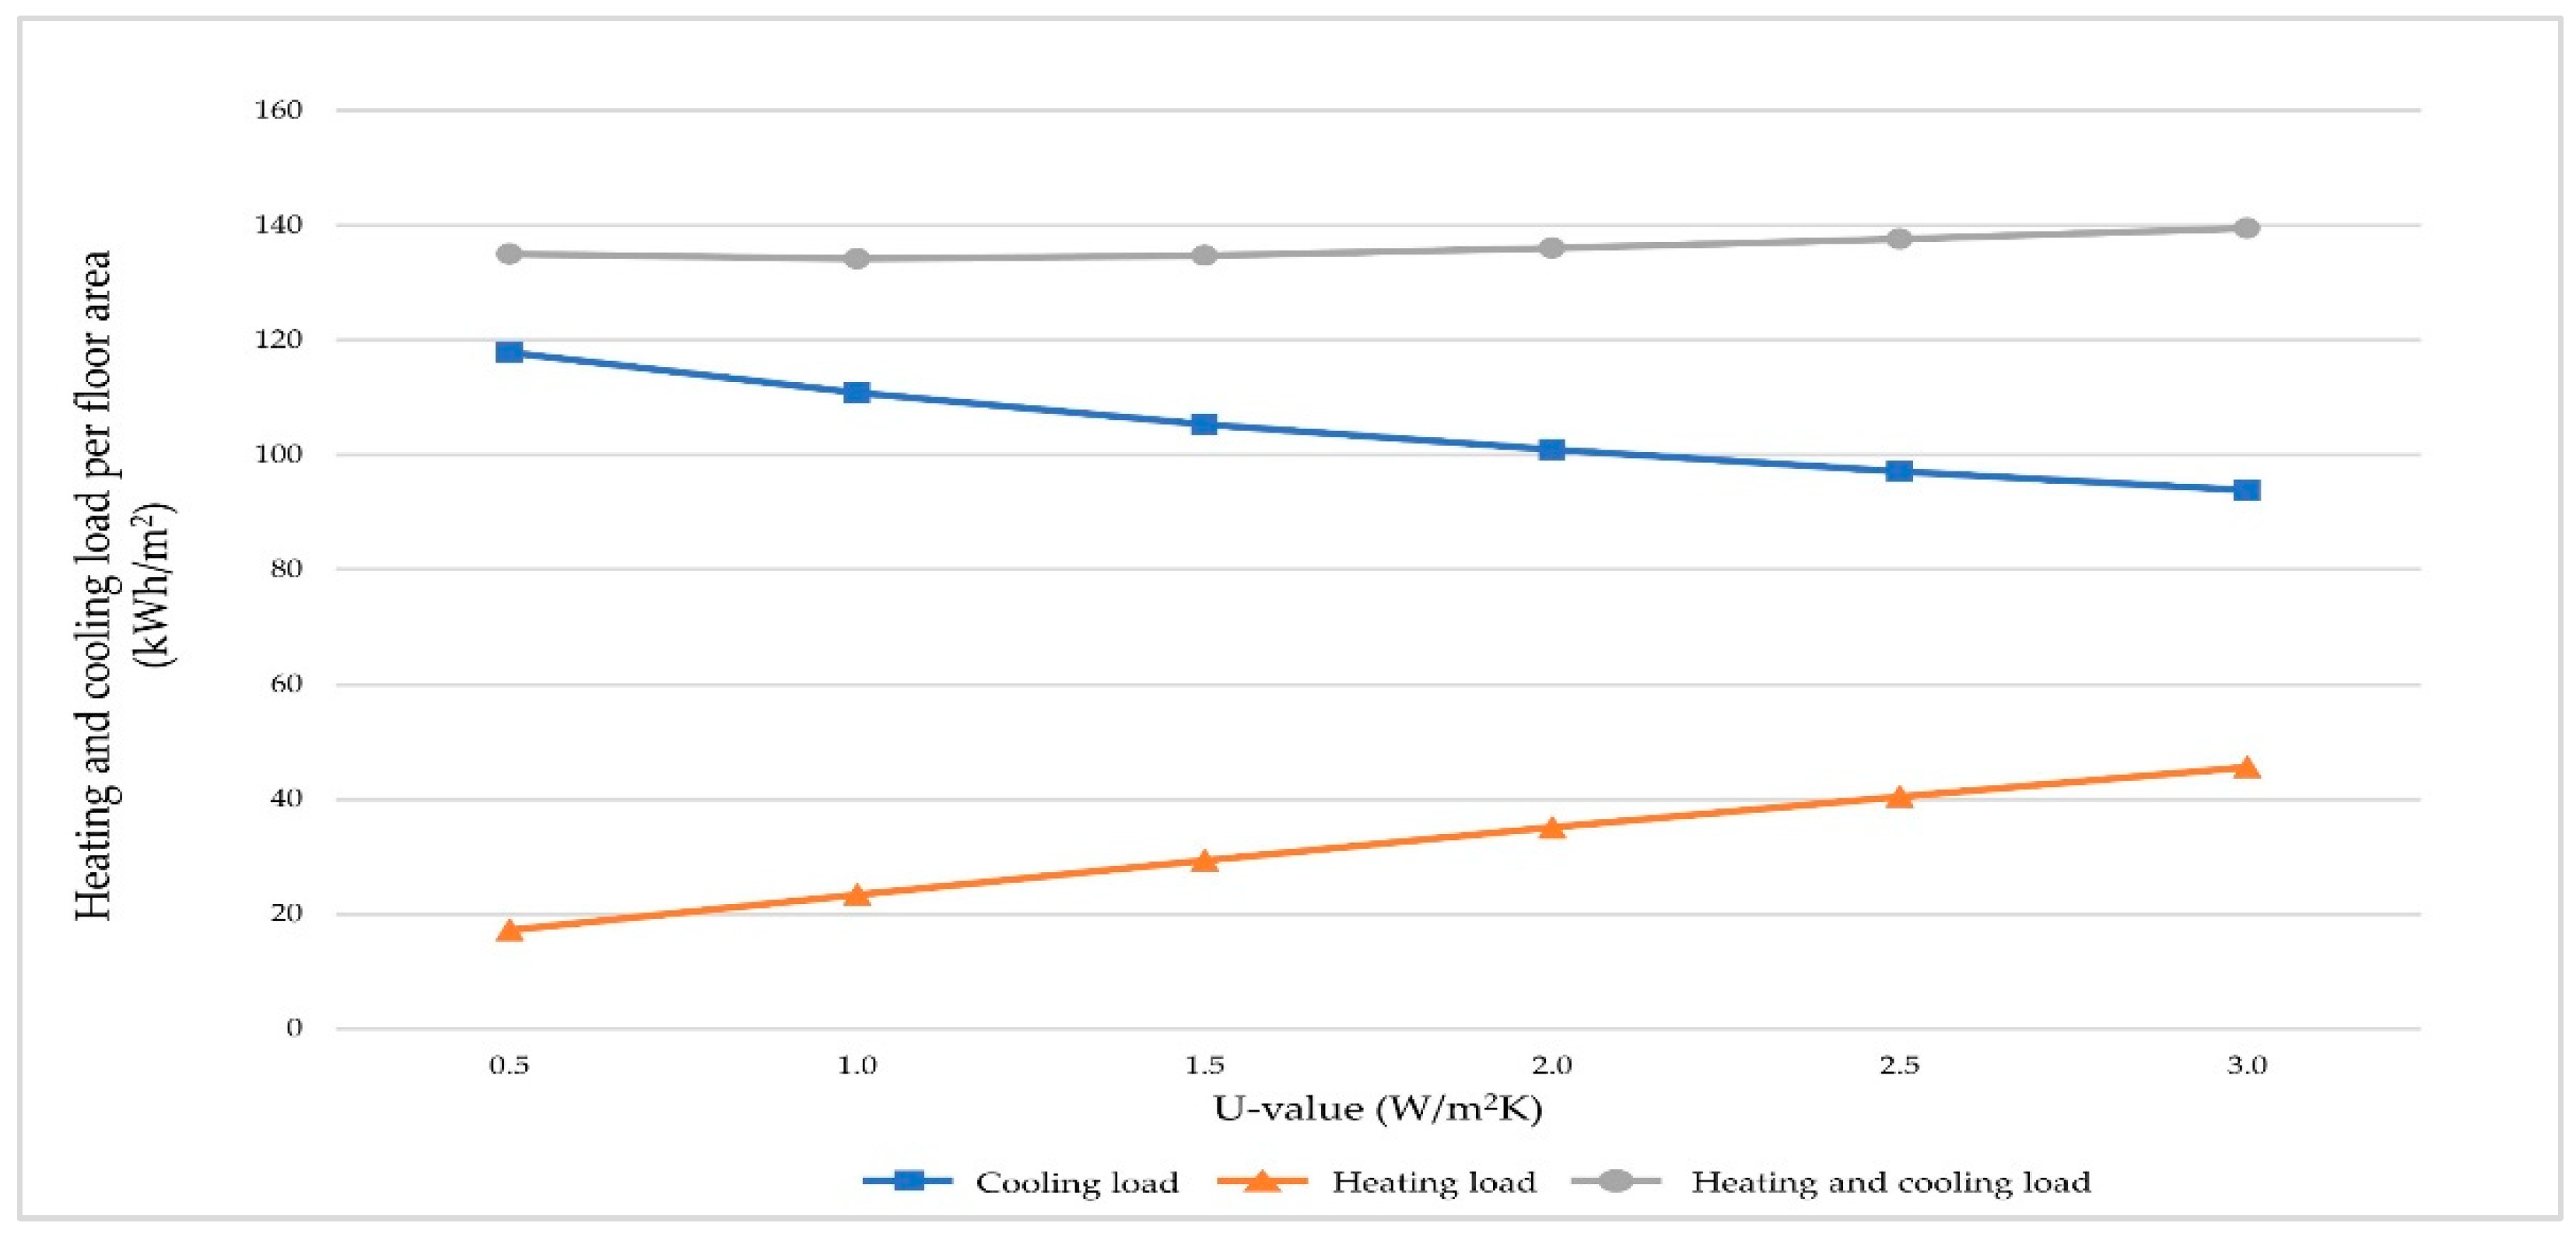
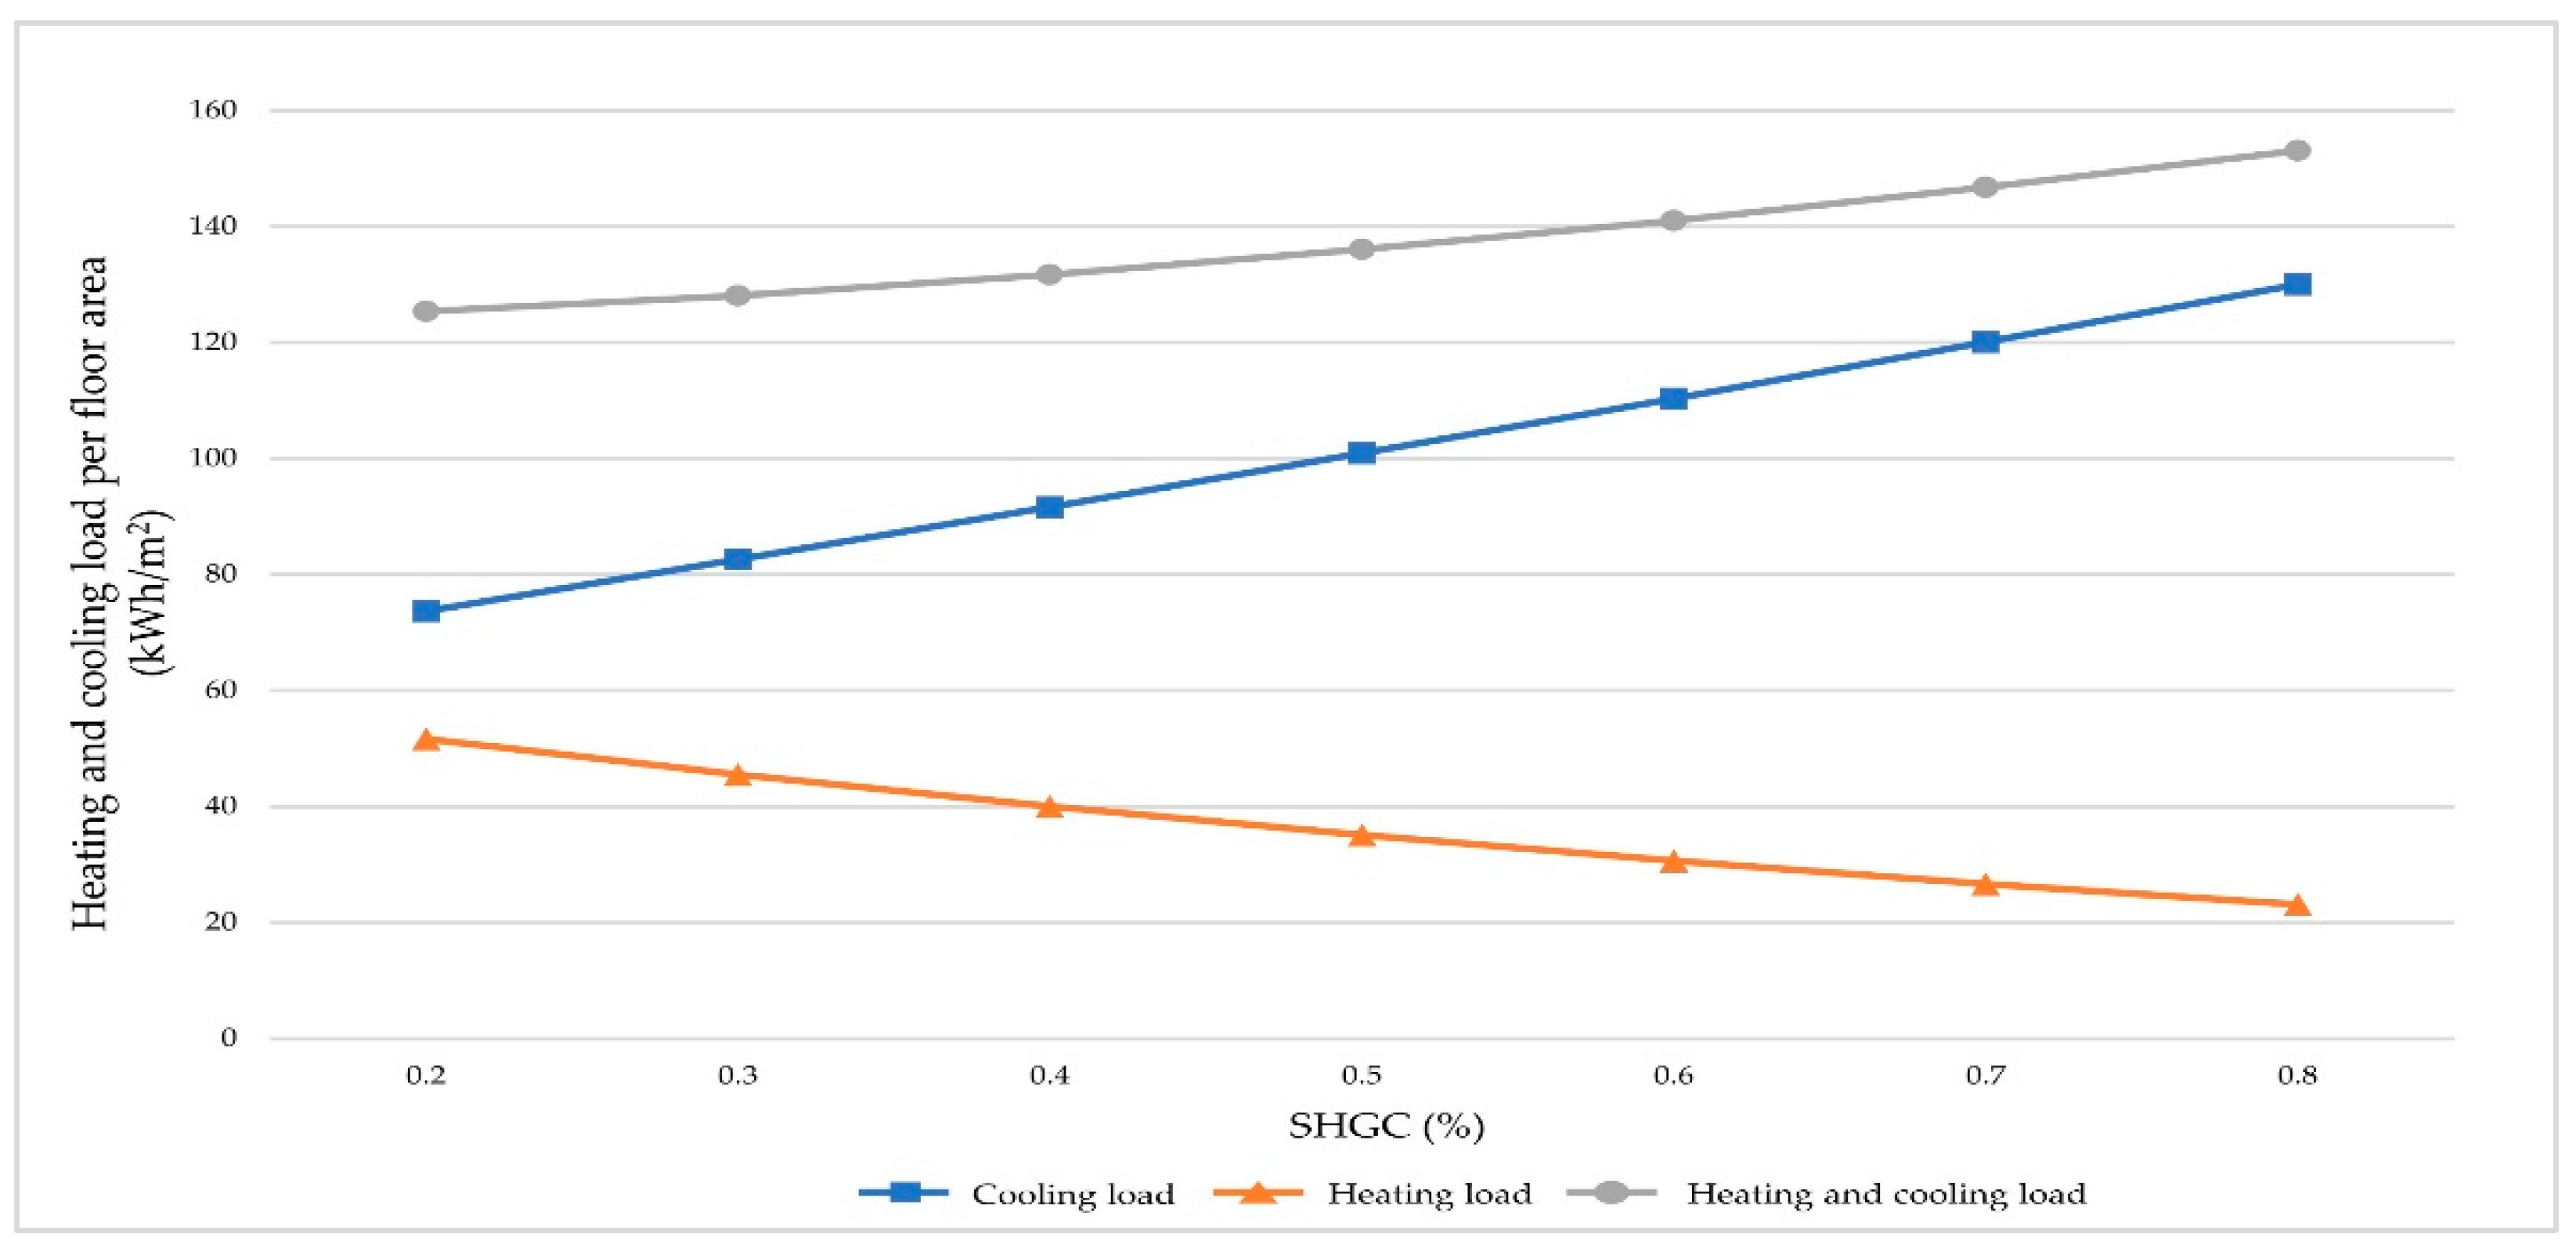
- The first experiment was on the impact of each element, and all elements, except one experimental element, were fixed at the median value to test the change in each performance element. Table 4 shows the setup of this experiment.
- (2)
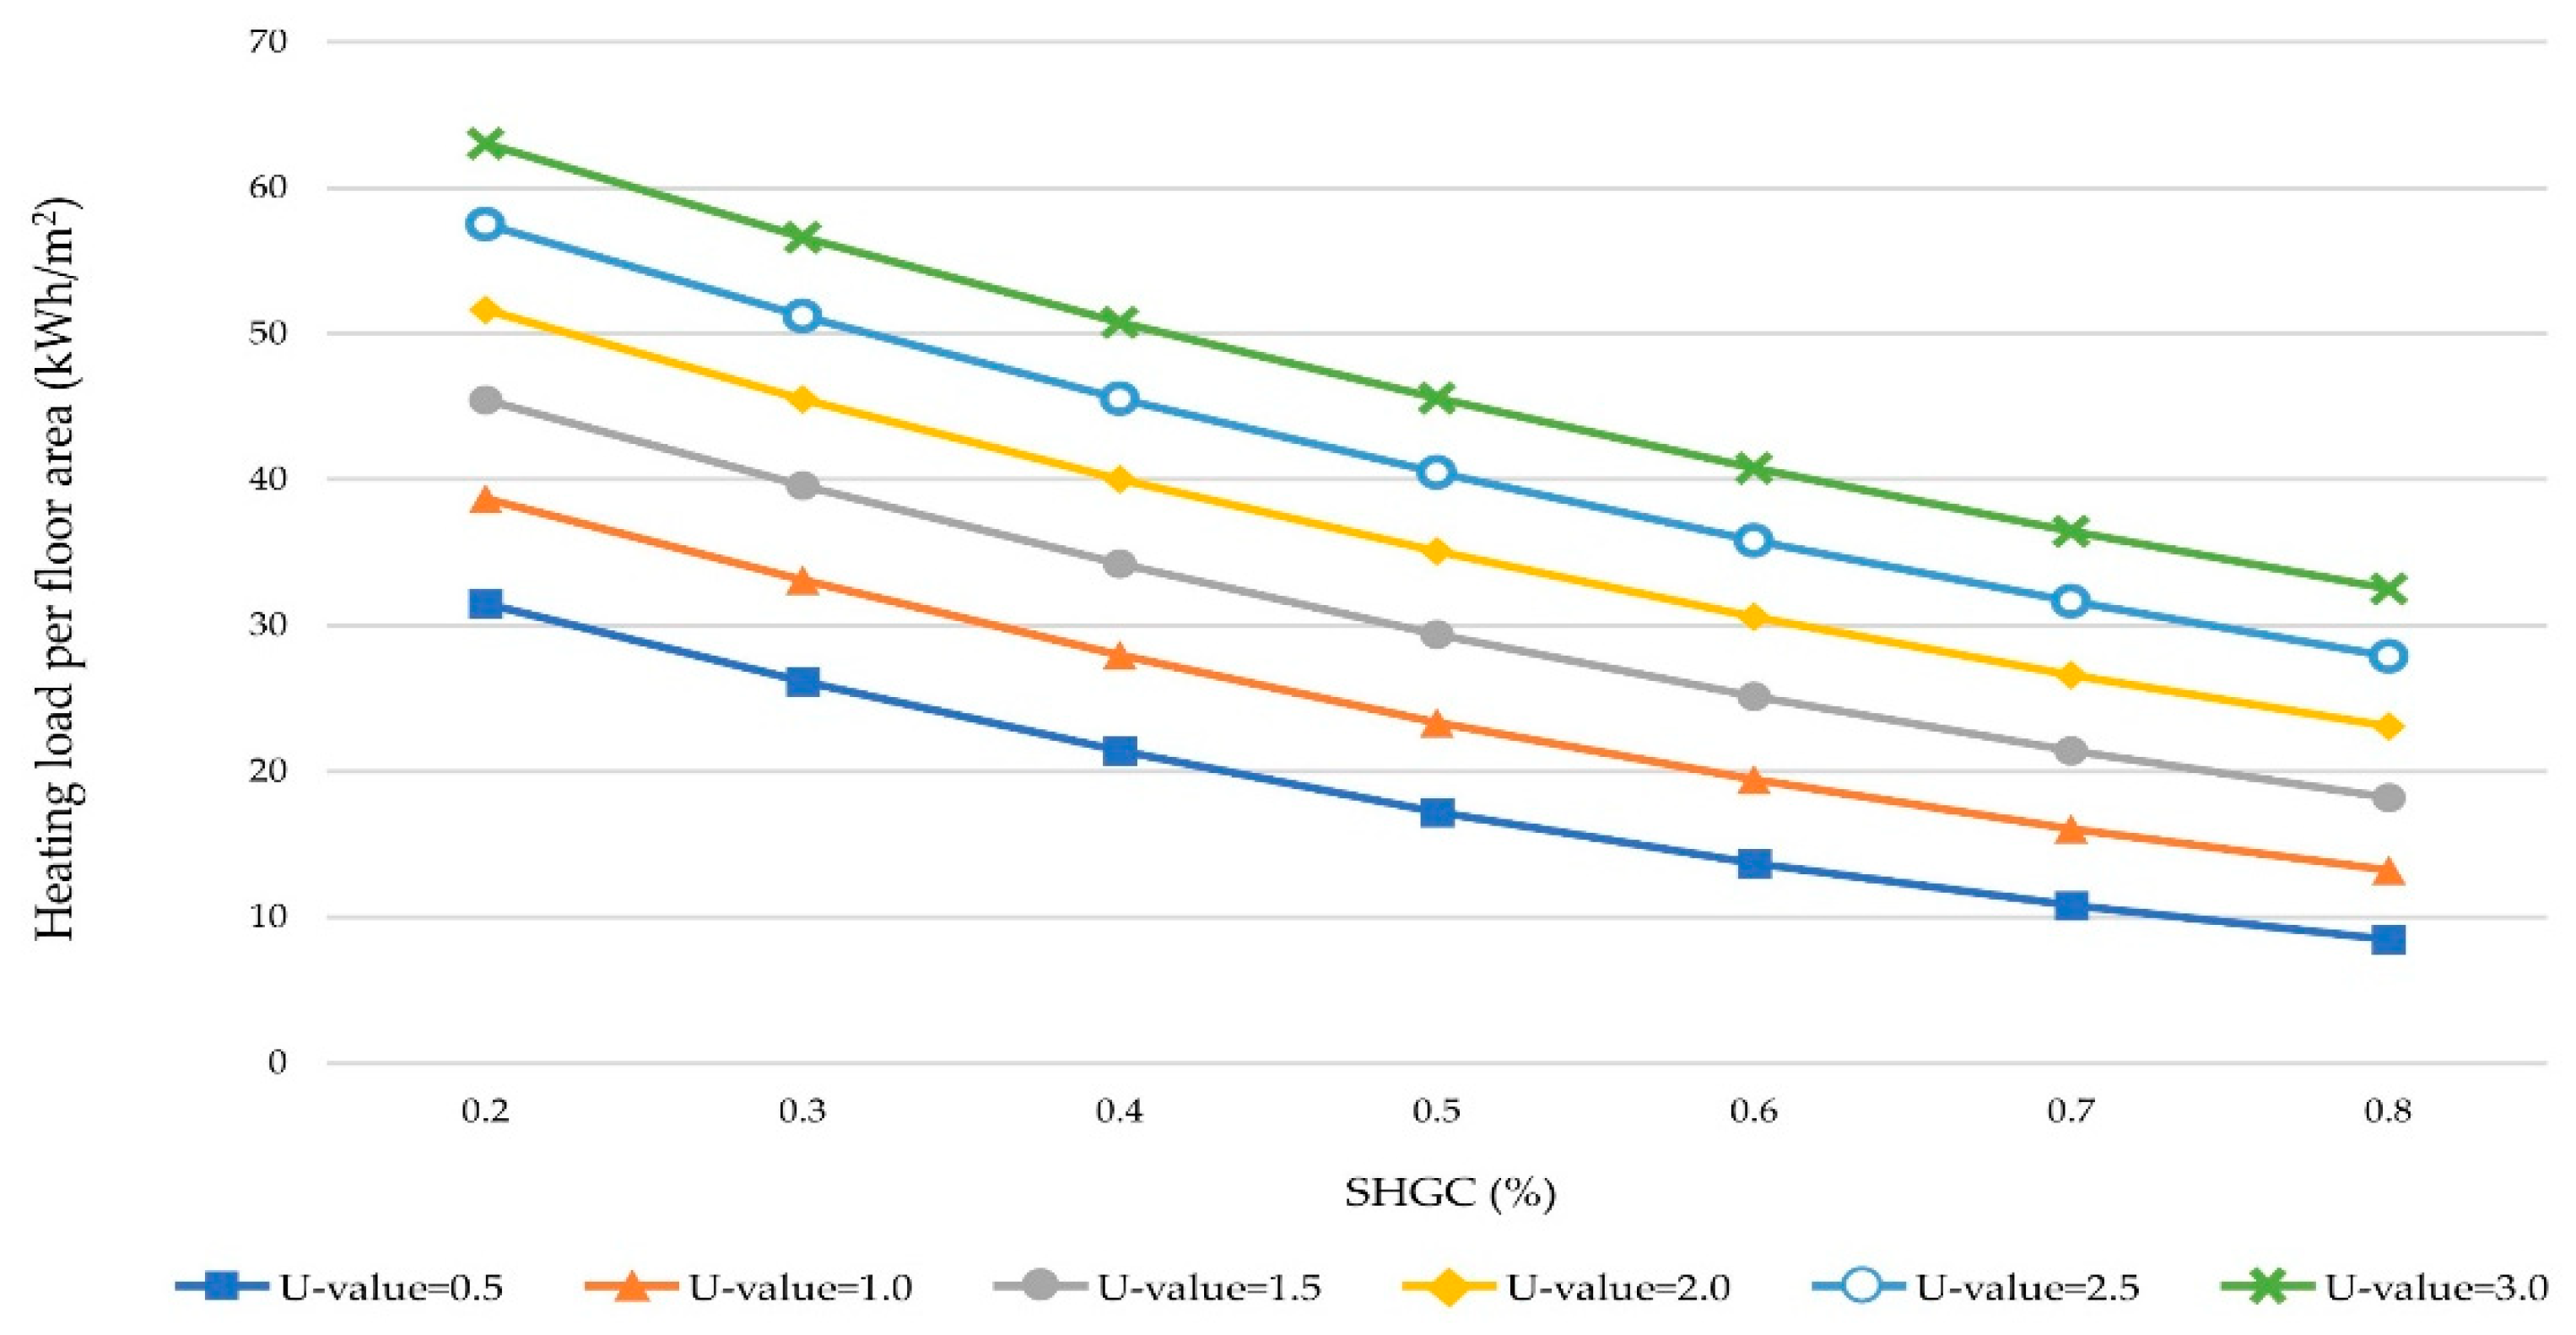
- Based on the experimental results above, the second experiment was conducted with a focus on the U-value and SHGC, which greatly impact heating and cooling loads. VLT was fixed at 0.5%, and the loads according to the change in the U-value and SHGC were identified to analyze the correlation between the performance elements and the loads. Table 5 shows the setup of this experiment.
3. Results and Discussion
3.1. Analysis of the Influence of Each Window Performance Factor
3.2. Annual Heating and Cooling Load According to U-Value and SHGC
3.3. A Hierarchical Analysis of U-Value and SHGC using Window Area Ratio
3.4. Sinter and Discussion
4. Conclusions
Author Contributions
Funding
Data Availability Statement
Conflicts of Interest
References
- Md, M.U.; Ji, J.; Wang, C.; Zhang, C.; Wei, K. A review on photovoltaic combined vacuum glazing: Recent advancement and prospects. Energy Build. 2023, 286, 112939. [Google Scholar]
- Our Wold in Data. Available online: https://ourworldindata.org/grapher/primary-energy-consumption-by-source (accessed on 9 June 2023).
- United Nations Environment Programme. Available online: https://globalabc.org/news/launched-2020-global-status-report-buildings-and-construction (accessed on 7 June 2023).
- European Commission. Available online: https://single-market-economy.ec.europa.eu/industry/sustainability/net-zero-industry-act_en (accessed on 9 June 2023).
- Masson-Delmotte, V.; Zhai, P.; Pörtner, H.O.; Roberts, D.; Skea, J.; Shukla, P.R.; Pirani, A.; Moufouma-Okia, W.; Péan, C.; Pidcock, R. Global Warming of 1.5 °C: An IPCC Special Report on the Impacts of Global Warming of 1.5 °C above Pre-Industrial Levels and Related Global Greenhouse Gas Emission Pathways, in the Context of Strengthening the Global Response to the Threat of Climate Change, Sustainable Development, and Efforts to Eradicate Poverty; Cambridge University Press: Cambridge, UK, 2018. [Google Scholar]
- Ministry of Land, Infrastructure and Transport. Available online: http://www.molit.go.kr/english/USR/BORD0201/m_28286/DTL.jsp?id=eng_mltm_new&mode=view&idx=2809 (accessed on 9 June 2023).
- MOLIT. Zero Energy Buildung Spread Policy; Ministry of Land, Infrastructure and Transport: Sejong, Republic of Korea, 2019.
- Koo, B.; Lee, K.; An, Y.; Lee, K. Solar Heat Gain Reduction of Ventilated Double Skin Windows without a Shading Device. Sustainability 2018, 10, 64. [Google Scholar] [CrossRef]
- Choi, Y.; Song, D.; Yoon, S.; Koo, J. Comparison of Factorial and Latin Hypercube Sampling Designs for Meta-Models of Building Heating and Cooling Loads. Energies 2021, 14, 512. [Google Scholar] [CrossRef]
- Lee, K.H.; Choo, S.Y. A Development of Low-Carbon Design Strategy and Analysis of Office Towers Mass-Form Determining Factors Rank using Green BIM-based Energy Simulation. J. Korean Inst. Archit. Sustain. Environ. Build. Syst. 2016, 10, 289–299. [Google Scholar]
- Lee, J.B. A Study on the optimized Performance Designing of the Window of the Apartment based on the Annual Energy Demand Analysis according to the Azimuth Angle applying the Solar Heat Gain Coefficient of the Window. J. Archit. Inst. Korea 2019, 35, 25–34. [Google Scholar]
- Erdem, C. Role of airtightness in energy loss from windows: Experimental results from in-situ tests. Energy Build. 2017, 139, 449–455. [Google Scholar]
- Chen, Z.; Hammad, A.W.A.; Kamardeen, I.; Haddad, A. Optimising Window Design on Residential Building Facades by Considering Heat Transfer and Natural Lighting in Nontropical Regions of Australia. Buildings 2020, 10, 206. [Google Scholar] [CrossRef]
- Ko, Y.J.; Hong, H.K.; Min, J.K. Energy Performance Evaluation of Responsive Smart Windows Applying SPD According to Window Area Ratio and SHGC Range. Korean J. Air-Cond. Refrig. Eng. 2020, 32, 441–447. [Google Scholar]
- Park, Y.; Park, J.I. A study of Energy use Impacts by SHGCs of Windows in Detached House. Korean J. Air-Cond. Refrig. Eng. 2010, 22, 189–196. [Google Scholar]
- Chang, W.S.; Shin, H.C.; Suh, S.J. A Study on the Energy Performance according to Envelope Condition of Business Building with Curtain Wall. J. Korean Inst. Archit. Sustain. Environ. Build. Syst. 2014, 8, 97–103. [Google Scholar]
- Carlos, J.S.; Corvacho, H. Evaluation of the performance indices of a ventilated double window through experimental and analytical procedures: SHGC-values. Energy Build. 2015, 86, 886–897. [Google Scholar] [CrossRef]
- Yeom, S.; An, J.; Hong, T.; Kim, S. Determining the optimal visible light transmittance of semi-transparent photovoltaic considering energy performance and occupants’ satisfaction. Build. Environ. 2023, 231, 110042. [Google Scholar] [CrossRef]
- Nie, Z.; Chen, S.; Zhang, S.; Wu, H.; Weiss, T.; Zhao, L. Adaptive Façades Strategy: An architect-friendly computational approach based on co-simulation and white-box models for the early design stage. Energy Build. 2023, 296, 113320. [Google Scholar] [CrossRef]
- Mohammad, D.; Moncef, K. Optimal Control Strategies for Switchable Transparent Insulation Systems Applied to Smart Windows for US Residential Buildings. Energies 2021, 14, 2917. [Google Scholar] [CrossRef]
- Lantonio, A.N.; Krarti, M. Simultaneous design and control optimization of smart glazed windows. Appl. Energy 2022, 328, 120239. [Google Scholar] [CrossRef]
- Sbar, N.L.; Podbelski, L.; Yang, H.M.; Pease, B. Electrochromic dynamic windows for office buildings. Int. J. Sustain. Built Environ. 2012, 1, 125–139. [Google Scholar] [CrossRef]
- Mesloub, A.; Ghosh, A.; Touahmia, M.; Albaqawy, G.A.; Alsolami, B.M. Atef AhrizAssessment of the overall energy performance of an SPD smart window in a hot desert climate. Energy 2022, 252, 124073. [Google Scholar] [CrossRef]
- Ko, Y.; Oh, H.; Hong, H.; Min, J. Energy Consumption Verification of SPD Smart Window, Controllable According to Solar Radiation in South Korea. Energies 2020, 13, 5643. [Google Scholar] [CrossRef]
- Baetens, R.; Jelle, B.P.; Gustavsen, A. Properties, requirements and possibilities of smart windows for dynamic daylight and solar energy control in buildings: A state-of-the-art review. Sol. Energy Mater. Sol. Cells 2010, 94, 87–105. [Google Scholar] [CrossRef]
- Krarti, M. Optimal optical properties for smart glazed windows applied to residential buildings. Energy 2023, 278, 128017. [Google Scholar] [CrossRef]
- Zhao, J.; Du, Y. Multi-objective optimization design for windows and shading configuration considering energy consumption and thermal comfort: A case study for office building in different climatic regions of China. Sol. Energy 2020, 206, 997–1017. [Google Scholar] [CrossRef]
- Nundy, S.; Mesloub, A.; Alsolami, B.M.; Ghosh, A. Electrically actuated visible and near-infrared regulating switchable smart window for energy positive building: A review. Clean. Prod. 2021, 301, 126854. [Google Scholar] [CrossRef]
- Moghaddam, S.A.; Serra, C.; Gameiro da Silva, M.; Simões, N. Comprehensive Review and Analysis of Glazing Systems towards Nearly Zero-Energy Buildings: Energy Performance, Thermal Comfort, Cost-Effectiveness, and Environmental Impact Perspectives. Energies 2023, 16, 6283. [Google Scholar] [CrossRef]
- Hee, W.J.; Alghoul, M.A.; Bakhtyar, B.; Elayeb, O.K.; Shameri, M.A.; Alrubaih, M.S.; Sopian, K. The role of window glazing on daylighting and energy saving in buildings. Renew. Sustain. Energy Rev. 2015, 42, 323–343. [Google Scholar] [CrossRef]
- Kim, J.H.; Son, S.K.; Choi, G.S.; Kim, Y.T.; Kim, S.B.; Choi, W.K. A Fundamental Study on the Development of New Energy Performance Index in Office Buildings. Energies 2021, 14, 2064. [Google Scholar] [CrossRef]
- Yoon, Y.S.; Choi, W.K.; Sim, M.H. A Study on the Characteristics of the Energy Performance in Curtain Wall Building—Focused on the Glazing Type, Window to Wall Ratio and Internal Gains. JAIK 2013, 29, 255–263. [Google Scholar]
- ANSI/ASHRAE Standard 140-2017; Standard Method of Test for the Evaluation of Building Energy Analysis Computer Program. ASHRAE: Peachtree Corners, GA, USA, 2017.
- DesignBuilder. Available online: https://designbuilder.co.uk/download/documents (accessed on 12 November 2023).
- Yoon, J.H.; Hong, W.W.; Hwang, W.J.; Choi, W.K. A Study of Correlation between Glazing Performance and Building Energy—Focused on the U-value, SHGC and VLT in a Curtain Wall Building. JAIK 2011, 27, 341–348. [Google Scholar]
- Tsay, Y.S.; Yang, C.H.; Yeh, C.Y. Evaluation of Metal Mesh Applied on Building Facades with Regard to Daylight and Energy Consumption: A Case Study of an Office Building in Taiwan. Buildings 2022, 12, 1187. [Google Scholar] [CrossRef]
- Lee, J.W.; Jung, H.J.; Park, J.Y.; Lee, J.B.; Yoon, Y. Optimization of building window system in Asian regions by analyzing solar heat gain and daylighting elements. Renew. Energy 2013, 50, 522–531. [Google Scholar] [CrossRef]
- Sadooghi, P.; Kherani, N.P. Thermal analysis of triple and quadruple windows using partitioning radiant energy veils™ with different physical and optical properties. Sol. Energy 2018, 174, 1163–1168. [Google Scholar] [CrossRef]
- Liu, X.; Wu, Y. Numerical evaluation of an optically switchable photovoltaic glazing system for passive daylighting control and energy-efficient building design. Build. Environ. 2022, 219, 109170. [Google Scholar] [CrossRef]
- Ménard, R.; Souviron, J. Passive solar heating through glazing: The limits and potential for climate change mitigation in the European building stock. Energy Build. 2020, 228, 110400. [Google Scholar] [CrossRef]
- Shin, J.G.; Kim, K.J.; Jeong, J.W.; Choi, W.K. A Study on the Energy Consumption Patterns according to Correlation of SHGC and U-value in Commercial-Residential Buildings. In Proceedings of the Society of Air-conditioning and Refrigerating Engineers of Korea, Seoul, Republic of Korea, 6 July 2011. [Google Scholar]
- Raji, B.; Tenpierik, M.J.; Dobbelsteen, A. An assessment of energy-saving solutions for the envelope design of high-rise buildings in temperate climates: A case study in the Netherlands. Energy Build. 2016, 124, 210–221. [Google Scholar] [CrossRef]
- Zhao, B.; Qi, L.; Yang, T. Simulation and Analysis of the Energy Consumption for Public Buildings in Different Climate Regions of China. Procedia Eng. 2017, 205, 2940–2947. [Google Scholar] [CrossRef]
- Yoon, Y.S.; Yoon, J.H.; Choi, W.K.; Kwon, Y.C. A Fundamental Study on the Optimal Window Applications According to the Window Ratio and SHGC in Office Buildings. J. Korean Inst. Archit. Sustain. Environ. Build. Syst. 2012, 6, 38–45. [Google Scholar]


 | Model Setting | |
| Building type | Office | |
| Hight | 15th floor | |
| Floor height | 4 m | |
| Floor space | 400 m2 | |
| Window-wall ratio | 40% | |
| 50% | ||
| 60% | ||
| 70% | ||
| Parameter | Value | ||
|---|---|---|---|
| Site | Seoul, Republic of Korea | ||
| Dimension | Floor area | 400 m2 | |
| Height | 60 m | ||
| Construction | Wall | Thickness | 300 m |
| R-value | 2.847 m2K/W | ||
| U-value | 0.351 W/m2K | ||
| Slab | Thickness | 200 m | |
| R-value | 3.893 m2K/W | ||
| U-value | 0.257 W/m2K | ||
| Roof | Thickness | 330 m | |
| R-value | 2.886 m2K/W | ||
| U-value | 0.346 W/m2K | ||
| Indoor condition | Temperature | Heating | 22 °C |
| Cooling | 24 °C | ||
| Occupancy density | 0.111 people/m2 | ||
| Metabolic factor | 0.90 | ||
| Power density | 11.77 W/m2 | ||
| Lighting | 5.0 W/m2–100 lux | ||
| Ventilation fresh air | 10.0 ℓ/s·person | ||
| HVAC | Fan Coil Unit (4-pipe), Air cooled | ||
| Operation schedule | Weekdays | 7:00~19:00 | |
| Weekends | Off | ||
| Weather data | Seoul TMY2 | ||
| Month | Dry Bulb Temp. (°C) | Dew Point Temp. (°C) | Relative Humidity (%) | Global Radiation (kWh/m2) | Wind Speed (m/s) |
|---|---|---|---|---|---|
| Jan. | −1.29 | −7.84 | 60.40 | 37.20 | 2.35 |
| Feb. | 0.98 | −7.24 | 54.38 | 44.14 | 2.55 |
| Mar. | 6.87 | −1.76 | 55.42 | 60.83 | 2.77 |
| Apr. | 13.04 | 2.84 | 53.49 | 74.67 | 2.72 |
| May. | 18.27 | 10.23 | 62.36 | 81.97 | 2.76 |
| Jun. | 22.82 | 15.67 | 66.09 | 85.90 | 2.07 |
| Jul. | 25.29 | 20.30 | 74.33 | 67.50 | 2.19 |
| Aug. | 24.84 | 19.97 | 74.31 | 65.91 | 1.56 |
| Sep. | 20.92 | 14.80 | 69.32 | 52.41 | 1.83 |
| Oct. | 15.48 | 7.74 | 61.31 | 49.69 | 1.78 |
| Nov. | 6.20 | −0.68 | 62.61 | 33.85 | 2.14 |
| Dec. | 0.99 | −5.65 | 59.81 | 39.54 | 2.25 |
| Case | Window Performance | ||
|---|---|---|---|
| U-Value (W/m2K) | VLT (%) | SHGC (%) | |
| A-1 | 0.5 | 0.5 | 0.5 |
| 1.0 | |||
| 1.5 | |||
| 2.0 | |||
| 2.5 | |||
| 3.0 | |||
| A-2 | 2.0 | 0.2 | 0.5 |
| 0.3 | |||
| 0.4 | |||
| 0.5 | |||
| 0.6 | |||
| 0.7 | |||
| 0.8 | |||
| A-3 | 2.0 | 0.5 | 0.2 |
| 0.3 | |||
| 0.4 | |||
| 0.5 | |||
| 0.6 | |||
| 0.7 | |||
| 0.8 | |||
| Case | Window Performance | ||
|---|---|---|---|
| U-Value (W/m2K) | VLT (%) | SHGC (%) | |
| B-1 | 0.5 | 0.5 | 0.2 |
| 0.3 | |||
| 0.4 | |||
| 0.5 | |||
| 0.6 | |||
| 0.7 | |||
| 0.8 | |||
| B-2 | 1.0 | ||
| B-3 | 1.5 | ||
| B-4 | 2.0 | ||
| B-5 | 2.5 | ||
| B-6 | 3.0 | 0.2 | |
| 0.3 | |||
| 0.4 | |||
| 0.5 | |||
| 0.6 | |||
| 0.7 | |||
| 0.8 | |||
| U-Value | VLT | SHGC | |
|---|---|---|---|
| Cooling load change rate (%) | −20.31 | −3.12 | +76.37 |
| Heating load change rate (%) | +165.19 | +4.34 | −55.28 |
| Heating and cooling load change rate (%) | +3.31 | −1.28 | +22.13 |
| WWR | SHGC (%) | U-Value = 0.5 | U-Value = 1.0 | U-Value = 1.5 | U-Value = 2.0 | U-Value = 2.5 | U-Value = 3.0 |
|---|---|---|---|---|---|---|---|
| 40% | SHGC = 0.2 | 113.3 | 116.0 | 118.9 | 121.9 | 124.8 | 127.8 |
| SHGC = 0.3 | 117.2 | 119.2 | 121.5 | 124.1 | 126.6 | 129.1 | |
| SHGC = 0.4 | 121.9 | 123.1 | 124.8 | 126.9 | 128.9 | 131.1 | |
| SHGC = 0.5 | 127.4 | 127.7 | 128.8 | 130.3 | 131.8 | 133.5 | |
| SHGC = 0.6 | 133.5 | 132.9 | 133.2 | 134.0 | 135.1 | 136.4 | |
| SHGC = 0.7 | 140.0 | 138.6 | 138.1 | 138.3 | 138.9 | 139.7 | |
| SHGC = 0.8 | 147.2 | 144.8 | 143.5 | 143.0 | 143.1 | 143.5 | |
| 50% | SHGC = 0.2 | 115.1 | 118.2 | 121.7 | 125.4 | 129.0 | 132.6 |
| SHGC = 0.3 | 120.6 | 122.4 | 125.1 | 128.1 | 131.0 | 134.1 | |
| SHGC = 0.4 | 127.2 | 127.8 | 129.4 | 131.7 | 133.9 | 136.4 | |
| SHGC = 0.5 | 135.0 | 134.2 | 134.7 | 136.0 | 137.6 | 139.5 | |
| SHGC = 0.6 | 143.6 | 141.4 | 140.7 | 141.0 | 141.8 | 143.1 | |
| SHGC = 0.7 | 153.2 | 149.3 | 147.4 | 146.7 | 146.8 | 147.5 | |
| SHGC = 0.8 | 163.6 | 158.0 | 154.8 | 153.1 | 152.4 | 152.3 | |
| 60% | SHGC = 0.2 | 117.1 | 120.4 | 124.4 | 128.7 | 133.0 | 137.4 |
| SHGC = 0.3 | 124.2 | 125.8 | 128.5 | 131.9 | 135.3 | 138.9 | |
| SHGC = 0.4 | 132.9 | 132.6 | 133.9 | 136.2 | 138.7 | 141.5 | |
| SHGC = 0.5 | 143.3 | 140.9 | 140.7 | 141.7 | 143.2 | 145.2 | |
| SHGC = 0.6 | 154.9 | 150.2 | 148.2 | 147.8 | 148.3 | 149.5 | |
| SHGC = 0.7 | 167.6 | 160.6 | 156.8 | 155.0 | 154.5 | 154.8 | |
| SHGC = 0.8 | 181.4 | 172.0 | 166.3 | 163.0 | 161.3 | 160.7 | |
| 70% | SHGC = 0.2 | 119.3 | 122.7 | 127.1 | 132.0 | 137.0 | 142.0 |
| SHGC = 0.3 | 128.2 | 129.2 | 131.9 | 135.6 | 139.4 | 143.6 | |
| SHGC = 0.4 | 139.2 | 137.6 | 138.5 | 140.7 | 143.4 | 146.5 | |
| SHGC = 0.5 | 152.7 | 148.0 | 146.6 | 147.2 | 148.6 | 150.7 | |
| SHGC = 0.6 | 167.4 | 159.6 | 155.9 | 154.5 | 154.6 | 155.7 | |
| SHGC = 0.7 | 183.5 | 172.6 | 166.5 | 163.2 | 161.9 | 161.8 | |
| SHGC = 0.8 | 200.6 | 186.7 | 178.1 | 173.0 | 170.1 | 168.8 |
| WWR 40% | WWR 50% | WWR 60% | WWR 70% | |||||||||
|---|---|---|---|---|---|---|---|---|---|---|---|---|
| U-Value | VLT | SHGC | U-Value | VLT | SHGC | U-Value | VLT | SHGC | U-Value | VLT | SHGC | |
| Change rate (%) | 4.80 | 2.12 | 17.37 | 3.31 | 1.28 | 22.13 | 1.27 | 0.92 | 26.66 | 1.31 | 0.71 | 31.03 |
| Influence (%) | 19.76 | 8.74 | 71.50 | 12.40 | 4.78 | 82.83 | 4.41 | 3.18 | 92.41 | 3.95 | 2.14 | 93.91 |
Disclaimer/Publisher’s Note: The statements, opinions and data contained in all publications are solely those of the individual author(s) and contributor(s) and not of MDPI and/or the editor(s). MDPI and/or the editor(s) disclaim responsibility for any injury to people or property resulting from any ideas, methods, instructions or products referred to in the content. |
© 2023 by the authors. Licensee MDPI, Basel, Switzerland. This article is an open access article distributed under the terms and conditions of the Creative Commons Attribution (CC BY) license (https://creativecommons.org/licenses/by/4.0/).
Share and Cite
Lee, Y.-J.; Kim, S.-H.; Ryu, J.-H.; Lee, K.-H. Optimizing Window Glass Design for Energy Efficiency in South Korean Office Buildings: A Hierarchical Analysis Using Energy Simulation. Buildings 2023, 13, 2850. https://doi.org/10.3390/buildings13112850
Lee Y-J, Kim S-H, Ryu J-H, Lee K-H. Optimizing Window Glass Design for Energy Efficiency in South Korean Office Buildings: A Hierarchical Analysis Using Energy Simulation. Buildings. 2023; 13(11):2850. https://doi.org/10.3390/buildings13112850
Chicago/Turabian StyleLee, Yu-Jeong, Sang-Hee Kim, Ji-Hye Ryu, and Kweon-Hyoung Lee. 2023. "Optimizing Window Glass Design for Energy Efficiency in South Korean Office Buildings: A Hierarchical Analysis Using Energy Simulation" Buildings 13, no. 11: 2850. https://doi.org/10.3390/buildings13112850
APA StyleLee, Y.-J., Kim, S.-H., Ryu, J.-H., & Lee, K.-H. (2023). Optimizing Window Glass Design for Energy Efficiency in South Korean Office Buildings: A Hierarchical Analysis Using Energy Simulation. Buildings, 13(11), 2850. https://doi.org/10.3390/buildings13112850


