

Investigation on the Through-Thickness Temperature Gradient and Thermal Stress of Concrete Box Girders


Abstract
:1. Introduction
2. Measurement, Results and Analysis of the Temperature Distribution in the Box Girder
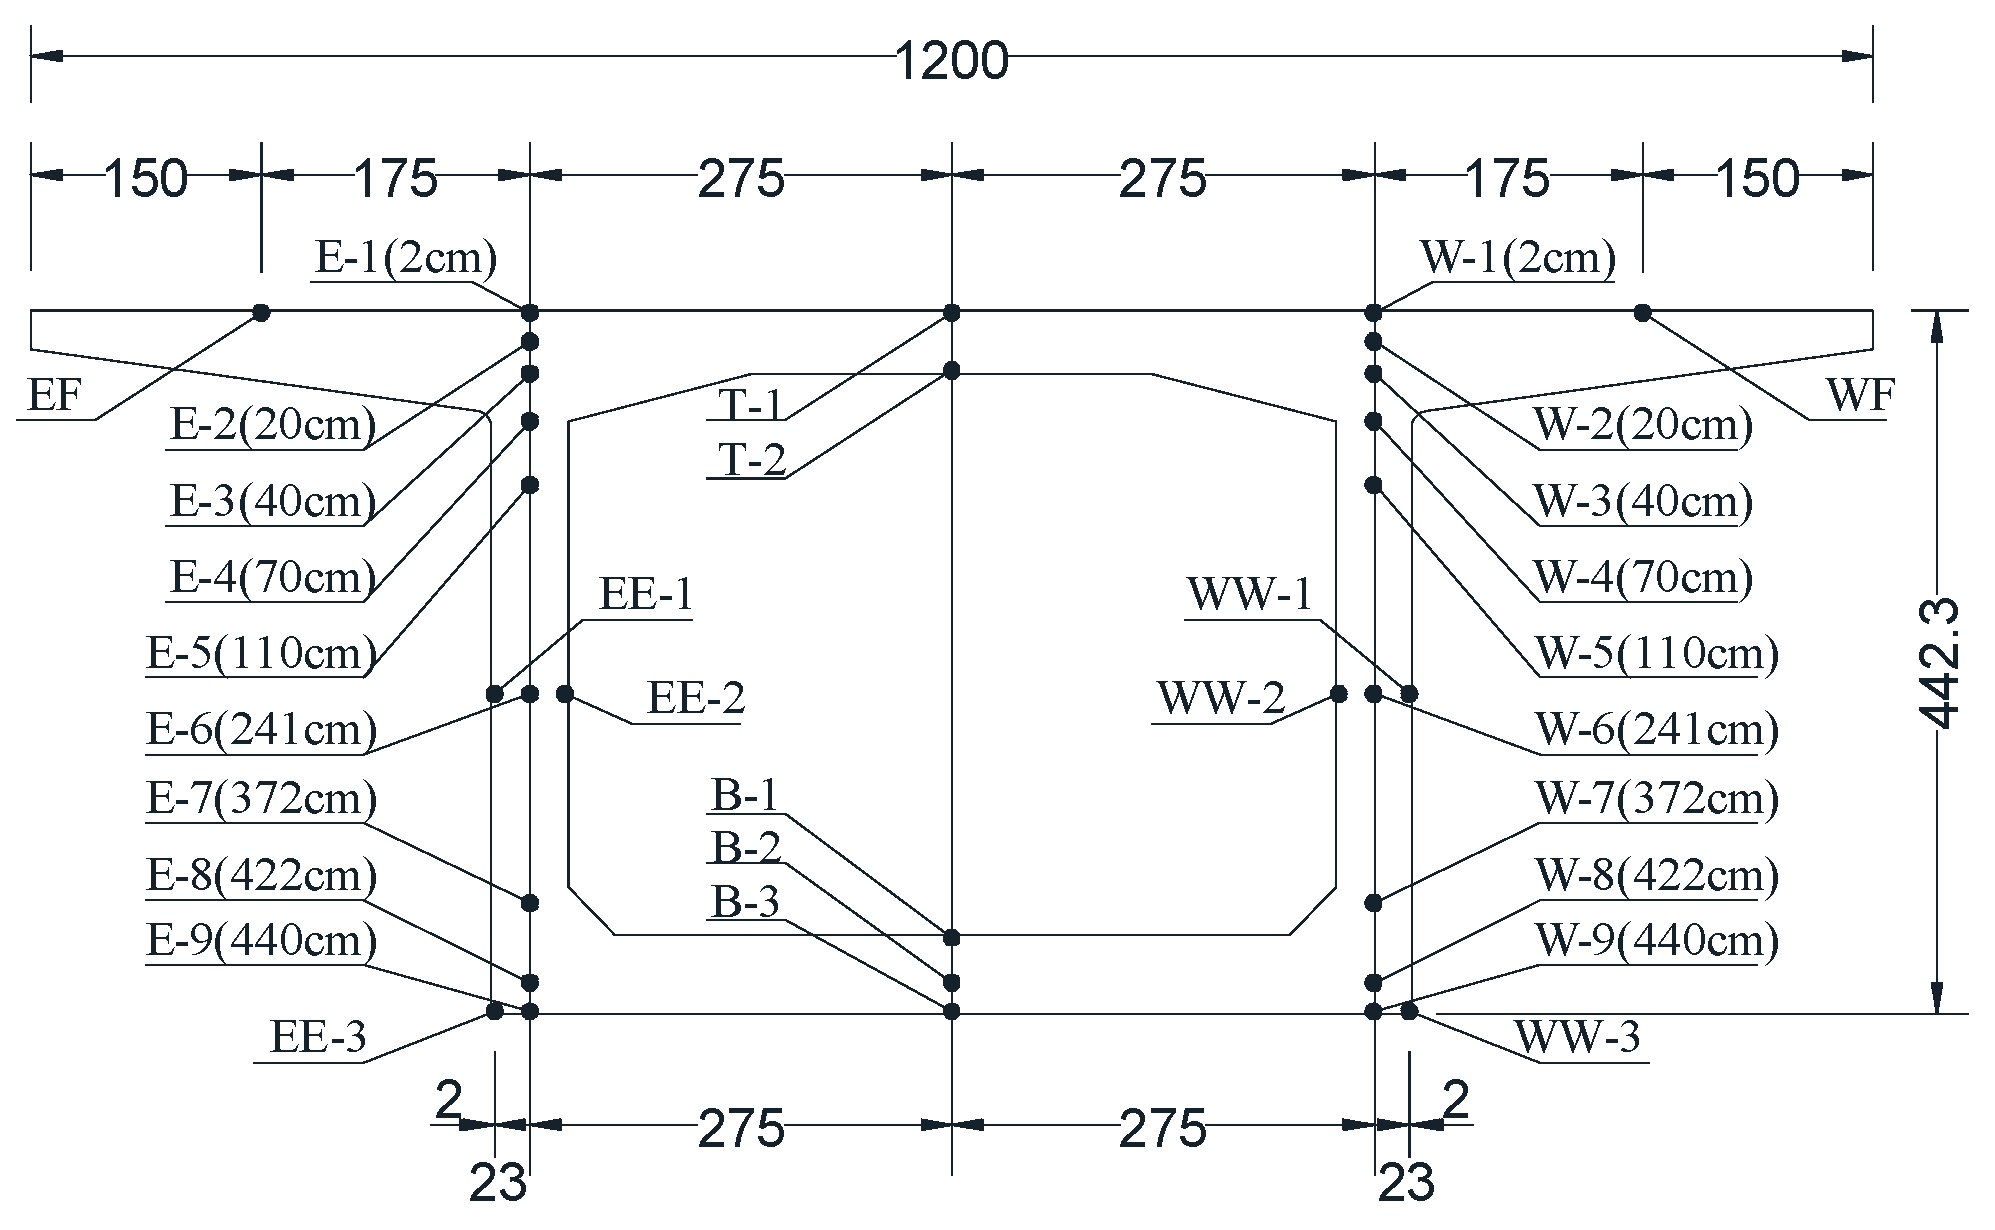
2.1. The Layout of the Bridge, Information and Measuring Points
2.2. Measurements, Results and Evaluation of the Thermal Field
- (1)
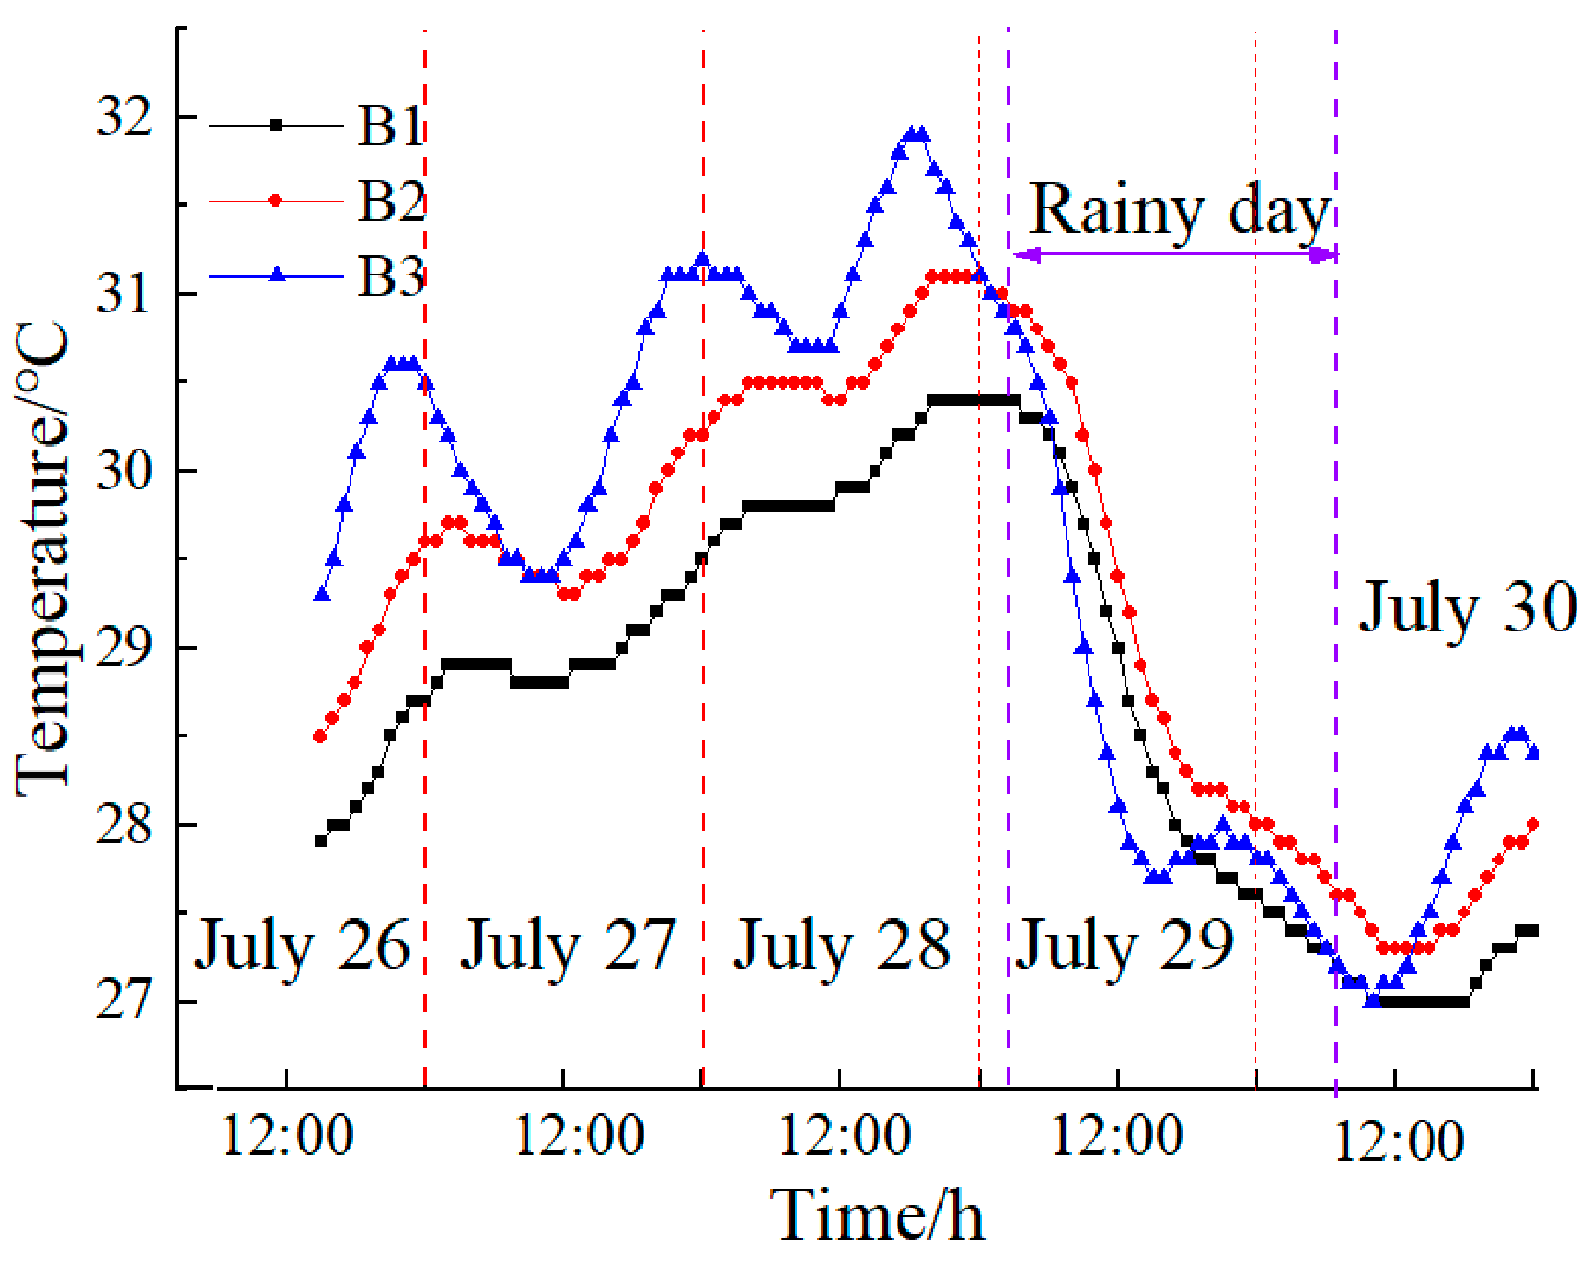
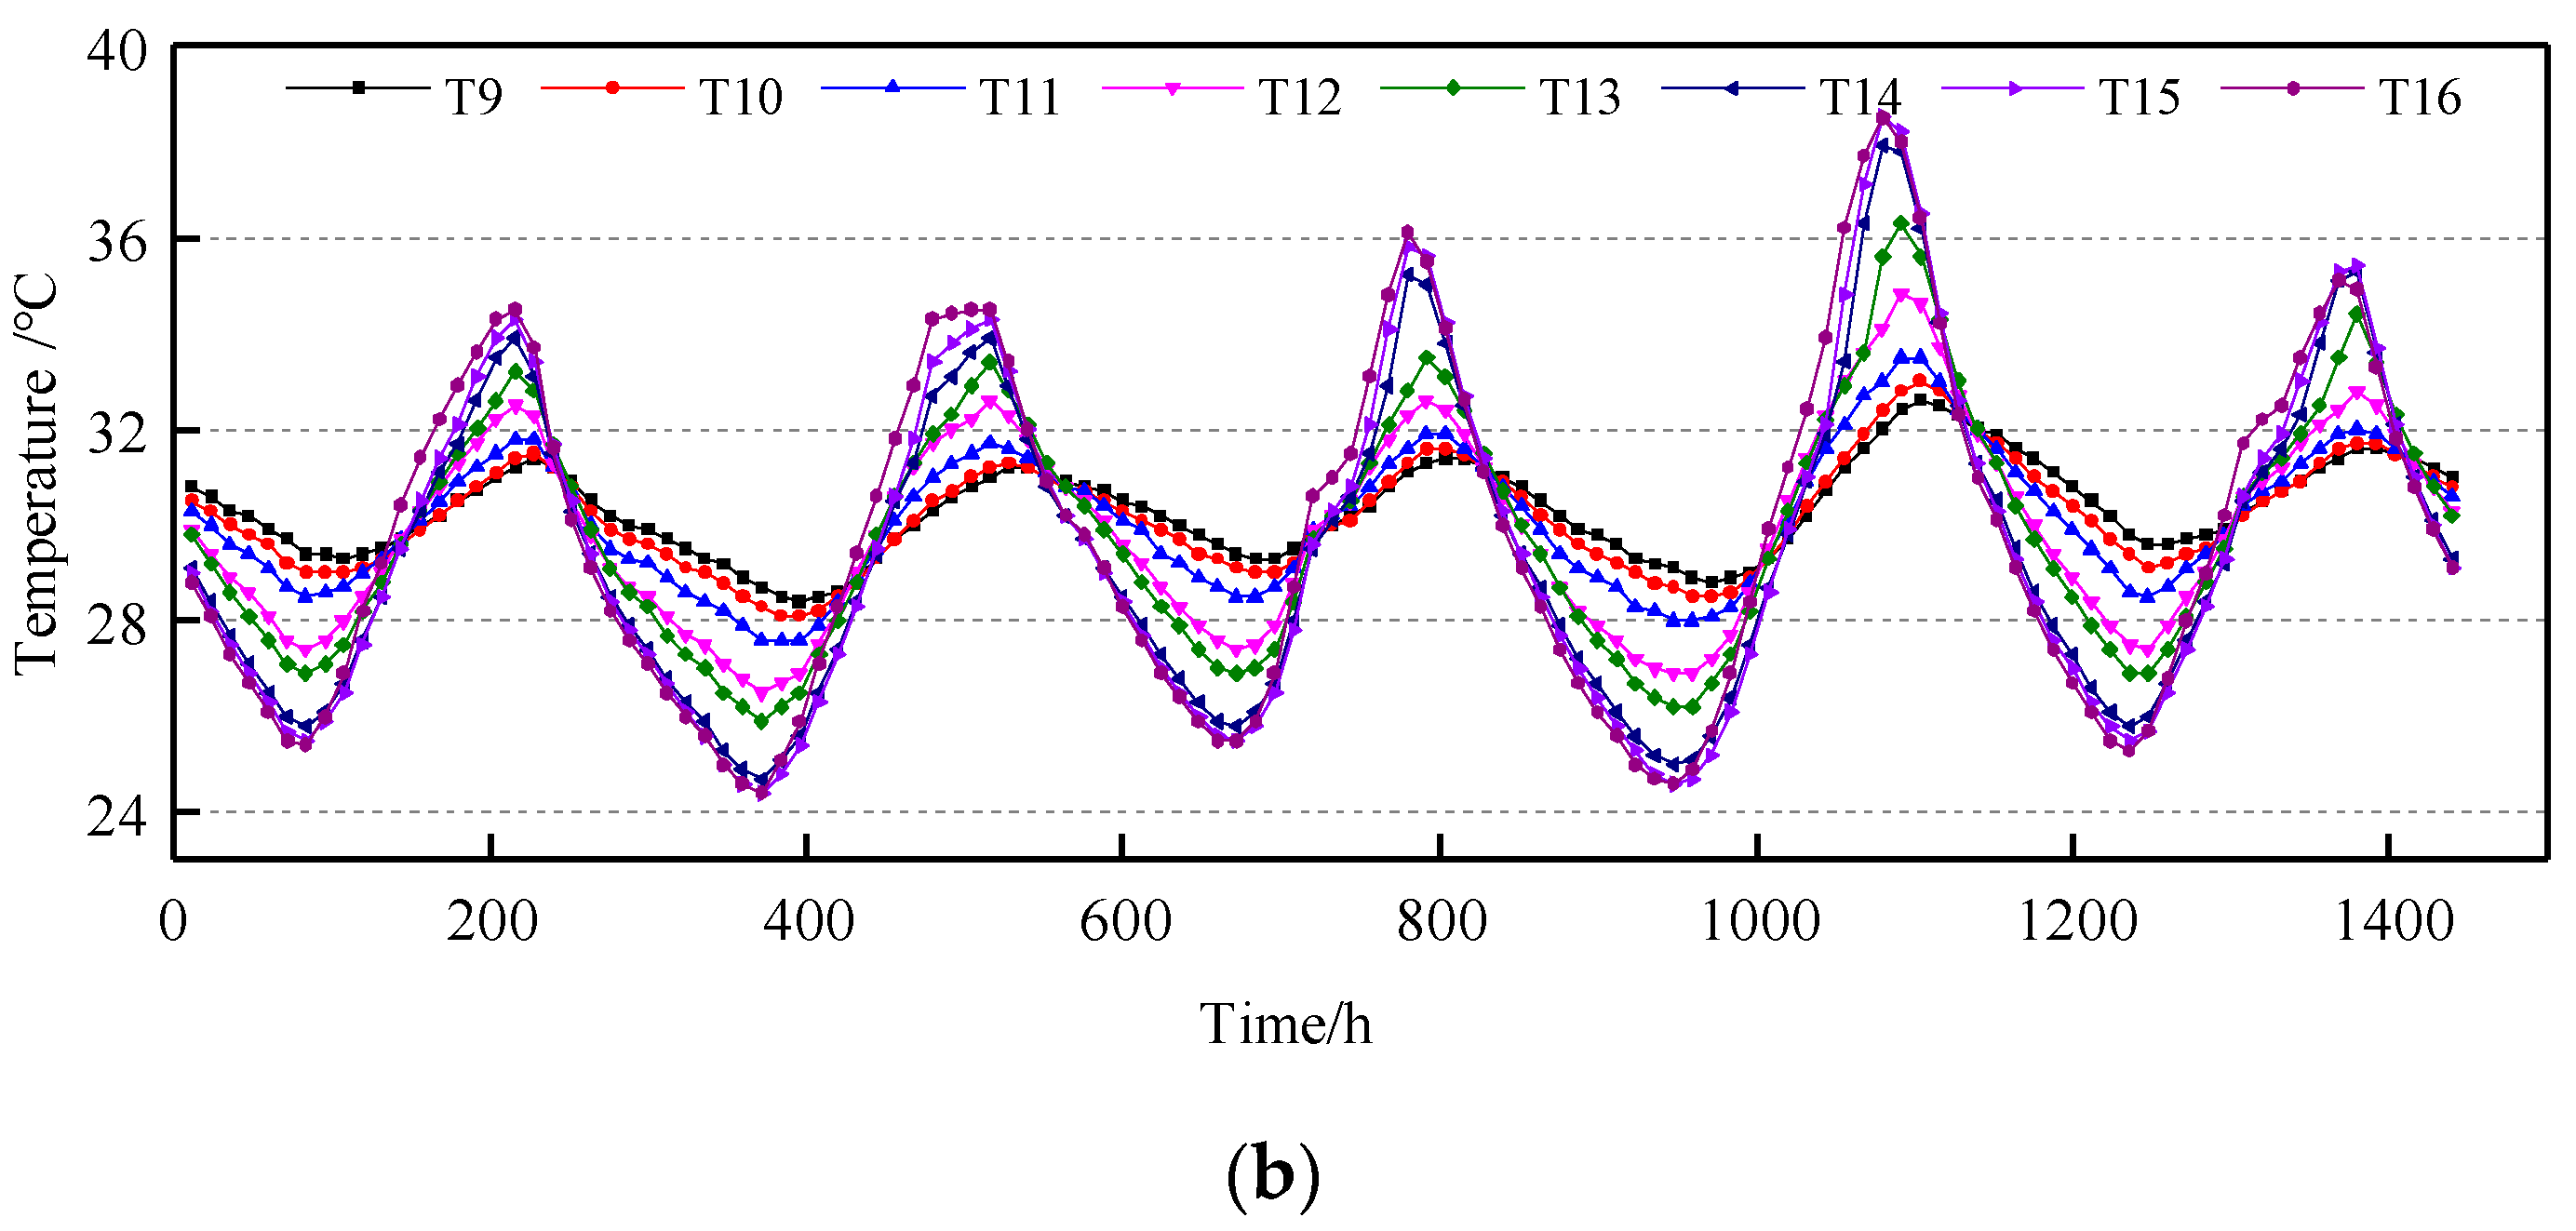
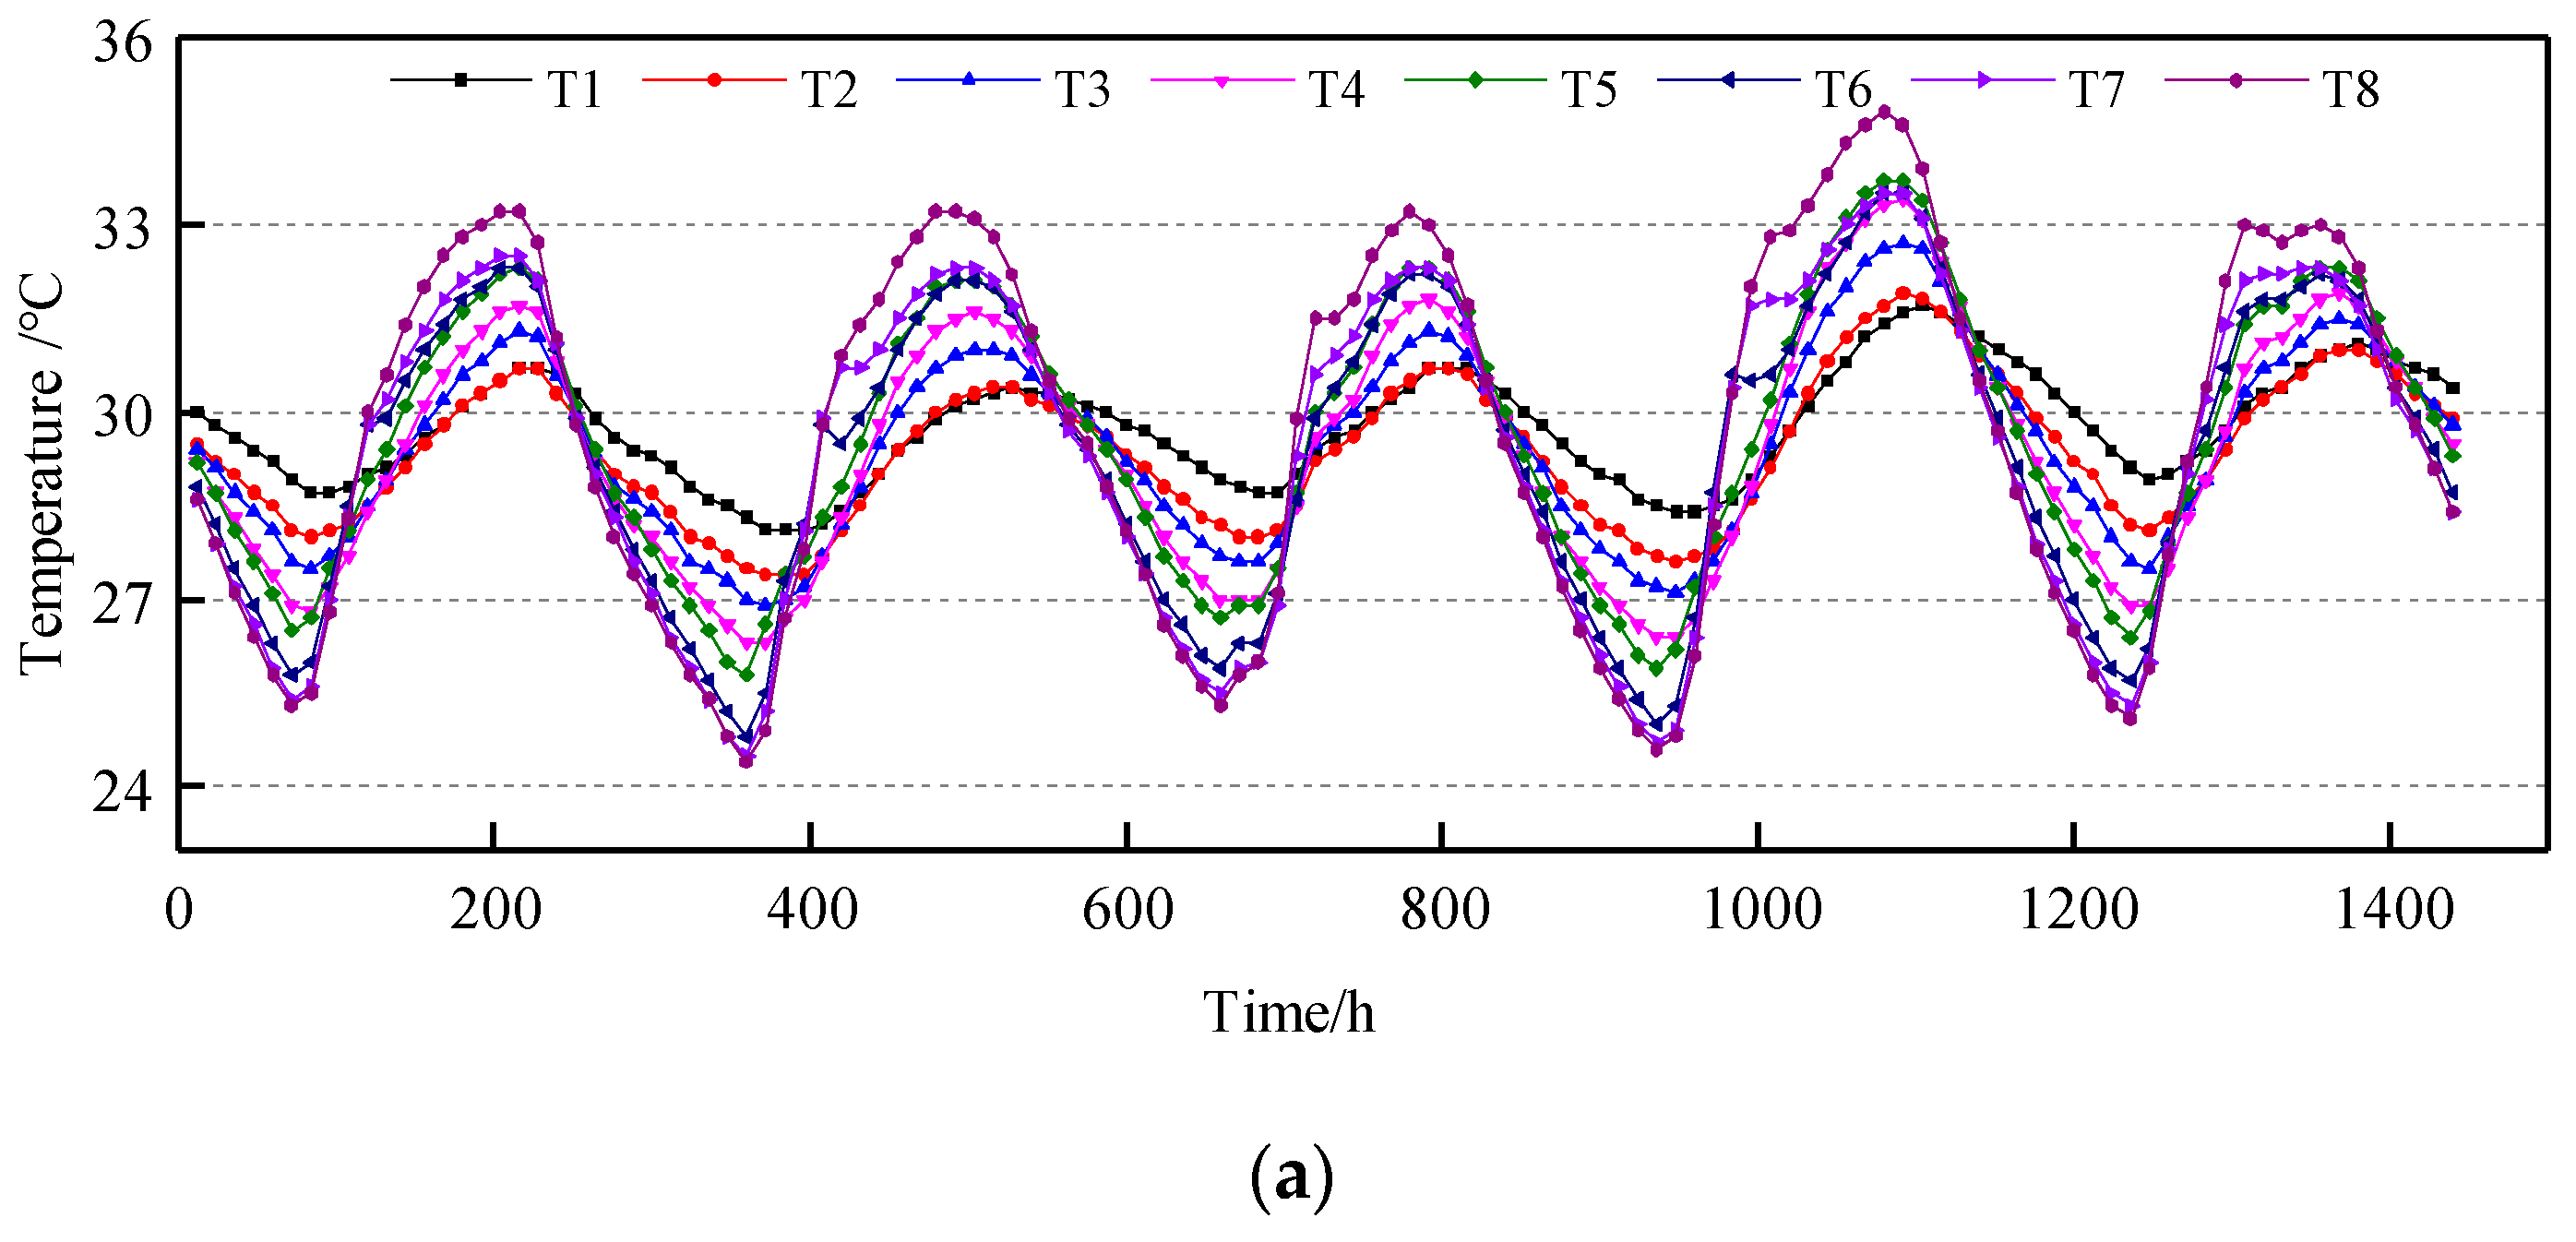
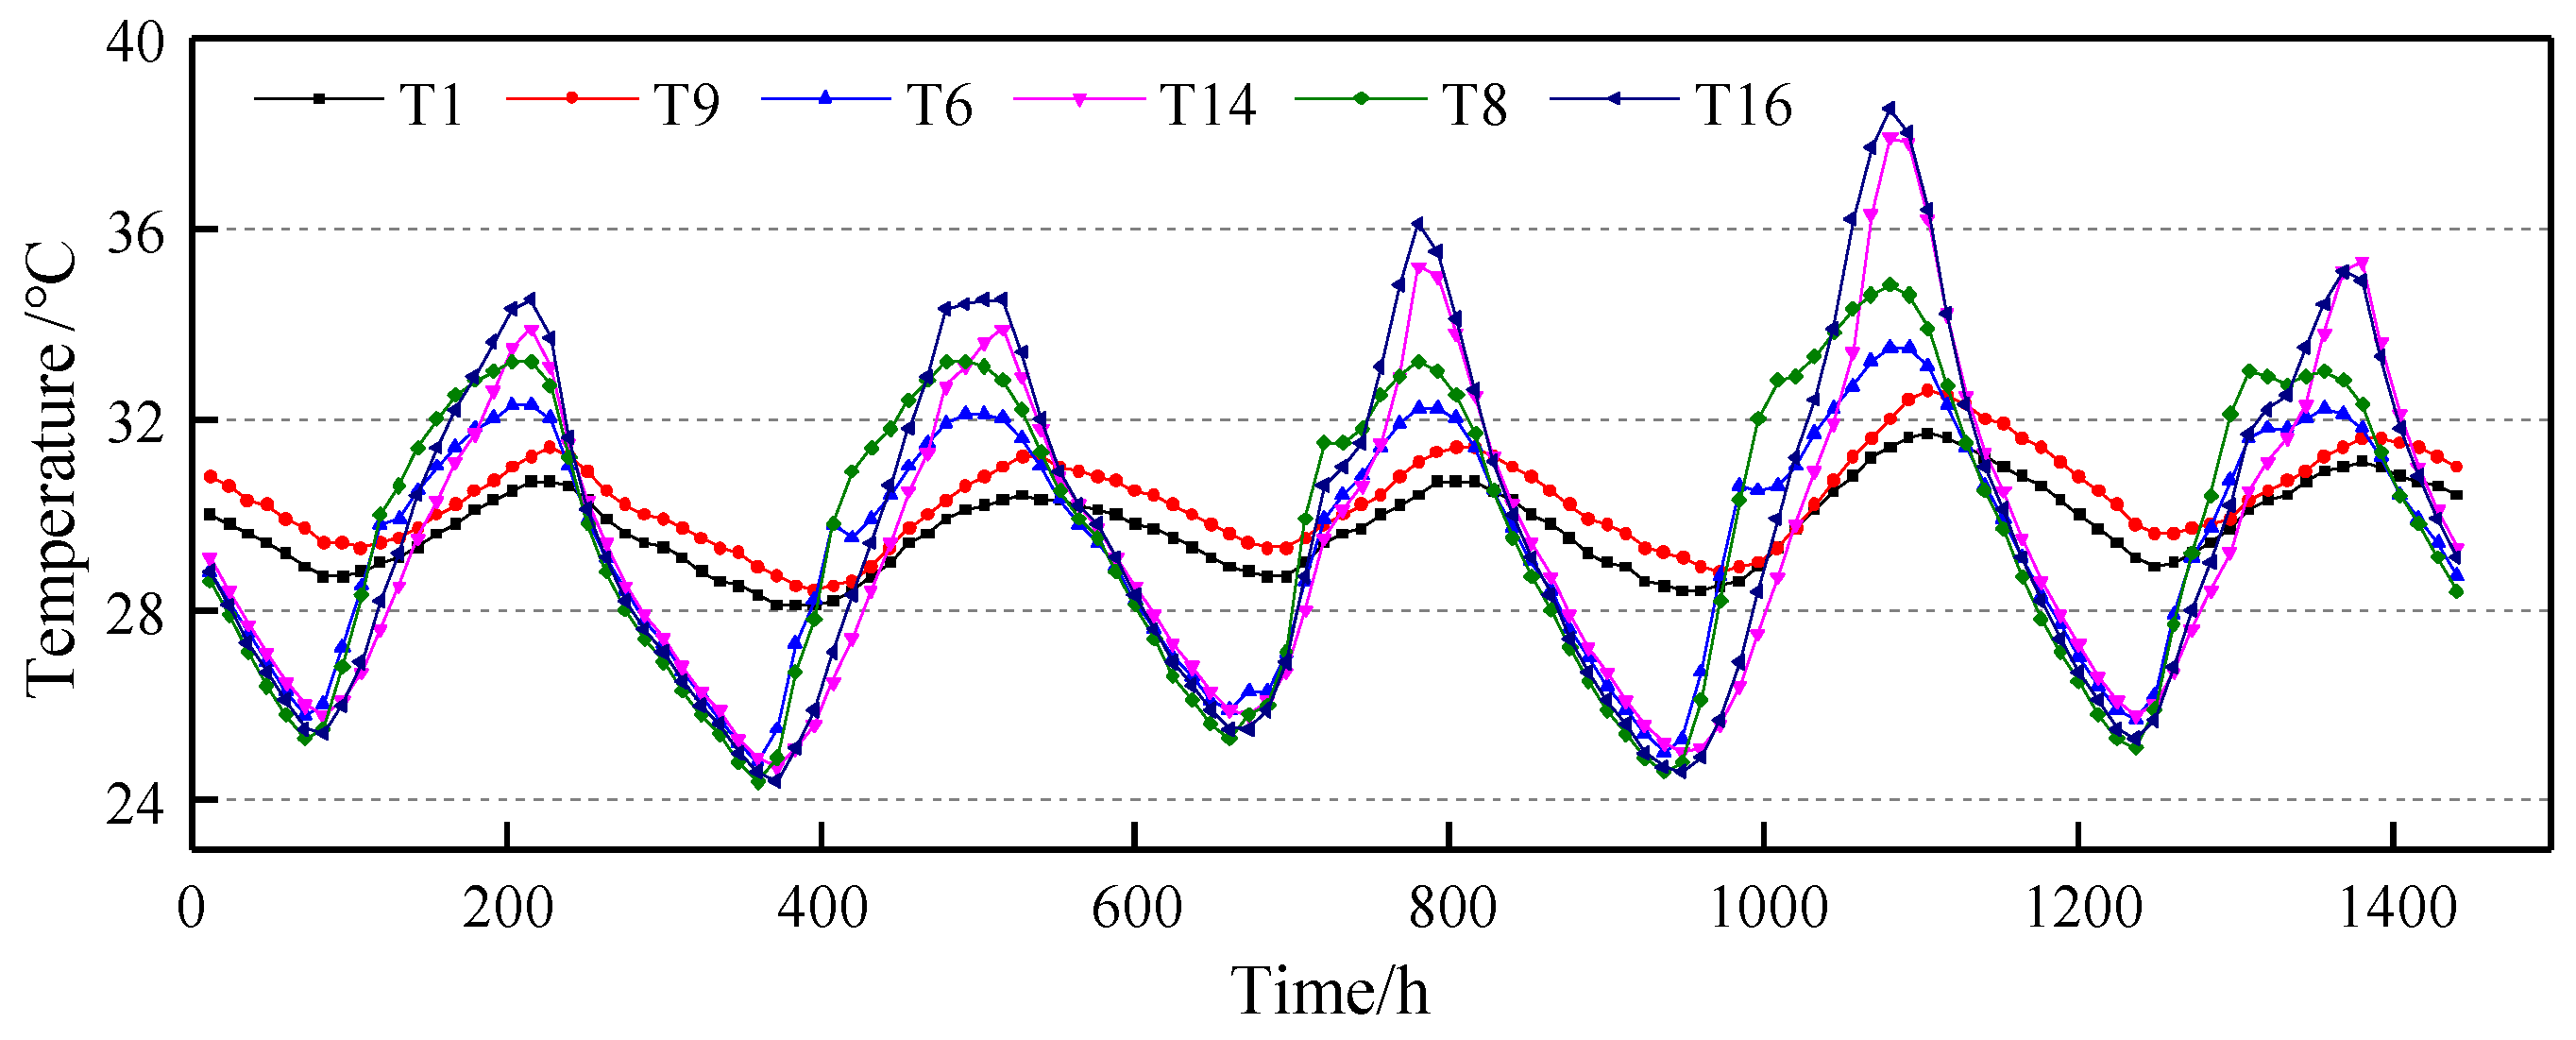
- When comparing the temperature change amplitude at each measurement point, it is evident that the temperature change amplitude at the bottom plate surpasses that at the top plate, and the closer it gets to the bottom plate, the more pronounced the temperature change amplitude.
- (2)
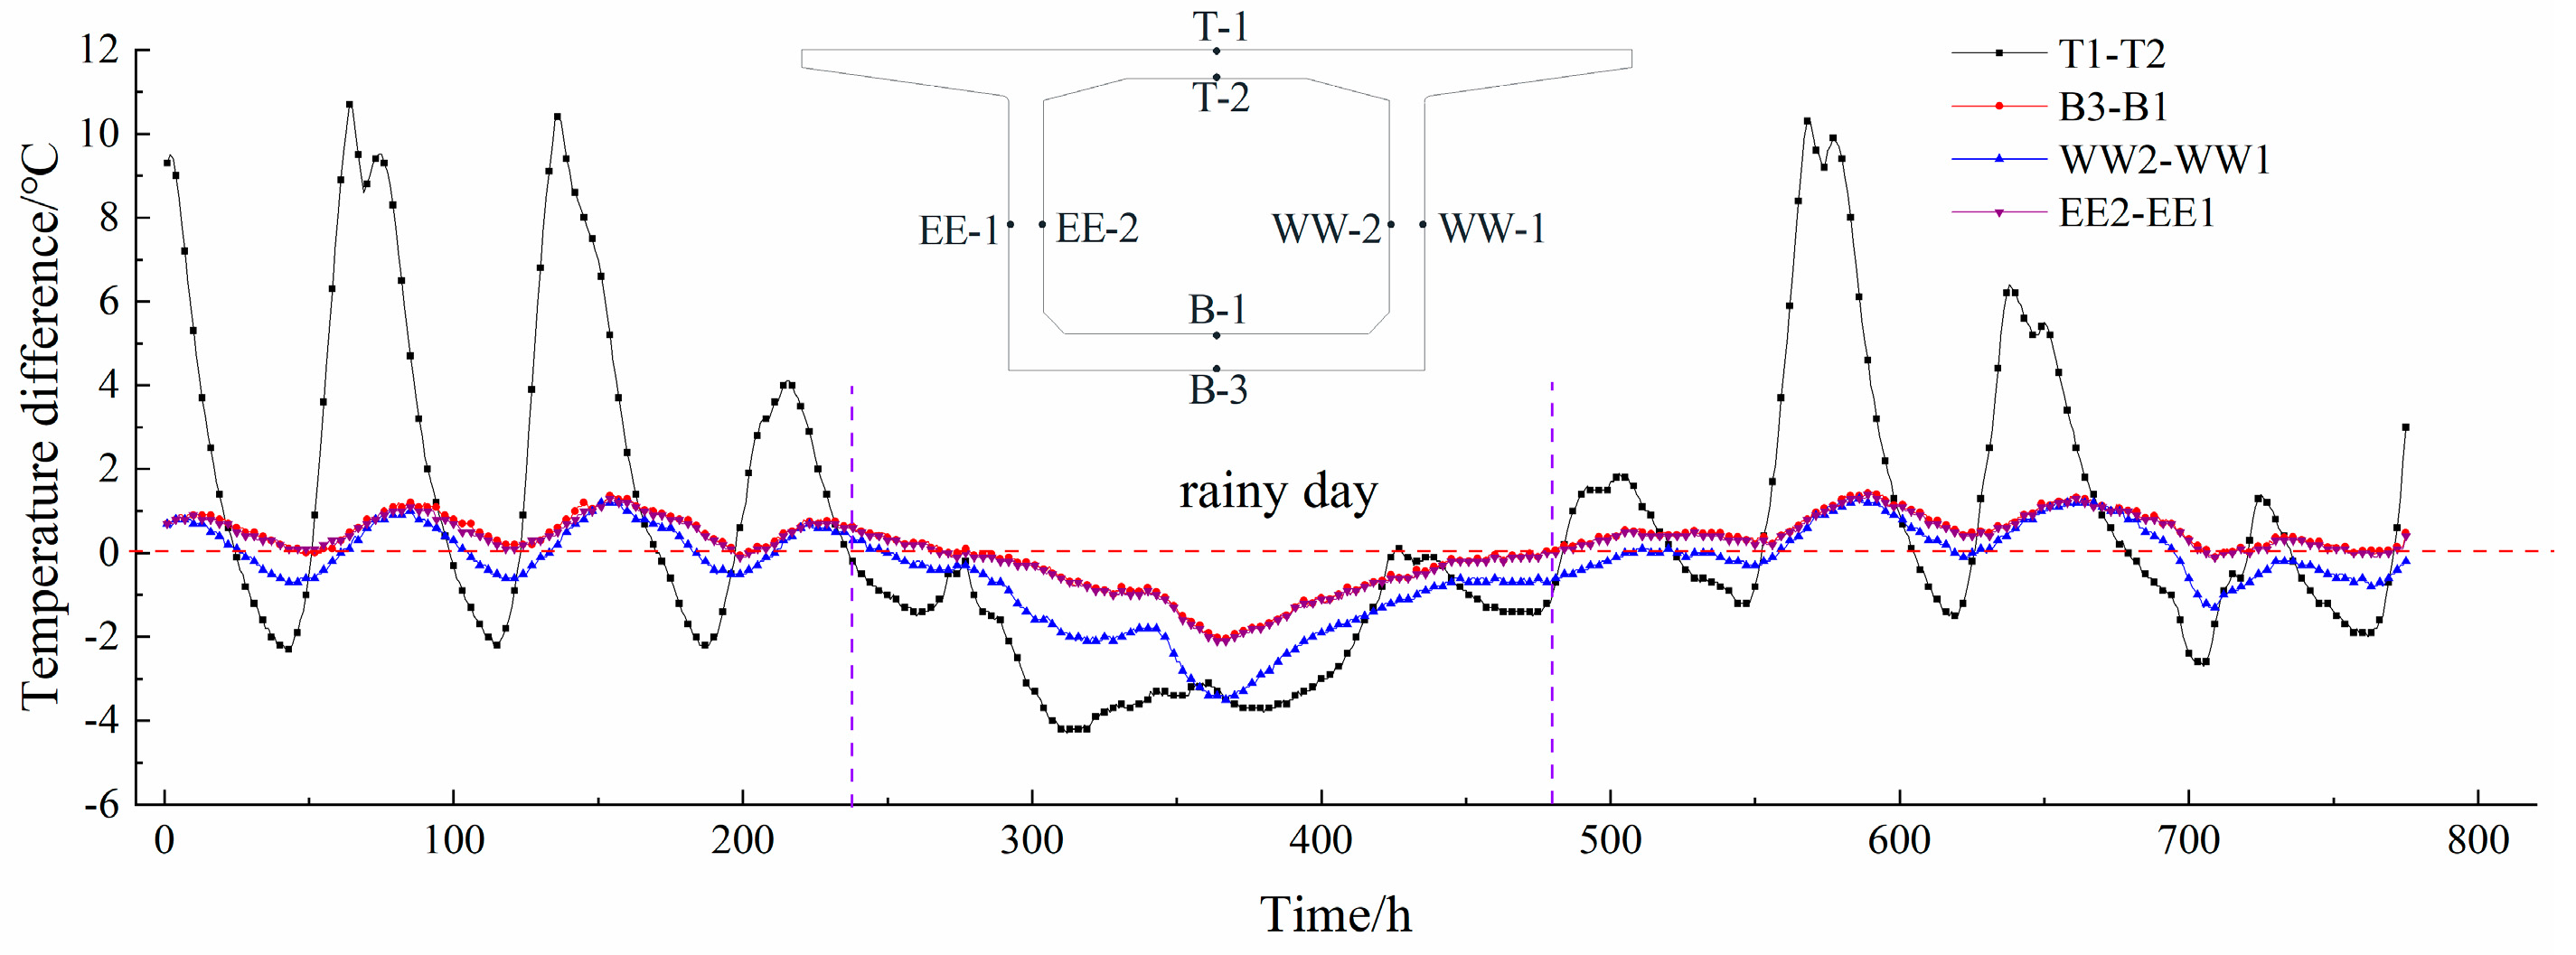
- The contrast between the vertical negative temperature gradient and the upward vertical temperature gradient is more pronounced, with the vertical positive temperature gradient in the background bridge manifesting during the night and morning when the box girder’s temperature was lower, while vertical negative temperature gradient manifesting during the day when the railroad box girder’s temperature was higher. Incorporation of ballast and concrete bridge panels atop the railway box girder deck, in conjunction with the presence of 3-m-high side guardrails flanking the box girder bridge, effectively shields the bridge deck from diurnal solar exposure. This arrangement directs sunlight exclusively onto either side of the box girder belly plate. In the realm of structural engineering, it is imperative to acknowledge that the relative proximity of the web plate to the bottom plate significantly influences the duration of direct solar irradiation, giving rise to a vertical adverse temperature gradient, wherein the temperature recorded at measurement locations on the upper plate is less than that observed on the lower plate. The ballast and concrete bridge panels’ covering effect causes the top plate to dissipate heat at a slower pace compared to the bottom plate and belly plate during the night. The top plate temperature is higher than the bottom plate temperature, resulting in a vertical positive temperature gradient.
- (3)
- In the realm of bridge engineering, it is observed that the temperature change in the lower plate manifests itself prior to the temperature variation in the upper plate. Moreover, the proximity of the lower plate to its designated position correlates with an earlier onset of temperature alteration. At 5:35 in the morning of the summer solstice, the sun ascends from the ground plane, radiating its rays directly onto the right web of the box girder, with a height of 4.8 m. Subsequently, the height of the direct solar radiation on the web gradually diminishes, and the closer it gets to the bottom plate, the more it is affected by it; the temperature of the bottom plate is lower than that of the top plate in the morning, indicating a thermal gradient. As time passes, the box girder’s cross-section temperature decline process causes solar radiation to lose its role in maintaining a higher temperature in the bottom plate position. The temperature of the bottom plate started to decrease as soon as possible.
- (1)
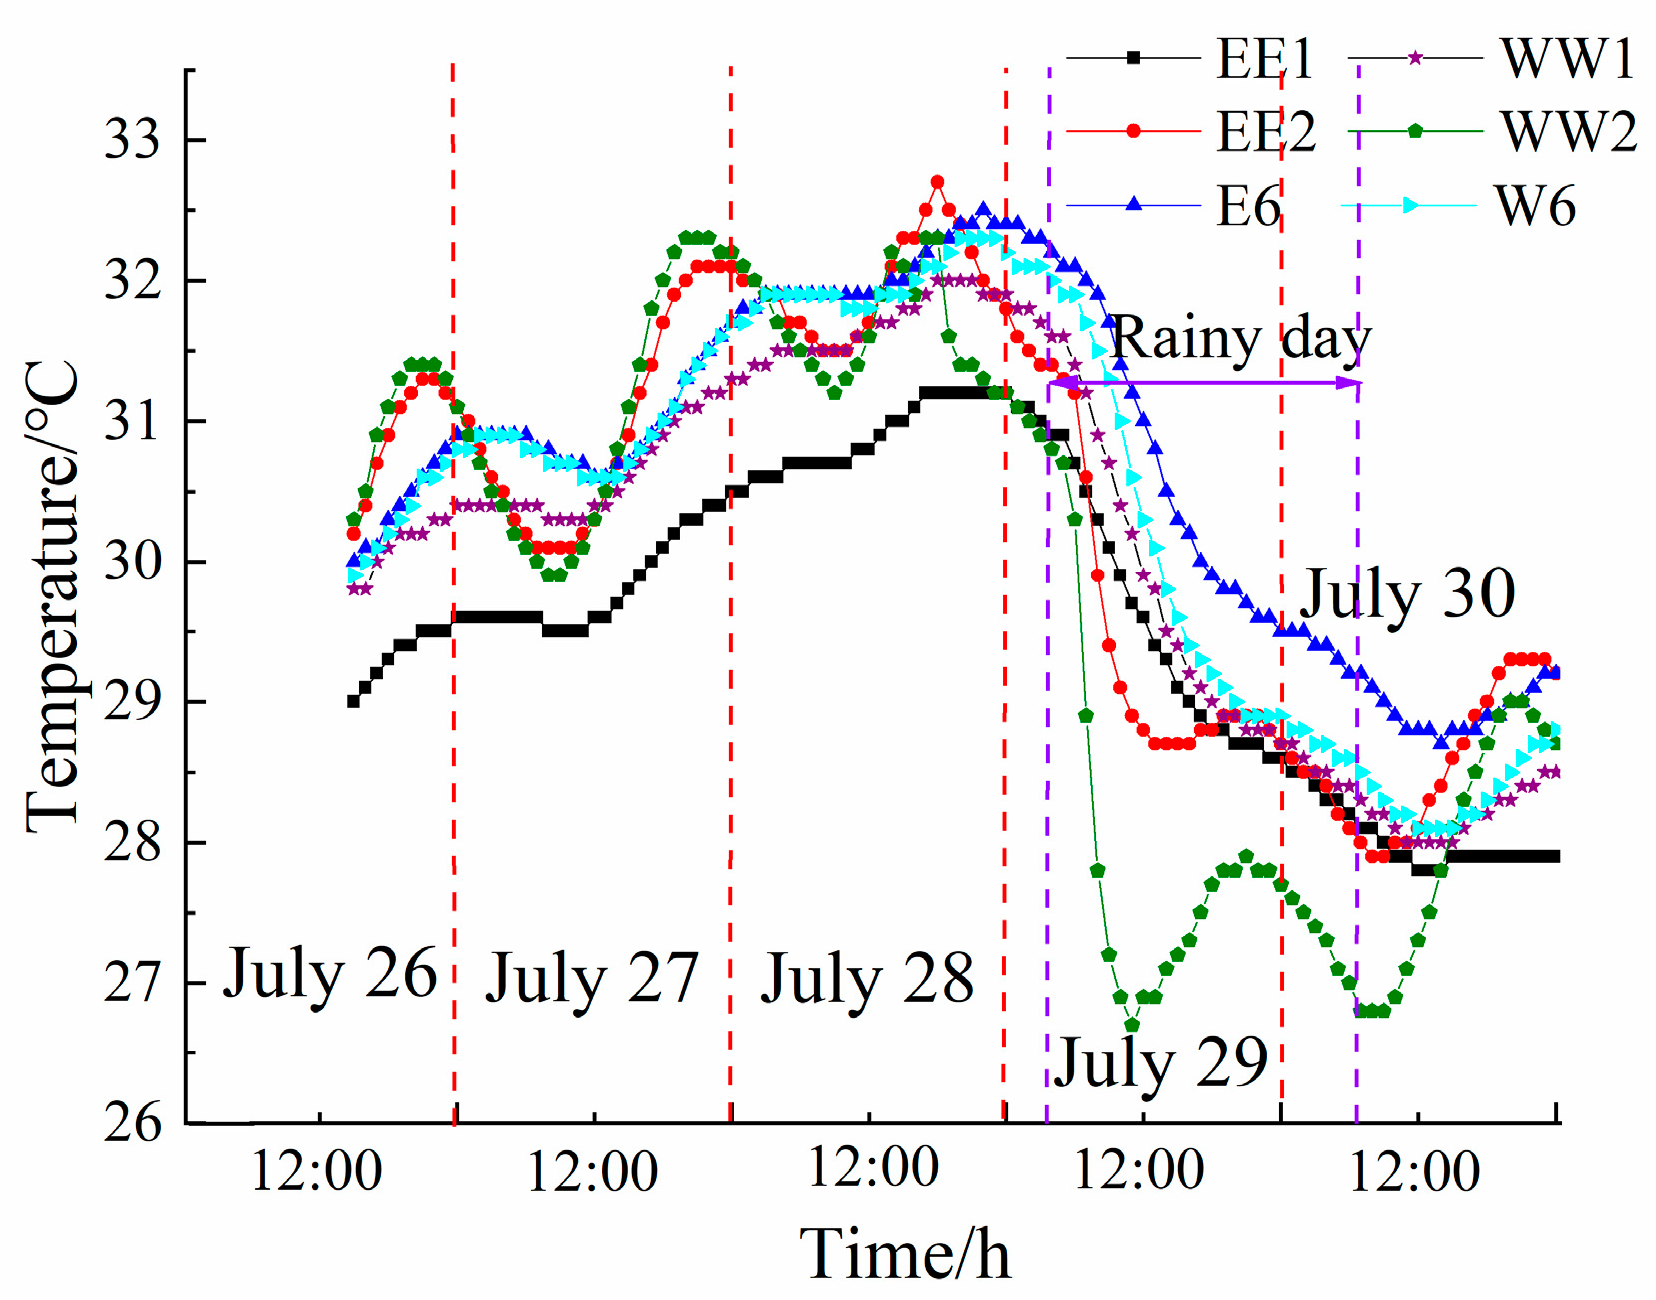
- The uppermost plate of the box girder shows minimal fluctuation in transverse temperature, while the lower plate showcases a more noticeable disparity in transverse temperature. In the initial and intermediate stages of the box girder temperature rise, there is a noticeable increase in transverse positive temperature, followed by a decrease in transverse negative temperature before and after the peak value.
- (2)
- The right side experiences an earlier temperature change compared to the left side at the identical transverse position.
- (3)
- The bottom plate will experience both vertical and lateral temperature effects simultaneously.
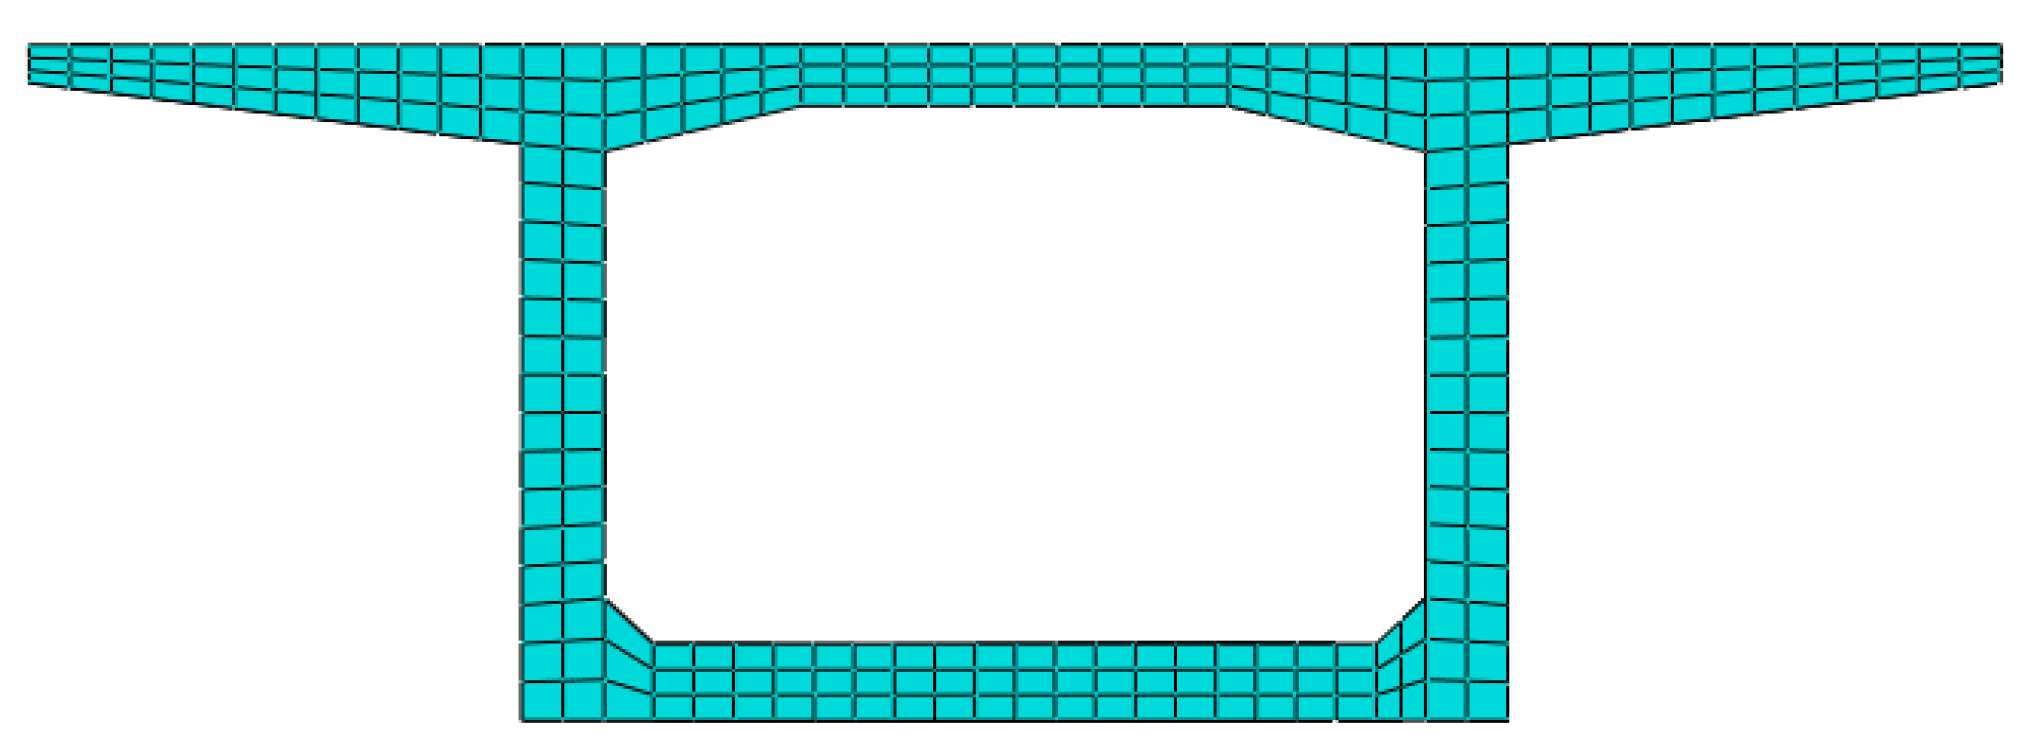
3. Simulation of the Temperature Field of the Concrete Box Girder Section
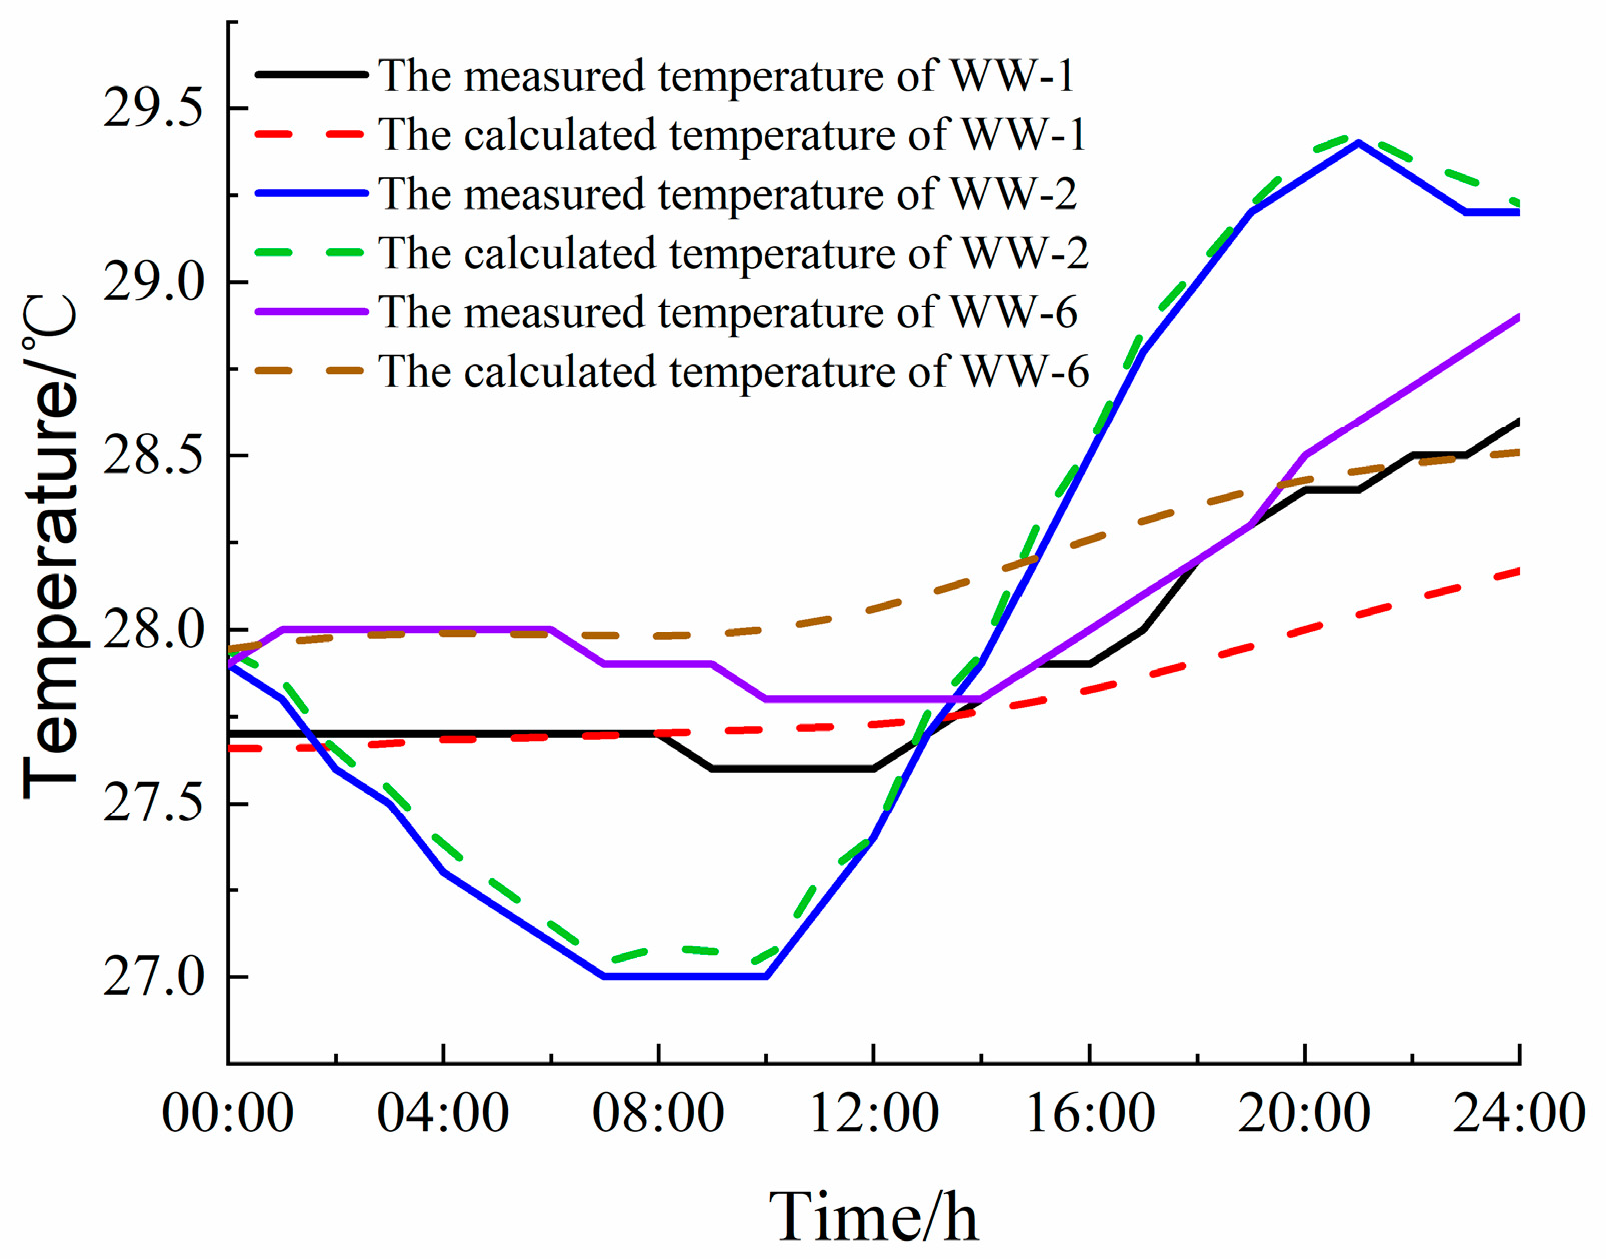
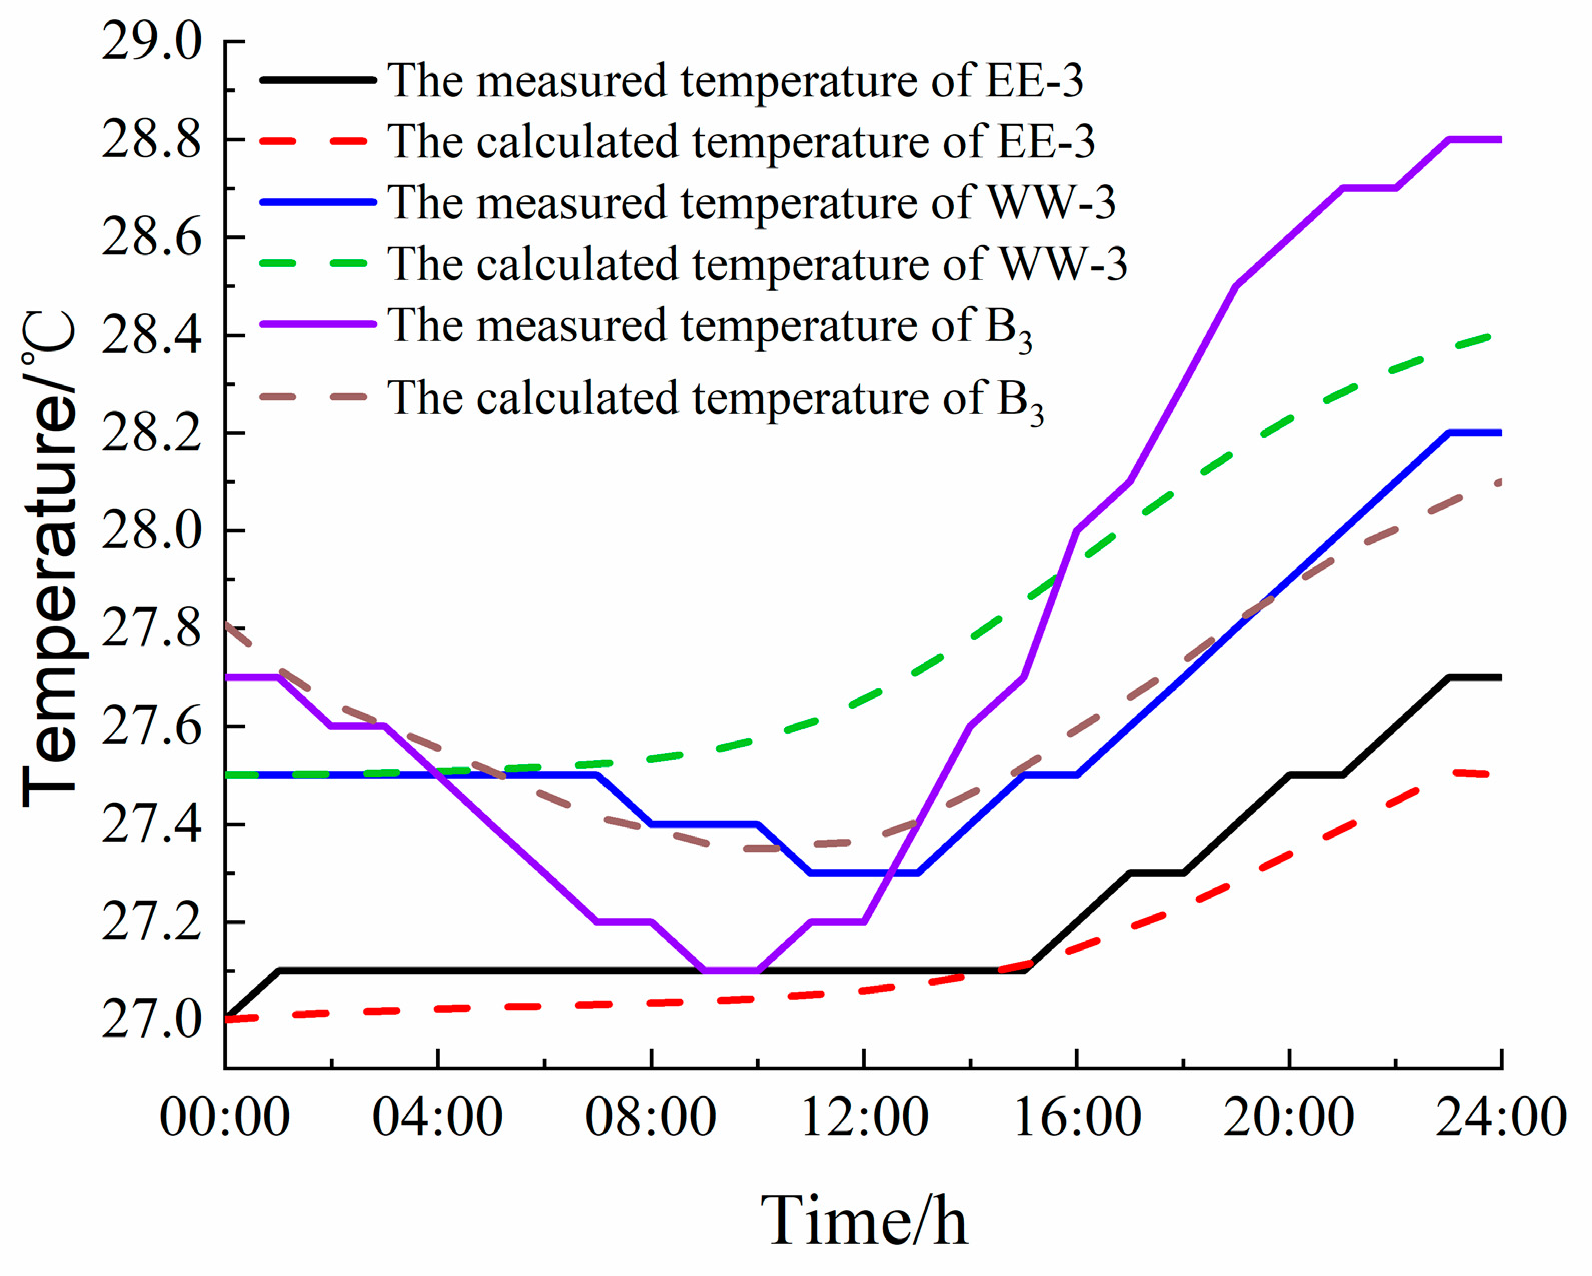
3.1. Temperature Field Boundary Conditions
3.2. Model Parameter Values and Finite Element Simulation
4. Analysis of Self-Stress and Section Temperature
4.1. Diurnal Temperature Stress Change in a Section
4.2. Stress Distributions on the Inner and Outer Surfaces of the Plate Thickness
4.3. Stress Distributions along the Thickness Direction of the Section Plate
5. Conclusions
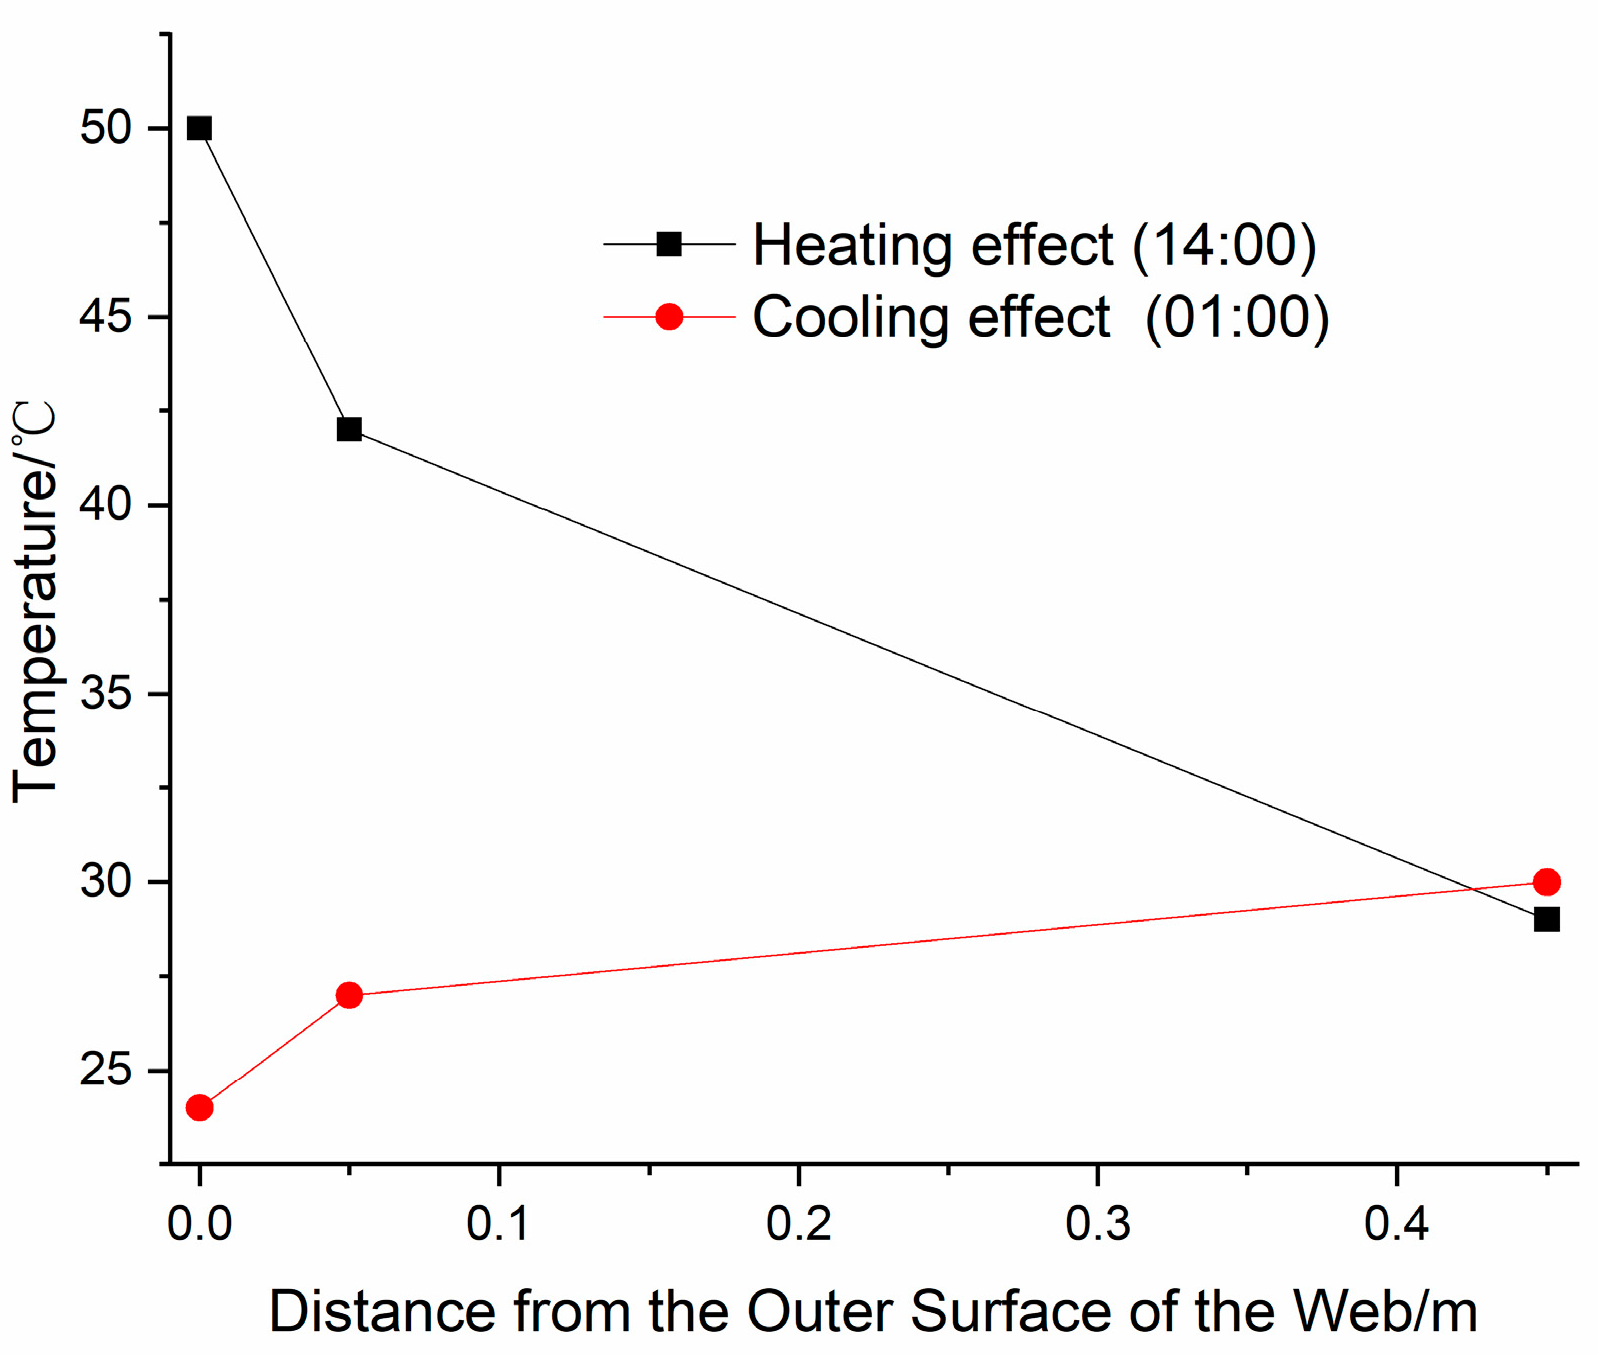
- (1)
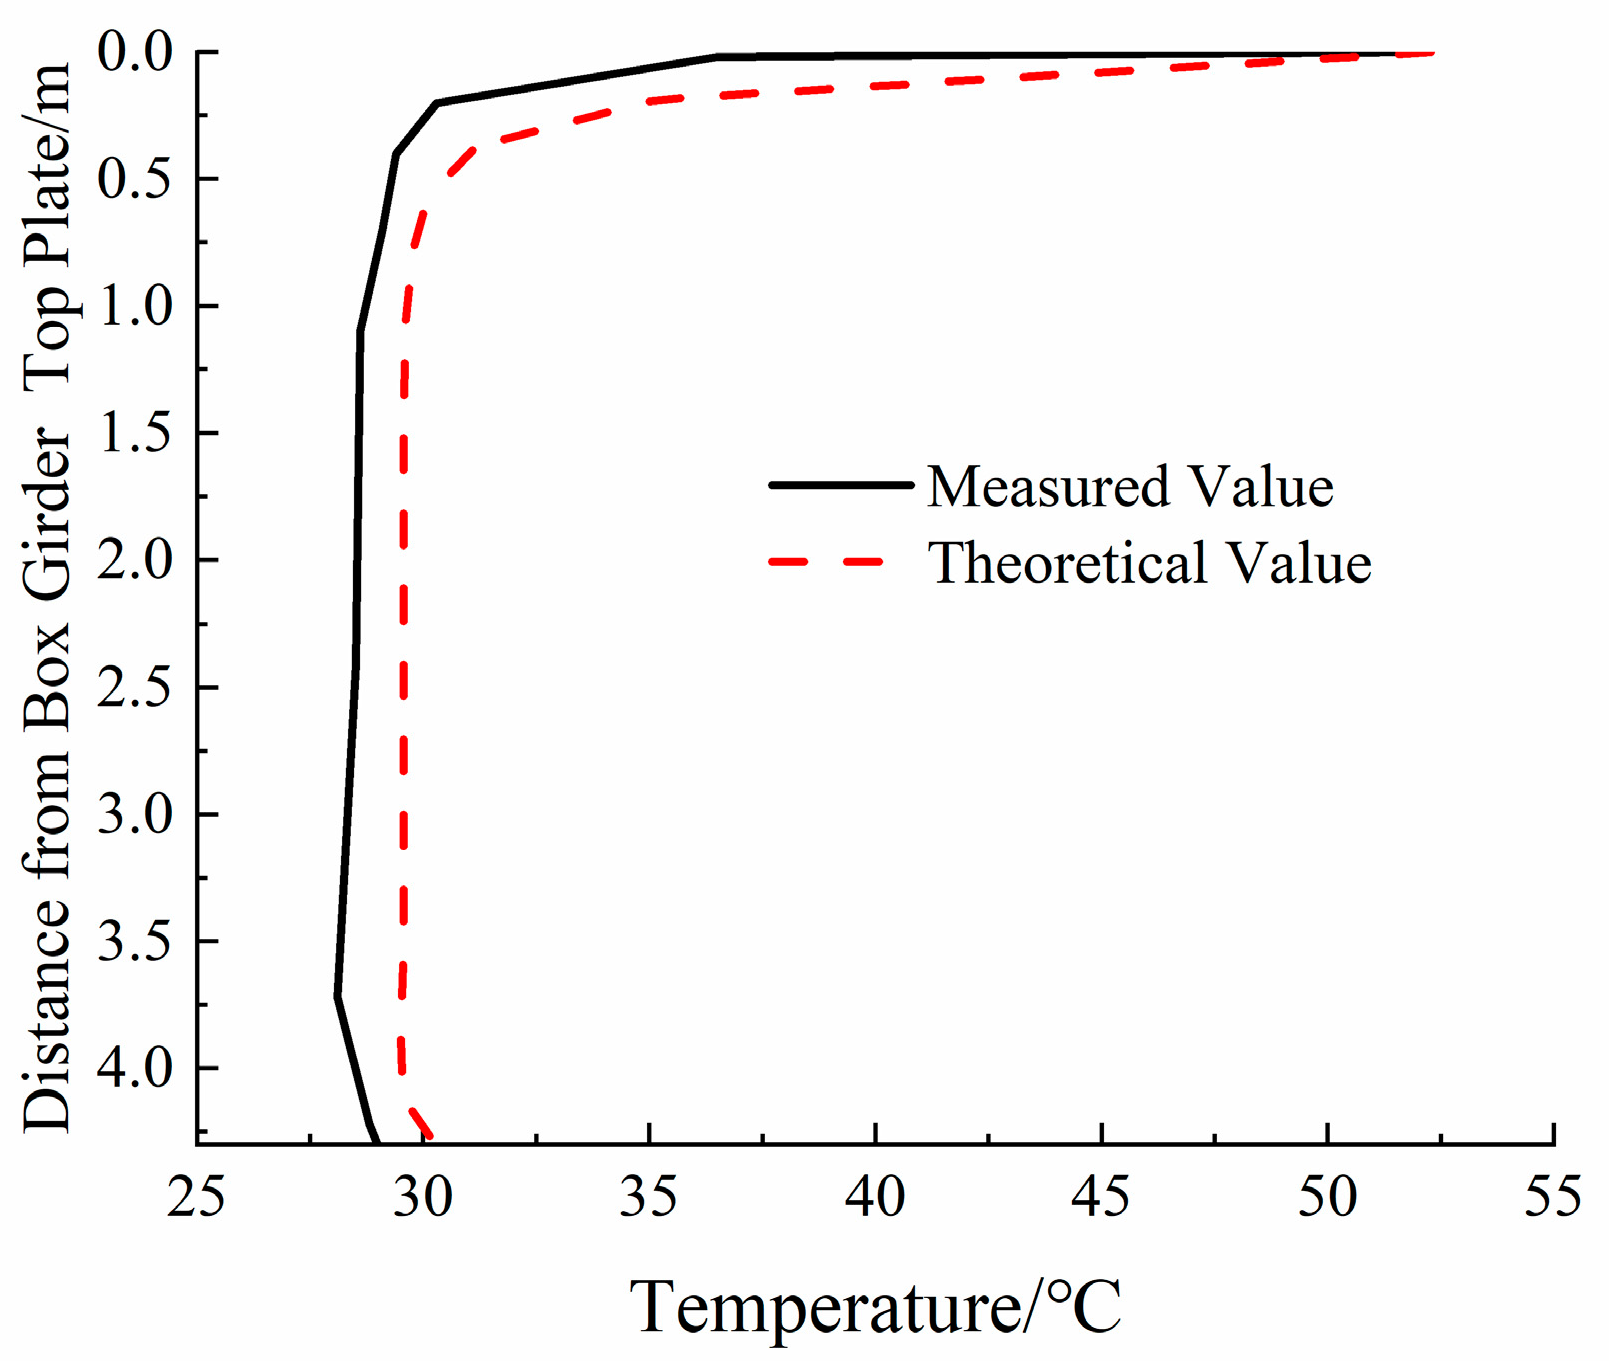
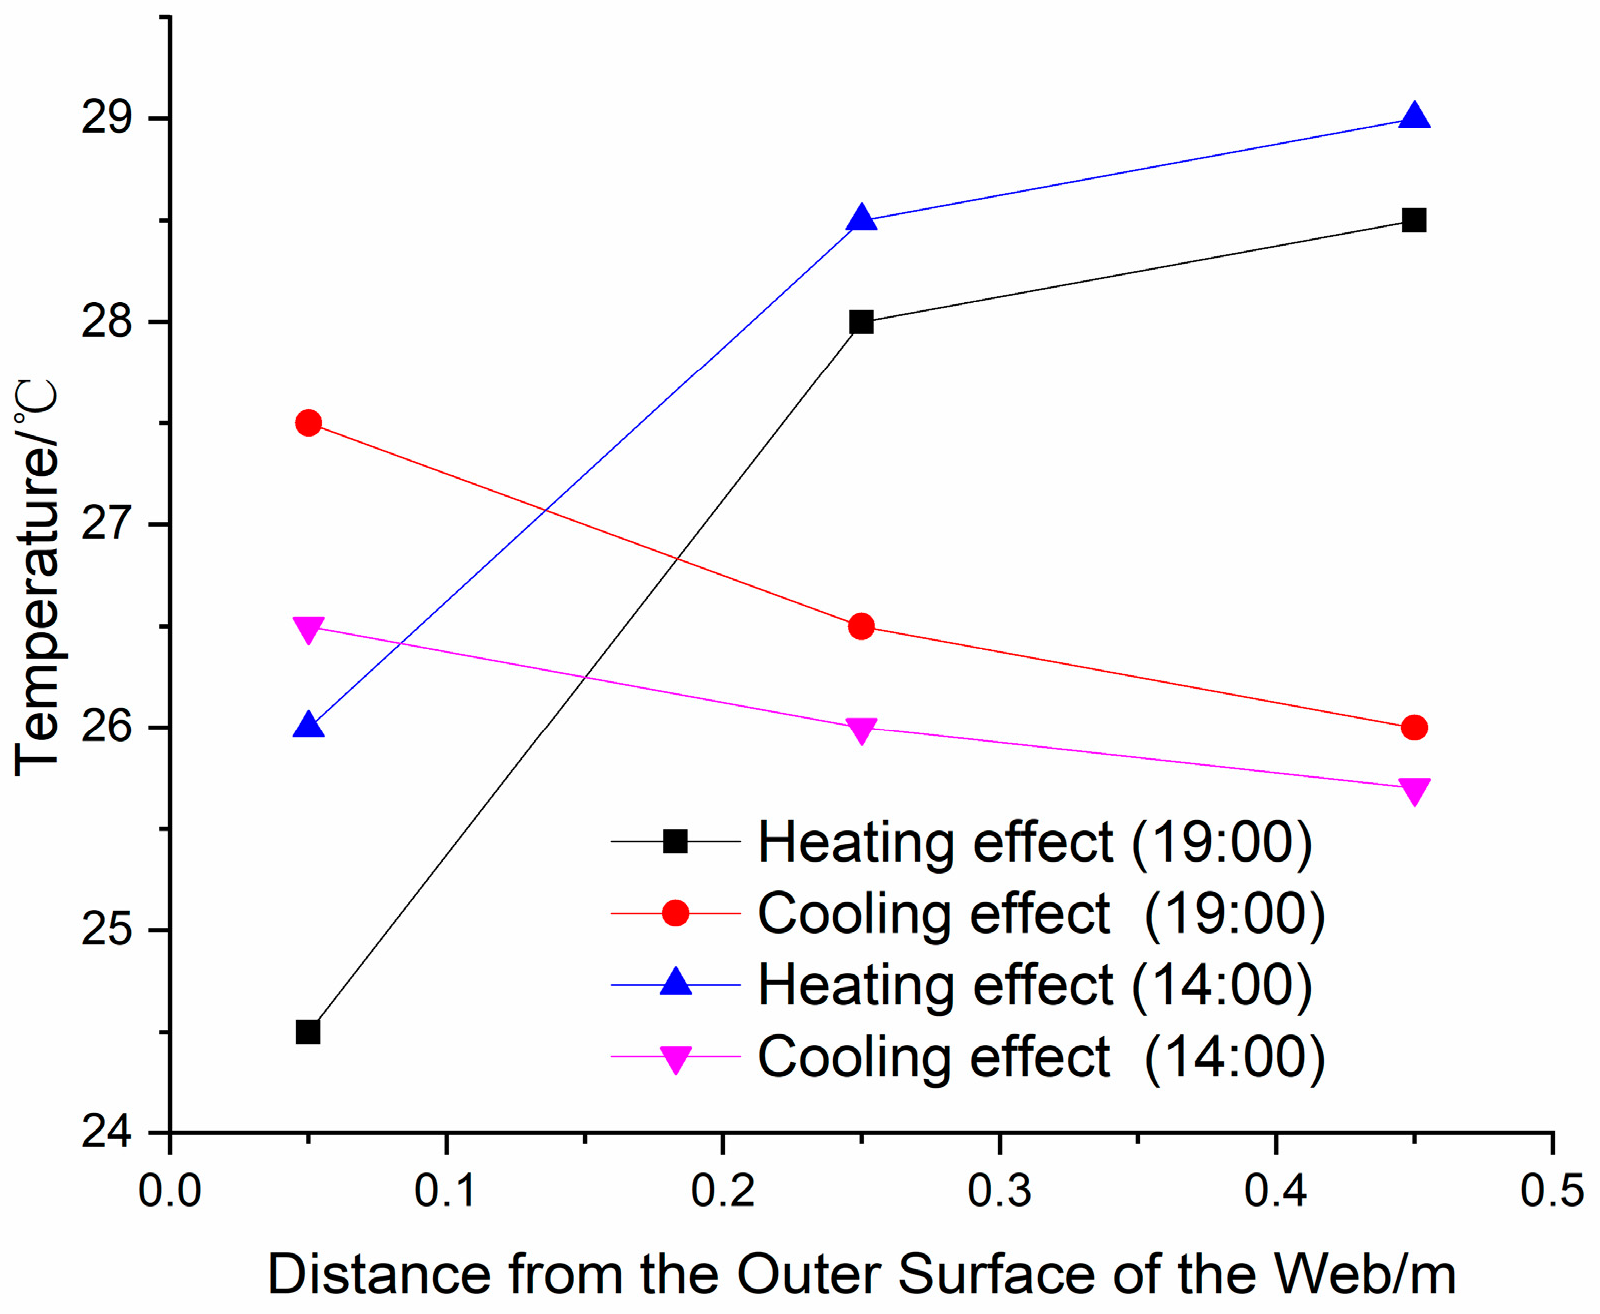
- Along the thickness direction of the concrete box girder, there exists a temperature gradient. The maximum temperature gradient occurs along the top plate thickness direction, reaching a maximum value of up to 10.7 °C. The gradient is somewhat smaller in the bottom plate, and even smaller in the web. There are temperature difference changes in the full range of the top plate thickness direction. The web and the bottom plate at the center of the outer surface plate thickness exhibit a disparity in temperature. There is an approximate temperature difference of 0 between the center of the plate thickness and the inner surface of the web.
- (2)
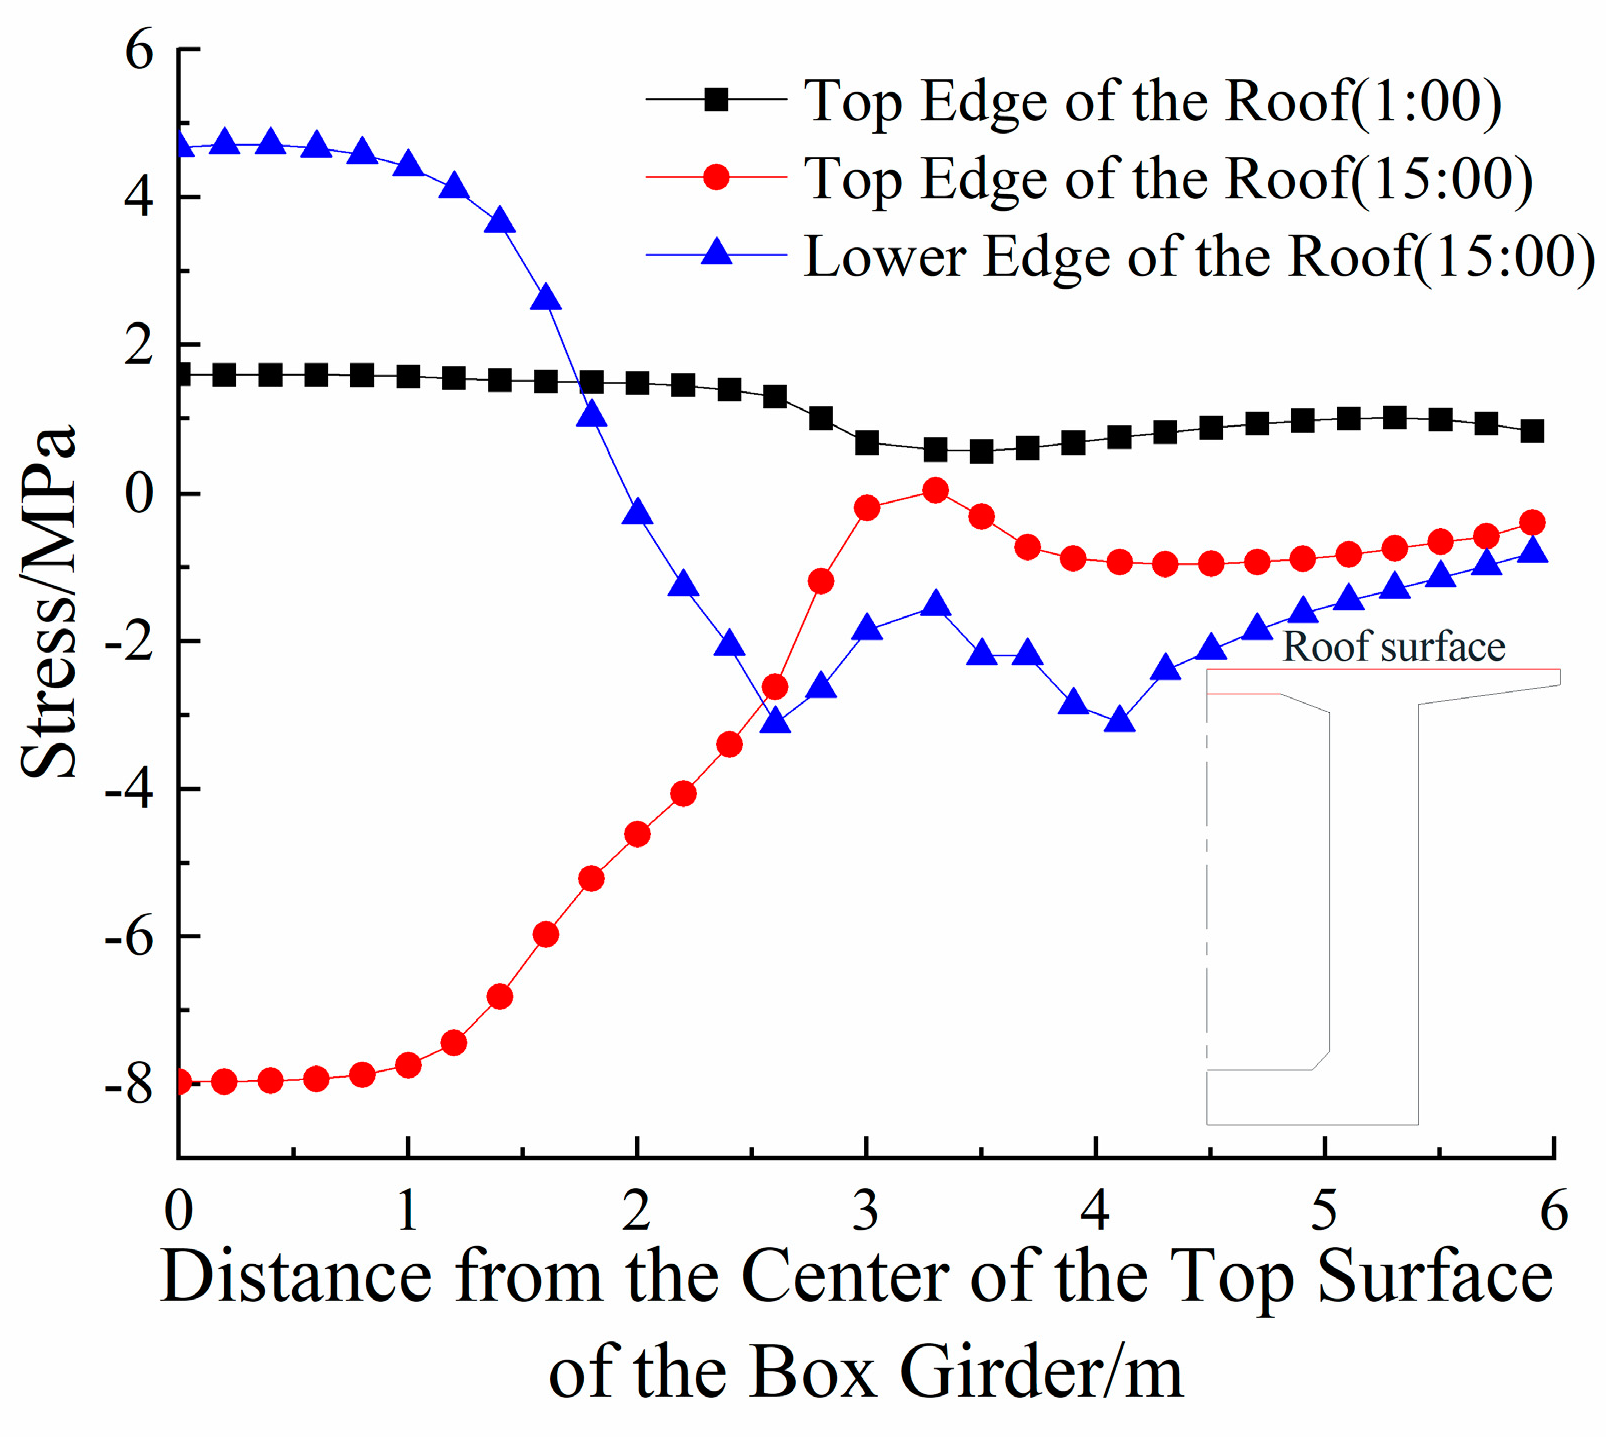
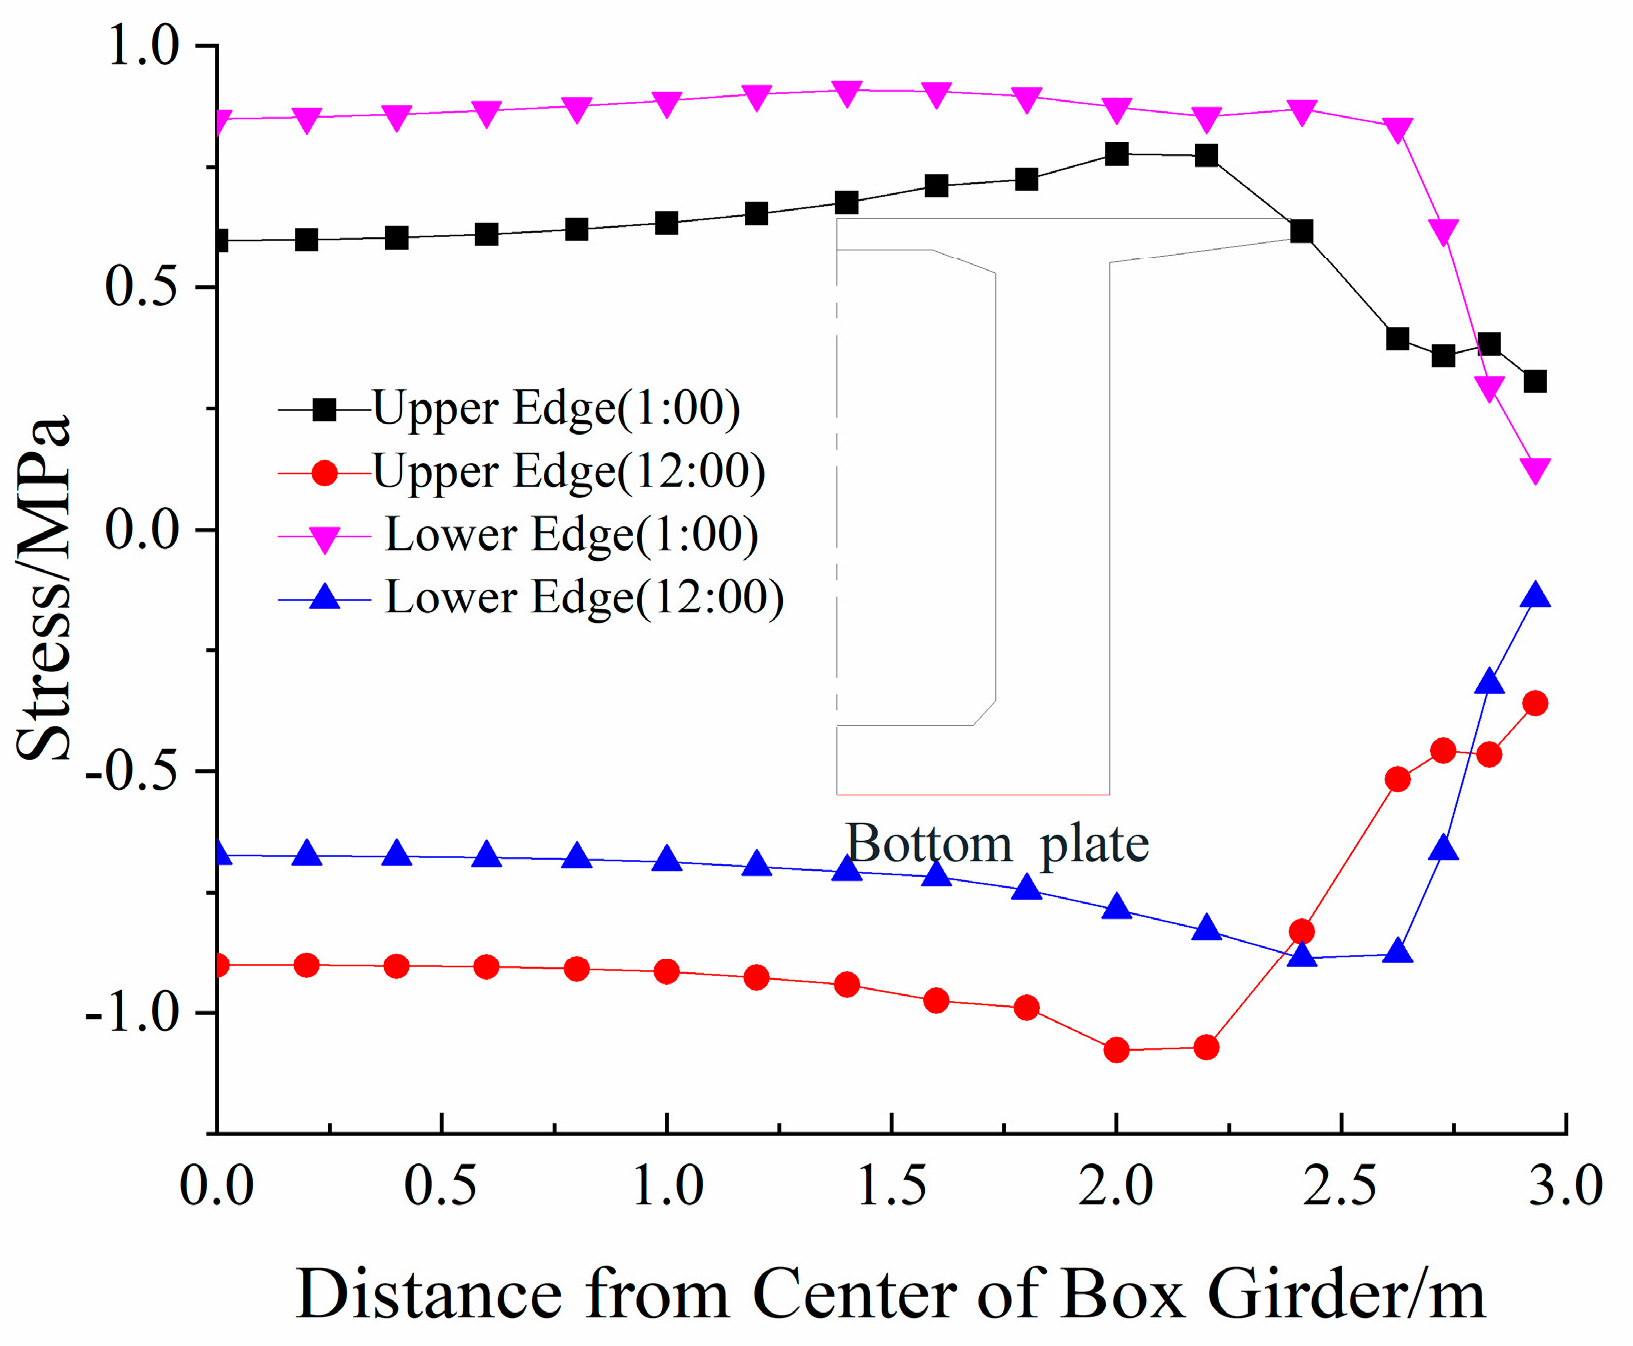
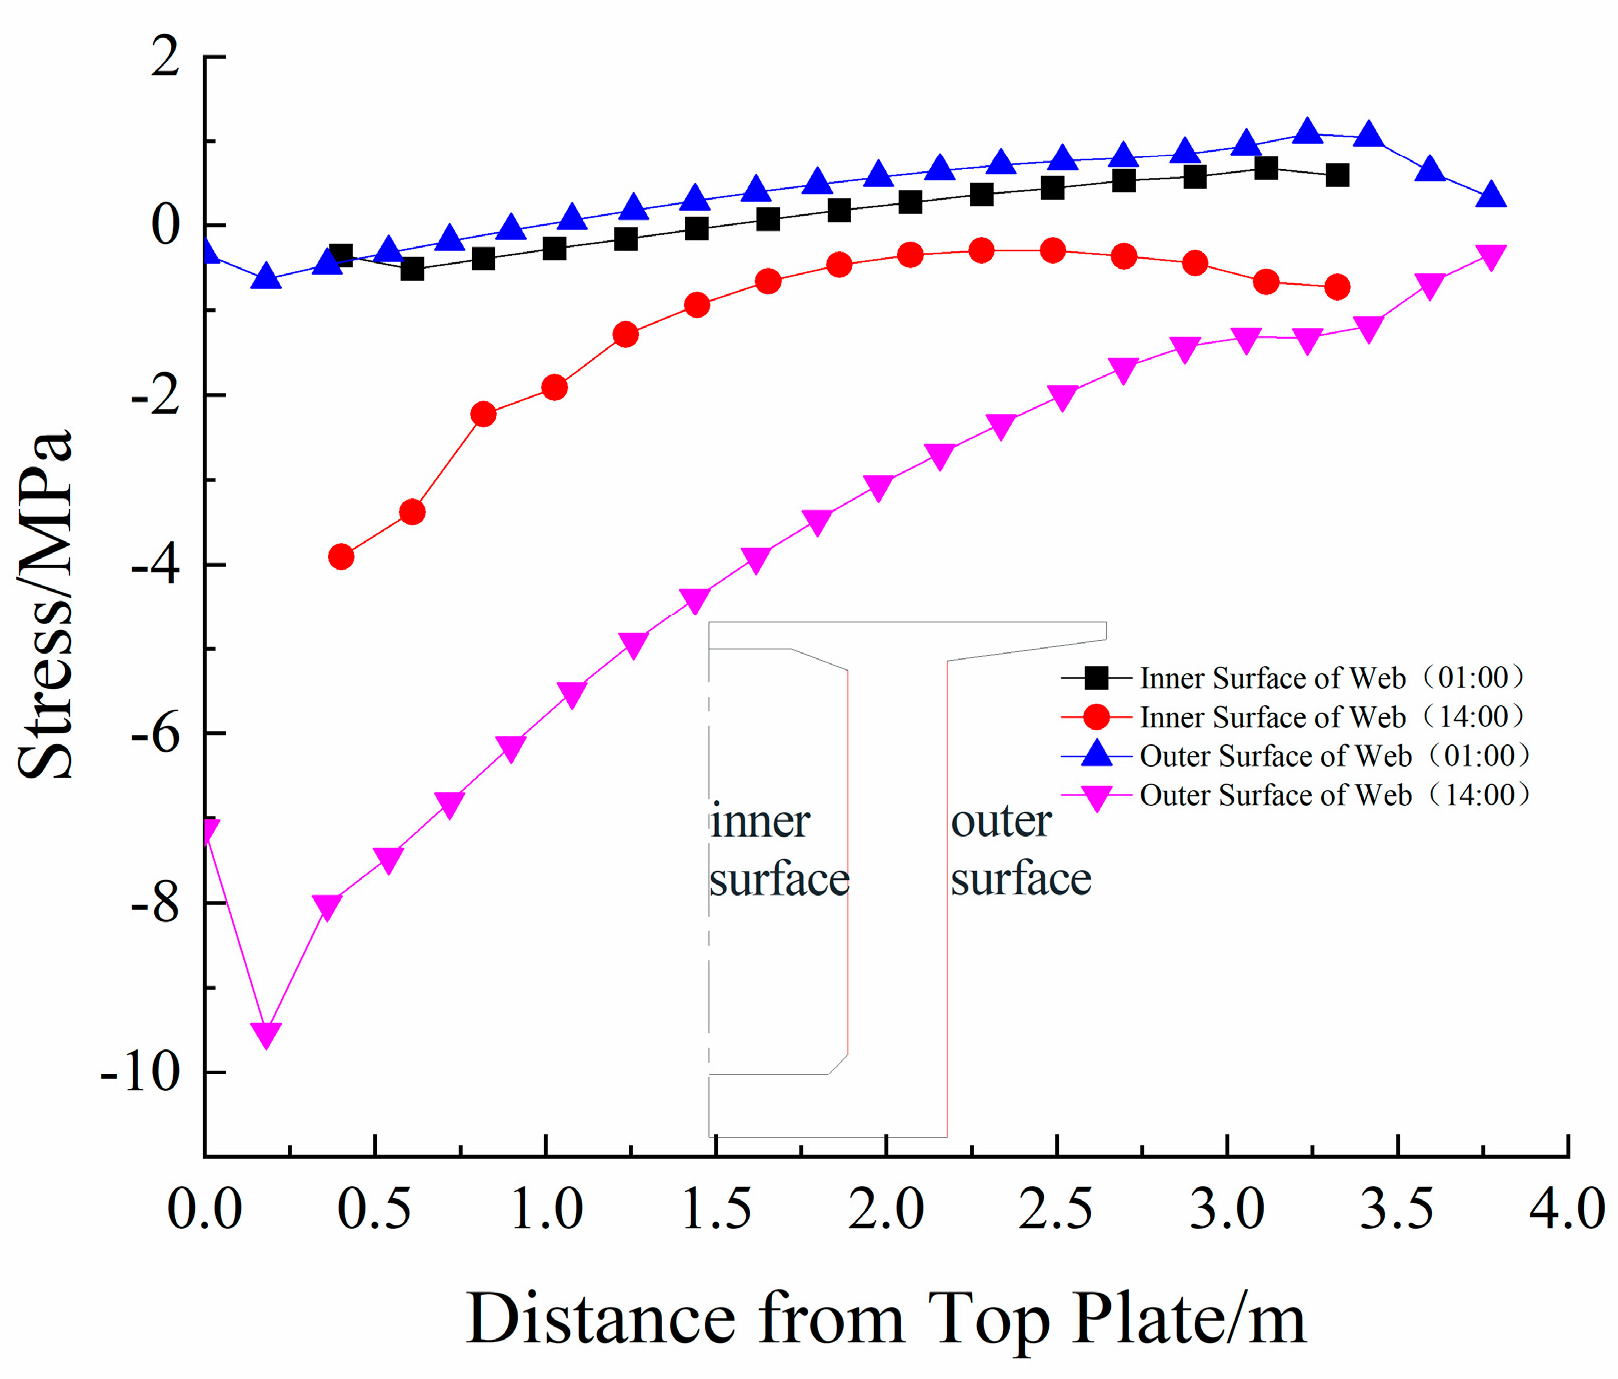
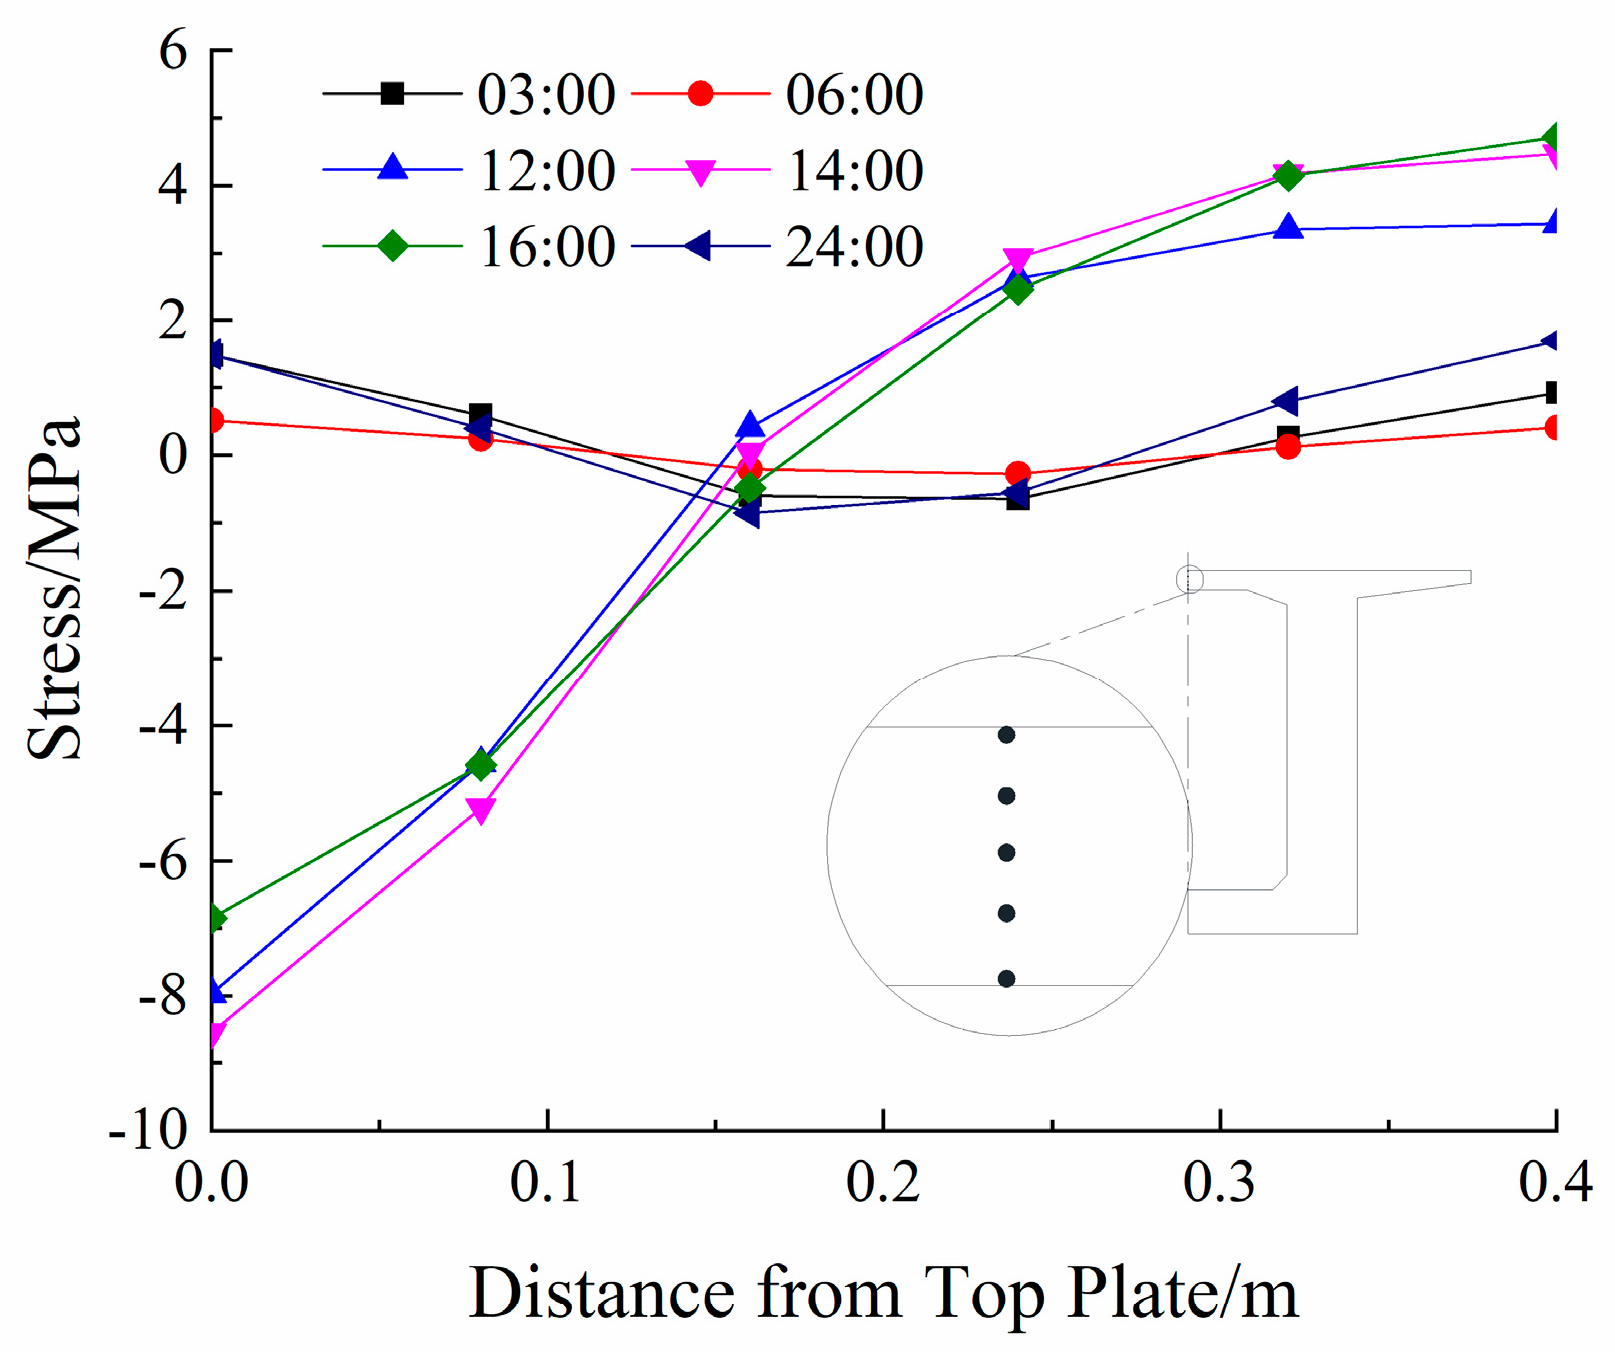
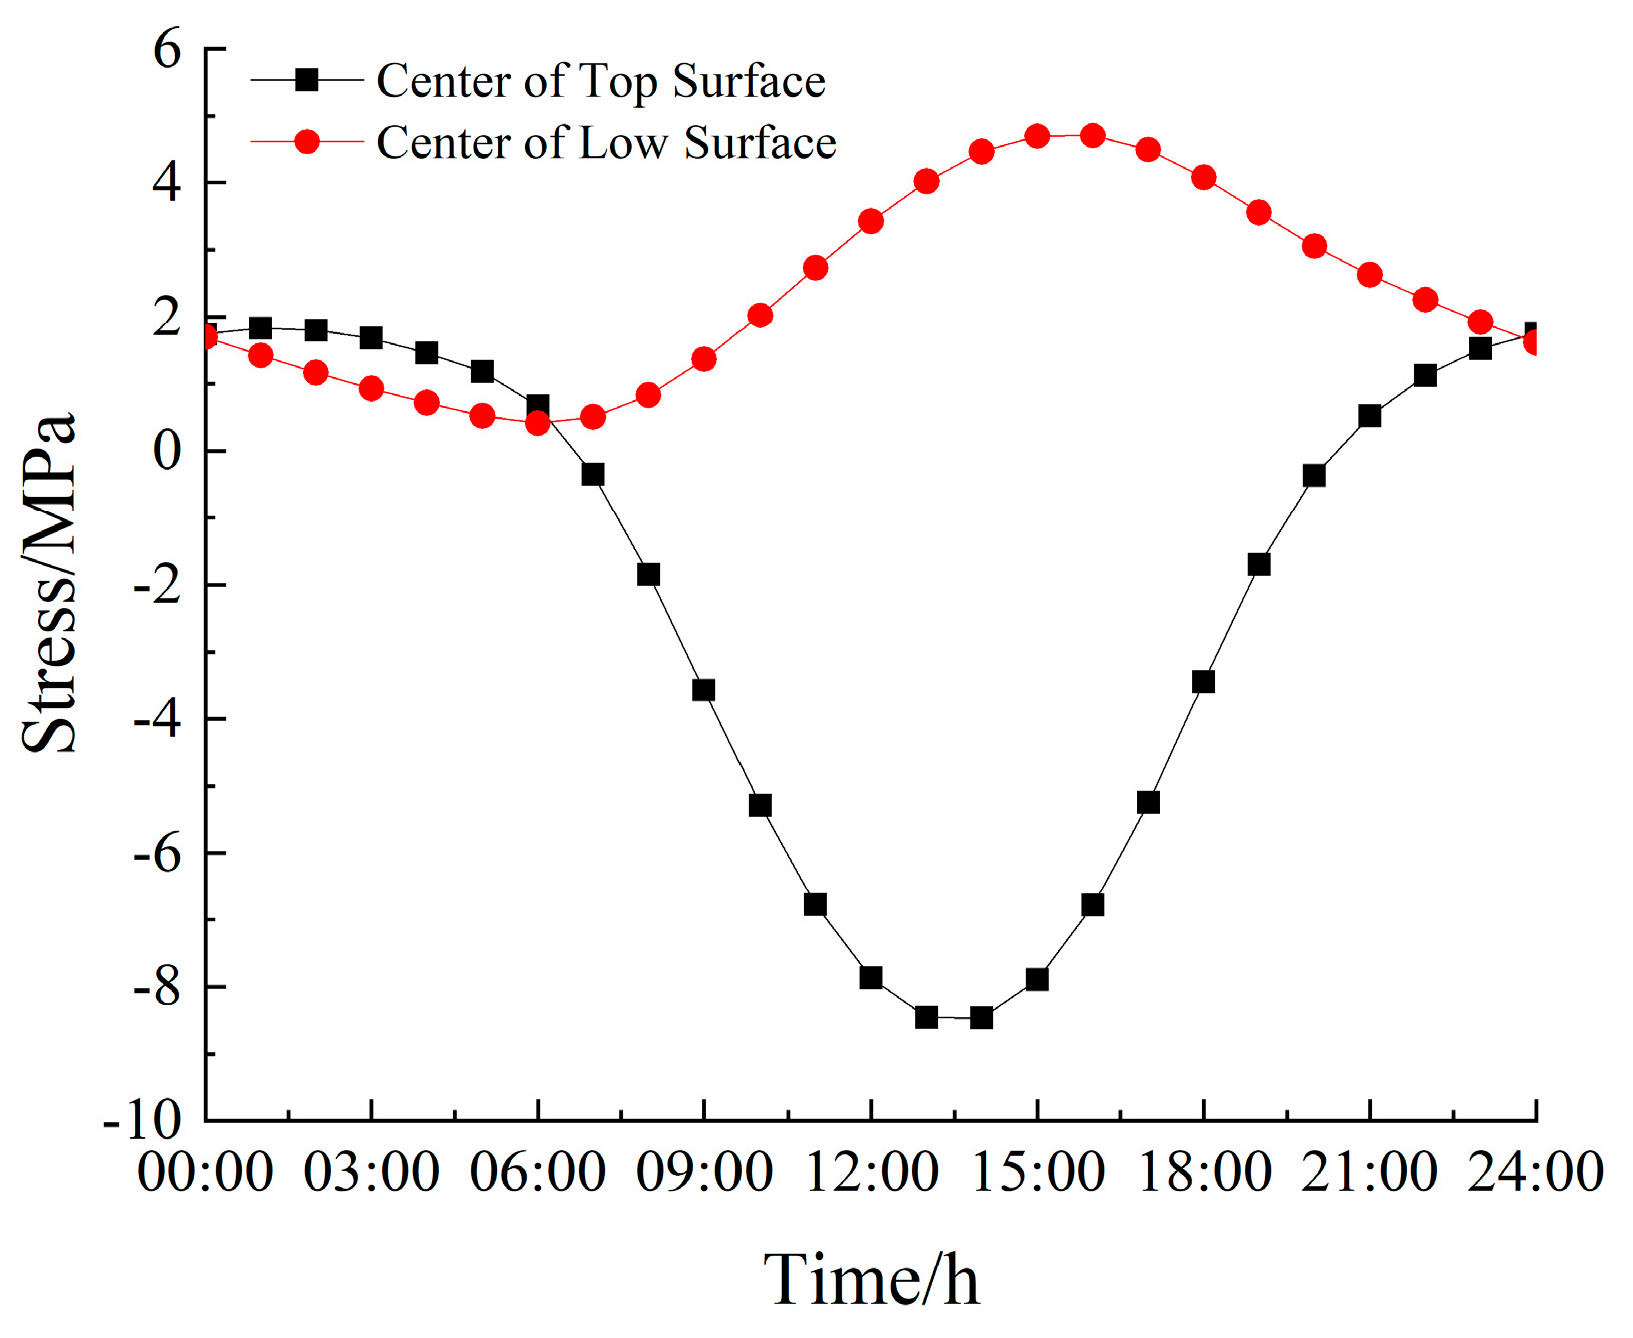
- The concrete box girder’s top surface is subjected to considerable temperature-induced stress, reaching a maximum compressive stress of 8.5 MPa and a maximum tensile stress of 1.5 MPa. The temperature pressure stress on the outer surface of the web is 4.0~8.0 MPa, the temperature stress on the inner surface is smaller than that on the outer surface, and the temperature stress on both the inner and outer surfaces of the bottom plate is less than 1 MPa.
- (3)
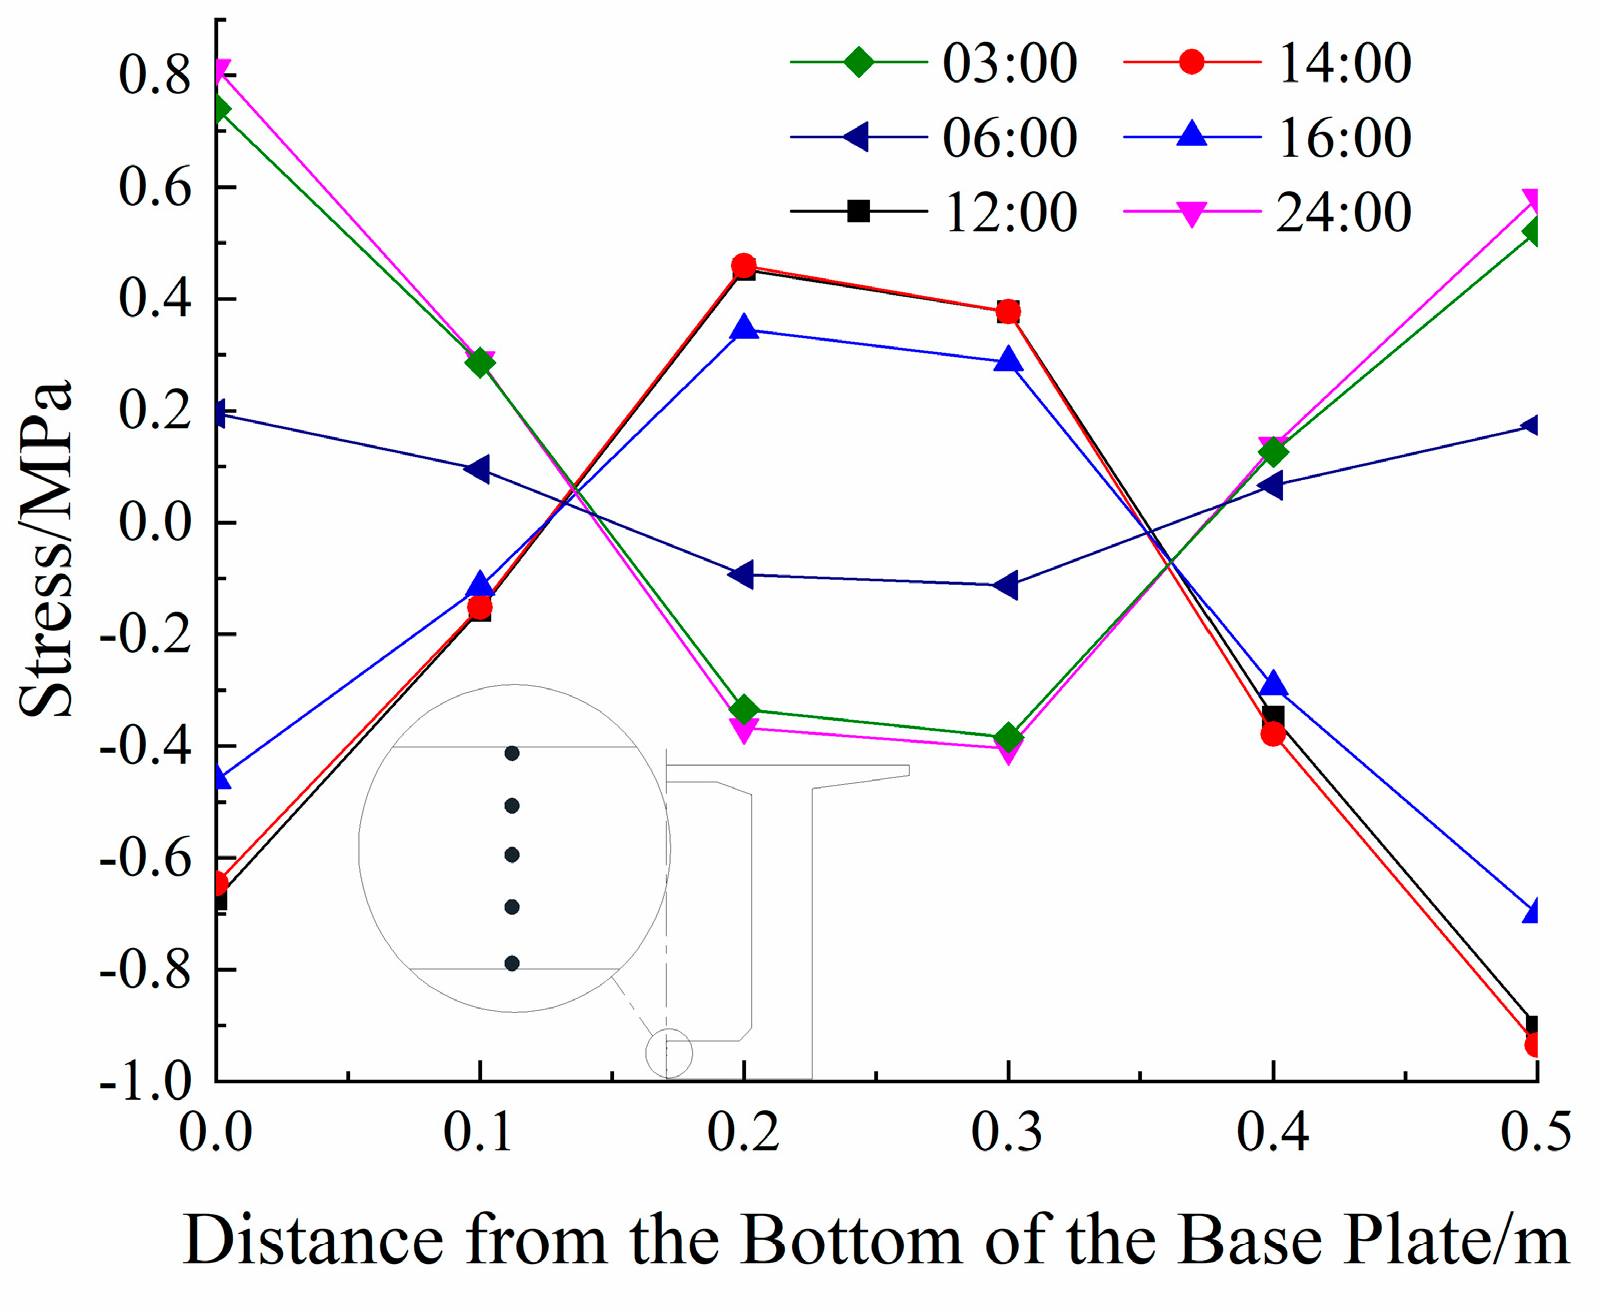
- The top plate experiences significant fluctuations in temperature stress as it moves along its thickness. The inner and outer surfaces experience the most significant temperature stresses, which gradually diminish as the plate thickness increases. The distribution of temperature stress along the thickness direction of the bottom plate can be regarded as approximately symmetrical throughout the day and night.
- (4)
- With the increase in thickness, the standard value of positive temperature difference decreases, the standard value of negative temperature difference increases, and the thermal stress is proportional to the gradient of thickness direction.
Author Contributions
Funding
Data Availability Statement
Conflicts of Interest
References
- Lei, X.; Ye, J.; Wang, Y. Representative value of solar thermal difference effect on PC box-girder. J. Southeast Univ. 2008, 38, 5–9. [Google Scholar]
- Lei, X.; Ye, J.; Wang, Y. Analysis of conc- rete box-girder temperature and strain based on long term observation. J. Jiangsu Univ. Nat. Sci. Ed. 2010, 31, 230–234, 239. [Google Scholar]
- Elbadry, M.M.; Ghail, A. Temperature variations in concrete bridges. J. Struct. Eng. 1983, 109, 2355–2374. [Google Scholar] [CrossRef]
- Saetta, A.; Scotta, R.; Vitaliani, R. Stress analysis of concrete structures subjected to variable thermal loads. J. Struct. Eng. 1995, 121, 446–457. [Google Scholar] [CrossRef]
- Han, D.; Tan, Y. Temperature variation in pre-stressed concrete single-cell box-girder bridges. J. Sichuan Univ. Eng. Sci. Ed. 2008, 40, 7–13. [Google Scholar]
- Mirambell, E.; Aguado, A. Distribution of temperature and stress in concrete box girder bridge. J. Struct. Eng. 1990, 116, 2388–2409. [Google Scholar] [CrossRef]
- Liu, Y.; Chen, X. Research on box girder temperature field using artificial neural network. China J. Highw. Transp. 2000, 13, 69–72. [Google Scholar]
- Emerson, M. Bridge Temperatures for setting bearings and expansion joints. TRRL Lab. Rep. (Transp. Road Res. Lab. Great Br.) 1979, 5, 21–28. [Google Scholar]
- Chen, H.; Xie, X.; Zhang, Z. Temperature Field and Stress Field of Prestressed Concrete box girder bridge. J. ZheJiang Univ. (Eng. Sci.) 2005, 39, 85–90. [Google Scholar] [CrossRef]
- Chai, Y.H. Temperature Gradients in lightweight aggregate concrete box-girder bridges. J. Part A Civ. Struct. Eng. 2013, 6, 199–210. [Google Scholar] [CrossRef]
- Oskar, L.; Sven, T. Estimating extreme values of thermal gradients in concrete structures. Mater. Struct. 2011, 44, 1491–1500. [Google Scholar]
- Taysi, N.; Abid, S. Temperature distributions and variations in concrete box-girder bridges: Experimental and finite element parametric studies. Adv. Struetural Eng. 2015, 18, 469–486. [Google Scholar] [CrossRef]
- Zhang, H.; Wu, E.-J. Statistical model estimation of extreme temperature gradient of long-span bridges combined parameter updating. Eng. Mech. 2017, 34, 124–130. [Google Scholar]
- Rodriguez, L.E.; Barr, P.J.; Halling, M.W. Temperature Effects on a Box-Girder Integral-Abutment Bridge. J. Perform. Constr. Facil. 2014, 28, 583–591. [Google Scholar] [CrossRef]
- Lee, J.H. Investigation of extreme environment conditions and design thermal gradients during construction for prestressed concrete bridge girders. J. Bridge Eng. 2011, 17, 547–556. [Google Scholar] [CrossRef]
Disclaimer/Publisher’s Note: The statements, opinions asnd data contained in all publications are solely those of the individual author(s) and contributor(s) and not of MDPI and/or the editor(s). MDPI and/or the editor(s) disclaim responsibility for any injury to people or property resulting from any ideas, methods, instructions or products referred to in the content. |


| Material | Density (g/cm3) | Thermal Conductivity (J·m−1·°C−1) | Specific Heat Capacity (J·kg−1·°C−1) |
|---|---|---|---|
| C50 Concrete | 2500 | 0.75 | 10.10 |
Disclaimer/Publisher’s Note: The statements, opinions and data contained in all publications are solely those of the individual author(s) and contributor(s) and not of MDPI and/or the editor(s). MDPI and/or the editor(s) disclaim responsibility for any injury to people or property resulting from any ideas, methods, instructions or products referred to in the content. |
© 2023 by the authors. Licensee MDPI, Basel, Switzerland. This article is an open access article distributed under the terms and conditions of the Creative Commons Attribution (CC BY) license (https://creativecommons.org/licenses/by/4.0/).
Share and Cite
Shen, Q.; Chen, J.; Yue, C.; Cao, H.; Chen, C.; Qian, W. Investigation on the Through-Thickness Temperature Gradient and Thermal Stress of Concrete Box Girders. Buildings 2023, 13, 2882. https://doi.org/10.3390/buildings13112882
Shen Q, Chen J, Yue C, Cao H, Chen C, Qian W. Investigation on the Through-Thickness Temperature Gradient and Thermal Stress of Concrete Box Girders. Buildings. 2023; 13(11):2882. https://doi.org/10.3390/buildings13112882
Chicago/Turabian StyleShen, Qiangru, Jingcheng Chen, Changqi Yue, Hui Cao, Chong Chen, and Wangping Qian. 2023. "Investigation on the Through-Thickness Temperature Gradient and Thermal Stress of Concrete Box Girders" Buildings 13, no. 11: 2882. https://doi.org/10.3390/buildings13112882
APA StyleShen, Q., Chen, J., Yue, C., Cao, H., Chen, C., & Qian, W. (2023). Investigation on the Through-Thickness Temperature Gradient and Thermal Stress of Concrete Box Girders. Buildings, 13(11), 2882. https://doi.org/10.3390/buildings13112882