Article

Preliminary Study on the Emission Dynamics of TVOC and Formaldehyde in Homes with Eco-Friendly Materials: Beyond Green Building

by
Chuloh Jung
1,
Naglaa Sami Abdelaziz Mahmoud
2,*,
Nahla Al Qassimi
3 and
Gamal Elsamanoudy
2
1
Department of Architectural Engineering, College of Engineering, University of Sharjah, Sharjah P.O. Box 27272, United Arab Emirates
2
Department of Interior Design, College of Architecture, Art and Design, Healthy and Sustainable Buildings Research Center, Ajman University, Ajman P.O. Box 346, United Arab Emirates
3
Department of Architecture, College of Architecture, Art and Design, Ajman University, Ajman P.O. Box 346, United Arab Emirates
*
Author to whom correspondence should be addressed.
Buildings 2023, 13(11), 2847; https://doi.org/10.3390/buildings13112847
Submission received: 24 September 2023 / Revised: 28 October 2023 / Accepted: 12 November 2023 / Published: 14 November 2023
(This article belongs to the Special Issue Healthy, Digital and Sustainable Buildings and Cities)

Abstract

:
This preliminary study investigates the emission characteristics of formaldehyde (HCHO) and total volatile organic compounds (TVOC) in indoor environments, comparing the effects of eco-friendly materials and general materials. The study analyzes the concentration changes over time in the living rooms of experimental units to assess the effectiveness of eco-friendly materials in reducing indoor air pollutants. The results show that eco-friendly materials exhibit lower initial emissions of TVOC than general materials, gradually decreasing over time. Compared to the eco-friendly material unit, the general material unit takes longer to reach acceptable TVOC concentrations. The emission pattern of HCHO differs from TVOC, with the highest peak occurring on the seventh day. Major individual VOCs, except for benzene, exhibit a similar decreasing trend for TVOC over time. Eco-friendly materials demonstrate significant reductions in emissions compared to general materials in various material applications, including parquet flooring, wallpaper, built-in furniture, and kitchen furniture. However, the difference in emissions for door and window frames using eco-friendly materials is minimal. These findings emphasize the effectiveness of eco-friendly materials in reducing indoor air pollutants and provide valuable insights for creating healthier living environments. Further research is needed to optimize the application of eco-friendly materials in specific components and investigate their long-term impact on indoor air quality and occupant health.

1. Introduction

Recently, residential properties’ insulation and airtightness requirements have become imperative for energy conservation [1]. Consequently, diverse construction techniques and the adoption of novel, high-efficiency, and multifunctional building interior materials have increased indoor air contaminants [2,3]. The building materials utilized in modern housing consist of intricate compounds and consequently release an array of perilous chemicals, including volatile organic compounds (VOCs) and formaldehyde (HCHO), which contribute to the degradation of indoor air quality (IAQ) [4,5]. Research is currently underway to investigate these emissions [6]. These harmful substances can potentially lead to various ailments among occupants, such as headaches, dizziness, nausea, drowsiness, and diminished concentration [7,8]. While not always directly or linearly correlated, these symptoms can collectively define sick building syndrome (SBS) [9]. Sick building syndrome (SBS) refers to non-specific health complaints often linked to exposure to indoor and outdoor air pollutants, including symptoms such as fatigue, headaches, irritations of the eyes, nose, and throat, dry cough, parched or itchy skin, dizziness, and difficulty maintaining concentration. The emission of hazardous chemicals indoors has given rise to numerous predicaments in the daily activities of inhabitants [10]. To address these issues, installing and operating appropriate ventilation systems is crucial, as is employing environmentally friendly materials while constructing new edifices and advancing the development of low-pollutant-emitting materials [11,12]. Desperate efforts are needed to tackle these challenges.
Various sources influence indoor air quality, each contributing to the presence of volatile organic compounds (VOCs) and formaldehyde (HCHO) in indoor environments. Construction materials, with their adhesives, sealants, and finishes, significantly release VOCs and HCHO indoors. However, they are not alone in this; furniture and furnishings made of composite wood products, household products such as cleaning agents, and even personal care items can emit these pollutants. Moreover, cooking and heating appliances, particularly gas stoves, can introduce combustion byproducts, including VOCs, into indoor air [13]. Outdoor sources such as traffic emissions and industrial activities can infiltrate indoor spaces, while human activities such as smoking and hobbies involving solvents add to the mix. Outdoor air quality also influences indoor air quality, and effective ventilation can help dilute pollutants and mitigate their impact. Managing indoor air quality effectively necessitates a holistic approach that addresses these diverse sources and employs strategies such as source control, ventilation, and air purification to ensure healthier indoor environments [14].
Extensive research conducted in Dubai has highlighted the critical nature of indoor air quality (IAQ) and its profound impact on residents [15,16]. Kim et al. (2022) conducted a study in Dubai, revealing that 15% of the city’s population has reported experiencing symptoms associated with sick building syndrome (SBS). This syndrome is characterized by various non-specific health complaints often linked to exposure to a complex mix of indoor and outdoor air pollutants [17]. SBS is a multifaceted issue highlighting the importance of indoor air quality in urban settings, where individuals spend a significant portion of their lives in various environments. Understanding the factors contributing to SBS, including specific pollutant sources, ventilation systems, and building design, is crucial for promoting healthier indoor environments and the well-being of urban populations. The symptoms of SBS include fatigue, headaches, irritations of the eyes, nose, and throat, dry cough, parched or itchy skin, dizziness, and difficulty maintaining concentration. To recognize these concerns and ensure compliance with IAQ standards, the Dubai Municipality has outlined specific concentration thresholds [18]. These mandates stipulate that HCHO levels should not exceed 0.08 parts per million (ppm), total volatile organic compounds (TVOC) should be maintained below 300 μg/m3, and particulate matter (PM10) should be limited to 150 μg/m3. These measurements are obtained through continuous monitoring over 8 h before newly constructed houses are occupied [19].
Arar et al. (2022) surveyed between December 2021 and January 2022, targeting residents of townhouses in Dubai, and revealed a notable level of awareness regarding SBS [20]. A significant 95% of respondents indicated having above-average knowledge of SBS [21]. However, despite this awareness, a majority demonstrated limited knowledge or indifference towards methods to improve IAQ [22]. It was observed that individuals who spent substantial amounts of time indoors, such as housewives and children, were the most adversely affected [23]. Furthermore, Carrer and Wolkoff (2018) identified a trend of increased vigilance among individuals in assessing IAQ before relocating [24]. However, once settled, there was a lack of guidance and systems for maintaining healthy living conditions [25].
Regarding construction practices, most developers in Dubai have adopted eco-friendly materials, established ventilation systems, and implemented pre-occupancy bake-outs to ensure compliance with recommended indoor air quality standards in new apartment buildings [26]. However, after moving in, residents are responsible for actively enhancing the indoor air environment [27]. This can be achieved through diligent utilization of ventilation facilities and restricting the use of household items that contribute to indoor pollutant generation, thereby reducing pollutant concentrations [28].
Jung et al. (2021) focus on evaluating the indoor environment within specific developments, such as The Springs, an iconic townhouse-type residential complex in Dubai [29]. This research aims to discern residents’ preferences concerning various indoor environmental factors, including thermal comfort, indoor air quality, lighting, and acoustics [30]. Preliminary findings indicate that, during the summer, thermal comfort emerges as the foremost concern for living rooms and master bedrooms. In contrast, indoor air quality assumes greater significance during winter [31,32]. The outcomes of this research are expected to guide future renovation guidelines to enhance indoor environments, particularly in buildings nearing the twenty-year mark, thereby preventing complications associated with SBS [33].
Furthermore, to enhance the quality of final interior finishing materials, utilizing substances that possess diminished levels of hazardous chemicals is also necessary [34]. Additionally, there is a growing need to systematically evaluate the efficacy of employing these materials [35].
This research employs a meticulous selection process to identify eco-friendly and conventional materials as primary candidates for indoor finishing materials, known to be the primary culprits behind indoor air pollution [36]. Subsequently, experiments are conducted to examine the emission of harmful chemicals and assess the effectiveness of implementing eco-friendly building materials [37]. The specific objectives encompass two principal aims: firstly, to evaluate the performance of experimental houses constructed using both eco-friendly materials and conventional materials [38]; secondly, to ascertain the emission characteristics of HCHO and VOCs within the living spaces, accounting for the location of each construction material [39,40].

2. Materials and Methods

2.1. Research Methods and Procedures

As shown in Table 1, four mockup test units, labeled 4A, 6B, 8C, and 10D, were meticulously constructed at the Sobha Hartland One Park Avenue construction site before the completion of the apartment [41].
Experimental unit 4A was erected using conventional materials, while experimental unit 6B employed eco-friendly materials, enabling the assessment of long-term reductions in HCHO and VOCs (Figure 1) [42,43]. Furthermore, experimental units 8C and 10D were dedicated to general and eco-friendly materials [44]. Sequentially, these units involved the installation of wallpaper (including adhesive), floor materials (including adhesive), general furniture, kitchen furniture, and wooden window and door materials at approximately two-week intervals [45]. The concentrations of formaldehyde and VOCs were measured on the first day and the fifth to eighth days after each construction phase, employing a repetitive construction cycle, measurement, and demolition [46].
To elaborate, the wallpaper experiment commenced with an initial measurement of background concentration, followed by the installation of wallpaper on the walls and ceiling of the living room, each room, and the kitchen in the experimental units [47]. The emissions were monitored and recorded before material removal [48]. Upon removal, thorough ventilation was conducted by fully opening the doors of all units for a specific duration [49]. Subsequently, the background concentration was remeasured before proceeding with the construction of subsequent materials [50].
The order of construction materials was determined based on the ease of dismantling and minimal residual impact [51]. General furniture, kitchen furniture, wooden windows, wallpaper, and flooring materials were successively installed [52]. Moreover, when calculating the final concentration, the background concentration measured before construction was subtracted and considered [53].
In this study, eco-friendly materials encompass substances specifically developed to reduce hazardous chemicals compared to conventional materials [54]. Table 2 provides detailed information regarding their specific composition.
Wallpaper was affixed to the walls and ceiling of the living room, as well as the walls and ceiling of each of the three individual rooms and the kitchen [55]. Conventional materials employed polyvinyl chloride (PVC)-based resin for the wallpaper, while eco-friendly materials employed polypropylene (PP)-based resin [56]. Flooring materials were installed in the living room and kitchen. Conventional floorboards utilized oil-based epoxy resin-based adhesives, whereas eco-friendly floorboards utilized urethane resin-based adhesives [52,57].
General furniture includes a shoe rack, a dressing table in the master bedroom, a closet in the dressing room, and a decorative cabinet in the living room [58]. Regarding the materials utilized for general furniture, the core body employed a particle board (PB), while the doors were constructed using medium density fiberboard (MDF) [59]. It is worth noting that these furniture materials adhered to the E2 grade for HCHO emissions, ensuring limited radiation of HCHO [60]. Conversely, eco-friendly furniture materials adhered to the E1 grade, signifying a higher level of environmental friendliness [61]. Regarding surface treatment, adhesives were circumvented using the PVC wrapping technique for general furniture materials [62]. On the other hand, the low-pressure laminate (LPM) processing method was employed for eco-friendly furniture materials [63].
The kitchen area was furnished with general furniture comprising a core body of PB E2-grade and MDF E2-grade materials to ensure compliance with the specified formaldehyde (HCHO) radiation standards [64]. Furthermore, a membrane finish was applied for a polished appearance [65]. On the other hand, eco-friendly kitchen furniture featured PB E1-grade and MDF E1-grade materials and a coating of ultraviolet curing (UV) paint, signifying a commitment to environmentally conscious practices [66].
Wood windows and doors encompass the materials utilized for each room’s doors, doorframes, and window frames. The core component of general and eco-friendly materials comprises E2-grade laminated wood and a high-intensity fiberboard (HDF) surface layer. In the case of general materials, veneer lumber (LVL) adhered to the E2 grade, while HDF met the E1 grade requirements. Eco-friendly materials, on the other hand, adhered to E2 grade specifications. The experiment entailed a repetitive process of constructing and demolishing the aforementioned materials in each designated area, carried out sequentially.

2.2. Target Building Status
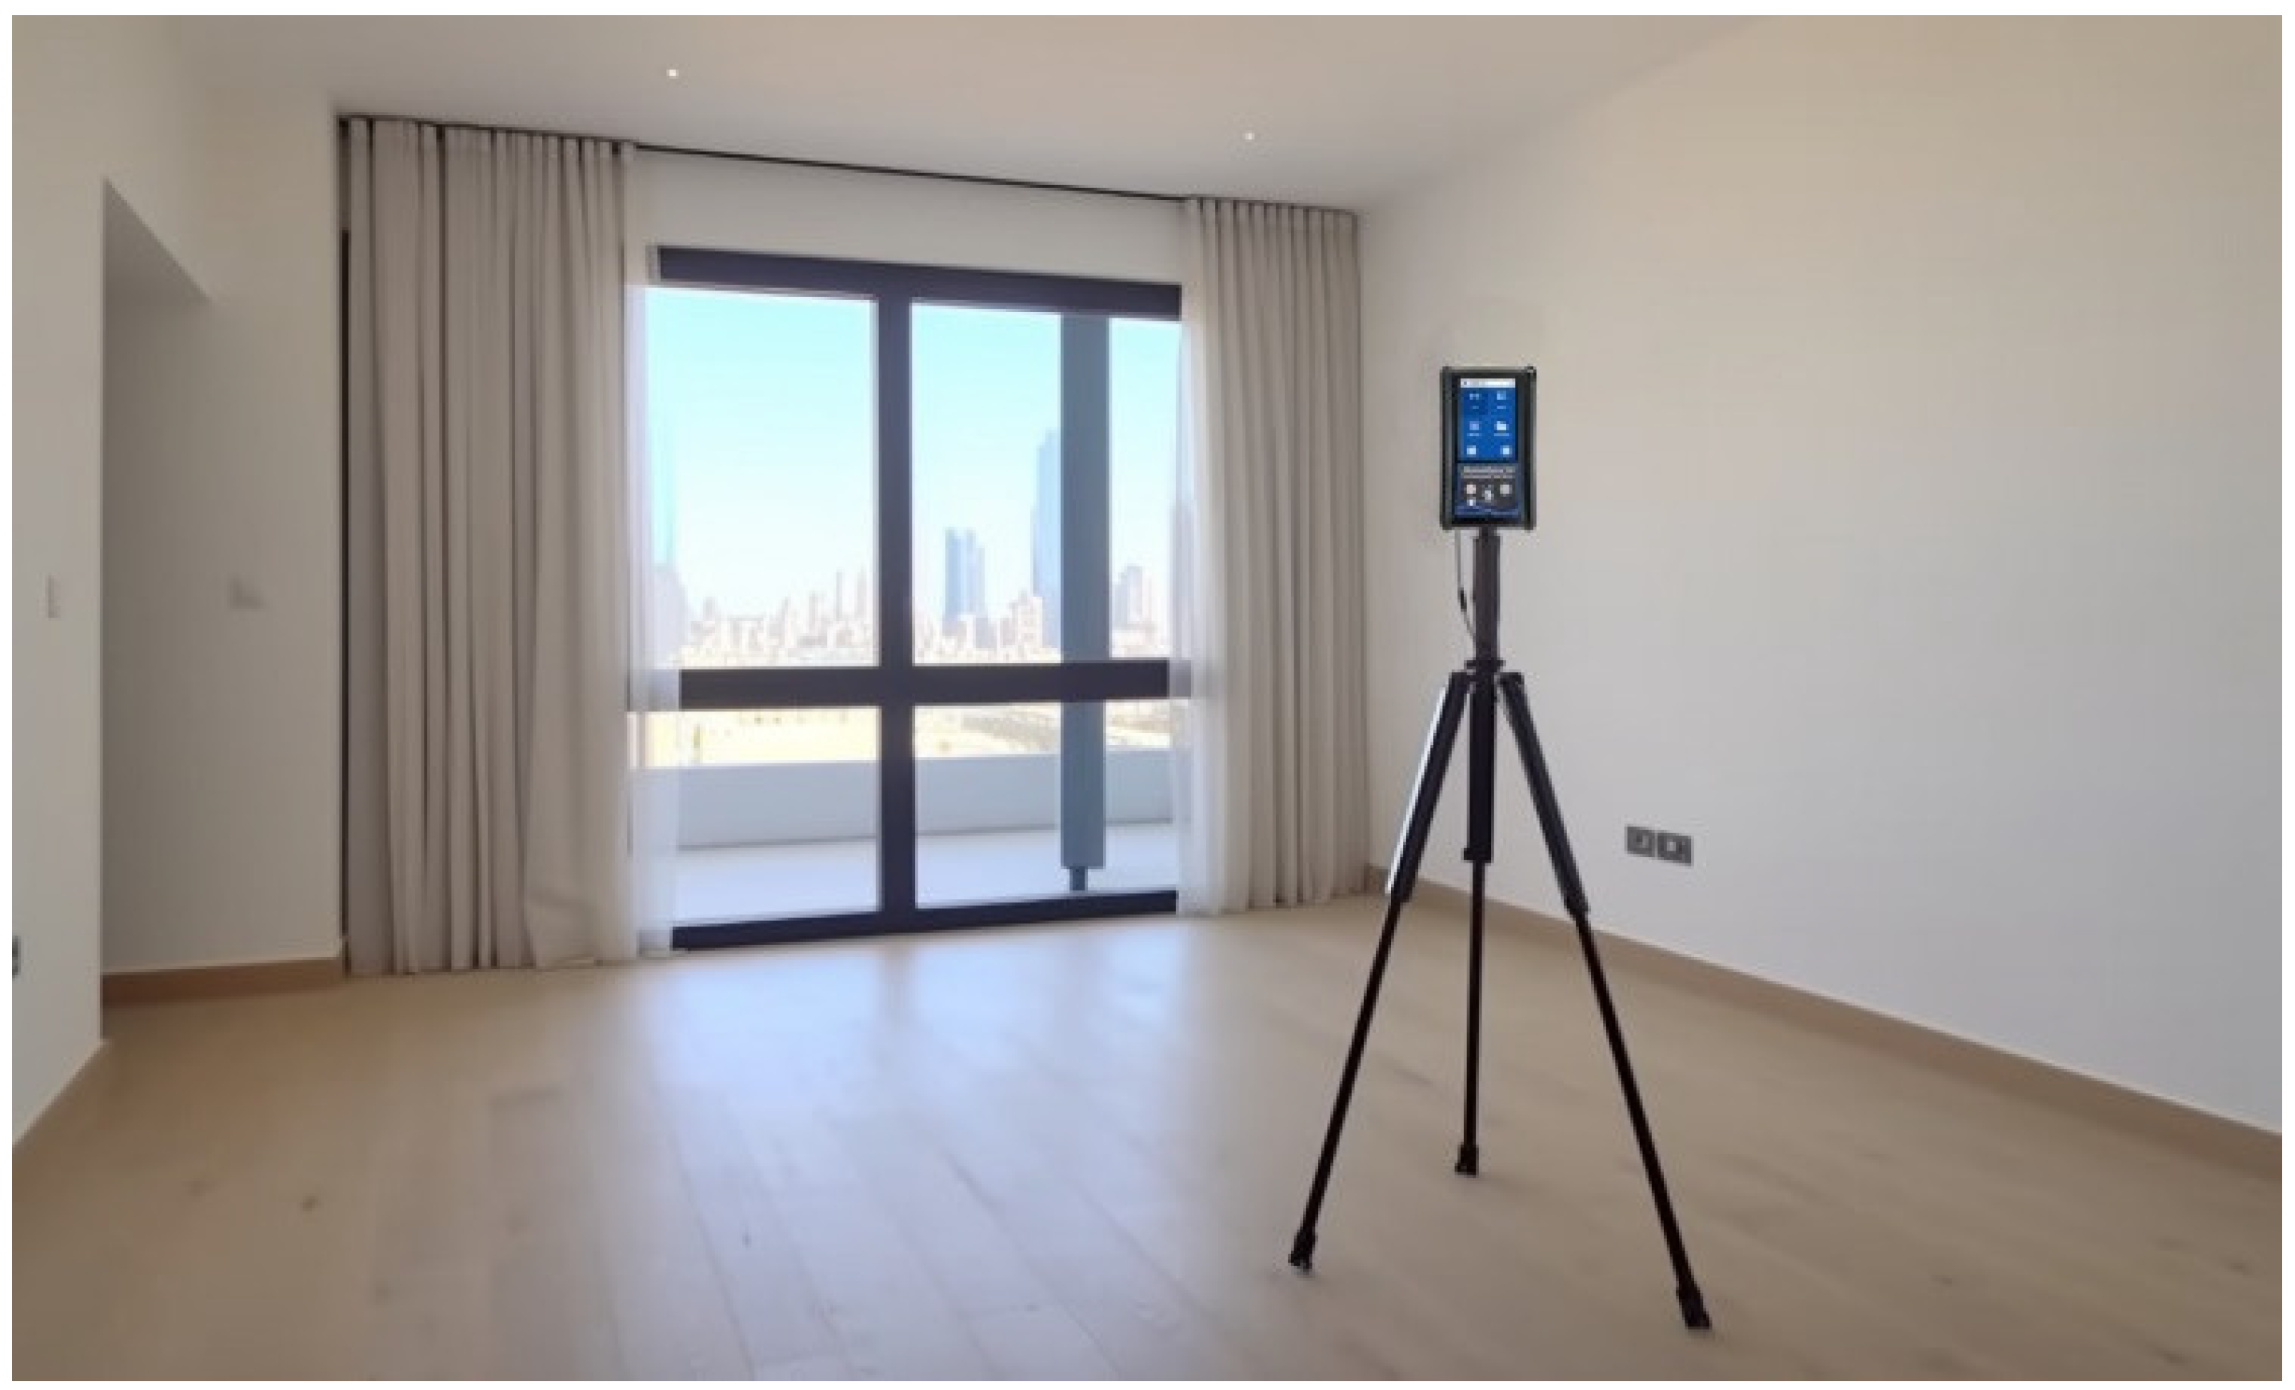
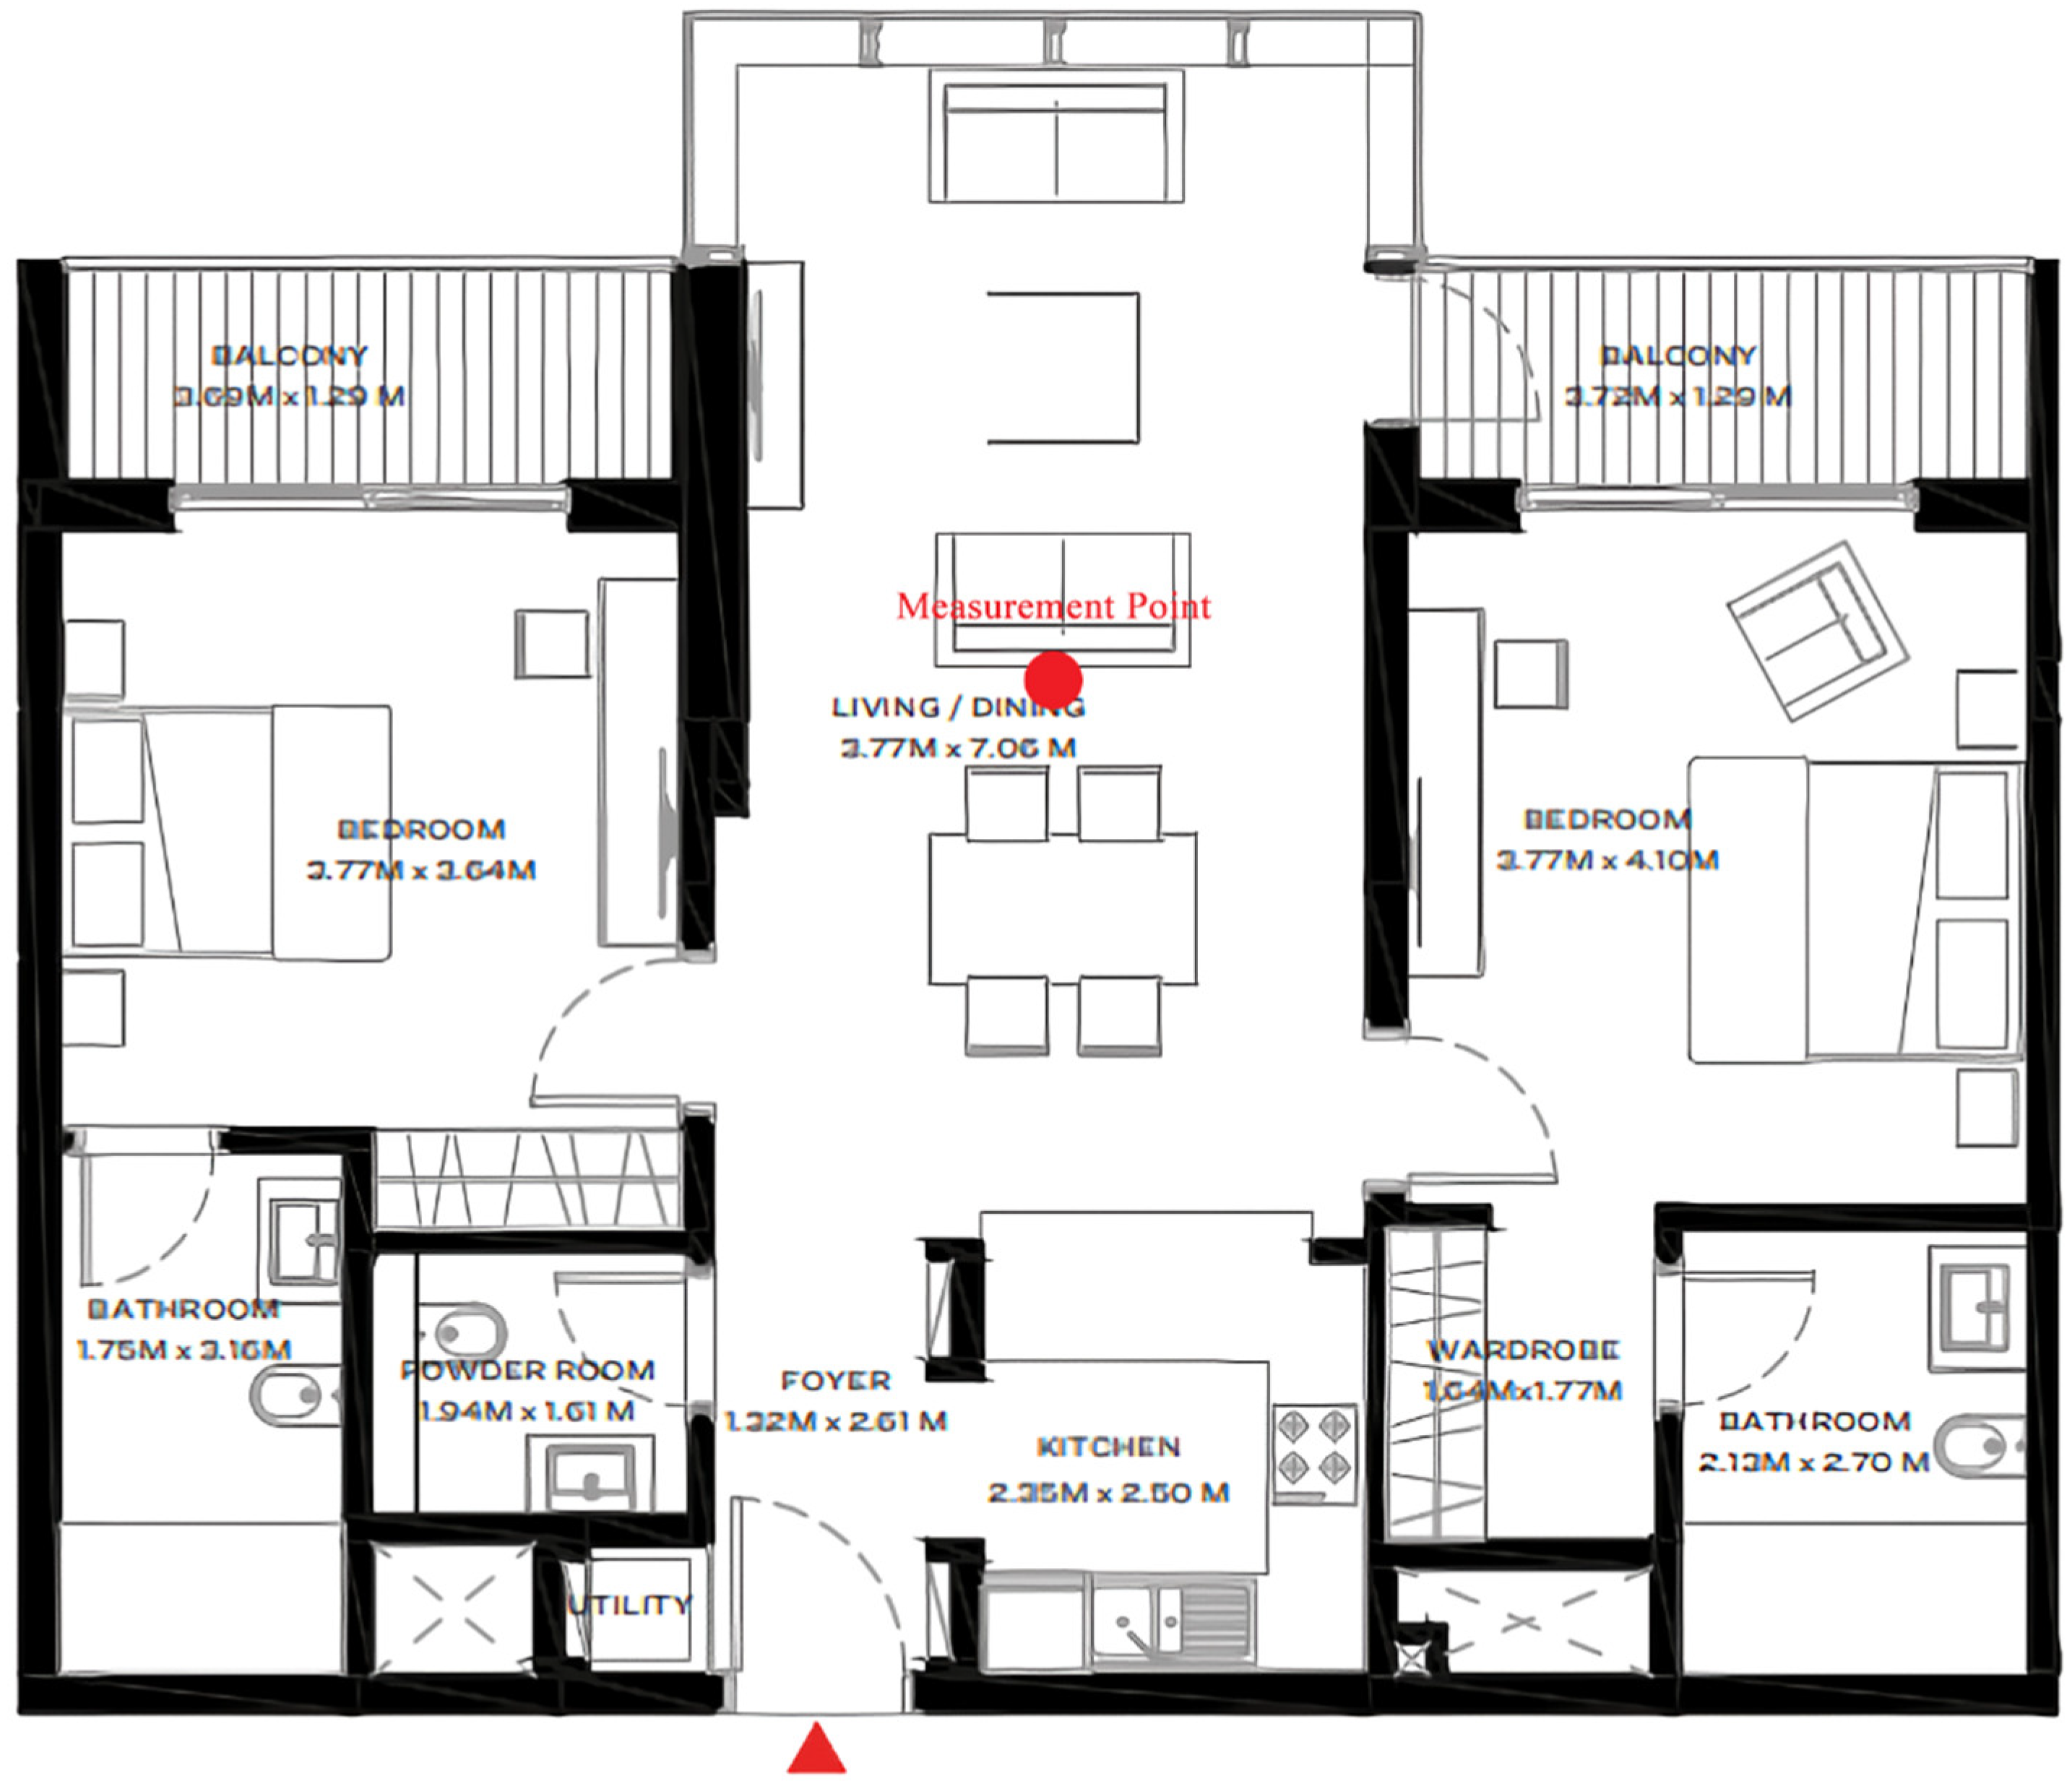
The focus of measurement encompassed the two-bedroom units (102.13 m2) within the Sobha Hartland One Park Avenue apartment complex situated in Mohammad Bin Rashid Al Maktoum City (MBR), Dubai [67]. The experiment was conducted over the period spanning from November 2022 to December 2022. The room conditions were diligently maintained during the experiment at an air temperature of 25 °C. Figure 2 illustrates the experimental layout, showcasing the plan view and the positioning of the measuring points.
The measurement locations were determined based on the living room, serving as the primary measurement point [68]. Each material was measured at its main construction location (e.g., bedroom, kitchen). To clarify further, the living rooms of units 4A and 6B were measured. In contrast, in units 8C and 10D, the living rooms were assessed for flooring, wallpaper, general furniture, and wooden window and door installations. In contrast, the living rooms and bedrooms were examined for kitchen furniture.
The measurement points were positioned at the center, with a minimum distance of 1 m from the walls, and the height was set between 1.2 and 1.5 m from the floor [69]. Indoor air collection was measured following a process adhering to the World Health Organization’s (WHO) IAQ testing method [70]. This entailed 30 min of ventilation followed by 5 h of sealing. The concentration of VOCs emitted by each building material was calculated by determining the concentration of individual VOCs and compounds identified through analysis. For compounds that could not be specifically identified, they were converted to the concentration of toluene, and subsequently, the concentration of TVOC was calculated by summing the two concentrations.

2.3. Measurements

Specialized measurement sensors were employed to collect data on indoor air quality meticulously. These sensors were thoughtfully selected based on their exceptional accuracy and reliability in quantifying the concentrations of formaldehyde (HCHO) and volatile organic compounds (VOCs) in the indoor environment.
A highly sensitive approach was adopted for VOC measurements, utilizing a stainless tube filled with 200 mg of Tenex-TA (60/80 mesh, Supelco, Bellefonte, PA, USA) for solid adsorption. Similarly, for HCHO measurements, we employed a purified 2,4-DNPH Silica Cartridge (Supelco, S10, Bellefonte, PA, USA). To maintain the utmost precision in our measurements, a micro pump (Gilian, Pinellas County, FL, USA) was meticulously chosen for its minimal flow fluctuations before and after measurements, guaranteeing our data’s accuracy and reliability. The flow rates for VOC and HCHO measurements were set at 50 mL/min and 250 mL/min, respectively. These flow rates were continually monitored using a digital flow meter (All-tech, Lexington, KY, USA), ensuring that fluctuations remained within the 5% range.
Our analytical arsenal was further bolstered by utilizing gas chromatography with mass spectrometry detection (GC/MSD) for VOC analysis. This state-of-the-art approach incorporated an HP-1 Capillary column (60 m × 0.32 mm × 5 μm) and adhered to rigorous analysis conditions. These conditions entailed maintaining the column temperature between 40 °C and 220 °C, maintaining a column flow rate of 1 mL/min, and sustaining a mass spectrometry detector (MSD) temperature of 230 °C.
HCHO analysis was performed using high-performance liquid chromatography (HPLC) with a C-18 column (3.9 × 300 mm) to ensure comprehensive analysis. The mobile phase consisted of acetonitrile and water in a precise ratio of 55:45, with detection conducted at a wavelength of 360 nm. The flow rate was methodically set at 1.0 mL/min, and each sample was injected using a consistent volume of 20 μL. The acetonitrile and water used in the analysis were procured from reputable suppliers to meet the highest analytical standards. These measurement sensors and analytical methods were thoughtfully selected for their exceptional precision and reliability, underscoring our unwavering commitment to ensuring the utmost accuracy in our data collection process.

2.4. Sample Collection and Analysis Method

The solid adsorption method used a stainless tube filled with 200 mg of Tenex-TA (60/80 mesh, Supelco, Bellefonte, PA, USA) to measure VOCs. For HCHO measurements, a purified 2,4-DNPH silica cartridge (Supelco, S10, Bellefonte, PA, USA) was utilized. A micro pump (Gilian, Pinellas County, FL, USA) with minimal flow fluctuations before and after measurements was utilized for VOC and HCHO measurements.
In the case of VOCs, a total volume of 1.5 L was measured over 30 min, with a flow rate of 50 mL/min. For HCHO measurements, a total volume of 7.5 L was measured over the same 30 min period at a flow rate of 250 mL/min. The flow rate before and after the measurement was assessed using a digital flow meter (Alltech, Lexington, KY, USA), ensuring that the variation in flow rate remained within 5%.
Before measurement, VOCs were thermally desorbed and conditioned using ATD-400 (Perkinelmer, Buckinghamshire, UK). After measurement, the VOC adsorption tube was securely sealed, protected from light, and stored in a cool and dark environment at temperatures below 4 °C until further analysis. The desorbed VOCs from the adsorption tube were separated using a BP-1 column as the stationary phase and detected using a mass spectrometry detector (MSD) (PerkinElmer, Buckinghamshire, UK). The following are the analysis conditions for GC/MSD (Table 3).
During the measurement of HCHO, certain factors, such as ozone, sunlight, and moisture, can interfere with the derivatization reaction of aldehydes. To mitigate the impact of ozone, an ozone scrubber (Waters, Milford, MA, USA) was employed at the front end of the 2,4-DNPH cartridge. Additionally, the influence of sunlight was deemed negligible, as it did not directly affect the measurement point. Following the measurement, the sample was carefully sealed, shielded from light using aluminum foil, and stored in a cool, dark environment below 4 °C. The sample was then fixed within a sample extractor, namely, the Vacuum Elution Rack (Supelco, Bellefonte, PA, USA), and filtered using an oil-soluble filter (47 mm diameter, 0.45 μm pore size, PTFE), employing HPLC-grade acetonitrile (JTbaker, Phillipsburg, NJ, USA) solution. A volume of 5 mL was extracted for analysis. Sample analysis was conducted using high-performance liquid chromatography (HPLC). The following outlines the analysis conditions for HCHO (Table 4).

3. Results

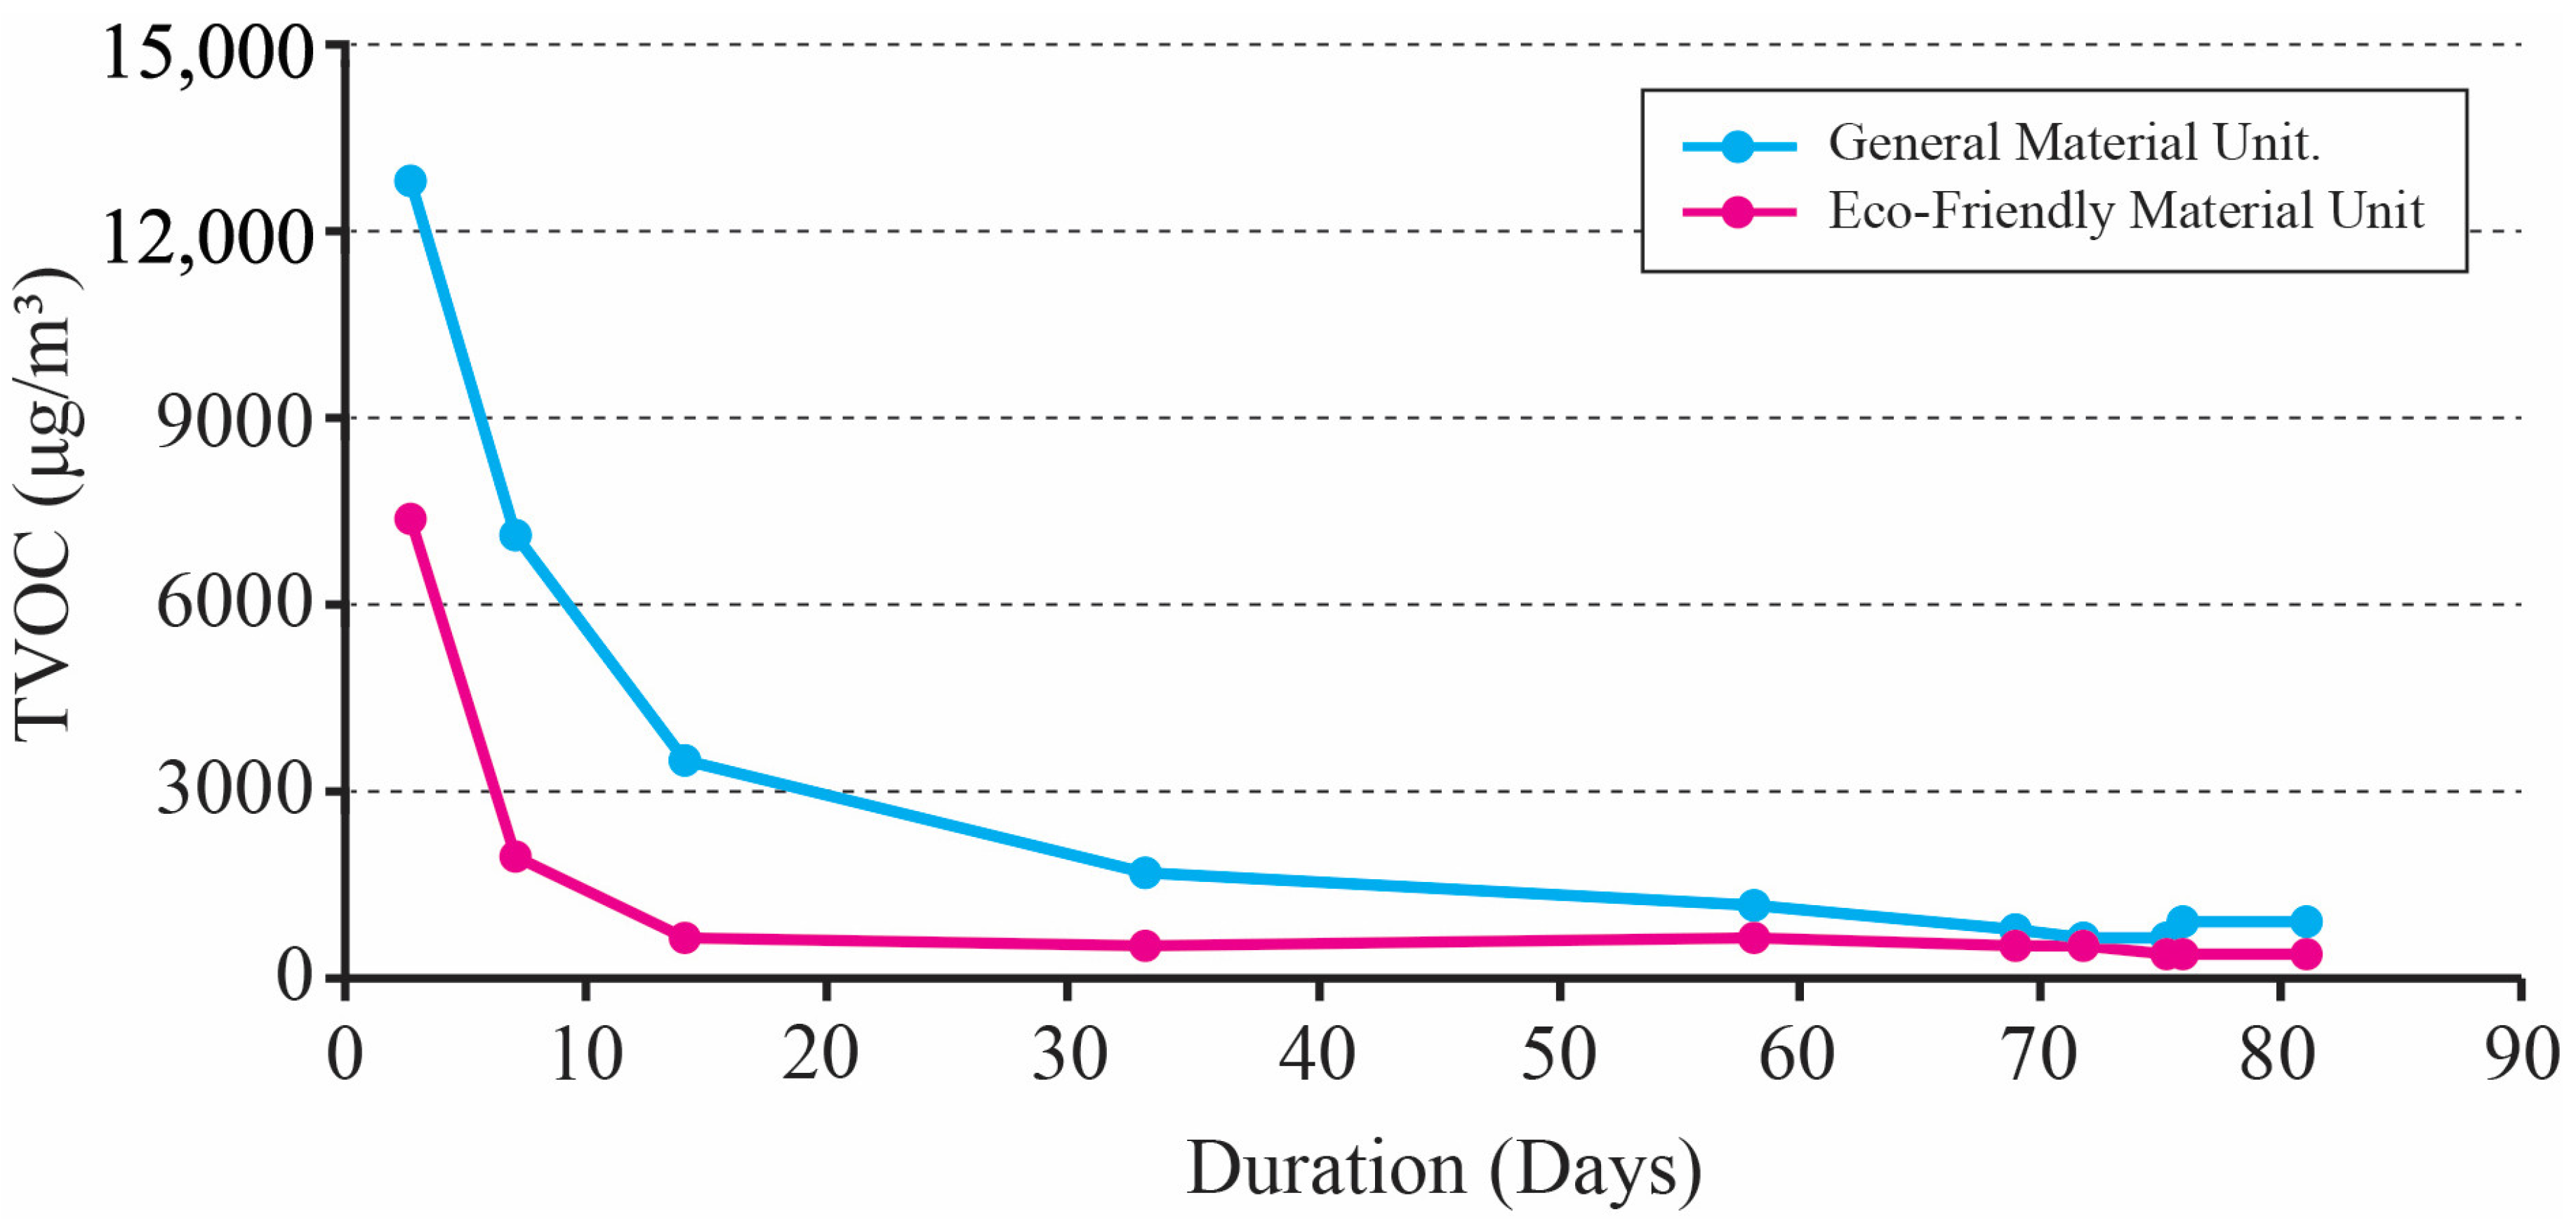
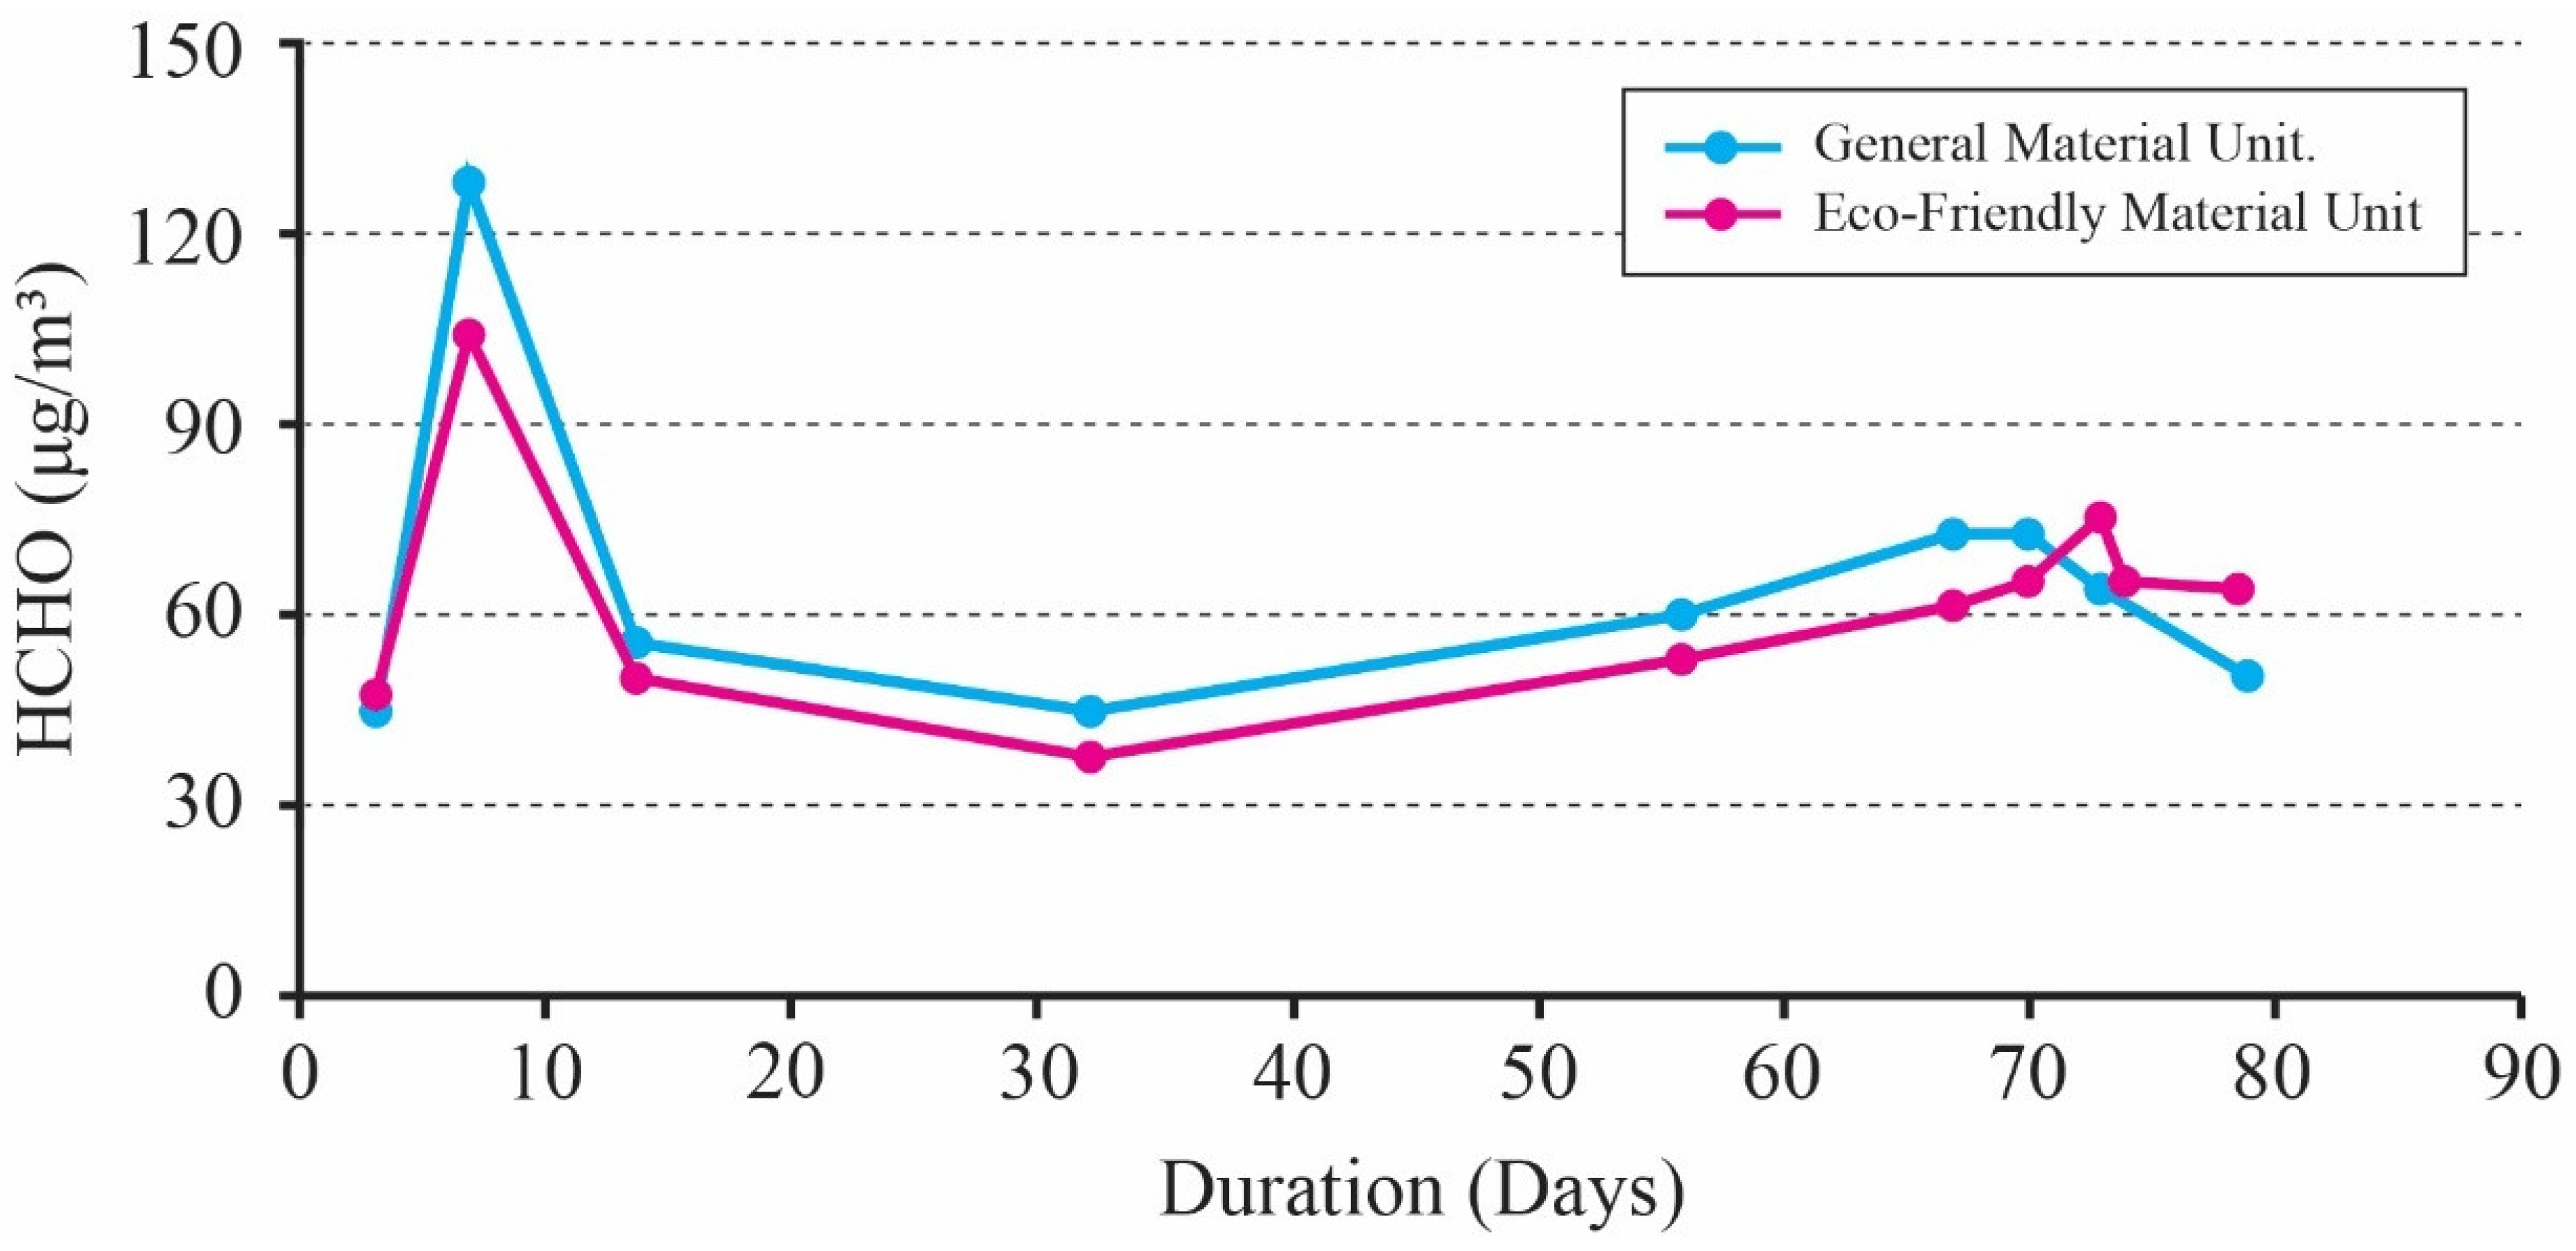
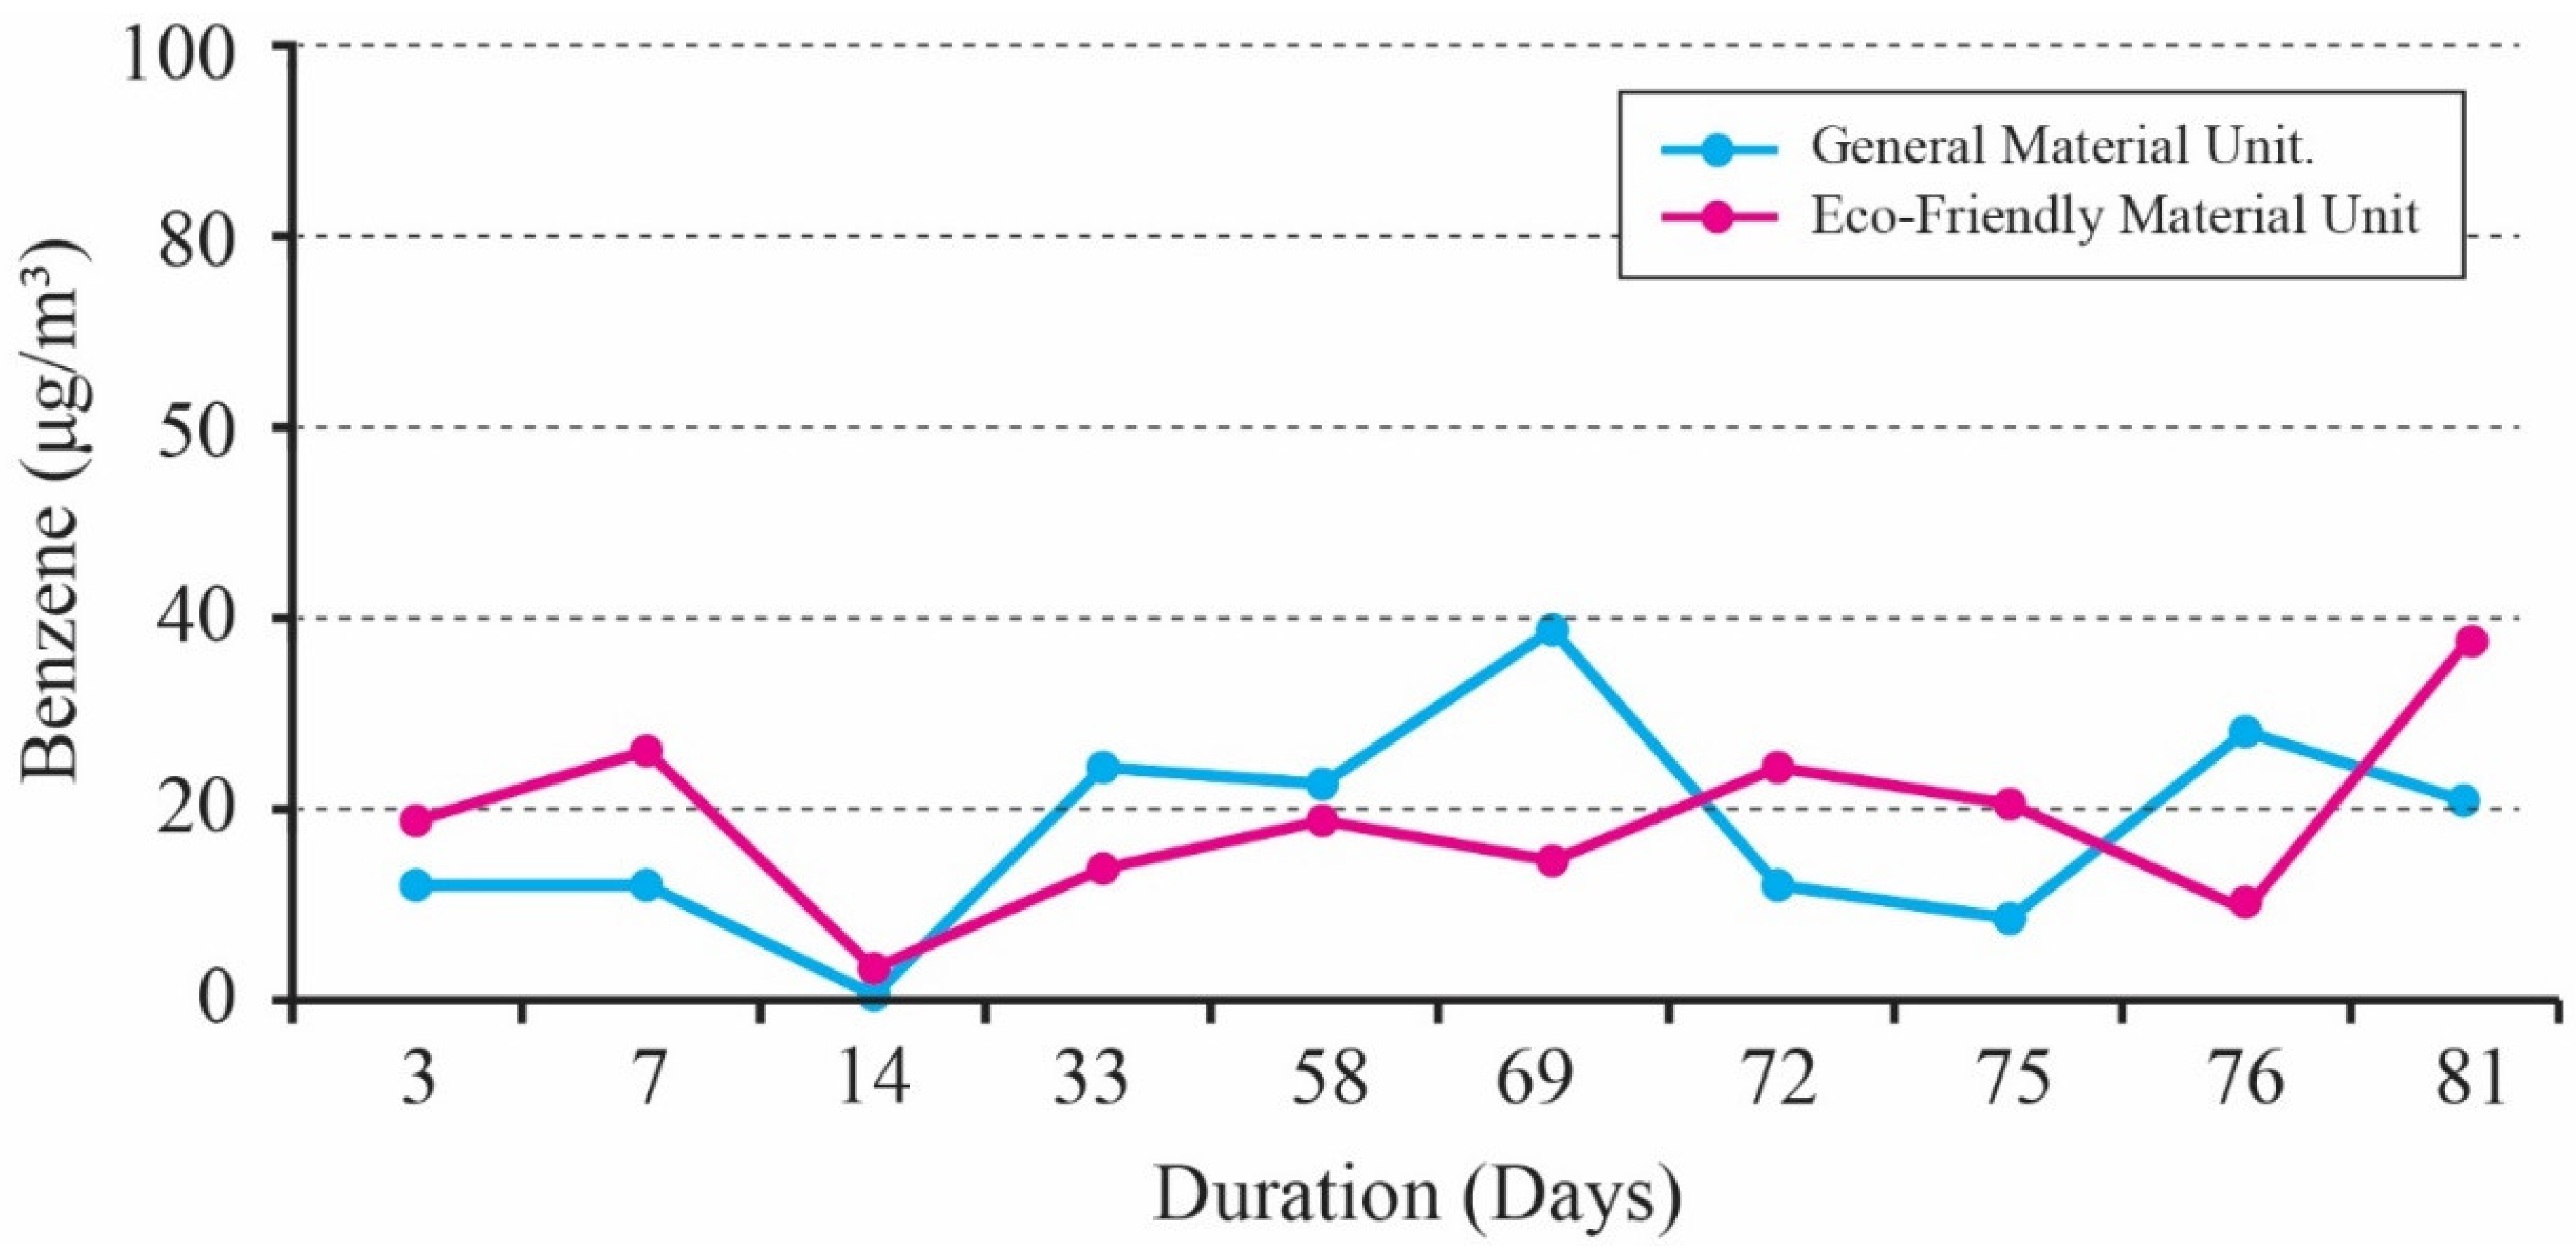
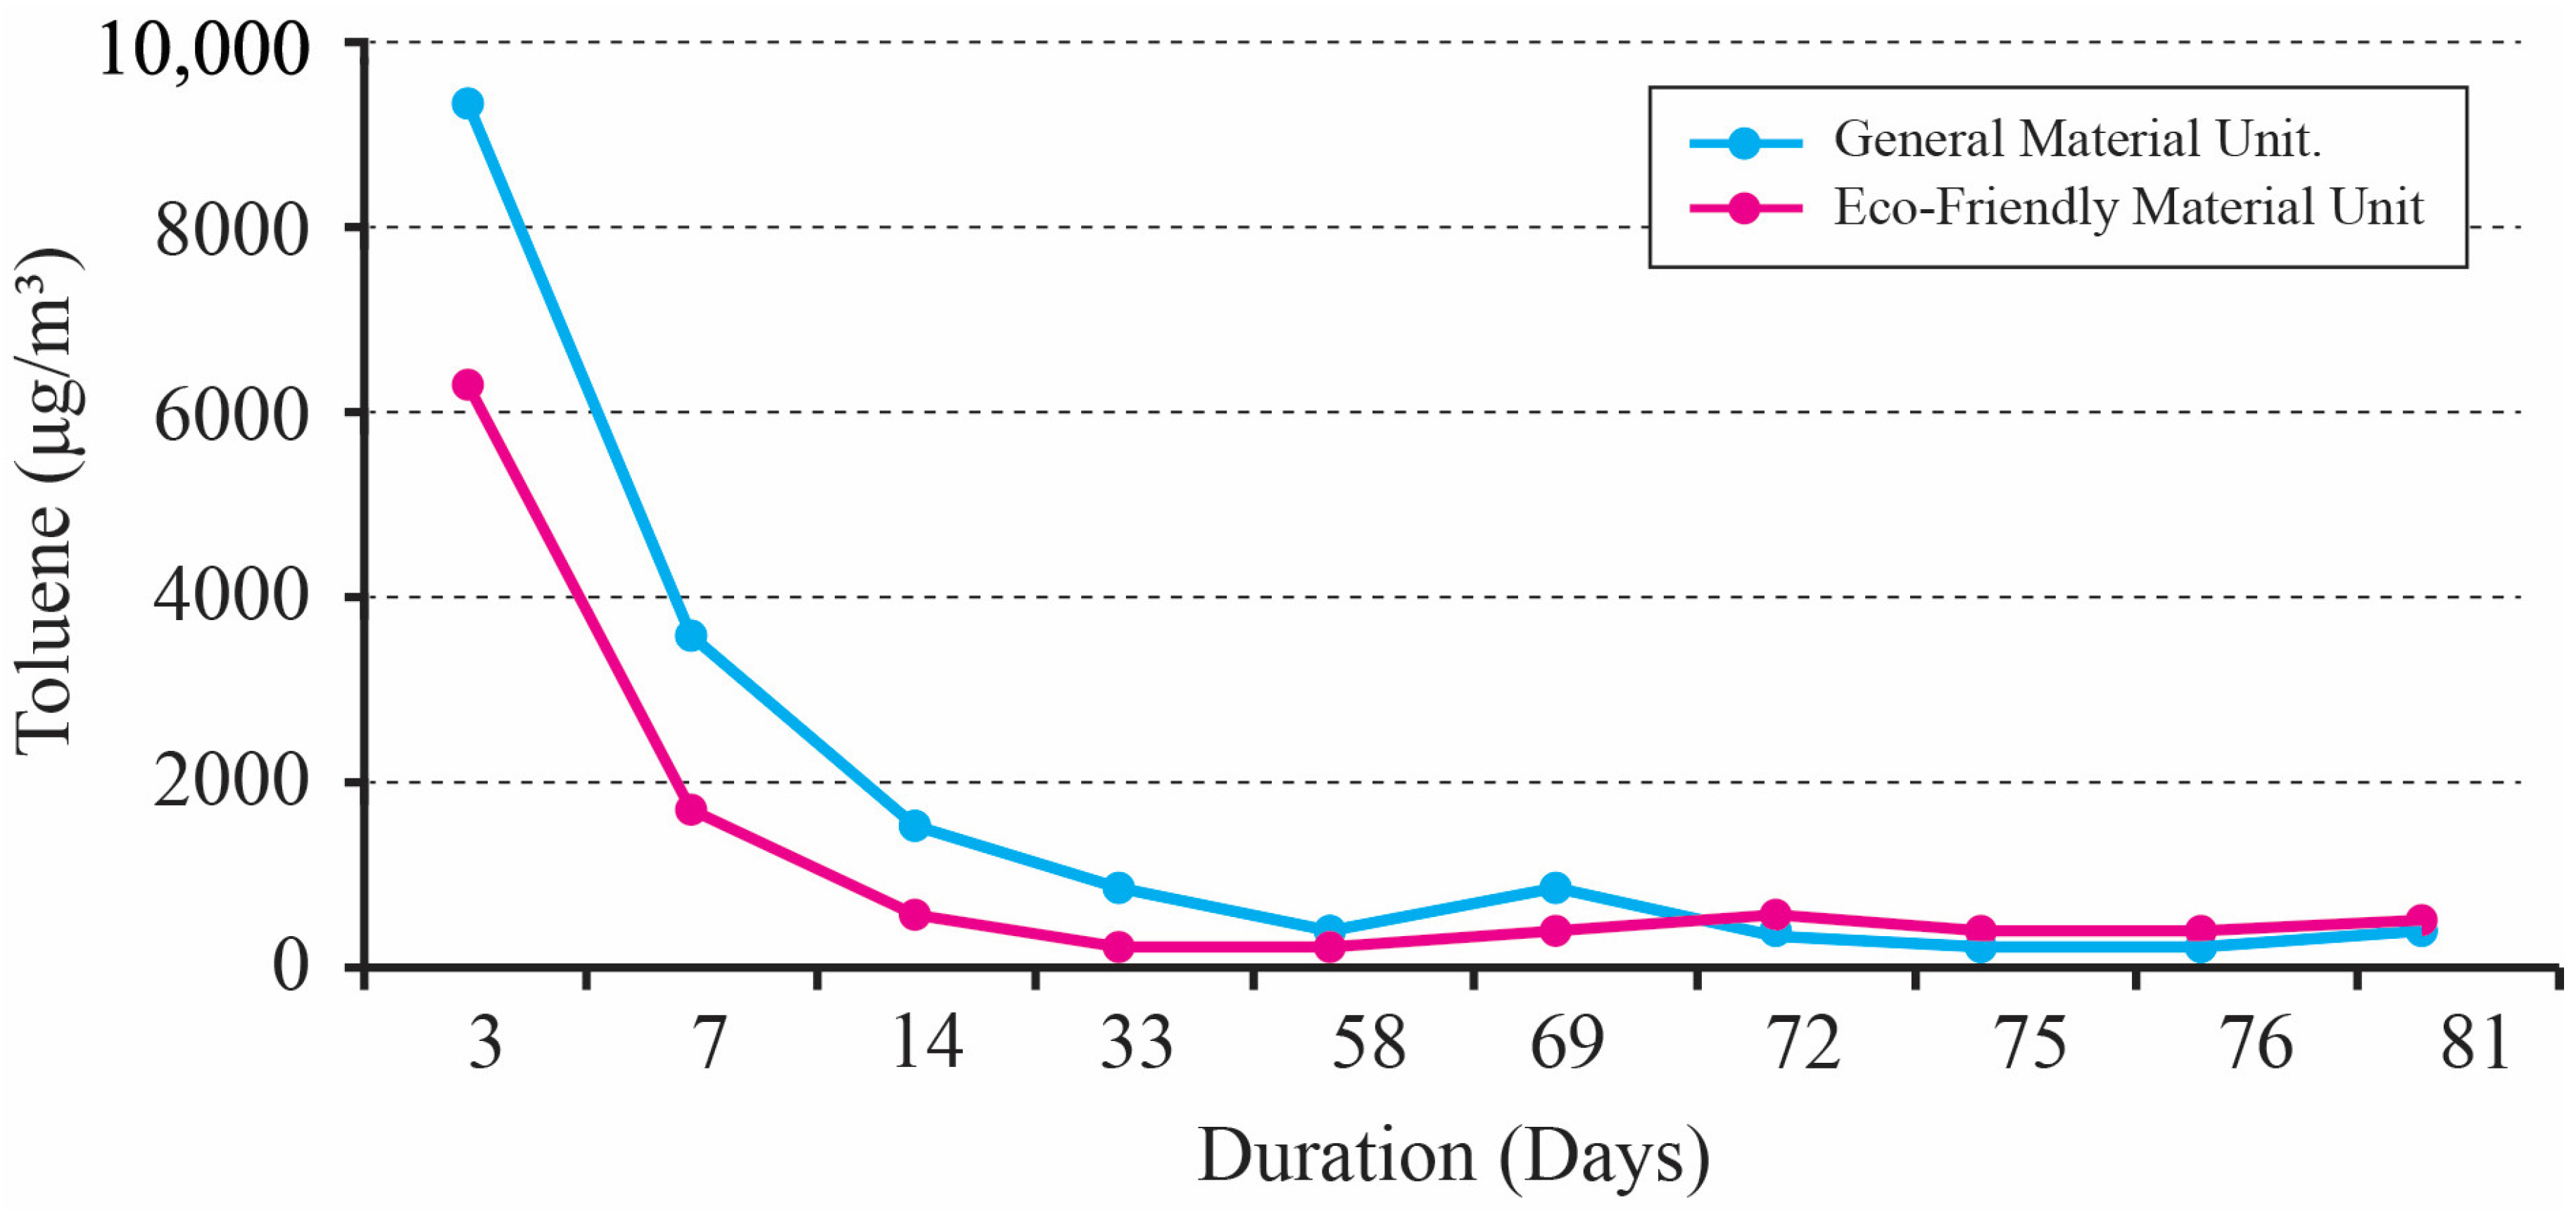
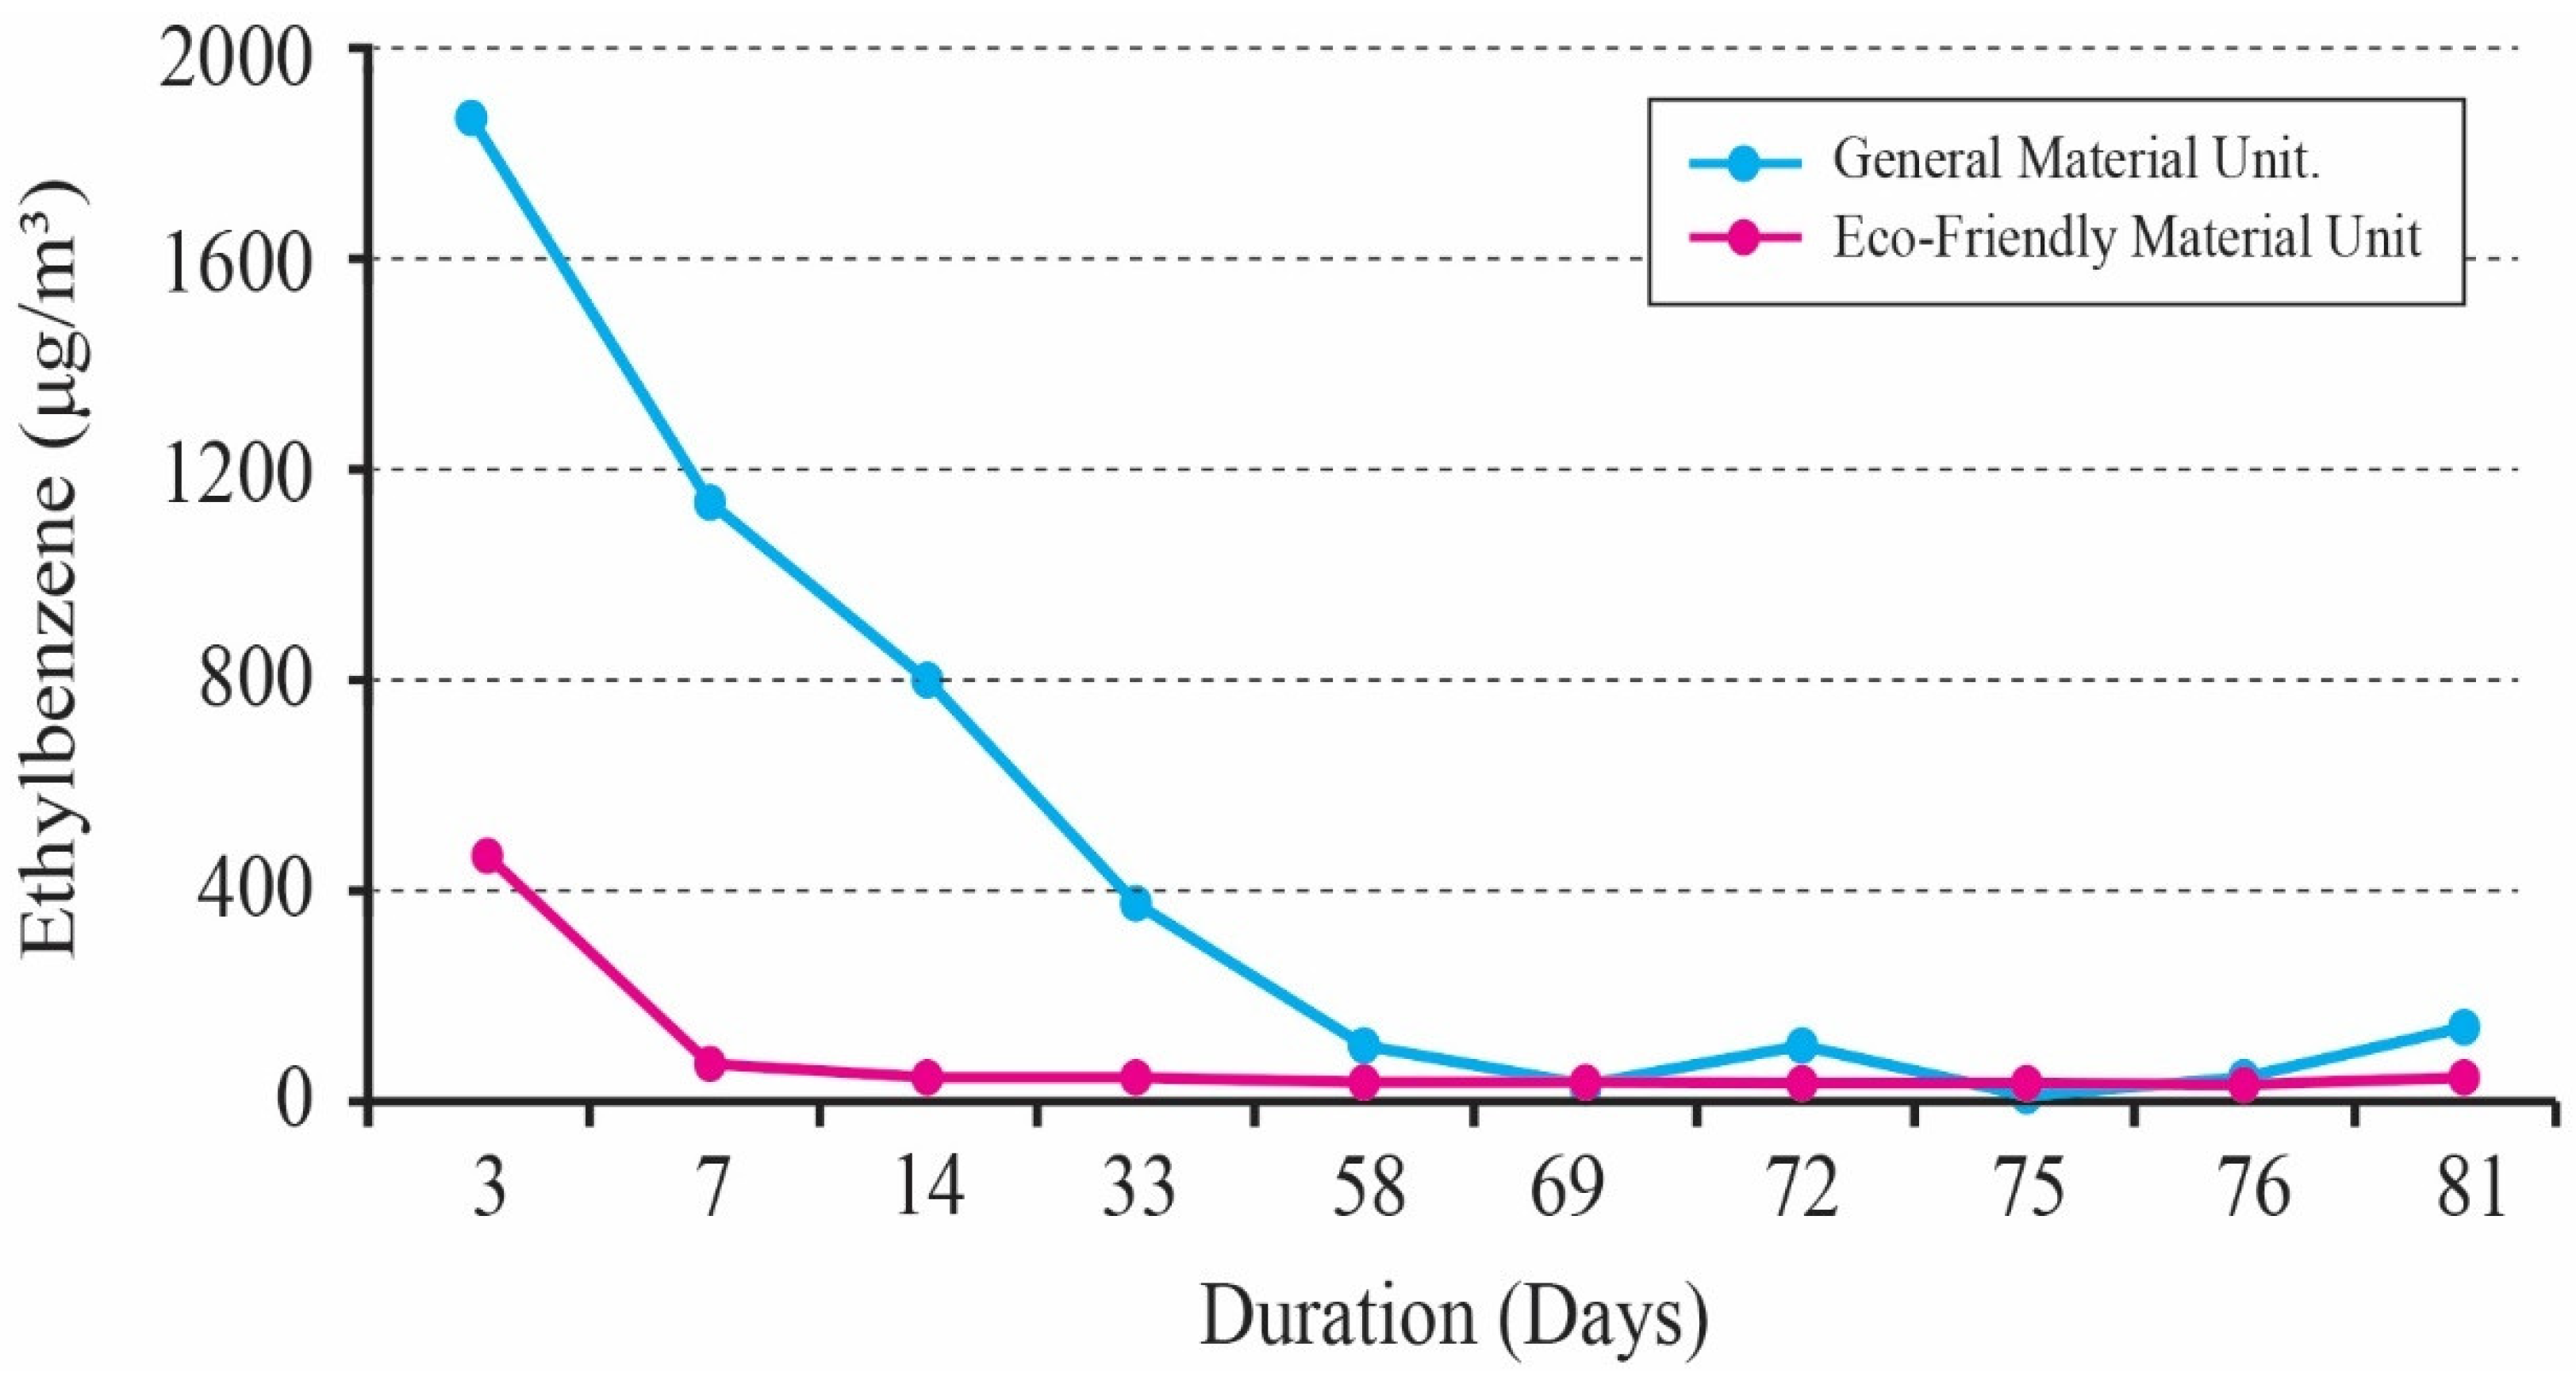
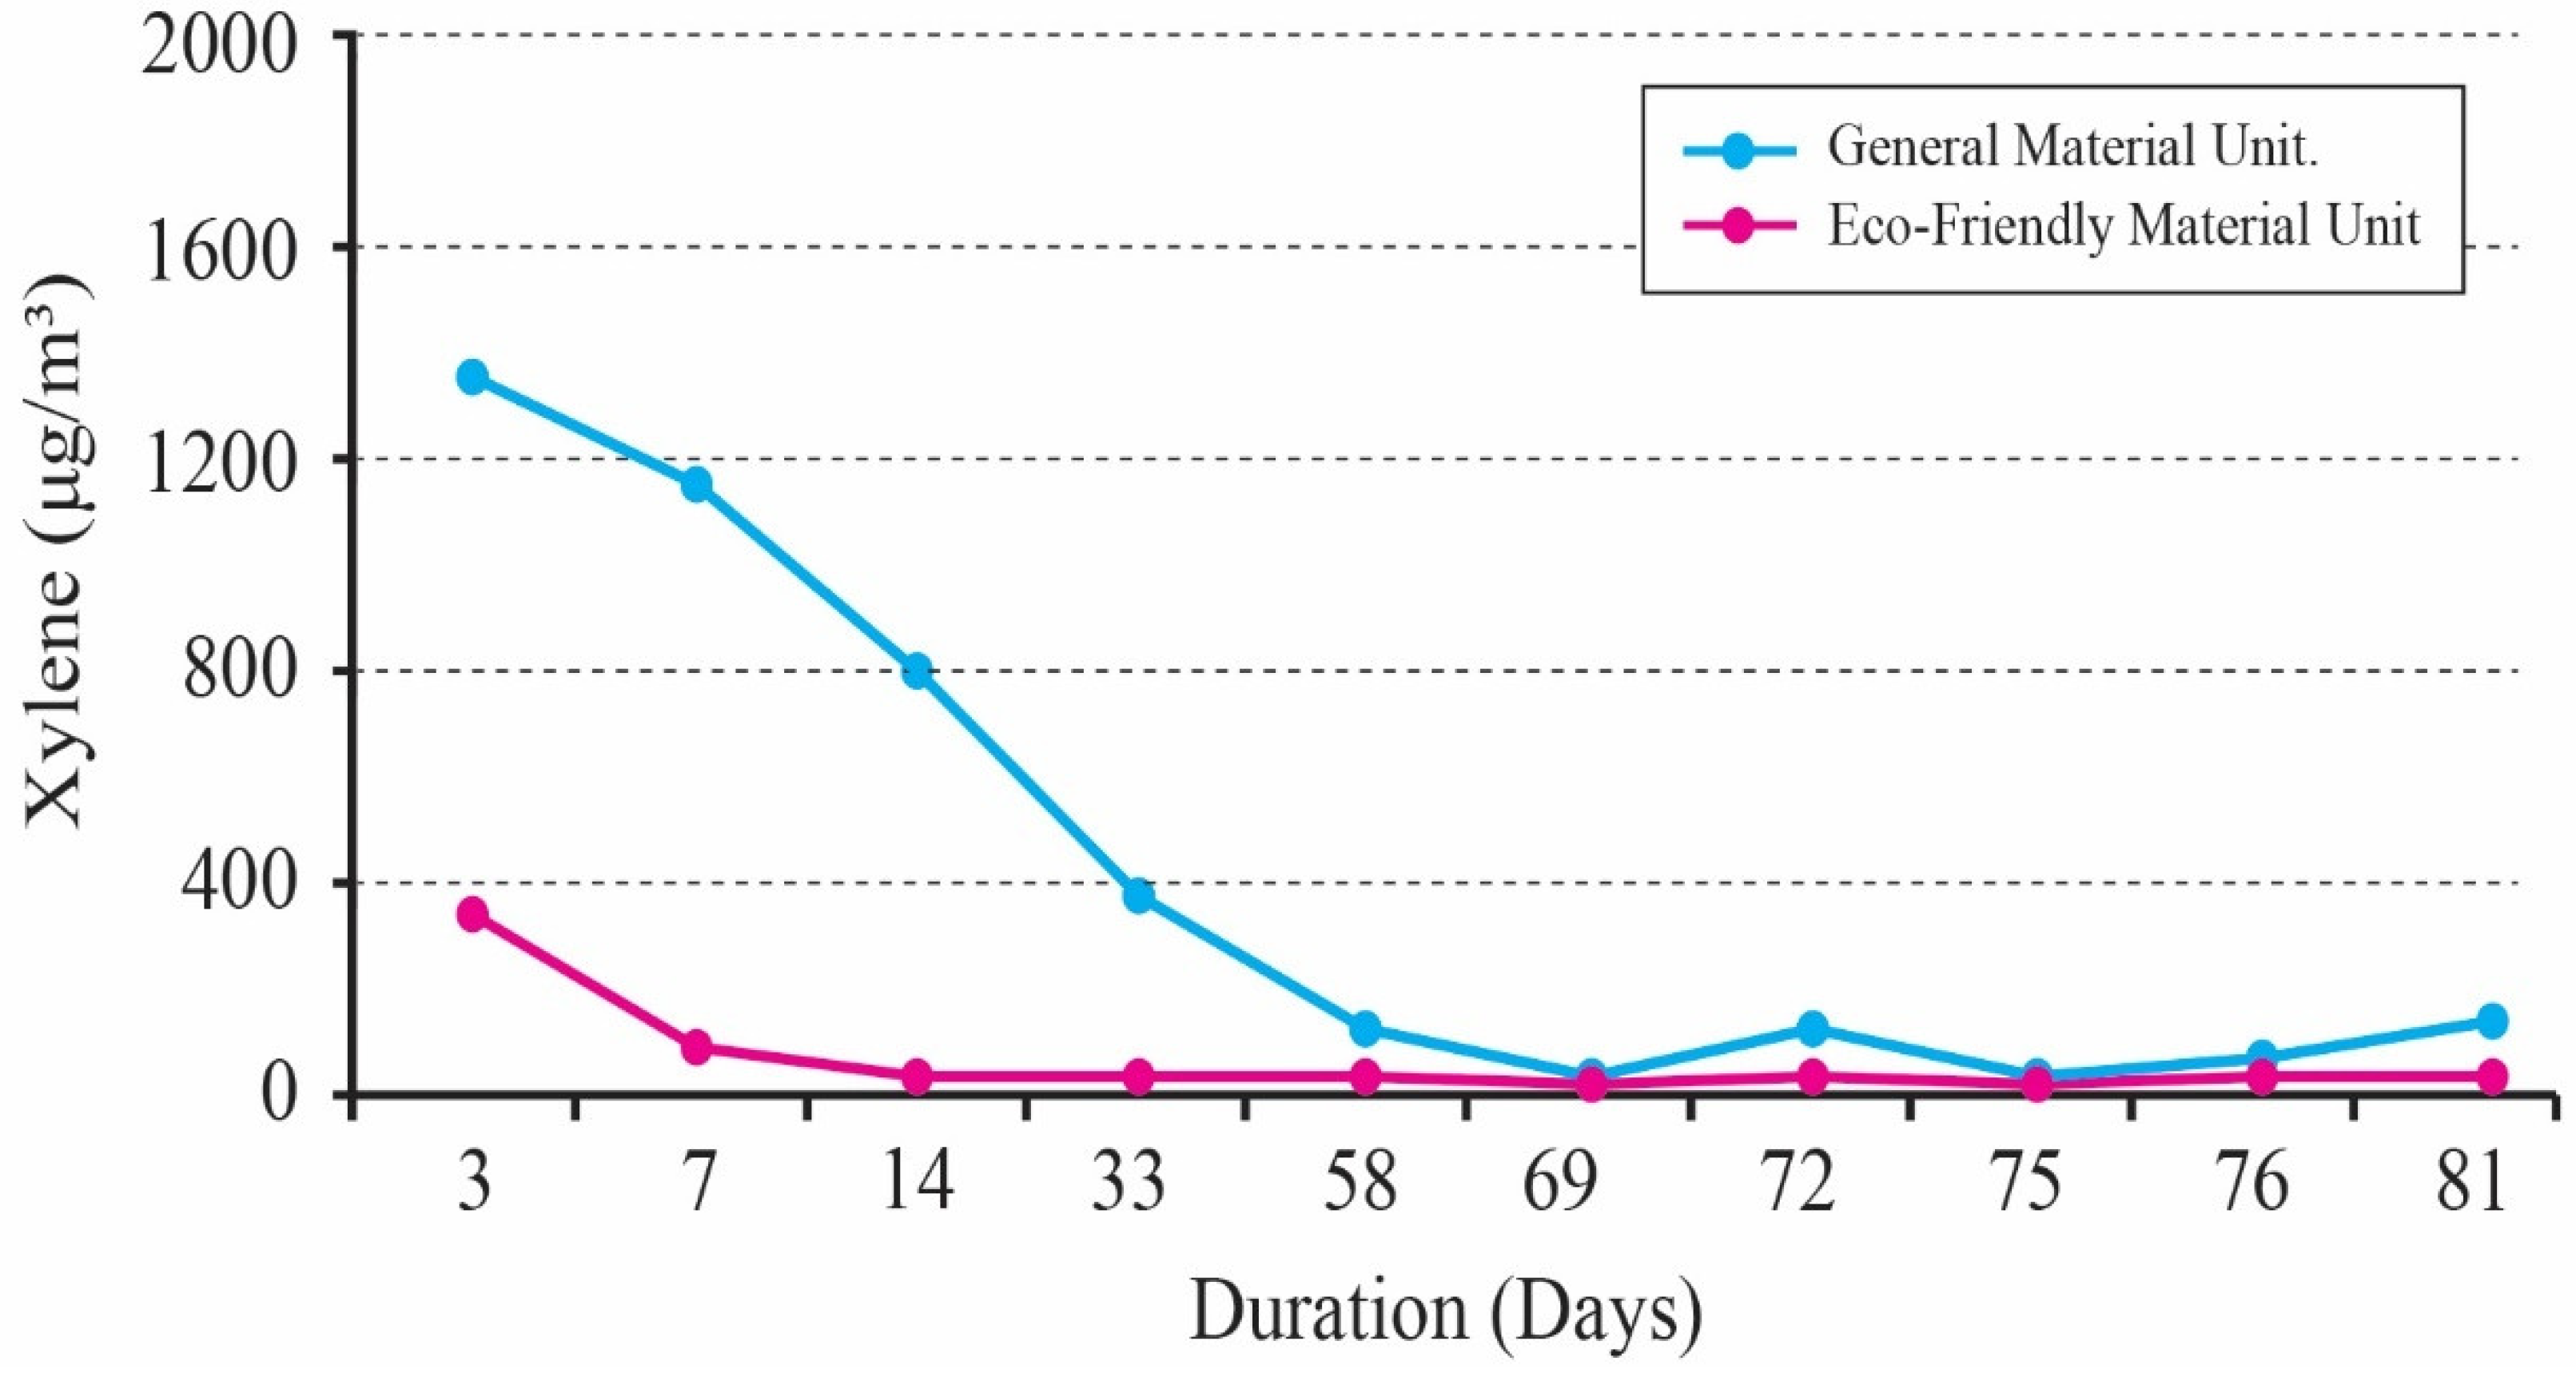
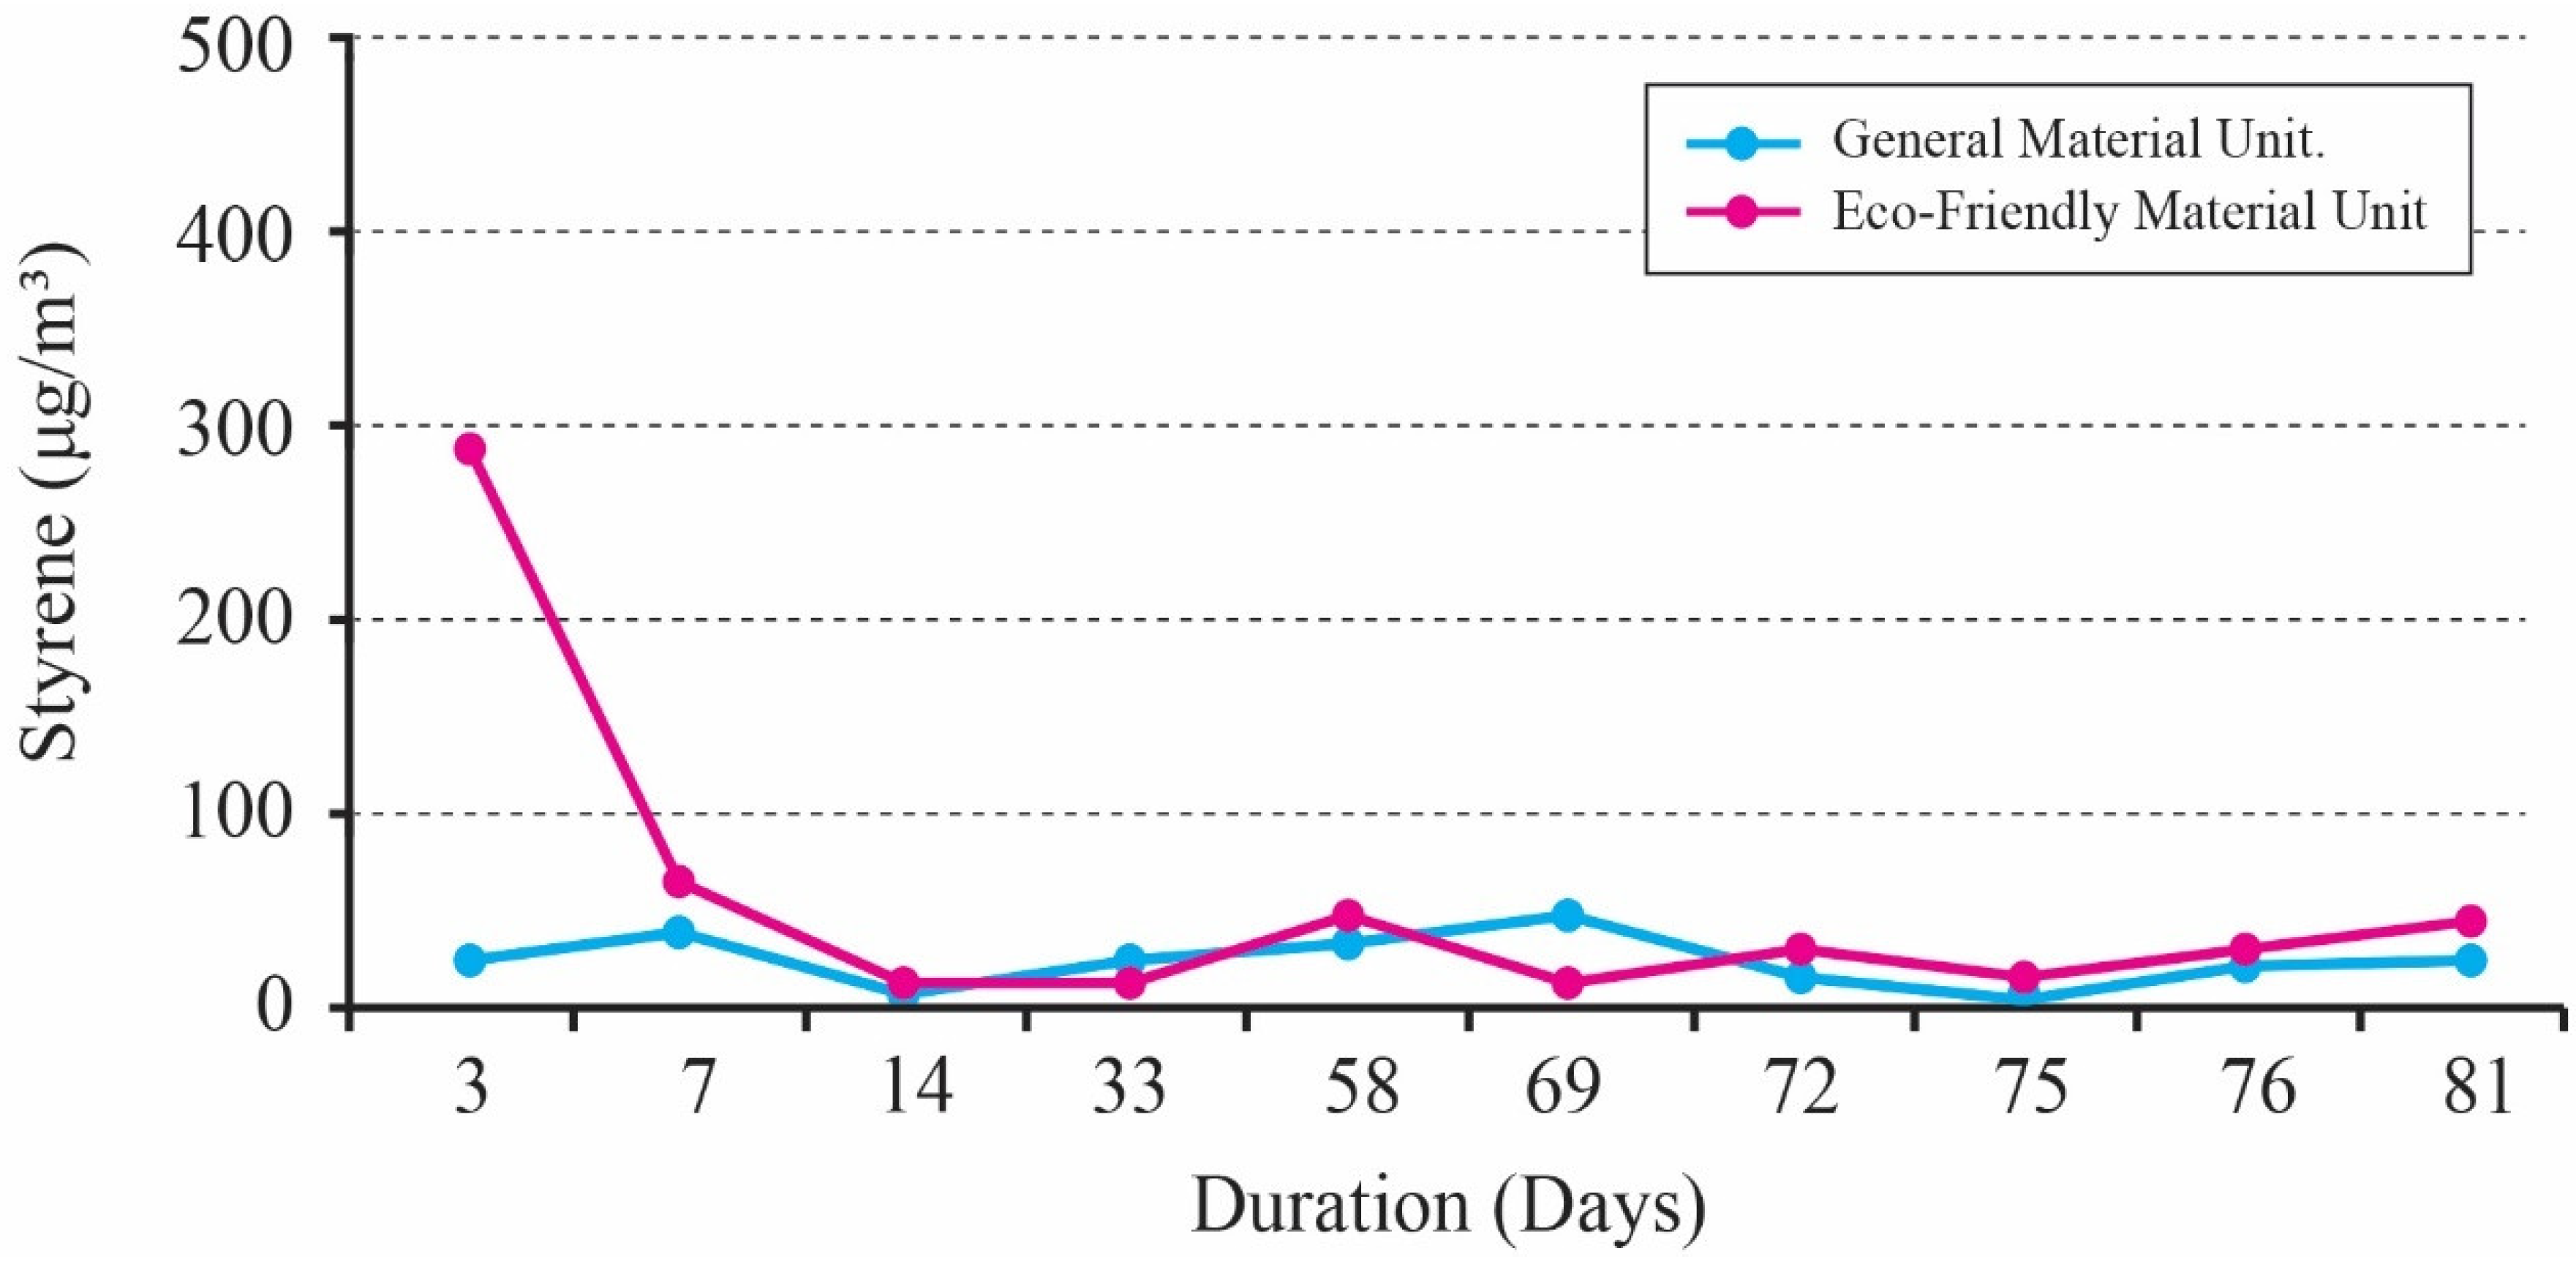
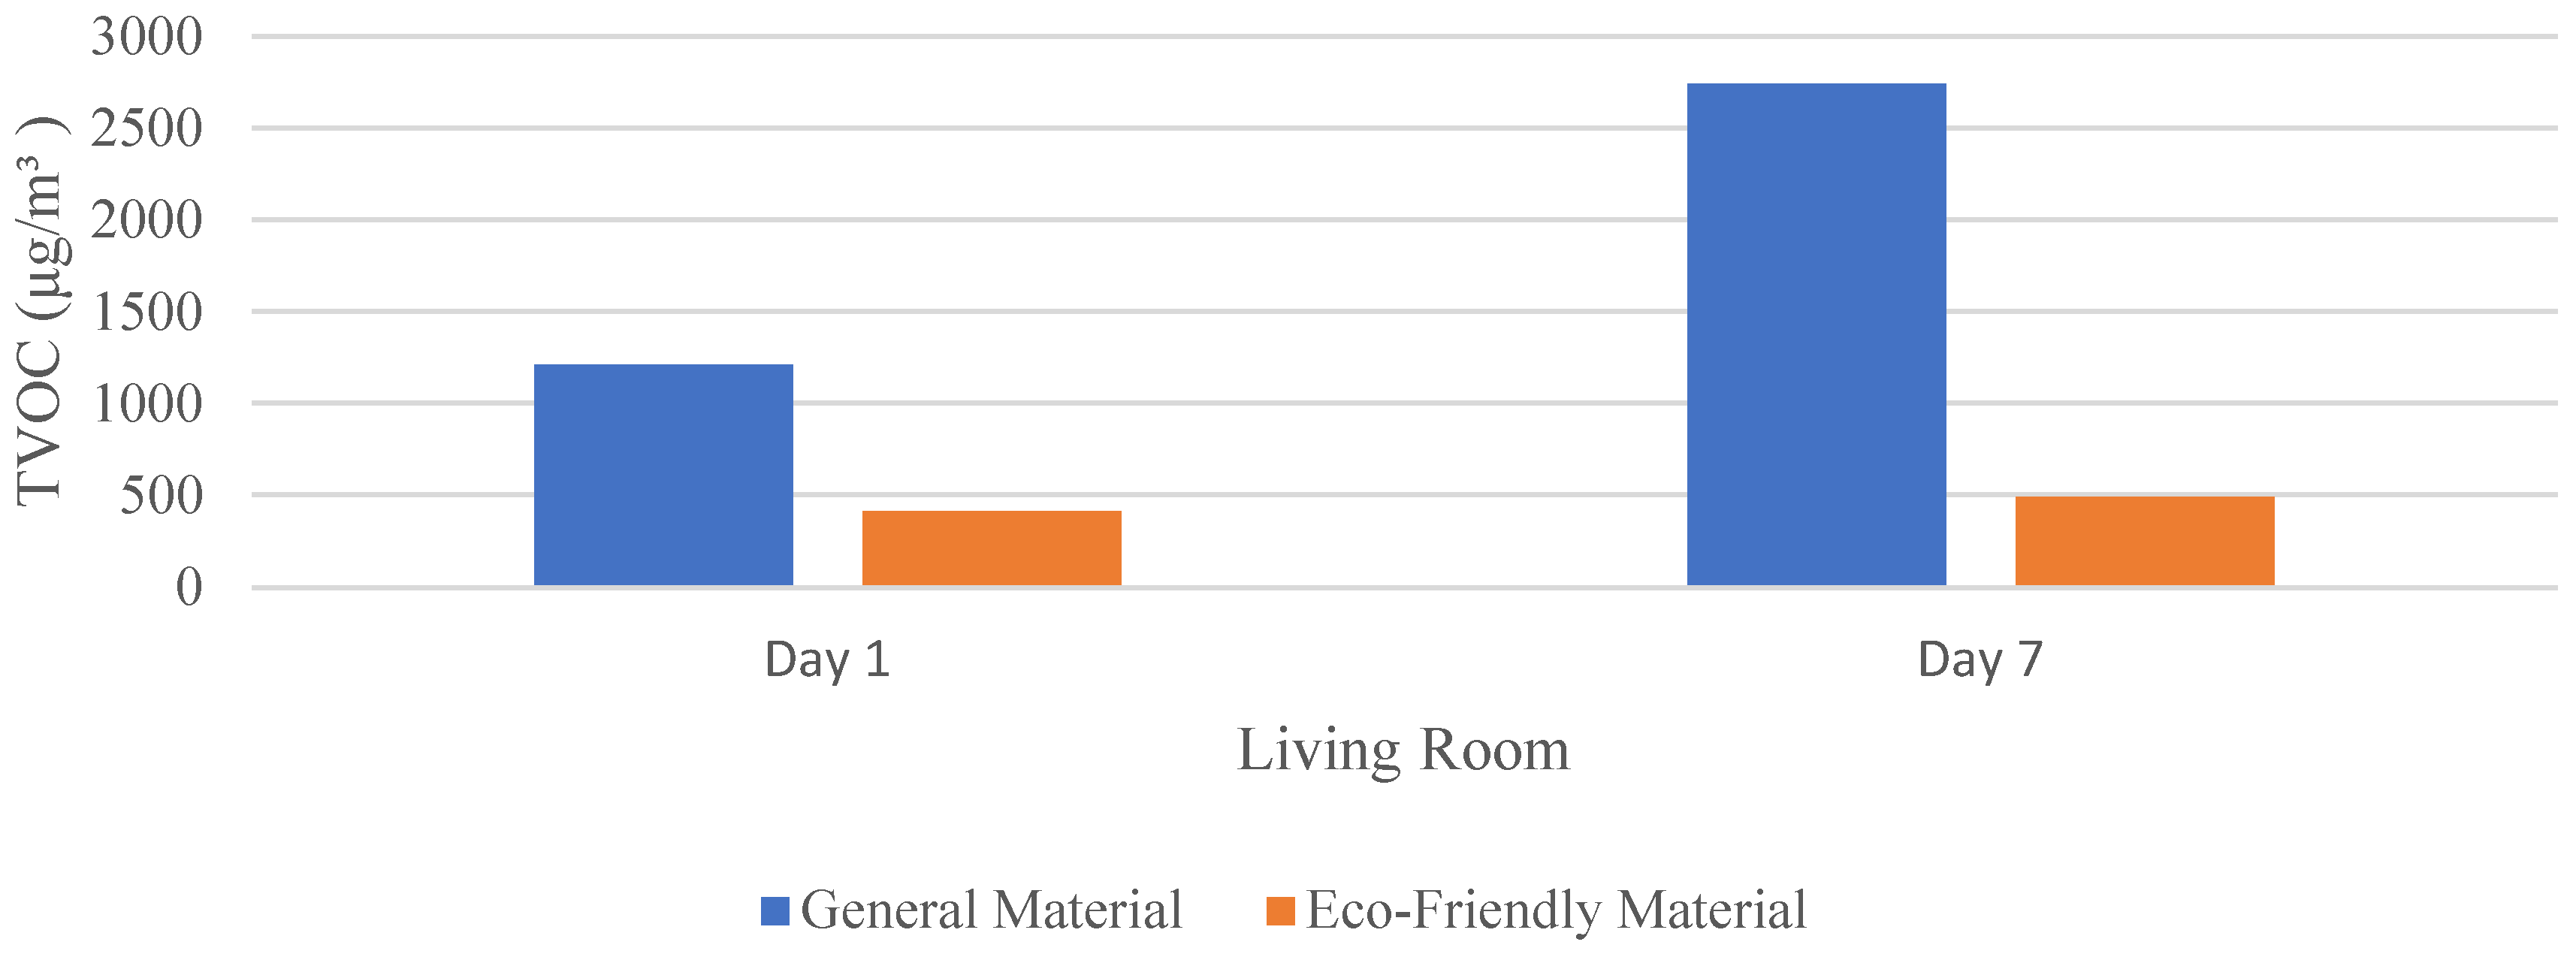
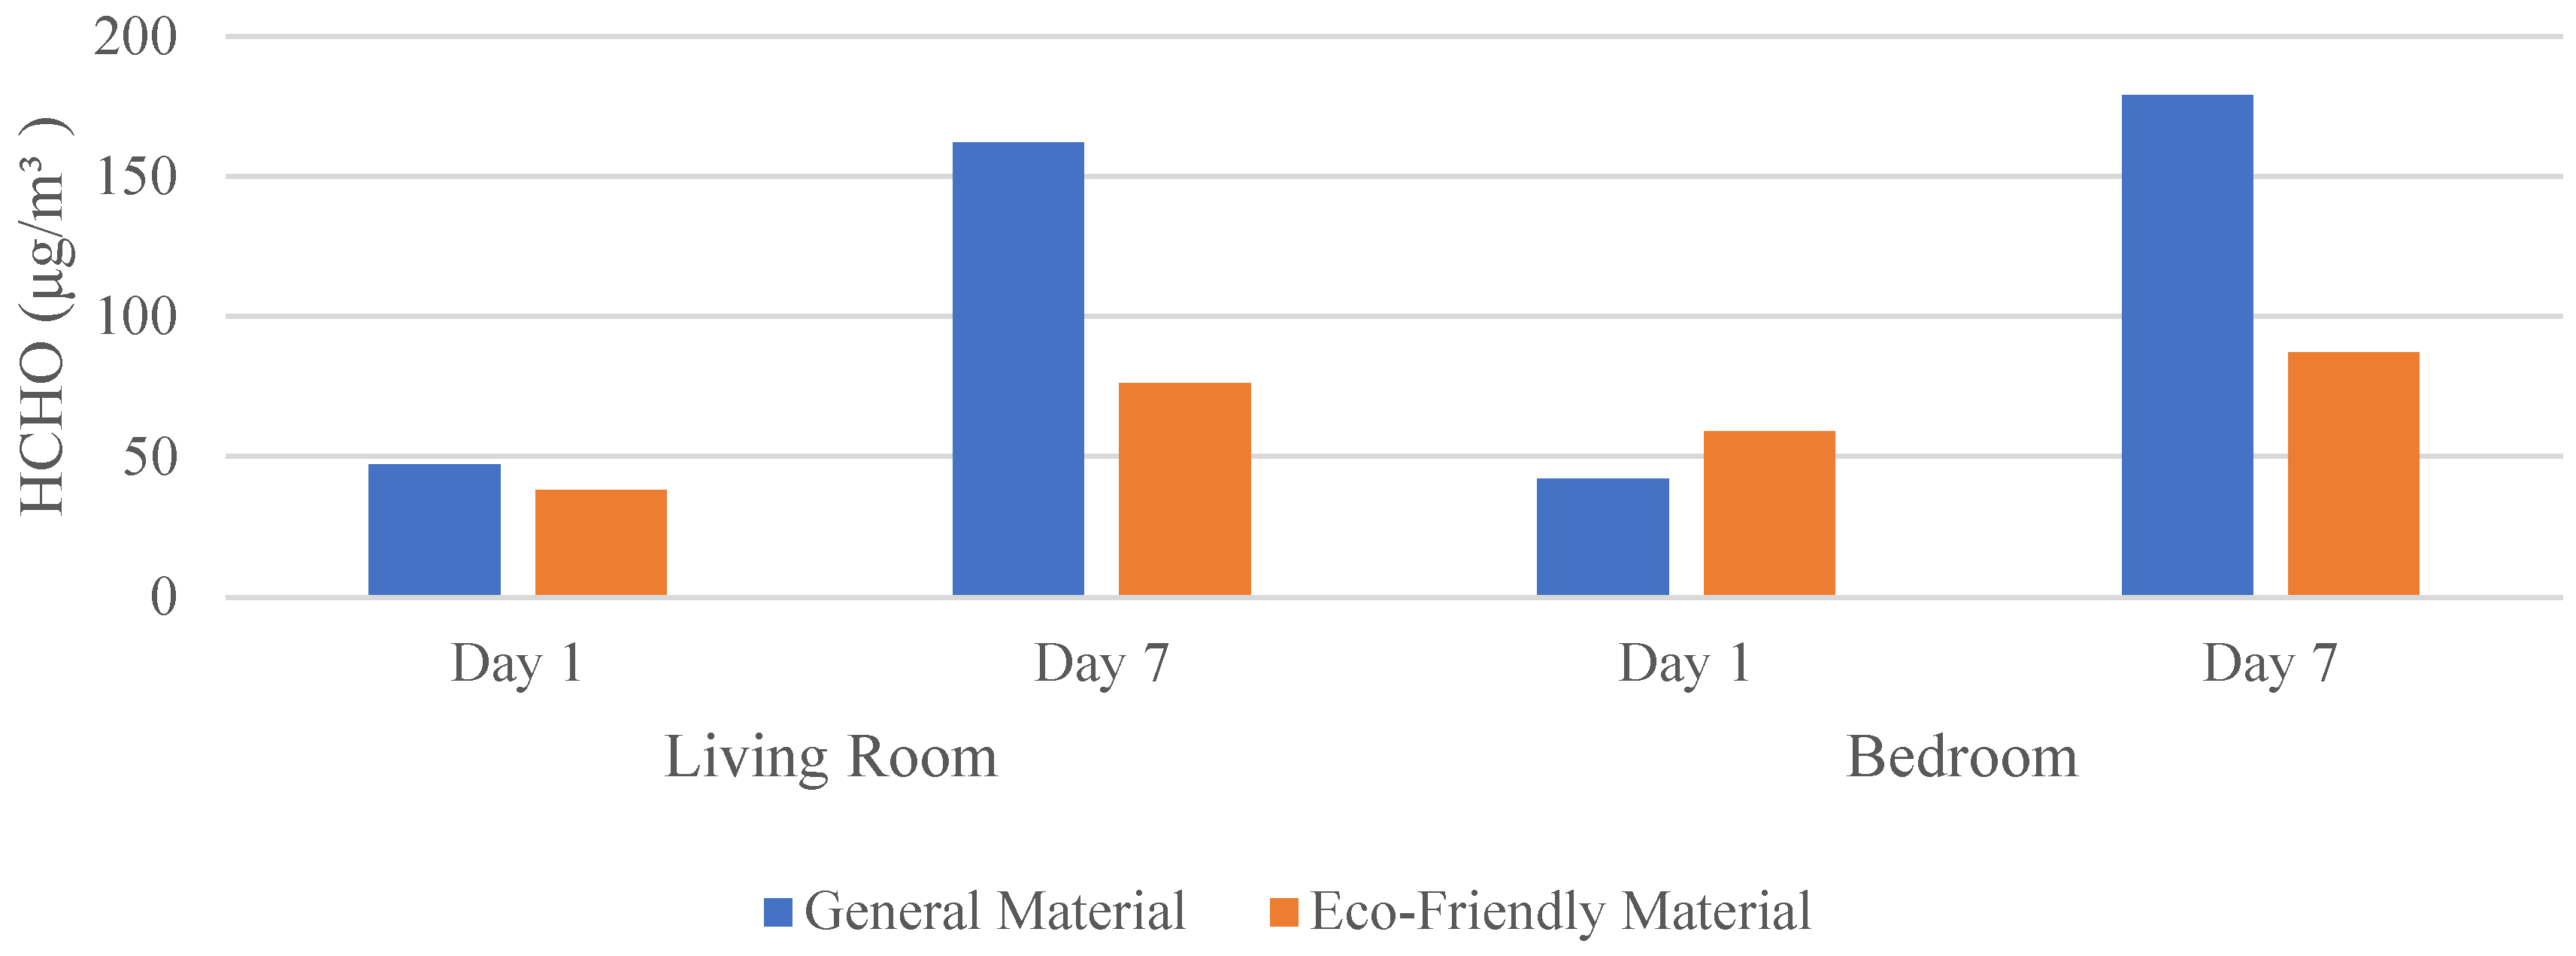
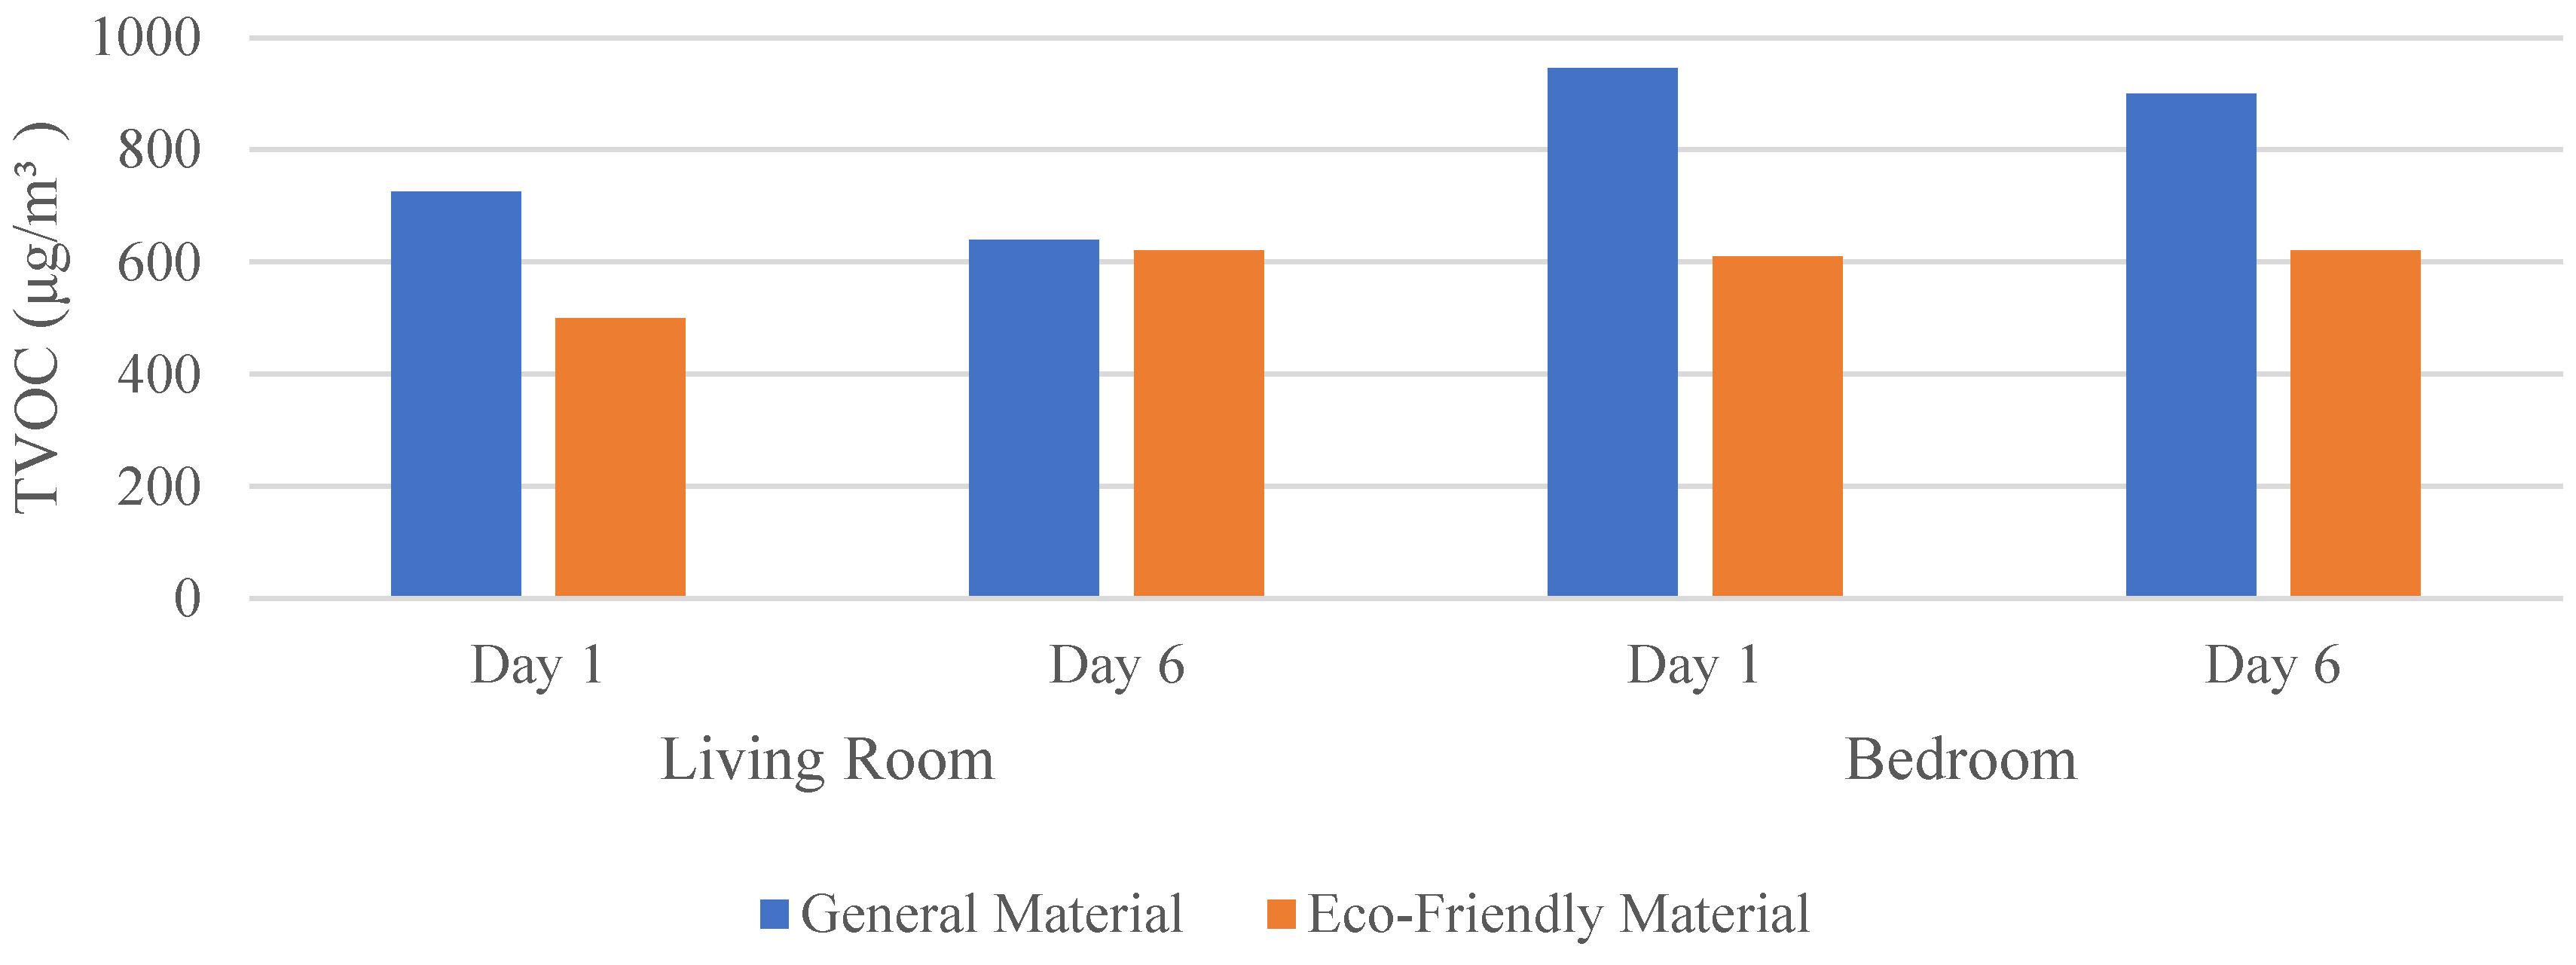
3.1. Comparison of VOC and HCHO Emission Concentrations over Time between General and Eco-Friendly Material

The findings of this experiment elucidate the concentration changes over time in the living rooms of experimental units 4A and 6B. Figure 3 and Figure 4 present the long-term variations in TVOC and HCHO concentrations for both the eco-friendly and general material units.
The initial TVOC concentration in the general material unit was approximately 1.7 times higher than in the eco-friendly material unit. However, it exhibited a decreasing trend over time, indicating a high initial emission of pollutants that gradually diminished. Conversely, in the eco-friendly material unit, the TVOC concentration dropped below 1000 μg/m3 after 14 days of construction and remained stable even after several tens of days.
In contrast, it took 69 days of construction for the concentration of the general material unit to fall below 1000 μg/m3. The TVOC concentration in the general material unit was consistently lower than in the eco-friendly material unit, but it required more than 50 days to achieve such levels. Figure 3 illustrates a similar trend in TVOC emission concentration between the general and eco-friendly material units after several construction days have elapsed. Considering these observations, the application of eco-friendly materials proves effective in ensuring a more comfortable indoor air quality for residents when moving in, especially considering the typical occupancy timeline of 30 days after the completion of interior finishing materials.
Unlike TVOC, the maximum peak of HCHO emission concentration occurred on the seventh day, reaching 126 μg/m3 in the general material unit. It is important to note that HCHO concentrations may exhibit fluctuations depending on indoor temperature and humidity conditions. However, in this experimental setting, temperature fluctuations were minimal due to the consistent indoor temperature of 23 ± 1 °C maintained throughout the experiment (Figure 4). Nevertheless, it is worth mentioning that although the room temperature controller in the living room was set at 25 °C, the measured air temperature in the central breathing area of the living room was approximately 2 °C lower.
Upon analyzing the temporal variations in indoor concentrations of major individual volatile organic compounds (VOCs), it was observed that most substances exhibit a similar declining trend as that of the total volatile organic compounds (TVOC) (Figure 5, Figure 6, Figure 7, Figure 8 and Figure 9). Notably, toluene has substantial emission levels and a decreasing pattern that is remarkably comparable to TVOC (Figure 6). However, benzene showcases a distinct behavior with low initial emission levels, displaying a cyclic pattern of fluctuations over time. In all cases, except for benzene, the initial emission levels (60 days before the start of the experiment) are considerably higher in general materials compared to eco-friendly materials, indicating a significant disparity. Therefore, eco-friendly materials are effective in mitigating initial emissions [53].

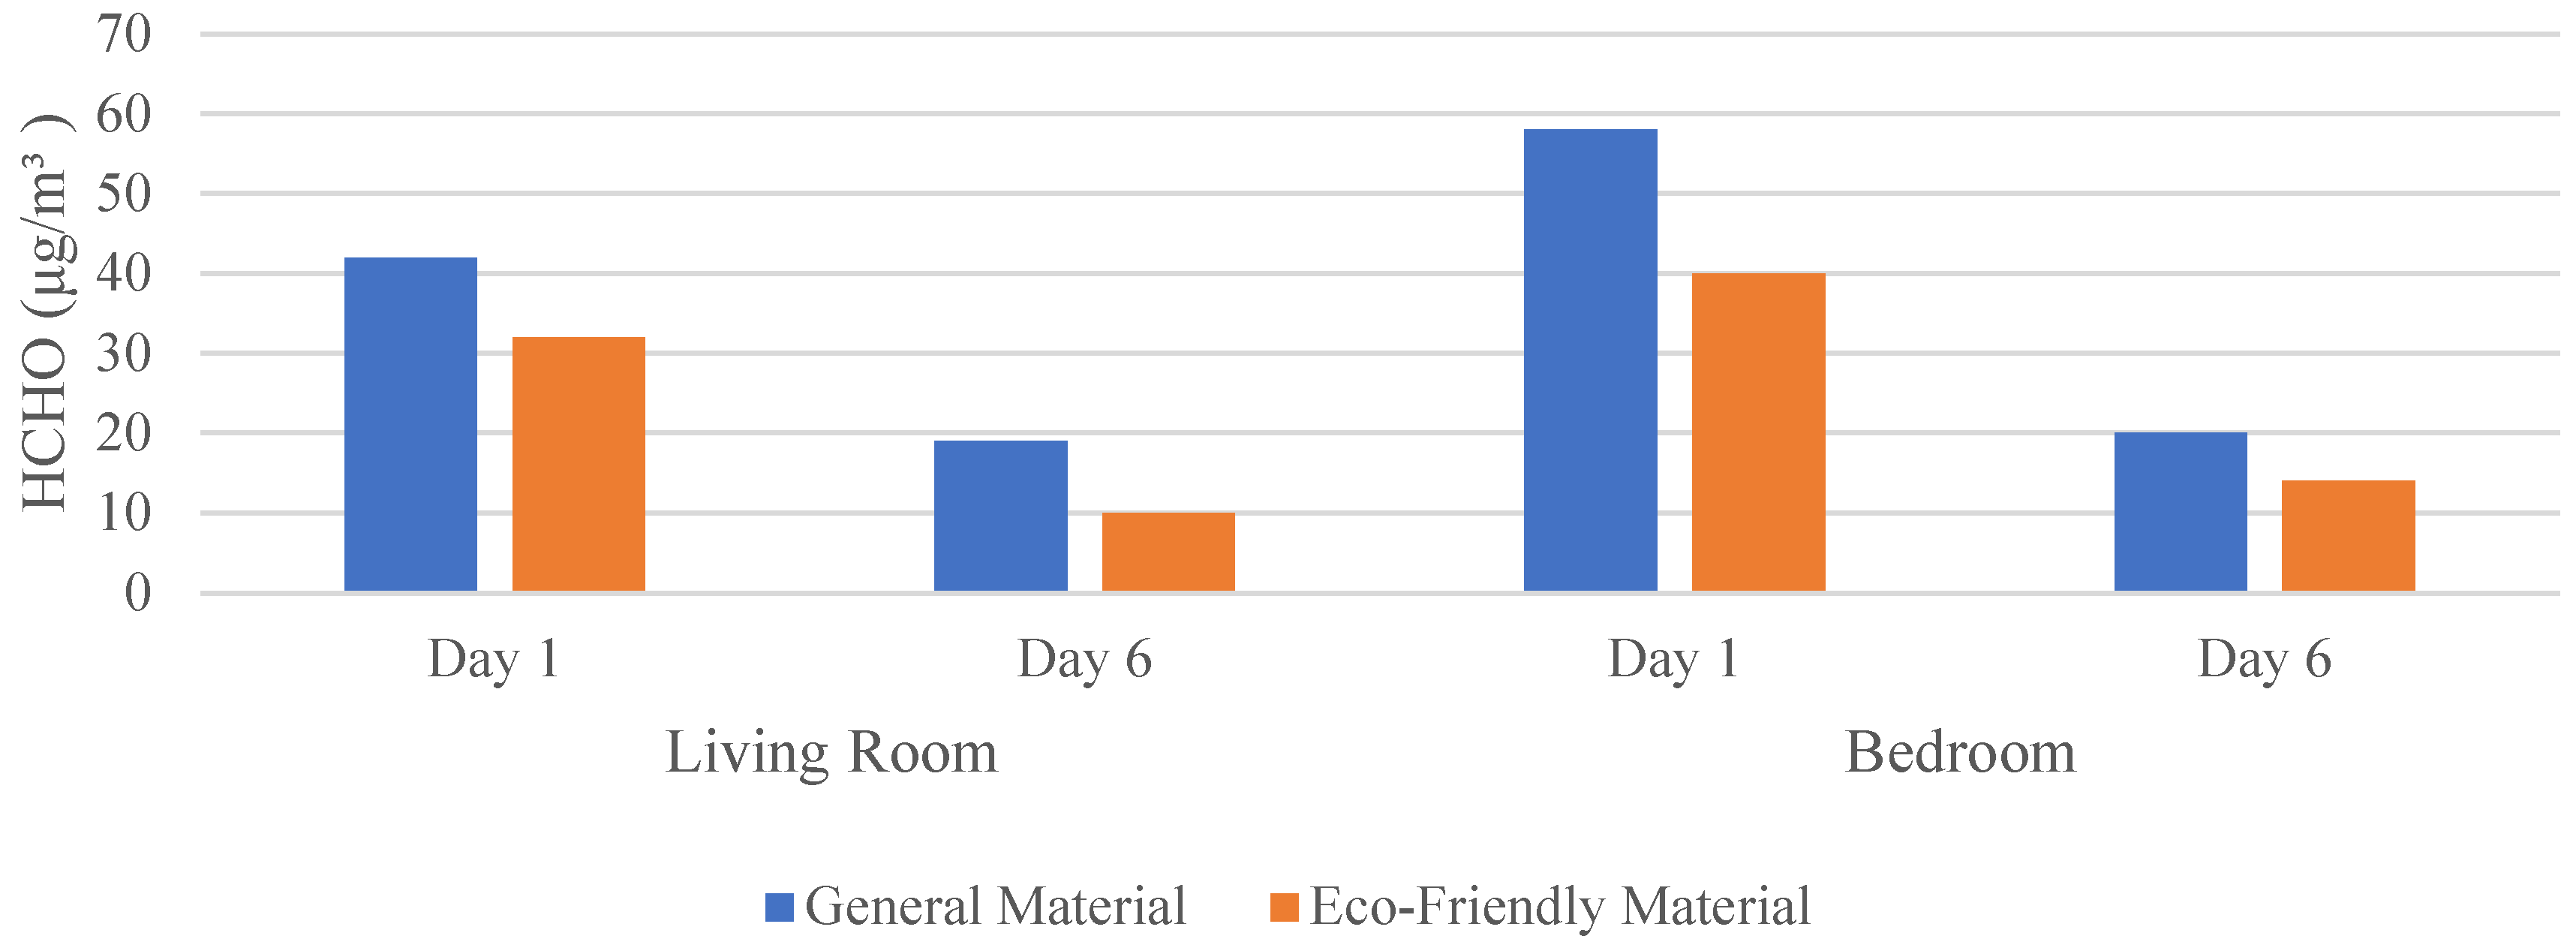
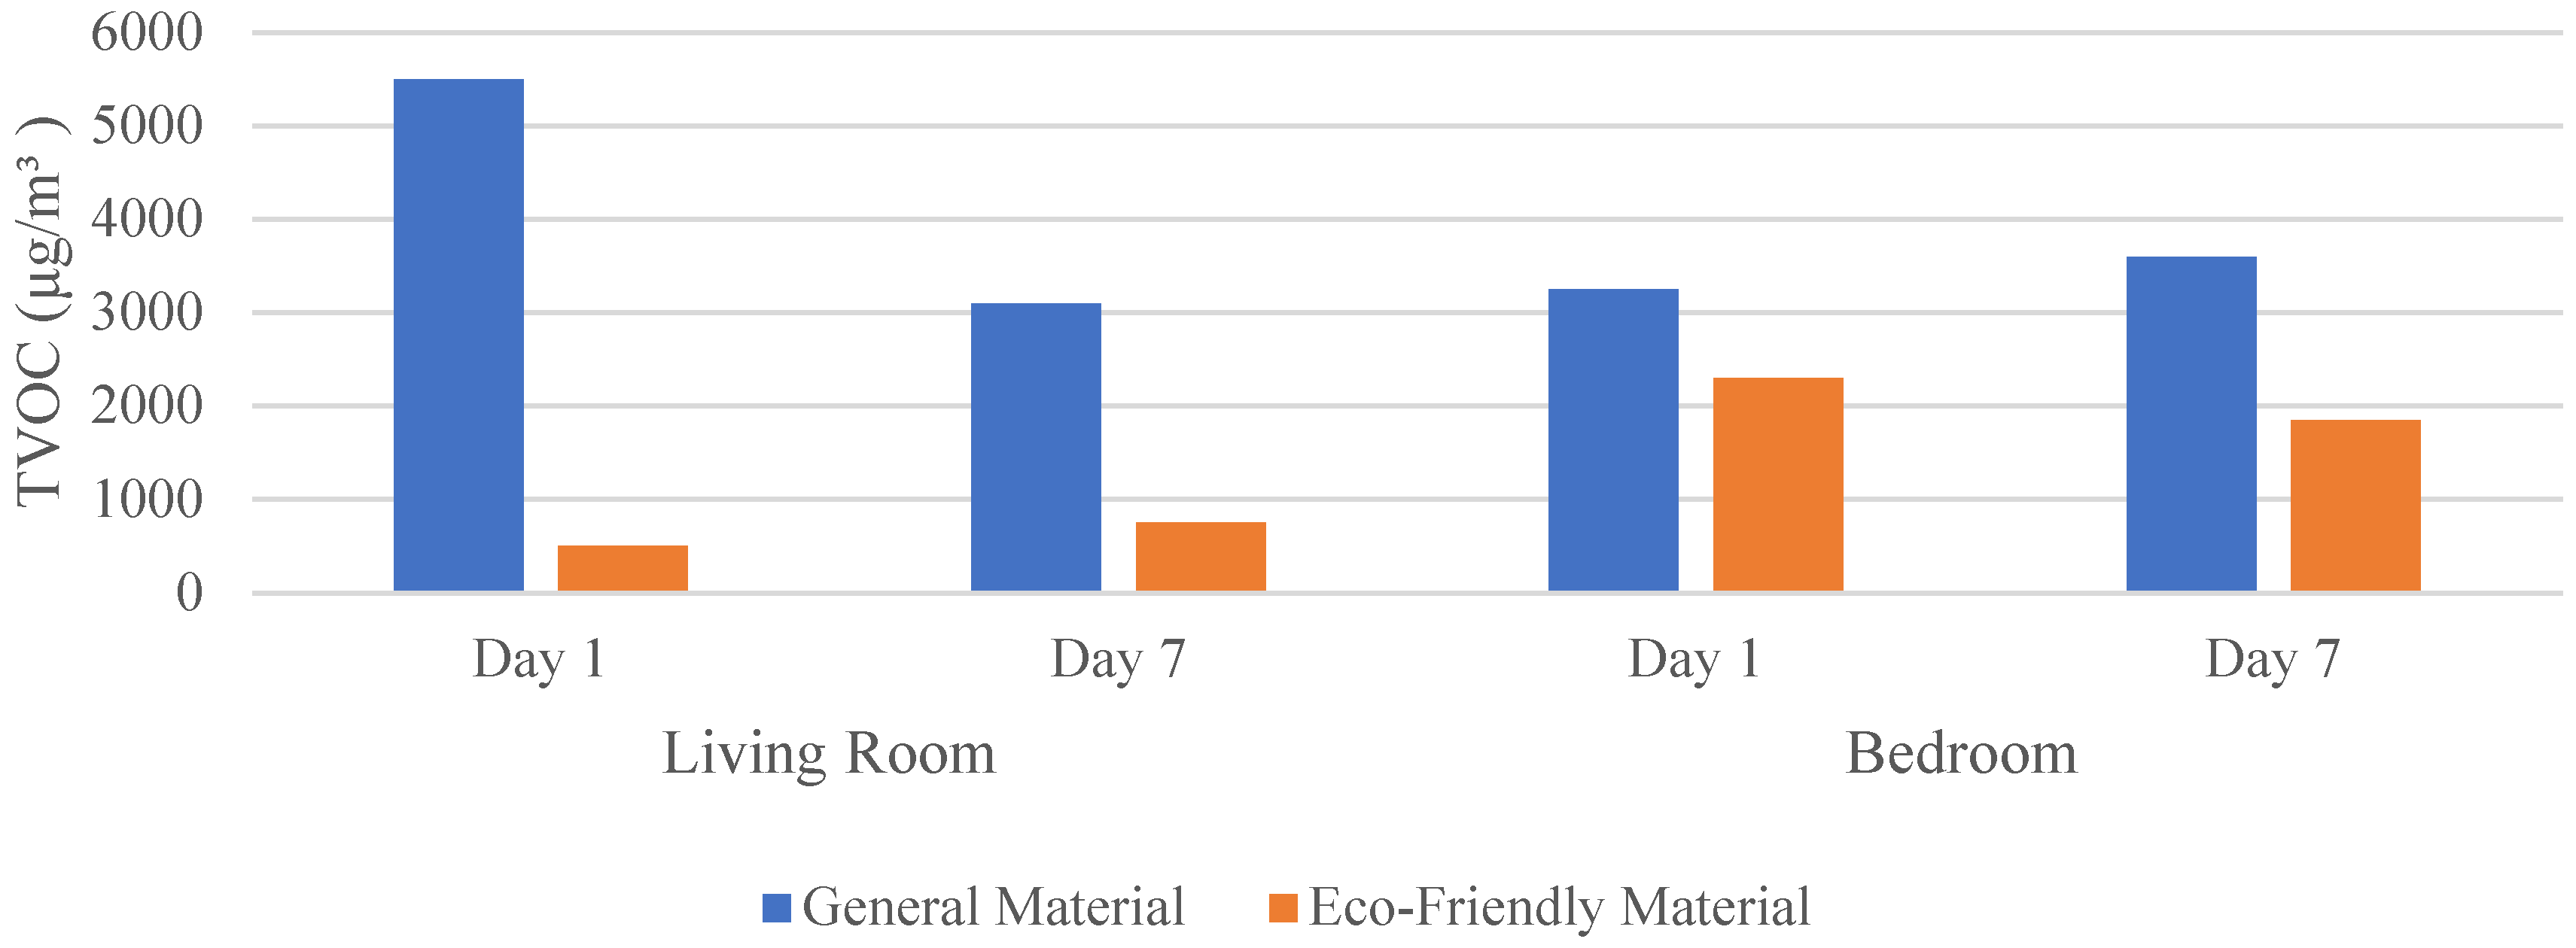
3.2. Comparison of TVOC and HCHO Emission Concentrations by Locations between General and Eco-Friendly Material

The outcomes of this study pertain to the experimental units 8C and 10D. The experiment aimed to ascertain the emission characteristics of HCHO and VOCs indoors concerning the construction location of each material. Furthermore, the efficacy of eco-friendly materials for each specific material was evaluated. Measurements were conducted at the central position within the living room area.

3.2.1. Parquet Flooring

Parquet flooring was meticulously installed in both the living room and kitchen areas. An adhesive containing oil-based epoxy resin was utilized for conventional flooring materials, while eco-friendly flooring materials employed a resin adhesive based on urethane. A comparative analysis of TVOC emissions reveals a substantial disparity. The construction of eco-friendly flooring materials results in significantly lower emission levels compared to the installation of conventional floor materials (Figure 10).
Regarding HCHO emissions, eco-friendly flooring materials exhibit lower overall levels than general flooring materials. Specifically, on the first day after construction, the difference in emissions was approximately twice as large. However, it should be noted that there was a slight increase in emission amounts over time, and the disparity with the emission levels of general flooring materials was not significantly large (Figure 11).

3.2.2. Wallpaper

The experiment focused on two types of wallpaper: one made with PVC (polyvinyl chloride) resin and the other made with PP (polypropylene) resin. The experiment results demonstrated a reduction in the emissions of TVOC and HCHO with the use of eco-friendly wallpaper (Figure 12). Specifically, on the first day after construction, a considerable concentration of emissions was observed, highlighting the notable difference between eco-friendly wallpaper and general wallpaper. By the sixth day, there was no significant emission level disparity between the general and eco-friendly wallpaper. However, it was evident that the emission amounts were significantly reduced compared to the first day, indicating the effectiveness of eco-friendly wallpaper in minimizing emissions over time (Figure 13).

3.2.3. Built-in Furniture

The emission levels were measured on the first and seventh days after installing general furniture in the experimental household, including shoe cabinets, dressing tables in the master bedroom, closets in the dressing room, and cabinets in the living room. Figure 14 and Figure 15 illustrate the concentrations of TVOC in the living room and bedroom after general furniture and eco-friendly materials are installed. In the case of general furniture, it was observed that eco-friendly materials resulted in a significant reduction in TVOC concentrations. Regarding HCHO emissions, it was noted that on the first day in the bedroom, eco-friendly furniture exhibited slightly higher emissions than general furniture. However, after seven days of construction, it was confirmed that the emission levels were more than twice as low when using eco-friendly materials compared to general materials.

3.2.4. Kitchen Furniture

When considering kitchen furniture, eco-friendly subsidiary materials resulted in a more than two times reduction in TVOC emissions compared to general subsidiary materials (Figure 16). This reduction was observed at the beginning of construction and on the eighth day. In the case of eco-friendly kitchen furniture, the application of UV paint as the surface finish played a significant role in reducing VOC emissions. The paint-drying process during the molding stage contributed to lower VOC emissions after the furniture was installed in the experimental unit. Using eco-friendly subsidiary materials led to lower HCHO emissions than general subsidiary materials (Figure 17).

3.2.5. Door/Window Frame

Regarding door and window frames, E2-grade laminated wood, HDF, and LVL were used with general auxiliary materials. In contrast, eco-friendly auxiliary materials were assigned an E1 grade to enhance performance. As a result, both TVOC and HCHO emissions were slightly lower when eco-friendly subsidiary materials were utilized. However, the difference in emissions was minimal, indicating the need for further emphasis on applying eco-friendly materials for wooden windows and doors (Figure 18 and Figure 19).

4. Discussion

The findings of our experiment yield valuable insights into the emission characteristics of VOCs and HCHO in indoor environments, comparing the effects of general materials and eco-friendly materials. The temporal changes in concentrations within the living rooms of the experimental units serve as evidence of the efficacy of eco-friendly materials in reducing indoor air pollutants.
Our findings indicate that the initial concentration of TVOC in the general material unit was approximately 1.7 times higher than that in the eco-friendly material unit. However, the TVOC concentration in the general material unit gradually decreased over time. It’s important to note that this reduction reflects the concentration levels, not necessarily the emission rate, which could also be influenced by factors such as increased ventilation or absorption by materials. In contrast, the eco-friendly material unit experienced a rapid reduction in TVOC concentration, reaching levels below 1000 μg/m3 after 14 days of construction. The concentration remained stable even after an extended period. Conversely, the general material unit took significantly longer, approximately 69 days, to reach TVOC concentrations below the threshold. This stark difference underscores the effectiveness of eco-friendly materials in mitigating TVOC emissions, aligning with previous studies [61,63,66] that have reported lower TVOC emissions in buildings utilizing eco-friendly materials.
On the other hand, the emission pattern of formaldehyde (HCHO) differed from that of TVOC. The highest peak of HCHO concentration was observed on the seventh day, reaching 126 μg/m3 in the general material unit. Fluctuations in HCHO concentrations were attributed to variations in indoor temperature and humidity conditions. Despite maintaining a controlled indoor temperature of 23 ± 1 °C throughout the experiment, it is noteworthy that the air temperature measured in the central breathing area of the living room was approximately 2 °C lower than the set temperature of 25 °C. This temperature difference may have contributed to the observed fluctuations in HCHO emissions.
The analysis of major individual VOCs, excluding benzene, exhibited a similar declining trend in concentration over time, paralleling the pattern observed for TVOC. Notably, toluene demonstrated a substantial emission concentration, closely following the decreasing trend of TVOC. In contrast, benzene displayed distinct behavior with low initial emission levels and cyclic fluctuations over time. Except for benzene, the initial emission levels were significantly higher in general materials compared to eco-friendly materials. This underscores the effectiveness of eco-friendly materials in mitigating initial VOC emissions, thereby suggesting their superiority in indoor air quality.
From a practical perspective, these findings have significant implications for indoor construction and renovation practices. As supported by this study, eco-friendly materials can drastically reduce indoor air pollution, ensuring a healthier living environment for occupants. This insight is particularly important for urban settings where residents often face air quality issues, both outdoors and indoors. Additionally, the reduced emission levels from eco-friendly materials can lead to decreased health-related expenditures in the long run.
Our study also examined the effects of eco-friendly alternatives in specific material applications. Parquet flooring constructed with eco-friendly materials exhibited significantly lower TVOC emissions than conventional flooring materials. Although there was a slight increase in HCHO emissions over time, the difference compared to general flooring materials was not substantial (Figure 10 and Figure 11). Similarly, eco-friendly wallpaper significantly reduced TVOC and HCHO emissions compared to general wallpaper, particularly on the first day after construction. By the sixth day, emissions levels equalized between the two types of wallpaper, with both showing significant reductions compared to the initial values. This demonstrates the long-term effectiveness of eco-friendly wallpaper in reducing emissions.
Regarding built-in furniture, utilizing eco-friendly materials significantly reduced TVOC concentrations compared to general materials. Although slightly higher HCHO emissions were observed on the first day in the bedroom, after seven days of construction, the emission levels were more than twice as low when eco-friendly materials were employed (Figure 14 and Figure 15). Eco-friendly kitchen furniture, constructed with subsidiary eco-friendly materials, exhibited over two times lower TVOC emissions compared to general subsidiary materials. Applying UV paint as a surface finish was crucial in reducing VOC emissions. The overall emissions of HCHO were also lower in eco-friendly kitchen furniture.
Regarding door and window frames, both TVOC and HCHO emissions were slightly lower when eco-friendly auxiliary materials were employed. However, the difference in emissions was minimal, suggesting the need for further emphasis on applying eco-friendly materials in these components.
Furthermore, these results also guide the selection of materials for construction professionals, architects, and interior designers, promoting eco-friendly choices that offer environmental and health advantages.
The current study provides compelling evidence for the effectiveness of eco-friendly materials in reducing indoor air pollutants, particularly TVOC and HCHO. The temporal analysis of concentrations in various material applications underscores the significant benefits of eco-friendly alternatives. Nevertheless, further research and development are necessary to optimize the application of eco-friendly materials in specific components, such as wooden windows and doors. The findings from this study contribute to the expanding body of knowledge on indoor air quality, offering valuable insights for architects, builders, and homeowners striving to create healthier living environments. Future studies should focus on refining eco-friendly materials and investigating their long-term impact on indoor air quality and occupant health.
Moreover, with the global shift towards sustainability and the increasing awareness of health implications due to indoor pollutants, eco-friendly materials can also present economic opportunities for manufacturers and suppliers. Therefore, this study serves as an impetus for healthier living conditions and a call for industries to invest and innovate in eco-friendly construction materials.
It is essential to acknowledge that this study is preliminary. The findings provide compelling evidence for the effectiveness of eco-friendly materials in reducing indoor air pollutants, particularly TVOC and HCHO. The temporal analysis of concentrations in various material applications underscores the significant benefits of eco-friendly alternatives. However, it is important to note that this study did not consider relative humidity, which is one of the limitations. Nevertheless, further research and development are necessary to optimize the application of eco-friendly materials in specific components, such as wooden windows and doors. The findings from this study contribute to the expanding body of knowledge on indoor air quality, offering valuable insights for architects, builders, and homeowners striving to create healthier living environments. Future studies should focus on refining eco-friendly materials and investigating their long-term impact on indoor air quality and occupant health.

5. Conclusions

In this study, we compared the emission concentrations of formaldehyde (HCHO) and volatile organic compounds (VOCs) over time between eco-friendly and general materials in an experimental house. We also assessed emission characteristics in different areas of the house. The key findings are as follows:
TVOC emissions initially peaked and gradually decreased in houses constructed with eco-friendly materials, with the general material unit taking over 50 days to reach stable pollutant levels below 1000 μg/m3. This suggests that using eco-friendly materials can create a more comfortable indoor environment over time. Overall, eco-friendly materials effectively improve indoor air quality.
In contrast, HCHO emissions reached their highest level on the seventh day and then stabilized. Other major VOCs showed declining concentrations over time, with benzene exhibiting cyclic patterns and toluene being the dominant influencer. General materials had higher initial emissions than eco-friendly ones, highlighting the efficacy of eco-friendly materials in reducing initial emissions.
Overall emissions were lower when using eco-friendly materials throughout the house. Eco-friendly flooring, wallpaper, built-in furniture, and kitchen furniture consistently demonstrated reduced emissions, particularly in the initial phase, showcasing the long-term effectiveness of eco-friendly materials.
Eco-friendly subsidiary materials contributed to lower TVOC and HCHO emissions, with kitchen furniture exhibiting significant reductions compared to general materials. However, window and door frame materials showed insignificant differences.
In summary, eco-friendly materials reduce indoor air pollutants, particularly TVOC and initial emissions. Toluene plays a significant role in VOC emissions, and eco-friendly materials outperform general materials in improving indoor air quality.

Author Contributions

All authors contributed significantly to this study. C.J. and N.S.A.M. identified and secured the example buildings used in the study. The data acquisition system and installations of measurements were designed and installed by N.A.Q. and G.E. C.J. and N.S.A.M. were responsible for data collection. Data analysis was performed by G.E. The manuscript was compiled by C.J. and N.A.Q. and reviewed by G.E. and N.A.Q. All authors have read and agreed to the published version of the manuscript.

Funding

This research received no external funding.

Data Availability Statement

New data were created or analyzed in this study. Data will be shared upon request and consideration of the authors.

Acknowledgments

The authors would like to express their gratitude to University of Sharjah and Ajman University for APC support and providing great research environment.

Conflicts of Interest

The authors declare no conflict of interest.

References

  1. Xu, J.; Sun, J.; Zhao, J.; Zhang, W.; Zhou, J.; Xu, L.; Guo, H.; Liu, Y.; Zhang, D. Eco-friendly wood plastic composites with biomass-activated carbon-based form-stable phase change material for building energy conversion. Ind. Crops Prod. 2023, 197, 116573. [Google Scholar] [CrossRef]
  2. Qian, C.; Fan, W.; Yang, G.; Han, L.; Xing, B.; Lv, X. Influence of crumb rubber particle size and SBS structure on properties of CR/SBS composite modified asphalt. Constr. Build. Mater. 2020, 235, 117517. [Google Scholar] [CrossRef]
  3. Jung, C.; Awad, J. The improvement of indoor air quality in residential buildings in Dubai, UAE. Buildings 2021, 11, 250. [Google Scholar] [CrossRef]
  4. Surawattanasakul, V.; Sirikul, W.; Sapbamrer, R.; Wangsan, K.; Panumasvivat, J.; Assavanopakun, P.; Muangkaew, S. Respiratory symptoms and skin sick building syndrome among office workers at University Hospital, Chiang Mai, Thailand: Associations with indoor air quality, AIRMED Project. Int. J. Environ. Res. Public Health 2022, 19, 10850. [Google Scholar] [CrossRef] [PubMed]
  5. Awad, J.; Jung, C. Evaluating the indoor air quality after renovation at the Greens in Dubai, United Arab Emirates. Buildings 2021, 11, 353. [Google Scholar] [CrossRef]
  6. Alfuraty, A.B. Sustainable Environment in Interior Design: Design by Choosing Sustainable Materials. IOP Conf. Ser. Mater. Sci. Eng. 2020, 881, 012035. [Google Scholar] [CrossRef]
  7. Samuel, A.K.; Mohanan, V.; Sempey, A.; Garcia, F.Y.; Lagiere, P.; Bruneau, D.; Mahanta, N. A Sustainable Approach for a Climate Responsive House in UAE: Case Study of SDME 2018 BAITYKOOL Project. In Proceedings of the 2019 International Conference on Computational Intelligence and Knowledge Economy, ICCIKE 2019, Dubai, United Arab Emirates, 11–12 December 2019; pp. 816–823. [Google Scholar] [CrossRef]
  8. Taleb, H.M. Using passive cooling strategies to improve thermal performance and reduce energy consumption of residential buildings in U.A.E. buildings. Front. Archit. Res. 2014, 3, 154–165. [Google Scholar] [CrossRef]
  9. Jiang, C.; Li, D.; Zhang, P.; Li, J.; Wang, J.; Yu, J. Formaldehyde and volatile organic compound (VOC) emissions from particleboard: Identification of odorous compounds and effects of heat treatment. Build. Environ. 2017, 117, 118–126. [Google Scholar] [CrossRef]
  10. Maghrabie, H.M.; Abdelkareem, M.A.; Al-Alami, A.H.; Ramadan, M.; Mushtaha, E.; Wilberforce, T.; Olabi, A.G. State-of-the-art technologies for building-integrated photovoltaic systems. Buildings 2021, 11, 383. [Google Scholar] [CrossRef]
  11. Arar, M.; Jung, C.; Qassimi, N.A. Investigating the influence of the building material on the indoor air quality in apartment in Dubai. Front. Built Environ. 2022, 7, 804216. [Google Scholar] [CrossRef]
  12. Vu, H.T.; Liu, Y.; Tran, D.V. Nationalizing a global phenomenon: A study of how the press in 45 countries and territories portrays climate change. Glob. Environ. Change 2019, 58, 101942. [Google Scholar] [CrossRef] [PubMed]
  13. Jung, C.; Al Qassimi, N.; Arar, M.; Awad, J. The Analysis of Indoor Air Pollutants From Finishing Material of New Apartments at Business Bay, Dubai. Front. Built Environ. 2021, 7, 765689. [Google Scholar] [CrossRef]
  14. Al-Sallal, K.A.; Al-Rais, L.; Dalmouk, M.B. Designing a sustainable house in the desert of Abu Dhabi. Renew. Energy 2013, 49, 80–84. [Google Scholar] [CrossRef]
  15. He, C.; Morawska, L.; Gilbert, D. Particle deposition rates in residential houses. Atmos. Environ. 2005, 39, 3891–3899. [Google Scholar] [CrossRef]
  16. ASHRAE Standard 62.1-2019; Ventilation for Acceptable Indoor Air Quality. American Society of Heating. Refrigerating and Air-Conditioning Engineers: Atlanta, GA, USA, 2005.
  17. Kakoulli, C.; Kyriacou, A.; Michaelides, M.P. A review of field measurement studies on thermal comfort, indoor air quality and virus risk. Atmosphere 2022, 13, 191. [Google Scholar] [CrossRef]
  18. Han, Y.; Yang, M.S.; Lee, S.-M.; Investigation on the Awareness and Preference for Wood Culture to Promote the Values of Wood: Ⅲ. Living Environment and Trend of Wood Utilization. J. Korean Wood Sci. Technol. 2022, 50, 375–391. [Google Scholar] [CrossRef]
  19. Burnard, M.D.; Kutnar, A. Wood and human stress in the built indoor environment: A review. Wood Sci. Technol. 2015, 49, 969–986. [Google Scholar] [CrossRef]
  20. Ikei, H.; Song, C.; Miyazaki, Y. Physiological effects of wood on humans: A review. J. Wood Sci. 2017, 63, 1–23. [Google Scholar] [CrossRef]
  21. Jung, C.; Mahmoud, N.S.A. Extracting the Critical Points of Formaldehyde (HCHO) Emission Model in Hot Desert Climate. Air Soil Water Res. 2022, 15, 11786221221105082. [Google Scholar] [CrossRef]
  22. Kelly, F.J.; Fussell, J.C. Improving indoor air quality, health and performance within environments where people live, travel, learn and work. Atmos. Environ. 2019, 200, 90–109. [Google Scholar] [CrossRef]
  23. Arar, M.; Jung, C. Analyzing the Perception of Indoor Air Quality (IAQ) from a Survey of New Townhouse Residents in Dubai. Sustainability 2022, 14, 15042. [Google Scholar] [CrossRef]
  24. Mushtaha, E.; Salameh, T.; Kharrufa, S.; Mori, T.; Aldawoud, A.; Hamad, R.; Nemer, T. The impact of passive design strategies on cooling loads of buildings in temperate climate. Case Stud. Therm. Eng. 2021, 28, 101588. [Google Scholar] [CrossRef]
  25. Mushtaha, E.; Alsyouf, I.; Al Labadi, L.; Hamad, R.; Khatib, N.; Al Mutawa, M. Application of AHP and a mathematical index to estimate livability in tourist districts: The case of Al Qasba in Sharjah. Front. Archit. Res. 2020, 9, 872–889. [Google Scholar] [CrossRef]
  26. Elnaklah, R.; Walker, I.; Natarajan, S. Moving to a green building: Indoor environment quality, thermal comfort and health. Build. Environ. 2021, 191, 107592. [Google Scholar] [CrossRef]
  27. Ebrahimi, P.; Khajeheian, D.; Fekete-Farkas, M. A SEM-NCA approach towards social networks marketing: Evaluating consumers’ sustainable purchase behavior with the moderating role of eco-friendly attitude. Int. J. Environ. Res. Public Health 2021, 18, 13276. [Google Scholar] [CrossRef]
  28. Elsaid, A.M.; Ahmed, M.S. Indoor air quality strategies for air-conditioning and ventilation systems with the spread of the global coronavirus (COVID-19) epidemic: Improvements and recommendations. Environ. Res. 2021, 199, 111314. [Google Scholar] [CrossRef]
  29. Leo Samuel, D.G.; Dharmasastha, K.; Shiva Nagendra, S.M.; Maiya, M.P. Thermal comfort in traditional buildings composed of local and modern construction materials. Int. J. Sustain. Built Environ. 2017, 6, 463–475. [Google Scholar] [CrossRef]
  30. Hussien, A.; Saleem, A.A.; Mushtaha, E.; Jannat, N.; Al-Shammaa, A.; Ali, S.B.; Assi, S.; Al-Jumeily, D. A statistical analysis of life cycle assessment for buildings and buildings’ refurbishment research. Ain Shams Eng. J. 2023, 14, 102143. [Google Scholar] [CrossRef]
  31. Michael, A.; Demosthenous, D.; Philokyprou, M. Natural ventilation for cooling in mediterranean climate: A case study in vernacular architecture of Cyprus. Energy Build. 2017, 144, 333–345. [Google Scholar] [CrossRef]
  32. Saljoughinejad, S.; Rashidi Sharifabad, S. Classification of climatic strategies, used in Iranian vernacular residences based on spatial constituent elements. Build. Environ. 2015, 92, 475–493. [Google Scholar] [CrossRef]
  33. Hayles, C.S. Environmentally sustainable interior design: A snapshot of current supply of and demand for green, sustainable or Fair Trade products for interior design practice. Int. J. Sustain. Built Environ. 2015, 4, 100–108. [Google Scholar] [CrossRef]
  34. Yang, S.; Wi, S.; Lee, J.; Lee, H.; Kim, S. Biochar-red clay composites for energy efficiency as eco-friendly building materials: Thermal and mechanical performance. J. Hazard. Mater. 2019, 373, 844–855. [Google Scholar] [CrossRef] [PubMed]
  35. Krishna, B.V.; Reddy, E.R. Applications of green materials for the preparation of eco-friendly bricks and pavers. Int. J. Eng. Technol. 2018, 7, 75–79. [Google Scholar] [CrossRef]
  36. Khoshnava, S.M.; Rostami, R.; Mohamad Zin, R.; Štreimikienė, D.; Mardani, A.; Ismail, M. The role of green building materials in reducing environmental and human health impacts. Int. J. Environ. Res. Public Health 2020, 17, 2589. [Google Scholar] [CrossRef]
  37. Wi, S.; Kim, M.G.; Myung, S.W.; Baik, Y.K.; Lee, K.B.; Song, H.S.; Kwak, M.-J.; Kim, S. Evaluation and analysis of volatile organic compounds and formaldehyde emission of building products in accordance with legal standards: A statistical experimental study. J. Hazard. Mater. 2020, 393, 122381. [Google Scholar] [CrossRef]
  38. Nasr, M.S.; Shubbar, A.A.; Abed, Z.A.A.R.; Ibrahim, M.S. Properties of eco-friendly cement mortar contained recycled materials from different sources. J. Build. Eng. 2020, 31, 101444. [Google Scholar] [CrossRef]
  39. Liu, Y.; Misztal, P.K.; Xiong, J.; Tian, Y.; Arata, C.; Weber, R.J.; Nazaroff, W.W.; Goldstein, A.H. Characterizing sources and emissions of volatile organic compounds in a northern California residence using space-and time-resolved measurements. Indoor Air 2019, 29, 630–644. [Google Scholar] [CrossRef]
  40. Hussien, A.; Jannat, N.; Mushtaha, E.; Al-Shammaa, A. A holistic plan of flat roof to green-roof conversion: Towards a sustainable built environment. Ecol. Eng. 2023, 190, 106925. [Google Scholar] [CrossRef]
  41. Sobha Realty. Sobha Hartland One Park Avenue. 2023. Available online: https://www.sobharealty.com/apartments-for-sale-in-dubai/one-park-avenue/ (accessed on 12 April 2023).
  42. Hong, Q.; Liu, C.; Hu, Q.; Zhang, Y.; Xing, C.; Su, W.; Ji, X.; Xiao, S. Evaluating the feasibility of formaldehyde derived from hyperspectral remote sensing as a proxy for volatile organic compounds. Atmos. Res. 2021, 264, 105777. [Google Scholar] [CrossRef]
  43. Huang, K.; Sun, W.; Feng, G.; Wang, J.; Song, J. Indoor air quality analysis of 8 mechanically ventilated residential buildings in northeast China based on long-term monitoring. Sustain. Cities Soc. 2020, 54, 101947. [Google Scholar] [CrossRef]
  44. Chen, Q.; Xiao, R.; Lei, X.; Yu, T.; Mo, J. Experimental and modeling investigations on the adsorption behaviors of indoor volatile organic compounds in an in-situ thermally regenerated adsorption-board module. Build. Environ. 2021, 203, 108065. [Google Scholar] [CrossRef]
  45. Liu, C.Y.; Tseng, C.H.; Wang, H.C.; Dai, C.F.; Shih, Y.H. The study of an ultraviolet radiation technique for removal of the indoor air volatile organic compounds and bioaerosol. Int. J. Environ. Res. Public Health 2019, 16, 2557. [Google Scholar] [CrossRef] [PubMed]
  46. Bahri, M.; Haghighat, F.; Kazemian, H.; Rohani, S. A comparative study on metal organic frameworks for indoor environment application: Adsorption evaluation. Chem. Eng. J. 2017, 313, 711–723. [Google Scholar] [CrossRef]
  47. Chang, T.; Wang, J.; Lu, J.; Shen, Z.; Huang, Y.; Sun, J.; Xu, H.; Wang, X.; Ren, D.; Cao, J. Evaluation of indoor air pollution during decorating process and inhalation health risks in Xi’an, China: A case study. Aerosol Air Qual. Res. 2019, 19, 854–864. [Google Scholar] [CrossRef]
  48. Caron, F.; Guichard, R.; Robert, L.; Verriele, M.; Thevenet, F. Behaviour of individual VOCs in indoor environments: How ventilation affects emission from materials. Atmos. Environ. 2020, 243, 117713. [Google Scholar] [CrossRef]
  49. van den Broek, J.; Cerrejon, D.K.; Pratsinis, S.E.; Güntner, A.T. Selective formaldehyde detection at ppb in indoor air with a portable sensor. J. Hazard. Mater. 2020, 399, 123052. [Google Scholar] [CrossRef]
  50. Harashima, H.; Sumiyoshi, E.; Ito, K. Numerical models for seamlessly predicting internal diffusion and re-emission of leaked liquid toluene from indoor mortar materials. J. Build. Eng. 2022, 57, 104976. [Google Scholar] [CrossRef]
  51. Geldermans, B.; Tenpierik, M.; Luscuere, P. Circular and flexible indoor partitioning—A design conceptualization of innovative materials and value chains. Buildings 2019, 9, 194. [Google Scholar] [CrossRef]
  52. Hoang, C.P.; Kinney, K.A.; Corsi, R.L. Ozone removal by green building materials. Build. Environ. 2009, 44, 1627–1633. [Google Scholar] [CrossRef]
  53. Liu, S.; Song, R.; Zhang, T.T. Residential building ventilation in situations with outdoor PM2.5 pollution. Build. Environ. 2021, 202, 108040. [Google Scholar] [CrossRef]
  54. Alonso, M.J.; Moazami, T.N.; Liu, P.; Jørgensen, R.B.; Mathisen, H.M. Assessing the indoor air quality and their predictor variable in 21 home offices during the COVID-19 pandemic in Norway. Build. Environ. 2022, 225, 109580. [Google Scholar] [CrossRef]
  55. Marques, A.C.; Mocanu, A.; Tomić, N.Z.; Balos, S.; Stammen, E.; Lundevall, A.; Abrahami, S.T.; Günther, R.; de Kok, J.M.M.; de Freitas, S.T. Review on adhesives and surface treatments for structural applications: Recent developments on sustainability and implementation for metal and composite substrates. Materials 2020, 13, 5590. [Google Scholar] [CrossRef] [PubMed]
  56. Lee, K.E. Environmental sustainability in the textile industry. In Sustainability in the Textile Industry; Springer: Singapore, 2017; pp. 17–55. [Google Scholar]
  57. Blanchet, P.; Pepin, S. Trends in chemical wood surface improvements and modifications: A review of the last five years. Coatings 2021, 11, 1514. [Google Scholar] [CrossRef]
  58. Rudawska, A.; Szabelski, J.; Miturska-Barańska, I.; Doluk, E. Biological Reinforcement of Epoxies as Structural Adhesives. In Structural Adhesives: Properties, Characterization and Applications; Wiley: Hoboken, NJ, USA, 2023; pp. 31–104. [Google Scholar]
  59. Ahmad, J.; Arbili, M.M.; Deifalla, A.F.; Salmi, A.; Maglad, A.M.; Althoey, F. Sustainable concrete with partial substitution of paper pulp ash: A review. Sci. Eng. Compos. Mater. 2023, 30, 20220193. [Google Scholar] [CrossRef]
  60. Krzyżaniak, Ł.; Kuşkun, T.; Kasal, A.; Smardzewski, J. Analysis of the internal mounting forces and strength of newly designed fastener to joints wood and wood-based panels. Materials 2021, 14, 7119. [Google Scholar] [CrossRef]
  61. Foong, S.Y.; Liew, R.K.; Lee, C.L.; Tan, W.P.; Peng, W.; Sonne, C.; Tsang, Y.F.; Lam, S.S. Strategic hazard mitigation of waste furniture boards via pyrolysis: Pyrolysis behavior, mechanisms, and value-added products. J. Hazard. Mater. 2022, 421, 126774. [Google Scholar] [CrossRef] [PubMed]
  62. Raydan, N.D.V.; Leroyer, L.; Charrier, B.; Robles, E. Recent advances on the development of protein-based adhesives for wood composite materials—A review. Molecules 2021, 26, 7617. [Google Scholar] [CrossRef]
  63. Sharma, B.; Shekhar, S.; Sharma, S.; Jain, P. The paradigm in conversion of plastic waste into value added materials. Clean. Eng. Technol. 2021, 4, 100254. [Google Scholar] [CrossRef]
  64. Gonzalez-Martin, J.; Kraakman, N.J.R.; Perez, C.; Lebrero, R.; Munoz, R. A state–of–the-art review on indoor air pollution and strategies for indoor air pollution control. Chemosphere 2021, 262, 128376. [Google Scholar] [CrossRef]
  65. Hernández-Gordillo, A.; Ruiz-Correa, S.; Robledo-Valero, V.; Hernández-Rosales, C.; Arriaga, S. Recent advancements in low-cost portable sensors for urban and indoor air quality monitoring. Air Qual. Atmos. Health 2021, 14, 1931–1951. [Google Scholar] [CrossRef]
  66. Akinyemi, B.A.; Kolajo, T.E.; Adedolu, O. Blended formaldehyde adhesive bonded particleboards made from groundnut shell and rice husk wastes. Clean Technol. Environ. Policy 2022, 24, 1653–1662. [Google Scholar] [CrossRef]
  67. Sobha Realty. One Park Avenue at Sobha Hartland–MBR City. 2023. Available online: https://sobha-residences.ae/one-park-avenue.php (accessed on 24 April 2023).
  68. Huang, K.; Song, J.; Feng, G.; Chang, Q.; Jiang, B.; Wang, J.; Sun, W.; Li, H.; Wang, J.; Fang, X. Indoor air quality analysis of residential buildings in northeast China based on field measurements and longtime monitoring. Build. Environ. 2018, 144, 171–183. [Google Scholar] [CrossRef]
  69. Ismaeel, W.S.; Mohamed, A.G. Indoor air quality for sustainable building renovation: A decision-support assessment system using structural equation modelling. Build. Environ. 2022, 214, 108933. [Google Scholar] [CrossRef]
  70. Alonso, M.J.; Wolf, S.; Jørgensen, R.B.; Madsen, H.; Mathisen, H.M. A methodology for the selection of pollutants for ensuring good indoor air quality using the de-trended cross-correlation function. Build. Environ. 2022, 209, 108668. [Google Scholar] [CrossRef]
Figure 1. Unit 6B in Sobha Hartland One Park Avenue. Measurement point: Grey Wolf device.
Buildings 13 02847 g001
Figure 2. Measurement point.
Buildings 13 02847 g002
Figure 3. The concentration of TVOC in the general material unit and the eco-friendly unit.
Buildings 13 02847 g003
Figure 4. The concentration of HCHO in the general material unit and the eco-friendly unit.
Buildings 13 02847 g004
Figure 5. The concentration of benzene in the general material unit and the eco-friendly unit.
Buildings 13 02847 g005
Figure 6. The concentration of toluene in the general material unit and the eco-friendly unit.
Buildings 13 02847 g006
Figure 7. The concentration of ethylbenzene in the general material unit and the eco-friendly unit.
Buildings 13 02847 g007
Figure 8. The concentration of xylene in the general material unit and the eco-friendly unit.
Buildings 13 02847 g008
Figure 9. The concentration of styrene in the general material unit and the eco-friendly unit.
Buildings 13 02847 g009
Figure 10. TVOC concentration according to the parquet flooring.
Buildings 13 02847 g010
Figure 11. HCHO concentration according to the parquet flooring.
Buildings 13 02847 g011
Figure 12. TVOC concentration according to the wallpaper.
Buildings 13 02847 g012
Figure 13. HCHO concentration according to the wallpaper.
Buildings 13 02847 g013
Figure 14. TVOC concentration according to the built-in furniture.
Buildings 13 02847 g014
Figure 15. HCHO concentration according to the built-in furniture.
Buildings 13 02847 g015
Figure 16. TVOC concentration according to the kitchen furniture.
Buildings 13 02847 g016
Figure 17. HCHO concentration according to the kitchen furniture.
Buildings 13 02847 g017
Figure 18. TVOC concentration according to the door/window frame.
Buildings 13 02847 g018
Figure 19. HCHO concentration according to the door/window frame.
Buildings 13 02847 g019
Table 1. Composition of the four experimental units.
Sobha Hartland One Park AvenueExperiment Contents
MaterialDurationEvaluation Criteria
Unit 4AGeneral material81 daysConcentration changes over time
Unit 6BEco-friendly material
Unit 8CGeneral material14 days for each materialChanges in indoor pollutant concentration according to the construction location for each material
Unit 10DEco-friendly material
Table 2. Comparison of the composition of finishing materials.
ClassificationGeneral MaterialEco-Friendly Material
Wallpaper (adhesive)PVC-based wallpaper
(general adhesive)
PP-based wallpaper
(HCHO low-emission adhesive)
Parquet flooring (adhesive)General flooring
(Oil-based epoxy adhesive)
Hazardous chemical substance reduction floor
(Urethane adhesive)
Window frameCore material Laminated wood E2 gradeLaminated wood E1 grade
Surface materialHDF E2 grade
LVL E2 grade
HDF E1 grade
LVL E1 grade
Built-in FurnitureCore materialBody framePB E2 gradePB E1 grade
DoorMDF E2 gradeMDF E1 grade
Surface materialPVC wrappingLPM
Kitchen furnitureCore materialBody framePB E2 gradePB E1 grade
DoorMDF E2 gradeMDF E1 grade
Surface materialLaquer paintUV paint
Table 3. Conditions for VOC analysis.
EquipmentAnalysis Conditions
GC/MSDHP 6890/HP-5973N
Column: HP-1 Capillary column(60 m × 0.32 mm × 5 μm)
Column temperature: 40 °C (5 min) >> 70 °C (5 min) >> 150 °C (5 min) >> 200 °C (5 min)->220 °C (5 min)
Ramp rate: 5 °C/min to 200 °C, 10 °C/min to 220 °C
Column flow: 1 mL/min
MS ion source temp: 230 °C
Table 4. Conditions for HCHO analysis.
EquipmentAnalysis Conditions
HPLCColumn: C-18 column (3.9 × 300 mm) waters U.S.A.
Mobile phase: acetonitrile/water = 55:45
UV detector: 360 nm
Flow rate: 1.0 mL/min
Sample injection amount: 20 μL
Disclaimer/Publisher’s Note: The statements, opinions and data contained in all publications are solely those of the individual author(s) and contributor(s) and not of MDPI and/or the editor(s). MDPI and/or the editor(s) disclaim responsibility for any injury to people or property resulting from any ideas, methods, instructions or products referred to in the content.

