Article

Test and Numerical Simulation of the Axial Compressive Capacity of Concrete Columns Reinforced by Duplex Stainless Steel Bars

1
Hunan Provincial Key Laboratory of Intelligent Disaster Prevention-Mitigation and Ecological Restoration in Civil Engineering, Hunan Institute of Engineering, Xiangtan 411104, China
2
China Construction Science & Technology Group Co., Ltd., Beijing 100195, China
*
Author to whom correspondence should be addressed.
Buildings 2023, 13(11), 2845; https://doi.org/10.3390/buildings13112845
Submission received: 17 October 2023 / Revised: 4 November 2023 / Accepted: 12 November 2023 / Published: 14 November 2023
(This article belongs to the Special Issue Advanced Concrete Structures: Structural Behaviors and Design Methods)

Abstract

:
Stainless steel has the characteristics of oxidation resistance, high temperature resistance, corrosion resistance, high strength, and high yield ratio. The use of stainless steel bars can extend the life of a structure, reduce later maintenance costs, and reduce the whole life cycle cost of the structure. In this paper, nine concrete columns reinforced with duplex stainless steel (S2205) (DSSRC) and nine ordinary reinforced concrete columns (ORC) were poured with the diameter of steel bars as the parameter, and axial compression tests were carried out on these eighteen concrete columns. The failure mode of the concrete columns is analyzed, and the compressive performance indexes of the two kinds of concrete columns are compared. The results show that, compared with the ORC, the cracking load of DSSRC is increased by 33%, the ultimate load is increased by 30.7%, and the deformation performance of the DSSRC is also improved significantly. On the basis of the test, the finite element model of DSSRC was established with the help of ABAQUS software, and the obtained failure law was consistent with the test; the experimental value, the calculated value, and the numerical simulation value of the axial compression capacity were in good agreement, which verified the feasibility of the test and provided a theoretical basis for practical engineering applications.

1. Introduction

This is an era of energy conservation and environmental protection. On the one hand, people pay attention to the clean technology of products and the sustainable development of society [1,2,3], but on the other hand, they also pay attention to the development of ultra-high performance materials such as ultra-high performance concrete [4,5] and the utilization of ultra-high performance steel [6]. Years of engineering practice have demonstrated the strong corrosion resistance of ordinary reinforced concrete structures. However, the stringent corrosion resistance requirements for concrete structures are still difficult to satisfy, especially in harsh corrosive environments, such as chemical and marine environments, where the designed corrosion resistance goals often prove challenging to reach. Nonetheless, with the advent of new reinforcing materials, duplex stainless steel bars (with 21% to 26% chromium, 4% to 8% nickel, and 0.1% to 4.5% molybdenum) are expected to replace ordinary steel bars [6,7,8]. Previous studies have shown that replacing ordinary steel bars with stainless steel bars is sufficient to increase the structure’s chloride ion corrosion resistance by over one order of magnitude [9,10,11,12,13]. Stainless steel bars have the characteristics of oxidation resistance, high-temperature resistance, corrosion resistance, high strength, and high yield ratio [14,15,16,17,18,19]. The price of stainless steel rebar is about six times the price of ordinary carbon steel rebar [20], and the application of stainless steel bars can both extend the service life of the structure and reduce the later-stage maintenance costs, thereby reducing the full life cycle cost [21,22,23].
With excellent corrosion resistance [16,24,25], good ductility, and good chemical properties, duplex stainless steel bars can extend the service life of concrete structures and reduce their full life cycle costs. It has been customary to think that different types of stainless steel have similar mechanical behaviors to carbon steel. However, existing studies have shown that stainless steel has very different mechanical properties from carbon steel. The tensile curves of the two types of steel are compared in Figure 1. Unlike carbon steel, stainless steel has no clear yield point (Figure 1). Usually, its yield strength is defined as that of a specific offset strain (approx. 0.2%). In the current design specification, the yield strength of ordinary rebar is used as its design value. In contrast, the nominal yield strength of hard steels such as stainless steel bars is usually used as the design value in the current specification. In this way, the bearing capacity increment of stainless steel bars in the reinforcement phase is neglected, and the strain-hardening characteristics of stainless steel bars are not fully exploited. Therefore, the calculated bearing capacity of stainless steel reinforced concrete (SSRC) structures is not sufficiently accurate, and is underestimated [18,19].
In recent years, stainless steel materials have been applied to many projects worldwide, especially bridges, retaining walls, and tunnels in environments with strong chemical or seawater corrosion [26,27,28,29,30]. Taking the Stonecutters Bridge in Hong Kong and the Sheikh Zayed Bridge in Abu Dhabi as an example, 1.4462 stainless steel bars were used in sections apt to splash and seawater corrosion. Moreover, duplex stainless steel bars were used in the piers of the newly-built Hong Kong-Zhuhai-Macao Bridge with a designed service life of 120 years [31].
With the prevalence of stainless steel bar applications, researchers began to study the stress performance of SSRC structures in detail. First of all, researchers focused more on the bonding properties of stainless steel bars to concrete when considering them as the main reinforcing bars. Relevant experimental studies worldwide have proved the good bonding performance of stainless steel bars and concrete [32,33,34]. The ratio of failure load and ultimate bond stress of a stainless steel bar drawing specimen to that of an ordinary steel bar drawing specimen is 0.99. The bonding properties of stainless steel bars and ordinary steel bars in concrete are similar, so it is suggested that the bonding properties of ordinary steel bars in concrete should be applied to stainless steel reinforced concrete [33]. Secondly, scholars also focused on the bending performance, eccentric compression performance, and bearing capacity of SSRC structures [35,36,37,38]. The relevant research results show that [16,17,19,39,40,41,42] SSRC structures have good mechanical properties. However, theoretical studies on the engineering applications of duplex stainless steel bars and research on the bonding properties, mechanical properties, failure modes, and corrosion resistance of duplex stainless steel reinforced concrete structures are relatively rare. This study conducted experiments on duplex stainless steel reinforced concrete columns to investigate the failure mode and mechanical properties of the test specimens. In the meantime, a finite element model of the S2205DSSRC concrete column was established in Abaqus to reveal its typical failure mode, bearing capacity, ductility, and strain response pattern. The findings could provide a reference basis for the subsequent formulation of duplex stainless steel bar design specifications and a theoretical basis for their applications in actual projects.

2. Experimental Program

2.1. Material Properties

All concrete columns were constructed in the structural laboratory of the Hunan University of Science and Technology.
Concrete. The concrete used in this study had a strength grade of C30 and was prepared with ordinary Portland cement. The same batch of concrete was used to prepare the test blocks for the compression resistance tests and the tested concrete columns. The ordinary Portland cement used in this study was produced by Hunan Xiangxiang Chengmei Cement Co., Ltd. (Xiangtan, China). According to the Standard for Test Methods of Concrete Physical and Mechanical Properties (GB/T50081-2019) [43], cubical standard test blocks (size: 150 × 150 × 150 mm; batch No. 1) and prismatic standard test blocks (size: 150 × 150 × 300 mm; batch No. 2) were prepared. After standard curing for 28 d, concrete compressive strength loading tests were carried out using a DYE-2000 electro-hydraulic compression testing machine. The test results are presented in Table 1.
Steel bar. Two types of steel bars were used in this study, HRB400 ordinary steel bars and S2205 duplex stainless steel bars. The diameters of rebars for the fabrication of concrete columns were 10 mm, 12 mm, and 14 mm, respectively, and the diameter of stirrups was 6 mm. The S2205 duplex stainless steel bars were produced by Taizhou Yuhao Stainless Steel Products Co., Ltd. (Taizhou, China). According to the different diameters and types of steel bars, three specimens were selected from each group for tensile strength tests. In accordance with the provisions of the Test Method of Steel for Reinforcement of Concrete (GB/T28900-2012) [44], a WAW-600 hydraulic universal testing machine was used to conduct the tensile tests at normal temperature. The tensile test curves of the HRB400 ordinary steel bars and S2205 duplex stainless steel bars are shown in Figure 2.
The tensile test results of the steel bar materials are presented in Table 2.
Strain gauge. To test the strain variation of steel bars and concrete in the concrete columns under external loads, strain gauges produced by Xingtai County Kehua Electronics Co., Ltd. (Xingtai, China) were installed at the various measuring points. The strain gauges for the steel bars and concrete were BE120-3AA-P200 and BZ120-80AA models, respectively, with a resistance of 120 ± 0.2 Ω and a sensitivity factor of 2.08 ± 1%.

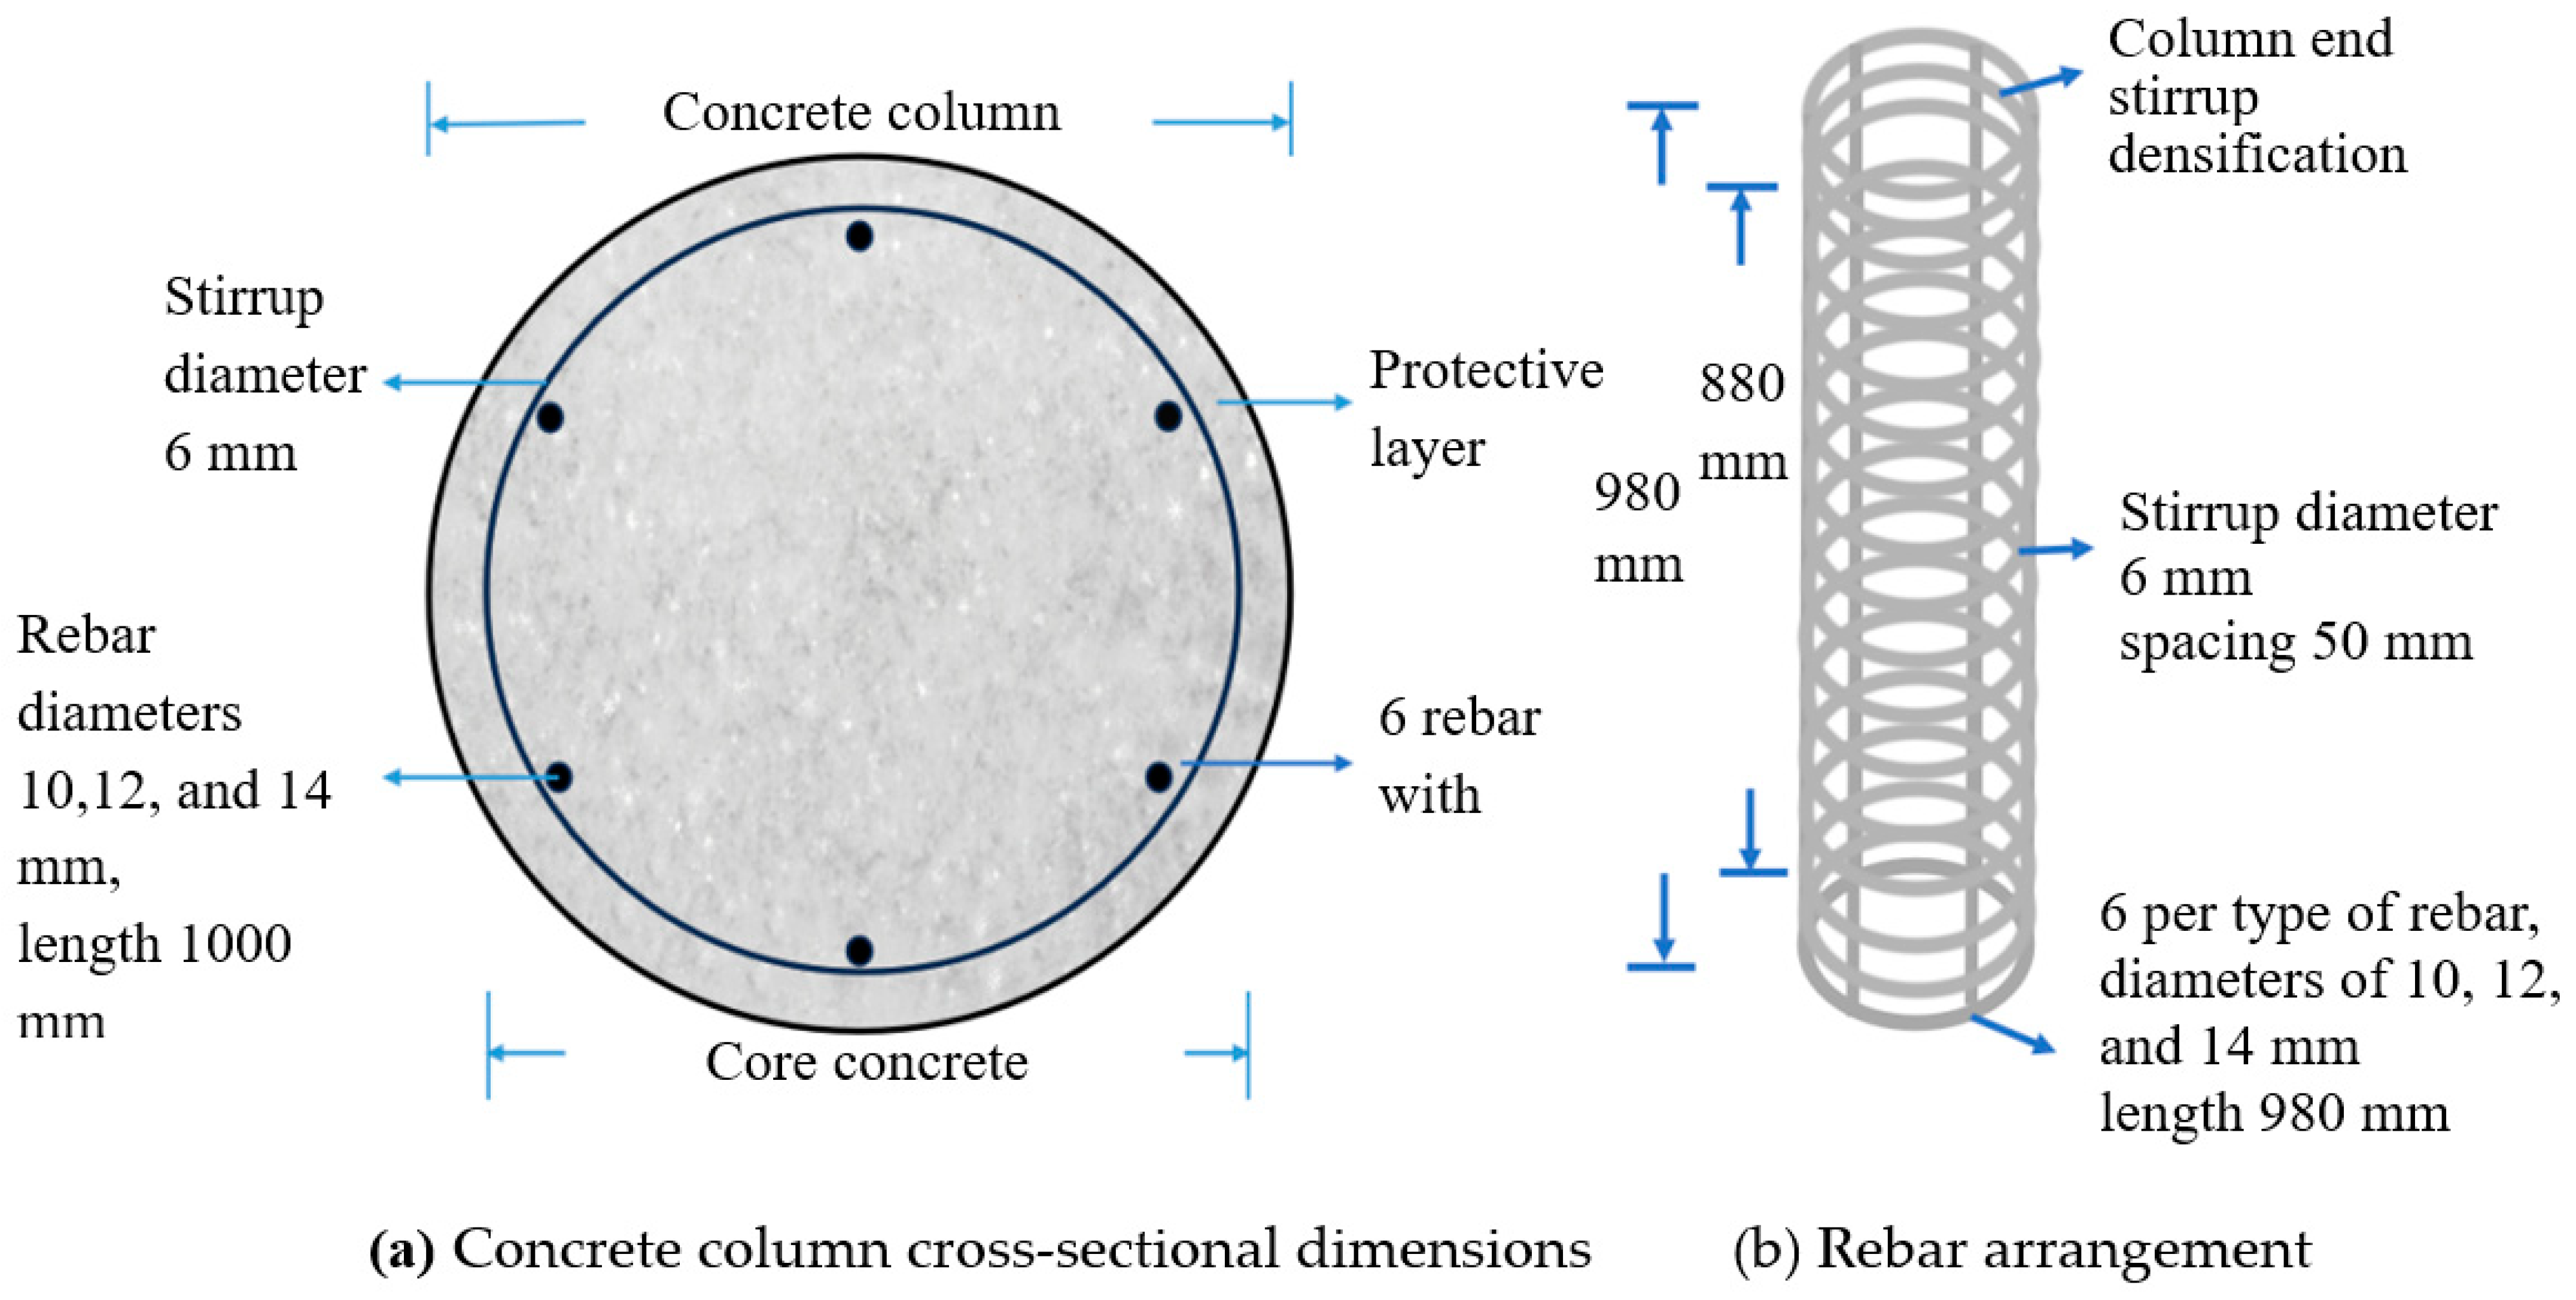
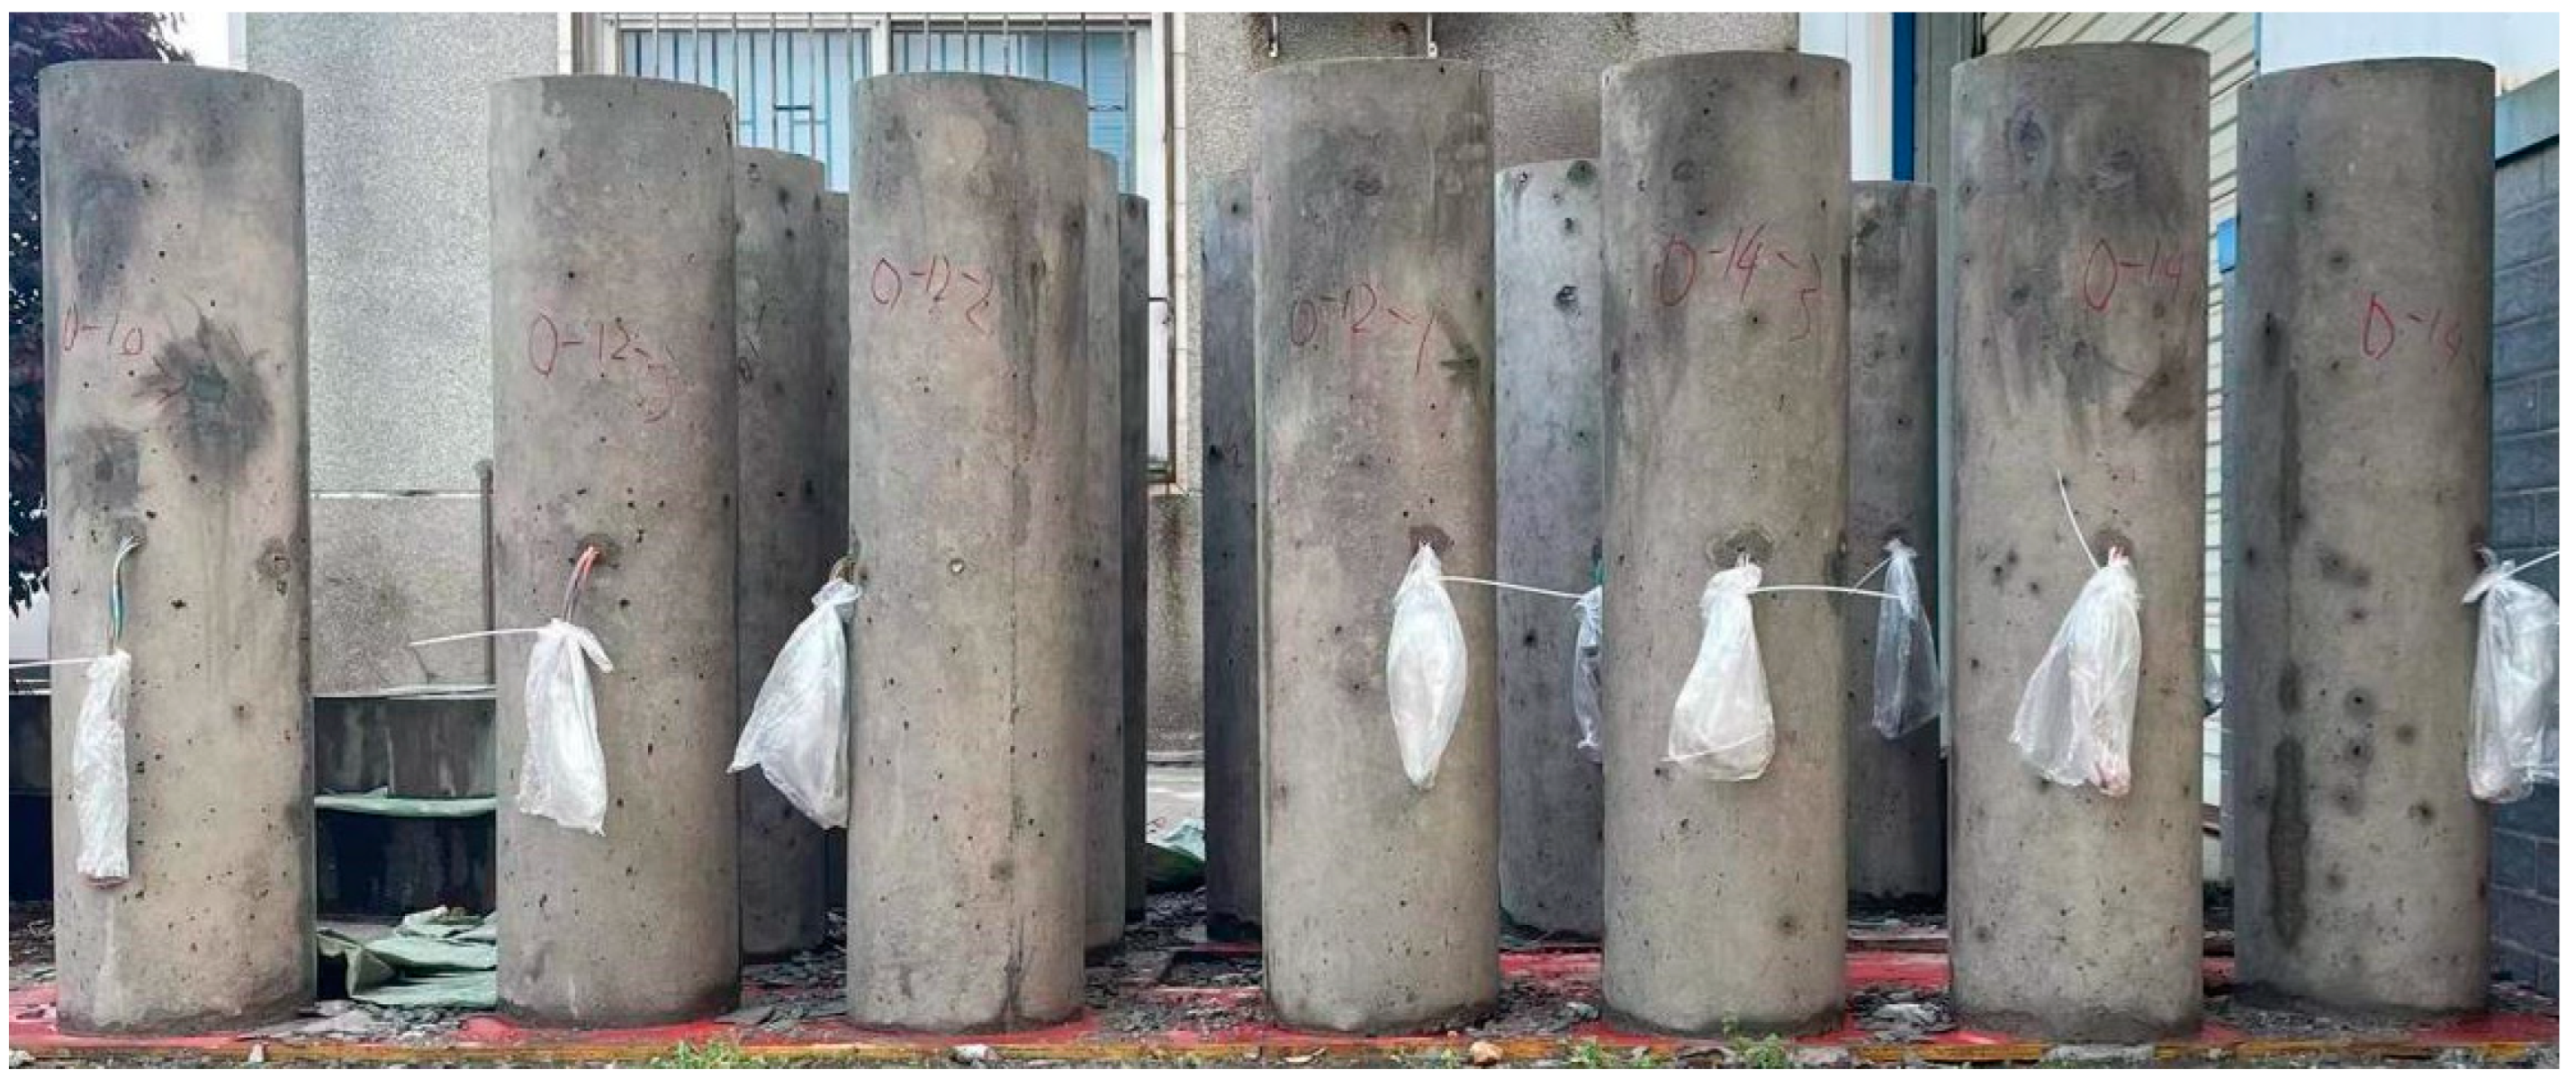
2.2. Component Design and Manufacture

A total of 18 circular concrete columns were designed in this study, nine of which were ordinary reinforced concrete short columns (rebar diameter: 10, 12, and 14 mm; labeled as ORC10, ORC12, and ORC14, respectively), and the other nine were duplex stainless steel reinforced concrete short columns (labeled as Duplex SSRC10 to DSSRC14). The section diameter of the columns was 256 mm, and the height was 1000 mm. HRB400 ordinary steel bars and S2205 duplex stainless steel bars with diameters of 10 mm, 12 mm, and 14 mm were used as the rebars, and six rebars were evenly distributed in each column. HRB400 steel and S2205 duplex stainless steel plain round bars with a diameter of 6 mm were used as the stirrups, with a spacing of 50 mm. The stirrups at both ends of the column were densified, with a reduced spacing of 25 mm. The thickness of the protective concrete layer was 25 mm. The column design parameters are presented in Table 3, and the column cross-sectional design and rebar-stirrup arrangement are shown in Figure 3a,b. The finished concrete columns after pouring construction are shown in Figure 4.

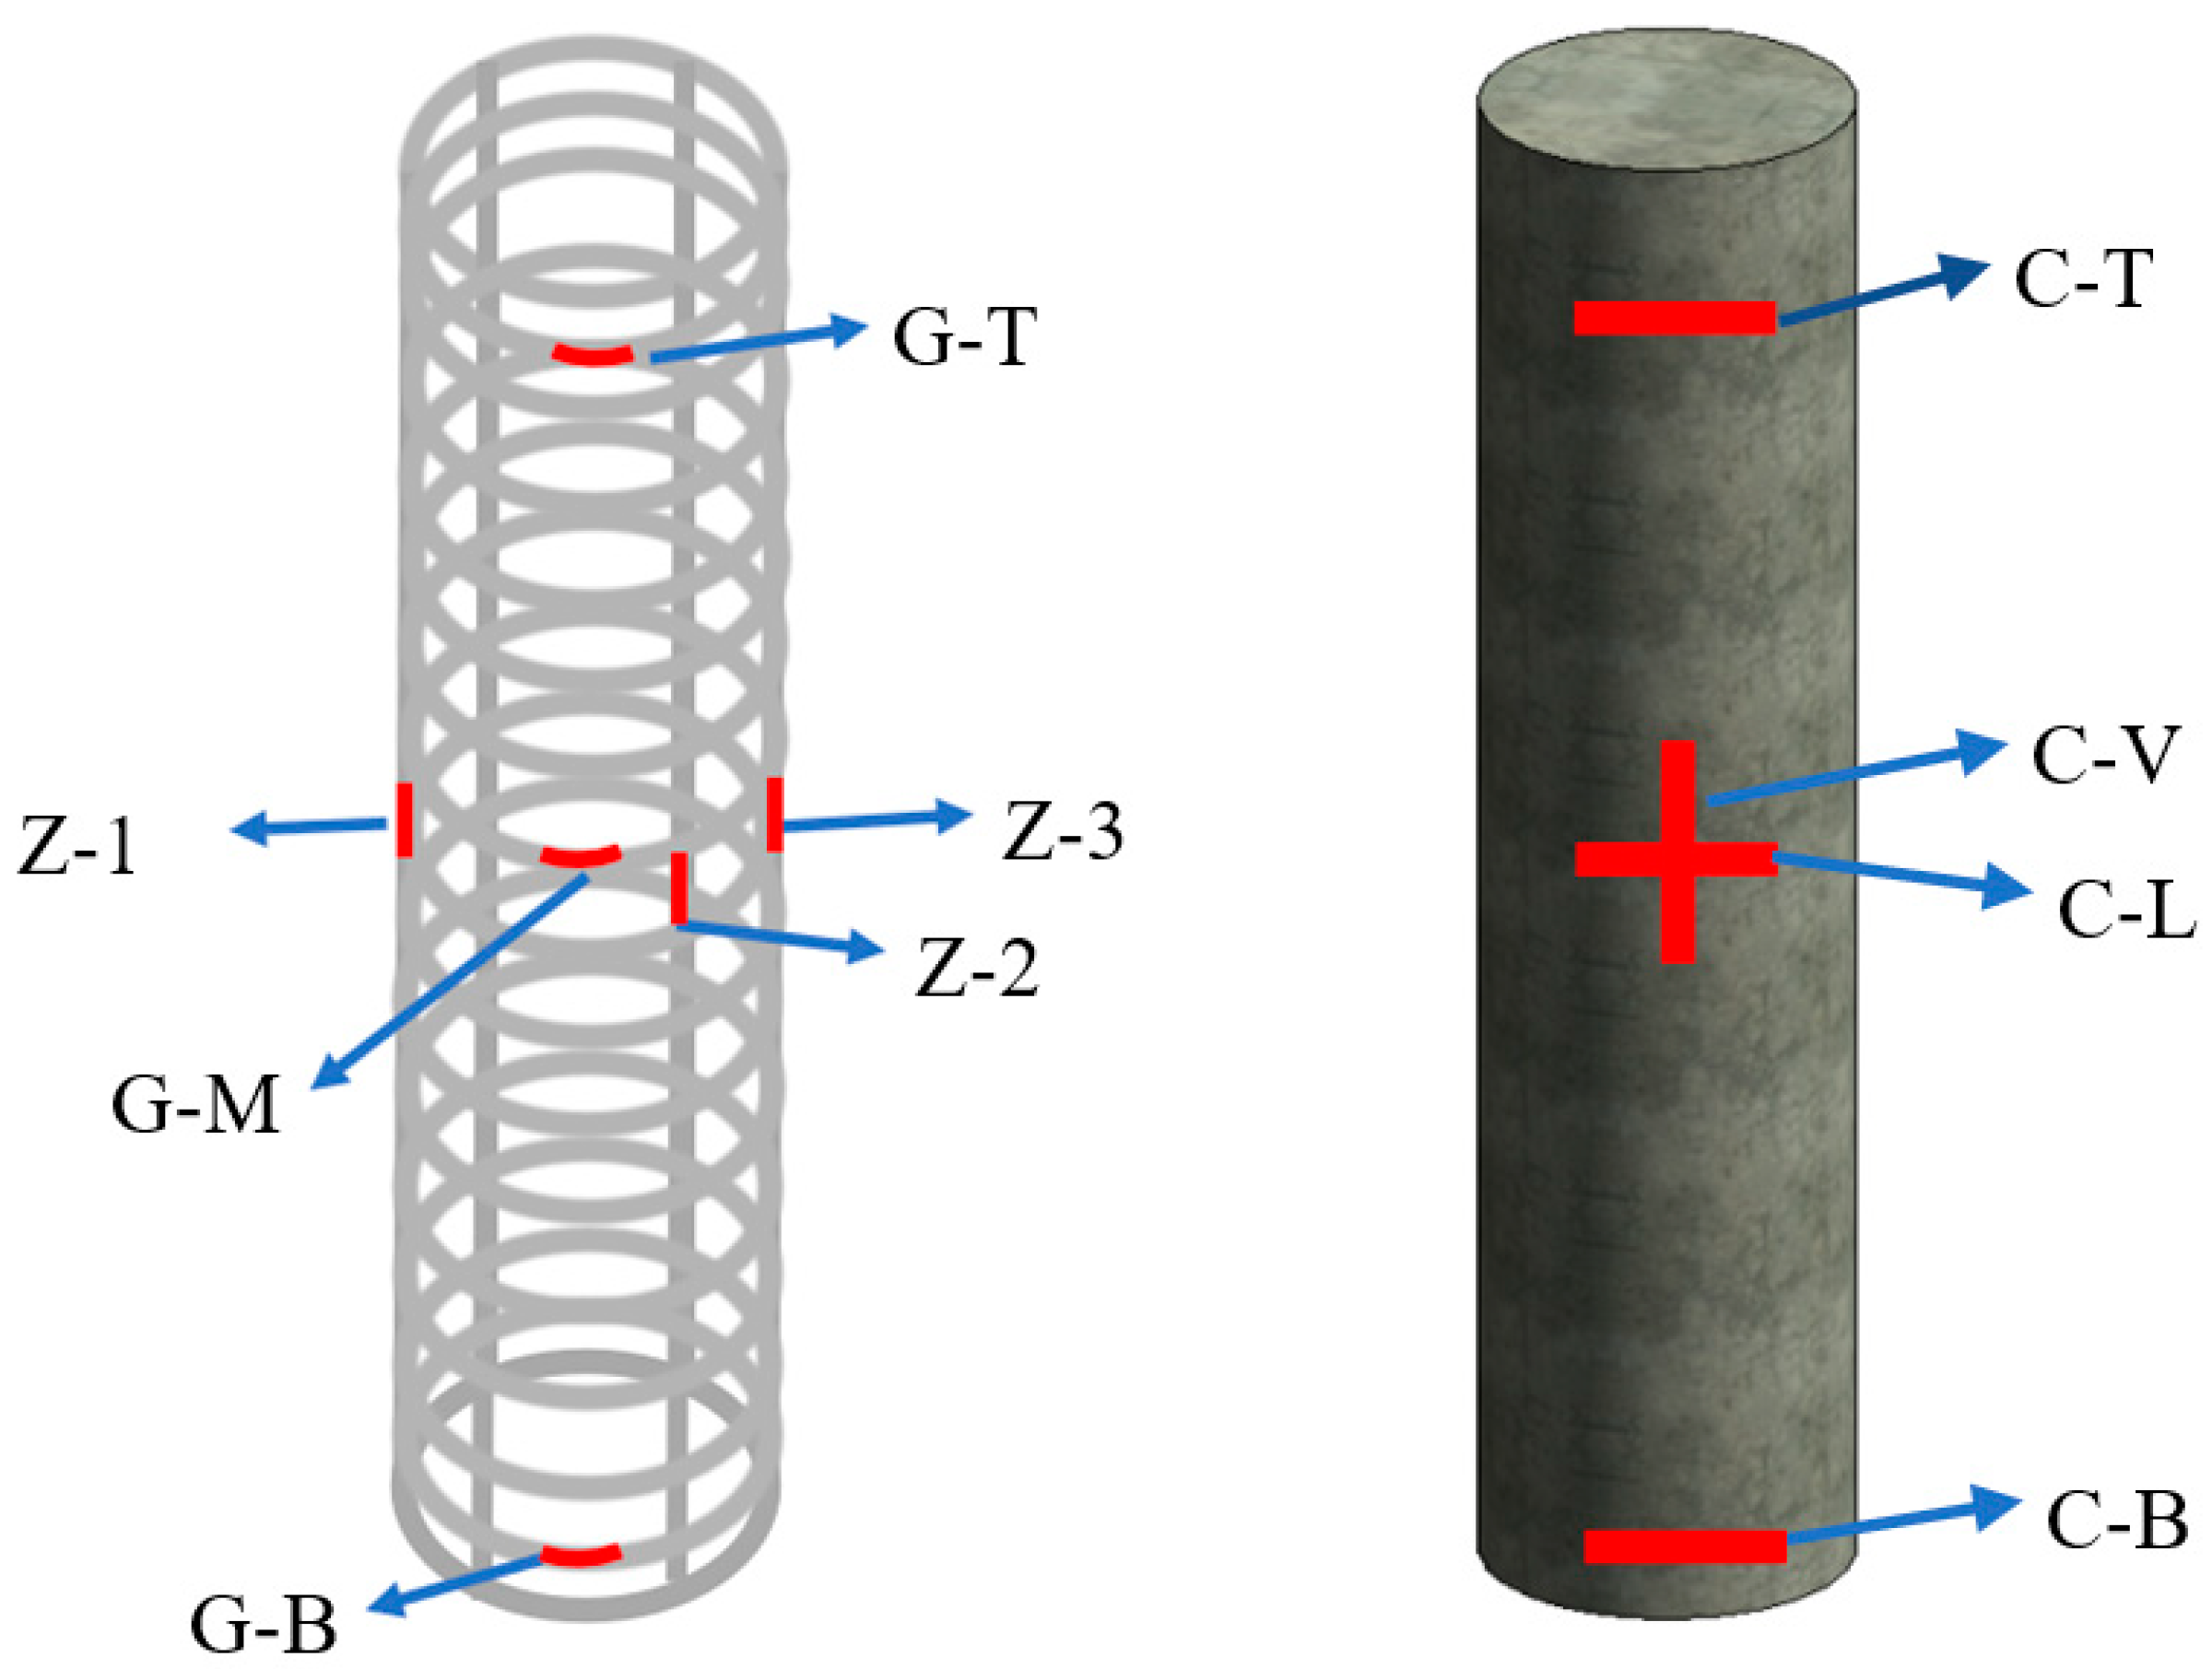
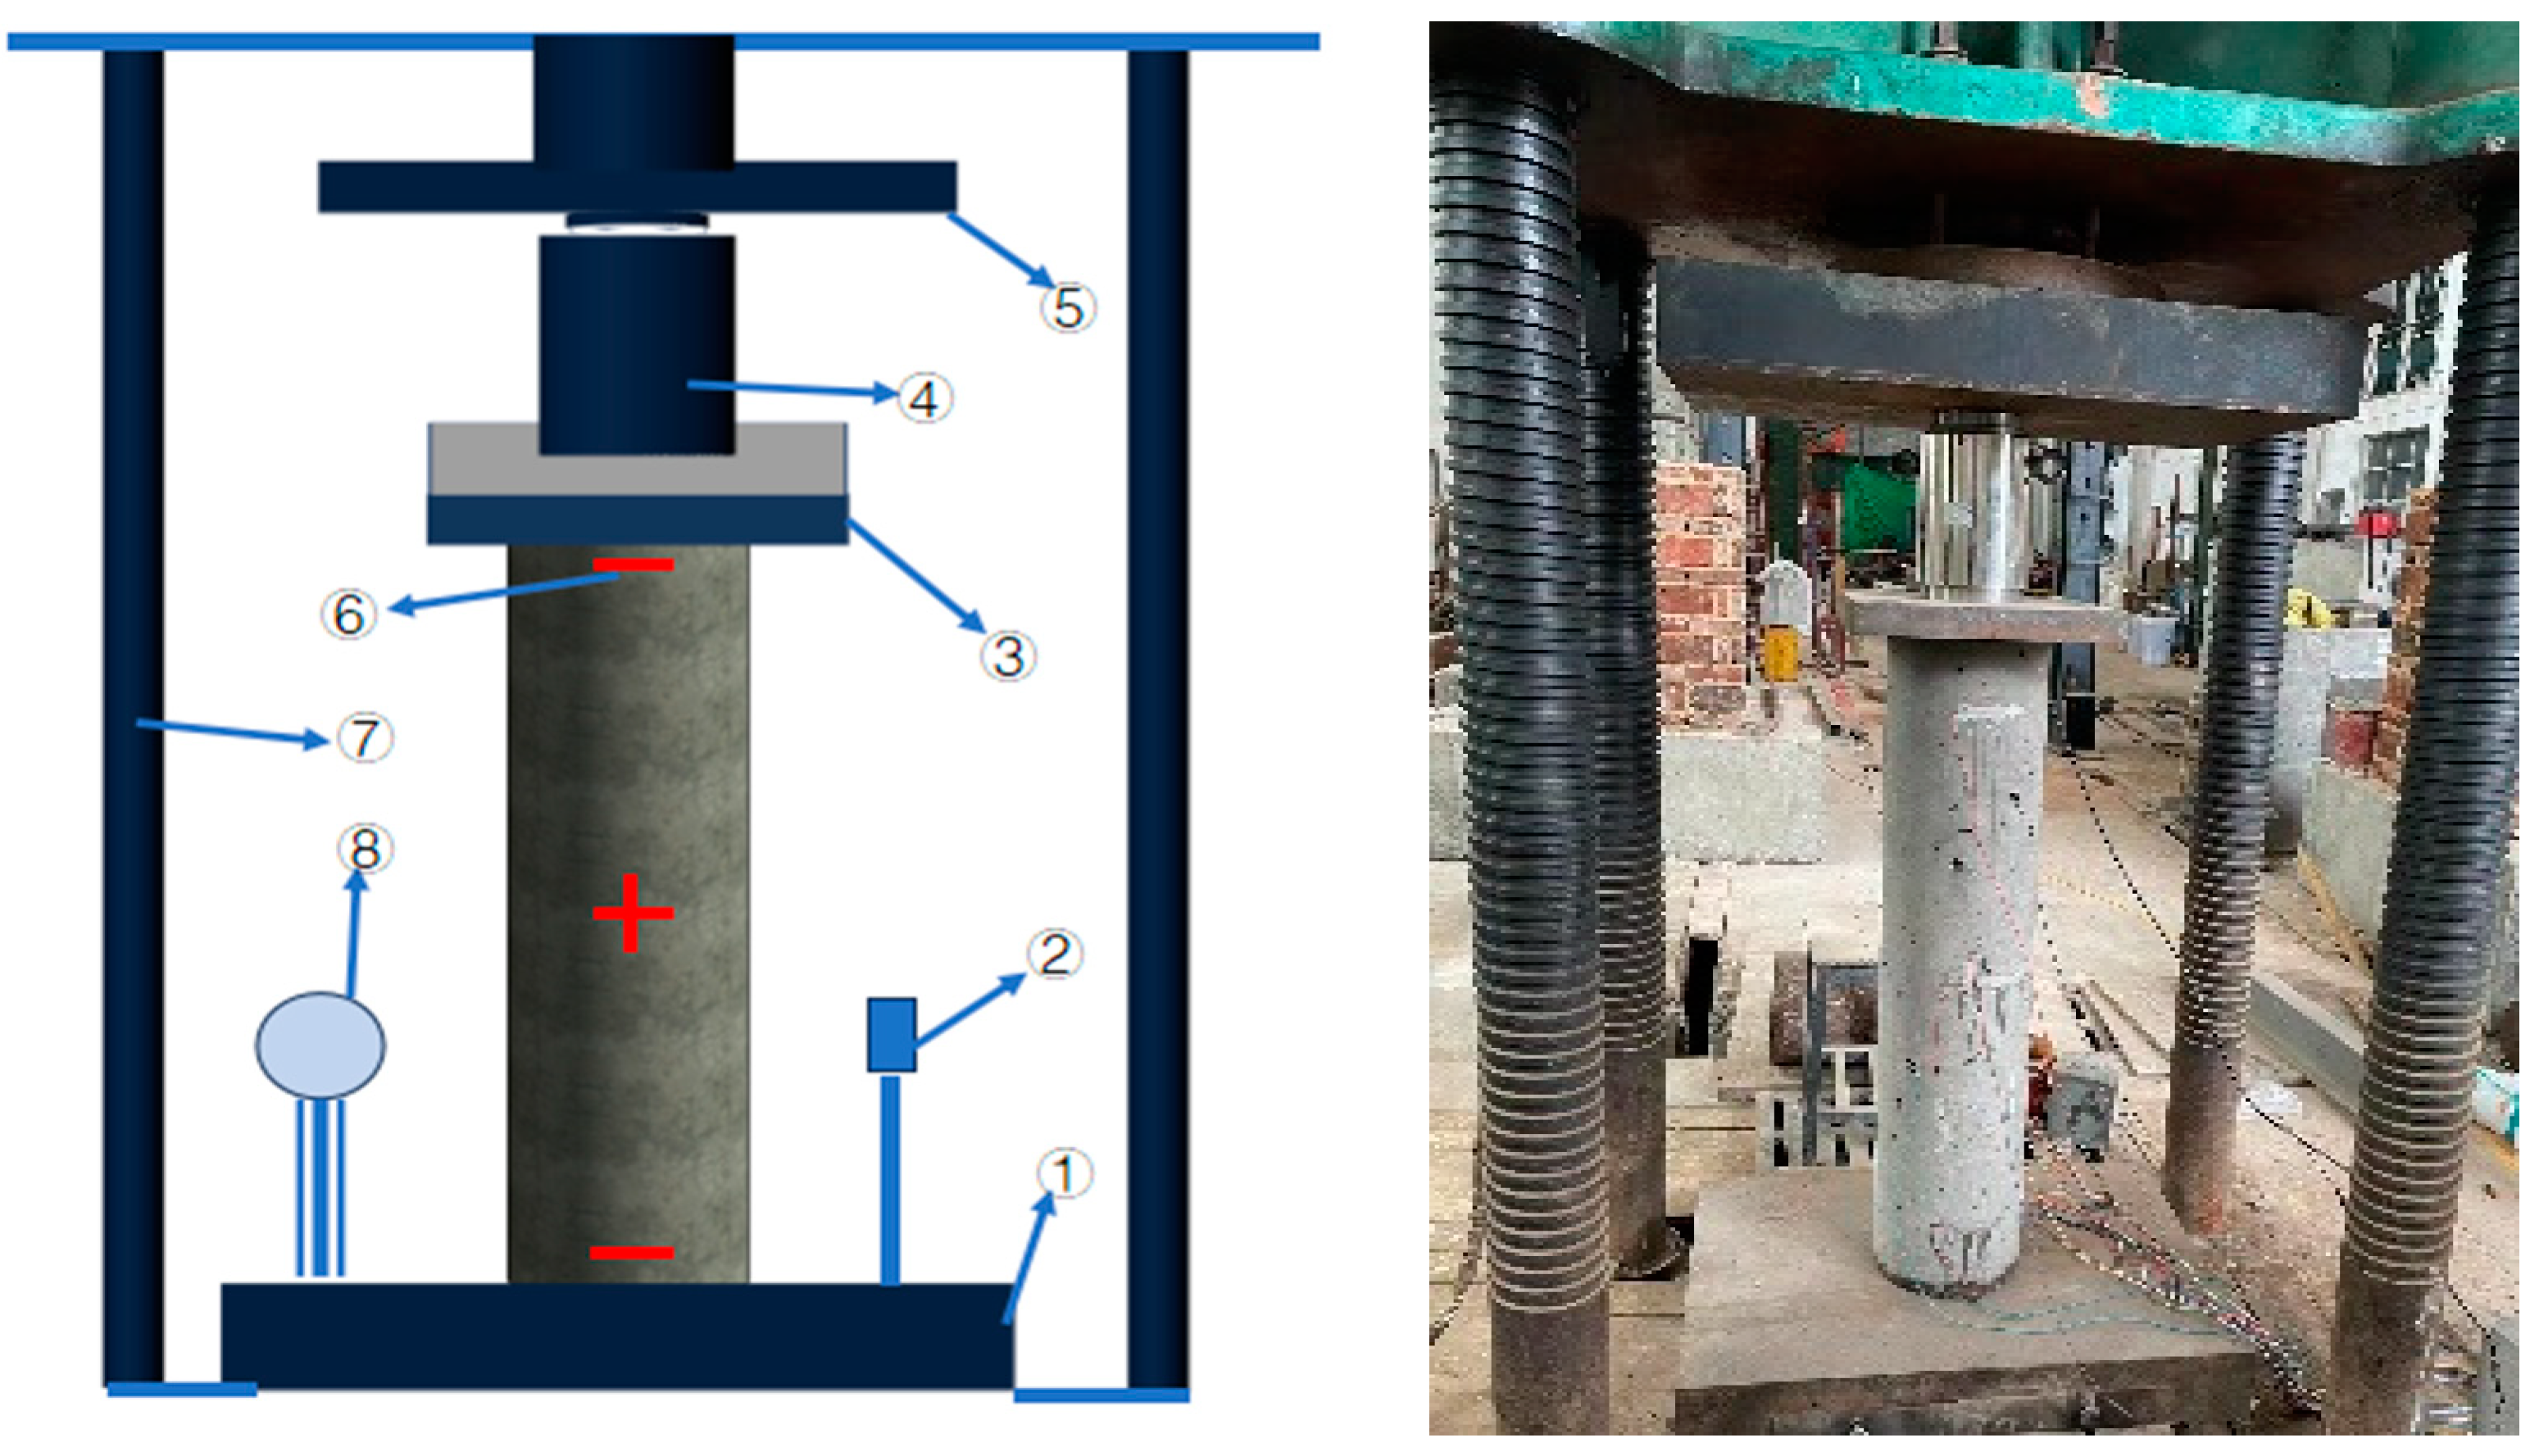
2.3. Measurement Point Arrangement and Loading Method

To measure the stress and deformation of ordinary steel bars, duplex stainless steel bars, and concrete columns, strain gauges were attached at the various measurement points. The specific positions of the strain gauges are shown in Figure 5.
The tests were performed in the structural laboratory of Hunan University of Science and Technology using an XE-5000 hydraulic pressure testing machine. The loading device used in the tests is shown in Figure 6. A plate was placed at the bottom of the testing machine, and a YHD-50 displacement meter and a dial gauge were installed on the left and right of the plate to measure the axial deformation of the concrete column. The pressure sensors were aligned with the axis before the tests, and a DH3816N static stress-strain testing and analysis system was used for real-time data collection from the pressure sensors, displacement gauges, and strain gauges. The crack width was measured using a crack width monitor (HC-U81) with an accuracy of 0.01 mm and a measuring range of 10 mm.
According to the Standard for Test Method of Concrete Structures (GB/T50152-2012) [45], the monotonous static graded loading was adopted for the tests, and the loading rate was controlled at 0.8 kN/s. Before the tests, a DYB-2000 pressure testing machine was used to measure the concrete strength of the test blocks, and the theoretical load of the specimens was calculated according to the measured concrete strength. At the preloading phase after the start of the tests, the load was gradually increased to 15% of the estimated ultimate load. After confirming that the equipment and instruments were working properly, the load was reduced to 0. In the formal loading stage, 1/10 of the estimated ultimate load was applied each time until 75% of the estimated ultimate load was reached. After reaching 75% of the estimated ultimate load, 1/20 of the estimated ultimate load was applied each time. The loading time for each loading was 3 to 5 min. Upon reaching failure, the load was increased continuously and slowly until the failure of the specimen, at which time the test was stopped.

3. Test Results and Analysis

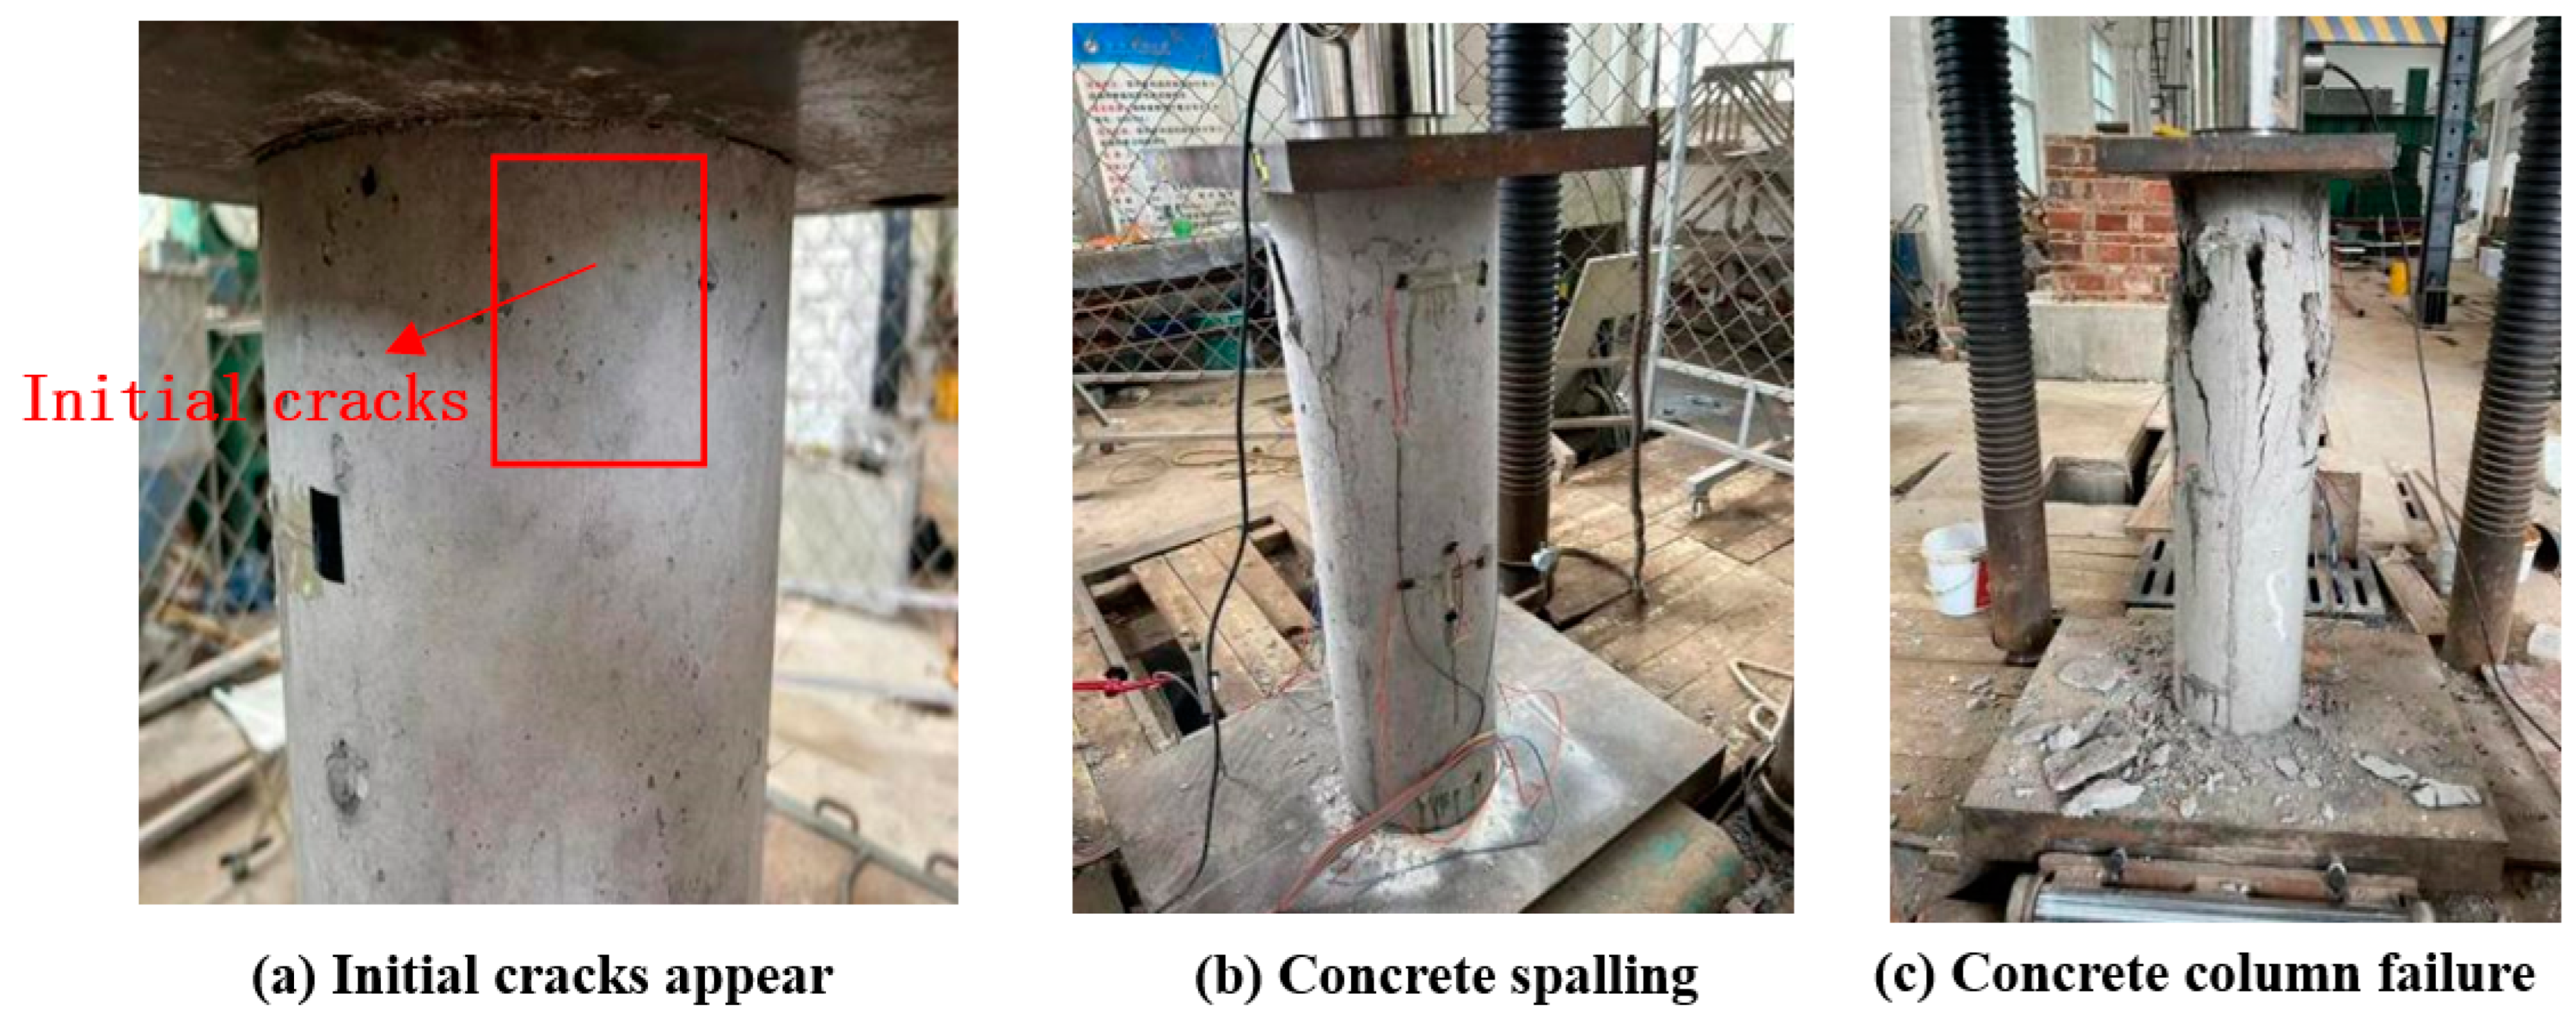
3.1. Analysis of Experimental Phenomena and Failure Modes

During the entire loading process, the mechanical behaviors of the 18 concrete columns in six groups can be divided into elastic, plastic, and failure stages. One representative concrete column from each group was used as an example for failure state description. In the elastic phase, the concrete columns exhibit linear elastic responses after loading and return to the previous shape after unloading. As the load increases, the concrete columns enter the plastic stage, showing plastic deformation, crack propagation, and inelastic behaviors, but can still withstand certain loads. As the loading continues, the concrete columns enter the failure stage, showing obvious failure states after reaching the ultimate load, such as fracture and shear failure. The failed concrete columns are shown in Figure 7 and Figure 8.
Column ORC-10. At the initial loading stage, the ORC-10 concrete column shows no significant deformation and is in the elastic stage. As the applied load is increased to 677 kN (about 47.3% of the ultimate load), the concrete column shows an initial crack (a fine vertical crack in the lower part of the column). As the load increases, the crack gradually extends up to the middle part, and its width increases accordingly. As the applied load is increased to 938 kN, new vertical cracks appear on the upper part of the concrete column. As the load increases further, the upper cracks expand further, causing concrete spalling from the upper part. As the applied load is increased to 1300 kN, the concrete column shows sand and gravel spalling off its surface, and the external vertical and transverse cracks gradually widen and intercross. Meanwhile, the surface concrete spalling is intensified, and the vertical compression deformation of the concrete column is significantly increased. As the load reaches 1430 kN (the ultimate load), the bearing capacity of the concrete column drops sharply, and the stirrups are broken, marking the failure of the concrete column.
Column ORC-12. Its failure process under load is roughly similar to that of concrete column ORC-10. As the applied load reaches 700 kN (about 42.5% of the ultimate load), the concrete column shows initial cracks. As the applied load is increased to 1000 kN, new symmetrical cracks appear in the upper part, and new cracks appear on the opposite surface of the initial cracks in the lower part, while the initial cracks gradually widen and lengthen. As the loading continues to 1190 kN, lateral cracks appear on the upper part, and small pieces fall off. As the applied load reaches 1527 kN, gravel falls from inside the column, and the cracks on the column surface widen, with the spalling of large concrete blocks. As the load reaches 1646 kN (the ultimate load), the bearing capacity of the concrete column drops sharply, and the concrete column fails.
Column ORC-14. Its loading process and failure process are basically the same as the ORC-10 and ORC-12 concrete columns. In the elastic stage, no significant difference is observed. As the load gradually increases, the concrete column exhibits a cracking load close to those of ORC-10 and ORC-12. However, the ultimate load of concrete column ORC-14 is higher than those of ORC-10 and ORC-12, reaching 1730 kN.
Concrete column DSSRC-10. At the initial loading stage, the concrete column is in the elastic working stage. As the load reaches 800 kN, the concrete column shows an initial crack (a small vertical crack in the upper part of the column). As the loading continues, the crack extends downward while multiple new cracks appear. As the applied load reaches 1400 kN, sand, gravel, and debris fall off the concrete column. As the applied load reaches 1870 kN (the ultimate load), the stirrups are broken, and the rebars bulge outward under compression, marking the failure of the concrete column.
Concrete columns DSSRC-12 and DSSRC-14. The loading and failure processes of these two columns are similar to those of the DSSRC-10 concrete column. The DSSRC-12 and DSSRC-14 concrete columns show initial cracks (small cracks) under a load of 790 kN. As the loading continues to reach 1000 kN, the cracks in the DSSRC-12 and DSSRC-14 concrete columns expand further. DSSRC-12 shows debris spalling under a load of 1674 kN. DSSRC-14 shows debris spalling under a load of 1700 kN. As the loading continues until the concrete column fails, the DSSRC-12 concrete column shows an ultimate load of 1996 kN, and the DSSRC-14 concrete column shows an ultimate load of 2213 kN.
In general, when the reinforced concrete column is subjected to axial pressure, the concrete column is mainly subjected to axial pressure by three parts: concrete bearing capacity, stirrup stress, and longitudinal stress. At the initial stage of loading, the force of the concrete column is in the linear elastic stage, and the axial pressure is mainly borne by concrete. With the increase of axial pressure, the surface of the concrete column cracks, and with the increase of loading time, the force of the concrete column enters the elastic-plastic stage. At this time, the core concrete and longitudinal reinforcements are carried together, and the compressive strength of the ordinary steel bar is less than that of the duplex stainless steel bar. At this stage, the axial pressure of the double-phase stainless steel reinforced concrete column is larger than that of the ordinary reinforced concrete column. In the failure stage, when the longitudinal reinforcement reaches the compressive strength, the longitudinal reinforcement deformation increases, but the longitudinal reinforcement deformation is constrained by the stirrup. With the increasing axial pressure, the stirrup reaches the tensile strength, the stirrup is pulled off, and the specimen is destroyed.

3.2. Force Analysis

Table 4 presents the axial compression test results of the ORC concrete columns and DSSRC concrete columns. It can be observed that the cracking load of the concrete column is not strongly correlated with the diameter of the reinforcing bars. However, the ultimate load is related to the steel bar diameter and closely related to the type of steel bar. The ultimate loads of the ORC concrete columns and DSSRC concrete columns increase as the steel bar diameter increases. With the same steel bar diameter, the ultimate load of the DSSRC concrete columns is 17.5% to 30.7% higher than that of the ORC concrete columns. Therefore, the mechanical properties and working performance of DSSRC concrete columns are better than those of ORC concrete columns.

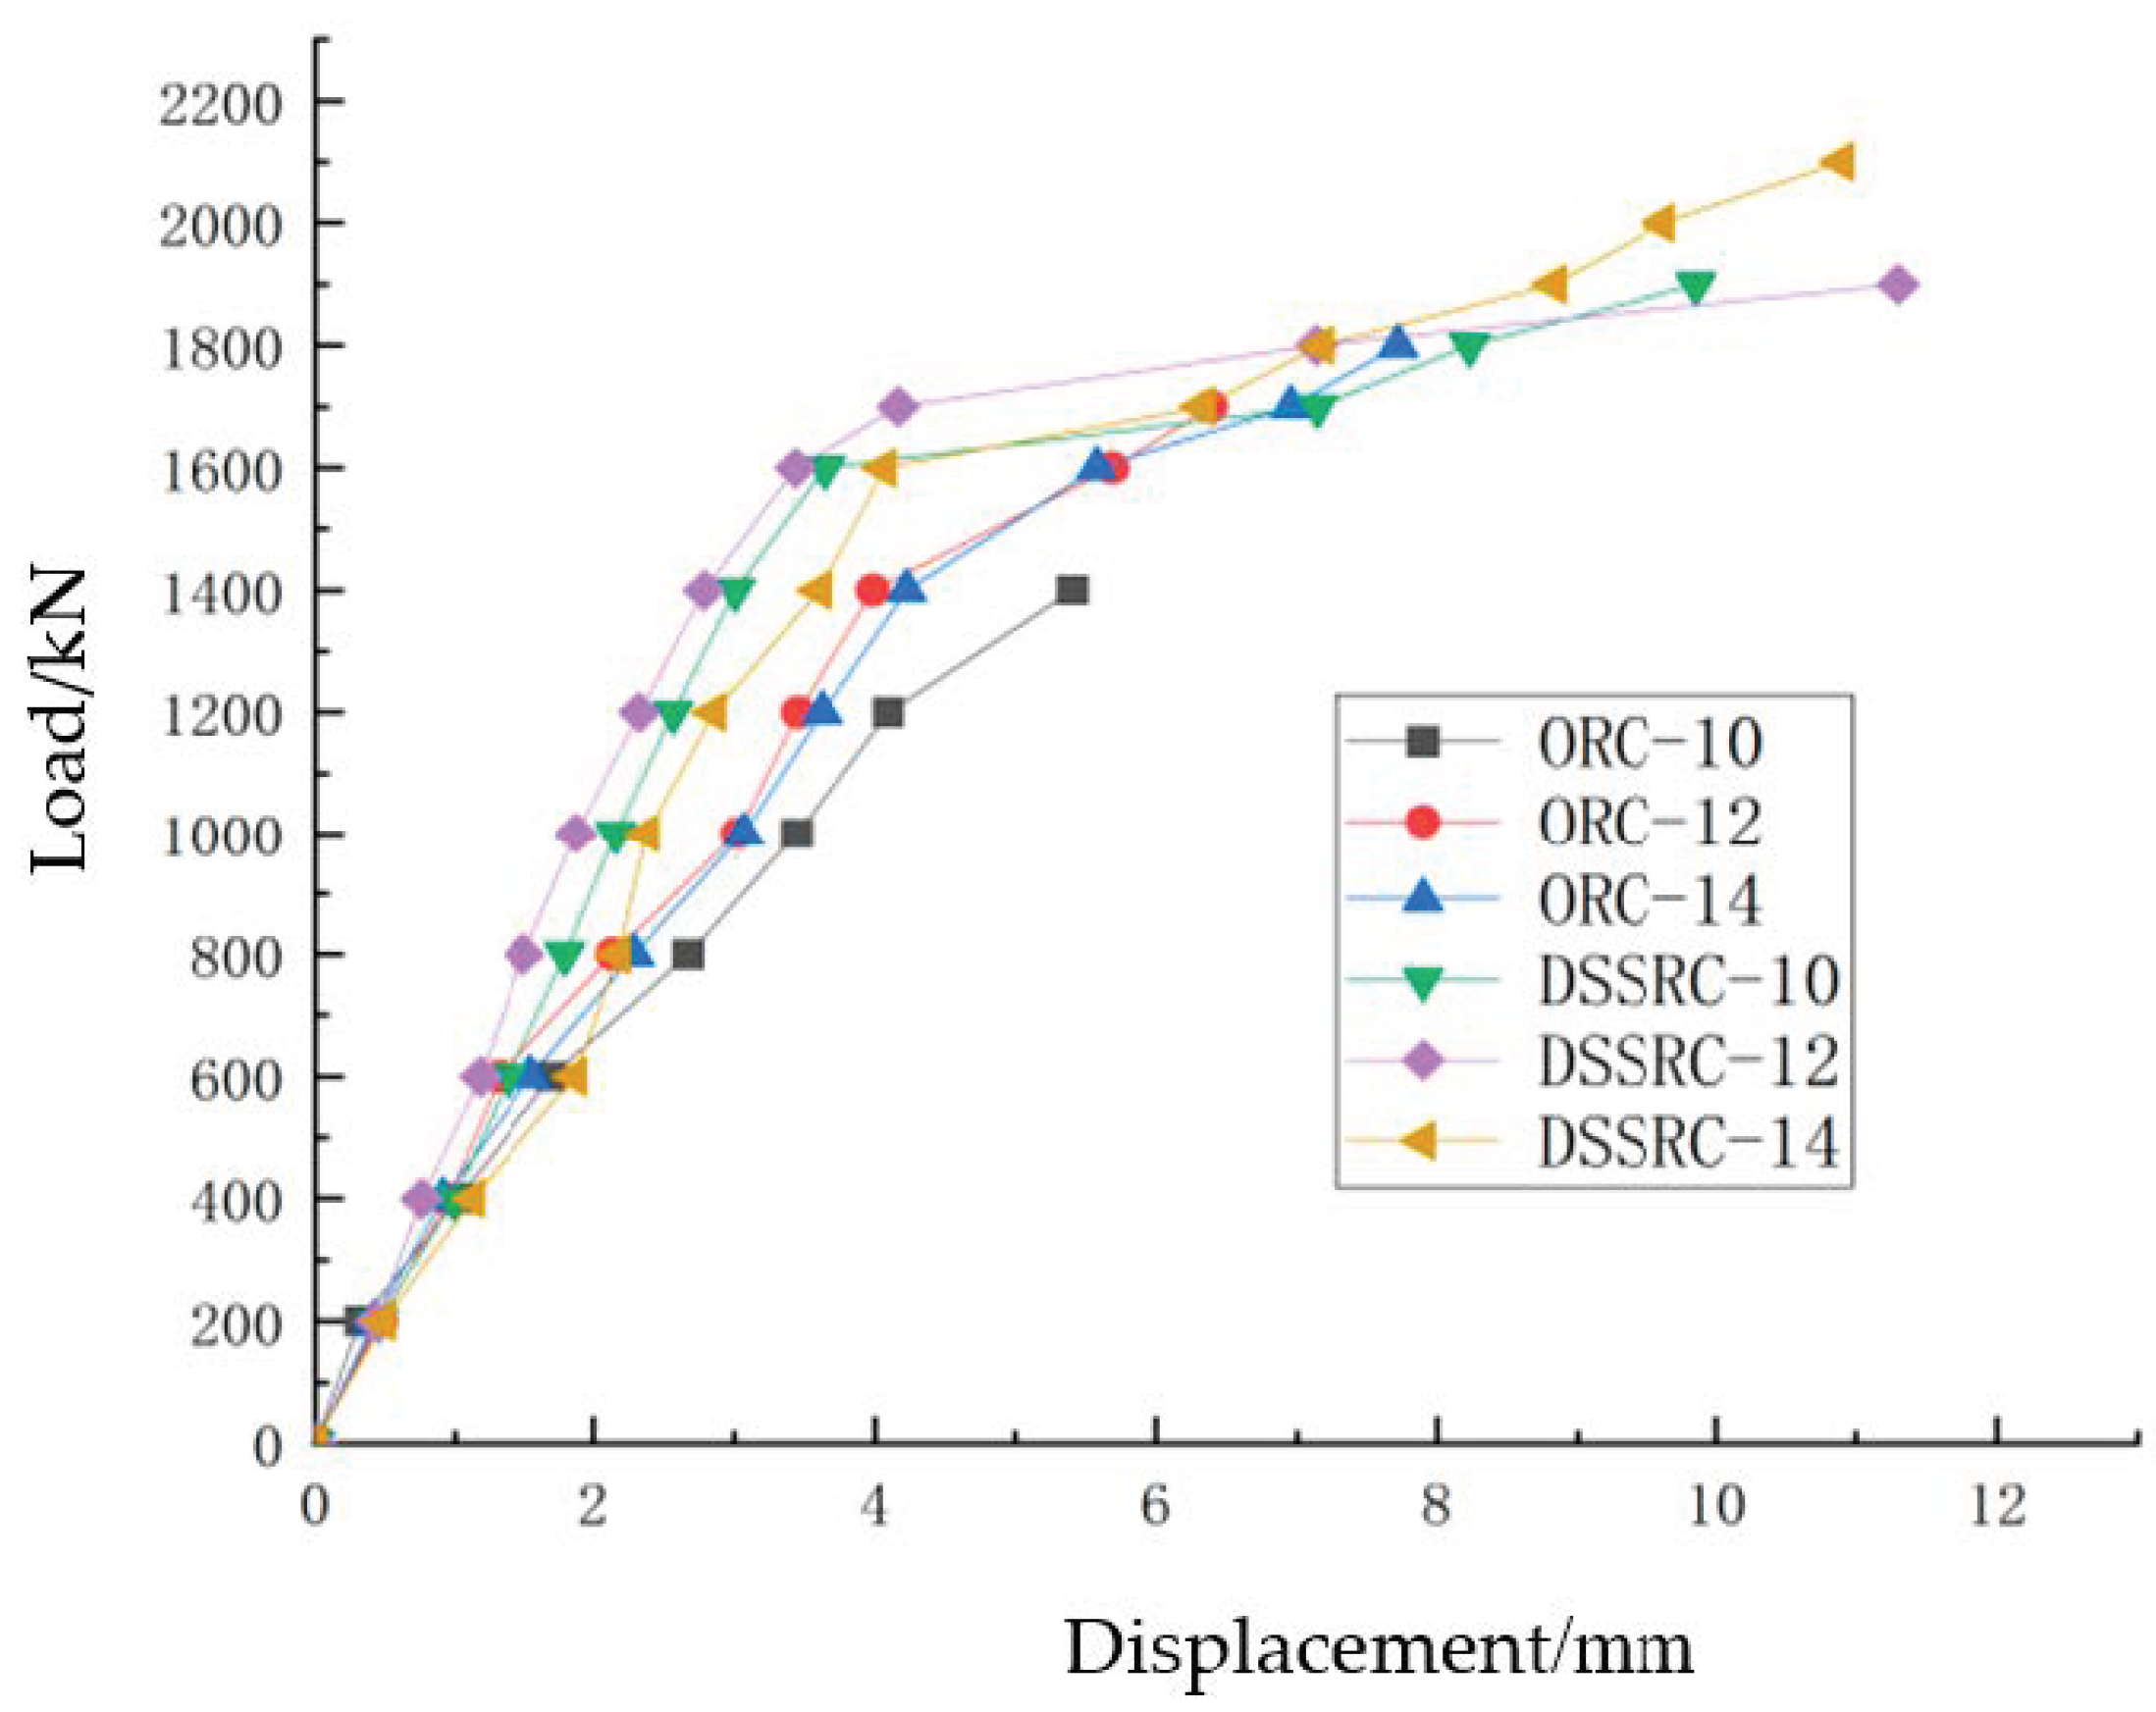
3.2.1. Load–Displacement Curve

Figure 9 shows the load–displacement curves of ORC concrete columns and DSSRC concrete columns. It can be observed that in the initial stage, the load-displacement curve of the concrete column is approximately linear. As the load reaches about 80% of the ultimate load, the stiffness of the concrete column decreases, and the displacement increment accelerates. After reaching the ultimate load, the DSSRC concrete columns can still maintain a certain displacement increment, while the load shows no rapid decrease. Therefore, the duplex stainless steel bars and concrete had a good bonding performance, and the high elongation of the duplex stainless steel bars improves the ductility of the DSSRC concrete column under an axial load.

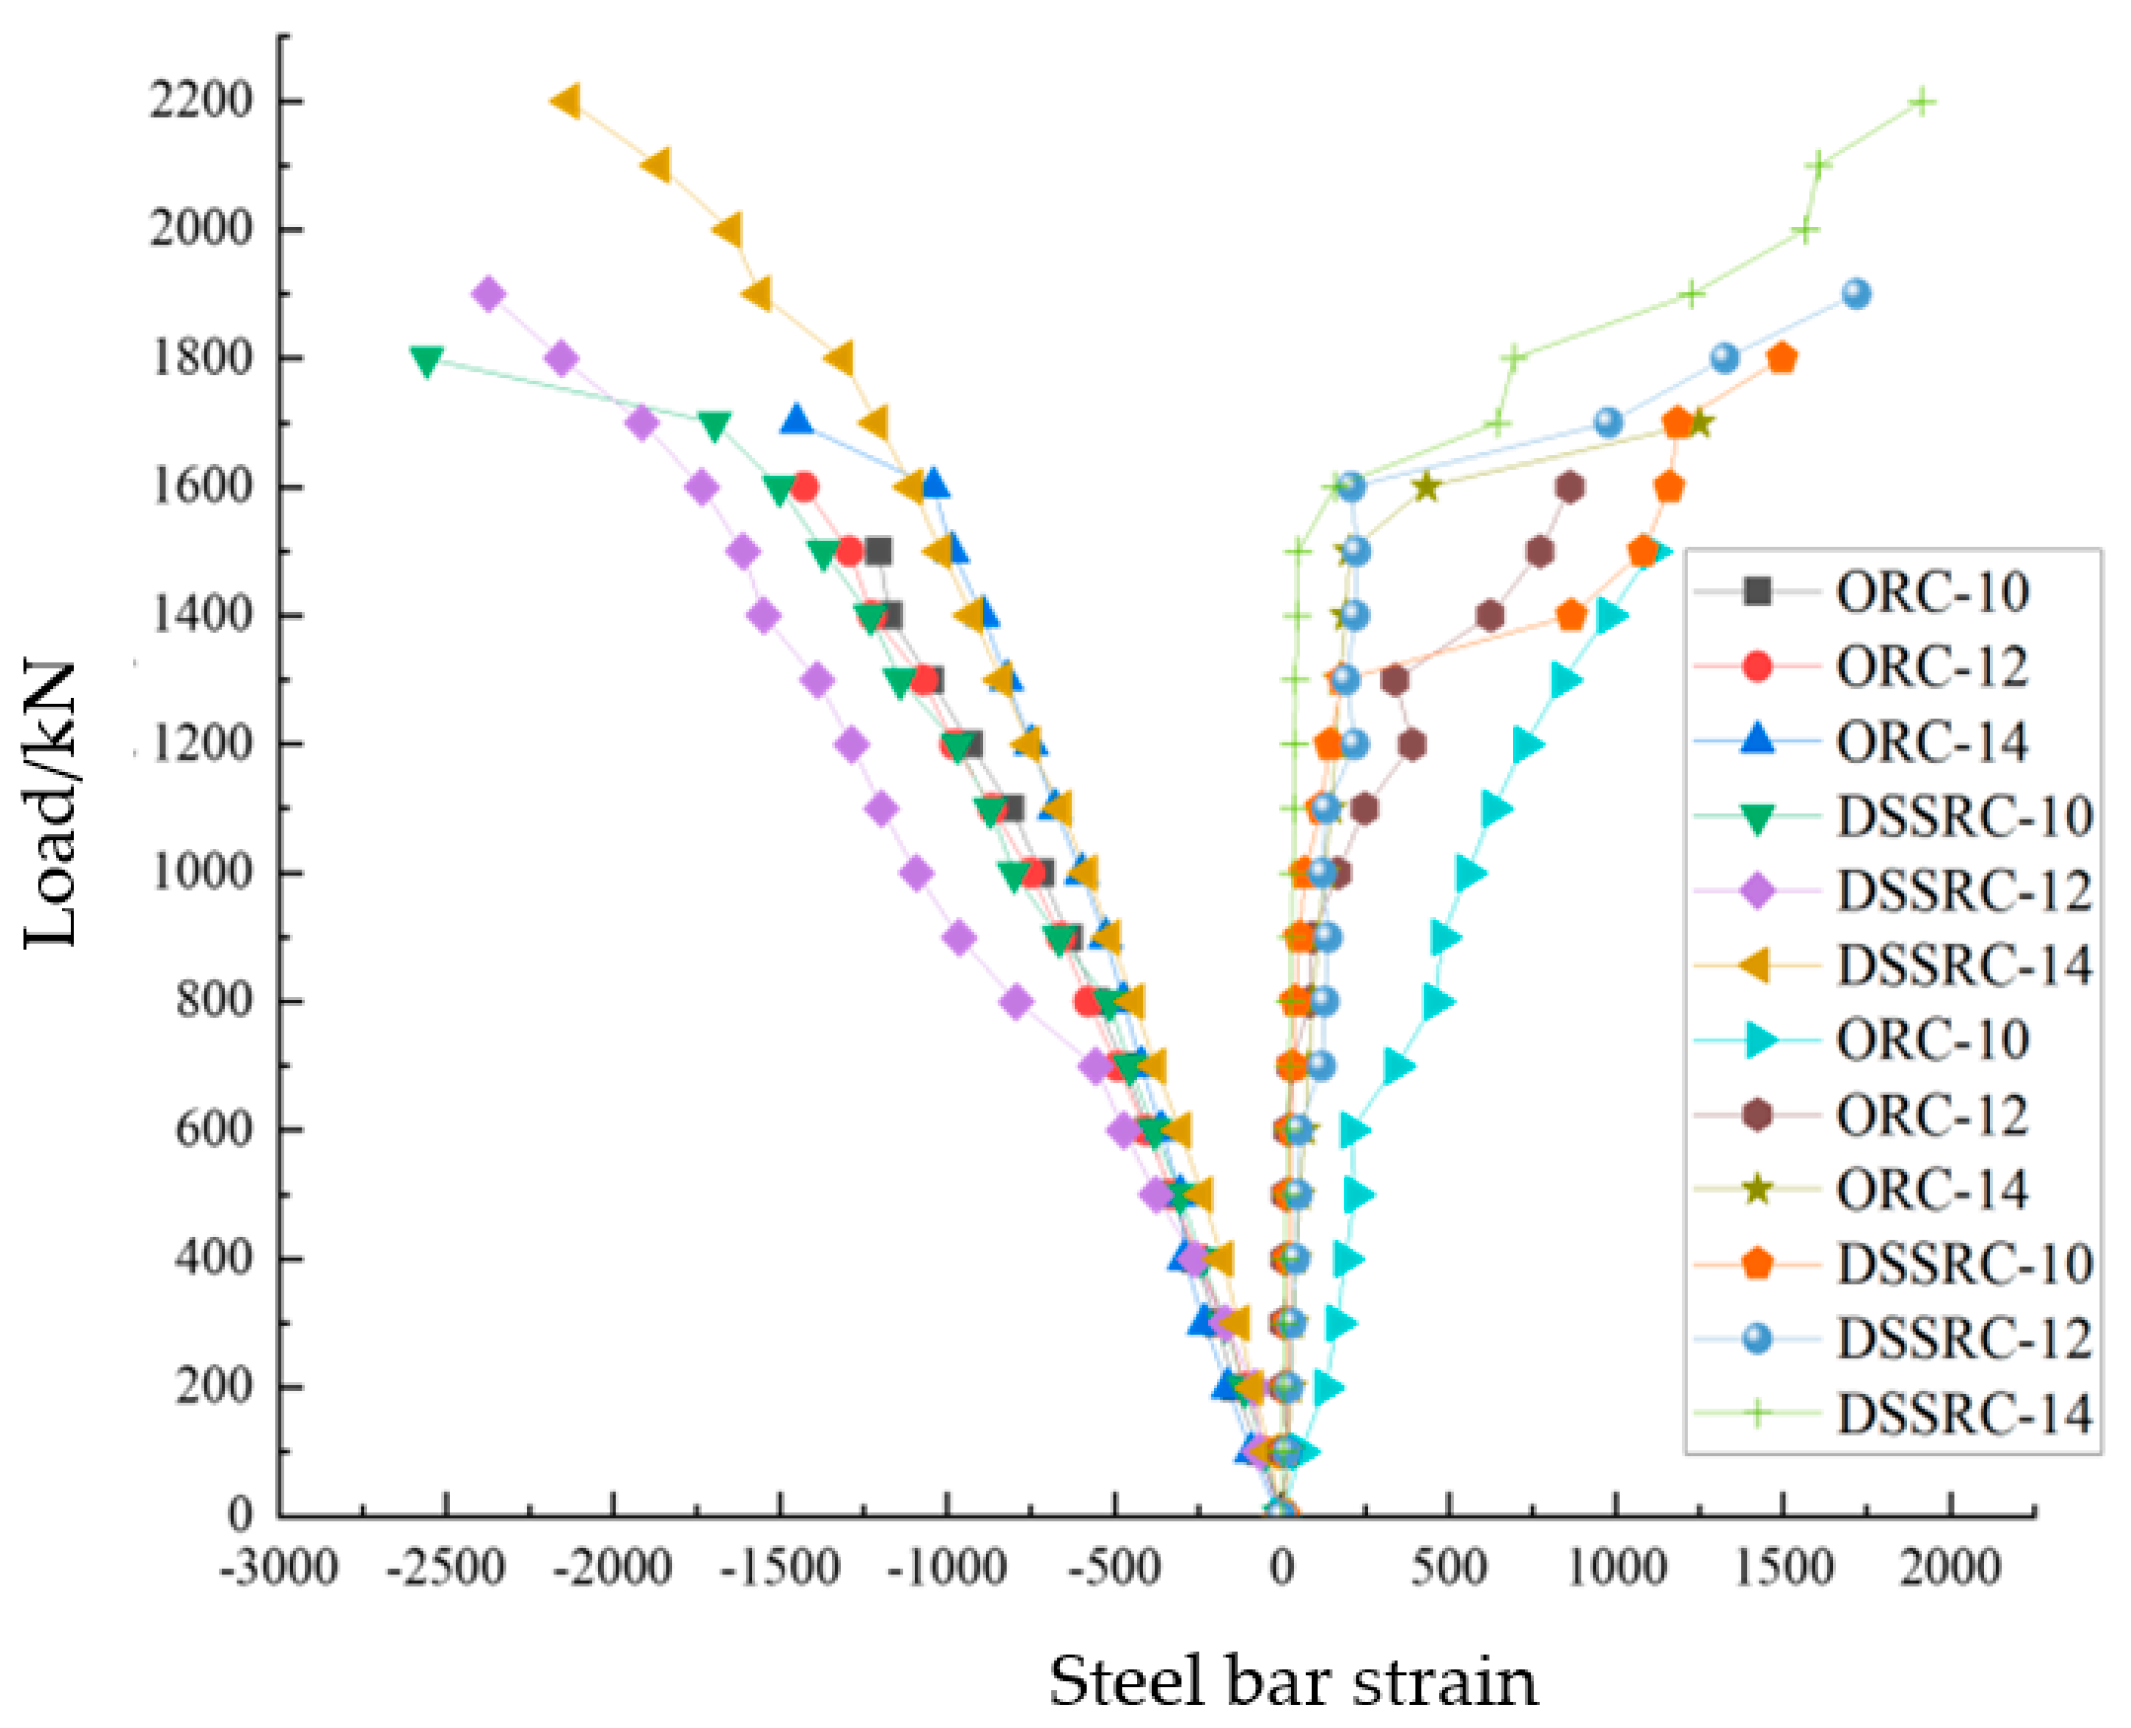
3.2.2. Load–Strain Curves of Steel Bars

Figure 10 shows the load–strain curves of steel bars for ORC series concrete columns and DSSRC series concrete columns. It can be seen that at the beginning of loading, the load and strain of ordinary and duplex stainless steel bars exhibit a linear relationship. With the increase of loading, the linear relationship gradually transforms into a nonlinear relationship. After the load reaches approximately 80% of the ultimate load, the increasing strain rate begins to accelerate, indicating that the steel bar is beginning to yield. When the concrete column reaches the yield load, the preload grows slowly, the strain of the steel bar grows rapidly, and the slope of the load-strain curve becomes flat.
When the concrete column reaches the peak load, the strain of duplex stainless steel bars can maintain a significant increase with a decreasing load, and the strain of ordinary steel bars increases slowly. It can also be seen from the figure that among the ORC series concrete column reinforcement, ORC-14 carries the largest load, and ORC-10 carries the smallest load.
This result indicates that the peak strain of the steel bars increases with the increase in the steel bar’s diameter. For concrete columns with the same diameter, the DSSRC series concrete columns show greater load-bearing capacity and peak strain than the ORC series concrete columns, suggesting that the steel bar in the DSSRC series concrete columns has better ductility as the load-bearing capacity increases.

3.2.3. Concrete Strain Analysis

As shown in Figure 11, the positive and negative horizontal coordinates represent the transverse tensile strain and the axial compressive strain of the concrete short columns subjected to axial load, respectively. In different types of steel bars, the transverse strain in concrete increases with increasing load and shows a linear correlation with an approximately similar growth trend, suggesting that the transverse strain in concrete is independent of the steel bar type. As for the axial strain, the initial growth trend is generally similar. However, the strain values of RC-S bars are larger than those of RC-O bars with increasing load. These results indicate that as the strength of the steel bar increases, the axial strain in the concrete column increases accordingly.

3.2.4. Calculation of the Axial Compressive Load-Bearing Capacity of DSSRC Columns

The bearing capacity in a positive section of duplex SSRC axial compression columns was analyzed following the term 6.2.15 in GB50010-2010 “Code for Design of Concrete Structures”. The compressive bearing capacity of axial compression columns of a spiral stirrup can be calculated by:
N u = 0.9 ( f c A c r + f y A s + 2 α f y v A s s o )
where f c is the design value of the axial compressive strength of concrete; A c r is the core cross-sectional area of the concrete column, taking the area of concrete within the inner surface of the stirrup; f y is the design value of the compressive strength of longitudinal steel bar; A s is the cross-sectional area of all longitudinal compression steel bars; f y v represents the design value of the tensile strength of the stirrup; A s s o is the converted cross-sectional area of the stirrup; α is the discount factor for concrete restraint by stirrup, when the concrete strength does not exceed C50, α = 1.0 . After substituting the relevant parameters and data into Equation (1), N u can be calculated.
The bearing capacity of eighteen concrete columns of six groups was calculated by substituting the specimen parameters, coefficients, and measured values of steel bars and concrete into the axial compression equation. The obtained theoretical and experimental averages were used for comparison analysis, and the results are shown in Table 5. In this analysis, we used the axial compression formula, which considers the specimen parameters, coefficients, and measured values of steel bars and concrete. By substituting these values into the equation, the theoretical bearing capacity of each specimen was obtained. In order to compare the theoretical and experimental values, we calculated the average value of all the specimens. The theoretical average is the average of the expected bearing capacity calculated according to the equation, and the test average is the average of the bearing capacity measured according to the actual test. A comparative analysis of the two averages was performed to assess the consistency and accuracy between the theoretical calculations and the experimental measurements, as shown in Table 5.
It can be seen that the experimental values of the ultimate load capacity of duplex SSRC columns are relatively close to the theoretical values. The test values of the specimens were generally greater than the theoretical values calculated according to the Code, indicating that the results calculated according to the Code are relatively reasonable. However, due to the limited number of tests, the formula for calculating the ultimate load-bearing capacity of duplex SSRC columns still requires further investigation.

4. ABAQUS Finite Element Analysis of DSSRC Columns

Finite element analysis is commonly used to simulate the mechanical behavior of structures and materials, including ABAQUS, ANSYS, Nastran, and others. In this paper, the ABAQUS method is used to simulate the concrete column. With the development of computer technology, the finite element method has become an efficient and accurate engineering evaluation method in recent years. The ABAQUS software has shown good applicability to nonlinear problems with high computational accuracy [46,47]. Due to limitations in cost and test conditions, it is difficult to accurately and comprehensively analyze all of the factors affecting the stress performance of SSRCS by test. Therefore, the stress performance of SSRC columns is analyzed by finite element analysis using the ABAQUS software. Based on the test in Section 2 and the two sets of tests performed by the group, a finite element model was established. The results of the model analysis are compared and verified with the existing test data. The damage mechanism of SSRC concrete columns was also investigated by analyzing the effects of several parameters on their mechanical properties.

4.1. Material Modeling

4.1.1. Constitutive Model of the Stainless Steel Bar

The unique mechanical properties of stainless steel need to be properly characterized by a corresponding constitutive model. Among the current models, the Rasmussen model [48] can concisely and accurately reflect the stress-strain relationship of stainless steel, and has been widely applied in previous finite element analyses. Therefore, this study adopted the Rasmussen model to analyze the stainless steel bars. The stress-strain relationship is as follows:
ε = σ E 0 + 0.002 ( σ σ 0.2 ) n σ     σ 0.2
ε = ( σ σ 0.2 ) E 0.2 + ε u ( σ σ 0.2 σ u σ 0.2 ) m + ε 0.2 σ > σ 0.2
n = ln 20 ln ( σ 0.2 σ 0.01 )
E 0.2 = E 0 ( 1 + 0.002 n E 0 σ 0.2 )
m = 1 + 3.5 σ 0.2 σ u
ε 0.2 = σ 0.2 E 0 + 0.02
where n is the strain hardening index; E0 is the elasticity modulus; σ 0.2 and σ 0.01 are the ultimate elastic stress values, corresponding to residual strains of 0.2% and 0.01%; σ u is the ultimate stress; and ε u is the ultimate strain.
The Rasmussen model is an explicit function of strain with respect to stress. In order to properly use this model, the above equations need to be converted to explicit functions on strain. In this paper, the approximate stress-strain inversion relationship proposed by Abdella [49] is used, and its stress-strain relationship is plotted in Figure 12.
The equations are as follows:
σ = σ 0.2 × r ε n 1 + ( r 1 ) ( ε n ) p           0     σ n     0
σ = σ 0.2 × ( 1 + r 0.2 ( ε n 1 ) 1 + ( r 1 ) ( ε n 1 ε n u 1 ) p )           0     ε n     ε n u
where the relative strain ε n = ε s ε 0.2 ; the ultimate relative strain ε n u = ε u ε 0.2 ; the hardening parameter in the elastic phase r = E 0 ε 0.2 σ 0.2 ; the hardening parameter at the nominal yield point r 0.2 = E 0.2 ε 0.2 σ 0.2 ; the relative hardening parameter in the elastic phase p = r ( 1 r 0.2 ) σ 0.2 r 1 ; the elasticity modulus at the nominal yield point E 0.2 = E 0 ( 1 + 0.002 n E 0 σ 0.2 ) ; the hardening parameter in yield phase r = E 0.2 ( ε u ε 0.2 ) σ u σ 0.2 ; the hardening parameter at ultimate tensile strain point r u = E u ( ε u ε 0.2 ) σ u σ 0.2 ; the relative hardening parameter in yield phase, p = r ( 1 r u ) σ 0.2 r 0.2 1 ; the modulus of elasticity at ultimate tensile strain point Eu; the softening factor m = 1 + 3.5 σ 0.2 σ u .

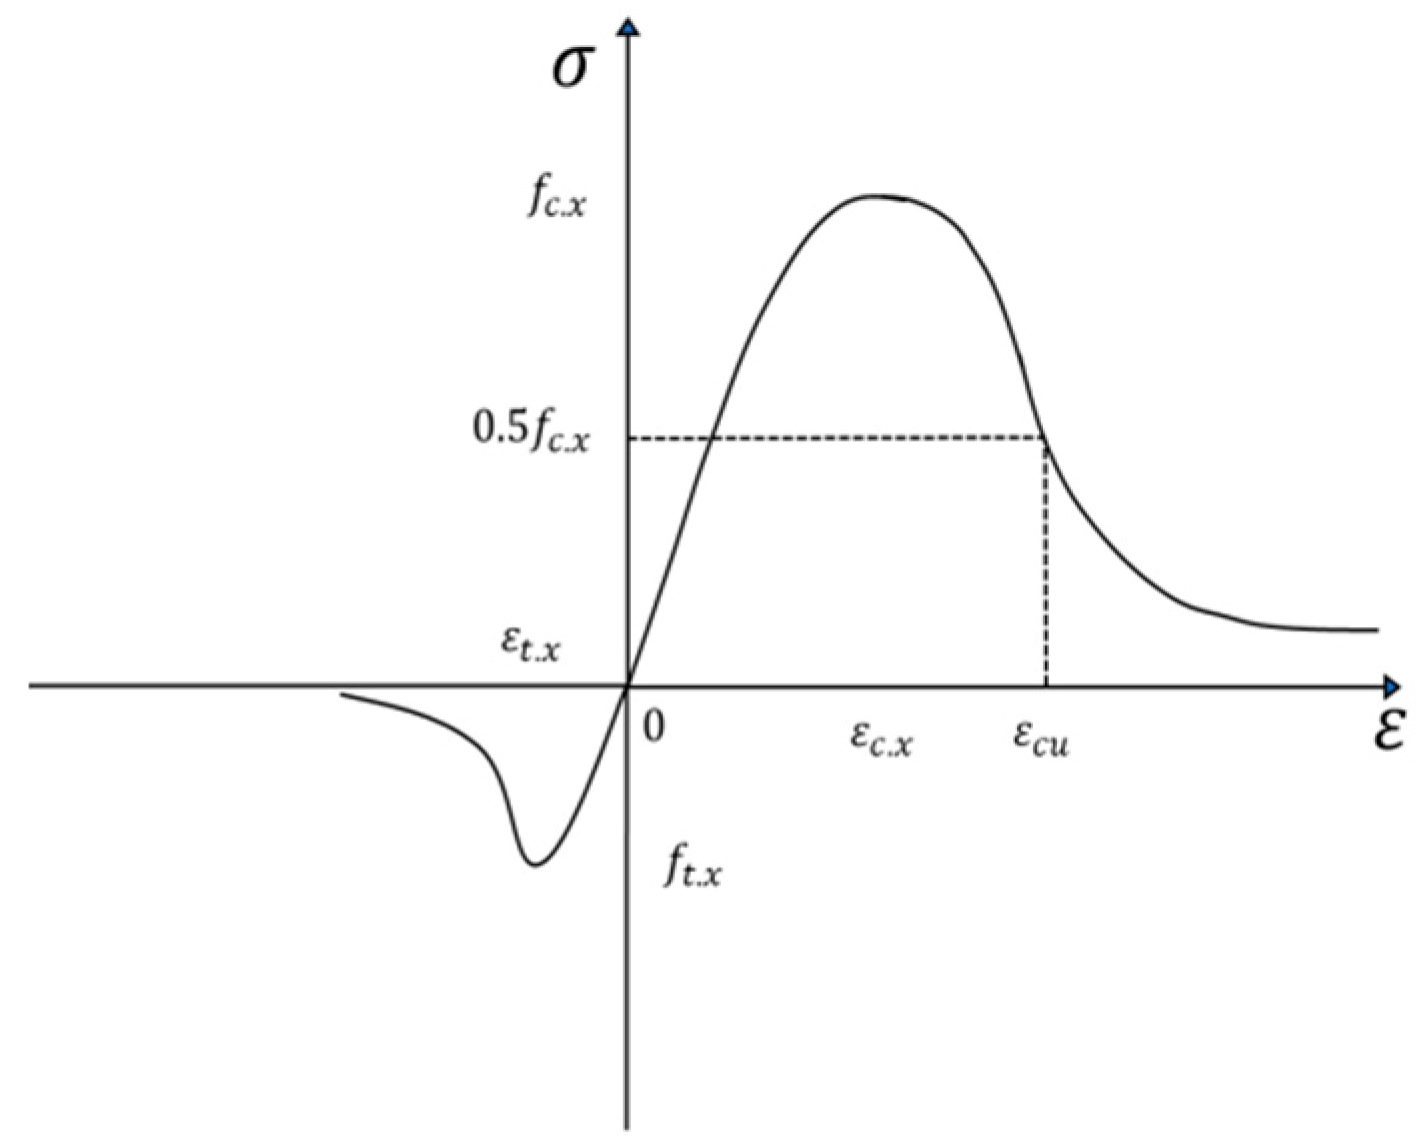
4.1.2. Constitutive Model of the Concrete

The constitutive model of the concrete is the concrete damage plasticity (CDP) model provided by ABAQUS. The uniaxial constitutive relationship for concrete needs to be defined by the user. Currently, the most representative constitutive relationships are: The stress-strain relationship curves in the model proposed by American scholars Kent and Park [50], the model based on the European Code [51], and the model based on the Chinese Code [52]. The model based on the European Code does not give uniaxial tensile stress-strain curves, while the model based on the Chinese Code has better computational convergence in finite element analysis compared to the Kent-Park model [53]. Therefore, the stress-strain curve model based on the Chinese Code is adopted in this study as the concrete constitutive model. As shown in Figure 13, the mathematical model of the uniaxial stress-strain curve of concrete can be determined by the following equations according to the Chinese Code:
(1)
Under uniaxial tensile loading:
σ = ( 1 d t ) E c ε
d t = 1 ρ t [ 1.2 0.2 x 5 ] x   1
d t = 1 ρ t α t ( x 1 ) 1.7 + x x   > 1
f t . r = 0.1 f c . r
ρ t = f t . r E c ε t . r
α t = 0.312 f t . r 2
ε t . r = 6.5 f t . r 0.54 × 10 6
ε = x ε t . r
(2)
Stress condition:
σ = ( 1 d c ) E c ε
d c = 1 ρ c n n 1 + x n x   1
d c = 1 ρ t α c ( x 1 ) 2 + x x   > 1
ρ c = f c . r E c ε c . r
n = E c ε c . r E c ε c . r f c . r
ε = x ε c . r
In the above equations, α c = 0.157 f c . r 0.785 0.905 ; ε c . r = ( 700 + 172 f c ) × 10 6 , where dt and dc are the uniaxial tensile and compressive damage parameters of concrete, respectively, f c . r is the representative value of the uniaxial compressive strength of concrete; f t . r is the representative value of uniaxial tensile strength of concrete.
In addition, the damage factor in the CDP model can be calculated according to Equation (14) proposed by Sidoroff. Other material parameters for the CDP model are shown in Table 6.
d = 1 σ E 0 ε

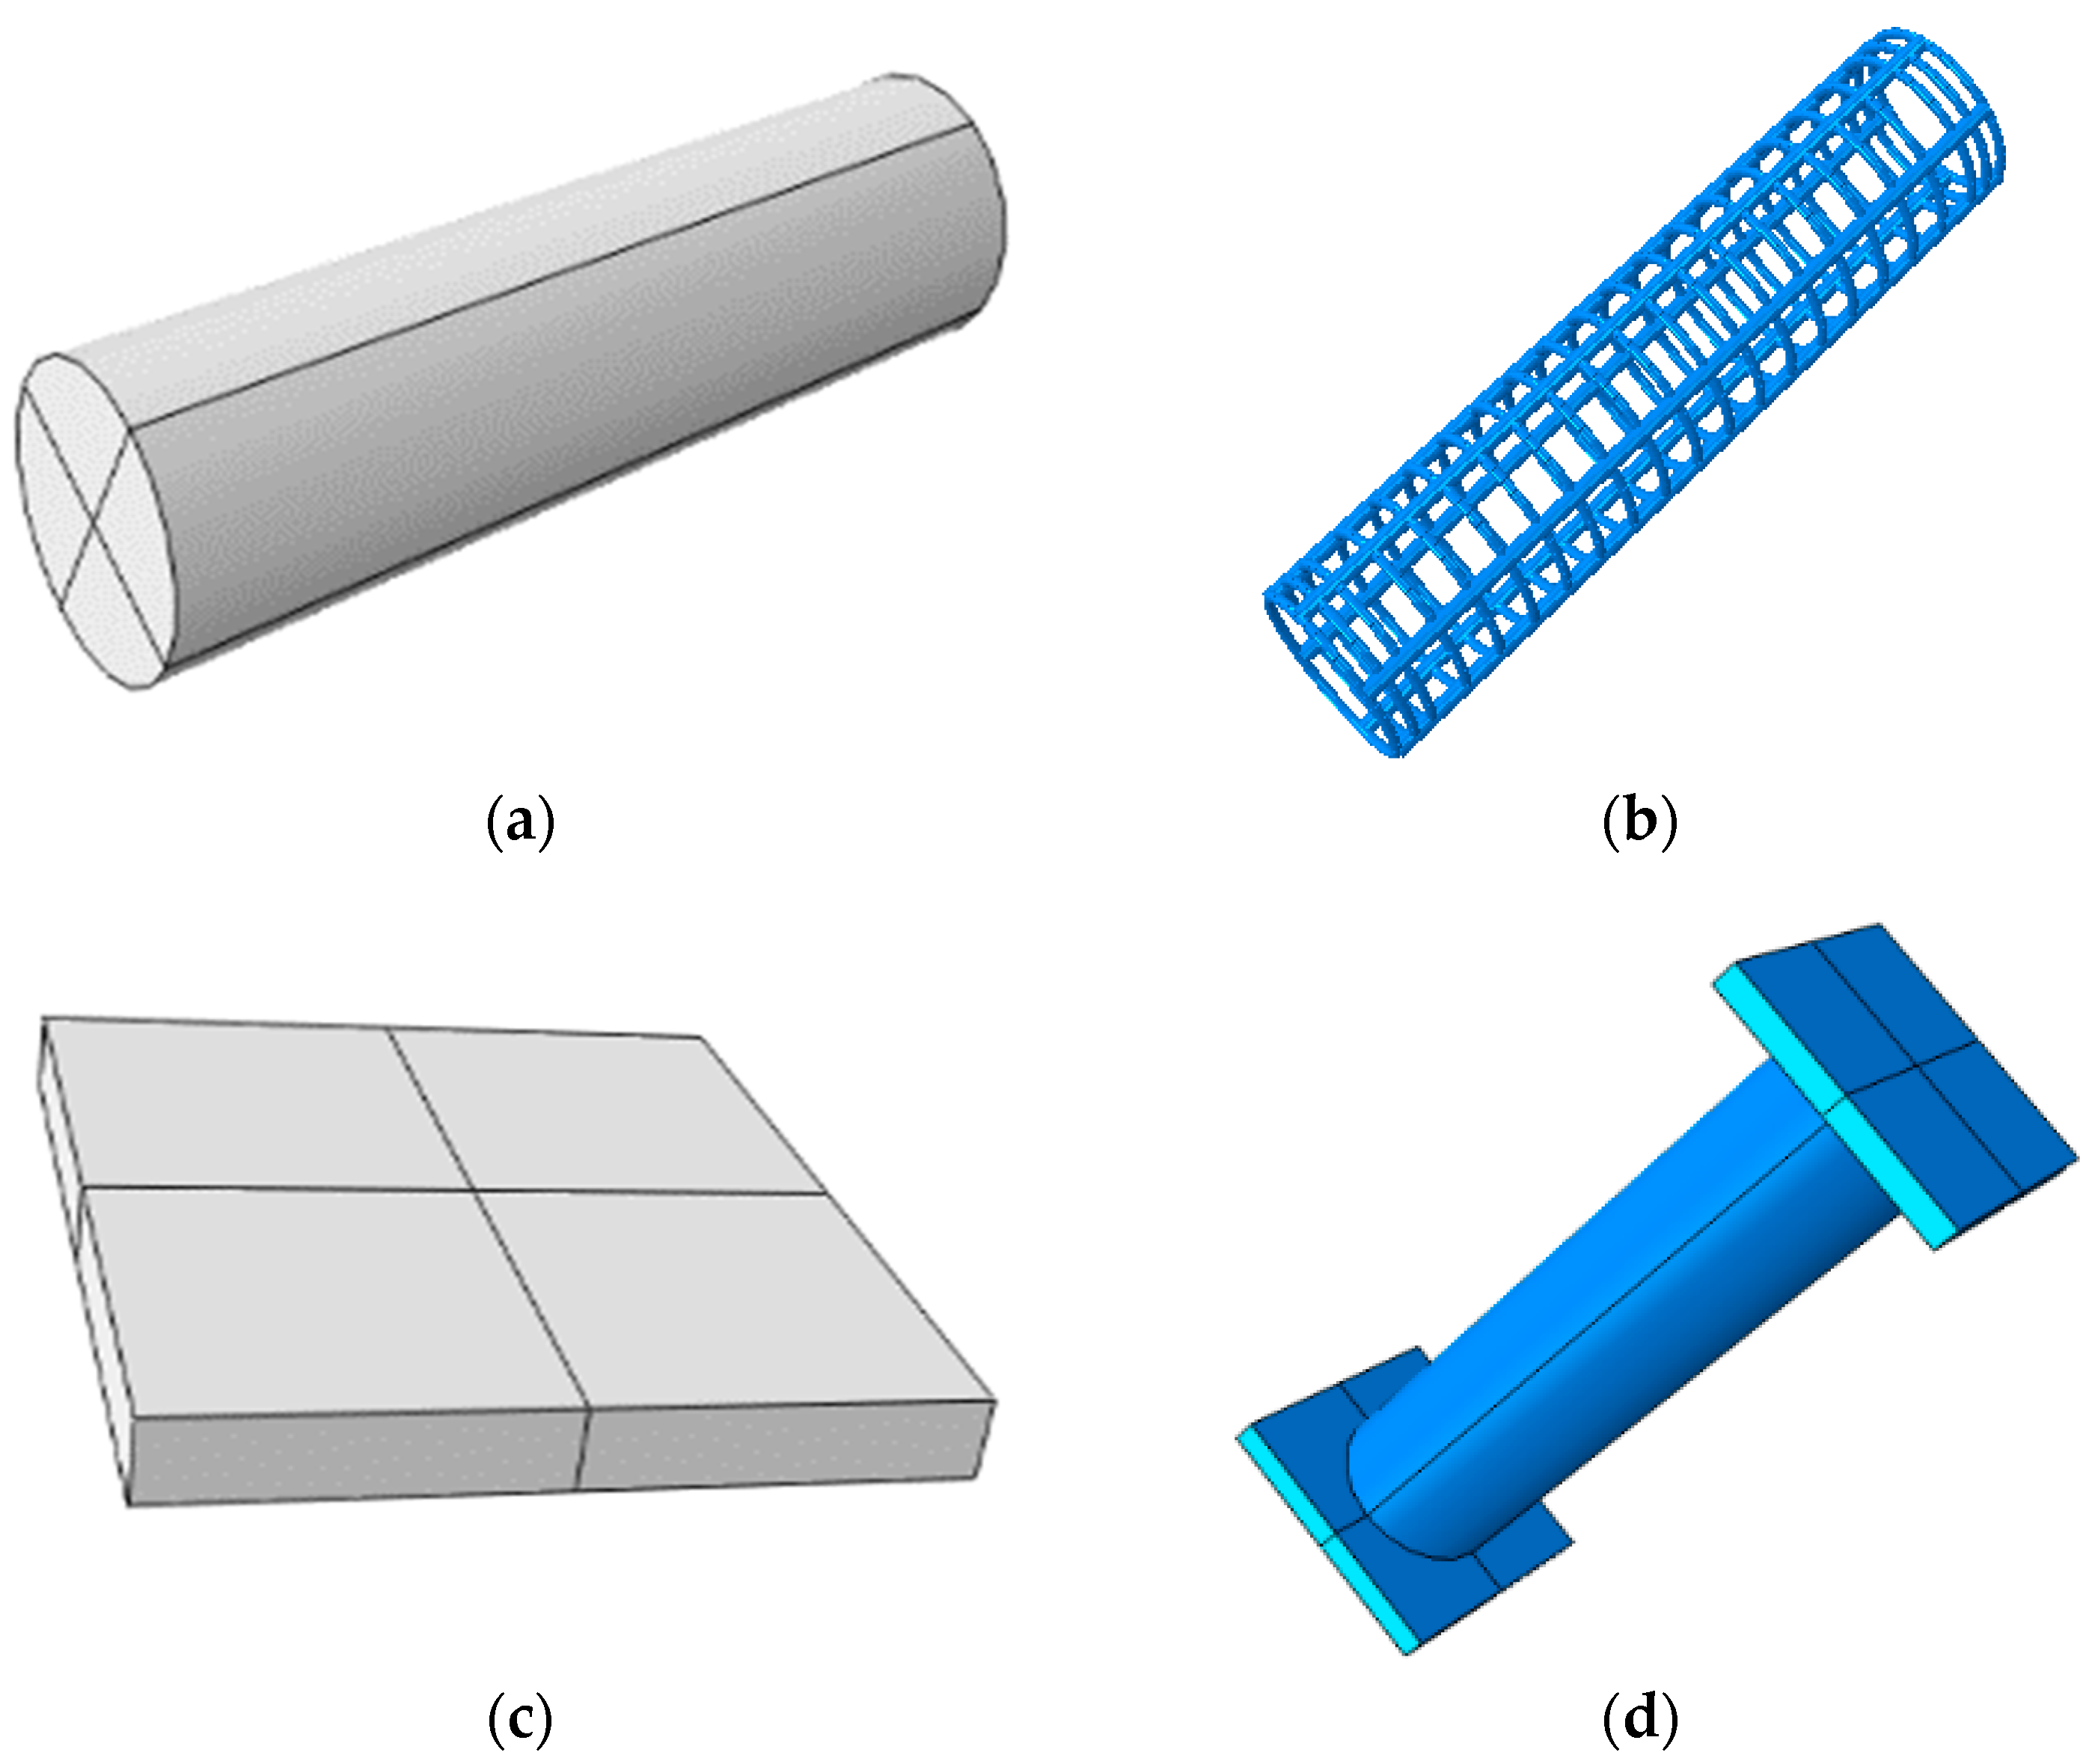
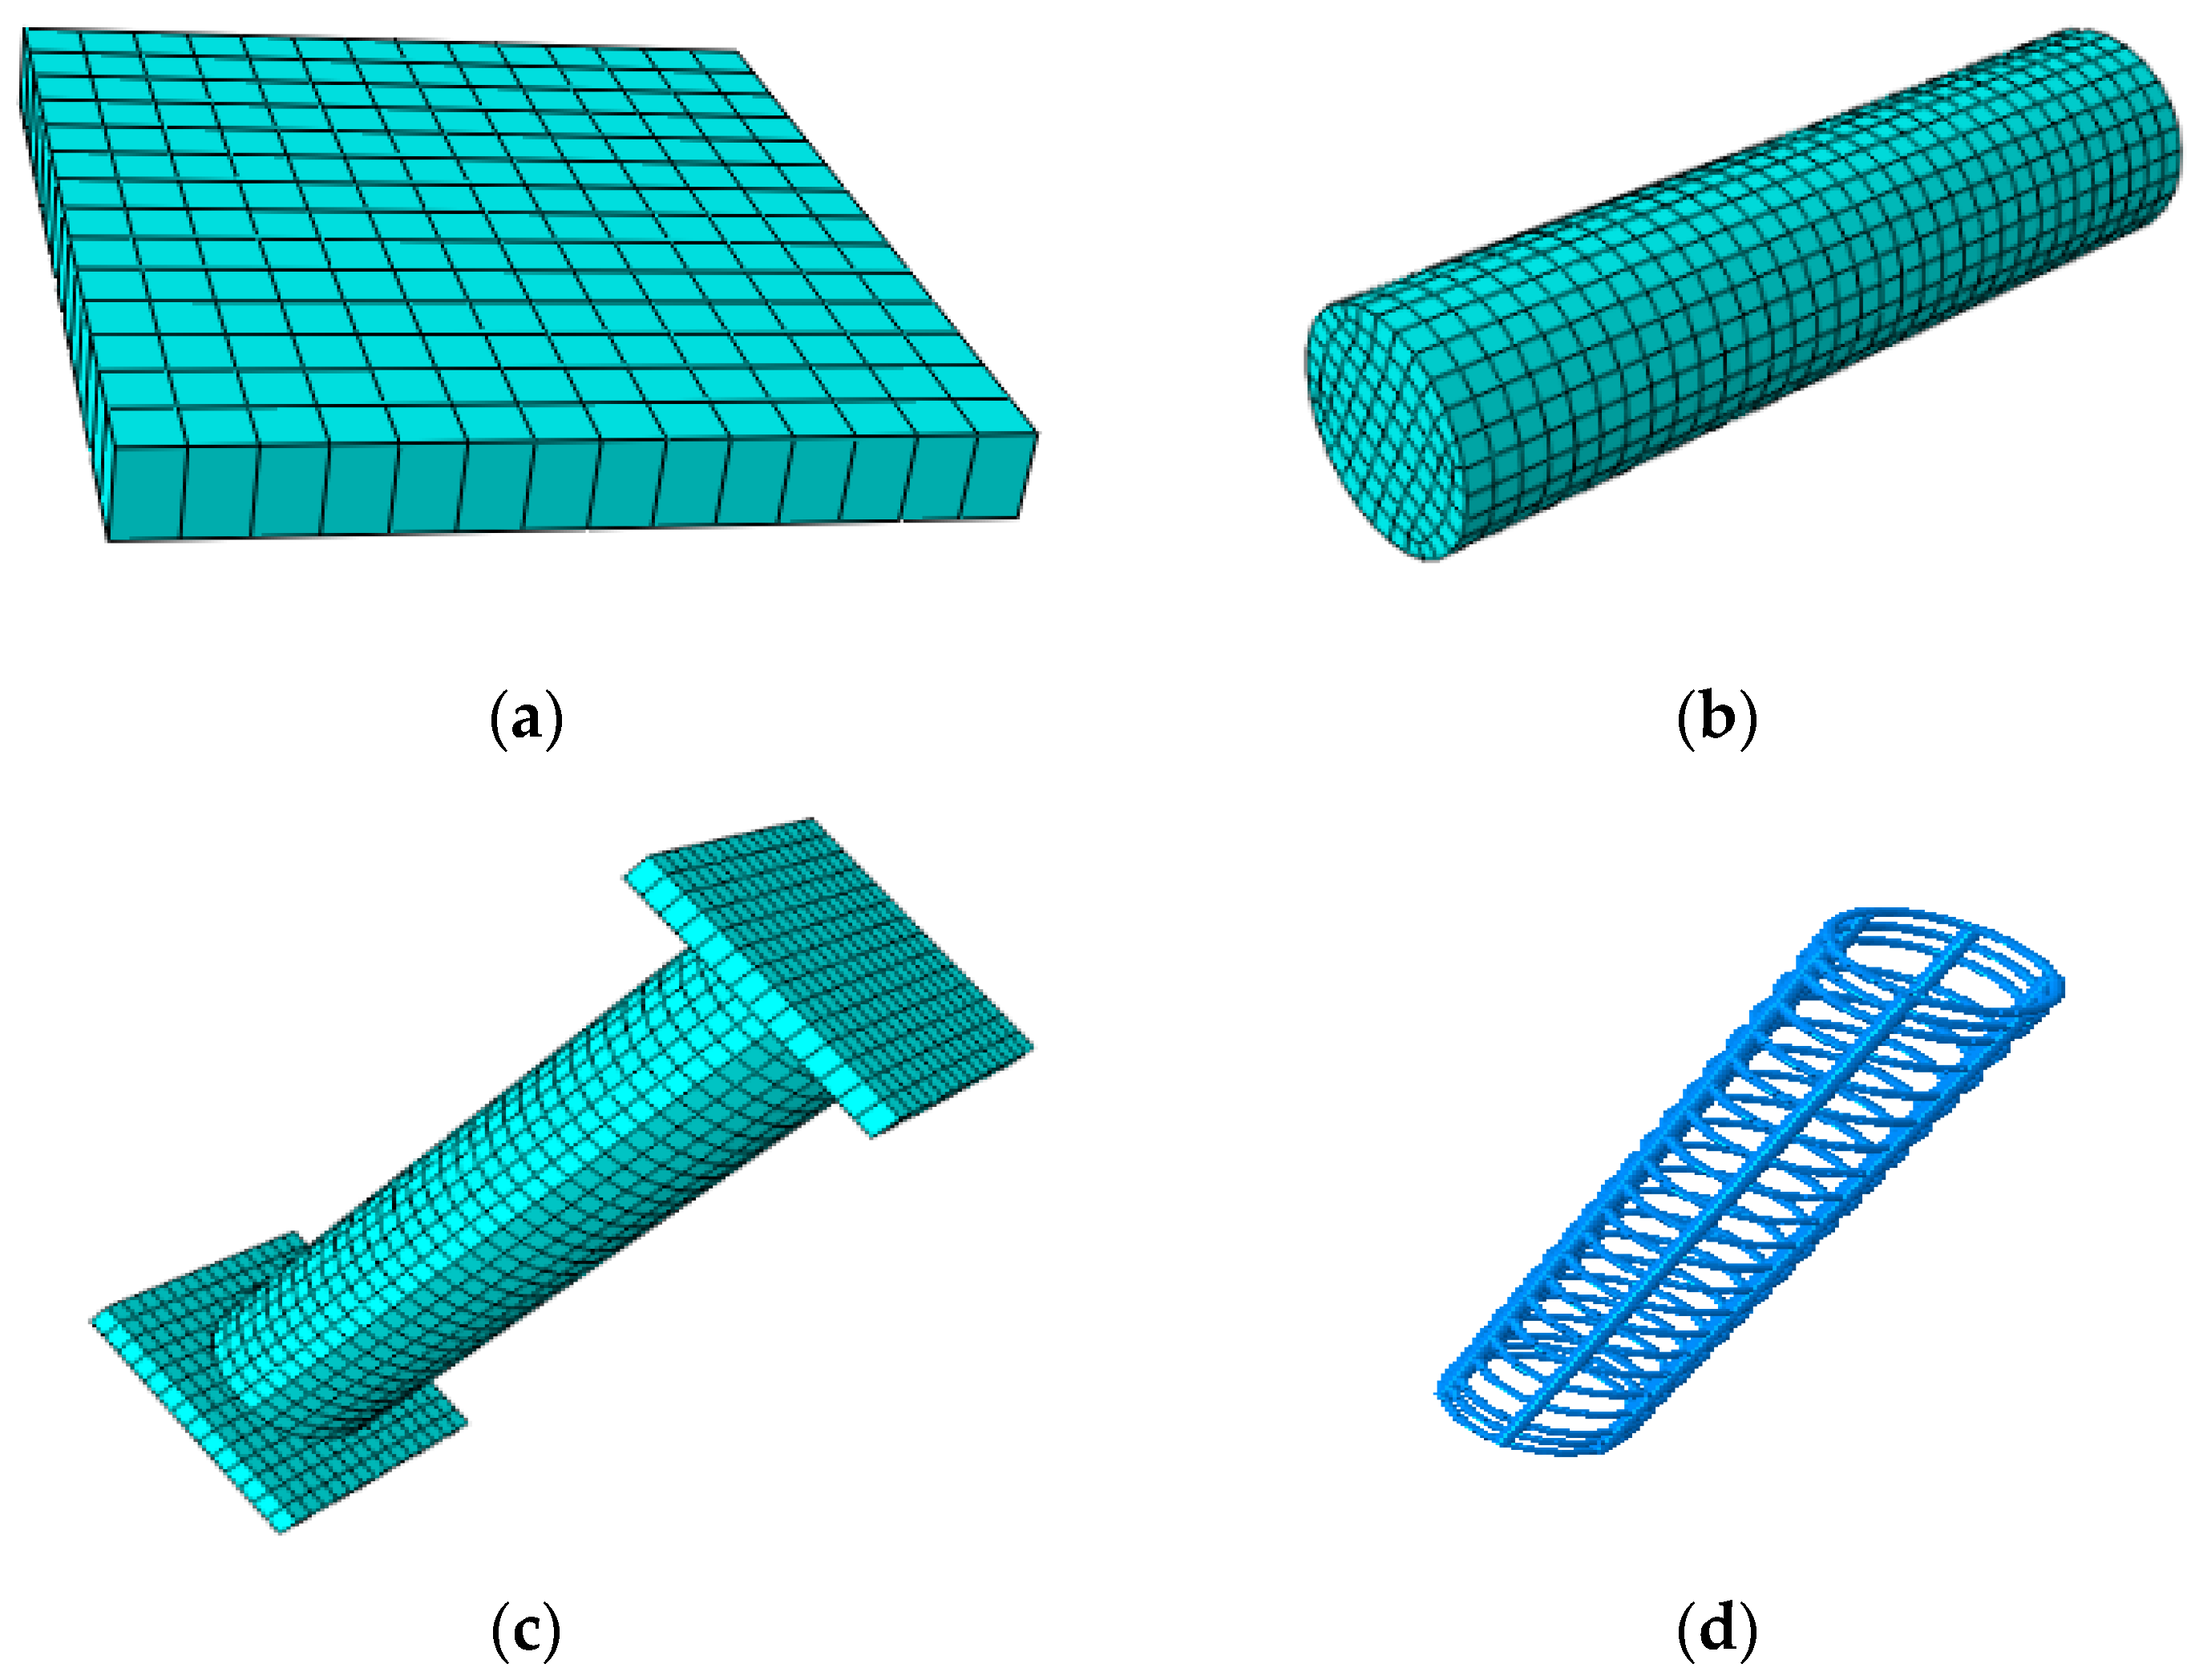
4.2. Establishment of the Computational Model

In this study, three duplex stainless steel bars and three plain reinforced concrete axial compression short columns were subjected to finite element analysis using ABAQUS software. The solid unit C3D8R was used for concrete and plate analysis, and the T3D2 truss unit was used for the steel bar. The bonding of the steel bar to the concrete was realized via the “Embedded Region” method, and the plate and the concrete column were merged into a single unit using the “Tie” method. The plastic damage model was adopted for the concrete, and the uniaxial compressive stress–strain curve obtained through the material property test was used for the constitutive relationship. The values of parameters such as the concrete expansion angle, eccentricity, and viscosity coefficient are shown in Table 6. A simplified bifold model was used for the constitutive relationship of the steel bar, and the boundary conditions at the upper and lower ends of the axially compressed short columns were set to be hinged, with reference points of RP-1 and RP-2, respectively. The displacement of the lower end of the column was limited to the x, y, and z directions, and that of the upper end was limited to the x and y directions. The axial displacement was applied in the z direction for loading. For a consistent finite element simulation process with the stress performance of the concrete columns in the test, a finite element model with three-dimensional units was adopted. The modeling of concrete and reinforcement for the short columns of duplex stainless steel bars (ORC-12 and DSSRC-12 as examples) and short columns of plain reinforced concrete are illustrated in Figure 14. According to the size of the finite element calculation, the appropriate mesh density was selected for meshing, as shown in Figure 15.

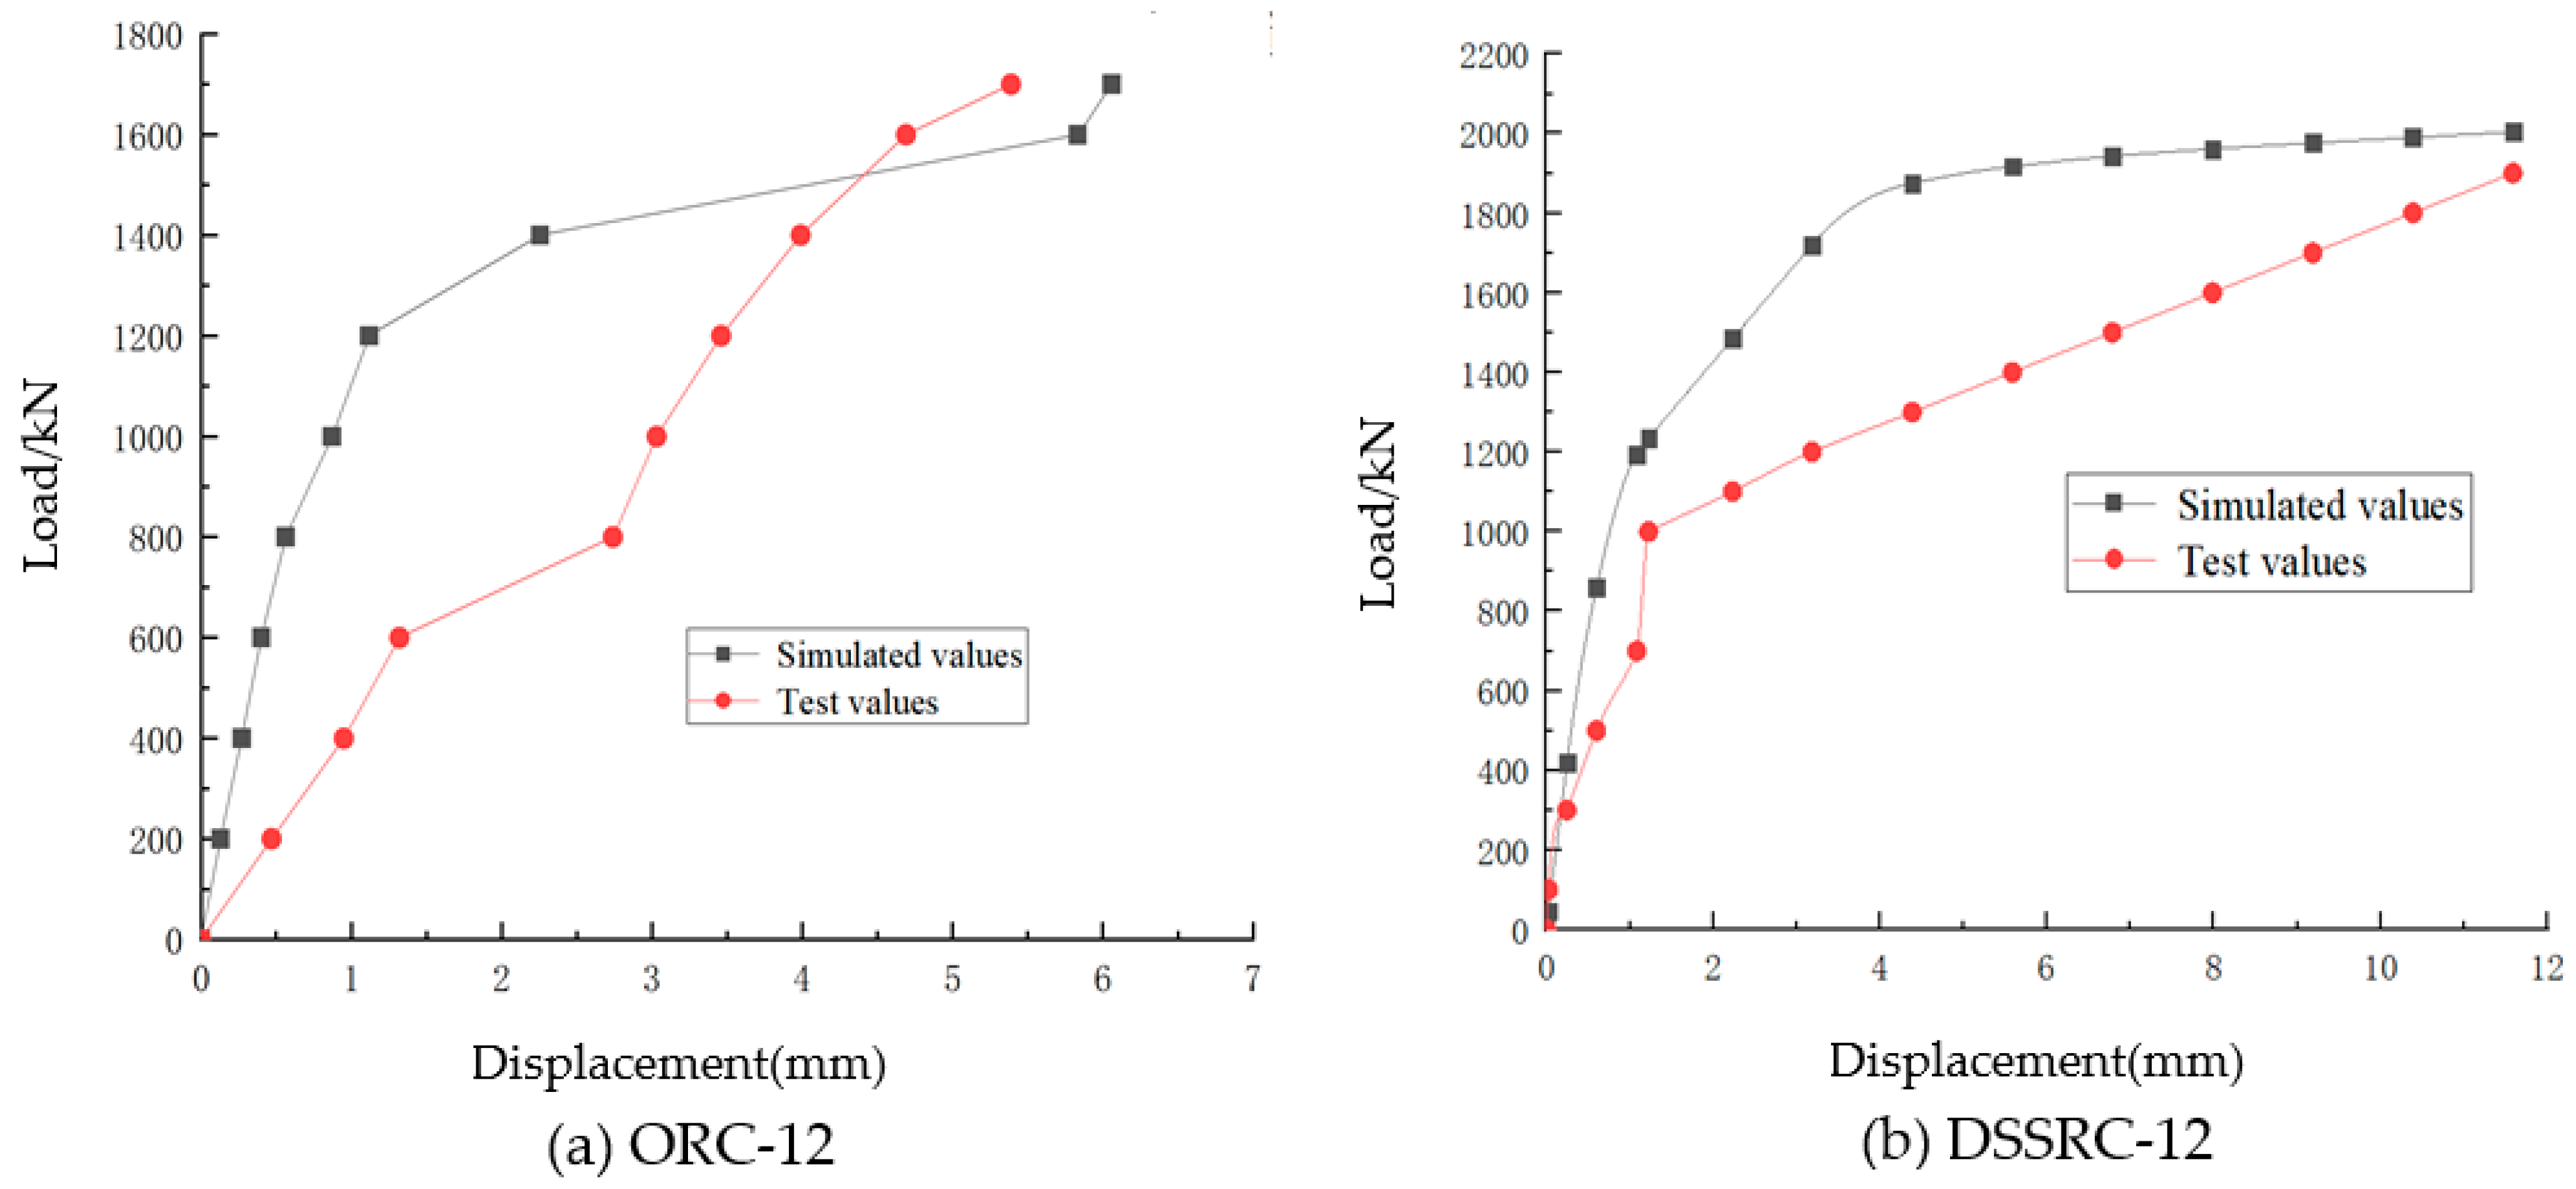
4.3. Analysis of Numerical Calculation Results

In this numerical test, the characteristics of concrete compression damage and reinforcement cage stress were investigated, and the load-displacement curves were derived via simulation and experiment. Figure 16 shows the equivalent plastic strain cloud for the concrete column. It can be seen that during the axial compression test, the concrete column with duplex stainless steel bars as longitudinal steel bars has a greater equivalent plasticity of concrete than that with ordinary steel bars. Figure 17 illustrates the stress cloud of the steel bar under axial compressive loading.
Figure 18 illustrates the load-displacement curves derived from the simulation. It is similar to the curves derived from the experiment, indicating that the ductility of duplex SSRC columns is better than that of ordinary reinforced concrete columns. Although the finite element simulation created an idealized model, the displacement values of the test are slightly larger than those of the finite element simulation.
Figure 18 shows that the ultimate bearing capacity of short columns with axial compression of duplex stainless steel reinforcement is positively correlated with its strength. Table 7 shows the comparison between the test values and the calculated and simulated results of the bearing capacity of all tested concrete columns. It can be seen that the overall trends of the experimental, calculated, and simulated values are similar for all the tested columns, and the calculated values are very close to the experimental values. On this basis, the axial compression column bearing capacity equation proposed in this paper is applicable to the estimation of the axial compression bearing capacity of duplex stainless steel reinforced columns. In addition, the simulated values are very close to the experimental values, indicating that the designed finite element method is suitable for calculating the load-bearing capacity of short axially compressed columns with duplex stainless steel reinforcement. The comparison of the average values shows that the error between the experimental, calculated, and simulated values of the short axial compression columns of duplex stainless steel bars designed in this study is small. The maximum errors are 8% and 9%, and the minimum errors are 0% and 1%. These results demonstrate a good agreement between the experimental, calculated, and simulated values of short axially compressed columns with duplex stainless steel reinforcement designed in this study.

5. Conclusions

In this paper, axial compression tests were conducted on 18 short concrete columns reinforced with different types of steel bars. The damage forms, longitudinal reinforcement strains, concrete strains, and ultimate load values were analyzed and studied. Based on the numerical calculation results, the following conclusions were obtained:
(1)
S2205 duplex stainless steel reinforcement has good bonding properties with concrete. Compared to the concrete columns reinforced with normal steel bars, the increase in cracking load was 20.7%, 12.7%, and 49.3% when the main reinforcement was 10 mm, 12 mm, and 14 mm, respectively.
(2)
The concrete columns reinforced with duplex stainless steel bars have significantly higher ultimate load-bearing capacity than those reinforced with ordinary steel bars. When the main reinforcement was 10 mm, 12 mm, and 14 mm, the increase in ultimate loading was 30.7%, 17.5%, and 27.9%, respectively.
(3)
The load-strain characteristic curves of concrete columns reinforced with S2205 steel bars are similar to those of concrete columns reinforced with ordinary steel bars. It was observed that both the longitudinal bar strain and concrete compressive strain showed a gradual increase with increasing load.
(4)
The formula for calculating the axial compressive capacity of ordinary steel-reinforced concrete columns can be used to calculate the axial compressive capacity of SSRC columns. In contrast, the load-bearing capacity of the short duplex SSRC columns obtained from numerical analysis was larger, with increases ranging from 9% to 21%.
(5)
Finite element simulation analysis for axial compression tests of short columns with duplex stainless steel reinforcement was performed using ABAQUS software. The results indicate that the mathematical model developed in the paper is applicable.
All in all, duplex stainless steel has excellent chemical resistance. In addition to the excellent mechanical properties of stainless steel (especially duplex stainless steel), the characteristic that attracts attention is its strong resistance to salt and other corrosive substances. Before testing the axial compression characteristics of the concrete columns, the duplex stainless steel was also characterized for its resistance to seawater corrosion, which was significantly higher than that of ordinary steel bars. This test will be provided in a separate paper.

Author Contributions

Conceptualization, Z.R. and X.Z.; methodology, Z.R. and X.Z.; software, H.W and P.D.; validation, H.W. and P.D.; formal analysis, X.Z. and H.W.; investigation, Z.R. and X.Z.; resources, Z.R. and X.Z.; data curation, H.W. and L.F.; writing—original draft preparation, H.W.; writing—review and editing, Z.R. and X.Z.; visualization, H.W. and L.F.; supervision, Z.R. and X.Z.; project administration, Z.R. and X.Z.; funding acquisition, Z.R. and X.Z. All authors have read and agreed to the published version of the manuscript.

Funding

This research was supported by the Hunan Key Laboratory of Intelligent Disaster Prevention and Mitigation and Ecological Restoration in Civil Engineering, Grant number 2020TP1010, Natural Science Foundation of Hunan Province, Grant number 2021JJ50106, 2022JJ30193; Hunan Provincial Science and Technology Promotion Talent Project, 2022TJ-Q17; The science and technology innovation Program of Hunan Province Grant number 2022RC4032.

Data Availability Statement

All data used to support the study are included within the article.

Conflicts of Interest

The authors declare no conflict of interest.

References

  1. Gautam, L.; Kalla, P.; Jain, J.K.; Choudhary, R.; Jain, A. Robustness of self-compacting concrete incorporating bone china ceramic waste powder along with granite cutting waste for sustainable development. J. Clean. Prod. 2022, 367, 132969. [Google Scholar] [CrossRef]
  2. Wu, K.-X.; Jin, D.-J.; Jin, W.-L.; Fan, X.-H.; Huang, Y.-L.; He, X.-Y. Life-cycle multi-attribute decision making of RC structures considering sustainability. J. Zhejiang Univ. (Eng. Ed.) 2023, 57, 1562–1572. [Google Scholar]
  3. Gautam, L.; Bansal, S.; Sharma, K.V.; Kalla, P. Bone-China ceramic powder and granite industrial by-product waste inself-compacting concrete: A durability assessment with statistical validation. Structures 2023, 54, 837–856. [Google Scholar] [CrossRef]
  4. Jiang, H.; Huang, C.; Mei, G.; Gao, X.; Tian, Y.; Sun, X. Experimental and numerical investigations on direct shear performance of UHPC dry joints. Eng. Struct. 2023, 283, 115872. [Google Scholar] [CrossRef]
  5. Feng, J.; Li, P.; Wu, J.; Jiang, H.; Tian, Y.; Sun, X. Shear behavior of externally prestressed UHPC beams without stirrups. Case Stud. Constr. Mater. 2023, 18, e01766. [Google Scholar] [CrossRef]
  6. Lollini, F.; Carsana, M.; Gastaldi, M.; Redaelli, E. Corrosion behaviour of stainless steel reinforcement in concrete. Corros. Rev. 2019, 37, 3–19. [Google Scholar] [CrossRef]
  7. Wu, X.; Ye, D.; Li, H.; Yu, H. Corrosion characteristics of S23043 duplex stainless steel bars. Constr. Build. Mater. 2018, 178, 135–143. [Google Scholar] [CrossRef]
  8. Fahim, A.; Dean, A.E.; Thomas, M.D.A.; Moffatt, E.G. Corrosion resistance of chromium-steel and stainless steel reinforcement in concrete. Mater. Corros. 2019, 70, 328–344. [Google Scholar] [CrossRef]
  9. Zhu, M.; Zhang, Q.; Yuan, Y.; Guo, S.; Huang, Y. Study on the correlation between passive film and AC corrosion behavior of 2507 super duplex stainless steel in simulated marine environment. J. Electroanal. Chem. 2020, 864, 114072. [Google Scholar] [CrossRef]
  10. Ogunsanya, I.G.; Hansson, C.M. Influence of chloride and sulphate anions on the electronic and electrochemical properties of passive films formed on steel reinforcing bars. Materialia 2019, 8, 100491. [Google Scholar] [CrossRef]
  11. James, A.; Bazarchi, E.; Chiniforush, A.A.; Aghdam, P.P.; Hosseini, M.R.; Akbarnezhad, A.; Martek, I.; Ghodoosi, F. Rebar corrosion detection, protection, and rehabilitation of reinforced concrete structures in coastal environments: A review. Constr. Build. Mater. 2019, 224, 1026–1039. [Google Scholar] [CrossRef]
  12. Corradi, M.; Di Schino, A.; Borri, A.; Rufini, R. A review of the use of stainless steel for masonry repair and reinforcement. Constr. Build. Mater. 2018, 181, 335–346. [Google Scholar] [CrossRef]
  13. Duarte, R.G.; Castela, A.S.; Neves, R.; Freire, L.; Montemor, M.F. Corrosion behavior of stainless steel rebars embedded in concrete: An electrochemical impedance spectroscopy study. Electrochim. Acta 2014, 124, 218–224. [Google Scholar] [CrossRef]
  14. Yin, F.; Yang, L.; Wang, M.; Zong, L.; Chang, X. Study on ultra-low cycle fatigue behavior of austenitic stainless steel. Thin-Walled Struct. 2019, 143, 106205. [Google Scholar] [CrossRef]
  15. Wu, X.; Li, L.; Li, H.; Li, B.; Ling, Z. Effect of strain level on corrosion of stainless steel bar. Constr. Build. Mater. 2018, 163, 189–199. [Google Scholar] [CrossRef]
  16. Gardner, L.; Bu, Y.; Francis, P.; Baddoo, N.; Cashell, K.; McCann, F. Elevated temperature material properties of stainless steel reinforcing bar. Constr. Build. Mater. 2016, 114, 977–997. [Google Scholar] [CrossRef]
  17. Medina, E.; Medina, J.M.; Cobo, A.; Bastidas, D.M. Evaluation of mechanical and structural behavior of austenitic and duplex stainless steel reinforcements. Constr. Build. Mater. 2015, 78, 1–7. [Google Scholar] [CrossRef]
  18. Li, C.C.; Mu, M.H.; Nie, C.X.; Li, Q.F.; Wang, H.M. Mechanical and Technological Properties of Stainless Steel Bars. Highw. Transp. Sci. Technol. 2016, 33, 1–5. [Google Scholar]
  19. Ji, D.J.; Qie, J.M.; Dong, F. Study on Mechanical Properties of 304 Stainless Steel bar. Foundry Technol. 2015, 36, 1682–1684. [Google Scholar]
  20. Huang, C. Application analysis of Stainless steel reinforcement in subway concrete structure. Munic. Technol. 2021, 39, 106–109. [Google Scholar]
  21. Mistry, M.; Koffler, C.; Wong, S. LCA and LCC of the world’s longest pier: A case study on nickel-containing stainless steel rebar. Int. J. Life Cycle Assess. 2016, 21, 1637–1644. [Google Scholar] [CrossRef]
  22. Presuel-Moreno, F.; Scully, J.R.; Sharp, S.R. Literature review of commercially available alloys that have potential as low-cost, corrosion-resistant concrete reinforcement. Corrosion 2010, 66, 0860018. [Google Scholar] [CrossRef]
  23. Nürnberger, U.; Wu, Y. Stainless steel in concrete structures and in the fastening technique. Mater. Corros. 2008, 59, 144–158. [Google Scholar] [CrossRef]
  24. Younis, A.; Ebead, U.; Judd, S. Life cycle cost analysis of structural concrete using seawater, recycled concrete aggregate, and GFRP reinforcement. Constr. Build. Mater. 2018, 175, 152–160. [Google Scholar] [CrossRef]
  25. Val, D.V.; Stewart, M.G. Life-cycle cost analysis of reinforced concrete structures in marine environments. Struct. Saf. 2003, 25, 343–362. [Google Scholar] [CrossRef]
  26. Zhang, G.X.; Wu, M.M. Application and development of stainless steel reinforced concrete. J. Foshan Univ. Sci. Technol. (Nat. Sci. Ed.) 2006, 2, 10–13. [Google Scholar]
  27. Yuan, H.X.; Wang, Y.Q.; Shi, Y.J. Preliminary study and application prospect of stainless steel reinforced concrete. Build. Sci. 2011, 27, 101–105. [Google Scholar]
  28. Zhang, X.Z.; Piao, L.; Fan, X.Y.; Ye, X.J.; Li, C.C. Application of Stainless steel bars in Durability Design of cross-sea Bridges. Highw. Transp. Sci. Technol. 2017, 34, 28–32. [Google Scholar]
  29. Li, Q.F.; Wang, J.W. Research progress and application of stainless steel bars. Henan Sci. Technol. 2017, 19, 107–109. [Google Scholar]
  30. Zheng, X.H.; Li, C.C.; Ouyang, P.; Xu, D.; Li, W. Engineering Application of Stainless steel Bar. Highw. Transp. Sci. Technol. (Appl. Technol. Ed.) 2017, 13, 42–43. [Google Scholar]
  31. Jing, Q.; Fang, X.; Ni, J.X.; Tang, Y.B. Application of 2304 stainless steel reinforcement in Hong Kong-Zhuhai-Macao Bridge: Research on corrosion resistance of steel reinforcement. Highw. Transp. Sci. Technol. 2017, 34, 51–56. [Google Scholar]
  32. Li, C.C.; He, W.N.; Lu, J.; Geng, H.T. Bonding properties of Stainless Steel bars and Concrete. Highw. Transp. Sci. Technol. 2016, 33, 15–20. [Google Scholar]
  33. Xu, C.Y.; Yuan, Y.S.; Lu, B.; Guo, Y.H. Anchorage design and Reliability Analysis of Duplex Stainless steel bar and Concrete. J. Shenyang Jianzhu Univ. (Nat. Sci. Ed.) 2019, 35, 445–452. [Google Scholar]
  34. Xu, C.Y.; Lu, B.; Yuan, Y.S. Test and Finite element simulation on bonding properties of duplex stainless steel bars and concrete. Concrete 2018, 5, 51–55. [Google Scholar]
  35. Zhang, L.; Qian, P.; Zhang, J.J.; Yang, J.J.; Shi, J.N.; Song, X.F. Research on flexion Performance of 304 stainless steel Reinforced concrete beams. Shanxi Archit. Archit. 2019, 45, 36–37. [Google Scholar]
  36. Zhang, Y.L. Experimental Study on Mechanical Performance of Stainless Steel Reinforced Concrete Columns; Zhengzhou University: Zhengzhou, China, 2019. [Google Scholar]
  37. Xiang, Q.H. Experimental Study on the Influence of Reinforcement Ratio on the Mechanical Performance of Stainless Steel Reinforced Concrete Columns; Zhengzhou University: Zhengzhou, China, 2020. [Google Scholar]
  38. Guo, W. Experimental Study on the Influence of Concrete Strength on the Mechanical Performance of Stainless Steel Reinforced Concrete Columns; Zhengzhou University: Zhengzhou, China, 2021. [Google Scholar]
  39. Castro, H.; Rodriguez, C.; Belzunce, F.; Canteli, A. Mechanical properties and corrosion behaviour of stainless steel reinforcing bars. J. Mater. Process. Technol. 2003, 143–144, 134–137. [Google Scholar] [CrossRef]
  40. Mudhaffar, M.A.; Saleh, N.; Aassy, A. Influence of hot clad rolling process parameters on life cycle of reinforced bar of stainless steel carbon steel bars. Procedia Manuf. 2017, 8, 353–360. [Google Scholar] [CrossRef]
  41. Corrêa, E.C.S.; Aguilar, M.; Cetlin, P. The influence of cyclic straining on the work hardening behavior of AISI 304 stainless steel bars in multiple-pass drawing. Mater. Chem. Phys. 2007, 106, 95–101. [Google Scholar] [CrossRef]
  42. Cadoni, E.; Fenu, L.; Forni, D. Strain rate behaviour in tension of austenitic stainless steel used for reinforcing bars. Constr. Build. Mater. 2012, 35, 399–407. [Google Scholar] [CrossRef]
  43. GB/T50081-2019; Standard of Test Method for Physical and Mechanical Properties of Concrete. National Standard of the People’s Republic of China: Beijing, China, 2019.
  44. GB/T28900-2012; Test Method for Steel Used in Reinforced Concrete. National Standard of the People’s Republic of China: Beijing, China, 2012.
  45. GB/T50152-2012; Standard for Test Methods of Concrete Structures. National Standard of the People’s Republic of China: Beijing, China, 2012.
  46. Nie, J.G.; Wang, Y.H. Comparative study of concrete constitutive Model used to simulate structural static behavior in ABAQUS. Eng. Mech. 2013, 30, 59–67. [Google Scholar]
  47. Li, Q.F.; Kuang, Y.H.; Guo, W. CDP model parameter calculation and value method verification. J. Zhengzhou Univ. (Eng. Ed.) 2020, 42, 43–48. [Google Scholar]
  48. Rasmussen, K.J. Full-range stress–strain curves for stainless steel alloys. J. Constr. Steel Res. 2003, 59, 47–61. [Google Scholar] [CrossRef]
  49. Abdella, K. An explicit stress formulation for stainless steel applicable in tension and compression. J. Constr. Steel Res. 2007, 63, 326–331. [Google Scholar] [CrossRef]
  50. Scott, B.D.; Park, R.; Priestley, M. Stress-strain Behavior of Concrete Confined by Overlapping Hoops at Low and High Strain Rates. J. Am. Concr. Inst. 1982, 79, 13–27. [Google Scholar]
  51. EN 1992-1 Euro Code 2; Design of Concrete Structures: Part 1-1: General Rules and Rules for Buildings. British Standards Institution: London, UK, 2004.
  52. GB 50010-2010; Code for Design of Concrete Structures. National Standard of the People’s Republic of China: Beijing, China, 2010.
  53. Fang, Z.H.; Zhou, H.J.; Lai, S.Y.; Xie, Q. Selection of Stress-strain Relationship of ABAQUS concrete. Build. Struct. 2013, 43, 559–561. [Google Scholar]
Figure 1. Comparison of the tensile properties of stainless steel and ordinary steel.
Buildings 13 02845 g001
Figure 2. Comparison of tensile test curves of the two types of steel bars.
Buildings 13 02845 g002
Figure 3. Concrete column cross-sectional dimensions and rebar arrangement.
Buildings 13 02845 g003
Figure 4. Finished concrete columns after pouring construction.
Buildings 13 02845 g004
Figure 5. Strain gauge arrangement (G—stirrup; Z—rebar; C—concrete; T—top part; M—middle part; B—bottom part; V—vertical; L—level).
Buildings 13 02845 g005
Figure 6. Loading device diagram. ① Testing machine bottom plate. ② Displacement meter. ③ Column top plate. ④ Pressure sensor. ⑤ Testing machine top plate. ⑥ Strain gauge. ⑦ Testing machine pillar. ⑧ Dial gauge.
Buildings 13 02845 g006
Figure 7. ORC-12 failure process.
Buildings 13 02845 g007
Figure 8. DSSRC-12 failure process.
Buildings 13 02845 g008
Figure 9. Load–displacement curve.
Buildings 13 02845 g009
Figure 10. Load–strain curves of steel bars.
Buildings 13 02845 g010
Figure 11. Load–strain curve of the concrete column.
Buildings 13 02845 g011
Figure 12. Stress-strain relationship proposed by Abdella.
Buildings 13 02845 g012
Figure 13. Uniaxial stress–strain curve of concrete based on GB 50010-2010.
Buildings 13 02845 g013
Figure 14. Concrete column components and the overall model. (a) Concrete column model; (b) Reinforcement cage model; (c) Plate model; (d) Overall model.
Buildings 13 02845 g014
Figure 15. Concrete component mesh and the overall mesh. (a) Plate grid; (b) Concrete grid; (c) Overall grid; (d) Reinforcement cage grid.
Buildings 13 02845 g015
Figure 16. Equivalent plastic strain cloud for concrete columns.
Buildings 13 02845 g016
Figure 17. Stress cloud of reinforcement cage.
Buildings 13 02845 g017
Figure 18. Load–displacement curve for concrete columns.
Buildings 13 02845 g018
Table 1. Concrete compression test results.
Batch No.Test Block No.Compressive Strength (MPa)Mean (MPa)
1Test block 137.6734.4
Test block 234.49
Test block 331.04
2Test block 430.6730.26
Test block 530.39
Test block 629.73
Table 2. Steel bar specifications and tensile test results.
MaterialDiameterYield Strength (MPa)Ultimate Strength (MPa)Elasticity Modulus (GPa)
HRB4006360.4424201
10339.2399.1201
12359.2438.9200
14395.1465.5202
S22056552.8650.4164
10609.1716.5162
i12683.1803.6165
14563.9583.9164
Table 3. Concrete column design parameters.
Specimen No.Stirrup DiameterStirrup SpacingNumber of RebarsRebar DiameterReinforcement RatioNumber of Specimens
ORC-106 mm50 mm610 mm0.9%3
ORC-126 mm50 mm612 mm1.3%3
ORC-146 mm50 mm614 mm1.7%3
DSSRC-106 mm50 mm610 mm0.9%3
DSSRC-126 mm50 mm612 mm1.3%3
DSSRC-146 mm50 mm614 mm1.7%3
Table 4. Compression test results of the concrete columns (kN).
Specimen No.Cracking LoadMeanUltimate LoadMeanGrowth Rate %Δ (mm)εs (10−6)
ORC-106656771543.214305.41−1206.5
6811318.4
6861409.3
DSSRC-108008172001.3187030.7%9.86−2557.5
7501742.3
9501868.4
ORC-127007001730.016466.39−1428.2
7401680.5
6601527.8
DSSRC-128767892099.4199617.5%11.30−2373.1
7911976.5
7001913.0
ORC-145406701690.017307.72−1450.9
6721651.4
8001849.0
DSSRC-1470010002031.2221327.9%10.90−2133.2
12002155.6
11002455.1
Note: 1. ∆ is the vertical displacement at the loading point corresponding to the ultimate load; 2. εs is the maximum compressive strain of the main bar upon reaching the ultimate load.
Table 5. Comparison between the theoretical and experimental ultimate bearing capacity of concrete columns.
Specimen No.Experimental Average/kNTheoretical Average/kNExperimental Value/Theoretical Value
ORC-101430.81349.811.06
DSSRC-101870.671635.641.14
ORC-121646.271450.621.13
DSSRC-121996.31822.411.09
ORC-141730.131569.491.10
DSSRC-142213.971817.071.21
Table 6. CDP model parameters.
Expansion   Angle   ψ ( ) Eccentricity f b 0 / f c 0 K Viscosity Parameter μ
300.11.160.66670.0005
Note: fb0 is the biaxial compressive strength of concrete; fc0 is the uniaxial compressive strength. The ratio between them takes the recommended value in the code.
Table 7. The ratio of experimental values to calculated and simulated values of the bearing capacity of concrete columns.
Specimen No.Experimental Value (kN)Theoretical Value (kN)Simulated
Value (kN)
Experimental Value/Theoretical ValueExperimental Value/Simulated Value
ORC-101430.801349.811427.71.061.00
DSSRC-101870.671635.641788.51.141.04
ORC-121646.271450.621511.21.131.08
DSSRC-121996.301822.411974.21.091.01
ORC-141730.131569.491612.81.101.07
DSSRC-142213.971817.072031.71.211.09
Disclaimer/Publisher’s Note: The statements, opinions and data contained in all publications are solely those of the individual author(s) and contributor(s) and not of MDPI and/or the editor(s). MDPI and/or the editor(s) disclaim responsibility for any injury to people or property resulting from any ideas, methods, instructions or products referred to in the content.

