Abstract
Ignoring the effect of a concrete core on bearing performance, the current design of prestressed concrete cylinder pipes (PCCPs) under internal water pressure only focuses on the fracture of prestressed steel wire, while the complexity of the AWWA C304 design method leads to a strong dependence on software that cannot be sufficiently mastered by the designers. In view of these issues, a simplified limit-state design process was induced to eliminate a large number of iterative operations and was verified by a three-dimensional finite element model (FEM) with a prototype test of PCCPs under internal water pressure. Meanwhile, the bearing performance of PCCPs was investigated using the parametric simulations of the FEM. The results showed that the cross-sectional area of the prestressed steel wire is higher by about 10% than that designed using the AWWA C304 method. The FEM provides a complete evolution process of the mechanical response of the structural constituents and simulates the strain mutation phenomenon of the prototype test well. The internal water pressure of the PCCPs designed using the simplified limit-state design process has enough safety to reach 4.7 times the working pressure at serviceability and 5.5 times the pressure at the ultimate limit state. A burst in the PCCPs took place under an internal pressure greater than 6.75 times the working pressure. The result of the FEM shows that an increase in the tensile strength of the concrete core is of great significance for improving the bearing performance of the PCCPs.
1. Introduction
In long-distance water diversion projects, prestressed concrete cylinder pipes (PCCPs) are mostly used as the main hydraulic structure. PCCPs are mainly composed of a concrete core, thin-steel cylinder, prestressed steel wire, protective mortar, and an external anti-corrosion coating [1,2]. The bearing performance of PCCPs mainly depends on the prestress of steel wire that is wound to the outside of the concrete core, while the seepage of water in the PCCP pipeline is avoided with the thin-steel cylinder [3,4]. At an early stage, PCCPs were designed using the allowable stress method combined with the empirical formula, which mainly limits the pressure in the pipe to control the tensile stress of the concrete core within its ultimate tensile strength [5]. However, this leads to an excessive use of materials based on the analytical results of hundreds of sets of pipeline test data [6]. Therefore, Zarghamee and Fok [7] proposed a new idea for PCCP design using a multi-layer ring model analysis. Subsequently, the most advanced limit-state design theory was applied to PCCPs. Based on the combination of factored and non-factored design load and internal pressure, the American Water Works Association code C304 (AWWA C304) provides a complete and technically correct design method [8,9]. The problem of the excessive use of materials can be solved by introducing three limit states of the PCCPs at serviceability, elasticity, and strength [10]. The drawback is that without relying on proprietary design software UDP, the AWWA C304 is difficult to understand and follow by the designers [11].
With regard to PCCP engineering accidents due to the pipe bursting [12,13], prototype tests of PCCPs with a diameter of 1.8 to 4.0 m under internal water pressure were performed to identify the failure mode of the broken wire [14], the deformation of the protective mortar [15], the cracking pressure of the concrete core [16], and the deformation of the steel cylinder [17,18]. The point sensors used for most of the tests could not continuously monitor the deformation of the pipeline in time and space [19]; therefore, a distributed optical fiber sensor was applied to measure and visualize the strain and load response of the PCCPs [20]. In view of the fact that the integrity of the prototype test results may not fully meet the expected requirements due to limitations with restricted test equipment and other objective factors, the finite-element model (FEM) was applied to analyze the bearing performance of the PCCPs. The mechanical response of the PCCPs with broken wires under internal water pressure can be analyzed by establishing a three-dimensional FEM [13,14,21]. The length of the broken wires can be determined using a theoretical method that considers the bonding quality of the mortar coatings [22,23]. The effect of the broken steel wire ratio on the bearing capacity of the PCCPs under internal water pressure can estimate the structural integrity of the PCCPs and thereby supports the recommendation for the operation and maintenance of the pipelines [24,25]. Meanwhile, considering the overestimation of damage caused by broken wires due to removing all the broken wire, and the underestimation of damage with simplified contact interactions, a new broken wire FEM was proposed [26,27].
The current research using the FEM for PCCPs mainly focuses on the broken prestressed steel wire. Environmental corrosion or hydrogen embrittlement is the main reason for prestressed steel wire damage [13,28]. However, both damage models of the prestressed steel wire have the characteristic of time accumulation with the premise of ensuring the qualification of production materials. In actual PCCP production, the steel wire put into production is the final product that can be directly used, and its production quality can be guaranteed by the steel wire manufacturer. In contrast, the pouring quality of the concrete core is susceptibly influence by the raw material, pouring environment, production management and worker’s technical level as well as the maintenance status of the molds and the pouring equipment [29]. The existing prototype tests point to the fact that the concrete core or the protective mortar rather than the steel wire is always firstly damaged [15,16,17,18]. This means that the concrete core or the protective mortar, rather than the prestressed steel wire, is more likely to be a weak link for the PCCPs. Under the internal water pressure, the concrete core undergoes a transition from compression to tension [16]. Once a full sectional tension appears on the concrete core, the protective mortar is put under tension. Therefore, the stress states of the concrete core and the mortar are effectively influenced by that of the PCCP. Unfortunately, a lack of research has been performed on this aspect to provide a deeper understanding.
In summary, the current design of PCCPs under internal water pressure only focuses on the damage to the prestressed steel wire, while the effect of the concrete core on the bearing performance is ignored and therefore does not receive enough attention. Moreover, the complexity of the AWWA C304 design method leads to a strong dependence on software that cannot be well mastered by the designers. In view of these issues, a simplified limit-state design process was induced to eliminate a large number of iterative operations [30]. The design results are compared with the AWWA C304 design method and verified using a three-dimensional FEM with a prototype test of the PCCP under internal water pressure. Meanwhile, the effects of the concrete core and the mortar are investigated using a parametric study. This can help designers correctly understand the performance of the PCCPs under internal water pressure when also considering the effects of the concrete core and the mortar.
2. Design Process
2.1. Design Method
A simplified limit-state design method was adopted by the code of China code CECS 140 [30]. The design process is shown in Figure 1. The differences between CECS 140 and AWWA C304 in the design process mainly focus on the load combination, the limit state, and the cracking control of the concrete core and mortar.
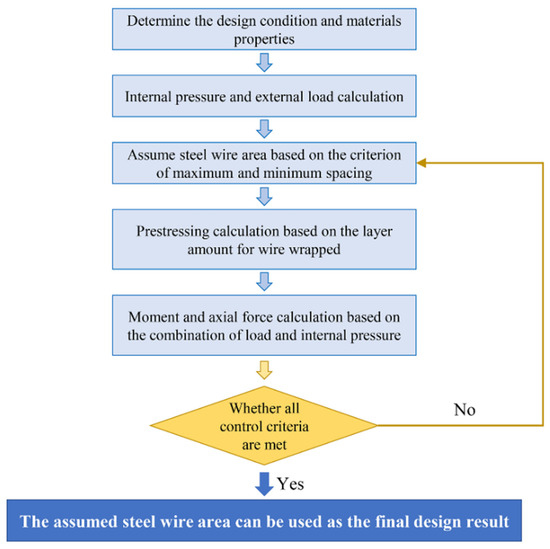
Figure 1.
Design process for PCCPs.
2.1.1. Load and Pressure Combination
The effects of pipe weight G1k, water weight Gwk, and earth load Fsk are considered by the two design methods, as shown in Table 1 [1] and Table 2 [30]. Both the vehicle live load q and the stacking load Ws are considered by AWWA C304, while the maximum value of q and Ws is considered by CECS 140. In terms of the internal water pressure, AWWA C304 separates it into a working pressure Pw and a water hammer pressure Pt, while CECS 140 specifies a design pressure Fwd. Compared to the five load and pressure combinations specified in CECS 140, twelve load and pressure combinations at the working condition and two combinations at the field-test condition are specified in AWWA C304. This leads to a complexity in the design process of the PCCPs.

Table 1.
Load and pressure combination for AWWA C304.
Table 2.
Load and pressure combination for CECS 140.
2.1.2. Limit States and Control Criteria
The limit states and control criteria of both methods are shown in Table 3 [1,30]. AWWA C304 includes three limit states at the serviceability, the elasticity and the strength, which considers the nonlinear mechanical response of structural materials. The serviceability limit state avoids the cracking of concrete and mortar. The elastic limit state controls the steel cylinder from yielding and the prestressed steel wire stress from exceeding the limit stress. The strength limit state controls the prestressed steel wire from yielding and the concrete from local crushing. CECS 140 specifies two limit states at the serviceability and the ultimate. The PCCPs are considered as an elastic system, ignoring the redistribution of internal forces caused by plastic deformation [30,31]. The serviceability limit state avoids the cracks that appeared on the concrete core at the crown/invert and the protective mortar at the spring line. The ultimate limit state controls the constituents from exceeding their strengths.
Table 3.
Limit states and control criteria for CECS 140 and AWWA C304.
2.1.3. Cracking Control of Concrete and Mortar
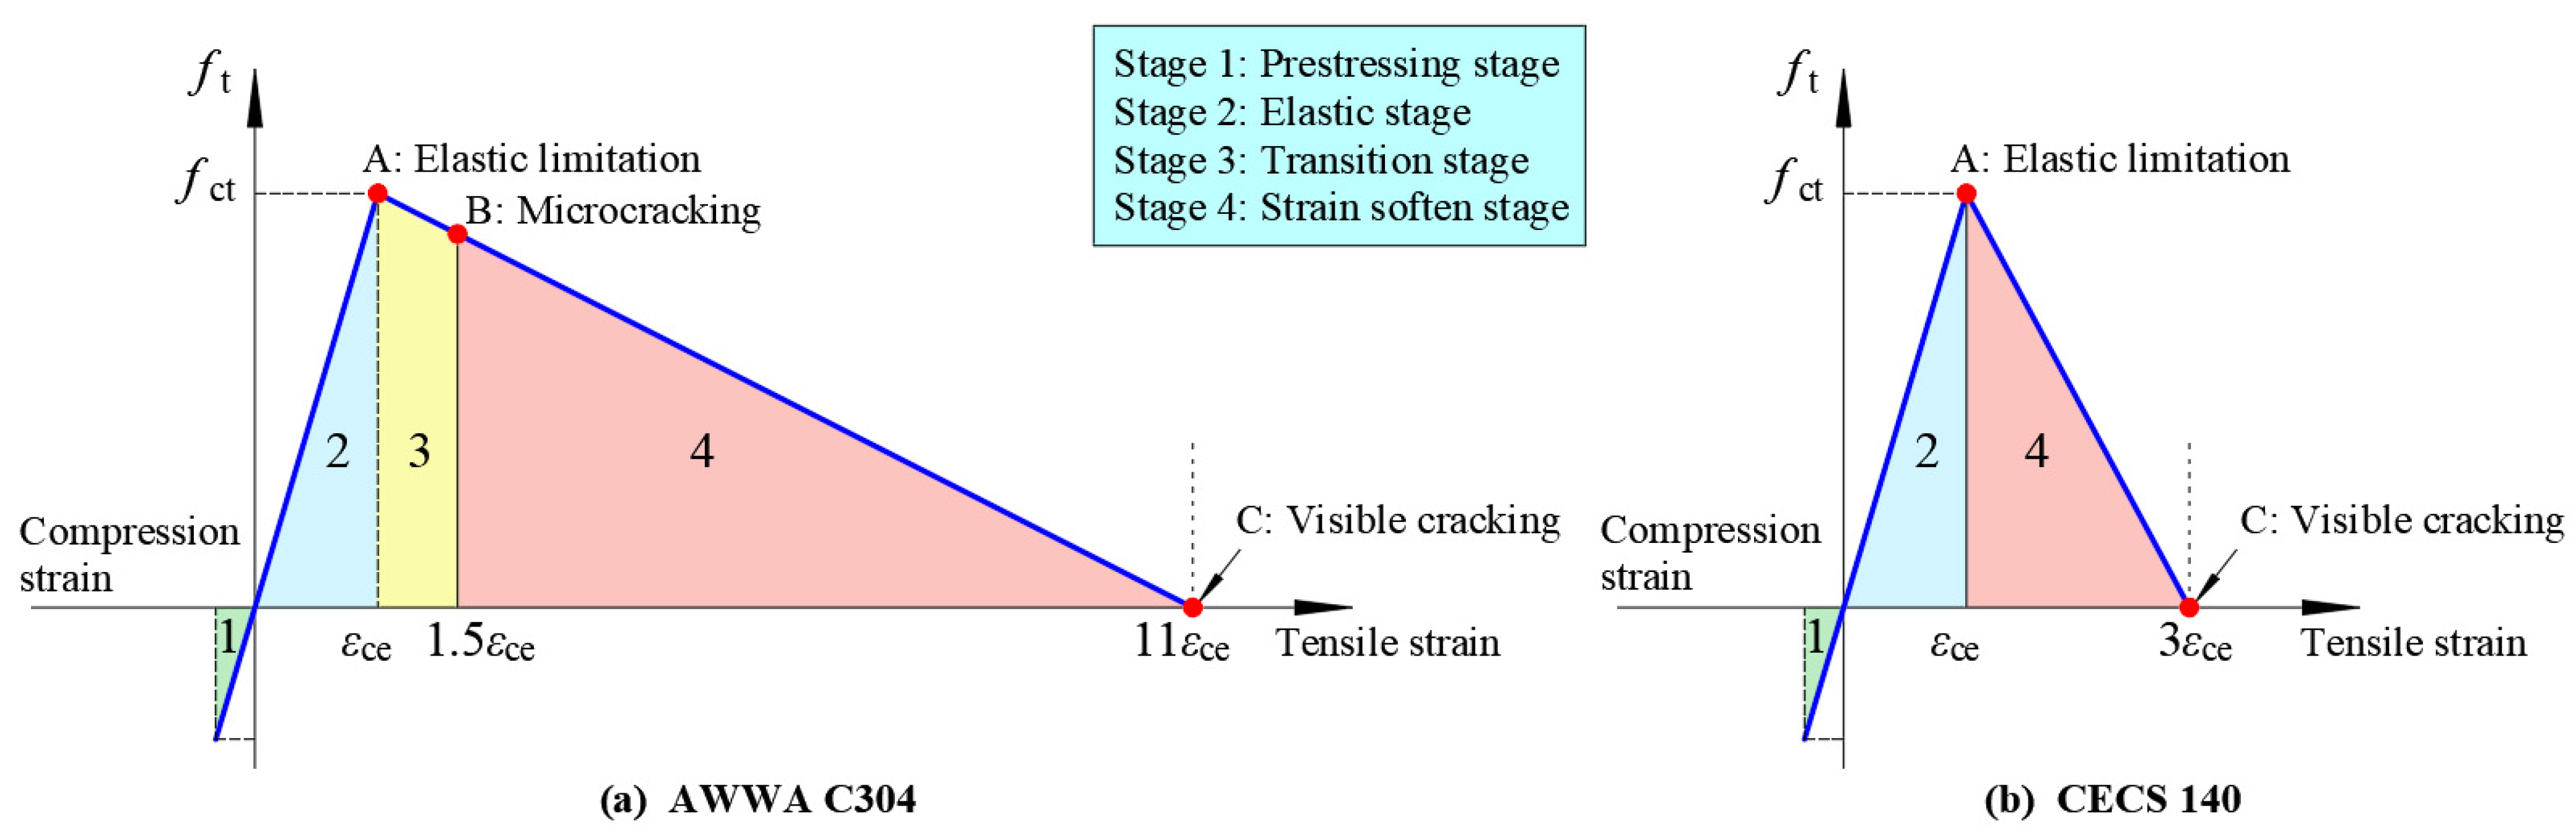
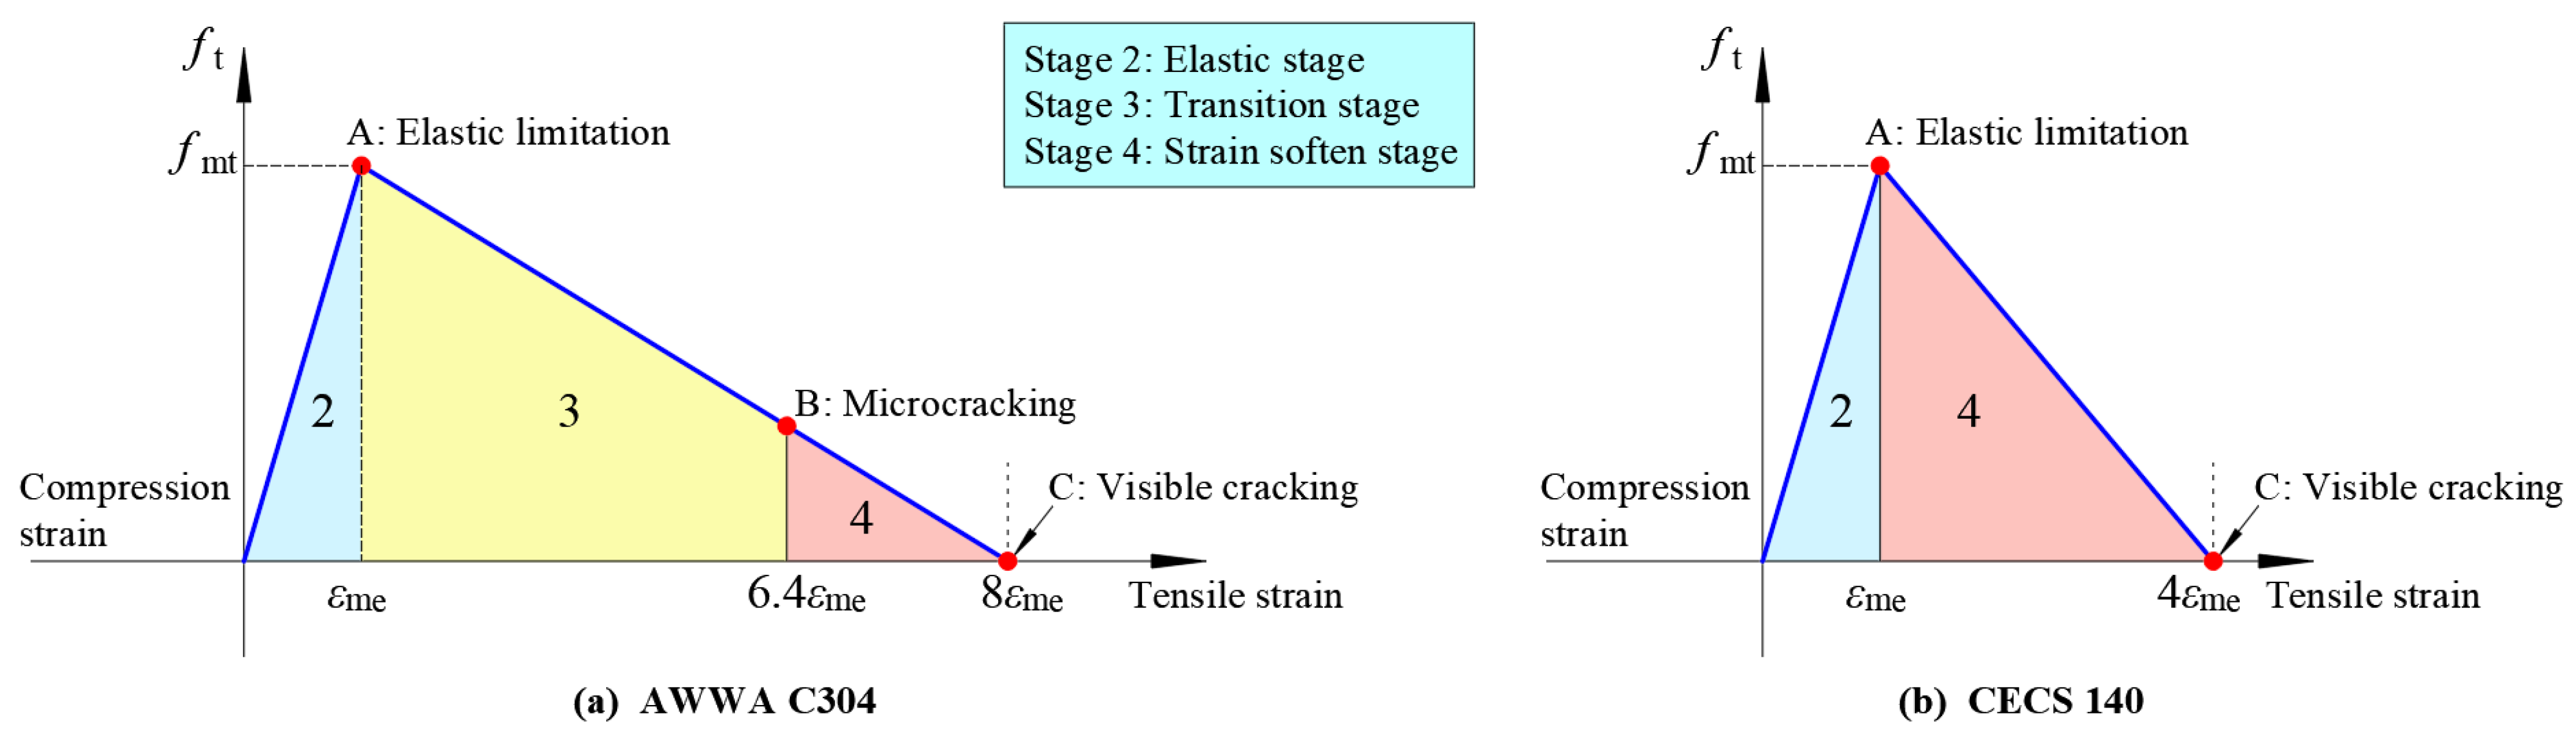
AWWA C304 describes the mechanical response of the concrete core at four stages: (1) prestressing; (2) elastic; (3) transition; and (4) strain softening, as shown in Figure 2a. No crack of concrete appears in stages 1 to 3, and the microcrack will grow in stage 4. Points A, B, and C separately indicate the concrete in elastic limit, the initial microcracks, and the critical transferring from microcrack to visible crack, respectively. The widths of the microcrack and the visible crack are 0.025 mm and 0.05 mm, respectively [32]. The occurrence of visible cracks indicates that the PCCP reaches the serviceability limit state. For the protective mortar, stage 1 is not considered, while stages 2 to 4 are similar to those of concrete, as shown in Figure 3a. The control strain to visible crack of the concrete and the mortar is 11 εce and 8 εme, respectively.

Figure 2.
Cracking control for concrete.

Figure 3.
Cracking control for mortar.
2.2. Design Process
2.2.1. Earth Load
The vertical earth load is calculated as following according to the specifications in CECS 140 and AWWA C304 [30,33] and marked as Fsk,CECS and Fsk,AWWA, respectively.
2.2.2. Maximum and Minimum Wire Area
The minimum center distance ds,min shall not be less than twice the diameter (d) of the steel wire, and the maximum center distance ds,max shall not be greater than 38 mm. The minimum cross-sectional area As,min and maximum cross-sectional area As,max are calculated as follows:
2.2.3. Prestress
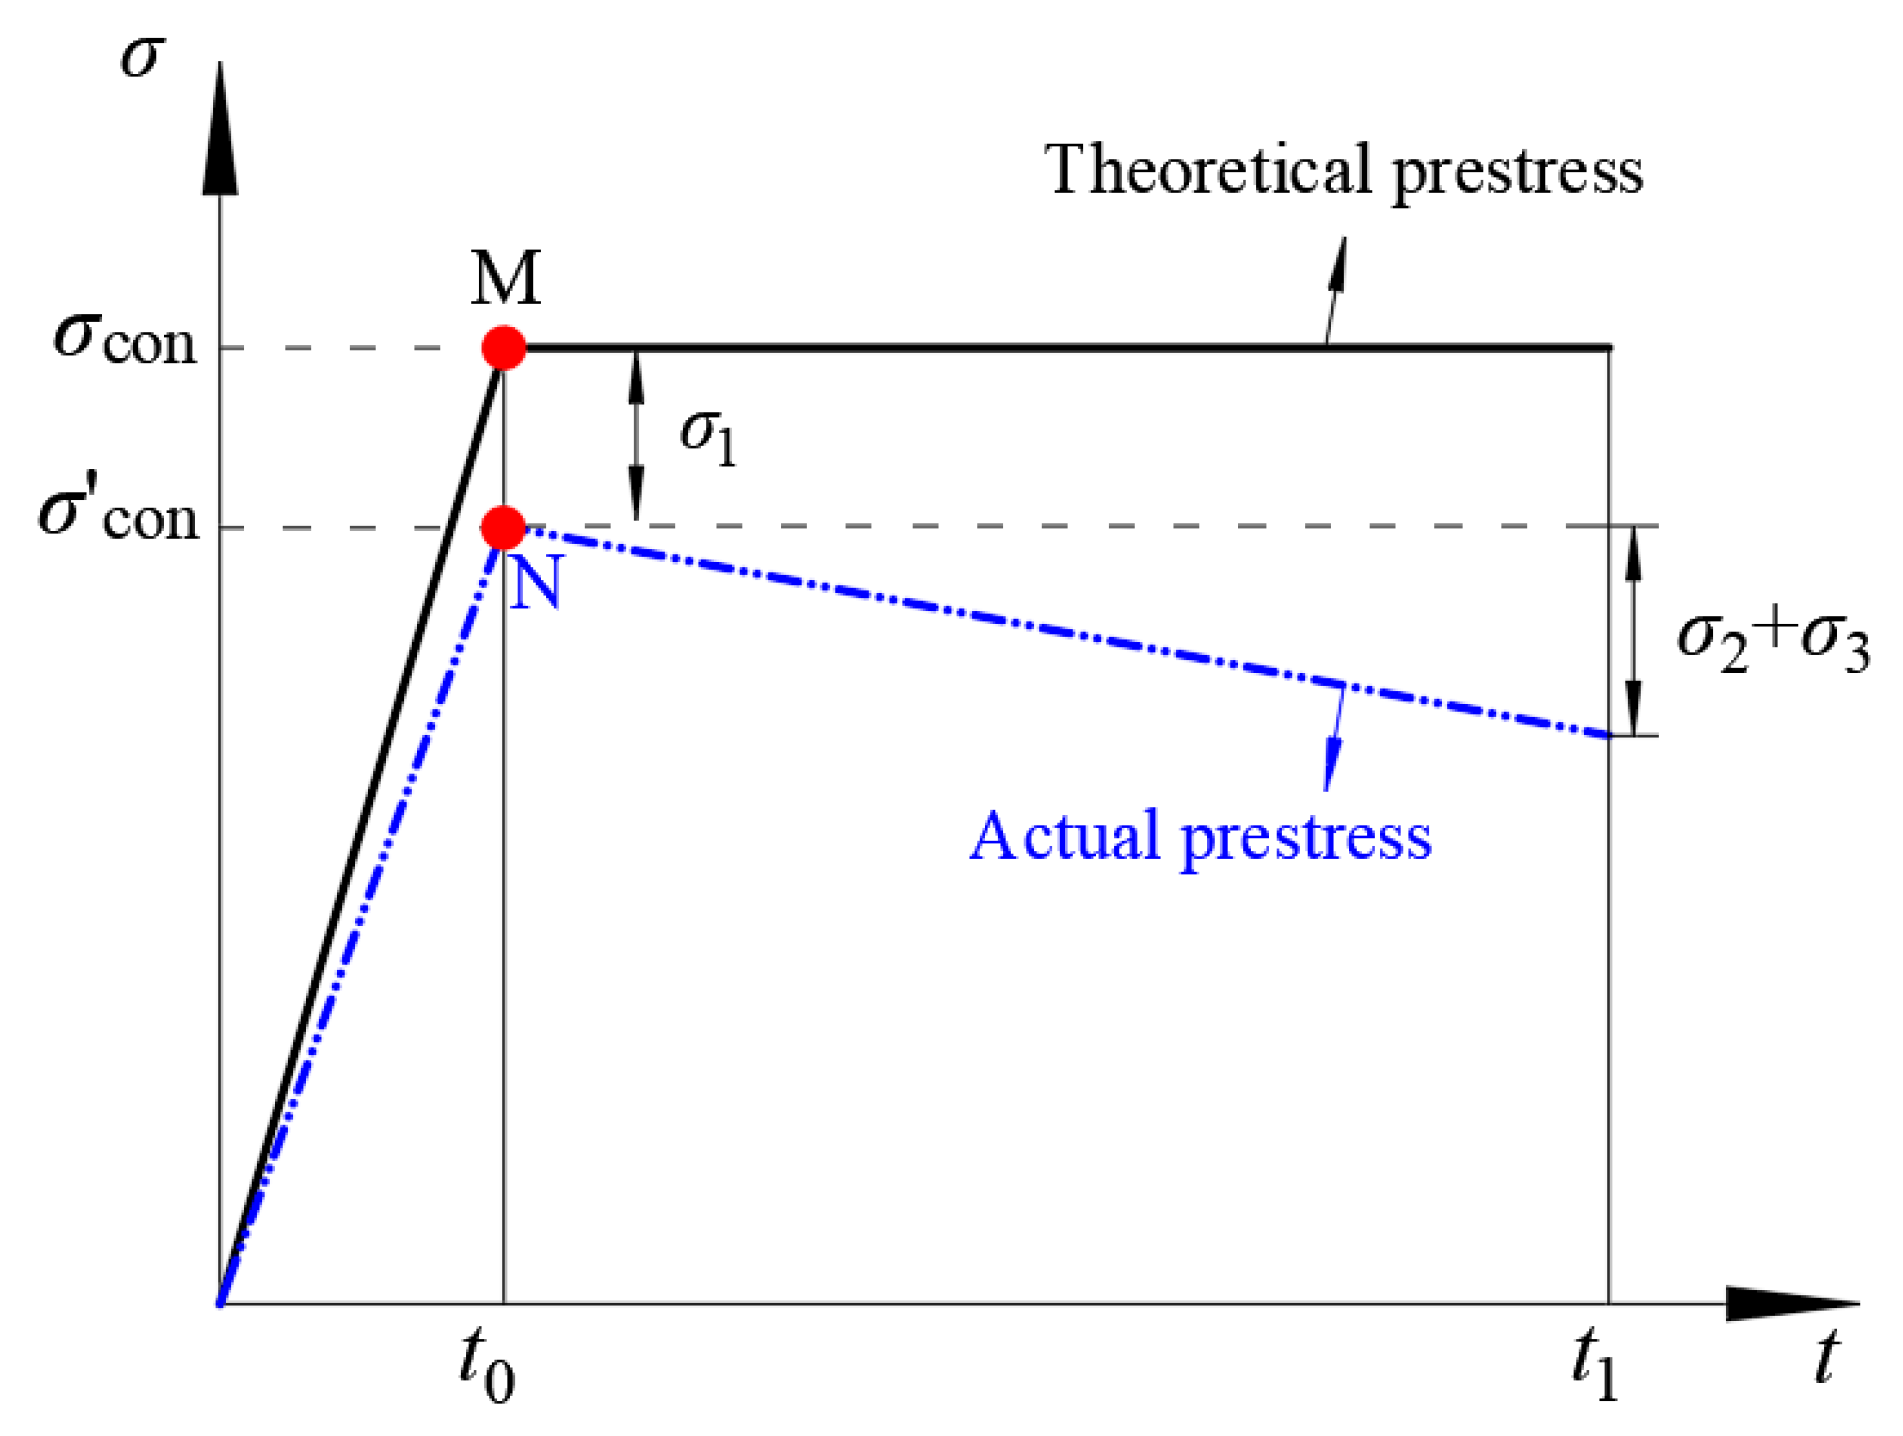
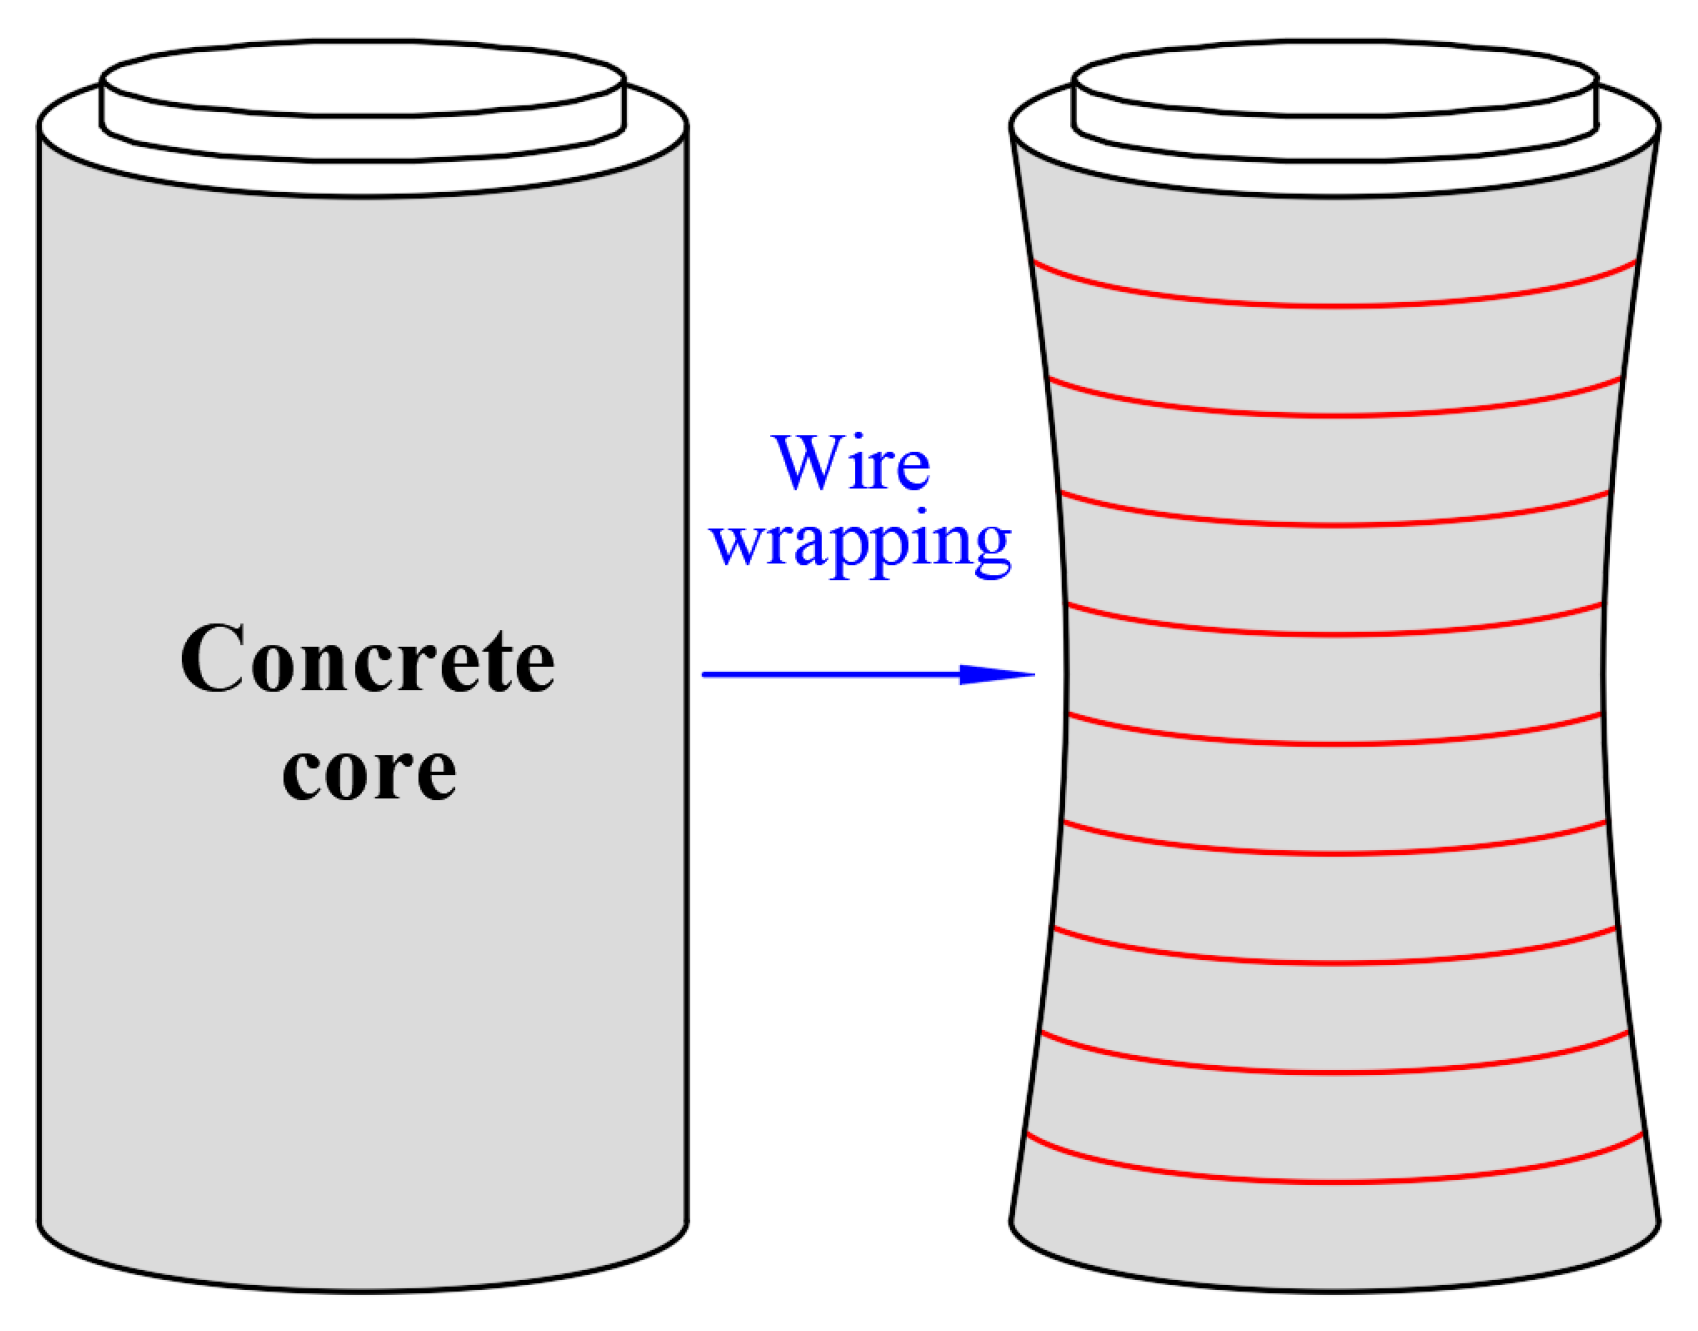
In this study, the prestress loss is attributed to the elastic compression of the concrete core (σ1), the shrinkage and creep of the concrete core (σ2), and the relaxation of prestressed steel wire (σ3) [1,30]. Figure 4 shows the theoretical trend of the prestress change with the storage time. The time t0 to t1 is the storage time of the PCCP. When the prestressed steel wire is wound around the concrete core, the elastic compression of concrete produces the radial deformation of the concrete core, resulting in the prestress loss σ1. The radial deformation distributes in law of larger at the middle and smaller at both ends along the axial of the PCCP [34], as shown in Figure 5. With the prestress losses σ2 and σ3, the effective prestress of the steel wire decreases continuously.
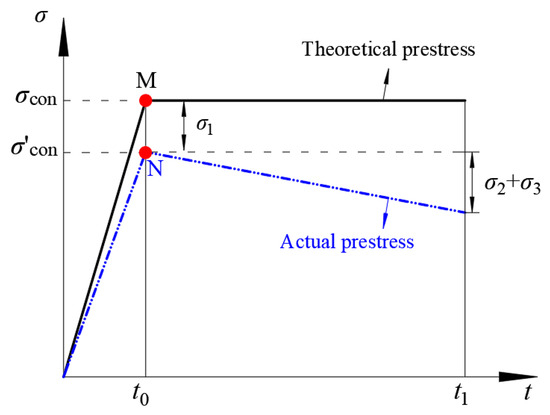
Figure 4.
Schematic diagram of the prestress loss of prestressed steel wire.

Figure 5.
Radial deformation caused by the winding of prestressed steel wire (note: Red line is prestressed steel wire).
For CECS 140, the σ1 and σ3 are calculated using Formulas (5) and (6), and the effective prestress σpe is calculated using Formula (7):
The σ2 is determined by a ratio of the normal precompression stress σp on the concrete core to the standard value f′cu of the cube compressive strength of concrete. To ensure the convergence of concrete shrinkage and creep, σp ≤ 0.5 f′cu [30]. For a single-layer winding of steel wire, σ2 is obtained from Table 4 [30].
Table 4.
Prestress loss caused by concrete shrinkage and creep.
For AWWA C304, the prestress losses are calculated based on the previous research [35,36] and the shrinkage and creep model of concrete in the code ACI 209.2R [37]. The effective prestress σpe is calculated using Formula (8):
The initial prestress σic of the concrete core is calculated using Formula (9):
Therefore, the final prestress σfc of the concrete core is separately calculated using Formulas (10) and (11) for CECS 140 and AWWA C304.
2.2.4. Decompression and Burst Pressures
Under the prestress of steel wire, the concrete core has a certain precompression strain [16]. The precompression strain will decrease and turn into a tension with the increase in internal water pressure. This induces a decompression point which represents the disappearing of the precompression stain in the concrete core, corresponding to the decompression pressure P0, as shown in Figure 6. The strain will suddenly increase when the concrete core reaches the elastic limit, which means the cracking of the concrete core.
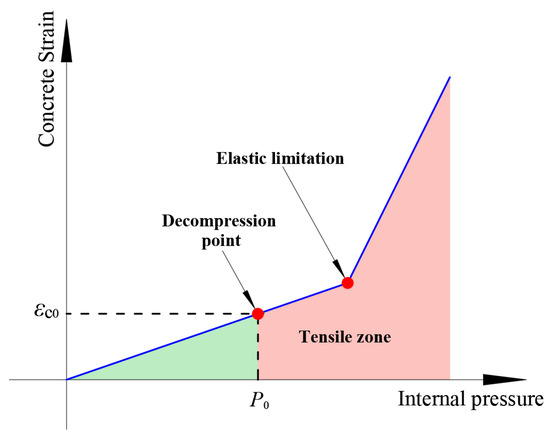
Figure 6.
Schematic diagram of different states of concrete under internal water pressure.
The decompression pressure is, respectively, calculated using Formulas (12) and (13) for the CECS 140 and the AWWA C304, and it is marked as P0,CECS and P0,AWWA:
The burst pressure Pb is calculated using Formula (14):
2.2.5. Moment and Thrust
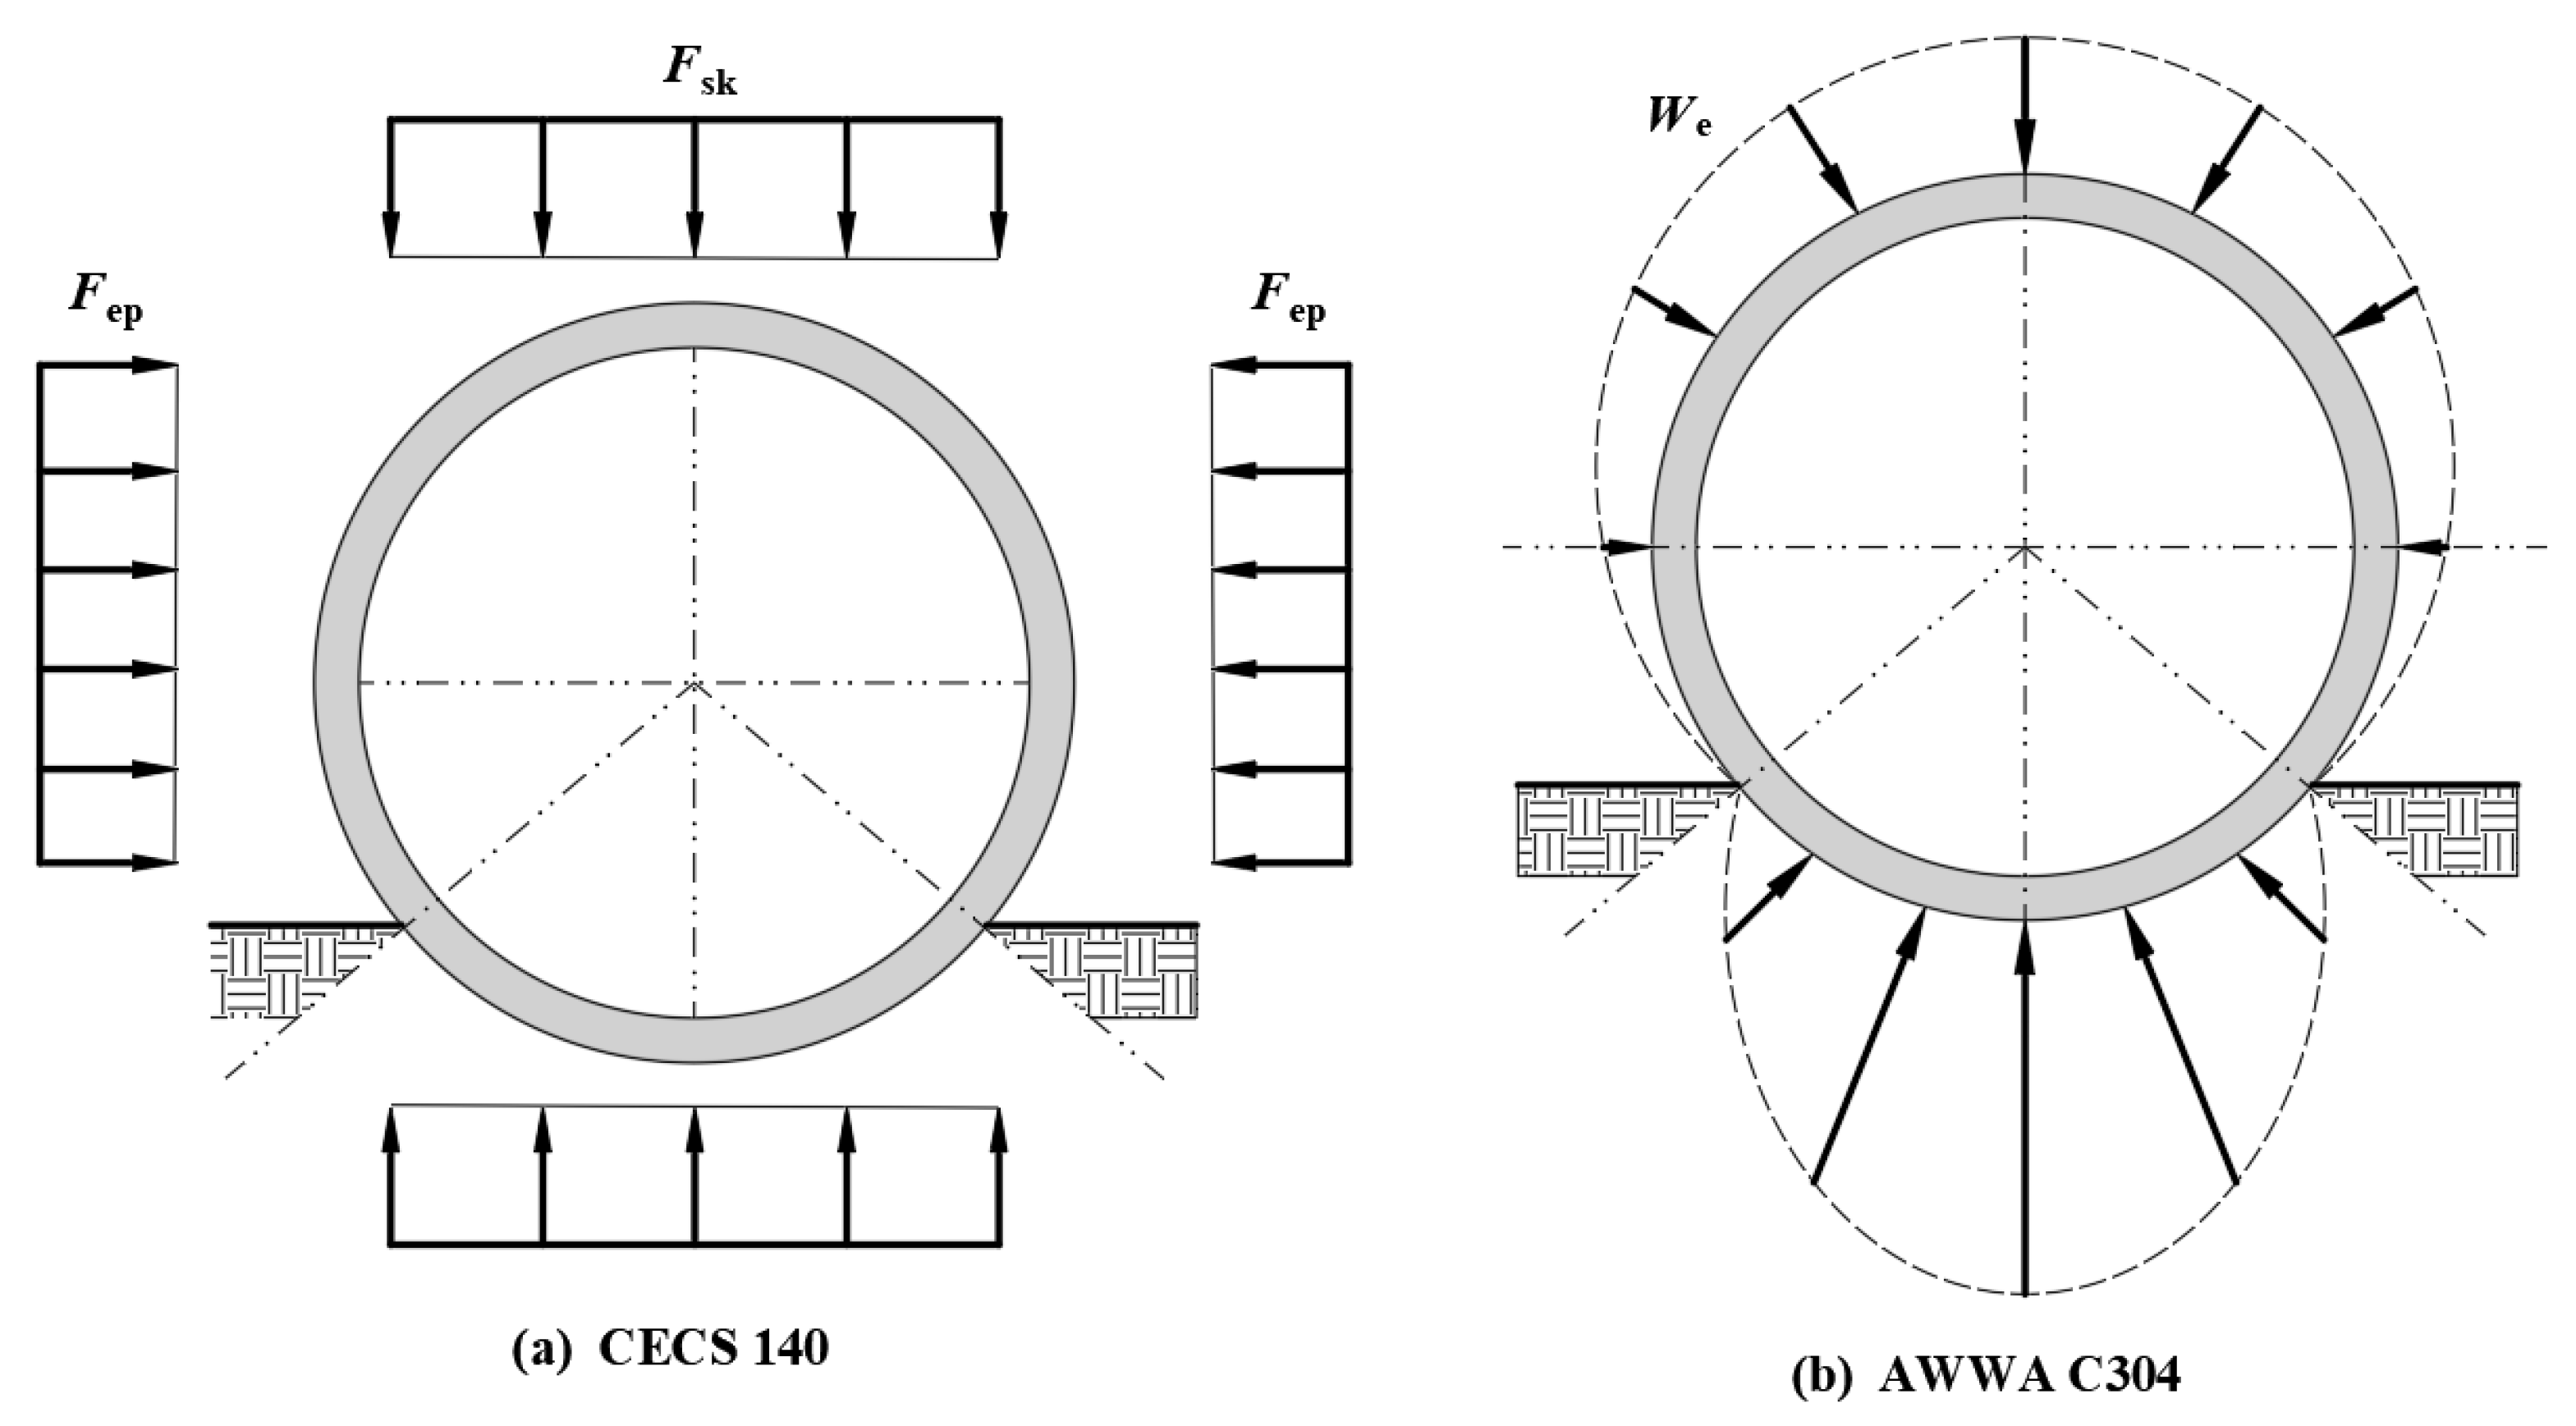
Based on the rectangular distribution theory, CECS 140 divides the soil load distribution into a vertical earth pressure Fsk and a horizontal earth pressure Fep, as shown in Figure 7a. The PCCPs tend to horizontal deformation under the Fsk, while Fep can inhibit this trend. However, AWWA C304 distributes the earth pressure into an Olander’s bulb form, as shown in Figure 7b.

Figure 7.
Distribution of earth load.
Table 5 lists the formulae for calculating the moment and axial force of the PCCPs [1,30]. The moment redistribution is considered by AWWA C304. In both design methods, the assumed cross-sectional area of prestressed steel wire can be adopted only when all working combinations meet the control criteria of the corresponding limit state.
Table 5.
Calculation of axial force and moment for the two design methods.
2.3. Design Parameters
Table 6 shows the geometry and design parameters of the PCCP, which is installed in a positive embankment with the arc soil foundation. The central angle of the pipe foundation is 120°. The following standard values were used: the unit weight of the backfill soil γs = 20 kN/m3, the pipe G1k = 75.64 kN/m, and the fluid Gwk = 80.42 kN/m. The additional load Ws = 10 kN/m2, and the vehicle live load q = 5.2 kN/m2. According to the codes [38,39], the design parameters of materials are presented in Table 7. The groundwater and the anti-floating stability are not required. The total outdoor laying time of the PCCPs is 270 d, and the time from the burial to the water supply is 90 d.
Table 6.
Geometry and design parameters for PCCP.
Table 7.
Material properties for design.
2.4. Design Results
The design results of the PCCP are shown in Table 8. The prestress losses σ1 and σ2 of AWWA C304 were 2.3 times and 1.9 times that of CECS 140, respectively. The difference of σ1 is caused by the higher tensile strength and lower elastic modulus of concrete adopted by AWWA C304. The difference of σ2 is attributed to the adopted shrinkage and creep models of concrete. The prestress loss σ3 is very close for the two methods. CECS 140 leads to an effective prestress of 7.7% higher than AWWA C304. This leads to the CECS 140 producing a concrete core with 1.1 times the initial prestress and 1.2 times the final prestress compared to AWWA C304, respectively.
Table 8.
Design results for PCCP.
Based on the design results, the cross-sectional area of prestressed steel wire designed by CECS 140 is about 10% higher than that by AWWA C304. This shows that CECS 140 can ensure the safety of the PCCP while reducing the calculation complexity and the dependence on software. Moreover, the cost of the prestressed steel wire was about 18% and 16% of the total manufacture cost of the PCCP designed using CECS 140 and AWWA C304, respectively. Therefore, the PCCP designed using the simplified method will increase cost less than 2% of the total manufacture cost because of the increase of about 10% prestressed steel wire under the working condition in this study.
3. Full-Scale Test and FE Model
3.1. Full-Scale Test
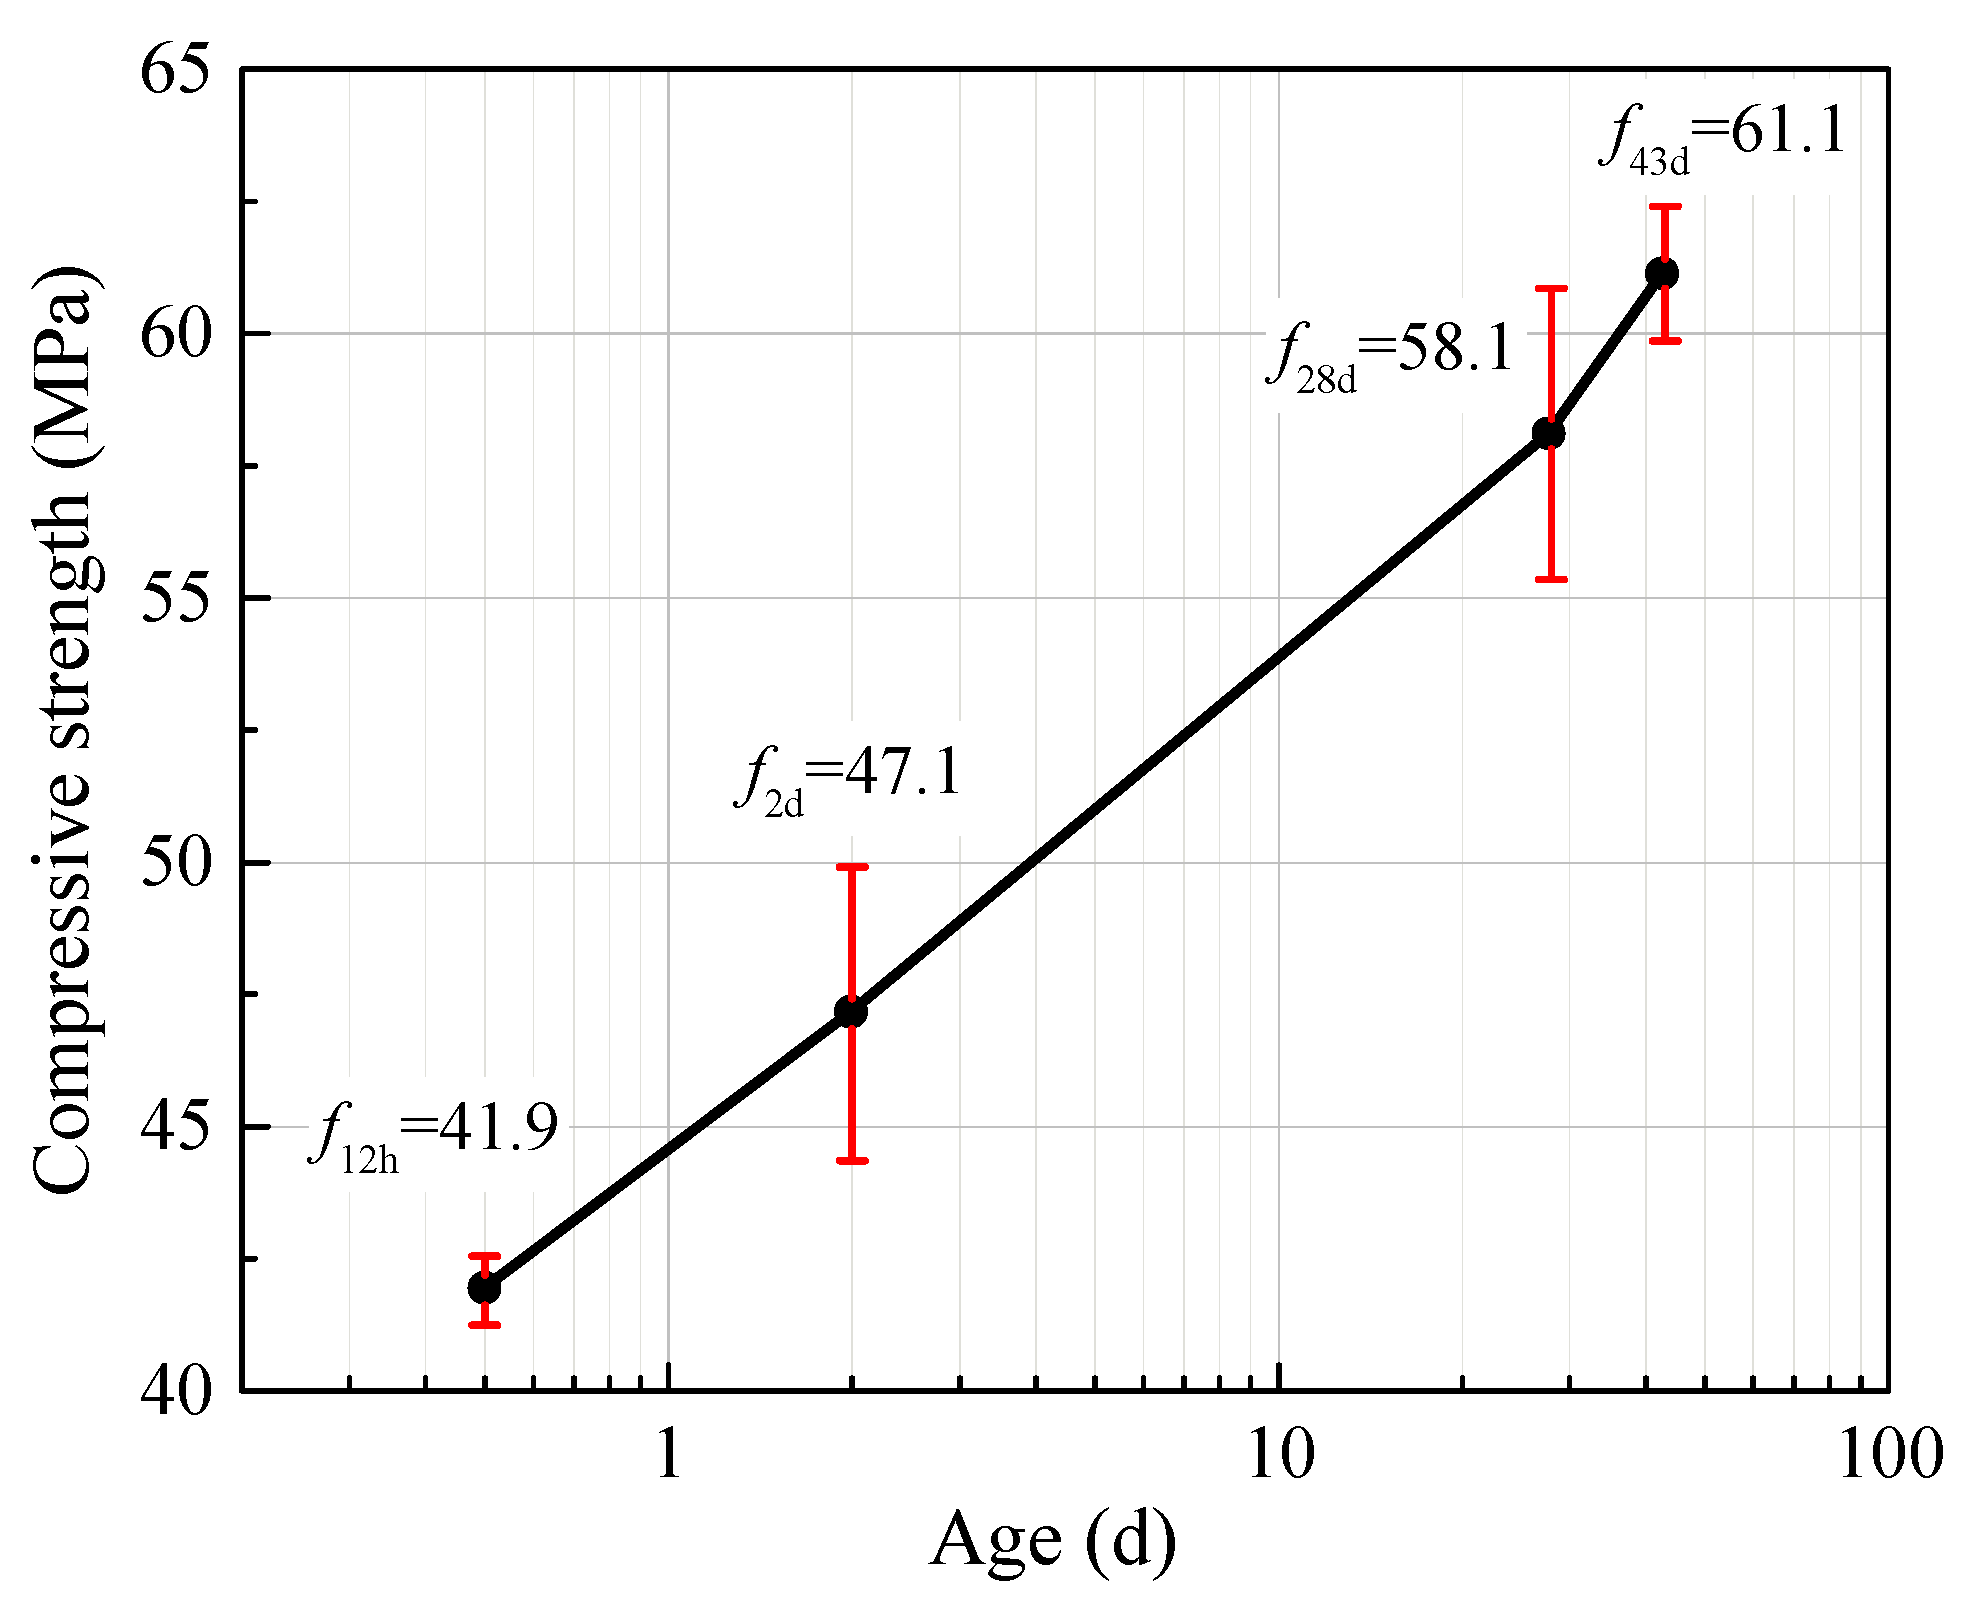
The test PCCP was designed by CECS 140 and was fabricated in a precast plant; for details, see the published paper [16]. The ages of the concrete core and protective mortar were 43 days and 38 days when the experimental study was carried out, respectively. Three group cubic specimens with dimensions of 150 mm were made during the concrete core pouring, which were respectively used to measure the concrete strength f12h at demolding, the strength f2d at the beginning of winding prestressed steel wire, and the strength f28d at a standard curing age of 28 days. After the completion of the internal water pressure test, the PCCP was sampled with cylinder specimens of Φ100 mm × 100 mm to measure the actual strength (f43d) [40]. The compressive strength results are shown in Figure 8.

Figure 8.
Test results of concrete strength f12h, f2d, f28d, and f43d.
The sample of steel cylinder and prestressed steel wire was tested by using the standard methods [41,42,43]. The yield and ultimate tensile strength of the steel cylinder were 300 MPa and 470 MPa. The ultimate tensile strength of prestressed steel wire was 1620 MPa. Because the test values of the f2d and the ultimate tensile strength of prestressed steel wire are higher than the design value shown in Table 7, some related parameters are corrected based on the formulas (7), (9), (10), (12), and (14); the results are shown in Table 9.
Table 9.
Results after revised.
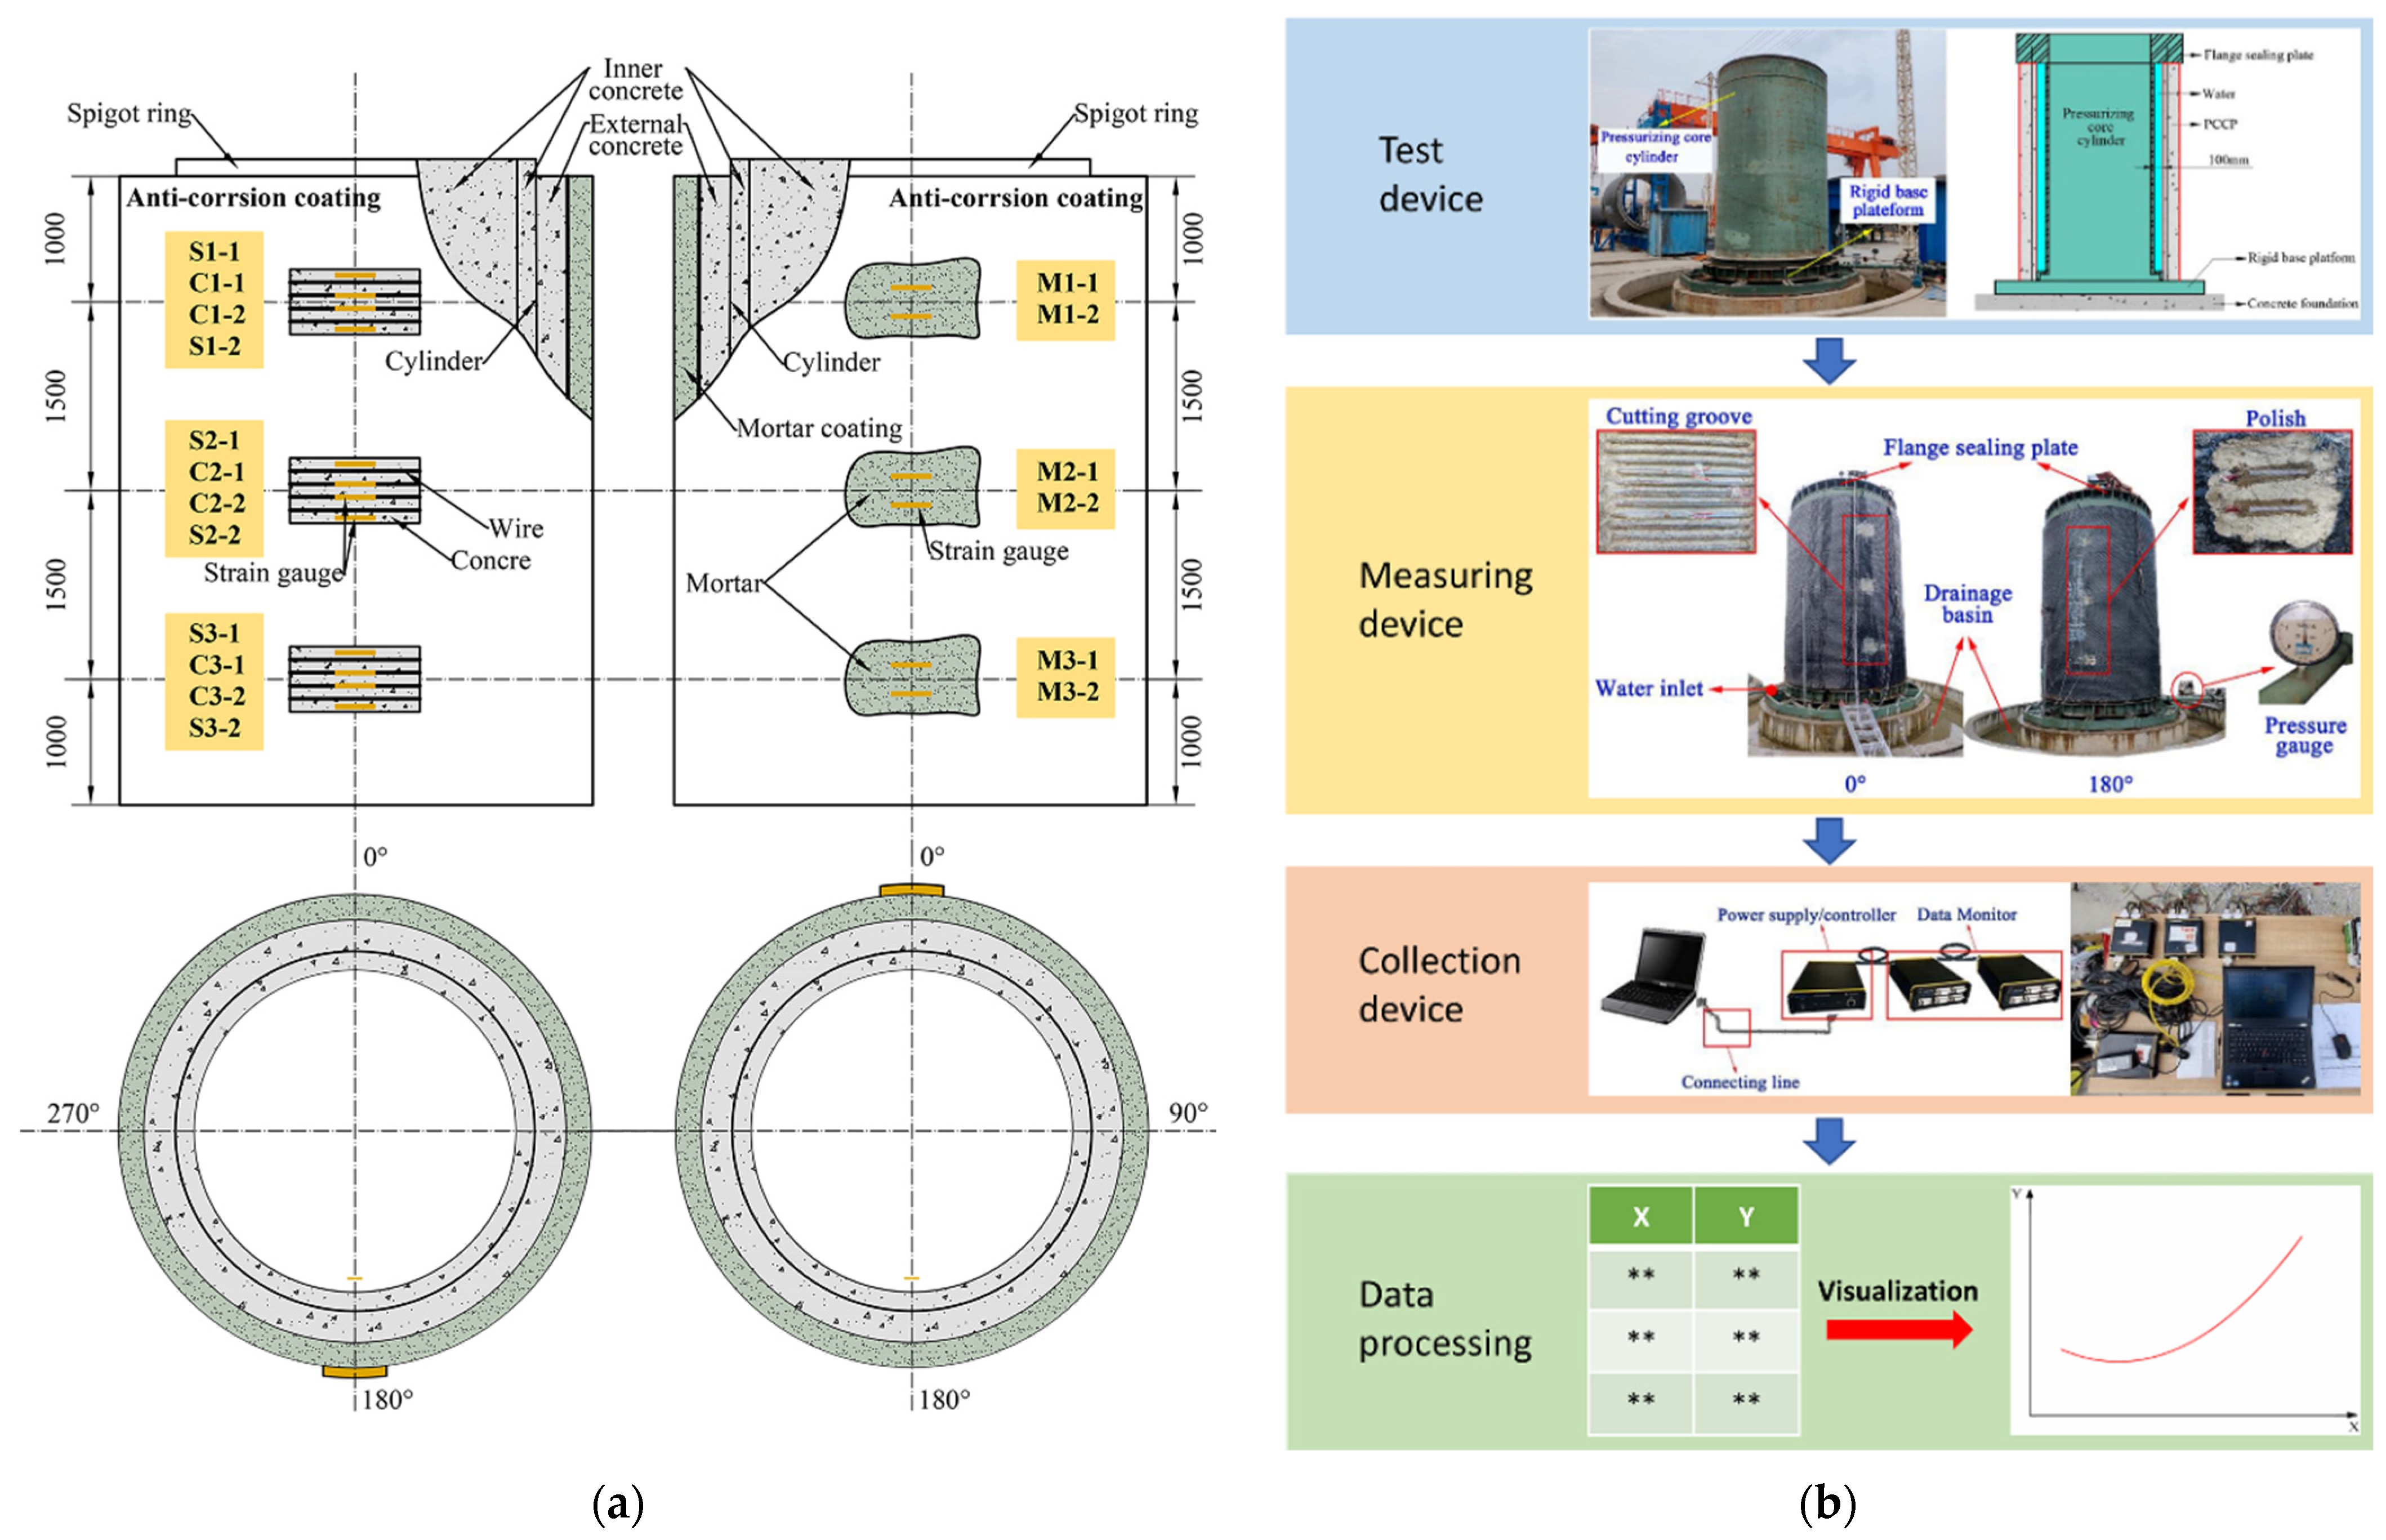
The positions of the strain monitoring device and experiment process are shown in Figure 9. For more details, refer to the published paper [16].
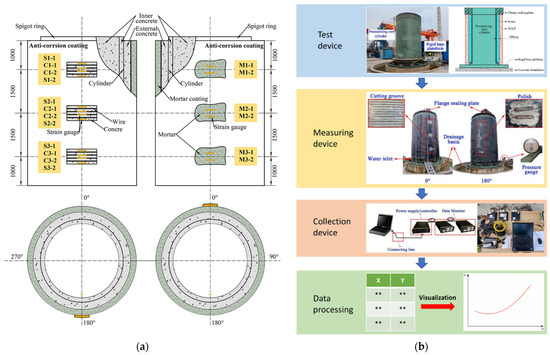
Figure 9.
Test monitoring arrangement, equipment and process: (a) schematic diagram for monitoring arrangement (unit: mm); (b) test equipment and process.
3.2. Finite Element Model (FEM)
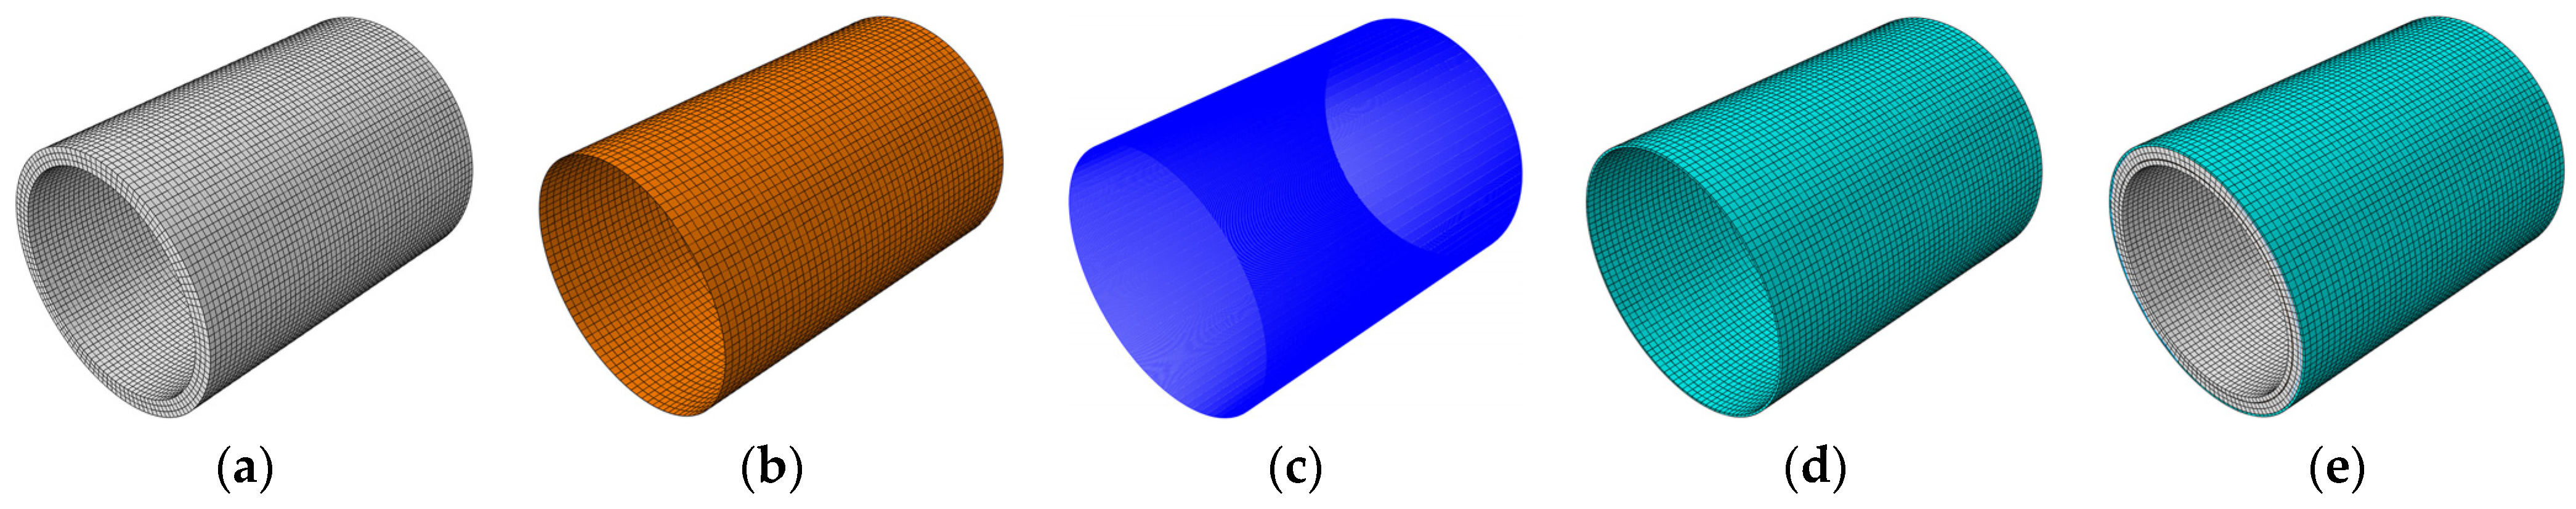
The eight-node hexahedral-reduced integral linear solid element (C3D8R) was used to simulate the concrete core and protective mortar. A linear truss element (T3D2) and four-node shell element (S4R) were used to describe the prestressed steel wire and steel cylinder, respectively. The mesh results for all parts are shown in Figure 10. The model has a total of 27,840 solid elements, 24,240 truss elements, and 4800 shell elements.

Figure 10.
Mesh division for the PCCP: (a) concrete core; (b) steel cylinder; (c) prestressed wire ring; (d) protective mortar; (e) the PCCP.
3.2.1. Material Parameters
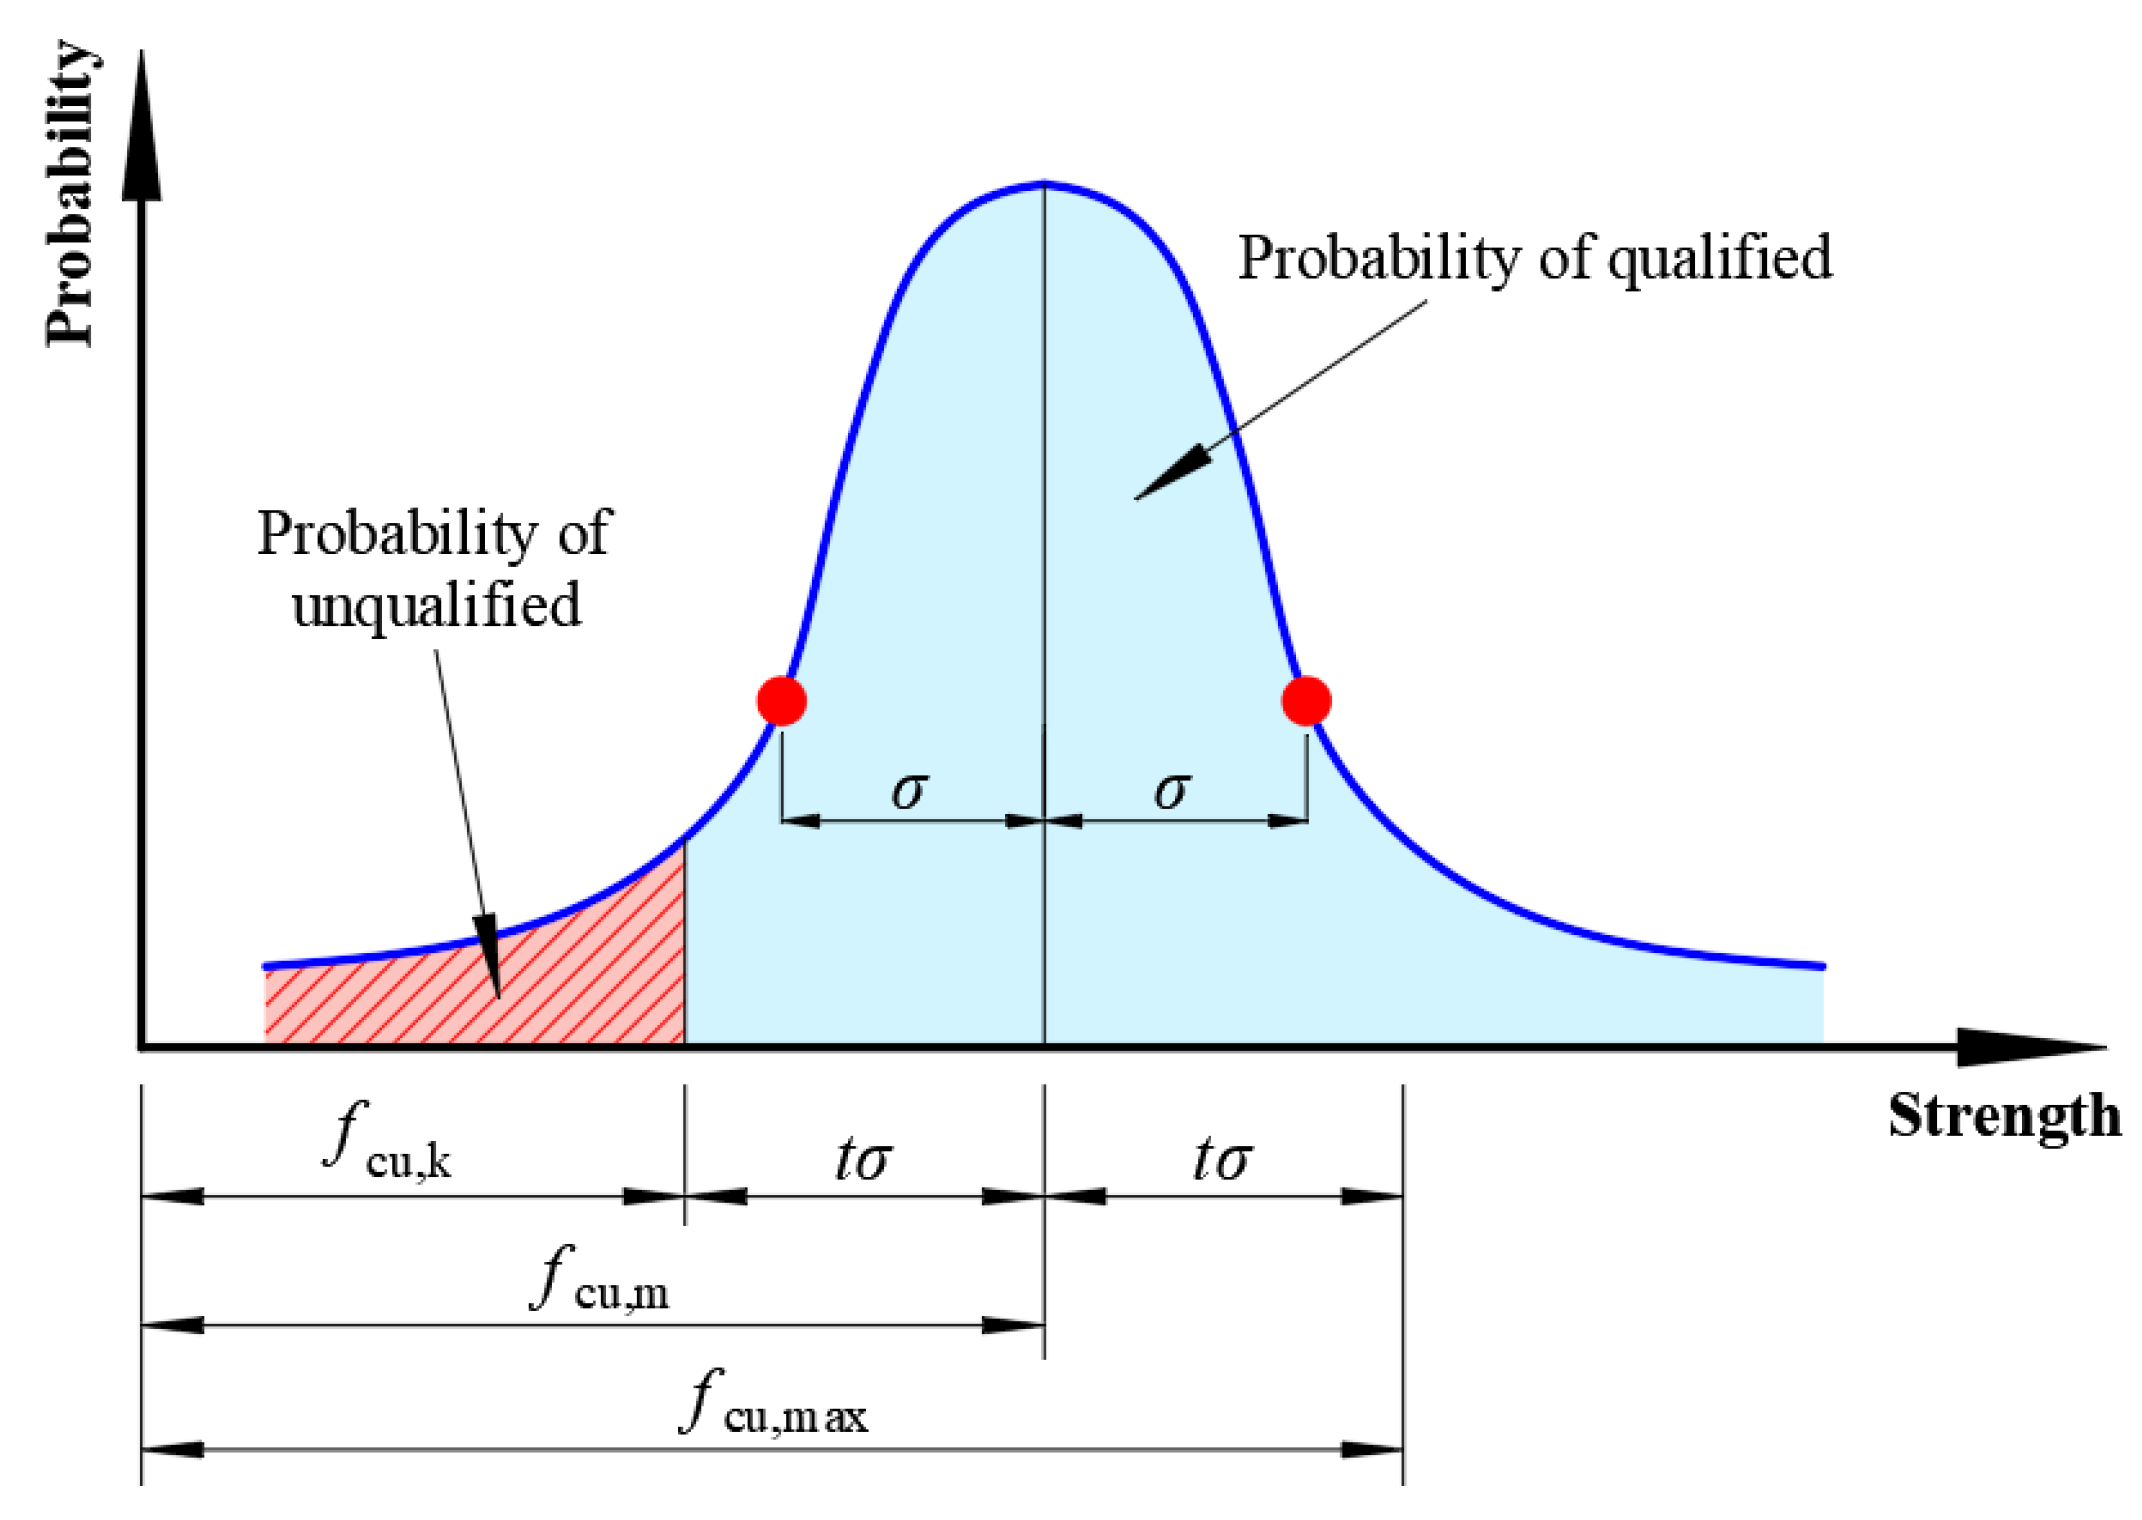
Generally, the probability of concrete strength no less than the standard design strength fcu,k is considered in the design, as shown in Figure 11.
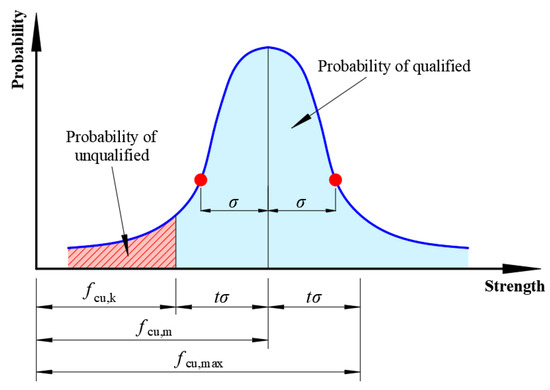
Figure 11.
Standard normal distribution curve of concrete strength.
The fcu,m and fcu,max are the average and the upper limit of concrete strength. The δ is the standard deviation of concrete strength. Based on the standard normal distribution, the functional relationship P(t) between P and probability t can be expressed as shown below:
Therefore, the fcu,k, fcu,m, and fcu,max were adopted in FEM to consider the dispersion of concrete strength. Based on the test results, the average strength can be converted into a standard value and maximum value according to the Formulas (17) and (18) [44]. The calculation results of mortar and concrete strength used in FEM are shown in Table 10. Due to the particularity of the roll-casting process, the upper limit of strength is not considered for the protective mortar.
Table 10.
Strength calculation results of concrete and mortar (unit: MPa).
Based on the test results, the yield strength of steel cylinder and the ultimate tensile strength of prestressed steel wire are 300 MPa and 1620 MPa, respectively. The yield strength of prestressed steel wire is taken as 1200 MPa, which is 75% of the ultimate tensile strength according to China code GB/T 5223 [43]. According to the codes [38,39,41,43], the elastic modulus of the steel cylinder and prestressed steel wire are 206 GPa and 195 GPa, respectively. Moreover, Poisson′s ratio of concrete and mortar is set at 0.2, and that of steel materials is set at 0.3.
3.2.2. Stress–Strain Relationships
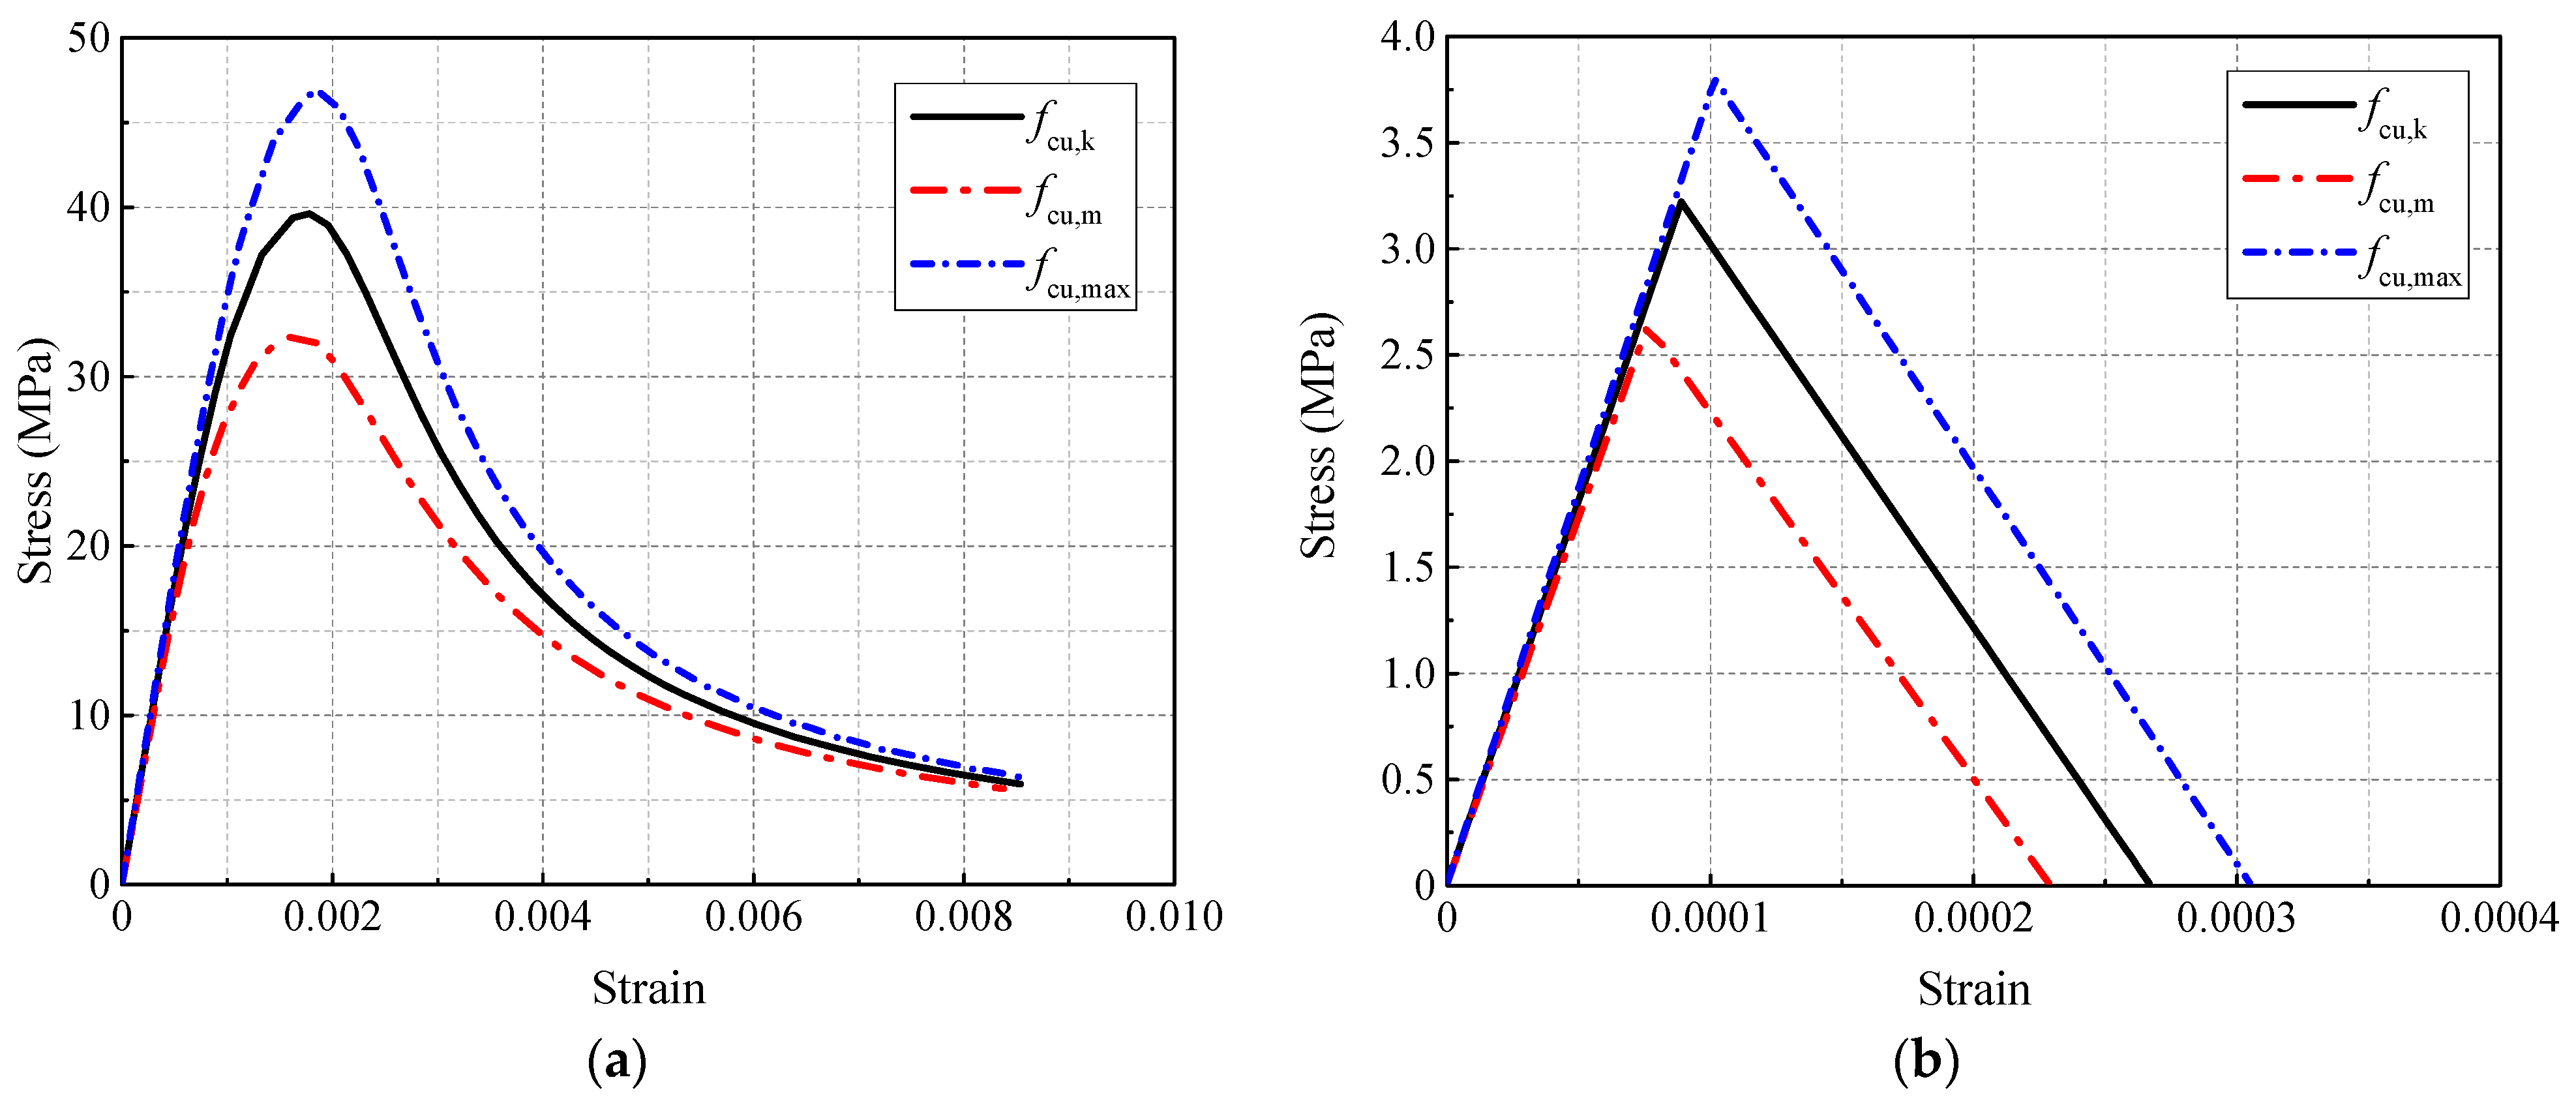
The nonlinear stress–strain curve of concrete under compression is expressed by Formula (19) [38]. A bilinear constitutive relationship is used for the tensile stress–strain of concrete. These relationships at different strengths of concrete are shown in Figure 12. A double linear model with the control cracking strain of 4εme is adopted for the tensile stress–strain relationship of the mortar.
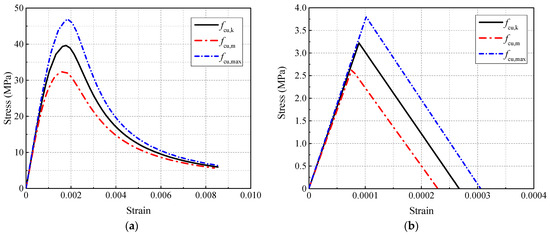
Figure 12.
Stress–strain relationship of concrete: (a) uniaxial compression; (b) uniaxial tension.
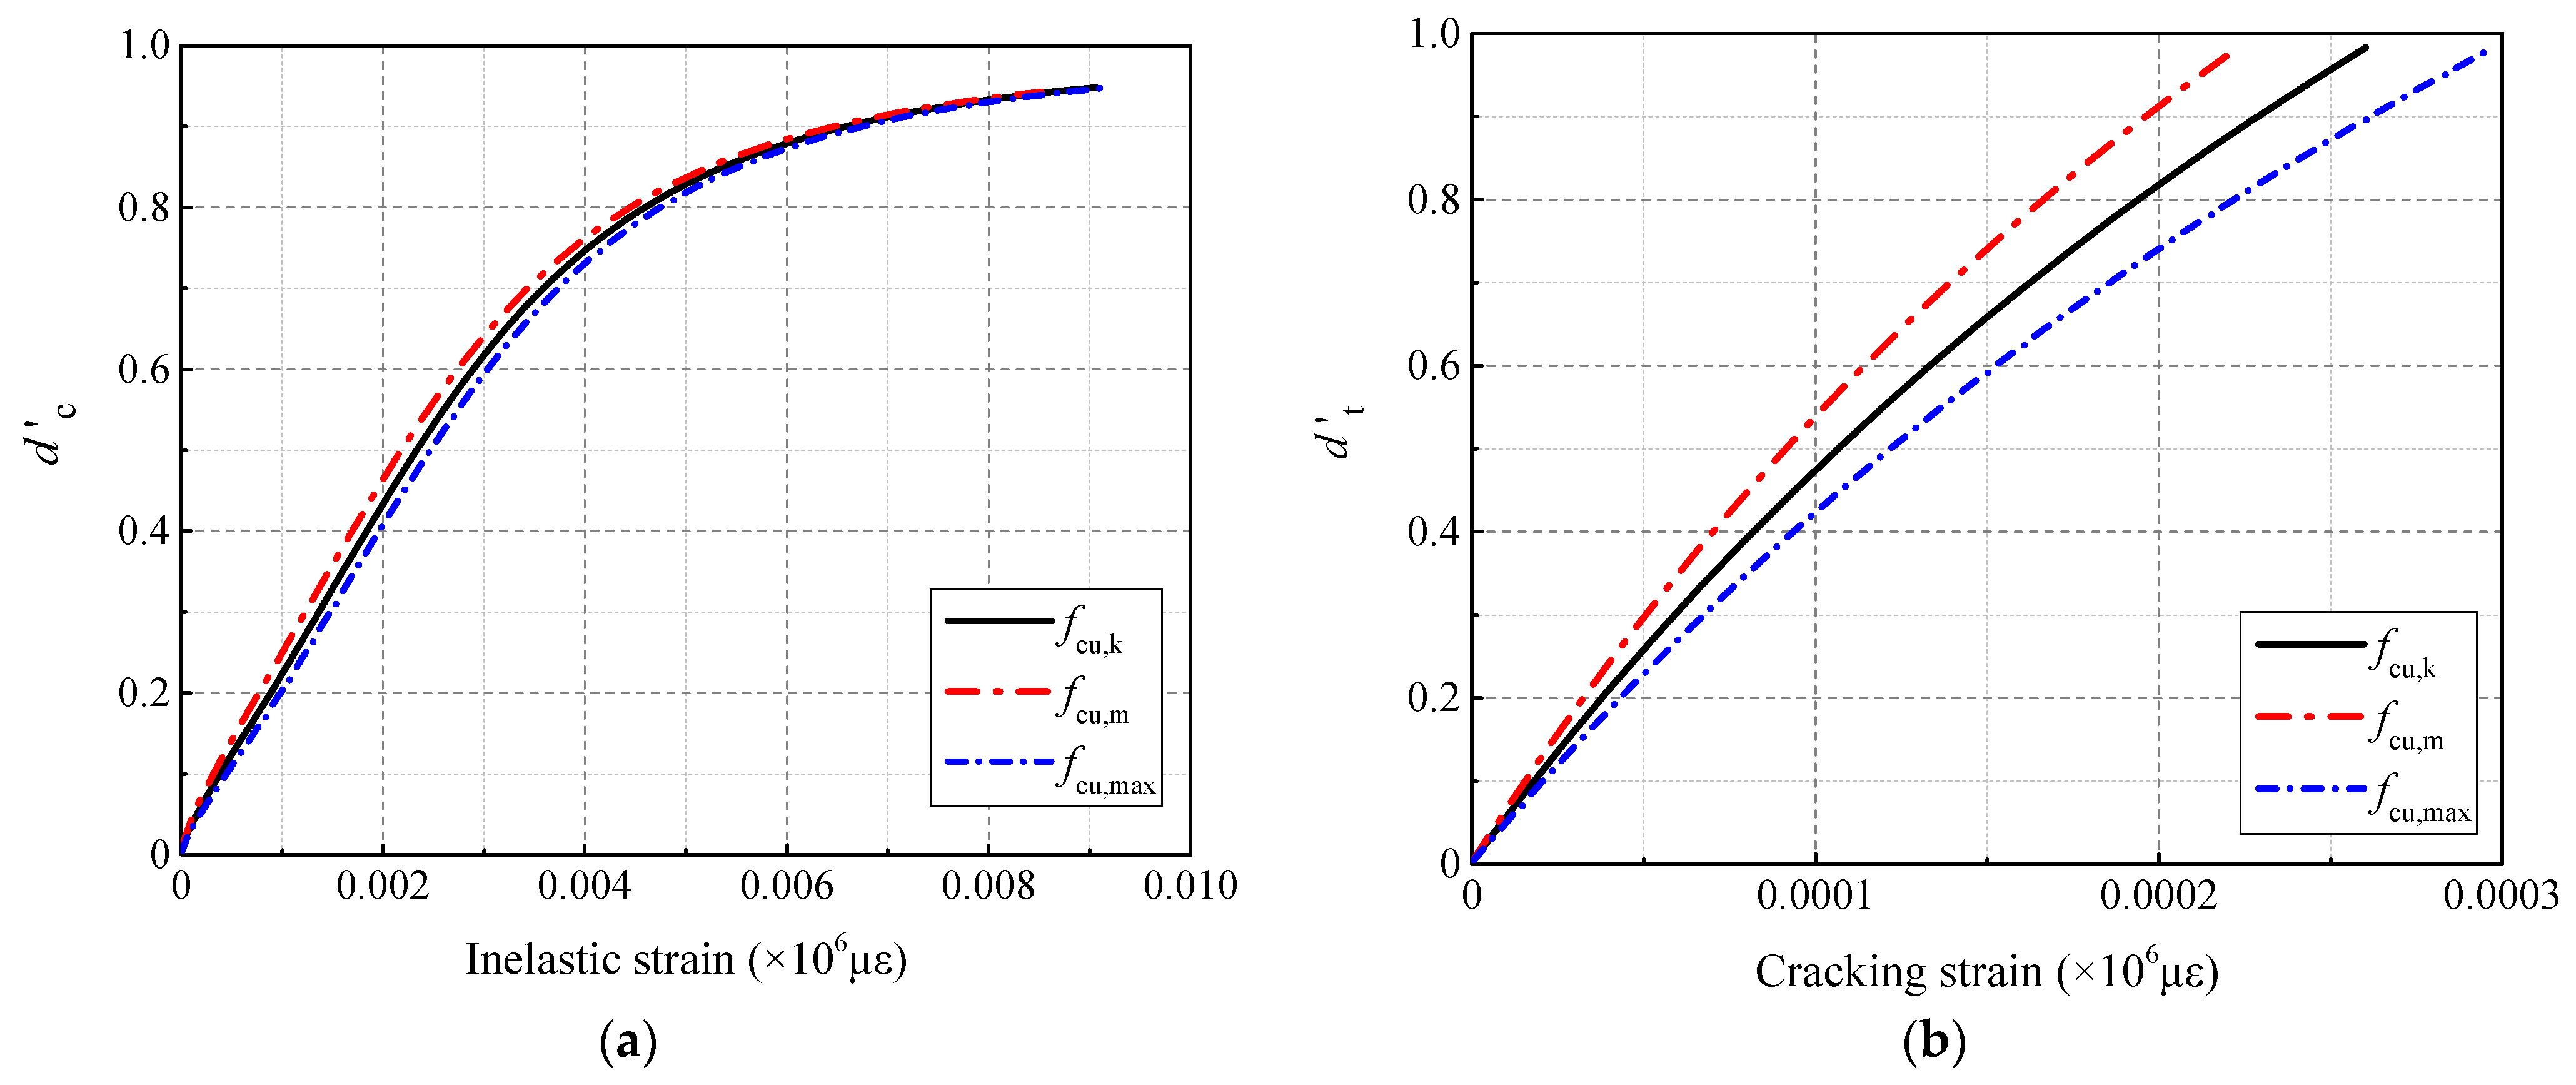
The stress–strain relationship of the Abaqus CDP model is a function related to the scalar damage degradation variables d′t and d′c, as shown in Formulas (20) and (21) [45].
The calculated nominal stress and strain need to be converted into the real stress and strain during the calculation. Assuming that the elastic deformation is incompressible, the expression of true stress can be obtained from the constant volume, as shown in Formulas (22) and (23) [46]. Then, d′t and d′c are calculated according to Formulas (24) and (25), respectively. Furthermore, the damage parameters of concrete in the CDP model can be obtained, as shown in Figure 13.
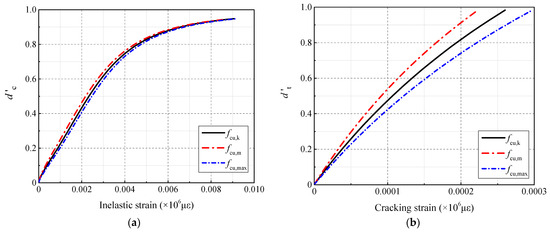
Figure 13.
Damage parameters of concrete: (a) uniaxial compression; (b) uniaxial tension.
The plastic flow of the CDP model is assumed to be a non-correlated flow. The yield function is shown in Formula (26) [47]:
In this study, α = 0.12, and Kc = 0.667.
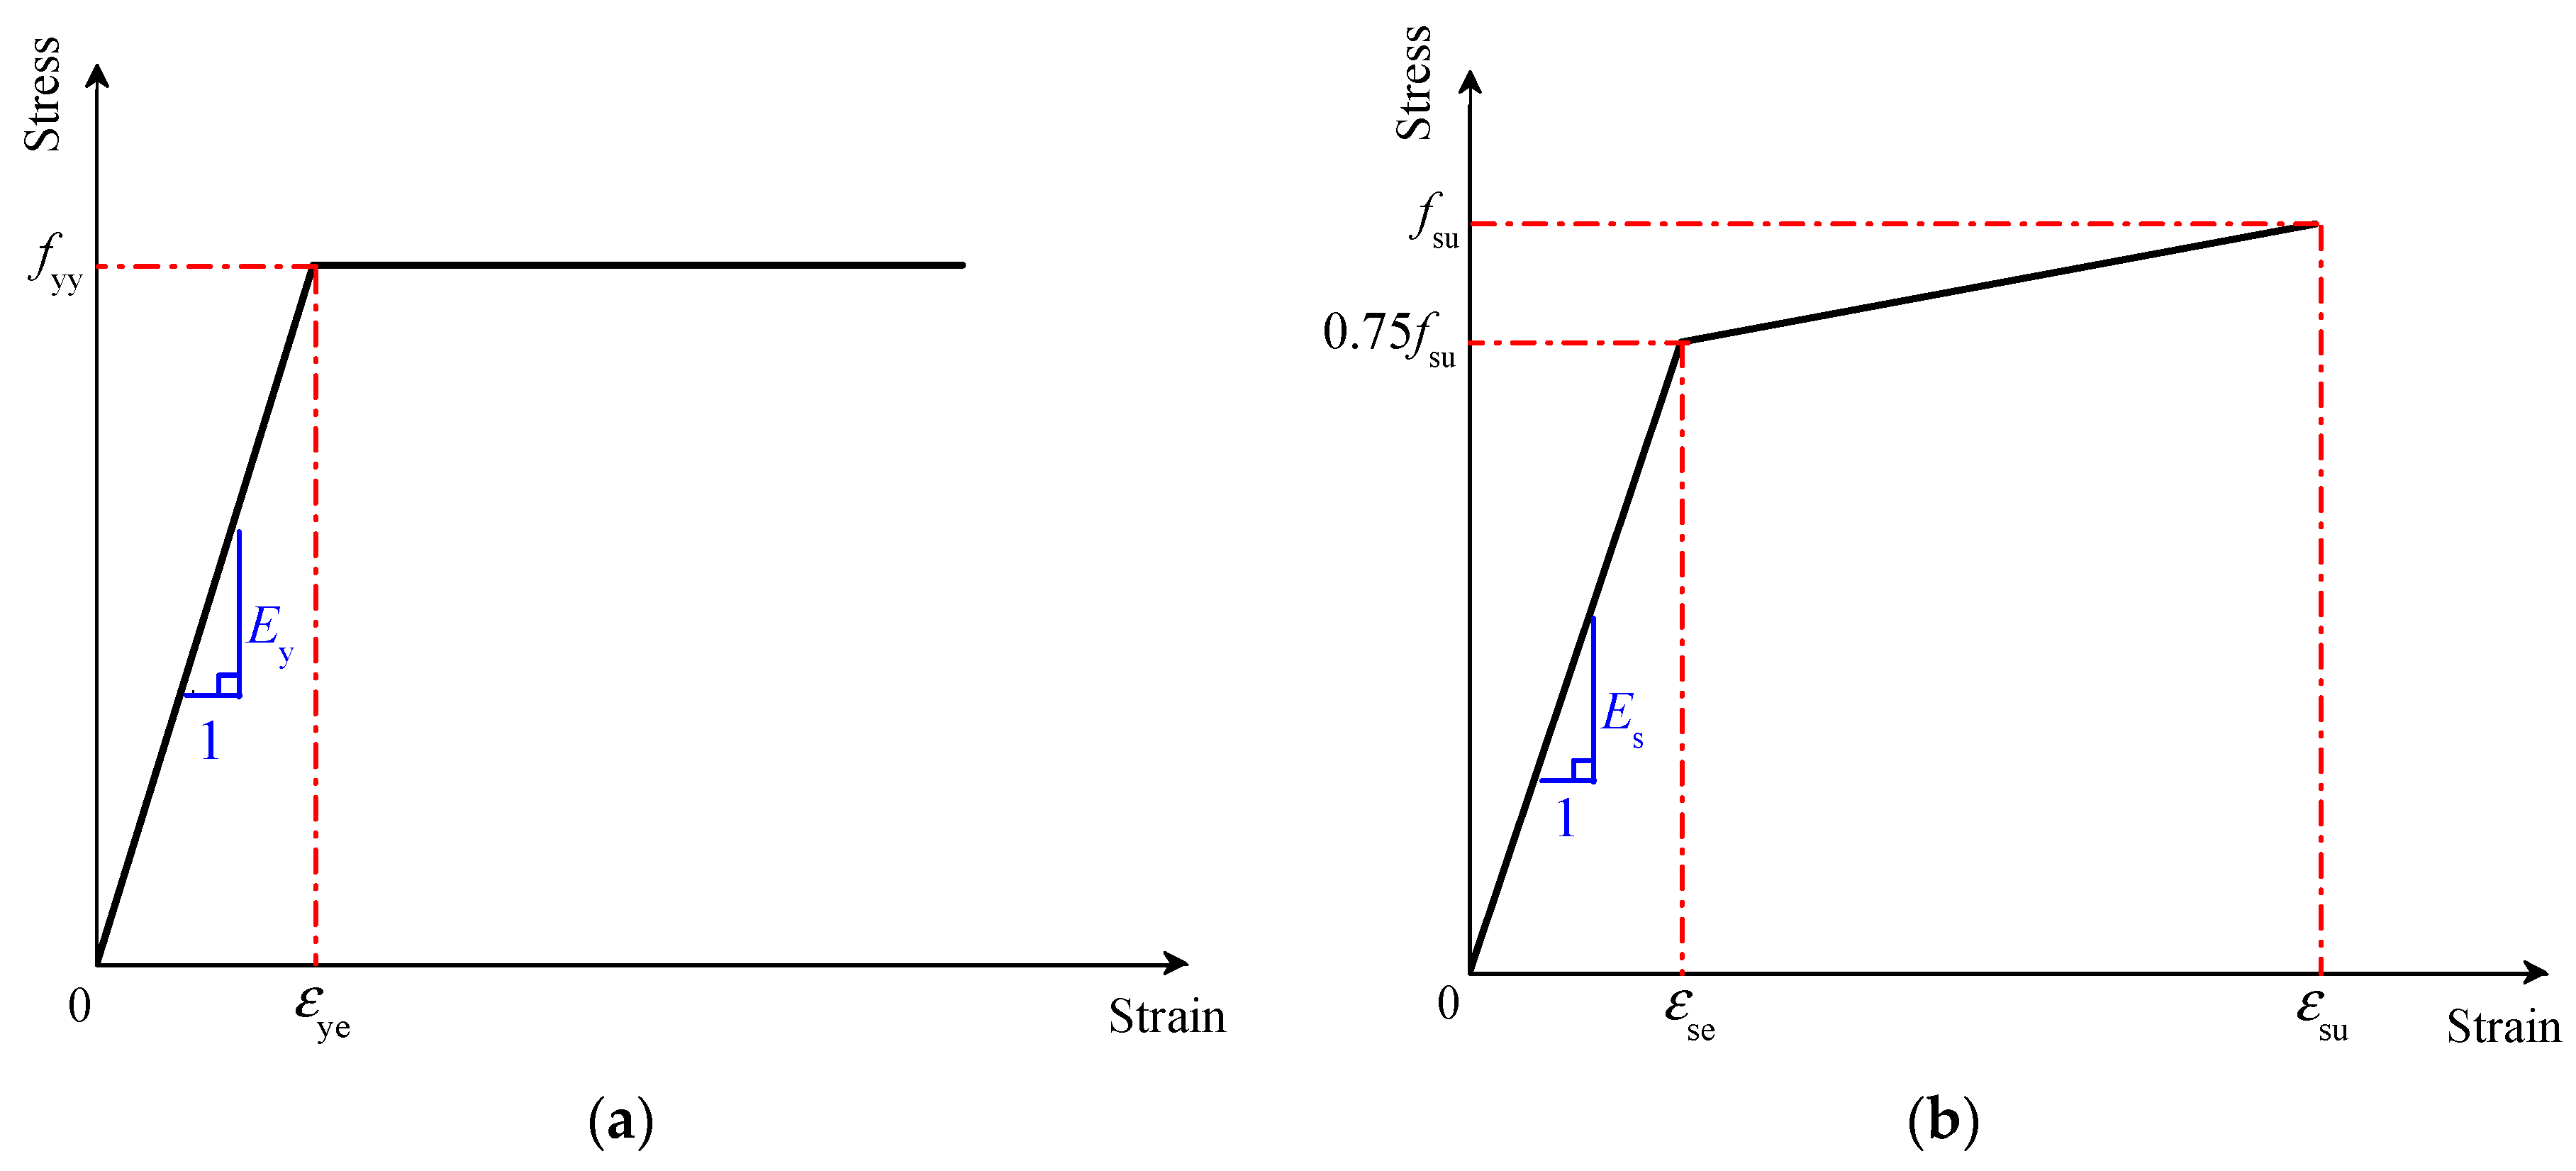
An ideal elastic–plastic model of the stress–strain relationship is selected for the steel cylinder, and a two-stage linear constitutive model is adopted for the prestressed steel wire, as shown in Figure 14.
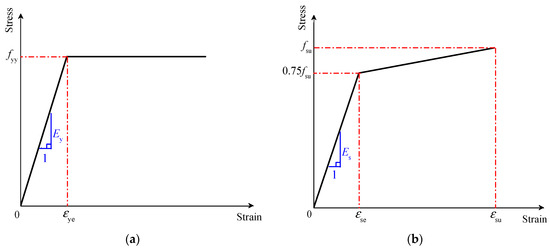
Figure 14.
Stress–strain relationship of steel materials: (a) steel cylinder; (b) prestressed steel wire.
3.2.3. Boundary Condition and Material Interaction
The axial and circumferential displacement constraints were applied to the top and bottom of the PCCP, while radial displacement was allowed. In this study, the “embedded” command was used to define the interaction between the steel cylinder to concrete and the prestressed steel wire to concrete, which assumed that the steel cylinder and prestressed steel wire are perfectly in contact with the concrete core. The “Tie” command was used to define the interaction of mortar to concrete, which assumed that no delamination exists between mortar and concrete.
3.2.4. Load Application and Working Conditions
The analysis steps of FEM are shown in Table 11. The final pressure is set to the burst pressure (2.7 MPa). Six groups of FEM models are established, in which the CAV + MSV group uses the same design parameters as the actual PCCP for the control, as shown in Table 12.
Table 11.
Analysis step settings.
Table 12.
Combination of working conditions.
3.2.5. Prestress Exerting
The equivalent temperature reduction method is used to simulate the prestress of prestressed steel wire [27]. The expression of the relationship between temperature and stress is shown below:
In this study, αt = 1 × 10⁻⁵/°C.
The prestress simulation results of the concrete core and the steel wire under CAV + MSV working conditions are shown in Figure 15. The design and simulation results of all working conditions are listed in Table 13. This shows that the simulation results are in good agreement with the design results.
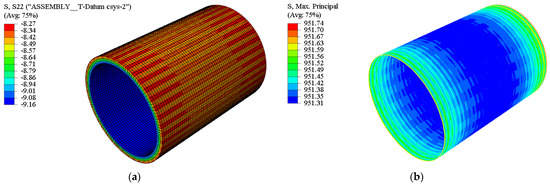
Figure 15.
Prestress simulation results (CAV + MSV group): (a) concrete core (MPa); (b) prestressed steel wire (MPa).
Table 13.
Comparison of prestress results.
3.3. Validation of FEM with Test Results
Figure 16 shows the FEM simulation results compared with the test results, in which the test 1 m, test 2.5 m, and test 4 m indicate the distance of the monitoring point away from the spigot ring of the PCCP. The linear characteristics present to the strains of concrete, mortar, and prestressed steel wire, when the internal water pressure is lower than 1.8 MP. When the internal water pressure exceeds 1.8 MPa, the concrete strain suddenly increases. The FEM simulates the characteristic of strain mutation well with a higher accuracy in the linear stage of the materials while achieving the expected aim of simulating the strain abrupt phenomenon.
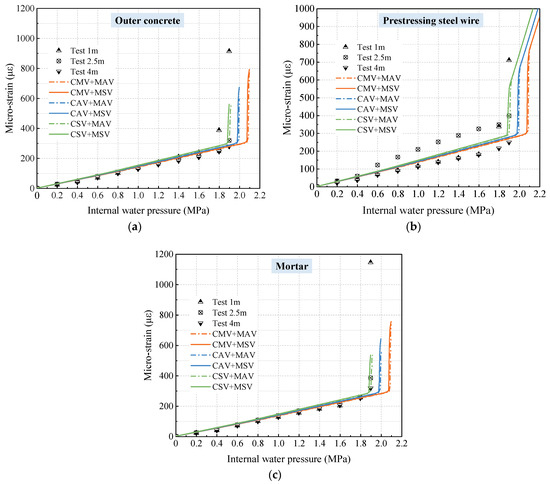
Figure 16.
Comparison of FEM simulation to test results: (a) outer concrete; (b) prestressed steel wire; (c) mortar.
4. Discussion of Analytical Results
4.1. Effect of the Strength Variations of Concrete and Mortar
Figure 17 shows the mechanical response of the concrete core under internal water pressure influenced by the strength variations of concrete and mortar. The red horizontal line represents the strain corresponding to the theoretical decompression pressure. With the axial compressive strength of concrete increased from 32.4 to 46.8 MPa, the decompression pressure increases by 13.7~14.3% and 13.6~14.4%, respectively, for the inner and outer concrete cores. However, the decompression pressure of the concrete core only increases by a maximum of 1.6% with the increasing compressive strength of the mortar. This indicates that the compressive strength of concrete has a dominant effect.
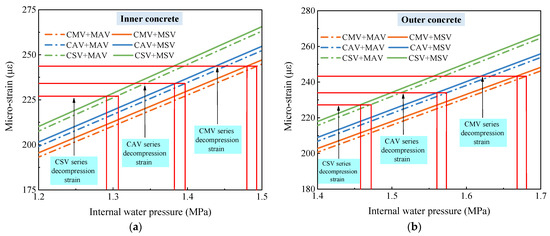
Figure 17.
Influence of the compressive strength of concrete and mortar on the deformation of the concrete core: (a) inner concrete; (b) outer concrete.
The cracking pressure of the concrete core influenced by the strength variations of concrete and mortar is shown in Figure 18. The red horizontal line expresses the cracking strain. The cracking pressure of the concrete core increases from 1.90 to 2.08 MPa with the concrete strength. This is attributed to the increase in the tensile strength of concrete, which is very significant to the safe operation of the pipeline.
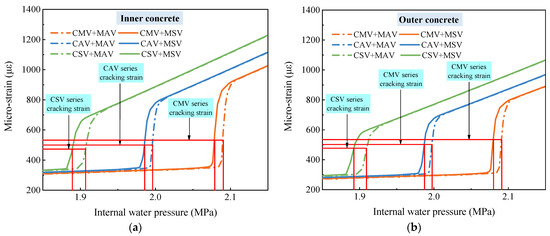
Figure 18.
Influence of the compressive strength of concrete and mortar on the cracking pressure of the concrete core: (a) inner concrete; (b) outer concrete.
The effect of the strength variations of concrete on the mechanical response of steel cylinder and prestressed steel wire is shown in Figure 19. With the tensile strength of concrete increased from 2.64 to 3.80 MPa, the internal water pressure at the yield of the steel cylinder increases from 2.35 to 2.43 MPa, and that at the yield of the prestressed steel wire increases from 2.30 to 2.38 MPa. Moreover, the tensile stress of the prestressed steel wire in the CSV and CAV series fully reaches the ultimate strength under the internal water pressure of 2.7 MPa, while that in the CMV series only reaches the ultimate strength at the top and bottom of the PCCP. This indicates that the increase in concrete tensile strength can reduce the stress level of prestressed steel wire under working conditions.
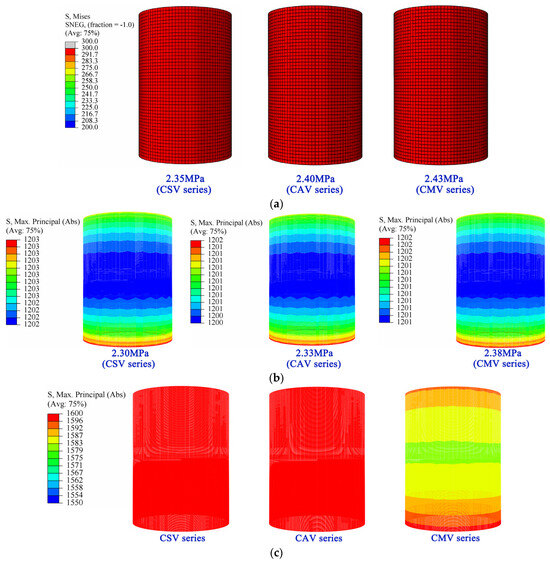
Figure 19.
Effect of the variation in concrete strength on the tensile stress of steel cylinder and prestressed steel wire (Unit: MPa): (a) yield of steel cylinder; (b) yield of prestressed steel wire; (c) tensile stress of prestressed steel wire under internal pressure of 2.7 MPa.
In summary, the decompression pressure of the concrete core can increase by increasing the compressive strength of concrete. The cracking of the concrete core and the yielding of the steel cylinder can be delayed, while the stress level of the prestressed steel wire can be reduced by improving the tensile strength of concrete. Concrete rather than mortar has priority in the measures to improve the structural performance of the PCCP. However, the protection to prestressed steel wires can be ensured by improving the crack resistance and impermeability of the protective mortar.
4.2. Cracking Priority of the Concrete Core
The strain simulation results of the concrete core at the mutation point are shown in Figure 20. The strain of the inner concrete core was higher than that of the outer concrete core, which is consistent with the monitoring results reported [18,20]. Furthermore, the comparison of tensile stress changes of the inner and outer concrete cores at the mutation point are shown in Figure 21. For the series of CSV, CAV, and CMV, the falling of the tensile stress curve of the inner concrete core is prior to that of the outer concrete core. This is consistent to the previous test that a longitudinal crack was found on the inner concrete core before the strain of the outer concrete core suddenly changed [16]. Therefore, the strain mutation of the outer concrete core may be attributed to the cracking of the inner concrete core. Additionally, the crack location is affected by the concrete pouring process and the circumferential crack location on the inner core.
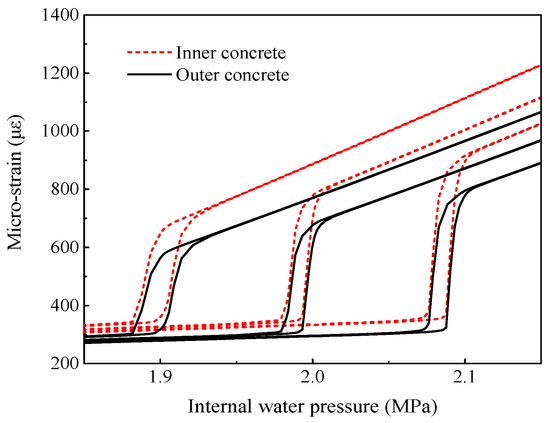
Figure 20.
Variation of concrete strain before and after mutation.
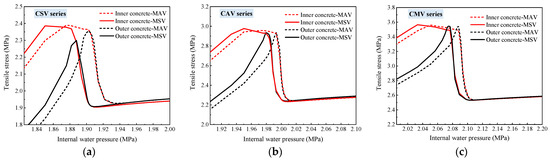
Figure 21.
Variation of concrete circumferential tensile stress before and after mutation: (a) CSV series; (b) CAV series; (c) CMV series.
4.3. Mechanical Response of Steel Cylinder and Prestressed Steel Wire after Concrete Cracking
The residual stress of the concrete core is not normally considered after cracking. In this study, the mechanical response of the steel cylinder and prestressed steel wire after concrete cracking is simulated using FEM, as shown in Figure 22. With the increase in internal water pressure, the steel cylinder first reaches the design strength, and it subsequently reaches the yield strength after the yield of prestressed steel wire. However, before the fracture of prestressed steel wires, the yielded prestressed steel wire still provides a “hoop effect” on the steel cylinder that gradually decreases with the increase in internal water pressure. This indicates that an excessive free deformation cannot take place in the steel cylinder before the fracture of the prestressed steel wire. Therefore, the PCCP may burst at any time after the prestressed steel wire breaks since the cracked concrete is not able to restrain the free deformation of the steel cylinder.
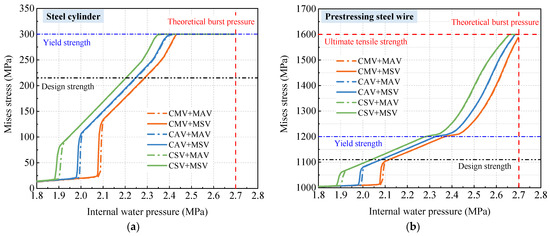
Figure 22.
Strains variations of the steel cylinder and the prestressed steel wire after the concrete cracking: (a) steel cylinder; (b) prestressed steel wire.
4.4. Bearing Capacity of the PCCP
The designed and simulation values of the decompression pressure P0 as well as the cracking pressure of the concrete or mortar of the CSV, CAV, and CMV models are listed in Table 14. The designed cracking pressure is calculated as follows [2].
Table 14.
Comparison of the values obtained from theoretical design and numerical simulation.
It can be seen from Table 14 that the same design value of P0 for a PCCP model does not reflect the influence of the inner or outer concrete core, while the same design value of Pt does not differentiate the influence of the cracking of concrete or mortar. The simulation result shows that P0 is corresponds more to the decompression of the outer concrete core, while Pt is not influenced by the cracking of the concrete or mortar. Pt of the concrete core increases by 10.6% with the increase in concrete tensile strength. For the CAV model, the values of P0 and Pt are 11% and 4.2% higher than the test values. This is attributed to the use of a homogeneous material model in the FEM without congenital defects. The Pt value of the CSV group is closer to the test. The CAV and CMV models may overestimate the bearing capacity of the PCCP under internal water pressure. Therefore, the lower limit strength of concrete should be adopted for the numerical simulation using the FEM.
The tensile stress of the PCCP is mainly caused by the steel cylinder and the prestressed steel wire after cracking of the concrete core. The PCCP will access the ultimate limit state when the tensile stresses of the steel cylinder and the prestressed steel wire reach the design strength. The simulation results of the CSV group show that the PCCP reaches the ultimate bearing capacity under an internal water pressure of 2.2 MPa, and it bursts under an internal water pressure over 2.7 MPa.
Based on the FEM simulation results, the cracking pressure is 4.7 times the working pressure for the PCCP designed using CECS 140. The concrete core undergoes irreversible damage to access the serviceability limit state. When the internal water pressure is 5.5 times the working pressure, the PCCP reaches the ultimate limit state. Finally, the PCCP will be damaged under an internal water pressure that is more than 6.75 times the working pressure. In summary, the PCCP designed using the simplified limit-state design process is sufficient in safety for actual operation.
5. Conclusions
(1) Using the design conditions in this study, the simplified limit-state design process gives about a 10% higher cross-sectional area of the prestressed steel wire than using AWWA C304. This ensures the operation safety of PCCPs using a simplified calculation with no dependence on specialist design software.
(2) The finite element model not only accurately simulates the bearing behavior of PCCPs in the linear phase of materials but also achieves the expected aim regarding the abrupt point. The parametric simulation results show that the decompression pressure of the concrete core increases with the compressive strength of concrete, while the bearing resistance to internal water pressure increases with the tensile strength of concrete.
(3) The PCCP designed using the simplified limit-state design process can be respectively subject to 4.7 and 5.5 times the working pressure at the serviceability and the ultimate limit state. The PCCP will burst under an internal water pressure greater than 6.75 times the working pressure.
(4) The simulation of a finite element model makes up for the deficiency of the prototype test of the PCCP, which exhibits a complete mechanical response of the structural constituents of PCCPs under internal water pressure. This assists with comprehensively understanding the bearing performance of PCCPs.
(5) Because only case studies are carried out in this study, further verification should be conducted to ensure the rationality of the simplified limit-state design process. Moreover, improving the crack resistance and impermeability of protective mortar and increasing the tensile strength of concrete need to achieve enough attention in the design process.
Author Contributions
Conceptualization and methodology, S.Z. and F.Q.; validation and formal analysis, P.S. and Y.G.; investigation and data curation, T.Y., J.W. and P.S.; writing—original draft preparation, P.S.; writing—review and editing, F.Q. and Y.G.; supervision, S.Z.; funding acquisition, P.S., J.W. and F.Q. All authors have read and agreed to the published version of the manuscript.
Funding
This research was funded by the Doctoral Innovation Foundation of North China University of Water Resources and Electric Power, grant number HSZ2022-196 and the National Key Engineering Project of Pipe Procurement for Yangtze River to Huaihe River (Henan section), grant number FCGY/JC2020/001.
Data Availability Statement
Data are available from the first author and can be shared with anyone upon reasonable request.
Conflicts of Interest
Author Jun Wang was employed by the company Henan Fuchen Pipe Co., Ltd. Author Yunsheng Geng was employed by the company Hebei Water Resources Planning, Design and Research Co., Ltd. The remaining authors declare that the research was conducted in the absence of any commercial or financial relationships that could be construed as a potential conflict of interest.
Notations
| σ | Stress of material, MPa |
| σc | Uniaxial compression stress of concrete, MPa |
| σic | Initial prestress of concrete core, MPa |
| σfc | Final prestress of concrete core, MPa |
| σcon | Control stress for tensioning of steel wires, MPa |
| σ′con | Prestress after considering prestress loss caused by elastic compression of concrete, MPa |
| σ1 | Prestressing loss caused by elastic compression of concrete, MPa |
| σ2 | Prestressing loss caused by creep and shrinkage of concrete, MPa |
| σ3 | Prestressing loss caused by stress relaxation of steel wire, MPa |
| σpe | Effective prestress after deducting prestress loss, MPa |
| σis | Initial prestress of steel wire, MPa |
| σfs | Final prestress of steel wire, MPa |
| max | Maximum effective principal stress, MPa |
| ε | Strain corresponding to the stress |
| εc | Strain under compression |
| εce | Elastic limit strain corresponding to the design tensile strength of concrete core, με |
| εme | Elastic limit strain corresponding to the design tensile strength of concrete core, με |
| εc0 | Precompression strain of concrete core, με |
| εt | Strain under tension |
| εct | Control strain of concrete core, με |
| εwt | Control strain of steel wire, με |
| εmt | Control strain of mortar, με |
| Equivalent plastic strain of concrete under tension | |
| Equivalent plastic strain of concrete under compression | |
| fs | Design tensile strength of steel wire, MPa |
| fsy | Yield tensile strength of steel wire, MPa |
| fsu | Ultimate tensile strength of steel wire, MPa |
| fy | Design tensile strength of steel cylinder, MPa |
| fyy | Yield tensile strength of steel cylinder, MPa |
| fyu | Ultimate tensile strength of steel cylinder, MPa |
| f′cu | Cubic compression strength of concrete core at wire wrapping, MPa |
| ftk | Standard value of tensile strength, MPa |
| fct | Design tensile strength of concrete core, MPa |
| fcu,k | Standard cubic compression strength of concrete core, MPa |
| fcu,m | Mean cubic compression strength of concrete core, MPa |
| fcu,max | Maximum cubic compression strength of concrete core, MPa |
| fmt | Design tensile strength of mortar, MPa |
| P0 | Decompression pressure, MPa |
| Pb | Brust pressure, MPa |
| Ac | Area of concrete core, mm2 |
| Ay | Area of steel cylinder, mm2 |
| As | Area of prestressed steel wire, mm2/m |
| An | Converted sectional area of the PCCP, mm2/m |
| E0 | Initial elastic stiffness, MPa |
| Ec | Elastic modulus of concrete, MPa |
| Es | Elastic modulus of steel wire, MPa |
| Ey | Elastic modulus of steel cylinder, MPa |
| Fsk | Vertical earth pressure, kN/m |
| Fep | Horizontal earth pressure, kN/m |
| We | External dead load, kN/m |
| Wt | Transient load, kN/m |
| Ws | Additional load, kN/m2 |
| q | Vehicle live load, kN/m2 |
| G1k | Pipe weight, kN/m |
| Gwk | Water weight, kN/m |
| M1cap | Moment of capacity at invert and crown |
| D0 | Inner diameter of the pipe, mm |
| D | Outer diameter of the pipe, mm |
| Dy | Outer diameter of the steel cylinder, mm |
| r0 | Calculation radius of the pipe wall section, mm |
| H | Underground burial depth, mm |
| sc | Design value of shrinkage coefficient |
| t0 | Time at wire crapping, d |
| t1 | Time at first water supply of pipe, d |
| t | Thickness of the concrete core including steel cylinder, mm |
| ty | Thickness of steel cylinder, mm |
| Δt | Controlled temperature, °C |
| ρ | Circumferential reinforcement ratio, % |
| λy | Comprehensive adjustment coefficient of design tensile strength of steel wire |
| ϕ | Influence coefficient of reinforcement |
| ϕc | Design value of creep coefficient |
| ϕt | Influence coefficient of the fabrication process of concrete core |
| ns | Elastic modulus ratio of steel wire to concrete core |
| ny | Elastic modulus ratio of steel cylinder to concrete core |
| ni | Elastic modulus ratio of steel wire to concrete core during wire winding |
| nr | Elastic modulus ratio of steel cylinder to concrete core during wire winding |
| n′i | Elastic modulus ratio of steel wire to concrete core after fabrication |
| n′r | Elastic modulus ratio of steel cylinder to concrete core after fabrication |
| R | Relaxation coefficient of steel wire when the wire is wrapped in a single layer |
| kvm | Moment coefficients resulting from the distribution of external load Fsk |
| khm | Moment coefficients resulting from the distribution of external load Fep |
| kwm | Moment coefficients resulting from the distribution of water weight Gwk |
| kgm | Moment coefficients resulting from the distribution of pipe weight G1k |
| Cmie | Moment coefficients resulting from the distribution of external load We or Wt (i = 1, 2) |
| Cmip | Moment coefficients resulting from the distribution of pipe weight G1k (i = 1, 2) |
| Cmif | Moment coefficients resulting from the distribution of water weight Gwk (i = 1, 2) |
| Cnie | Thrust coefficients resulting from the distribution of external load We or Wt (i = 1, 2) |
| Cnip | Thrust coefficients resulting from the distribution of pipe weight G1k (i = 1, 2) |
| Cnif | Thrust coefficients resulting from the distribution of water weight Gwk (i = 1, 2) |
| Cc | Pipeline load factor |
| dc | Compression damage evolution parameter for concrete |
| d′t | Damage parameters of concrete under tension |
| d′c | Damage parameters of concrete under compression |
| K | Ratio of active lateral to vertical unit pressure |
| Kc | Constant stress ratio |
| μ | Internal friction coefficient of soil |
| γs | Standard value of the unit weight of backfill, kg/m3 |
| He | Height of the settlement surface above the pipe top |
| Mises equivalent stress | |
| Effective stress hydrostatic pressure | |
| α | Dimensionless material coefficient |
| αt | Expansion coefficient of prestressed steel wire |
| γ0 | Safety coefficient of PCCP |
References
- ANSI/AWWA C304–2014; AWWA Standard for Design of Prestressed Concrete Pressure Pipe. American National Standards Institute, American Water Works Association: Denver, CO, USA, 2014.
- GB/T 19685-2017; Prestressed Concrete Cylinder Pipe. China Standards Press: Beijing, China, 2017.
- Ball, R.T.; Moore, W.G.; Smith, D.L.; Stubblefield, N.D.; Wahlquist, R.W. Prestressed concrete cylinder pipe rehabilitation, repair, and replacement: Large diameter success stories. Florida Water. Resour. J. 2012, 6, 4–10. [Google Scholar]
- Dong, X.; Dou, T.; Zhao, L.; Cheng, B.; Liu, J. An overview on safety assessment of pre-stressed concrete cylinder pipe (PCCP). Water. Resour. Hydr. Eng. 2020, 51, 72–80. [Google Scholar]
- ANSI/AWWA C301–1984; AWWA Standard for Prestressed Concrete Pressure Pipe, Steel Cylinder Type, for Water and Other Liquids. American Water Works Association: Denver, CO, USA, 1984.
- Zarghamee, M.S.; Heger, F.J.; Dana, W.R. Experimental evaluation of design methods for prestressed concrete pipe. J. Transp. Eng. ASCE 1988, 114, 635–655. [Google Scholar] [CrossRef]
- Zarghamee, M.S.; Fok, K.L. Analysis of prestressed concrete pipe under combined loads. J. Struct. Eng. 1990, 116, 2022–2039. [Google Scholar] [CrossRef]
- Heger, F.J.; Zarghamee, M.S.; Dana, W.R. Limit-states design of prestressed concrete pipe. I: Criteria. J. Struct. Eng. ASCE 1990, 116, 2083–2104. [Google Scholar] [CrossRef]
- Zarghamee, M.S.; Fok, K.L.; Sikiotis, E.S. Limit-states design of prestressed concrete pipe. II: Procedure. J. Struct. Eng. ASCE 1990, 116, 2105–2126. [Google Scholar] [CrossRef]
- Shang, P.; Zhang, D.; Wang, H.; Zheng, W.; Qu, F.; Zhao, S. Experimental study on external loading performance of large diameter prestressed concrete cylinder pipe. Buildings 2022, 12, 1740. [Google Scholar] [CrossRef]
- Roller, J.J.; Lotfi, H.R. Proposed Simplified Changes to ANSI/AWWA C304 Standard for Design of Prestressed Concrete Cylinder Pipe. In Proceedings of the Pipelines 2015: Recent Advances in Underground Pipeline Engineering and Construction—Pipeline Division Specialty Conference, ASCE, Baltimore, MD, USA, 23–26 August 2015; pp. 674–685. [Google Scholar]
- Ge, S.; Sinha, S. Failure analysis, condition assessment technologies, and performance prediction of prestressed-concrete cylinder pipe: State-of-the-art literature review. J. Perform. Constr. Facil. 2012, 28, 618–628. [Google Scholar] [CrossRef]
- Zarghamee, M.S.; Eggers, D.W.; Ojdrovic, R.; Rose, B. Risk analysis of prestressed concrete cylinder pipe with broken wires. In Proceedings of the Pipelines 2003: New Pipeline Technologies, Security, and Safety—Pipeline Division Specialty Conference, ASCE, Baltimore, MD, USA, 13–16 July 2003; pp. 599–609. [Google Scholar]
- Zarghamee, M.S. Hydrostatic pressure testing of prestressed concrete cylinder pipe with broken wires. In Proceedings of the Pipelines 2003: New Pipeline Technologies, Security, and Safety—Pipeline Division Specialty Conference, ASCE, Baltimore, MD, USA, 13–16 July 2003; pp. 294–303. [Google Scholar]
- Hu, S.; Shen, J.; Liu, X.; Wang, D. Study on bearing capacity test of internal water pressure of super-caliber PCCP. Adv. Sci. Technol. Water. Res. 2009, 29, 9–12. [Google Scholar]
- Qu, F.; Zhang, D.; Shang, P.; Wang, H.; Zheng, W.; Zhao, S. Full-scale test and bearing capacity evaluation of large diameter prestressed concrete cylinder pipe under internal water pressure. Buildings 2022, 12, 1791. [Google Scholar] [CrossRef]
- Dou, T.; Cheng, B.; Hu, H.; Xia, S.; Yang, J.; Zhang, Q. The prototype test study of prestressed concrete cylinder pipe structure deformation law I: The internal pressure. J. Hydraul. Eng. 2017, 48, 1438–1446. [Google Scholar]
- Cheng, B.; Dou, T.; Xia, S.; Zhao, L.; Yang, J.; Zhang, Q. Mechanical properties and loading response of prestressed concrete cylinder pipes under internal water pressure. Eng. Struct. 2020, 216, 110674. [Google Scholar] [CrossRef]
- Tan, X.; Abu-Obeidah, A.; Bao, Y.; Nassif, H.; Nasreddine, W. Measurement and visualization of strains and cracks in CFRP post-tensioned fiber reinforced concrete beams using distributed fiber optic sensors. Automat. Constr. 2021, 124, 103604. [Google Scholar] [CrossRef]
- Li, K.; Li, Y.; Dong, P.; Wang, Z.; Dou, T.; Ning, J.; Dong, X.; Si, Z. Pressure test of a prestressed concrete cylinder pipe using distributed fiber optic sensors: Instrumentation and results. Eng. Struct. 2022, 270, 114835. [Google Scholar] [CrossRef]
- Zarghamee, M.S.; Eggers, D.W.; Ojdrovic, R.P. Finite-Element Modeling of Failure of PCCP with Broken Wires Subjected to Combined Loads. In Proceedings of the Pipeline Division Specialty Conference 2002: Beneath Our Feet: Challenges and Solutions, ASCE, Cleveland, OH, USA, 4–7 August 2002; pp. 1–17. [Google Scholar]
- Ge, S.; Sinha, S. Effect of wire breaks on Prestressed Concrete Cylinder Pipe (PCCP) reinforced with steel liners—A case study. In Proceedings of the Pipelines 2012: Innovations in Design, Construction, Operations, and Maintenance, Doing More with Less—Pipeline Conference, Miami Beach, FL, USA, 19–22 August 2012; pp. 1297–1306. [Google Scholar]
- Ge, S.; Sinha, S. Effect of mortar coating′s bond quality on the structural integrity of prestressed concrete cylinder pipe with broken wires. J. Mater. Res. 2015, 4, 59–75. [Google Scholar] [CrossRef]
- Hu, B.; Fang, H.; Wang, F.; Zhai, K. Full-scale test and numerical simulation study on load-carrying capacity of prestressed concrete cylinder pipe (PCCP) with broken wires under internal water pressure. Eng. Fail. Anal. 2019, 104, 513–530. [Google Scholar] [CrossRef]
- Li, K.; Li, Y.; Dong, P.; Wang, Z.; Dou, T.; Ning, J.; Dong, X.; Si, Z.; Wang, J. Mechanical properties of prestressed concrete cylinder pipe with broken wires using distributed fiber optic sensors. Eng. Fail. Anal. 2022, 141, 106635. [Google Scholar] [CrossRef]
- Zhai, K.; Wang, F.; Fang, H.; Ni, P.; Ji, X.; Guo, C.; Hu, S. Serviceability assessment of prestressed concrete cylinder pipes with broken wires: Analytical solution and numerical simulation. Tunn. Undergr. Space. Technol. 2022, 126, 104551. [Google Scholar] [CrossRef]
- Dong, X.; Dou, T.; Cheng, B.; Zhao, L. Failure analysis of a prestressed concrete cylinder pipe under clustered broken wires by FEM. Structures 2021, 33, 3284–3297. [Google Scholar] [CrossRef]
- Dong, X.; Dou, T.; Dong, P.; Su, Y.; Li, Y.; Ning, J.; Wei, J.; Li, K.; Cheng, B. Experimental study on the influence of scattered broken wires on the structural performance of prestressed concrete cylinder pipe. Structures 2023, 47, 52–62. [Google Scholar] [CrossRef]
- Shang, P.; Liu, G.; Wang, J.; Fu, Q.; Pei, S.; Zhao, S. Quality control of PCCP concrete core production based on Analytic Hierarchy Process. J. North. China. Univ. Water. Res. Elec. Power Nat. Sci. Ed. 2022, 43, 31–38. [Google Scholar]
- CECS 140-2011; Specification for Structural Design of Buried Prestressed Concrete Pipeline and Prestressed Concrete Cylinder Pipeline of Water Supply and Sewerage Engineering. China Planning Press: Beijing, China, 2011.
- GB 50332-2002; Structural Design Code for Pipelines of Water Supply and Waste Water Engineering. China Architecture Press: Beijing, China, 2002.
- Kennison, H.F. Tests on Prestressed Concrete Embedded Cylinder Pipe. J. Hyd. Division 1960, 86, 77–98. [Google Scholar] [CrossRef]
- AWWA M9; Concrete Pressure Pipe. American Water Works Association: Denver, CO, USA, 2008.
- Hu, S.; Sun, Y.; Xue, X.; Huang, Y. Calculation model for bar-wrapping during prestressing of an embedded bar-wrapped cylinder concrete pressure pipe. Thin-Walled Struct. 2019, 139, 39–45. [Google Scholar] [CrossRef]
- Zarghamee, M.S.; Dana, W.R. A Step-by-step integration procedure for computing state of stress in prestressed concrete pipe. In Computer Analysis of the Effects of Creep, Shrinkage, and Temperature Changes on Concrete Structures; American Concrete Institute: Indianapolis, IN, USA, 1991; pp. 155–170. [Google Scholar]
- Zarghamee, M.S.; Heger, F.J.; Dana, W.R. Predicting Prestress Losses in Prestressed Concrete Pressure Pipe. In Concrete Int’l.: Design and Construction; American Concrete Institute: Indianapolis, IN, USA, 1988; Volume 10, pp. 59–64. [Google Scholar]
- ACI 209.2R-2008; Guide for Modeling and Calculating Shrinkage and Creep in Hardened Concrete. American Concrete Institute: Farmington Hills, MI, USA, 2008.
- GB 50010-2010 (version 2015); Code for Design of Concrete Structures. China Architecture Press: Beijing, China, 2015.
- GB 50017-2017; Standard for Design of Steel Structures. China Architecture Press: Beijing, China, 2017.
- SL/T 352-2020; Test Code for Hydraulic Concrete. China Water Resources and Hydropower Press: Beijing, China, 2020.
- ASTM A648-2018; Standard Specification for Steel Wire, Hard-Drawn for Prestressed Concrete Pipe. American Society of Testing Materials: West Conshohocken, PA, USA, 2018.
- GB/T 228.1-2010; Metallic Materials—Tensile Testing—Part 1: Method of Test at Room Temperature. China Standards Press: Beijing, China, 2010.
- GB/T 5223-2014; Steel Wire for Prestressing of Concrete. China Standards Press: Beijing, China, 2014.
- Zhao, S. Design Principle of Concrete Structure, 2nd ed.; Tongji University Press: Shanghai, China, 2013. [Google Scholar]
- Dassault Systèmes. Documentation-ABAQUS Analysis User′s Manual; Dassault Systèmes: Vélizy-Villacoublay, France, 2019. [Google Scholar]
- Zhao, X. Investigation of cracks and broken wires impact on structural safety performance of PCCP. Master′s Thesis, China Institute of Water Resources and Hydropower Research, Beijing, China, 2013. [Google Scholar]
- Lee, J.; Gregory, L.F. Plastic-damage model for cyclic loading of concrete structures. J. Eng. Mech. 1998, 124, 892–900. [Google Scholar] [CrossRef]


Disclaimer/Publisher’s Note: The statements, opinions and data contained in all publications are solely those of the individual author(s) and contributor(s) and not of MDPI and/or the editor(s). MDPI and/or the editor(s) disclaim responsibility for any injury to people or property resulting from any ideas, methods, instructions or products referred to in the content. |
© 2023 by the authors. Licensee MDPI, Basel, Switzerland. This article is an open access article distributed under the terms and conditions of the Creative Commons Attribution (CC BY) license (https://creativecommons.org/licenses/by/4.0/).