Article

Time Reversal Method for Lamb−Wave−Based Diagnostics of Multiple−Sleeve Grouting Connections

1
College of Civil Engineering, Fuzhou University, Fuzhou 350108, China
2
Haixia Construction Group Co., Ltd., Fuzhou 350001, China
3
Zhongjian Litian Group Co., Ltd., Fuzhou 350001, China
4
Zhongsheng Huaxin Group Co., Ltd., Fuzhou 350001, China
*
Author to whom correspondence should be addressed.
Buildings 2023, 13(11), 2824; https://doi.org/10.3390/buildings13112824
Submission received: 8 August 2023 / Revised: 18 October 2023 / Accepted: 25 October 2023 / Published: 10 November 2023
(This article belongs to the Section Building Structures)

Abstract

:
The grouting quality of the grouting sleeve connector is crucial for ensuring the stability of prefabricated building components. In practical engineering, the grouting sleeve is often arranged with multiple sleeves, and there is no feasible nondestructive testing method for testing the complex arrangement of the sleeve grouting joints in the embedded state. Building upon the feasibility of nondestructive detection of single socket grouting connectors, this study discusses the feasibility of defect detection and the severity of defects. Simulation results are used to investigate the choice of the best excitation signal. For different simulated damage cases, it is proven that the selected damage index can be very sensitive, and both the location and the extent of the damage can be detected successfully. The results demonstrate that with the section injury rate ranging from 10% to 40%, the reverse focus peak decreased from 20% to 60% compared to no injury. The effectiveness of the Lamb−wave−based time reversal method in detecting the internal grouting defects of multiple grouting sleeve joints is proven. This paper focuses on the detection study of the Lamb−wave−based time reversal method and proves its ability to perform the detection task effectively and accurately.

1. Introduction

Structural health monitoring is a rapidly advancing research area where various emerging technologies are utilized to transmit real−time structural data and analyze the health status of structures [1,2,3]. In the context of prefabricated building structures, grouting sleeve connection and grouting anchor connection are commonly used for connecting prefabricated components by engineers and researchers due to their reliability, seismic ability, and absence of height limitations [4,5]. Among these, the sleeve grouting connection is of particular importance and attention in both practical applications and experiments, as failures in this connection can lead to the destruction of the prefabricated building structure. Therefore, it is essential to focus on the structural health monitoring of sleeve grouting connections.
Current nondestructive testing technologies for grouting sleeves include impact echo, ray detection, embedded chip, and infrared thermal imaging methods, each with its limitations [6,7,8,9]. Although the impact echo method [10,11] has low cost and simple operation, its accuracy is insufficient. The ray detection method [12] can observe the defects intuitively. However, its test instrument is large (only suitable for laboratory observation) and large radiation to the surrounding personnel. The embedded chip method [13] is accurate, but it needs to embed sensors in the grouting sleeve before detection, which leads to high detection costs. The infrared thermal imaging method [14] can accurately determine the position and size of the defect; however, it needs to heat the test specimen, which is prone to the influence of external temperature in actual engineering use. Therefore, it is urgent to have simple, economical, and accurate methods applicable to detect the internal defects of grouting sleeves in practical engineering. To address these challenges, researchers have explored the use of ultrasonic guided waves, specifically Lamb waves, which offer advantages such as high accuracy, simplicity, low cost, and nondestructiveness [15,16]. Lamb waves have been applied in various practical engineering and experimental scenarios for damage identification and imaging. Xu X. and Jonas K.R. et al. used a phenomenon (the response signal propagation speed of Lamb waves from different types of injury areas is different) to propose an improved, fully focused imaging algorithm for different types of injury. This method can not only give the accurate injury location but also determine the injury types [17,18]. For the detection of a sleeve grouting connection, Hu Y. [19] arranged five defects with finite elements and used Lamb−wave−based time reversal technology to detect the sleeve grouting connection. The results proved that the detection of a single sleeve is feasible.
However, in practical engineering scenarios, multiple sleeves are commonly arranged in the assembly of beams, plates, columns, and other components, which can alter the structural boundaries and Lamb wave propagation characteristics. This paper aims to investigate whether the Lamb−wave−based time reversal method is suitable for practical engineering situations. To achieve this, this study will establish models of both embedded multi−arranged and single−arranged steel grouting sleeves and introduce typical defects for detecting the sleeves. The goal is to locate defects inside the sleeves and examine the effectiveness of the Lamb−wave−based time reversal method in detecting defects in semi−grouting sleeves. By exploring these aspects, this research aims to provide valuable insights into the applicability of Lamb wave detection technology in practical engineering settings.

2. Detection Principle of Lamb−Wave−Based Time Reversal Method

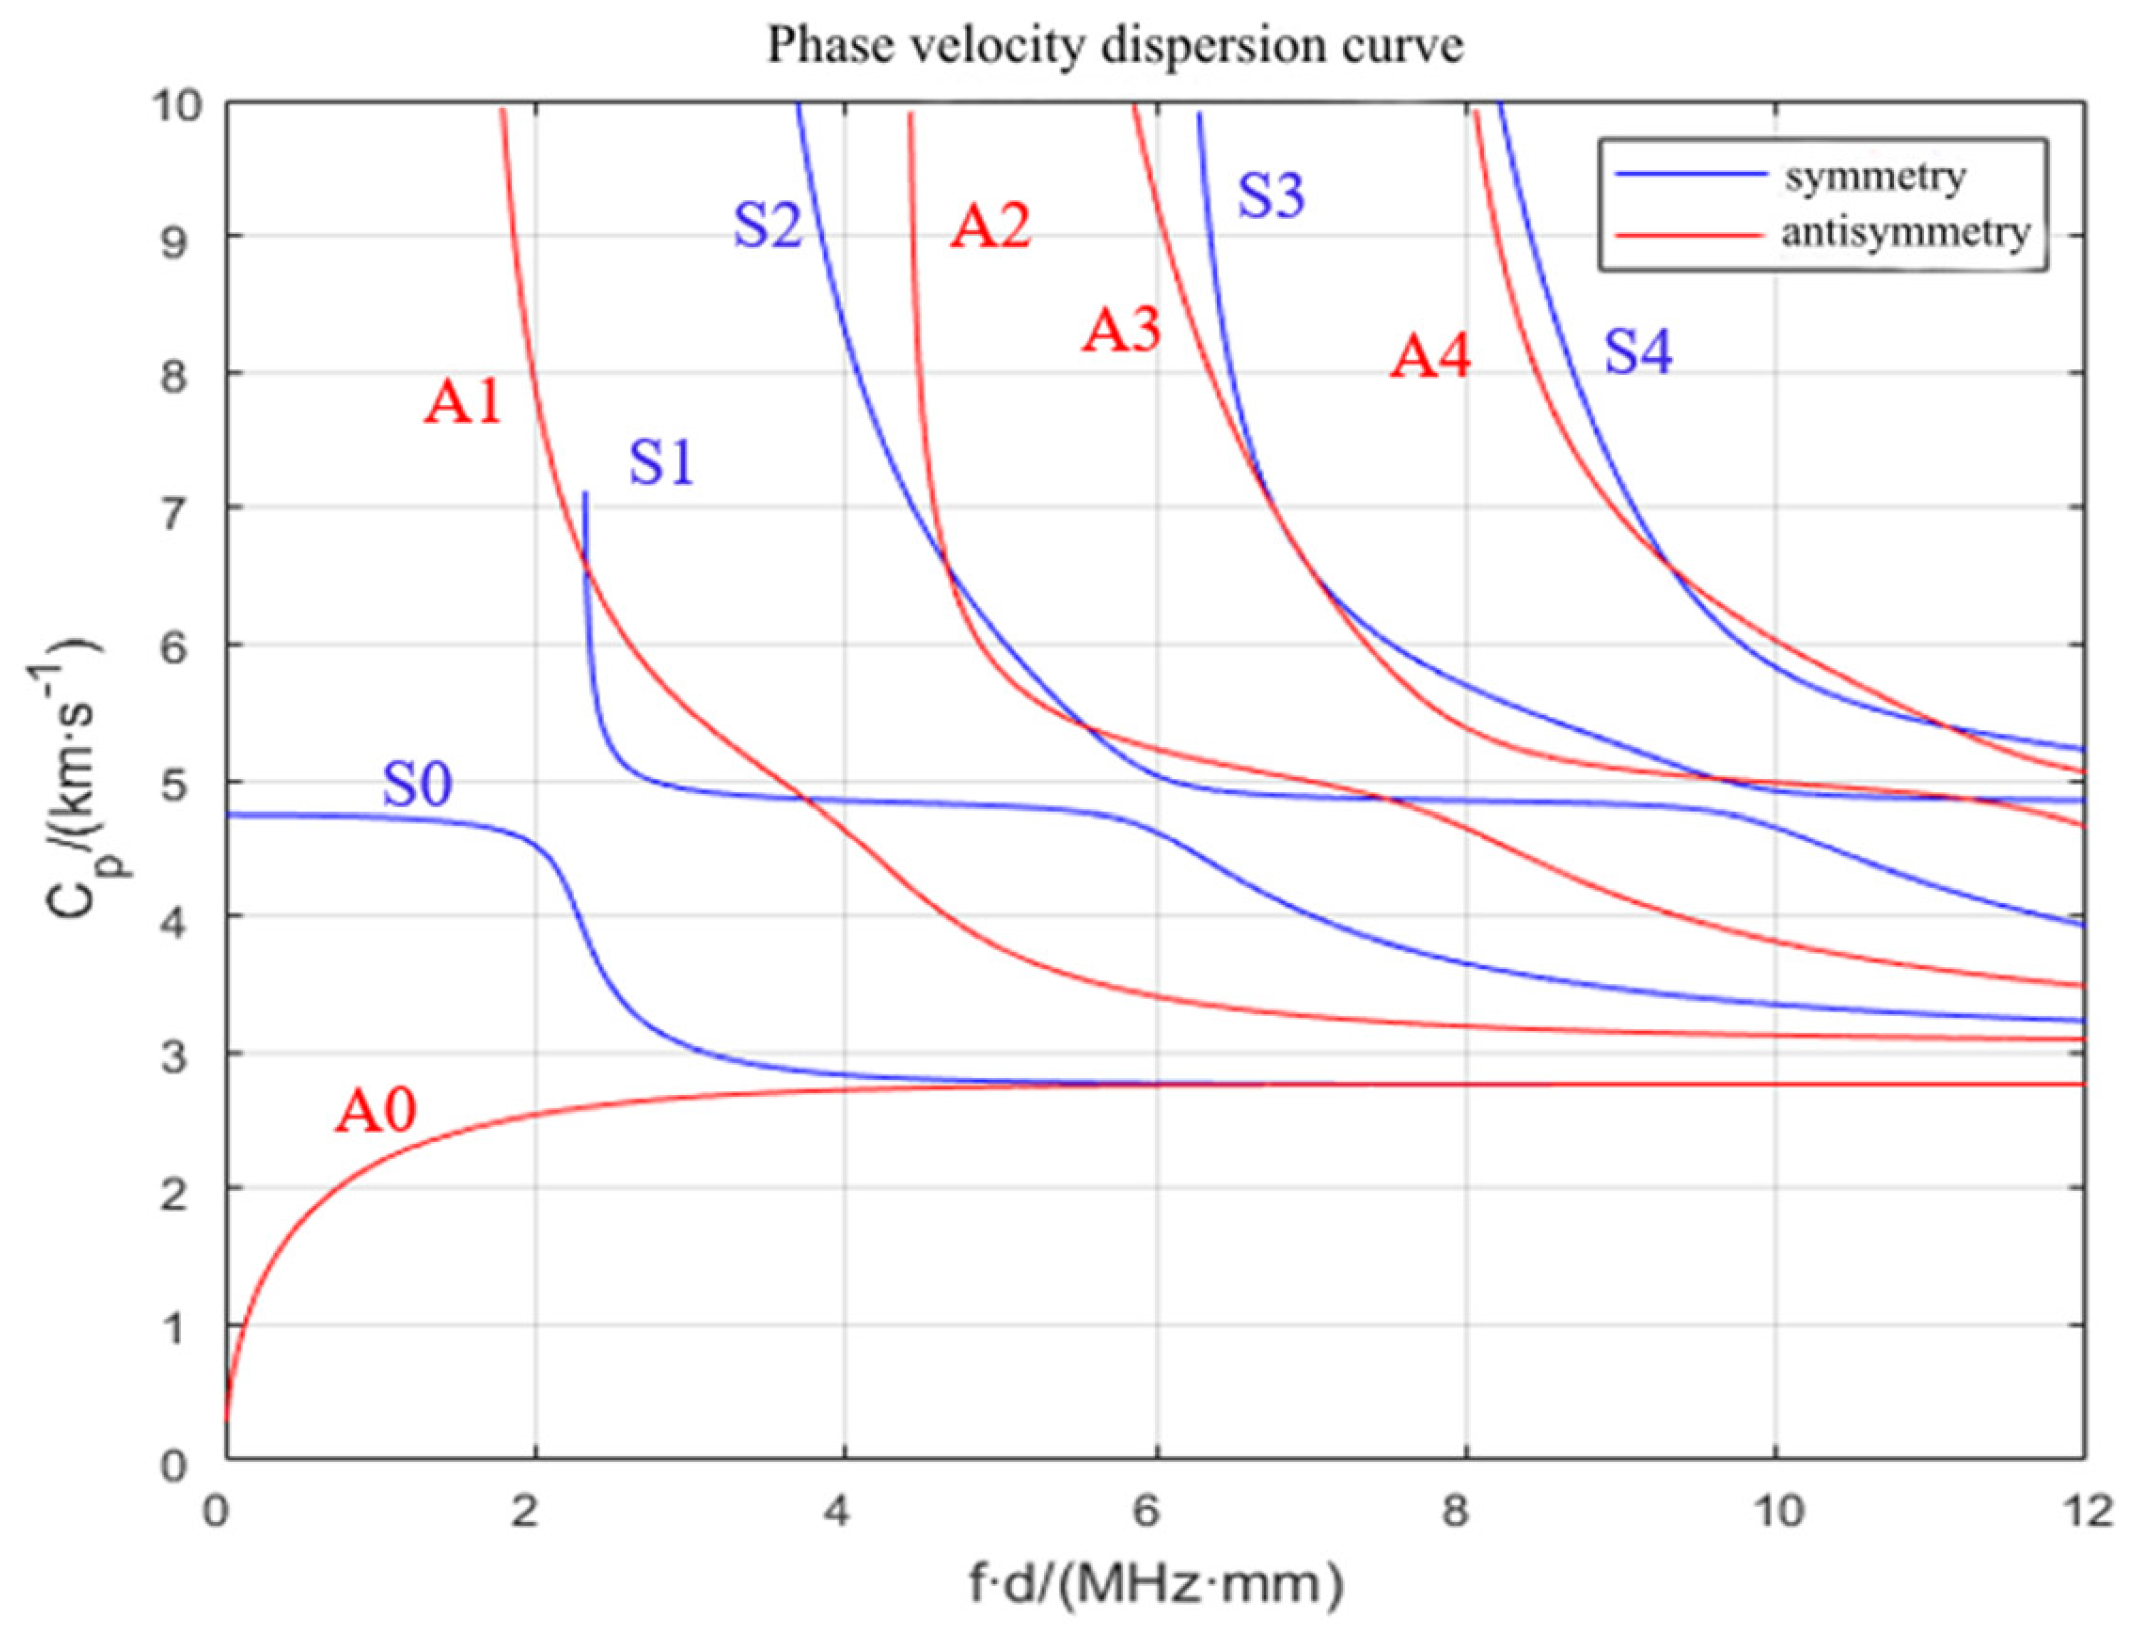
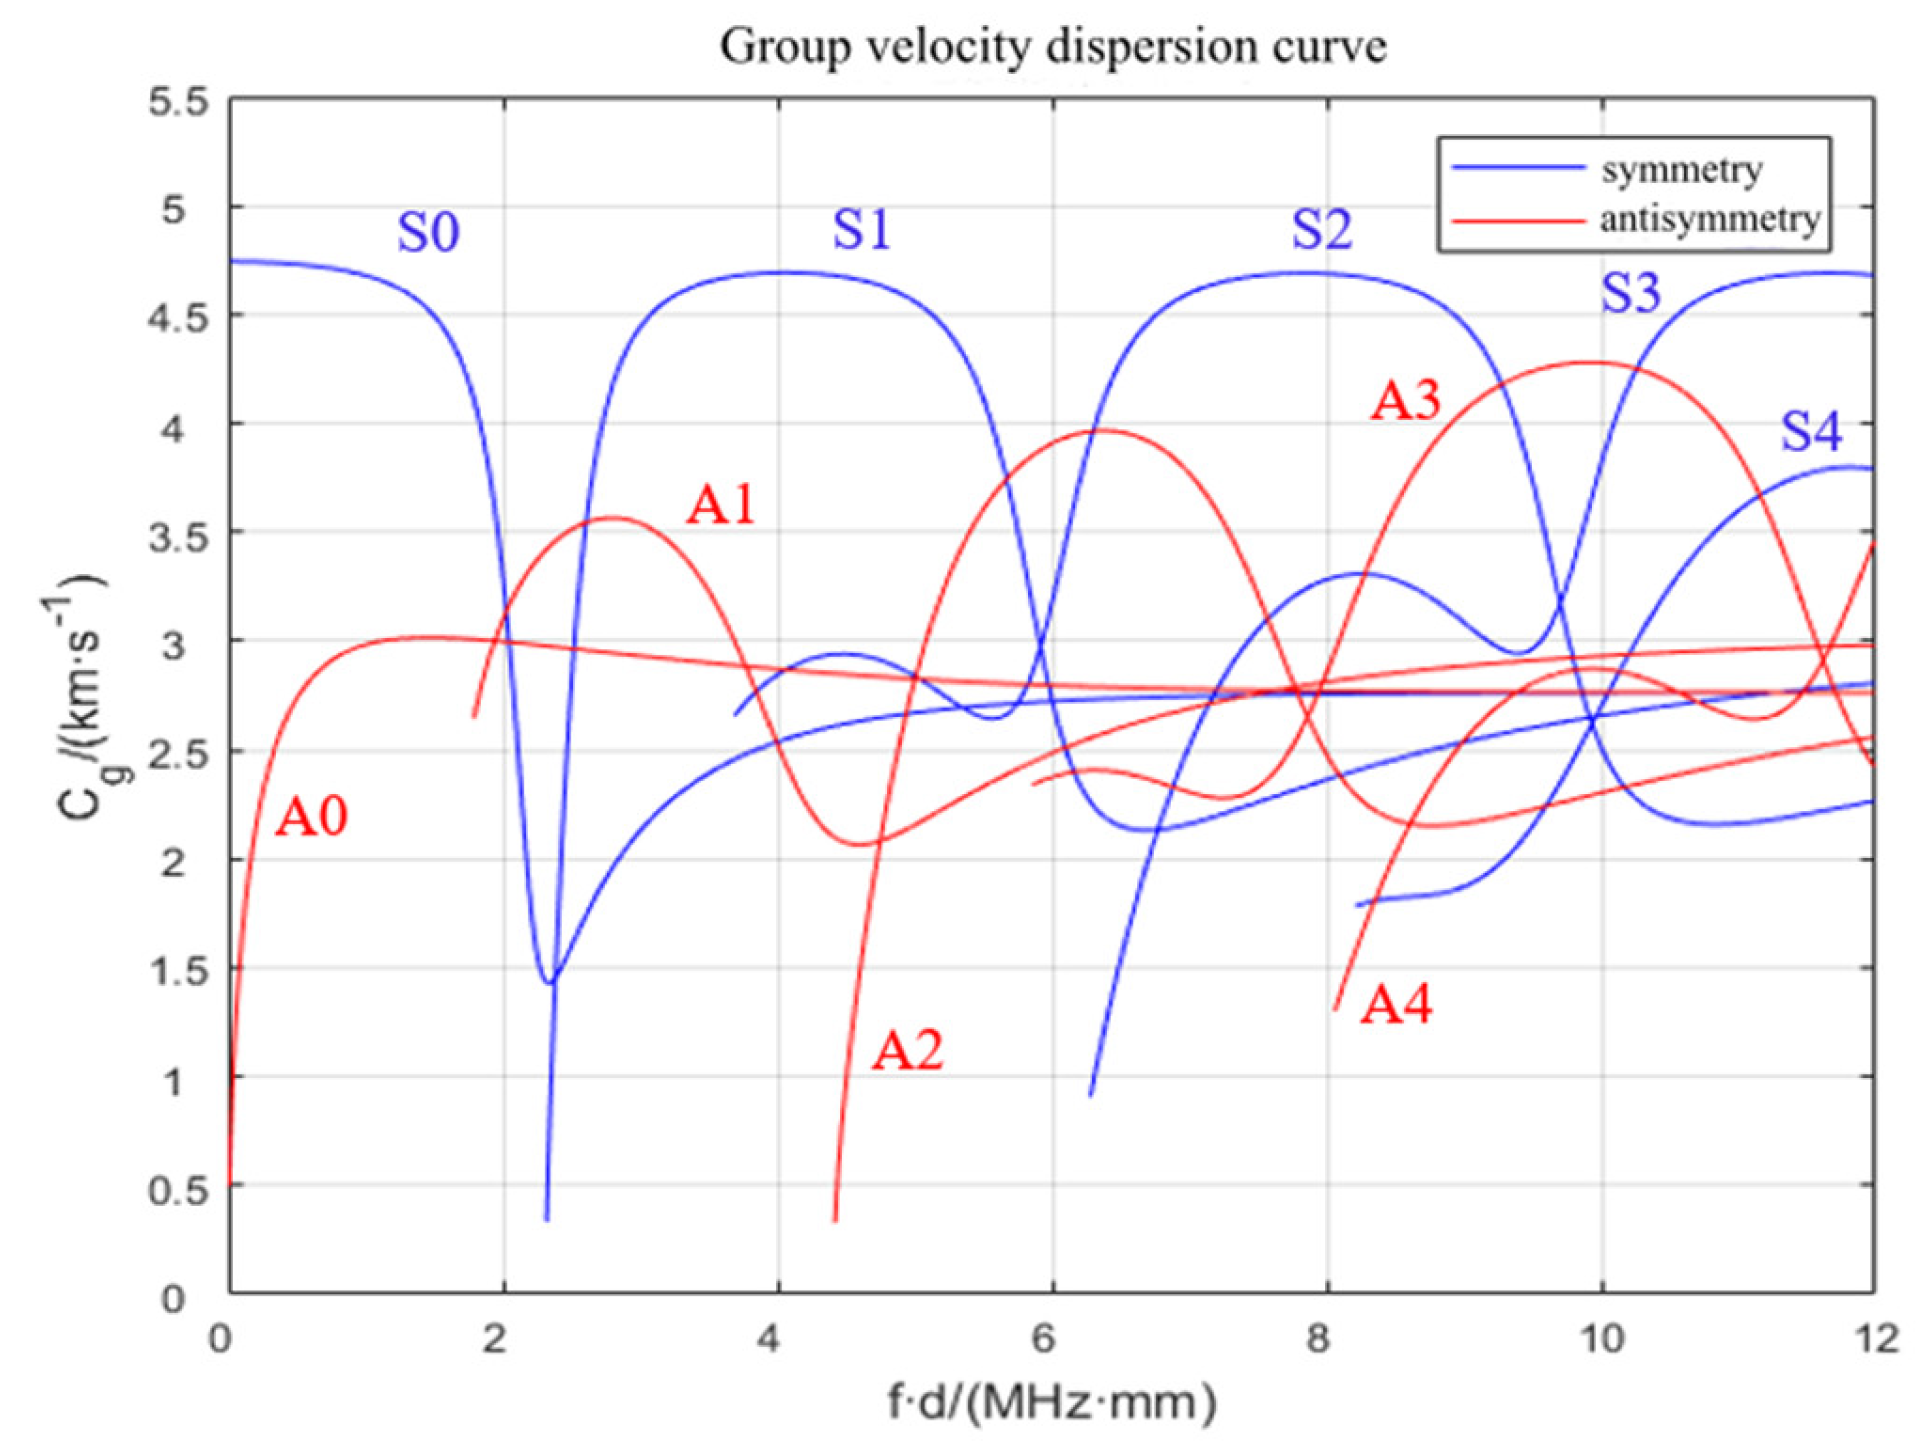
2.1. Basic Lamb Wave Theory

Lamb waves are a type of ultrasonic−guided plane stress wave that propagates in plate structures. When Lamb waves propagate in plate structures, they are influenced by the plate’s thickness and the interface constraints, leading to the generation of refracted and reflected waves in addition to longitudinal and transverse waves. These waves continuously undergo mode conversions and propagate steadily along the direction of the plate’s surface. The existence of Lamb waves was occasionally discovered by Horace Lamb during his study of sine waves in infinite plates [20].
In an infinite uniform isotropic medium, the vibration control equation for elastic waves is formed by combining the equation of motion, strain–displacement equation, and constitutive equation:
Equation of motion:
σ ji , j + f i = 0 ( or = ρ 2 u i t 2 )
Strain–displacement equation:
ε i j = 1 2 ( u i , j + u j , i )
Constitutive equations:
σ i j = λ ε k k δ i j + 2 μ i j
where σ represents positive stress, ε represents strain, i and j represent the two directions, respectively, and λ and μ, respectively, represent the Lamé constants of the material. The motion Equation (1) and the constitutive Equation (3) can jointly solve the Navier vibration control equation. In a uniform sheet of an isotropic thickness of 2 h, the vibration equation of the elastic wave can be recorded by the Karl tensor form as follows:
μ u i , i j + ( λ + μ ) u j , j i + f i = 0 ( or = ρ 2 u i t 2 ) ( i , j = 1 , 2 , 3 )
where ui represents the displacement tensor of the particle, fi represents the volume force tensor, and ρ is the density of the material, where the parentheses indicate the motion balance equation in the presence of static imbalance.

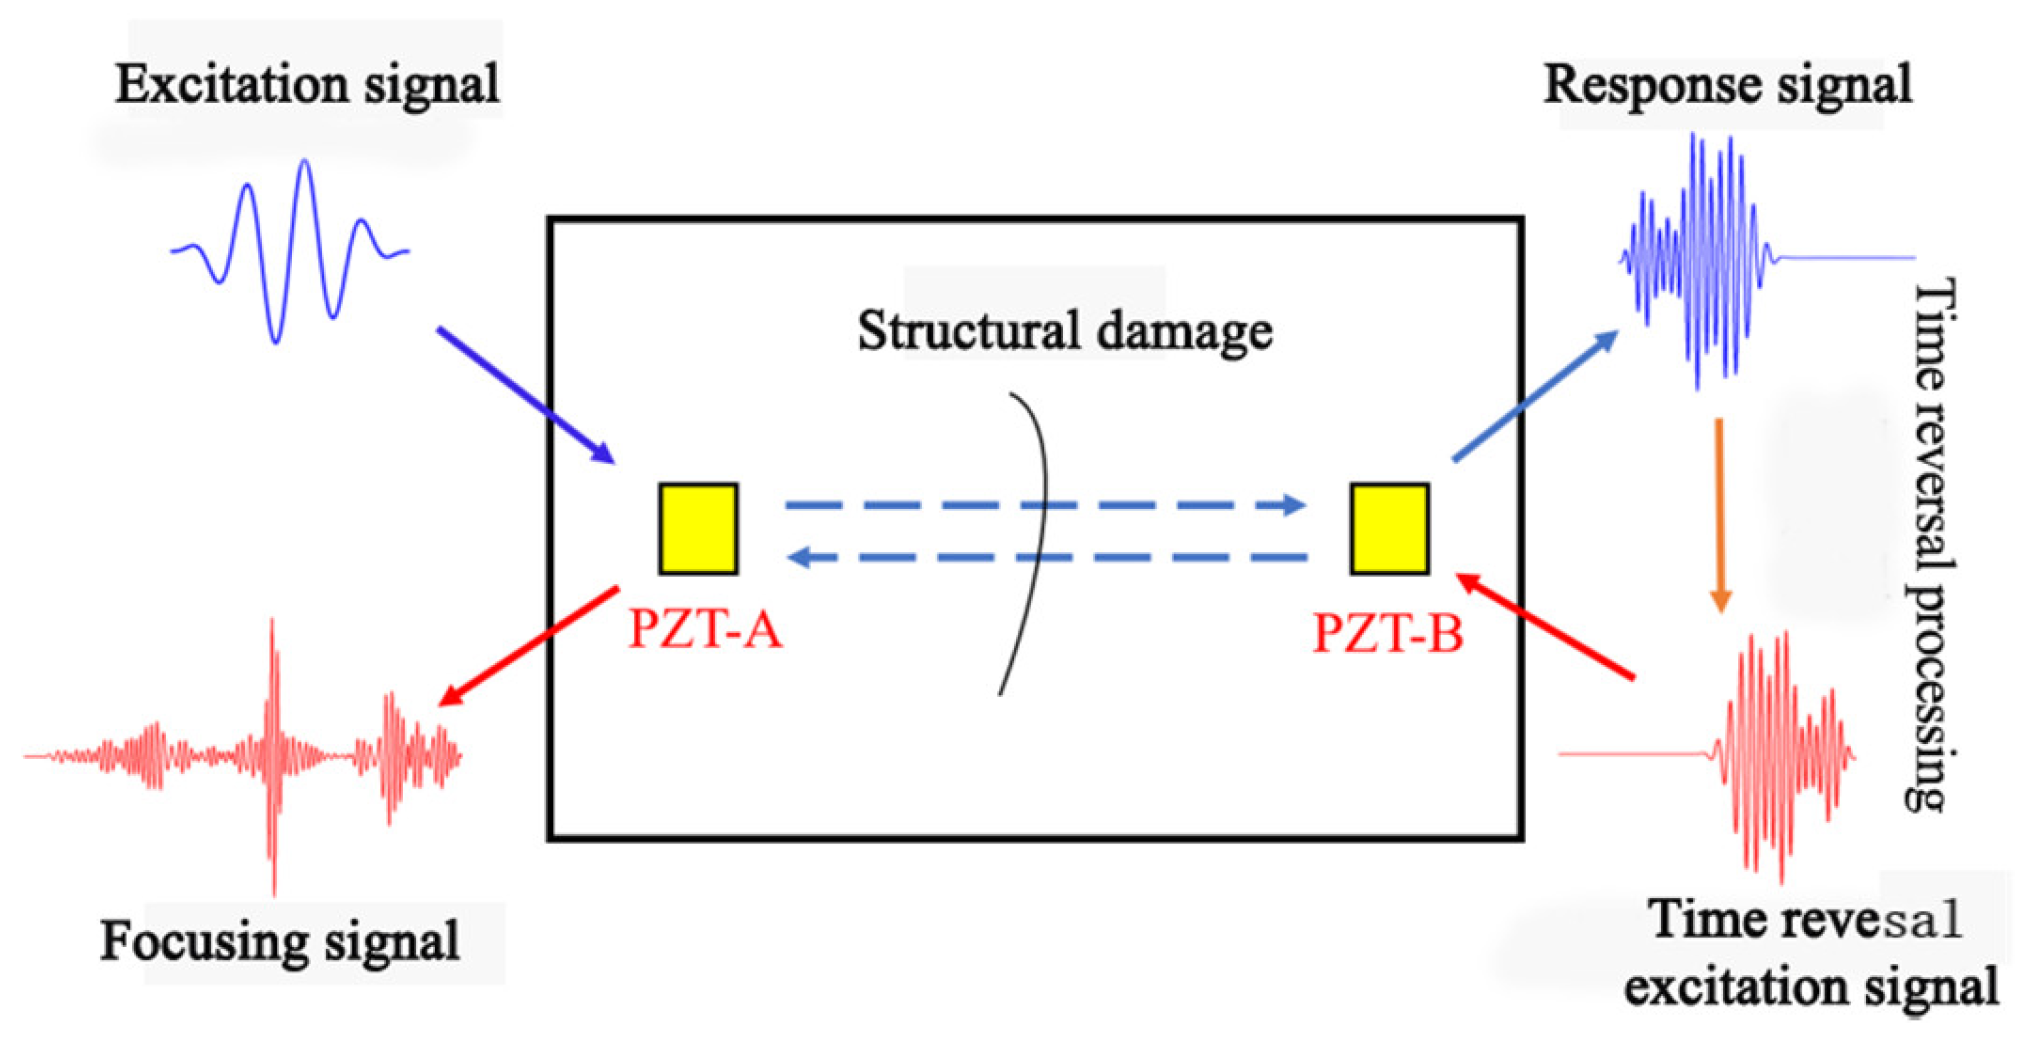
2.2. Application of the Lamb Wave Detection Principle

In traditional ultrasonic nondestructive testing technology, transverse waves and longitudinal waves are directly loaded into the test structures. The interaction between the sound waves and defects in the structure is analyzed by comparing and evaluating the acquired signals to identify defects. However, for large or complex structures, this defect detection approach can be challenging.
To enable Lamb waves to detect structural defects in practical engineering, ultrasonic transducers are used to convert electrical signals in the ultrasonic frequency into corresponding acoustic signals or vice versa [21]. Piezoelectric ceramic ultrasonic transducers are commonly used due to their small size, low cost, high mechanical strength, low power consumption, and ability to act as both signal receivers and transmitters, facilitating stable conversions between acoustic and electrical signals [22]. When the excitation signal passes through the transducer, the piezoelectric wafer inside converts it into an ultrasonic signal that is coupled and enters the structure being tested. In propagation, due to the constraints of the structural free interface, the signal transforms into a Lamb wave signal. The received Lamb wave is then converted back into an electrical signal by the transducer, and the signal is collected and analyzed.
When Lamb waves propagate in the structural medium, they interact with internal defects such as impurities, vacancies, and cracks, resulting in reflection, diffraction, transmission, and other phenomena. These interactions cause significant changes in the extracted signal, including the frequency spectrum, phase, and amplitude of the response signal. The model of the interaction between Lamb waves and structural defects is shown in Figure 1. By using modern signal processing technology, the defect response signal is analyzed. By comparing it with the characteristic curve of undamaged structures, the size, position, and other relevant parameters of the internal defects of the structure can be determined. This enables nondestructive detection and structural evaluation of internal damage in the structure.

3. Establishment of Complex Layout Grouting Sleeve and Defect Model

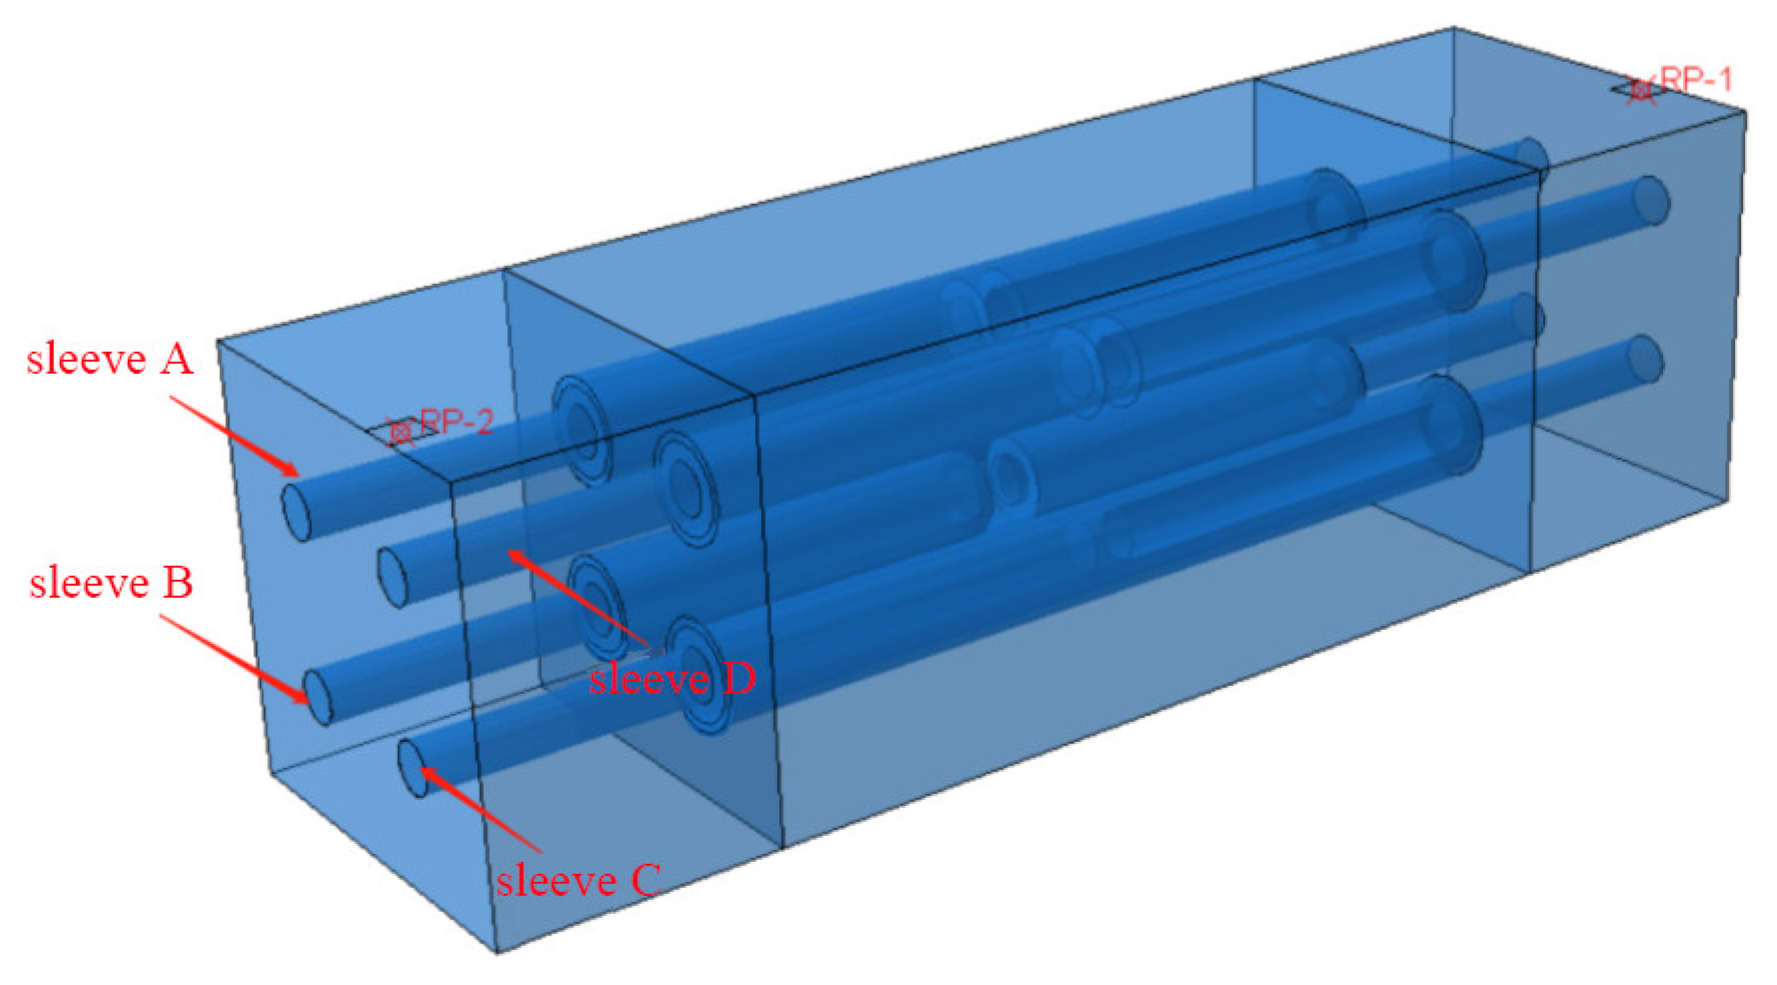
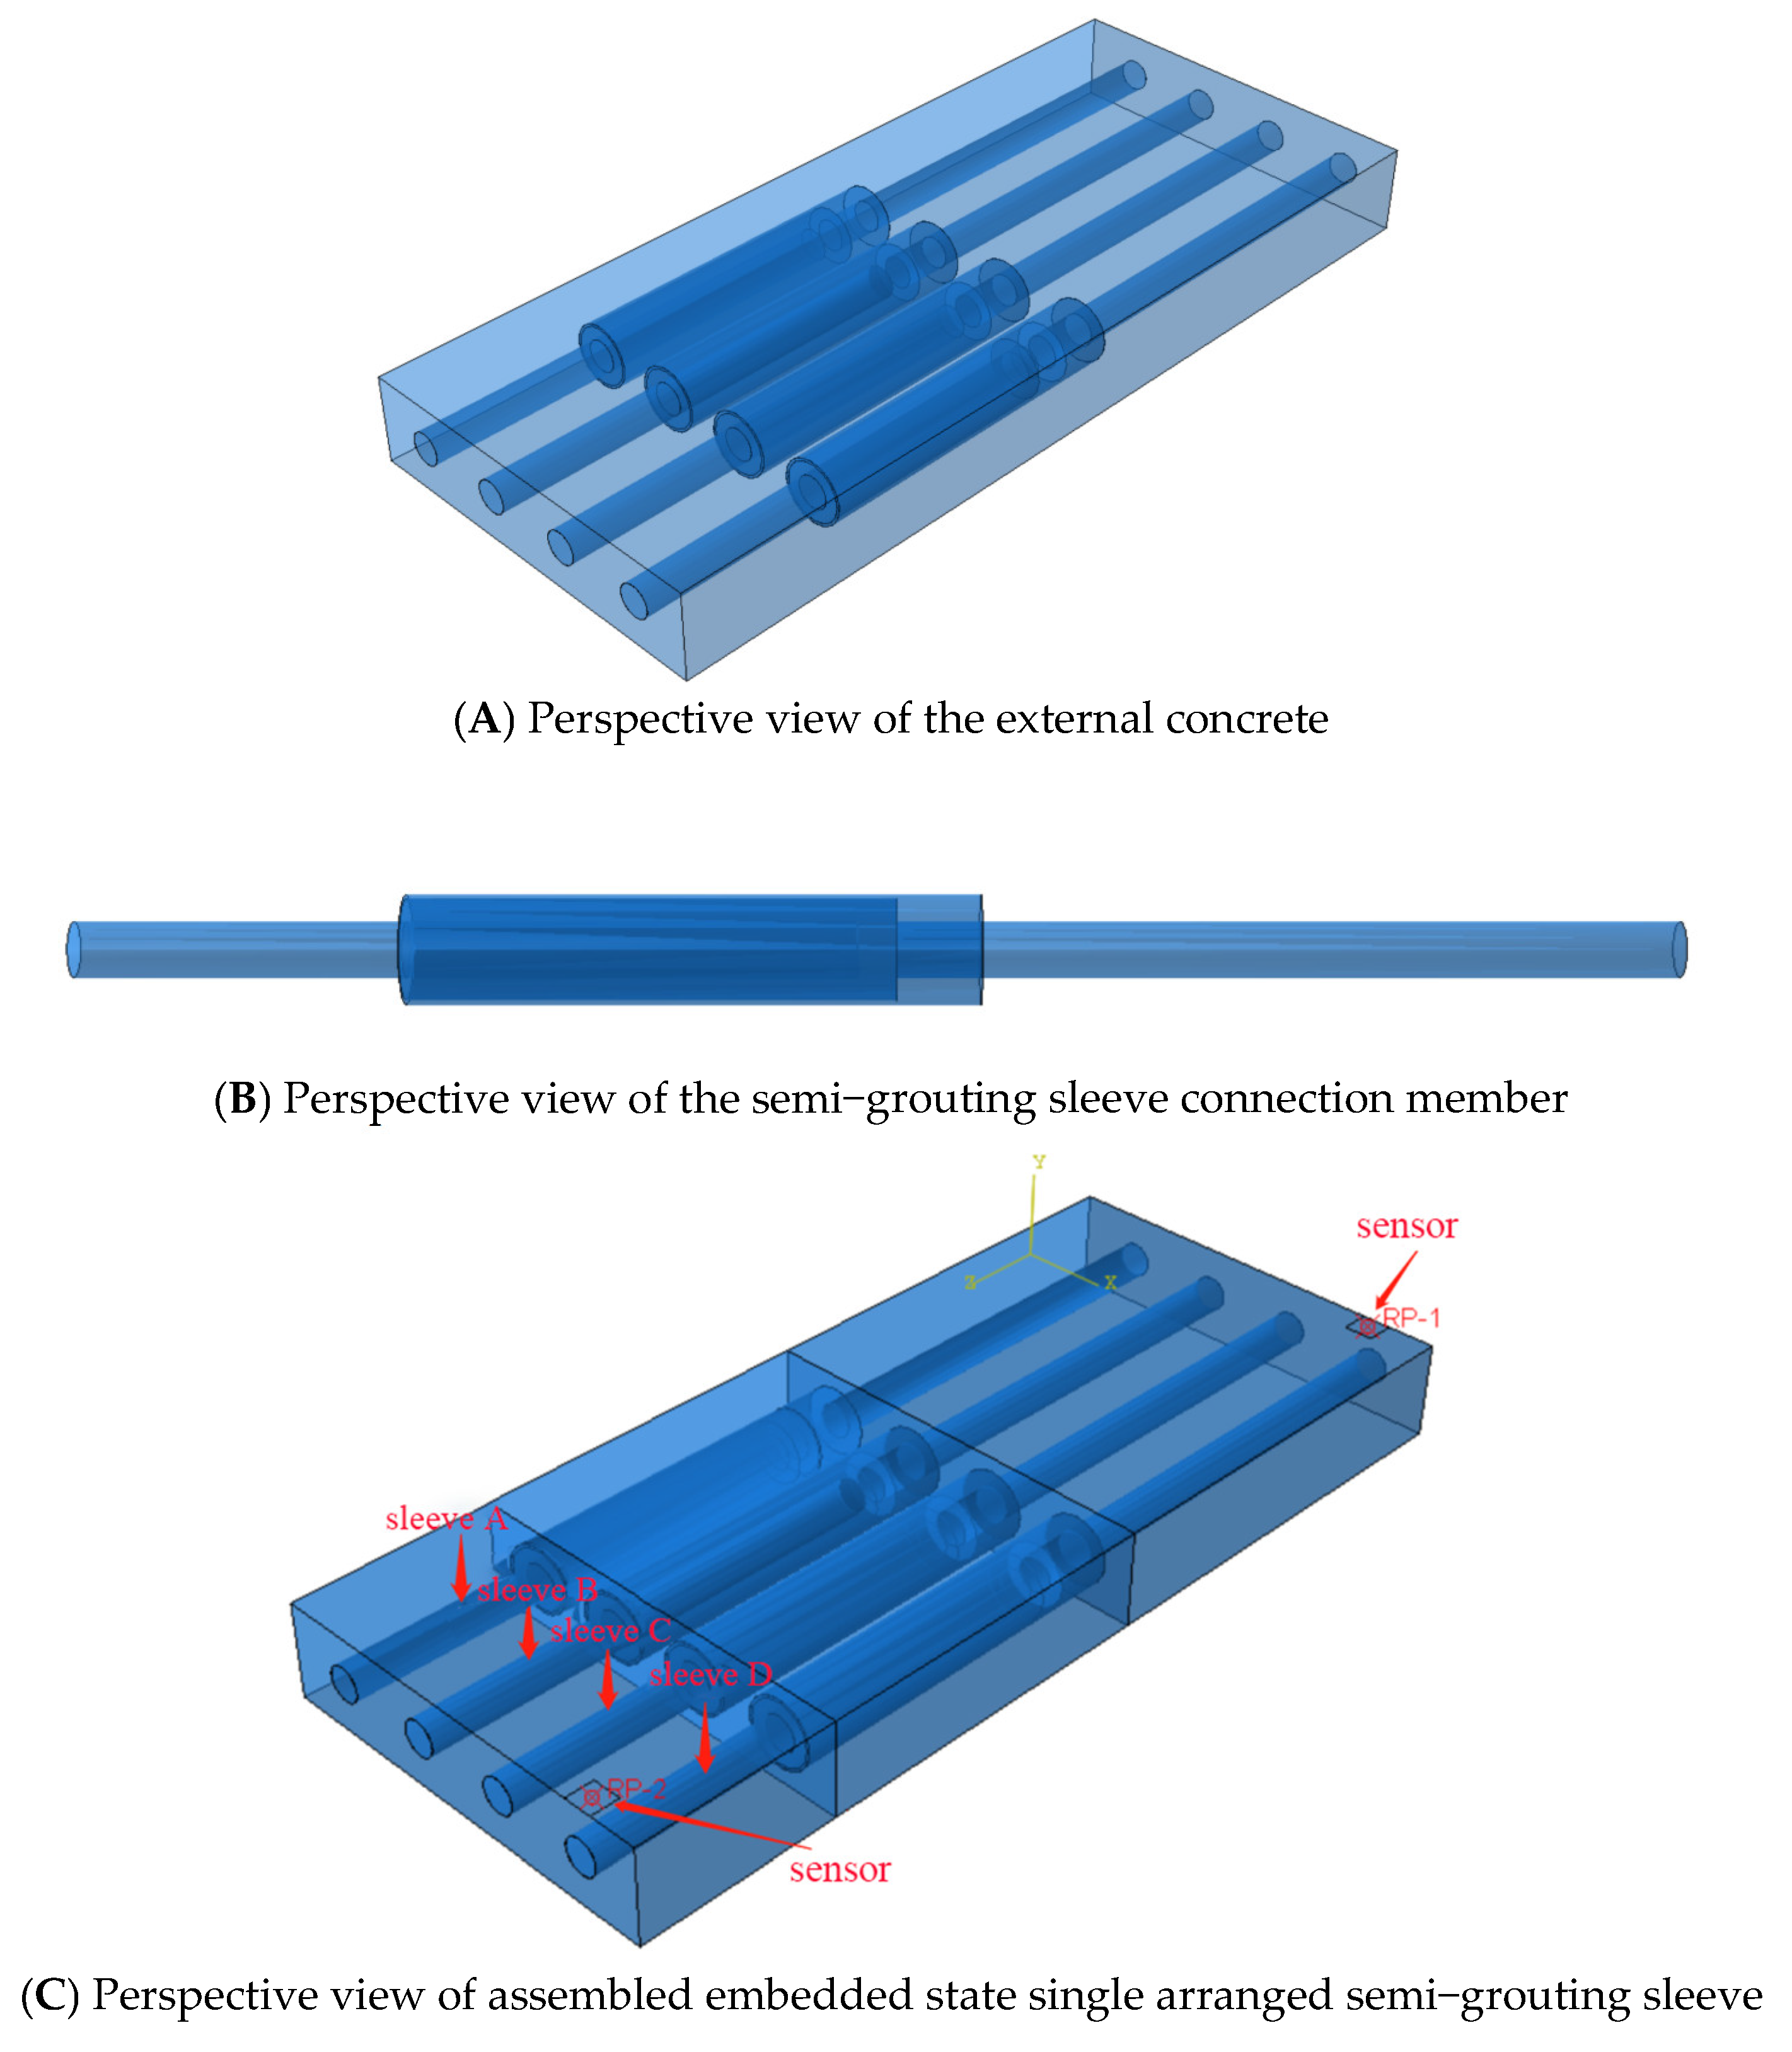
3.1. Complex Layout of the Grouting Sleeve Model

In this paper, the finite element software Abaqus 2020 was used for modeling, in which the three−dimensional model of the grouting sleeve of the research object included four materials: external cast iron sleeve, internal grouting material, steel bar, and external concrete. All materials were homogeneous solid parts, and the contact mode between materials was bound. Firstly, the dimensional design of the model of the single−row grouting sleeve in the embedded state is 1000 mm × 440 mm × 100 mm (length × width × thickness), which is shown in Figure 2. It is derived from the Abaqus FE model without meshing. The dimensional design of the model of the multi−row grouting sleeve in the embedded state is 1000 mm × 300 mm × 300 mm (length × width × thickness), which is shown in Figure 3. The material properties used in the model are shown in Table 1 [23].
A model of the half−grouting sleeve connector is established, and the model of the ductile iron semi−grouting sleeve is selected as GTZB 4−36C. The size of the sleeve is shown in Table 2, and the parameters of the materials used in the model are shown in Table 3 below. The model is shown in Figure 4.

3.2. Establishment of the Defect Model

The following three empty defect forms were mainly used in this study, and the model building is shown in Figure 5.

4. Verification of the Optimal Excitation Signal in the Injury State

Research presented in the article of Hu Y. [18] showed that the optimal excitation signal for a single embedded grouting sleeve was determined as the Lamb wave signal of cycle 4 and the frequency of 15 kHz. In this paper, multiple embedded grouting sleeves are studied, and the arrangement forms are distinguished. If the structure changes, the model will lead to a boundary change. This change will cause the propagation of the Lamb waveform to follow this change, while the best incentive signal will also change. Thus, the model is no longer for a single−sleeve internal defect detection but for a single arrangement and two multiple models; each model has four sleeves, and the corresponding structure size and internal structure also change, so in order to make the Lamb wave have the best response and detection effect, we need to verify the Lamb wave in the embedded state in the best excitation signal.

4.1. Establishment of the Defect−State Model

To build the grouting sleeve embedded state single−row multiple−sleeve model, refer to the configuration shown in Figure 5A. In this model, only grouting sleeve D will have horizontal empty defects, as depicted in Figure 5. The defect will have a depth of 10 mm and a width of 630 mm. Only the defect variable will be set while keeping the component size, material, and arrangement unchanged.
For defect detection, the excitation scheme using both ends of the concrete surface will be selected. The signal receiver and transmitter will be arranged at locations RP1 and RP2, respectively. This setup will enable the detection of the internal defects in grouting sleeve D and allow for the analysis and comparison of the received signals to evaluate the presence and extent of the horizontal empty defects in the sleeve.

4.2. Analysis of the Best Frequency Verification Results

The best incentive signal of the multiple−sleeve damage model is divided into two steps. The first step is to determine the best frequency, then keep the cycle number constant, change the range of the center frequency only, and select the center frequency that can obtain the best response. The best excitation signal of a single sleeve, as verified by Hu Y. [18], is found to be cycle number 4 at a center frequency of 15 kHz, so 15 kHz, and a total of five other frequencies of 5 kHz, 10 kHz, 20 kHz, 25 kHz, and 30 kHz were studied under cycle number 4. The time−domain signals extracted by the secondary receiver are shown in Figure 6.
In order to facilitate the analysis of the propagation law of Lamb wave of each center frequency in cycle 4, the peak of the center frequency is extracted in the secondary receiver of the model, and the data are drawn into a bar chart and a line diagram for comparison, as shown in Figure 7.
From the analysis of the signal maps extracted from cycle 4 and the frequency range of 5 kHz to 30 kHz, it is observed that at the central frequency of 5 kHz, the main lobe is well identified even as the defect increases. However, as the frequency increases from 20 kHz to 30 kHz, the time domain map of the anti−focus signal becomes chaotic, and clutter caused by signal stacking becomes evident. This clutter not only results in significant energy loss but also interferes with the main lobe, making subsequent data analysis challenging.
To detect a larger range of internal defects in the grouting sleeve, Lamb waves with a center frequency of 15 kHz were preferentially selected. The center frequencies of 10 kHz and 15 kHz were found to be 197.79 V and 236.06 V, respectively, further confirming that the optimal center frequency for the excitation signal in the damage state is 15 kHz. This selection aligns with the previously determined optimal center frequency, and it is considered the best choice for detecting defects in the grouting sleeve with the proposed setup.

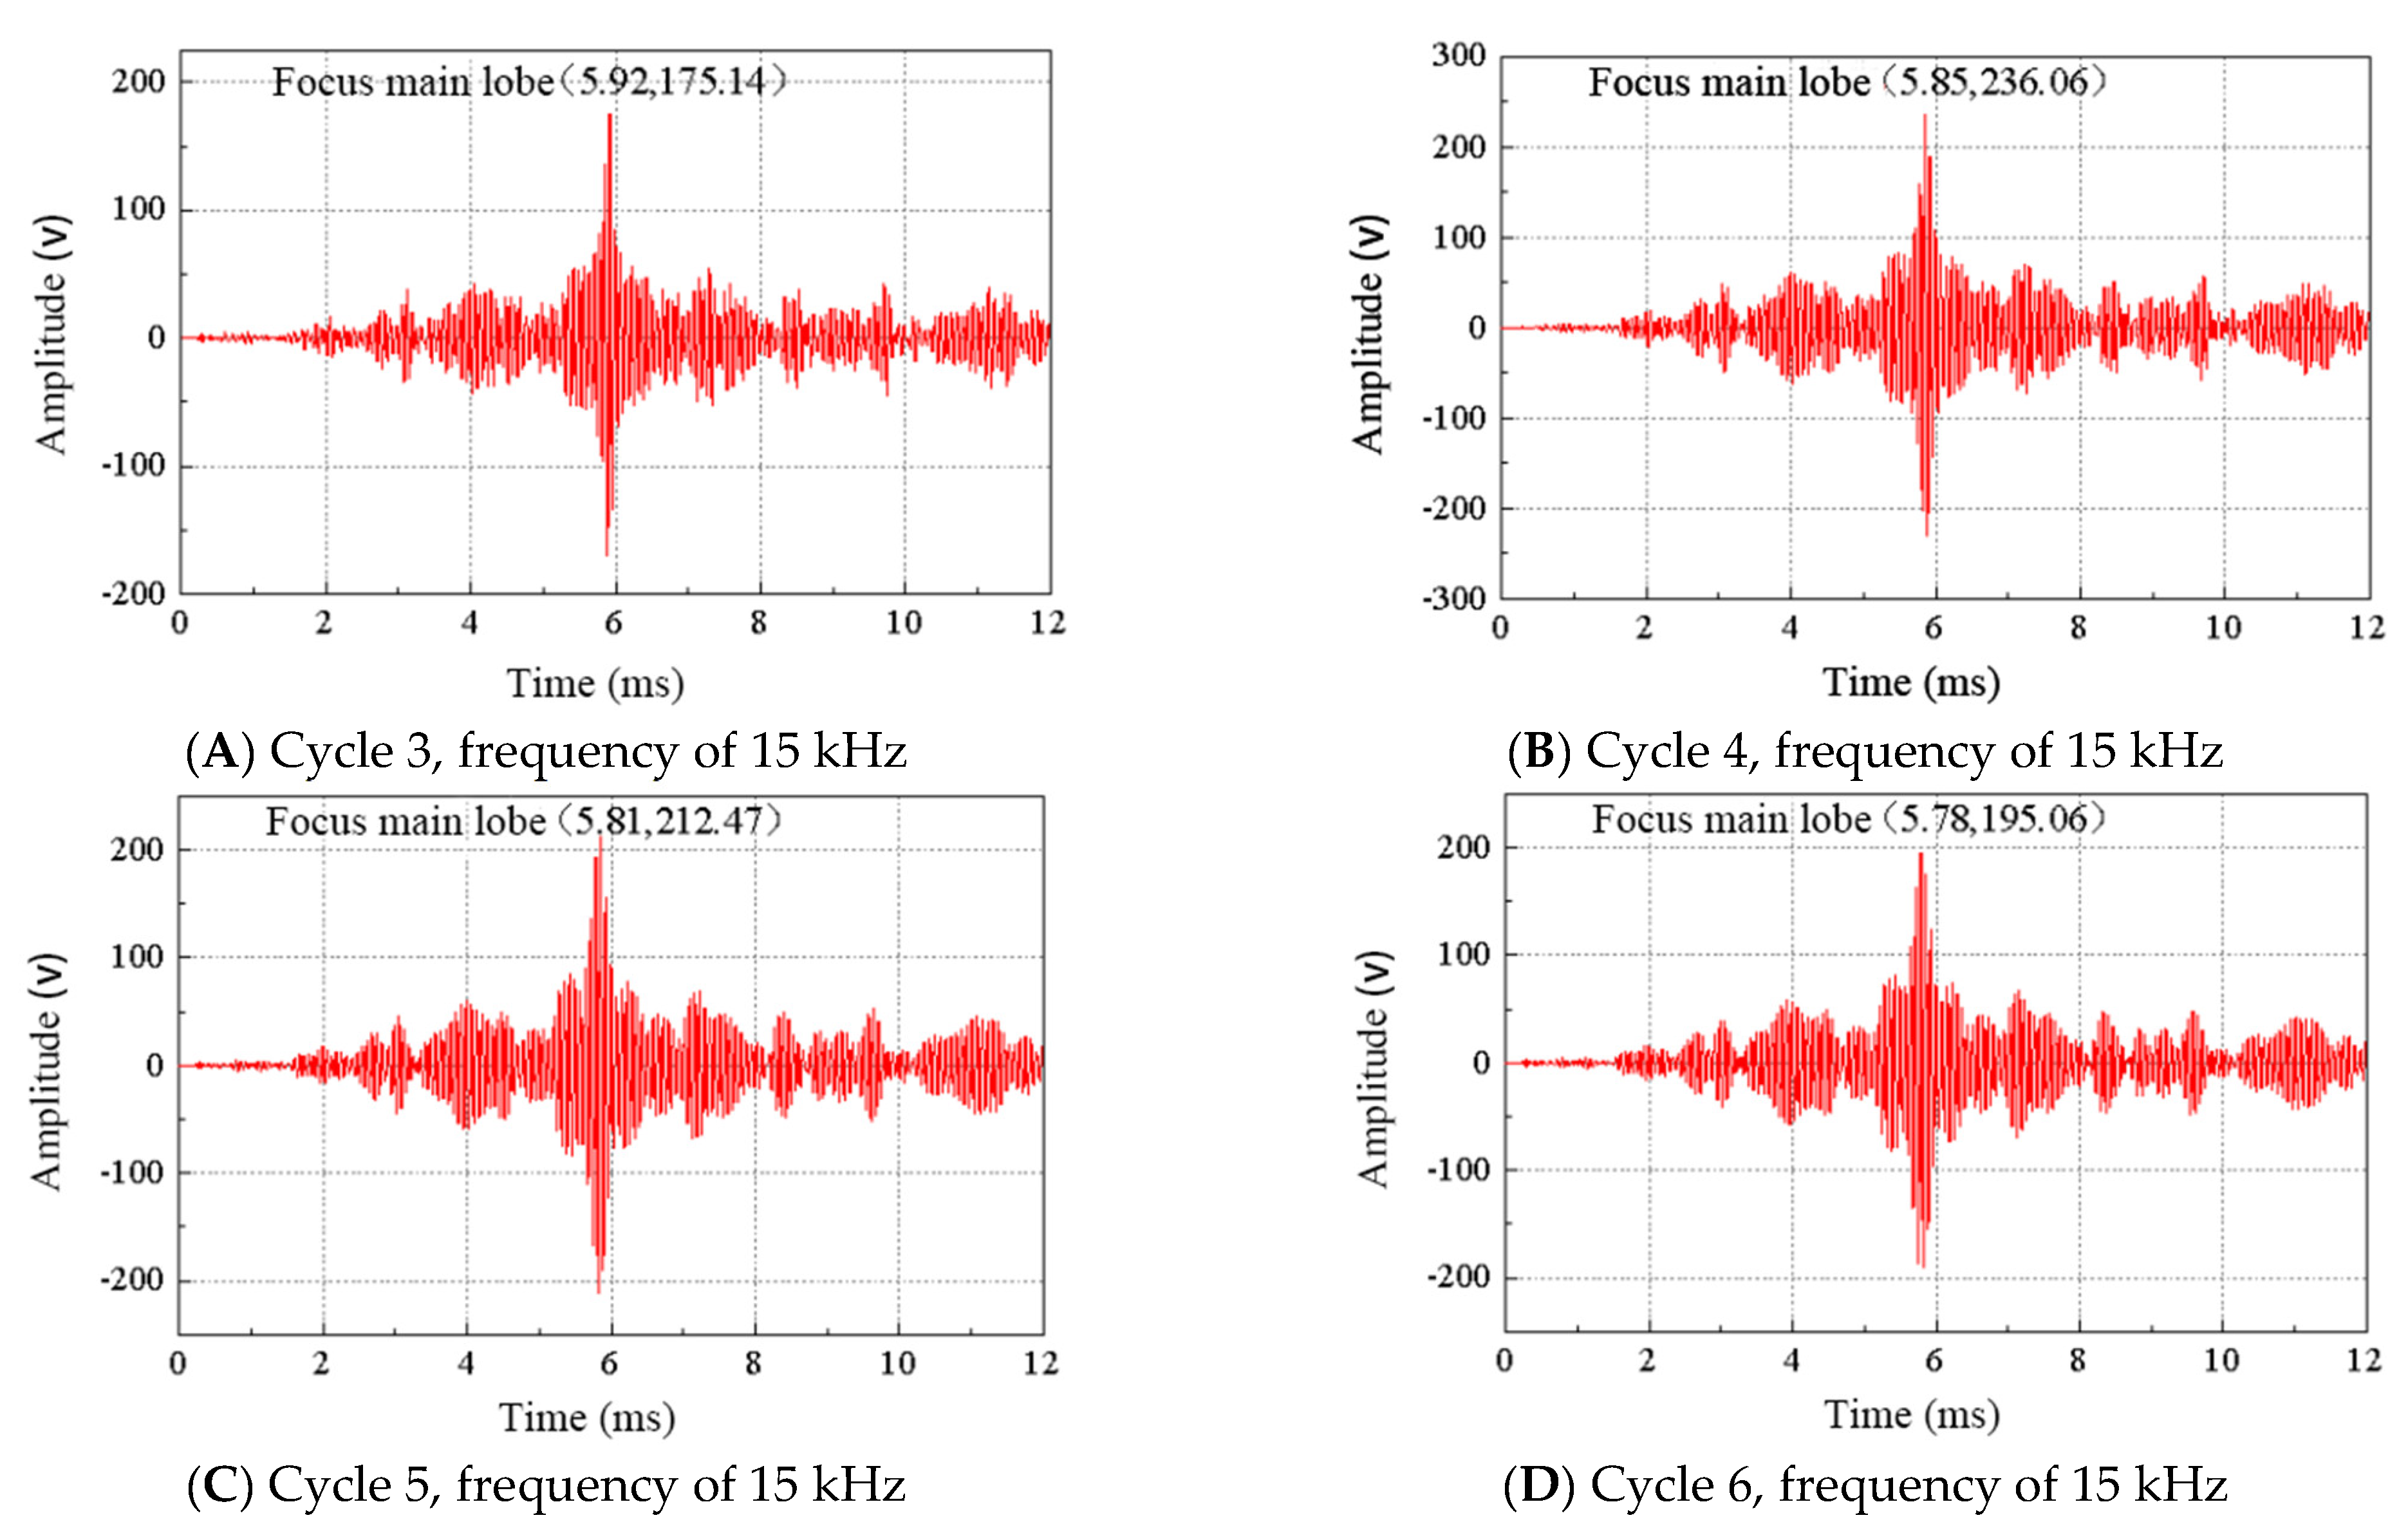
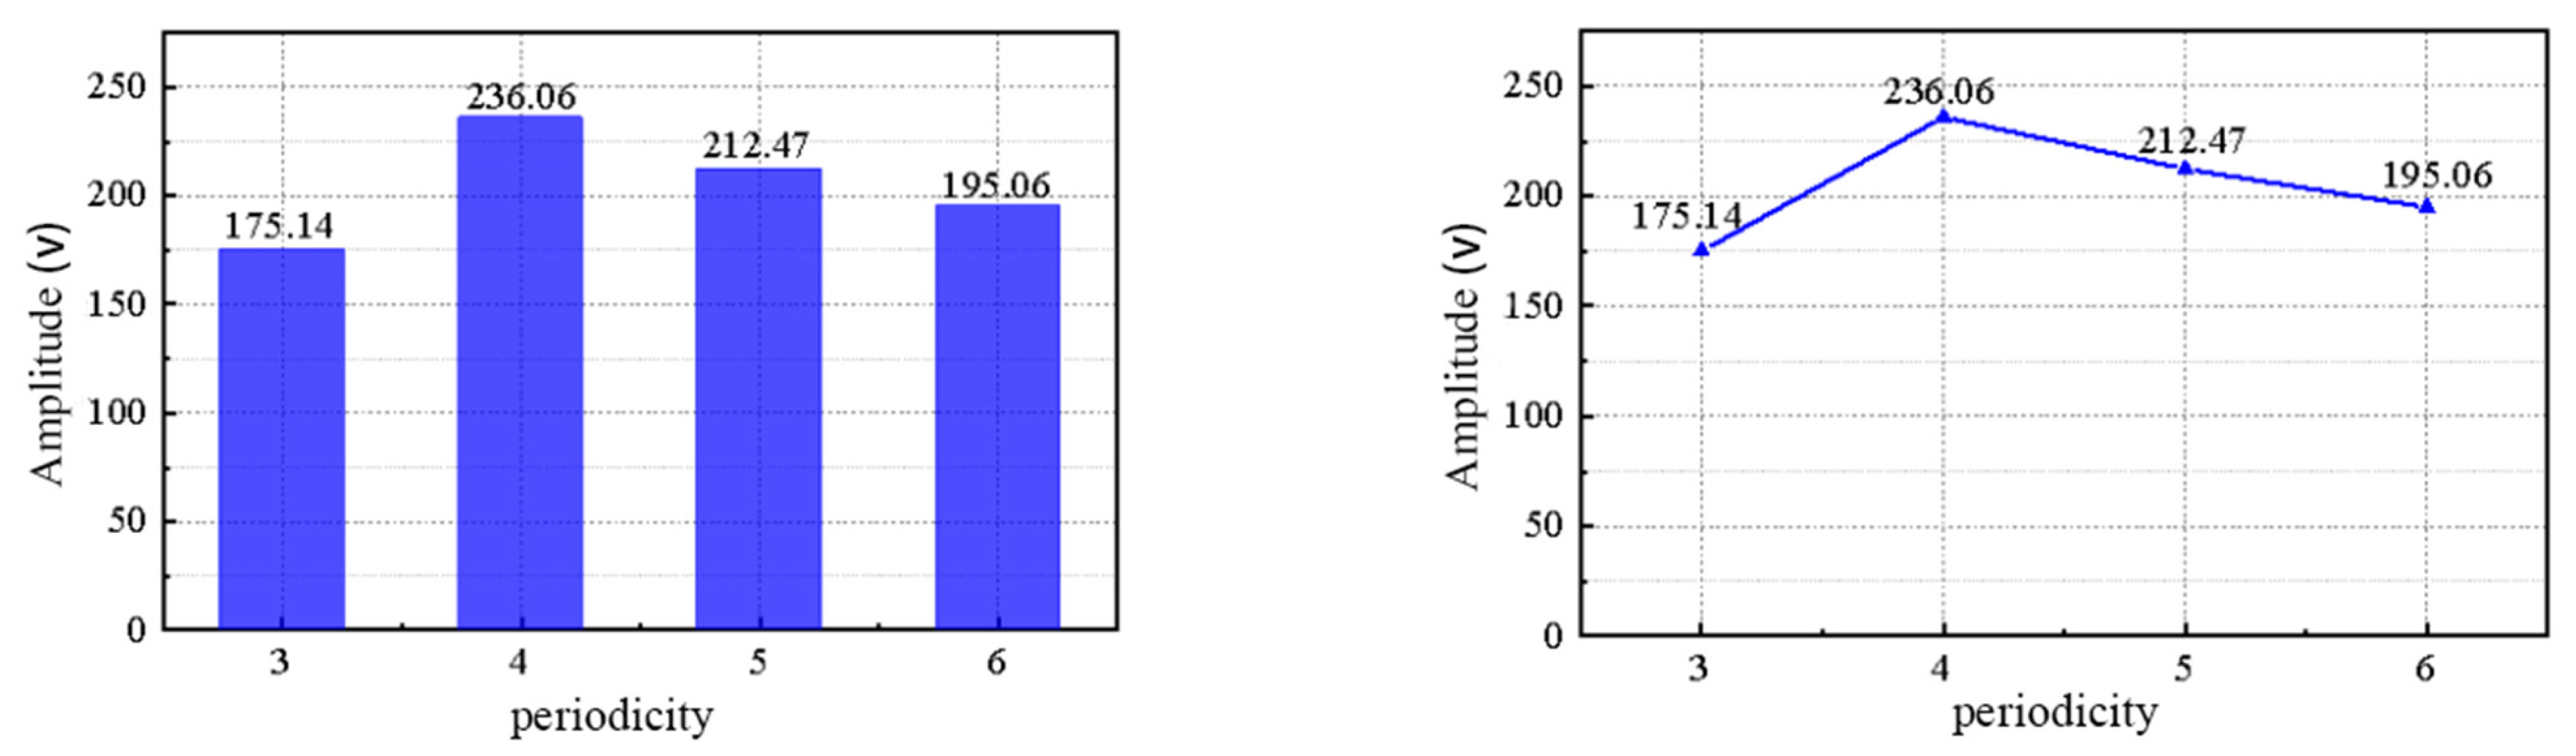
4.3. Analysis of the Optimal Cycle Validation Results

After verifying the center frequency of the model excitation signal in the damage state, the next step is to verify the cycle. In this step, the excitation signal frequency is kept at 15 kHz, and 3, 4, 5, and 6 are selected for the cycle number. Four groups of different incentive signals load the primary excitation end of the model, and the time−domain signal of four groups of excitation signals after time reversal at the secondary receiving end of the model is extracted, as shown in Figure 8.
In order to visually observe and analyze the propagation law of Lamb waves in different cycles in the sleeve internal damage when the central frequency is 15 kHz, the main lobe peak of each center frequency is extracted in the time−domain signal map extracted by the secondary receiver of the model, and the data are drawn into a bar chart and a line chart for comparison, as shown in Figure 9.
As can be seen from the time−domain signal diagram in Figure 8, the time−domain signals extracted at the secondary receiver of the damaged sleeve model and the peak of the focus main lobe are different in different cycles. The peak of the focused main valve from three cycles to six cycles increases first and then decreases, which is the same as the cycle of the optimal excitation signal of a single grouting sleeve.
From Figure 8B, the peak of cycle 4 is 236.06 V, which is the largest among the four cycles. At the number of cycles of three, five, and six, the peaks of the focused main valve were 171.14 V, 212.47 V, and 195.06 V, respectively, and the decreases were 27.50%, 10.00%, and 17.34% compared with the focus peak of cycle number 4. It shows that the Lamb waves with selected cycle number 4 have the least energy decay when propagating, which can detect larger internal defects of the sleeve and is more suitable for defect detection of the grouting sleeve. That is, the excitation signal cycle 4 and the frequency of 15 kHz can achieve the optimal detection effect in the damaged state of multiple sleeves. Therefore, when detecting the various defects of multiple grouting sleeves in the embedded state, the excitation signal will be selected for detection.

5. Defect Positioning of Complex Arranged Grouting Sleeve under Embedded State

Using the characteristics of Lamb waves propagation inside the sleeve, using the multi−measuring point defect positioning method, which can roughly locate the defect position by setting multiple measuring points for multiple detection.

5.1. Working Condition Setting and Model Establishment

The model adopts a single row of grouting sleeves in the embedded state, in which there are four sleeves. There is only one empty defect in the rightmost grouting sleeve; the empty defect width is 10 mm, and the section damage rate is 100%. The specific situation is shown in Figure 10.
To accurately determine the location of the internal defect in the grouting sleeve, the model surface is divided into several measuring areas, and specific measuring points are set along the length direction of the sleeve. The measuring points are labeled from RP−1 to RP−7 from right to left. Firstly, two symmetric measuring areas, A1 and A2, are defined. Area A1 is between measuring points RP−1 and RP−4, while area A2 is between RP−4 and RP−7. This division helps in narrowing down the location of the defect. Secondly, to further refine the measuring areas, two additional areas, B1 and B2, are set. Area B1 is between measuring points RP−1 and RP−3, and area B2 is between RP−5 and RP−7. Additionally, reduced measuring areas, C1 and C2, are defined. Area C1 is between measuring points RP−1 and RP−2, and area C2 is between RP−6 and RP−7. In this section, a defect is specifically set between RP−5 and RP−6. The time reversal method is then simulated to analyze the time−domain signal obtained through time reversal in order to accurately locate the defect within the grouting sleeve.

5.2. Analysis and Discussion of the Results

The excitation signal of cycle 4 and central frequency 15 kHz is input from the excitation end of the measuring area of the model in Figure 10 and is operated through the time reversal method. Finally, the time−domain signals extracted at the receiving end of the model measuring areas are shown in Figure 11 below.
In order to facilitate the analysis of the propagation law of Lamb waves with cycle 4 and a central frequency of 15 kHz between the different measuring areas of the grouting sleeve, the main lobe peak is extracted in the time−domain signal map extracted from the secondary receiver end, and the data are drawn into a bar chart and a line chart for comparison, as shown in Figure 12.
From the analysis of Figure 11, it is observed that in test area A1, the peak of the anti−focus signal is 238.60 V, which is higher than the peak in area A2, which is 179.50 V. This difference in peak values is due to the presence of grouting defects, which changes the internal boundaries of the structure, leading to the reflection, diffraction, and scattering of Lamb waves in the medium. As a result, the peak value of the main lobe in the time anti−focus signal decreases, enabling the initial positioning of the defect in measuring area A2.
Further comparison of the time−reversal focused signal maps in test areas B1 and B2 reveals that the peak in B1 is 348.12, while the peak in B2 is 296.57 V. The peak of the time−reversed main lobe in B2 decreases by 14.81% compared to B1. This comparison narrows down the location of the defect to area B2.
Comparing the time−focusing signal maps in areas C1 and C2, the peak of the main lobe in C2 is 424.27 V, and in C1, it is 423.64 V. This similarity in peak values indicates that the propagation mode of Lamb waves in C1 and C2 is almost identical. Based on this analysis, it is determined that there is no defect in area A2, and the defect is indeed in area B2, specifically between measuring points RP−5 and RP−6.
The above analysis demonstrates that to accurately locate defects, increasing the number of measurement areas is beneficial. More measurement areas provide a more precise position for defects. When a defect is present in a measurement area, it leads to a reduction in the peak value. Utilizing this characteristic allows us to judge the defect’s location within the measurement areas and achieve accurate defect positioning.

6. Study on the Severity of Defects in the Embedded State of the Complex Layout Grouting Sleeve Connector

Frequency dispersion is one of the main characteristics of Lamb wave propagation in the medium. The frequency dispersion will lead to different modes. So, the phase velocity and group velocity can be solved for by using MATLAB software (R2018a). The research object of this paper is the grouting sleeve, and the calculation formulas of the transverse wave and the vertical wave, respectively, are as follows:
C L = E ρ = λ + 2 μ ρ
C T = G ρ = μ ρ
The longitudinal wave speed is 3708 m/s, and the transverse wave speed is 2393 m/s. The dispersion curves of the phase velocity and group velocity in the sleeve grouting material are shown in Figure 13 and Figure 14 below, respectively.
The feasibility of the Lamb−wave−based time reversal method for defect positioning in complex arranged grouting sleeve connections has been demonstrated. In this section, the method is used to effectively analyze the severity of damage to grouting sleeve connections under various complex arrangements. To validate the method’s capabilities, two types of arrangements are chosen: single−row layout and multiple−row arrangement. The focus of this section is to verify the feasibility of testing the defect severity of half−grouting sleeve connections under the single−row arrangement.
By applying the Lamb−wave−based time reversal method, it is expected that the detection and analysis of defects in half−grouting sleeve connections will be accurately assessed under the single−row arrangement. This approach will provide valuable insights into the damage severity of grouting sleeve connections and further confirm the effectiveness of the time inversion method in detecting complex arrangements. The results from this section will contribute to the growing body of knowledge in structural health monitoring and nondestructive testing technologies, specifically for grouting sleeve connections in practical engineering scenarios.

6.1. Conditions Setting and Model Establishment

6.1.1. Single−Row Arrangement of Grouting Sleeve Defects

With the connection of four grouting sleeves, the size of the grouting sleeve remains unchanged. Four grouting sleeves are numbered in Figure 2, in which sleeves A, B, and C are kept without damage, and the defects are set inside sleeve D. In order to compare the propagation difference in Lamb waves in the embedded state, the defect condition is set for five groups of horizontal emptying defect conditions of different severity of damage, and the specific condition setting is shown in Table 4.

6.1.2. Multiple−Defect Arrangement of Grouting Sleeves

The central defect models of five different widths are established for simulation. Four grouting sleeves are divided into two columns for arrangement, and the size of the grouting sleeve remains unchanged and numbered in Figure 3, in which sleeve A, sleeve B, and sleeve C are kept without damage, and the middle empty defect is set inside sleeve D. Five different central defects are numbered 1, 2, 3, 4, and 5, and the information of the empty defect width and depth of the middle sleeve with different numbers are shown in Table 5.

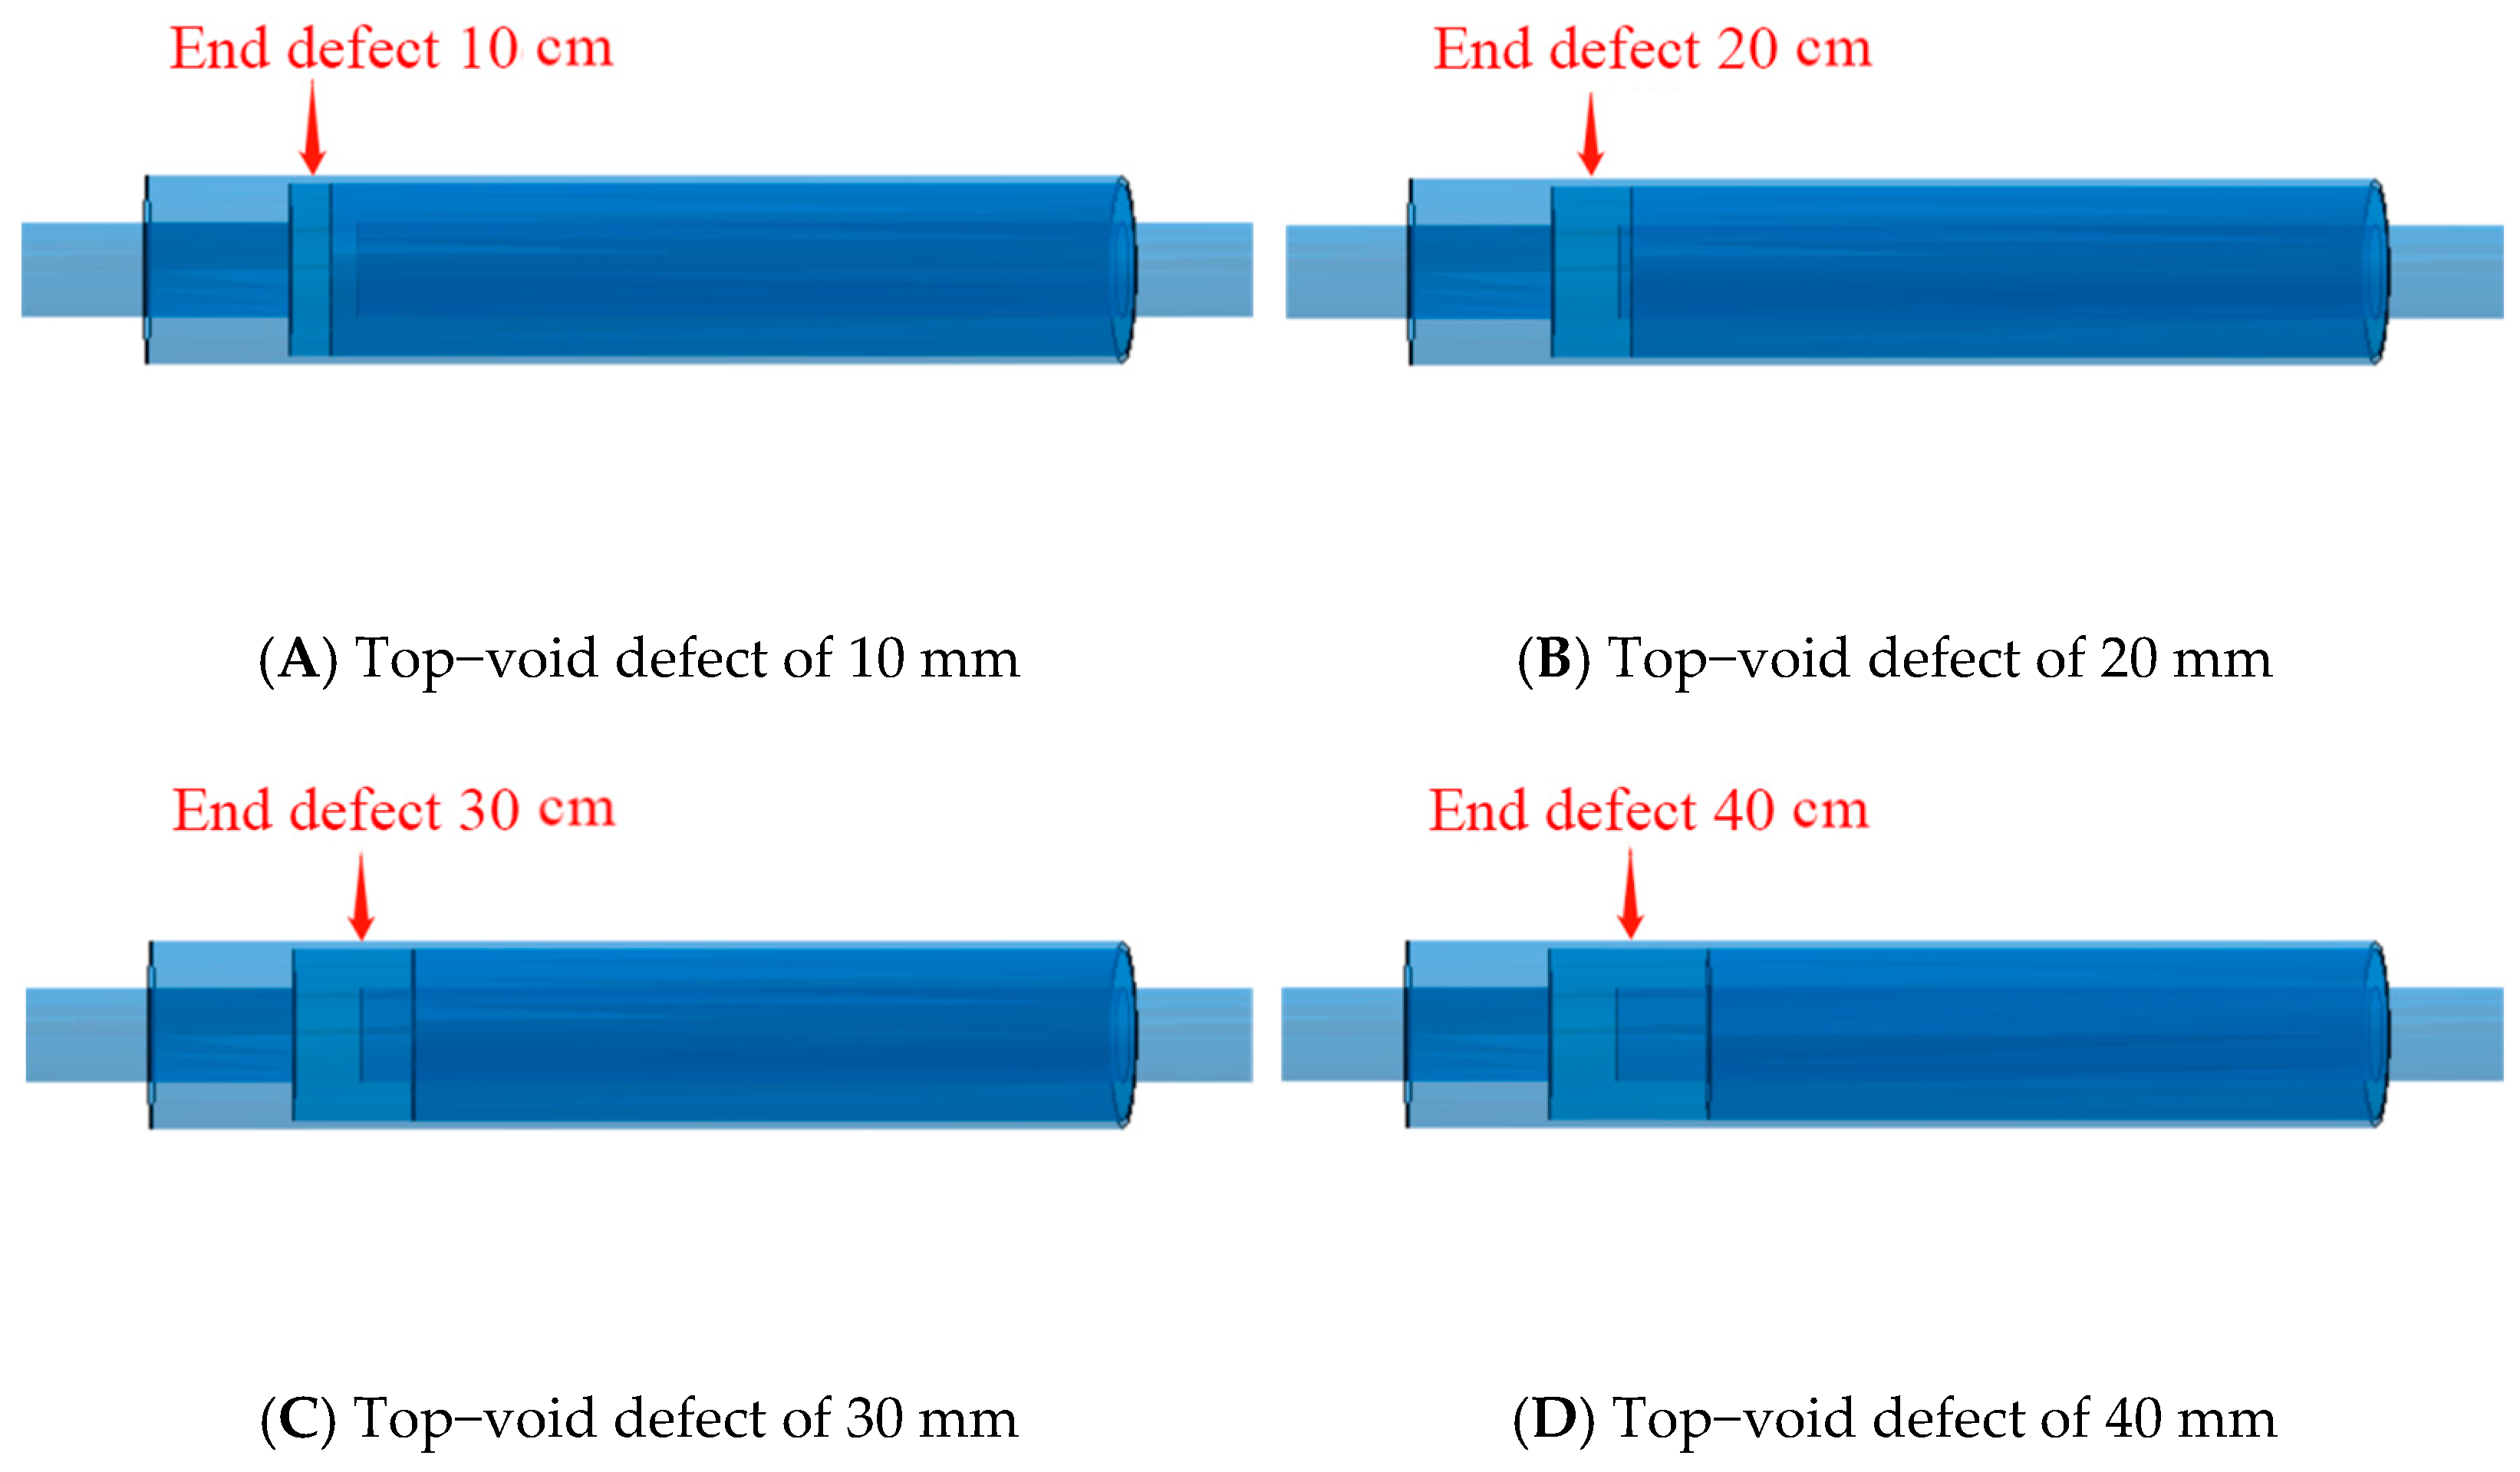
6.1.3. Defect Arrangement of the Top of the Semi−Grouting Sleeve

The use of semi−grouting sleeves in engineering applications is also prevalent. Unlike full grouting sleeves that have steel bar connections on both ends, the half grouting sleeve has one end connected and the other end directly fixed at the sleeve, resulting in an asymmetrical overall structure. Due to this asymmetry, the propagation form of Lamb waves in half−grouting sleeves differs from that of full−grouting sleeves.
In Figure 4C, four grouting sleeves (A, B, C, and D) are arranged, where sleeves A, B, and C are kept without damage, and defects are intentionally introduced inside sleeve D. Five different middle defect conditions are set and labeled as 1, 2, 3, 4, and 5. The specific severities of the top emptying defect of the half−grouting sleeve with different numbers are provided in Table 6.
The goal of this section is to examine the effectiveness of the Lamb−wave−based time reversal method in detecting and assessing defects in the half−grouting sleeve arrangement. The unique asymmetrical nature of the half−grouting sleeve structure poses a challenge to the detection process, and the results will shed light on the method’s ability to accurately identify and characterize defects in such complex arrangements.
When establishing the model of the semi−grouting sleeve with defects, only the top variable controls the empty defect, and the size, material, and arrangement form of the component remain unchanged. The schematics of four finite element models are shown in Figure 15.

6.2. Analysis and Discussion of the Results

6.2.1. Single−Row Arrangement

The excitation signal of cycle 4 and central frequency 15 kHz is input from the incentive end of Figure 2 and operated through the time reversal method. Finally, the above five time−domain signals of grouting emptying defects of different severities of damage are extracted at the secondary receiving end of the model, as shown in Figure 16.
In order to facilitate the analysis of the propagation rule of Lamb waves in cycle 4 at 15 kHz between different levels of the grouting sleeve, the peak of the main valve is focused on in the time−domain signal diagram, and the different section damage rates are extracted; the data are drawn into a bar chart and a line diagram, as shown in Figure 17.
According to Figure 17, the focused main lobe waveform of the signal map extracted at the secondary receiver of different section damage rates is consistent, and the waveform is also consistent with the excitation signal waveform. Moreover, the peak of the focused main valve was maintained at four cycles, and the peak of the main valve was 5.85 ms, indicating that the increase in the number of sleeves in the single row had no impact on the peak period and occurrence time of the focused main valve. From the reverse focusing peak map, the damage rate of the cross−section is between 0% and 40%, and with the increase in the corresponding focusing peak, it is decreasing. The peak of no injury is 294.91 V. When the damage rate is 10%, 20%, 30%, and 40%, the peak is 236.06 V, 206.68 V, 176.88 V, and 113.67 V. The decreases compared with the focus peak in the nondestructive state were 19.63%, 29.63%, 39.78%, and 61.30%. In conclusion, the Lamb−wave−based time reversal method still has excellent defect detection ability under the single arrangement of multiple−sleeve connections in the embedded state.

6.2.2. Multi−Row Arrangement Situation

The excitation signal of cycle 4 at a center frequency of 15 kHz is input from the excitation end of the time reversal method. Finally, the time−domain signals of the data are extracted at the secondary receiver of the model with the main valve peak, and the data are drawn into a bar chart and a line chart, as shown in Figure 18.
The analysis of Figure 16 reveals several important findings about the Lamb−wave−based time reversal method in detecting defects in complex arrangements of grouting sleeves:
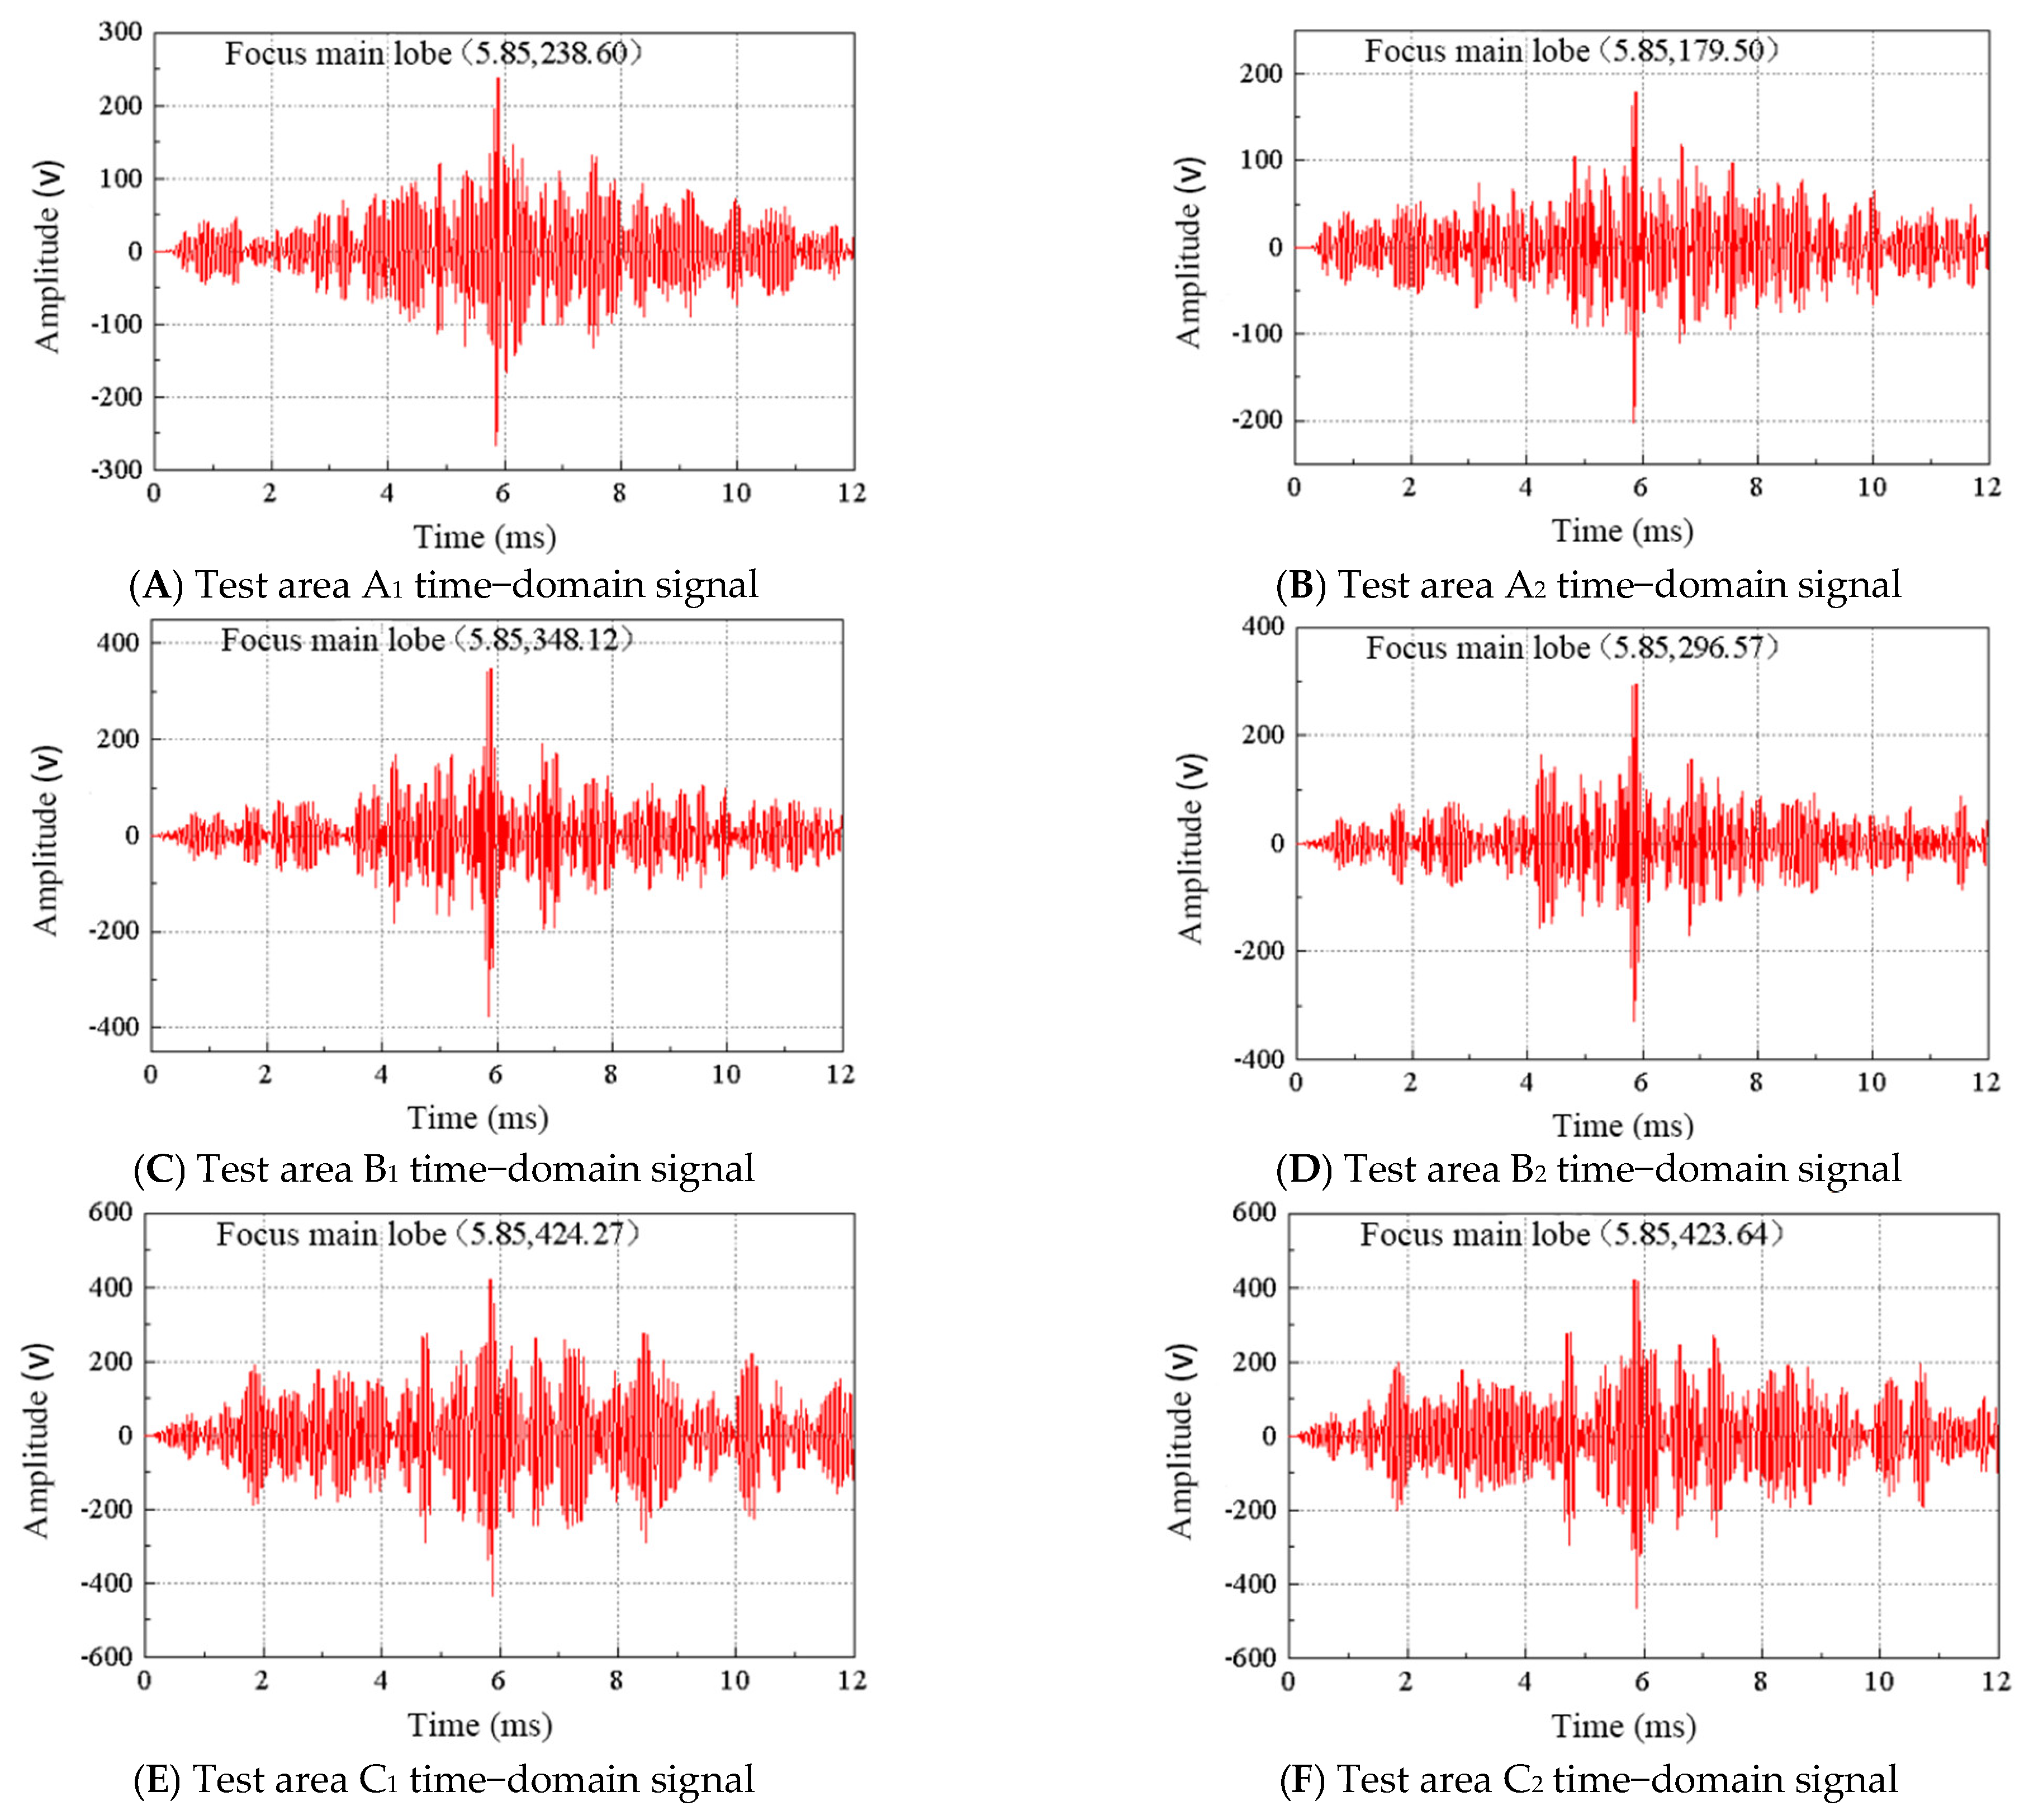
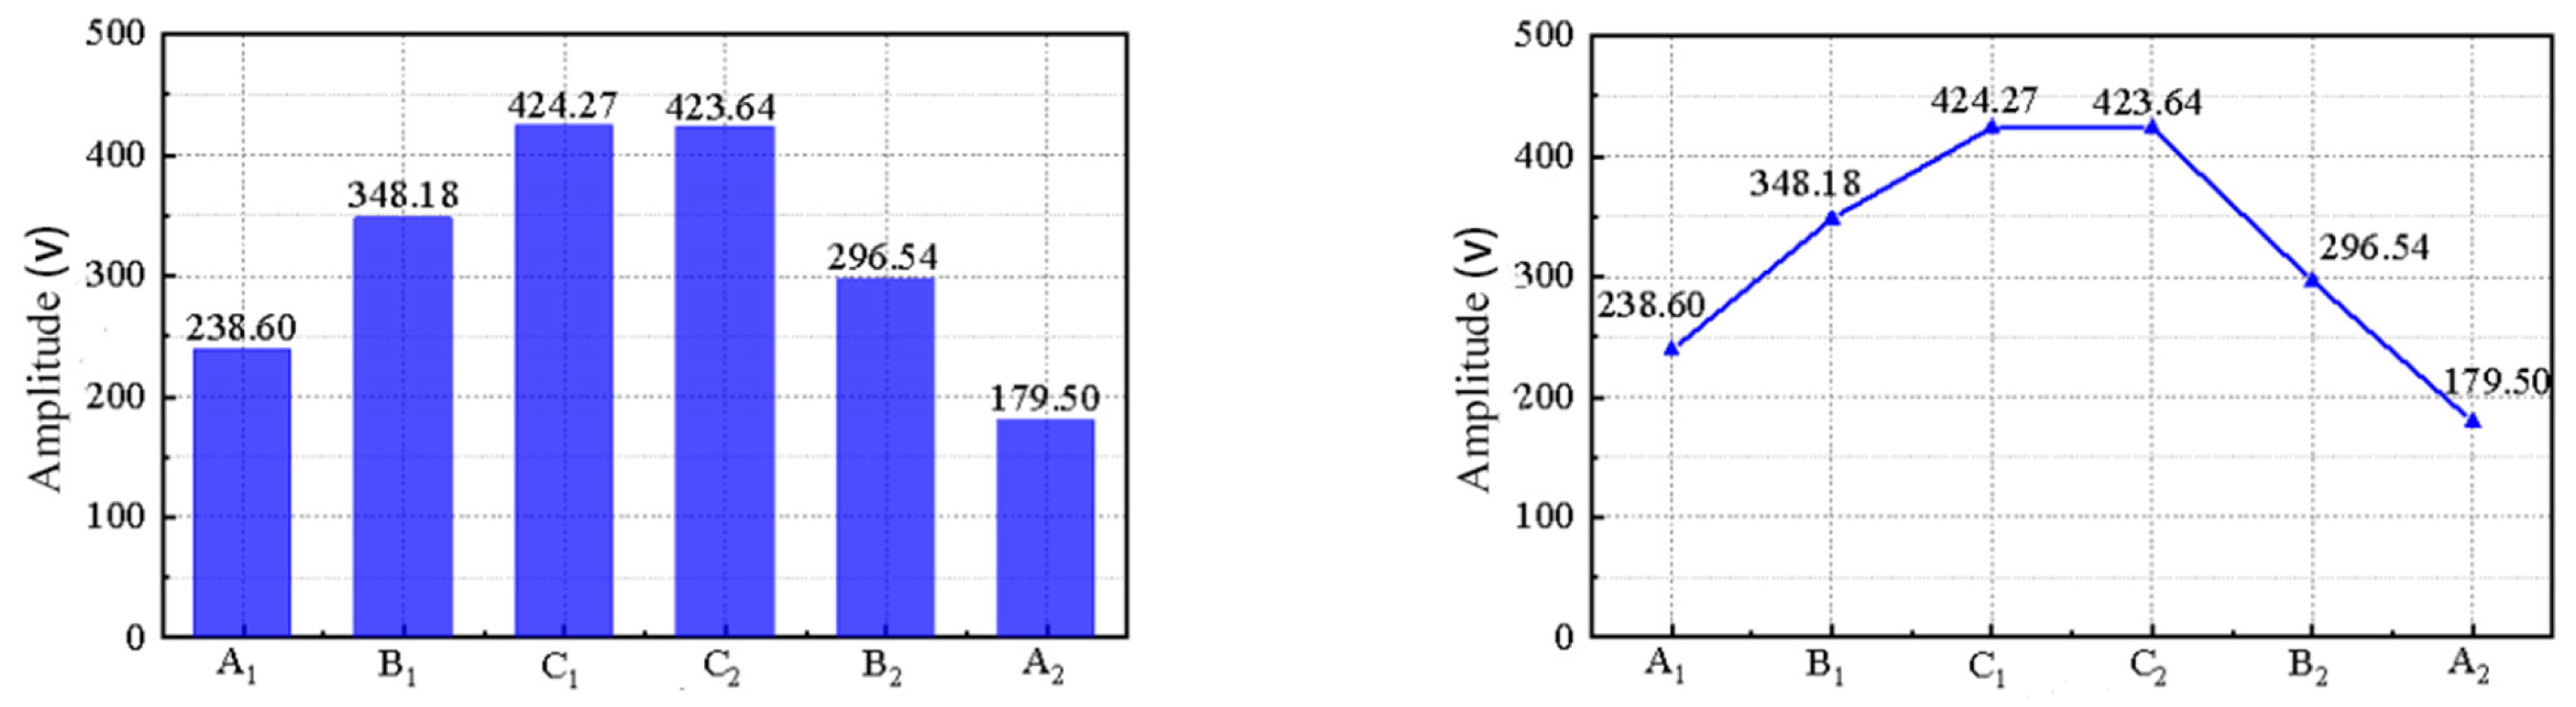
  • Structural height and width: The height and width of the structure have minimal impact on the peak period and occurrence time of the focused main lobe. However, as the structure size increases, the energy loss of Lamb waves propagating in the structure also increases. The energy loss caused by an increase in structure height is greater than that caused by an increase in structure width.
  • Multi−row grouting sleeve: In the embedded state of multi−row grouting sleeves, Lamb waves are constantly reflected up and down between the left and right sleeves. Only the sleeves on the left and right sides consume energy, resulting in a minimum anti−focus peak in the state without damage.
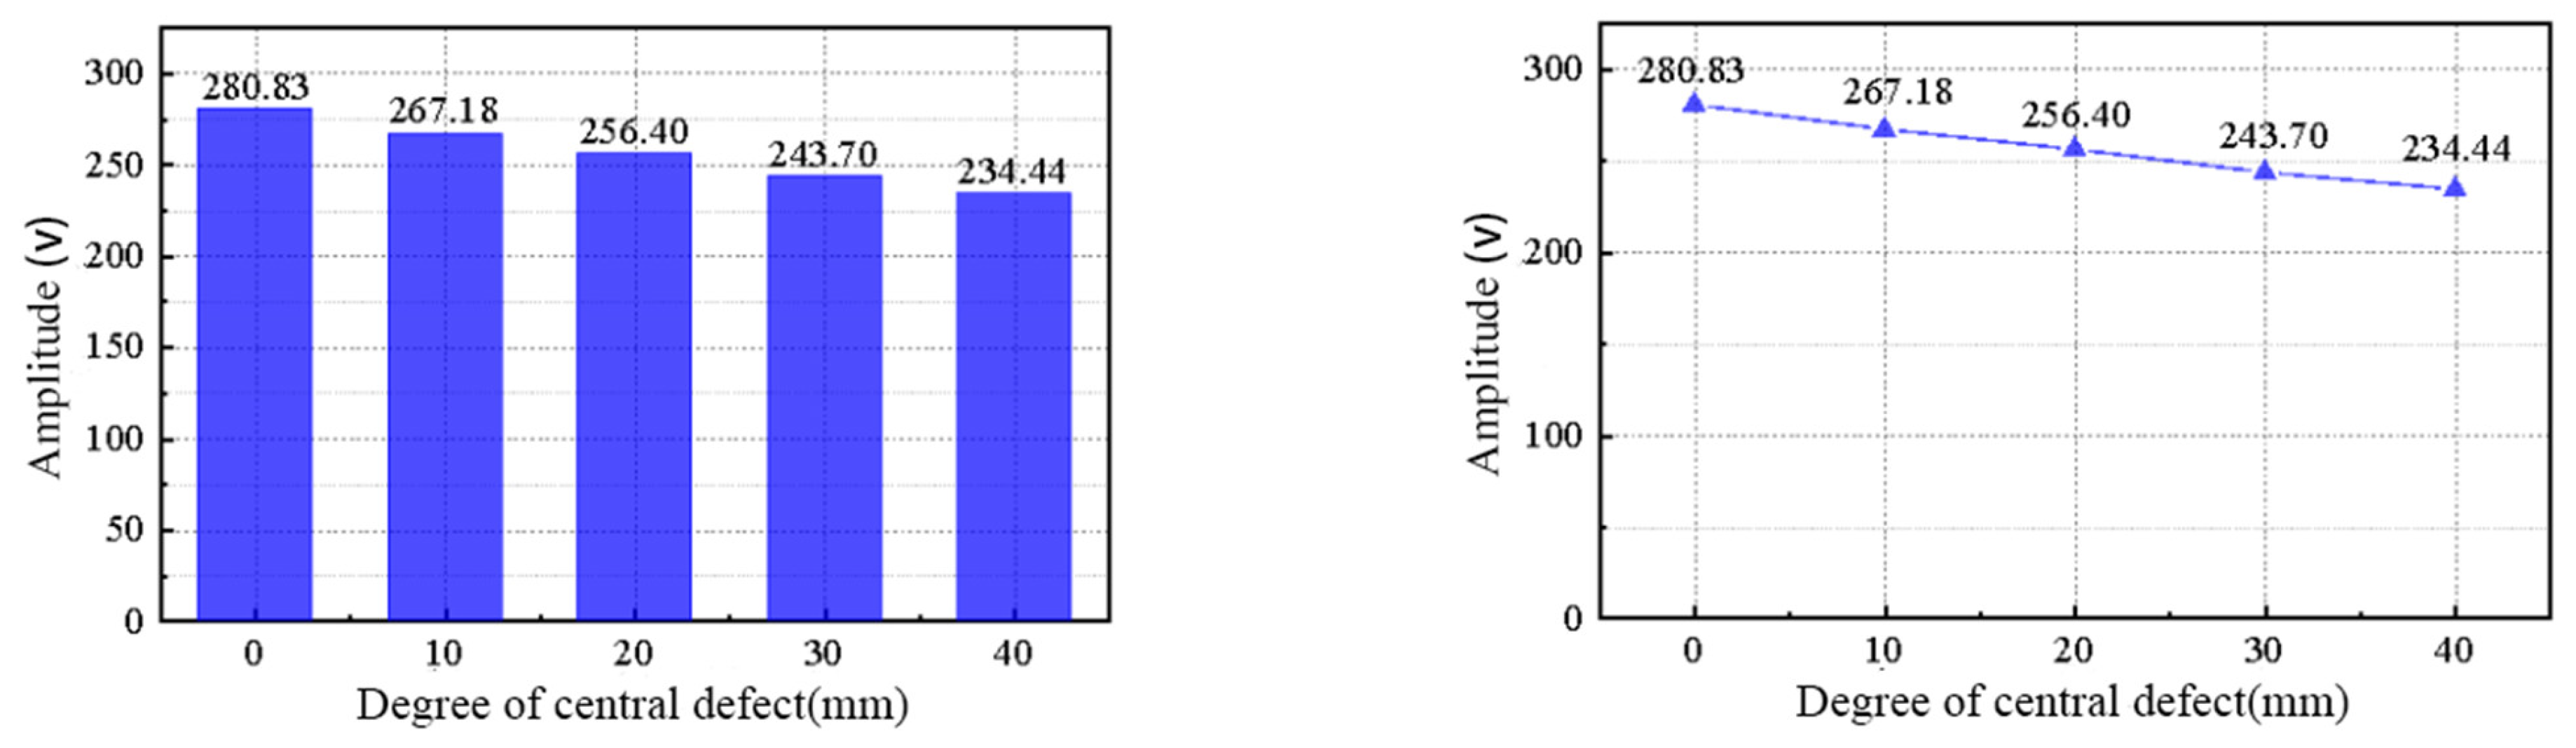
  • Middle defect width: The width of the middle defect in the grouting sleeve directly affects the peak focus of the extracted and received signal. As the defect width increases, the peak focus decreases linearly. The Lamb−wave−based time reversal method can effectively detect defects and quantitatively judge their severity.
In conclusion, the Lamb−wave−based time reversal method remains effective in detecting defects in the case of multi−row cloth and multiple−sleeve connections in the embedded state. It can accurately identify and characterize defects, making it a valuable tool for structural health monitoring and defect detection in practical engineering applications.

6.2.3. Arrangement of Half−Grouting

The excitation signal of cycle 4 at a center frequency of 15 kHz is input from the excitation end of the time reversal method. Finally, the peak of the main valve is focused on the end of the secondary receiver of the model, and the data are drawn into a bar chart and a line chart, as shown in Figure 19.
The analysis of Figure 19 provides several important insights into the effectiveness of the Lamb−wave−based time reversal method in detecting defects in the top region of semi−grouting sleeves:
  • Structural changes: Changes in the semi−grouting sleeve structure do not impact the peak period and appearance time of the focused main lobe. The Lamb−wave−based time reversal method remains consistent and reliable despite variations in the sleeve structure.
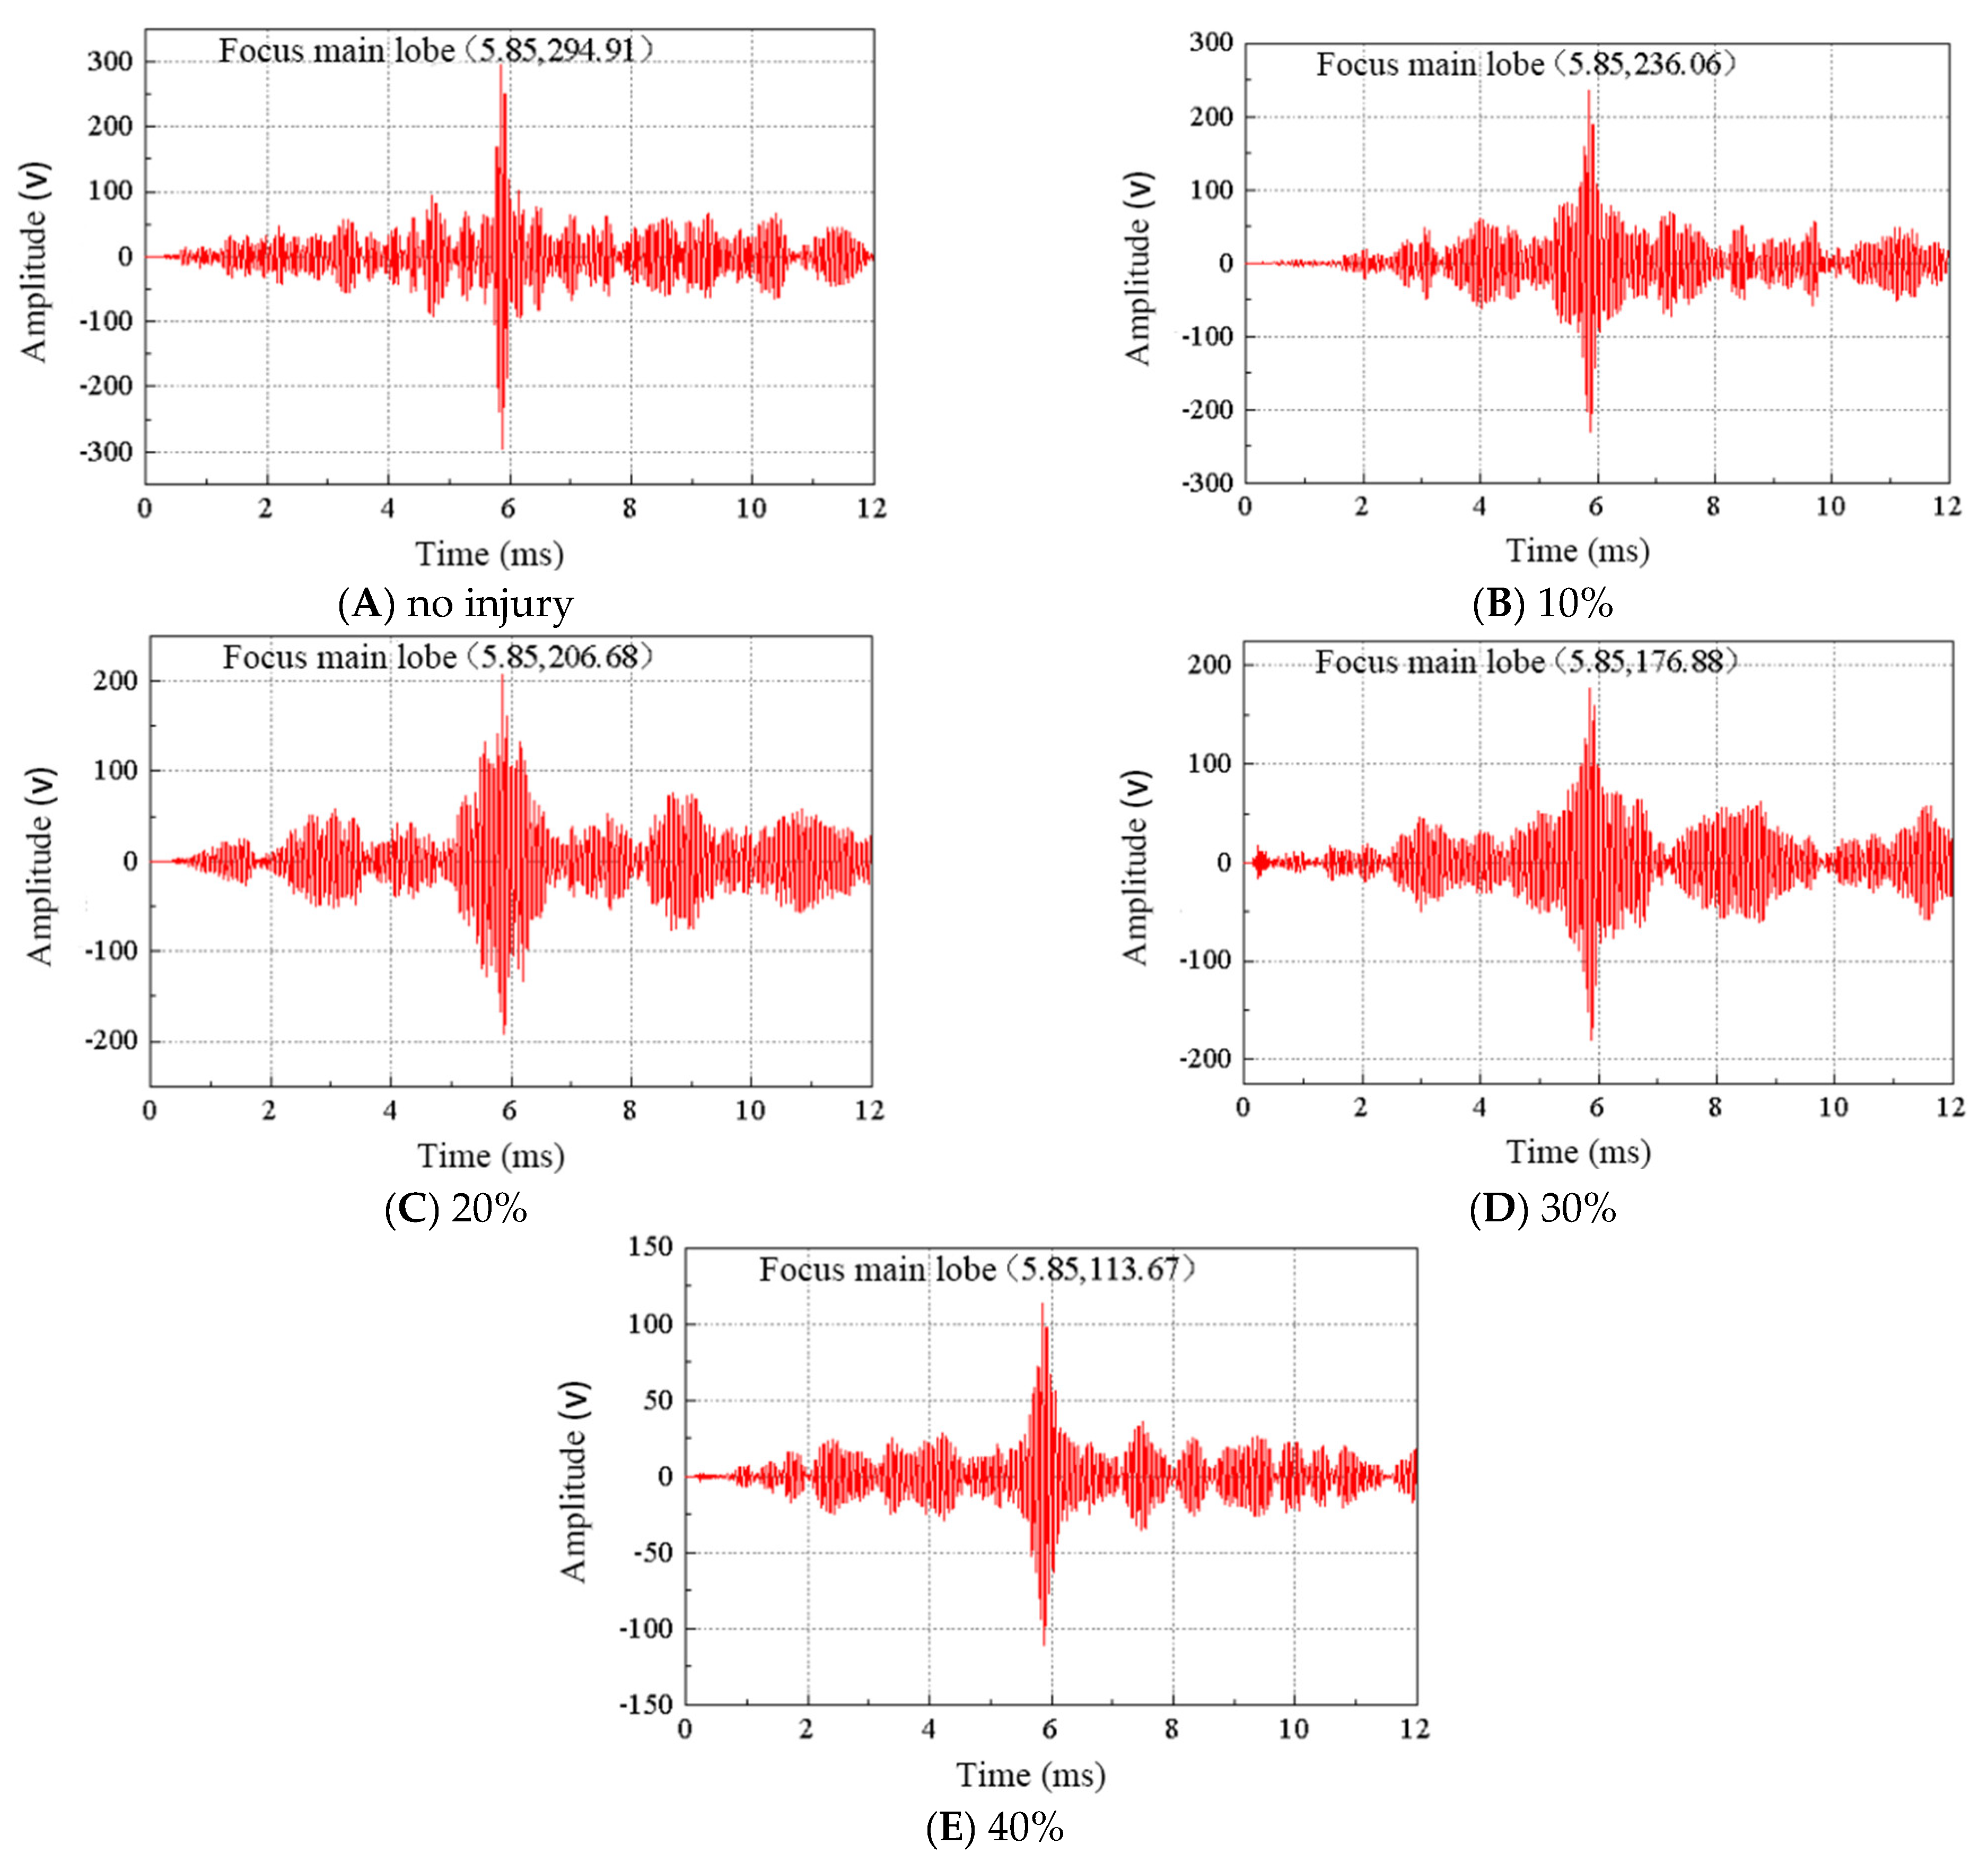
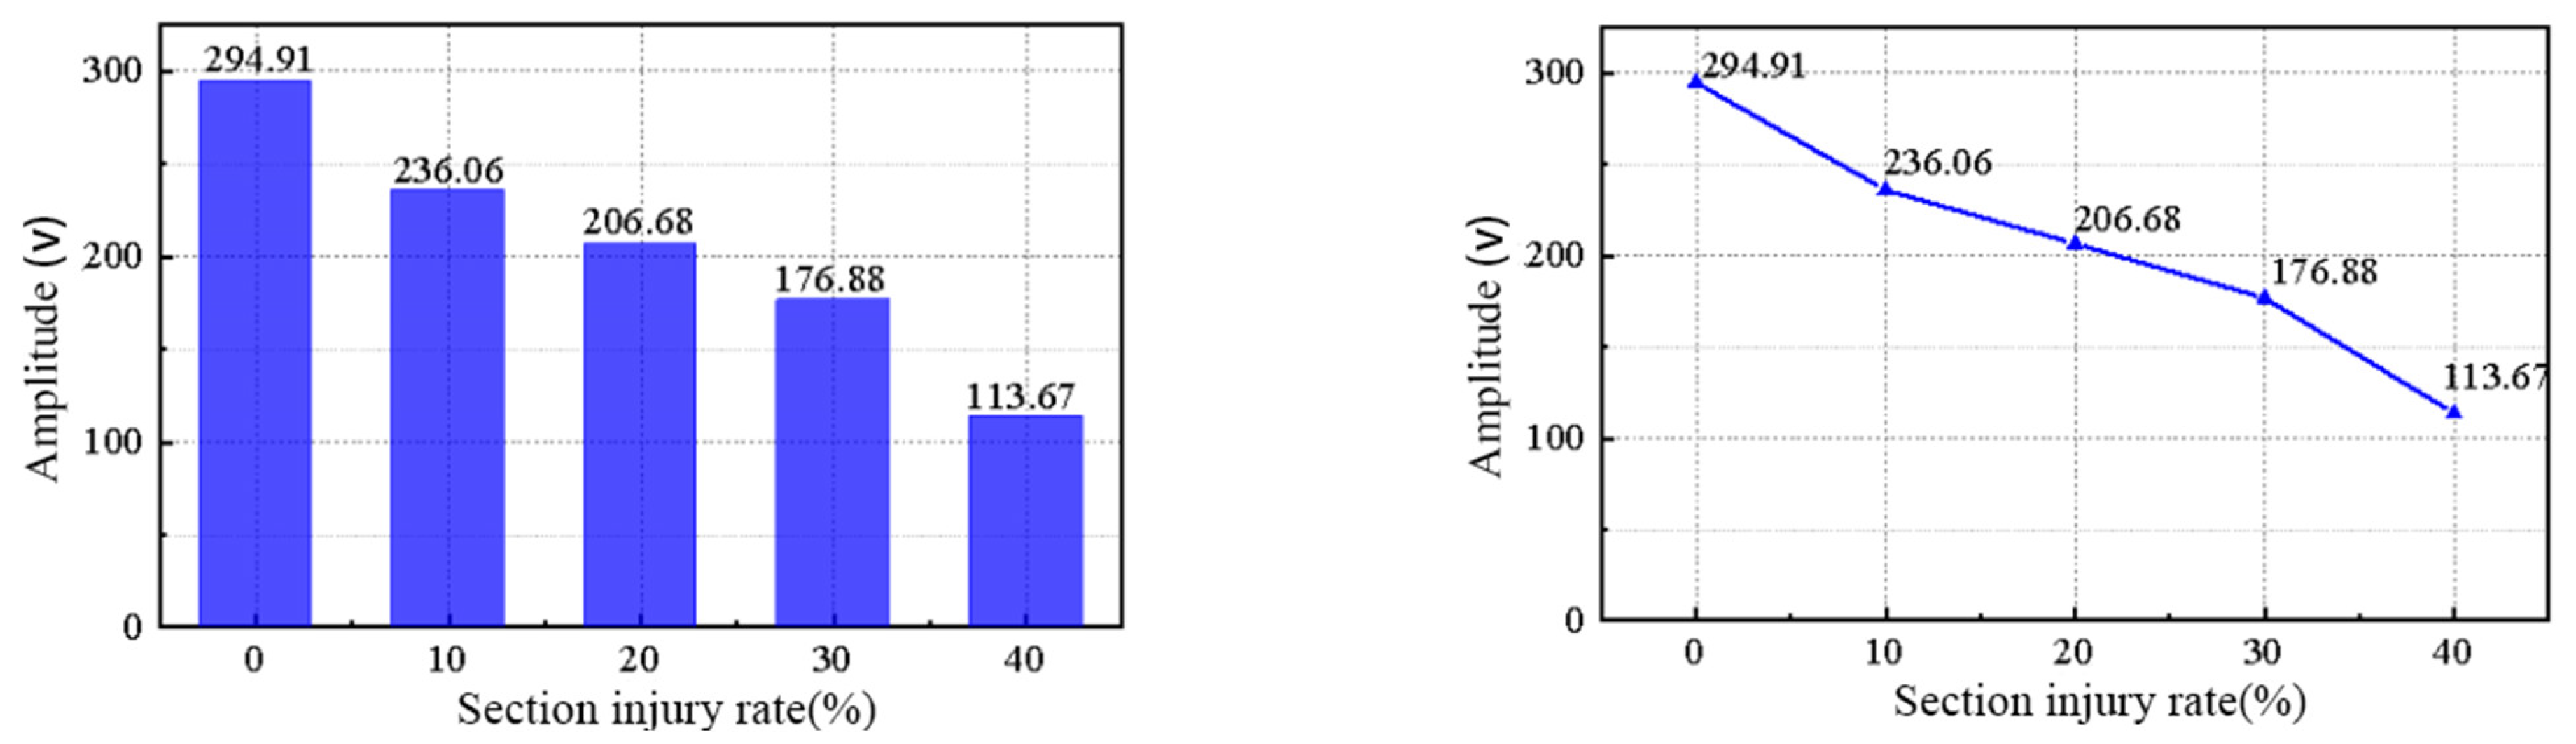
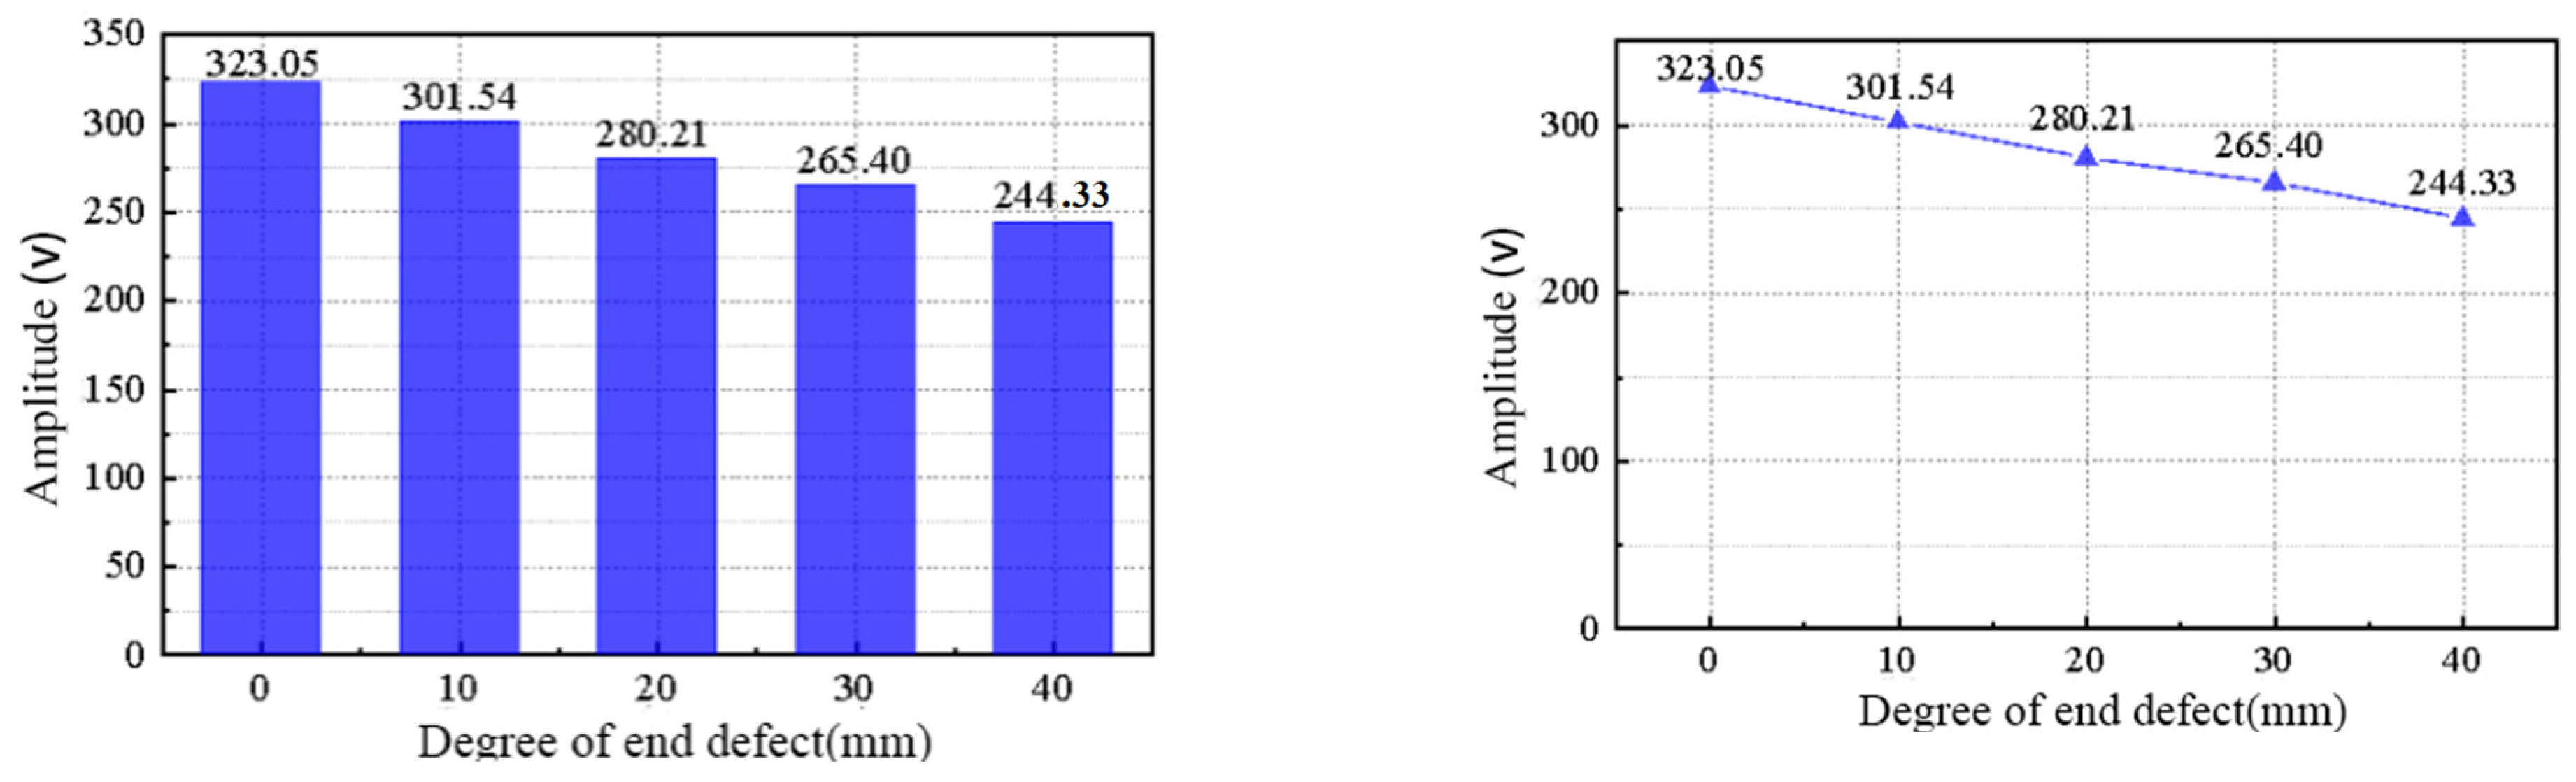
  • Defect width: As the width of the top defects in the semi−grouting sleeve increases, the corresponding focus peak continuously decreases. The decrease in peak amplitude is roughly linear with the increase in defect width. This linear relationship allows for quantitative judgment of the severity of defects based on the time anti−focus peak.
  • Detection effect: The Lamb−wave−based time reversal method shows a good detection effect on the top defects of the half−grouting sleeve. It can effectively detect vacancy defects at the top, steel offset, and horizontal grouting defects.
  • Limitation: Due to the asymmetric structure of the half−grouting sleeve, defects cannot be accurately located using symmetric spot arrangements multiple times. This limitation should be considered when applying the method to half−grouting sleeve connections.
  • However, in theory, there is a way to locate the semi−grouting sleeve. According to the conclusion of our paper, the full grouting sleeve can be divided into two identical structures, one half of which has no defects and the other half has defects. By arranging multiple measuring points to form several detection areas, the damage location is determined by comparing the peak difference between the two symmetrical structural areas. If it is a semi−grout sleeve, the damage location can be determined by comparing the two semi−grout sleeves. Specifically, two semi−grout sleeves are set up: one half−grout sleeve is set with defects inside, and the other half−grout sleeve has no damage inside. The two sleeves are arranged at the same size position and divided into the same detection areas. The damage location is determined by comparing the difference between the peaks of the two sleeves in the same area.
Overall, the Lamb−wave−based time reversal method is proven to be effective in detecting defects in the top region of semi−grouting sleeves. It provides a quantitative approach to evaluating the severity of defects and offers valuable insights for structural health monitoring and defect detection in practical engineering applications.

7. Conclusions

The findings presented in this paper demonstrate the effectiveness of the Lamb waves nondestructive detection technology and the time reversal method in detecting and locating internal defects in different types of grouting sleeves. The key conclusions drawn from this study are as follows:
  • Detection of single−row grouting sleeve: The Lamb−wave−based time reversal method is capable of effectively identifying the severity of damage in single−row grouting sleeves with different horizontal emptying defects. Larger defects result in smaller signal focus amplitudes extracted at the receiving end, providing a reliable means of detecting and evaluating the damage in embedded grouting sleeves.
  • Detection of multi−row grouting sleeve: In the case of embedded multi−row cloth and multiple grouting sleeves, the Lamb−wave−based time reversal method can successfully detect and quantify the middle void defects of varying severity. The increase in structure height causes energy loss in Lamb wave transmission, but it does not significantly affect the overall detection results.
  • Defect localization: By arranging symmetrical measuring points on both sides of the full grouting sleeve and comparing the reverse focus peaks, the general area of the defect can be located. Increasing the number of measuring points on both sides enhances the accuracy of defect localization, bringing the final positioning closer to the actual defect location.
  • Semi−grouting sleeve detection: The Lamb−wave−based time reversal method remains effective in detecting defects, such as internal vacancy defects and reinforcement deviation, in semi−grouting sleeves. However, due to the asymmetric structure of the semi−grouting sleeve, defect positions cannot be accurately located by arranging multiple symmetric measuring points.
In conclusion, the Lamb−wave−based time reversal method proves to be a versatile and reliable approach for nondestructive defect detection and evaluation in various types of grouting sleeves. The method’s ability to accurately assess the severity of damage and simulation experiments confirm that the method is theoretically feasible.

Author Contributions

Conceptualization, W.L.; methodology, W.L.; writing—original draft preparation, W.L., S.C. and H.W.; data curation, S.C.; data detection, H.W.; finite element simulations and experiments, H.W.; supervision, X.L. and J.H.; writing—review and editing, R.W. All authors have read and agreed to the published version of the manuscript.

Funding

This research was funded by the National Natural Science Foundation of China (No. 51878181), the Natural Science Foundation of Fujian Province (Nos. 2021J01602, 2018J01773), and the Science and Technology Plan Projects in the Housing and Urban–Rural Construction Industry of Fujian Province in 2022 (No. 2022-K-219).

Data Availability Statement

Data is contained within the article.

Conflicts of Interest

Author Xin Lin was employed by the Haixia Construction Group Co., Ltd. Author Jintu Huang was employed by the Zhongjian Litian Group Co., Ltd. Author Rong Wang was employed by the Zhongsheng Huaxin Group Co., Ltd. The remaining authors declare that the research was conducted in the absence of any commercial or financial relationships that could be construed as a potential conflict of interest.

References

  1. Quaegebeur, N.; Ostiguy, P.C.; Masson, P. Correlation−based imaging technique for fatigue monitoring of riveted lap−joint structure. Smart Mater. Struct. 2014, 23, 055007. [Google Scholar] [CrossRef]
  2. Colin, H.; Michael, T. Enhanced damage localization for complex structures through statistical modeling and sensor fusion. Mech. Syst. Signal Process. 2015, 54–55, 195–209. [Google Scholar] [CrossRef]
  3. Kudela, P.; Radzienski, M.; Ostachowicz, W.; Yang, Z. Structural health monitoring system based on a concept of Lamb wave focusing by the piezoelectric array. Mech. Syst. Signal Process. 2018, 108, 21–32. [Google Scholar] [CrossRef]
  4. Nerio, T.; Fabio, M. Grouted sleeve connections used in precast reinforced concrete construction—Experimental investigation of a column−to−column joint. Eng. Struct. 2016, 127, 784–803. [Google Scholar] [CrossRef]
  5. Zhuang, Z.Y. Application of prefabricated building sleeve grouting technology in the construction of house construction engineering. Constr. Technol. 2022, 463, 64–67. [Google Scholar] [CrossRef]
  6. Golub, M.V.; Fomenko, S.I.; Shpak, A.N.; Gu, Y.; Wang, Y.; Zhang, C. Semi−analytical hybrid approach for modelling smart structures and guided wave−based SHM systems for a laminate with multip−le delaminations and surface−mounted inhomogeneities. Appl. Math. Model. 2023, 120, 812–832. [Google Scholar] [CrossRef]
  7. Abbas, M.; Shafiee, M. Structural Health Monitoring (SHM) and Determination of Surface Defects in Large Metallic Structures using Ultrasonic Guided Waves. Sensors 2018, 18, 3958. [Google Scholar] [CrossRef]
  8. El Mountassir, M.; Yaacoubi, S.; Mourot, G.; Maquin, D. An adaptive PCA−based method for more reliable ultrasonic guided waves SHM: Data−driven modeling and experimental validation in high attenuating medium. Struct. Control Health Monit. 2020, 28, e2634. [Google Scholar] [CrossRef]
  9. Cantero−Chinchilla, S.; Chiachío, J.; Chiachío, M.; Chronopoulos, D.; Jones, A. A robust Bayesian methodology for damage localization in plate−like structures using ultrasonic guidedwaves. Mech. Syst. Signal Process. 2018, 122, 192–205. [Google Scholar] [CrossRef]
  10. Kim, D.; Choi, M.; Han, S.; Jeong, J. Determination of Partial Depth Repair Size for Spalling of Jointed Concrete Pavements Using the Impact Echo Method. Sustainability 2022, 14, 8143. [Google Scholar] [CrossRef]
  11. Bahati, P.A.; Le, V.D.; Lim, Y.J. An impact echo method to detect cavities between railway track slabs and soil foundation. J. Eng. Appl. Sci. 2021, 68, 7. [Google Scholar] [CrossRef]
  12. Zhang, J.; Huang, Y.; Song, L.-P.; Liu, Q.-H. Fast and accurate 3−D ray tracing using bilinear traveltime interpolation and the wave front group marching. Geophys. J. Int. 2011, 184, 1327–1340. [Google Scholar] [CrossRef]
  13. Raghavan, A.; Cesnik, C.E.S. Finite−dimensional piezoelectric transducer modeling for guided wave based structural health monitoring. Smart Mater. Struct. 2005, 14, 1448–1461. [Google Scholar] [CrossRef]
  14. Montinaro, N.; Cerniglia, D.; Pitarresi, G. Evaluation of interlaminar delaminations in titanium−graphite fibre metal laminates by infrared NDT techniques. NDT E Int. 2018, 98, 134–164. [Google Scholar] [CrossRef]
  15. Yee, A.; Eng, H.D. Structural and economic benefits of precast/prestressed concrete construction. PCI J. 2001, 46, 34–43. [Google Scholar] [CrossRef]
  16. Baggens, O.; Ryden, N. Poisson’s ratio from polarization of acoustic zero−group velocity Lamb mode. J. Acoust. Soc. Am. 2015, 138, 88–92. [Google Scholar] [CrossRef]
  17. Xu, X.; Zhang, F.; Li, Y.F. Damage classification and localization in plates based on improved full−focused imaging with nonlinear Lamb waves. J. Nanjing Univ. 2022, 58, 894–903. [Google Scholar] [CrossRef]
  18. Jonas, K.R.; Justina, S.; Egidijus, Z. Numerical Investigation of Excitation of Vario−us Lamb Waves Modes in Thin Plastic Films. Appl. Sci. 2022, 12, 849. [Google Scholar] [CrossRef]
  19. Hu, Y. Quality Detection of Grouting Sleeve Connection Based on Lamb Wave Time Inversion Method. Master’s Thesis, Fuzhou University, Fuzhou, China, 2021. [Google Scholar] [CrossRef]
  20. Lamb, H. On Waves in an Elastic Plate Review of Vibration−based Helicopters Health and Usage Monitoring Methods. Proc. R. Soc. 1917, 93, 114–128. [Google Scholar] [CrossRef]
  21. Munian, R.K.; Mahapatra, D.R.; Gopalakrishnan, S. Lamb wave interaction with composite delamination. Compos. Struct. 2018, 206, 484–498. [Google Scholar] [CrossRef]
  22. Jayant, S. Fundamental Understanding of Piezoelectric Strain Sensors. J. Intell. Mater. Syst. Struct. 2000, 11, 246–257. [Google Scholar] [CrossRef]
  23. JGJ 1−2014; Technical Specification for Assembled Concrete Structure. China Architecture and Building Press: Beijing, China, 2014. (In Chinese)
Figure 1. Schematic representation of the interaction model between Lamb waves and structural defects.
Buildings 13 02824 g001
Figure 2. Model of single−row grouting sleeve in embedded state.
Buildings 13 02824 g002
Figure 3. Model of multi−row grouting sleeve in embedded state.
Buildings 13 02824 g003
Figure 4. Model of single−arranged semi−grouting sleeve in embedded state.
Buildings 13 02824 g004
Figure 5. Defect injury model of each type.
Buildings 13 02824 g005
Figure 6. Diagrams of time−domain signals at different frequencies under cycle 4.
Buildings 13 02824 g006
Figure 7. Comparison of peak at different frequency values during cycle 4 in injury state.
Buildings 13 02824 g007
Figure 8. Time−domain signal maps at 15 kHz for different cycles.
Buildings 13 02824 g008
Figure 9. Comparison of peak for different numbers of cycles in the injury condition.
Buildings 13 02824 g009
Figure 10. Arrangement of model and external concrete surface measuring points.
Buildings 13 02824 g010
Figure 11. Time−domain signal diagrams extracted at the receiving end of each measuring area.
Buildings 13 02824 g011
Figure 12. The peak relationship of the main lobe in different measurement areas.
Buildings 13 02824 g012
Figure 13. The phase velocity of Lamb waves inside the grouting sleeve.
Buildings 13 02824 g013
Figure 14. The group velocity of Lamb waves inside the grouting sleeve.
Buildings 13 02824 g014
Figure 15. Schematic diagrams of top defects of half−grouting sleeves with different widths.
Buildings 13 02824 g015
Figure 16. Time−domain signal diagrams at different cross−sectional damage rates.
Buildings 13 02824 g016
Figure 17. The time−domain signal focused on the main valve peak.
Buildings 13 02824 g017
Figure 18. The time−domain signal focused on the main valve peak.
Buildings 13 02824 g018
Figure 19. Focusing on the time−domain signal of the main valve peak.
Buildings 13 02824 g019
Table 1. Material attribute parameters of the grouting sleeve.
MaterialE (MPa)ρ (kg/m3)Poisson Ratio υ
Cement33,00024000.2
Cast iron sleeve150,00075000.25
Connected bar20,00070000.2
External concrete31,00025000.2
Table 2. Model dimensions of ductile iron semi−grouting sleeve (mm).
ModelSteel Bar DiameterThe Outer Diameter of the SleeveWall ThicknessThe Depth of Rebar InsertionThreaded Hole Diameter
GTZ B4−36C3671628830
Table 3. Material attribute parameters of the grouting sleeve.
MaterialE (MPa)ρ (kg/m3)Poisson Ratio υ
cement33,00024000.2
Cast iron sleeve150,00075000.25
connected bar14,00070000.2
External concrete31,00025000.2
Table 4. Horizontal void defect parameters.
Working Condition NumberGrout Material Diameter (mm)Defect Width (mm)Defect Depth (mm)Grout Section
Damage Ratio
162000
2626301010%
3626301620%
4626302130%
5626302640%
Table 5. Detailed table of vacancy defects in the middle part.
Working Condition NumberDefect Width (mm)Defect Depth (mm)Empty Position
10621/2 Equal
210621/2 Equal
320621/2 Equal
430621/2 Equal
540621/2 Equal
Table 6. Detailed table of empty defects at the top.
Working Condition NumberDefect Width (mm)Defect Depth (mm)Empty Position
1065Top of sleeve
21065Top of sleeve
32065Top of sleeve
43065Top of sleeve
54065Top of sleeve
Disclaimer/Publisher’s Note: The statements, opinions and data contained in all publications are solely those of the individual author(s) and contributor(s) and not of MDPI and/or the editor(s). MDPI and/or the editor(s) disclaim responsibility for any injury to people or property resulting from any ideas, methods, instructions or products referred to in the content.

