1. Introduction
The evaluation of risk maps at a large scale is a challenging and crucial task to define effective mitigation policies and to correctly predict potential future losses. Within the activities of the ReLUIS (Network of the University Laboratories of Seismic Engineering) consortium, which operates as a competence centre of the Department of Civil Protection (DPC), special care has been devoted in these years to the development of fragility and loss functions for the risk assessment of residential and portfolio buildings. In particular, the 2019–2021 research project, Work Package, WP4 “Seismic Risk and Damage Maps at National scale—MARS”, involved the achievement of significant progresses on these crucial topics. The goal was to update the results presented in the 2018 version of the National Risk Assessment (NRA) [
1]. Task 4.4—“Risk: evaluation of consequences and economic losses” specifically focussed on the definition of tools and functions to predict direct and indirect losses due to seismic actions. Establishing empirical fragility curves to predict the usability of the buildings for a large-scale evaluation was another goal of the study. The Italian classification used to assess the usability of the buildings is based on the post-earthquake damage and safety assessment and short-term countermeasures survey form, named the AeDES survey form [
2]. In 2014 it was officially adopted by the Italian Civil Protection department for post-earthquake emergency management. According to the AeDES form, the building can be rated (i) A—usable; (ii) B temporarily unusable (partially or totally) but usable after short-term countermeasures; (iii) C—partially unusable; (iv) D—temporarily unusable, requiring a more detailed investigation; (v) E—unusable; (vi) F—unusable due to external risk. The usability assessment is of paramount importance for the management of the reconstruction process and for a quick preliminary estimation of the number of people needing assistance. Thus, the studies herein reported focused on the definition of consequence function to correlate usability rating and costs in terms of both the repair costs of buildings and costs for population assistance (i.e., direct and indirect costs). However, the strong effort of the scientific community to derive fragility curves in terms of the probability of achieving a certain global damage state, DS (based on an empirical approach, [
3,
4,
5,
6,
7,
8] or theoretical modelling, [
9,
10,
11,
12]), strongly required the analysis of proper functions able to associate costs with DSs. The relationships between DSs and repair costs have been defined by using data on residential buildings damaged by 2009 L’Aquila earthquake [
13,
14] and are discussed in the following. Furthermore, indirect costs in the form of assistance to populations [
15] have also been analysed and discussed in the following.
The aim of the study is the definition of loss functions for assessing earthquake impact in terms of both economic and social losses at large scale. They are calibrated with reference to residential buildings and can be adopted for risk analysis purposes. They can be used once key parameters derived from an exposure database (i.e., a census) are available. The intensity measure for the risk assessment is expressed in terms of peak ground acceleration (PGA).
To this aim, the following sections involve: (i) a critical analysis of available casualties models, including an evaluation of the main factors (e.g., damage levels, occupancy rate, building type etc.) affecting Casualty Estimation Models (CEMs) as well as new proposals to refine existing models; (ii) development of fragility curves for the prediction of buildings’ usability, a parameter strongly affecting reconstruction costs and time; (iii) the definition of consequence functions to correlate buildings’ usability or damage state with direct or indirect losses (i.e., repair costs and costs for population assistance).
2. Casualties Estimation
In the framework of seismic risk assessment, human casualty estimation is one of the most important tasks since its results could be used in planning civil protection activities as well as for relief and medical agencies to increase preparedness measures and emergency planning.
The reliability of the available models adopted to estimate casualties depends on a large number of factors involving vulnerability (e.g., structural type), exposure (e.g., the population living in different building types), hazard (e.g., earthquake intensity) and the effectiveness of emergency systems. Furthermore, although casualties are primarily related to building damage [
16], other causes can also determine consequences in terms of deaths and injured, among these infrastructure failures, triggered secondary effects, panic etc.
Despite the numerous factors involved and the associated uncertainties, in the past years a large research effort was devoted to assessing human casualties (e.g., [
17]). In the context of the MARS project, Task 4.4 aimed at analysing and updating loss models to estimate human casualties. Firstly, an extensive literature review of the principal models available in the literature to estimate the expected consequences [
16,
18,
19,
20,
21,
22]) has been carried out, and the main factors involved in the Casualty Estimation Models (CEMs) have been analysed and discussed. Furthermore, to investigate the influence of each factor introduced in the considered CEMs, loss scenarios based on the data related to two fatal earthquakes (1980 Irpinia-Basilicata and 2009 L’Aquila) have been defined. To this purpose, the post-earthquake surveys dataset, Da.D.O. (Database of Observed Damage, [
23]), has been used.
Significant differences have arisen from the comparison between the results obtained from the considered CEMs and the actual data (in terms of deaths), mainly due to factors involved in each CEM. Specifically, the model adopted in the 2018 NRA [
22,
23] does not consider differences in the rate of deaths depending on the construction material. Indeed, the damage and collapse mechanisms in masonry and RC buildings are quite different, and this may influence the expected number of casualties [
19].
Furthermore, the occupancy at the time of the event is not explicitly considered in the estimation, but it is implicitly included in the casualty rates.
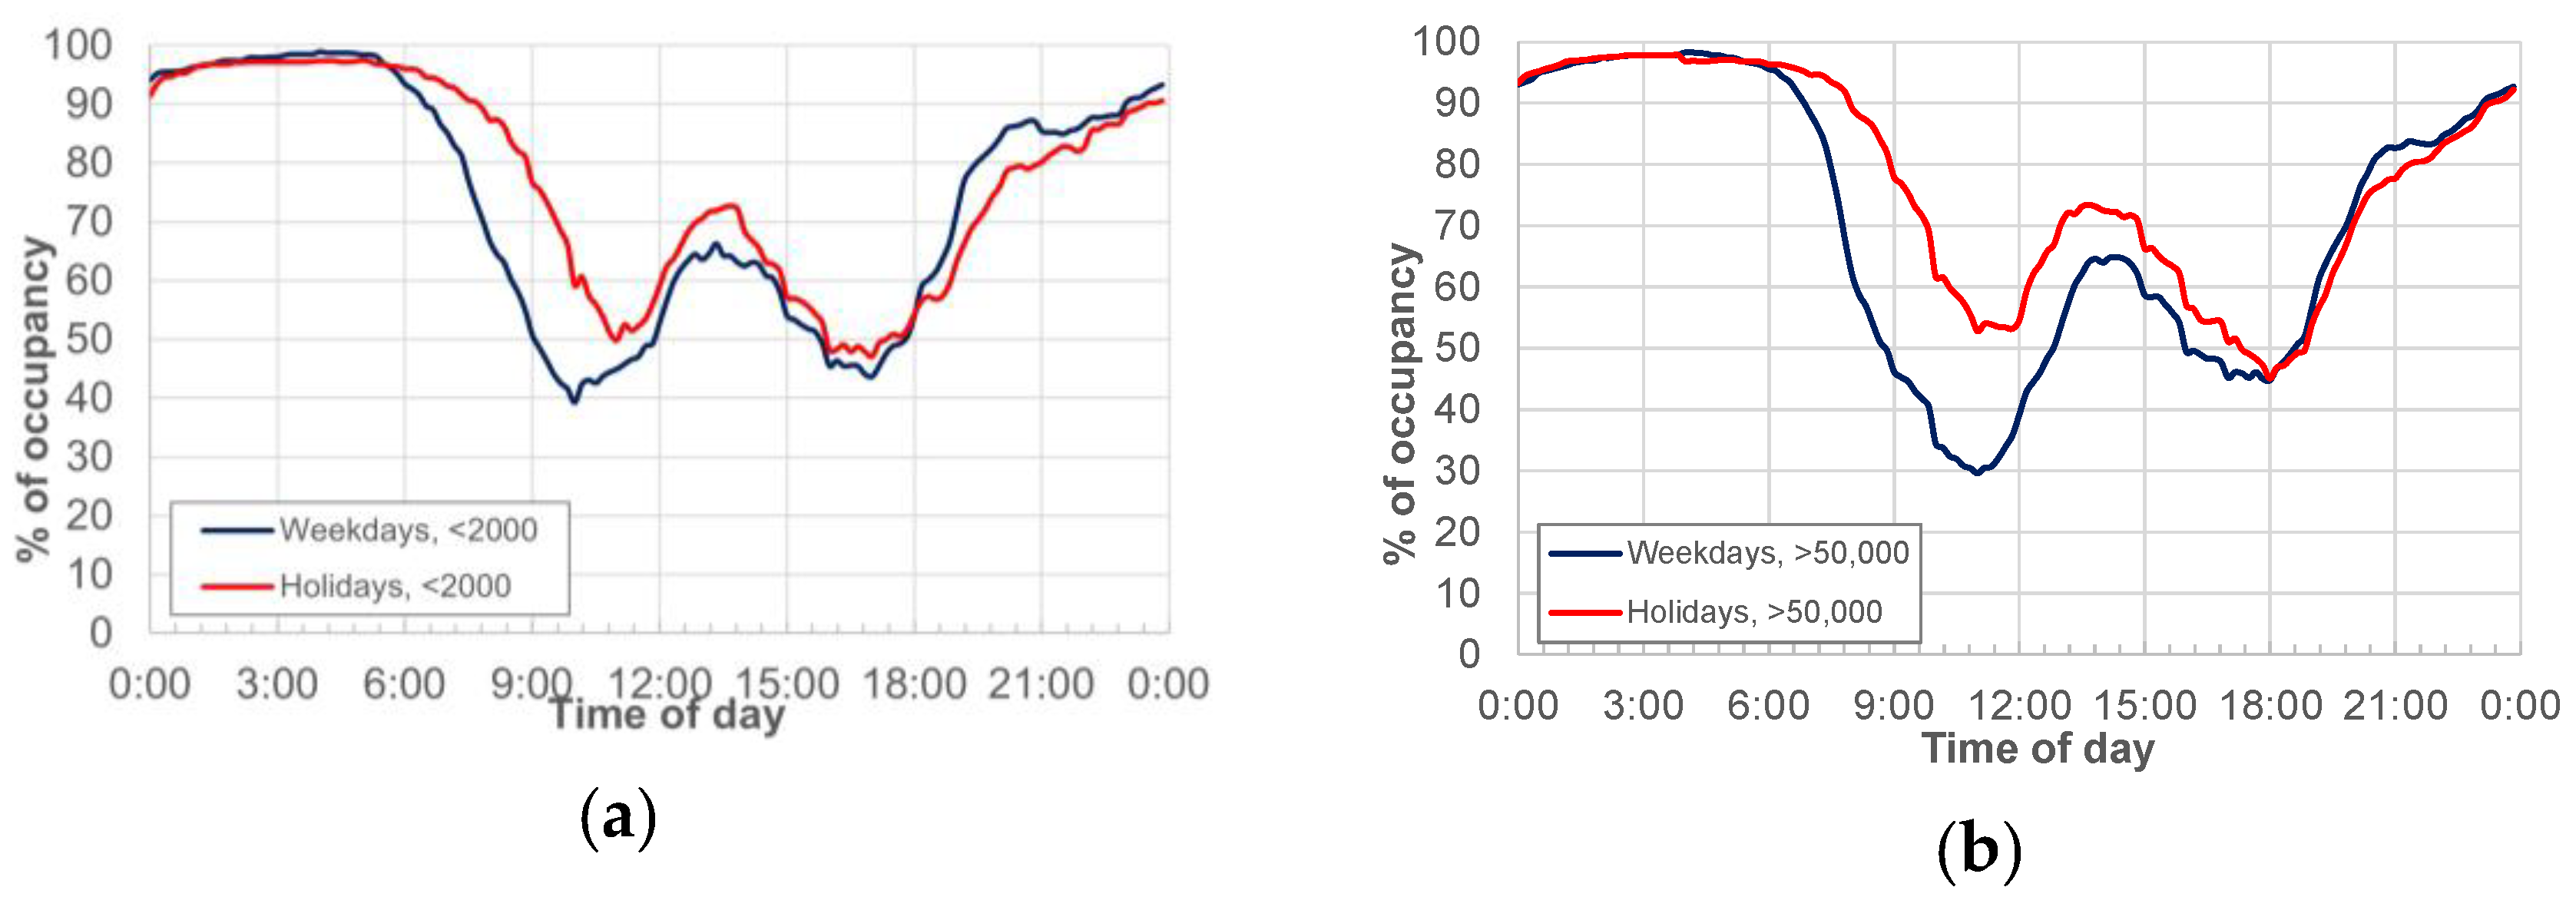
Therefore, to update the model considered in the future national risk assessment, two main factors have been proposed, namely construction material and occupancy at the time of the earthquake. More specifically, starting from the model adopted in the 2018 NRA to estimate human casualties (i.e., injuries and deaths), it could be improved by explicitly introducing in the above-mentioned expression the percentage of people living inside residential buildings. Further, by keeping in mind that collapse mechanisms (and then the possible consequences for occupants) differ as a function of the adopted construction material, in the new model the percentages of expected human causalities could be separately provided for masonry and reinforced concrete buildings. As for the occupancy at the time of the earthquake, the data of the National Institute of Statistics [
24]; investigation “daily life and citizen opinions”), which refer to whole of Italy, have been extrapolated and analysed to define specific curves related to the typical occupancy of residential buildings. The occupancy data of residential buildings during weekdays (related to a generic day) and holidays (associated with Sunday data) have been considered. According to the ISTAT classification, the municipalities are divided into four population classes by number of inhabitants: <2000; 2000–10,000; 10,000–50,000 and >50,000. As an example, based on the analysis of the ISTAT data,
Figure 1 shows the curves related to the typical occupancy of residential buildings on weekdays and holidays for two classes (<2000 and >50,000).
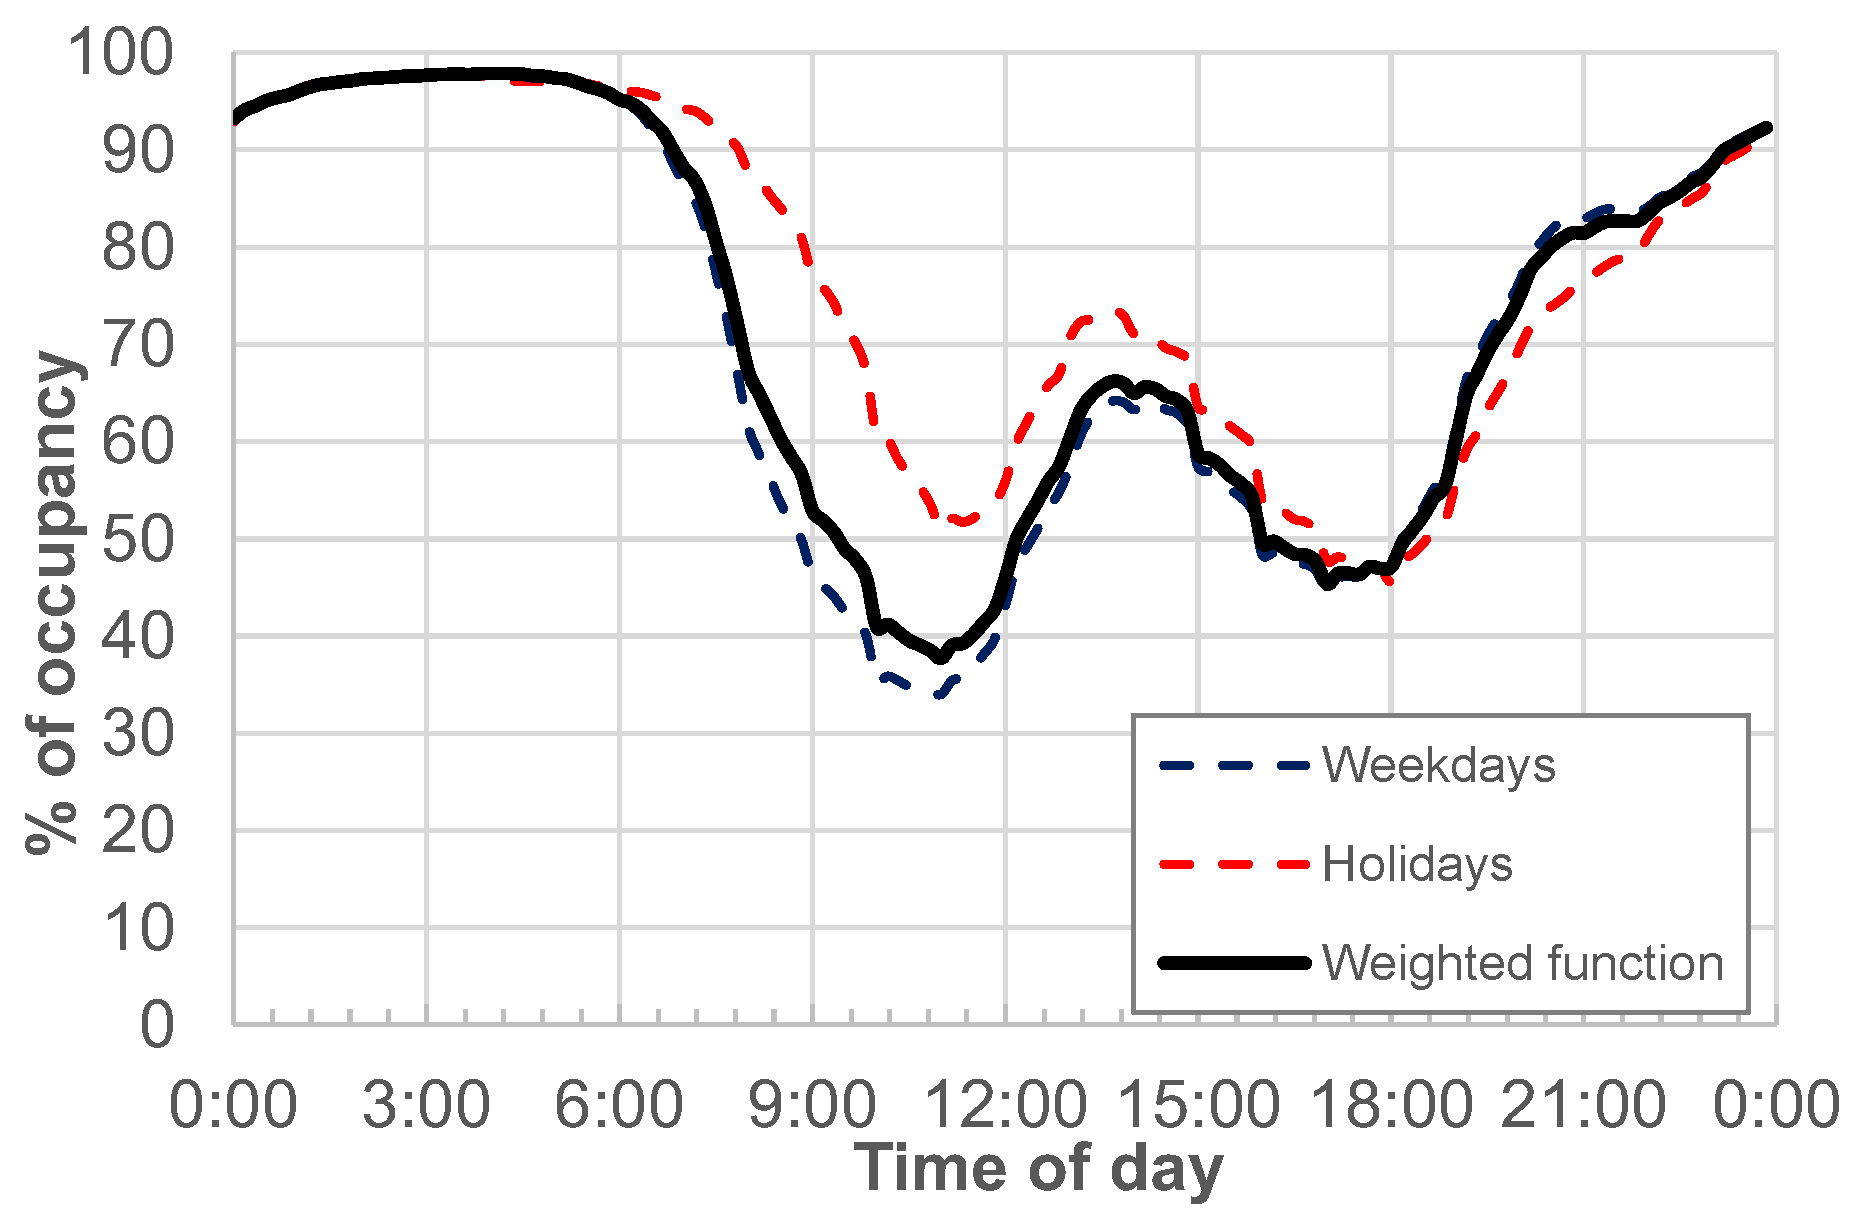
Starting from the data reported above, a weighted curve of the occupancy rate at the time of the earthquake has been defined.
Figure 2 shows the curves obtained as a weighted average on the distribution of the Italian population based on the classification of municipalities in terms of number of inhabitants (see
Table 1) derived directly from the IRMA platform (Borzi et al., 2021 [
25]). In addition to the curves for weekdays (blue dashed line) and holidays (red dashed line),
Figure 2 reports the curve weighted over one year between weekdays and holidays (black solid line).
As a result, the number of people inside the Italian residential buildings to be used in loss estimations would range from about 95% (maximum value of the occupancy rate) to about 40% (minimum value of the occupancy rate) with respect to the total number of inhabitants. Further, a more accurate number of people potentially involved at the time of an event could also be used to carry out loss scenarios immediately after an event to support civil protection activities in the first phases of emergency management.
As regards the construction material in the casualty rates, based on the main literature studies and the results obtained from the loss scenarios for the 1980 Irpinia-Basilicata earthquake and the 2009 L’Aquila earthquake, the proposal is to consider the casualty rates (both for deaths and for injured people) proposed by Zuccaro and Cacace (2011). As can be seen in
Table 2, the authors provided the casualty rates, i.e., the casualty percentages, with respect to the building inhabitants, for deaths (QD) and injuries (QI) as a function of the damage levels, D4 and D5 (which refer to very heavy damage and destruction conditions, respectively, according to the European Macroseismic Scale, EMS-98 [
26,
27], separately for masonry and RC buildings. For each building type, the [
19] model also specifies the vulnerability classes (i.e., A or B or C for Masonry buildings; C or D for RC ones), that are qualitative indicators defined in EMS-98 to rank the expected performance of buildings under earthquake.
The DS has a substantial impact not only on casualties but also on the expected economic losses (intended as the sum of the direct costs necessary to repair the damage detected on buildings following a seismic event, and the associated indirect costs). In fact, the relationships between costs and DSs represent a crucial tool to define territorial scale loss scenarios by using empirical or mechanically-based fragility curves. Anyway, in the immediate aftermath of the earthquake, to rapidly estimate reconstruction costs, it is particularly useful to adopt relationships between costs and the usability rating of the buildings; this would assist the Civil Protection Department in risk reduction and emergency management. Thus, in the next section an empirical usability model is proposed, and usability fragility curves are derived.
3. A Usability Model for Loss Assessment
A refined estimation of loss assessment requires the definition of effective fragility models suitable for assessing seismic risk and for assisting the Civil Protection Department in risk reduction and emergency management [
25,
28]. With this aim, many empirical models were proposed in the last decade thanks to the greater availability of empirical data made possible in Italy by the National Civil Protection Department that published the “Da.D.O.” web database [
23]. Several damage fragility functions for different residential types related to RC (e.g., [
7]) and masonry buildings (e.g., [
6,
29,
30]) have been presented in recent works. Once a reliable estimate of structural damage is obtained, it can be linked to cost of repair [
31] or social losses.
Alternatively, to the previous method, related to the damage of structural and non-structural elements surveyed in the post-earthquake phase, the usability assessment of the building can be considered. The usability, i.e., the fitness for continuing the use of a construction without an increased vulnerability, is a significant indicator of the earthquake behaviour of a construction [
32]. The usability assessment requires a comprehensive inspection of the post-earthquake damage of structural and non-structural elements.
In Italy, the usability rating was used to distribute repair funding at the beginning of the reconstruction process after the 2009 L’Aquila earthquake [
13,
14]. Furthermore, the indirect costs were strictly associated with the usability assessment, as shown by [
15]. Moreover, ref. [
33] revealed a significant correlation between structural parameters and usability ratings.
Then, within Task 4.4, an empirical usability model was developed for residential masonry constructions based on the abovementioned Da.D.O. dataset related to the 2009 L’Aquila earthquake observations [
34]. The aim is to serve a model similar to the vulnerability model and applicable in a seismic risk scenario for loss assessment that allows a stronger correlation between the usability outcomes and repair cost, time of population assistance, casualties, fatalities and homelessness. The proposed model develops empirical usability curves for masonry types, starting from the observed data of almost 60,000 residential buildings. First of all, the relevant parameters affecting the usability rating were identified through loss-of-usability regressions with the aim of defining types inferable both from the AeDES and the census databases [
35].
Only descriptive information (construction timespan, state of repair/pre-existing damage, number of storeys) and structural material (masonry, reinforced concrete, steel, mixed) are available in both databases. Hence, they will be used in the following to develop a model applicable to whichever Italian municipality in a territorial-scale for simplified analyses. Such analyses cannot be used at the individual building scale, for which structural analyses shall be performed, accounting for earthquake resistant details (or lack thereof).
The loss-of-usability regressions provide the percentage of unusable buildings (defined as the ratio between the number of unusable buildings and the total number of buildings) as a function of ground shaking intensity. These functions allowed for the definition of the relevant categories of the crucial parameters. In particular, the categories that led to well-separated functions were considered to identify the typological classes [
34]. The selected categories for the construction timespan are linked to the most important Italian technical codes concerning masonry buildings: before 1919 (T1), between 1919 and 1961 (T2) and after 1961 (T3) (Ref. [
33]. As for the state of repair, the census considers four categories: excellent, good, mean and poor. Based on the correlation with the pre-existing damage and usability assessment available in the AeDES database [
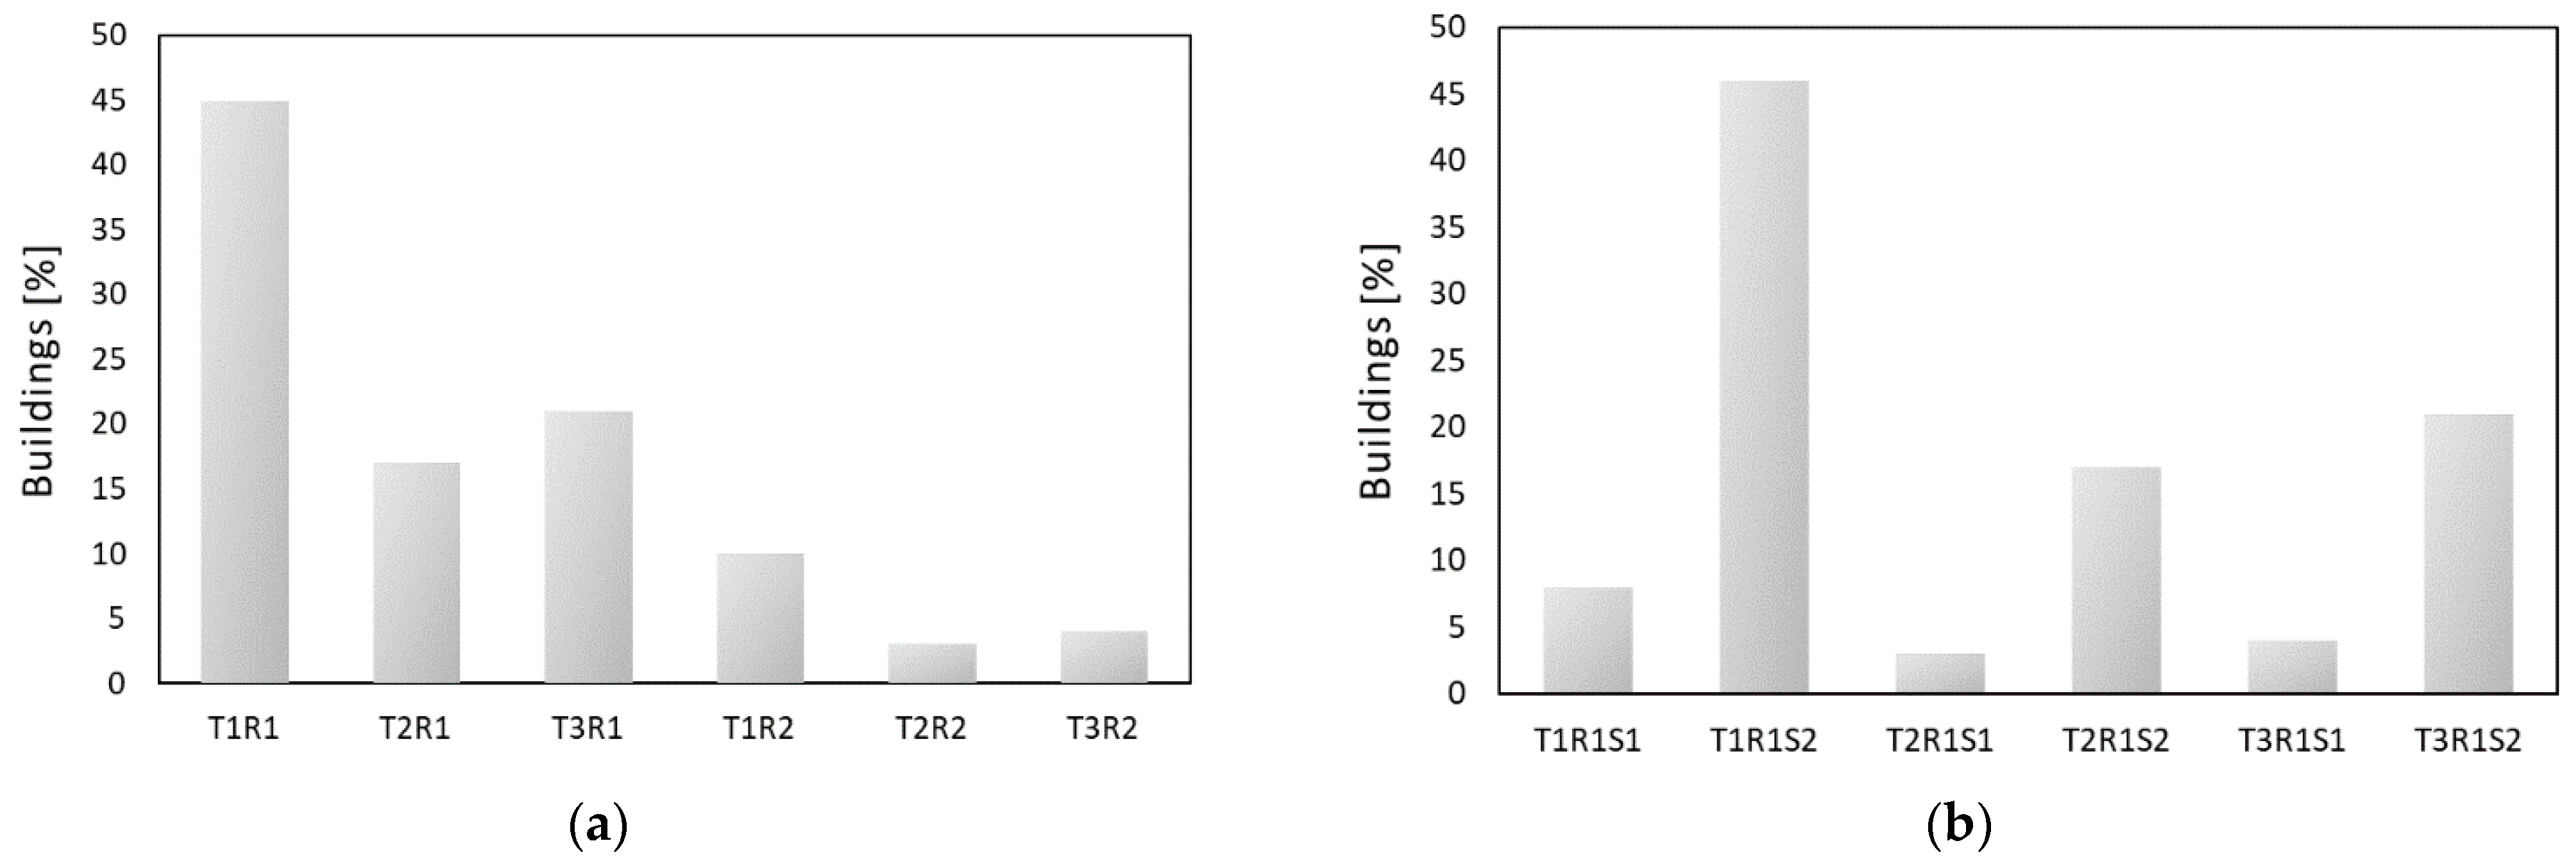
34], two categories are used in the following loss-of-usability functions: R1 (in the case of excellent or good census state of repair) or R2 (for mean or poor). Finally, for the number of storeys parameters were defined in two categories: one storey (S1) and more than one storey (S2); however, this parameter is not relevant for masonry buildings with the state of repairs R2. The percentage distributions of the selected types are shown in
Figure 3. Specifically, in
Figure 3a six typological classes are defined for the complete set of buildings (belonging either to R1 or R2 state of repair). These classes do not account for the number of stories, because this is not relevant for R2 buildings. Alternatively, in
Figure 3b, R1 buildings are disaggregated to account for the number of stories.
In order to properly evaluate the total number of buildings in the area affected by the earthquake (including the constructions not inspected because not damaged, thus avoiding the underestimation of those usable), the procedure introduced by [
33] was implemented. The observed data are increased considering the effective number of buildings present in the ISTAT data for each settlement, including Abruzzo region municipalities not present in the AeDES databank. The increased database consists of more than 375,000 buildings. The type of added buildings was outlined by means of a statistical procedure, considering the percentage distribution of the AeDES data.
The observed fragility functions consider two usability states
US, retrieved for each building from the AeDES database: B for partially unusable, E for unusable. The selected intensity measure was the Peak Ground Acceleration (PGA). PGA is an intensity measure close to each relevant building and accounts for soil amplification.
Observed PGA values were extracted from the 2009 shakemap (
http://shakemap.rm.ingv.it/shake/1895389/products.html, accessed on 3 September 2021), which was generated according to values measured at accelerometric stations as well as ground motion prediction equations also based on magnitude and distance [
36]. The US-PGA observed points were fitted with a lognormal distribution, and their parameters were evaluated employing the maximum estimation method based on the likelihood function, which represents one of the most robust methods to fit the observed data as suggested in previous works [
37,
38,
39,
40].
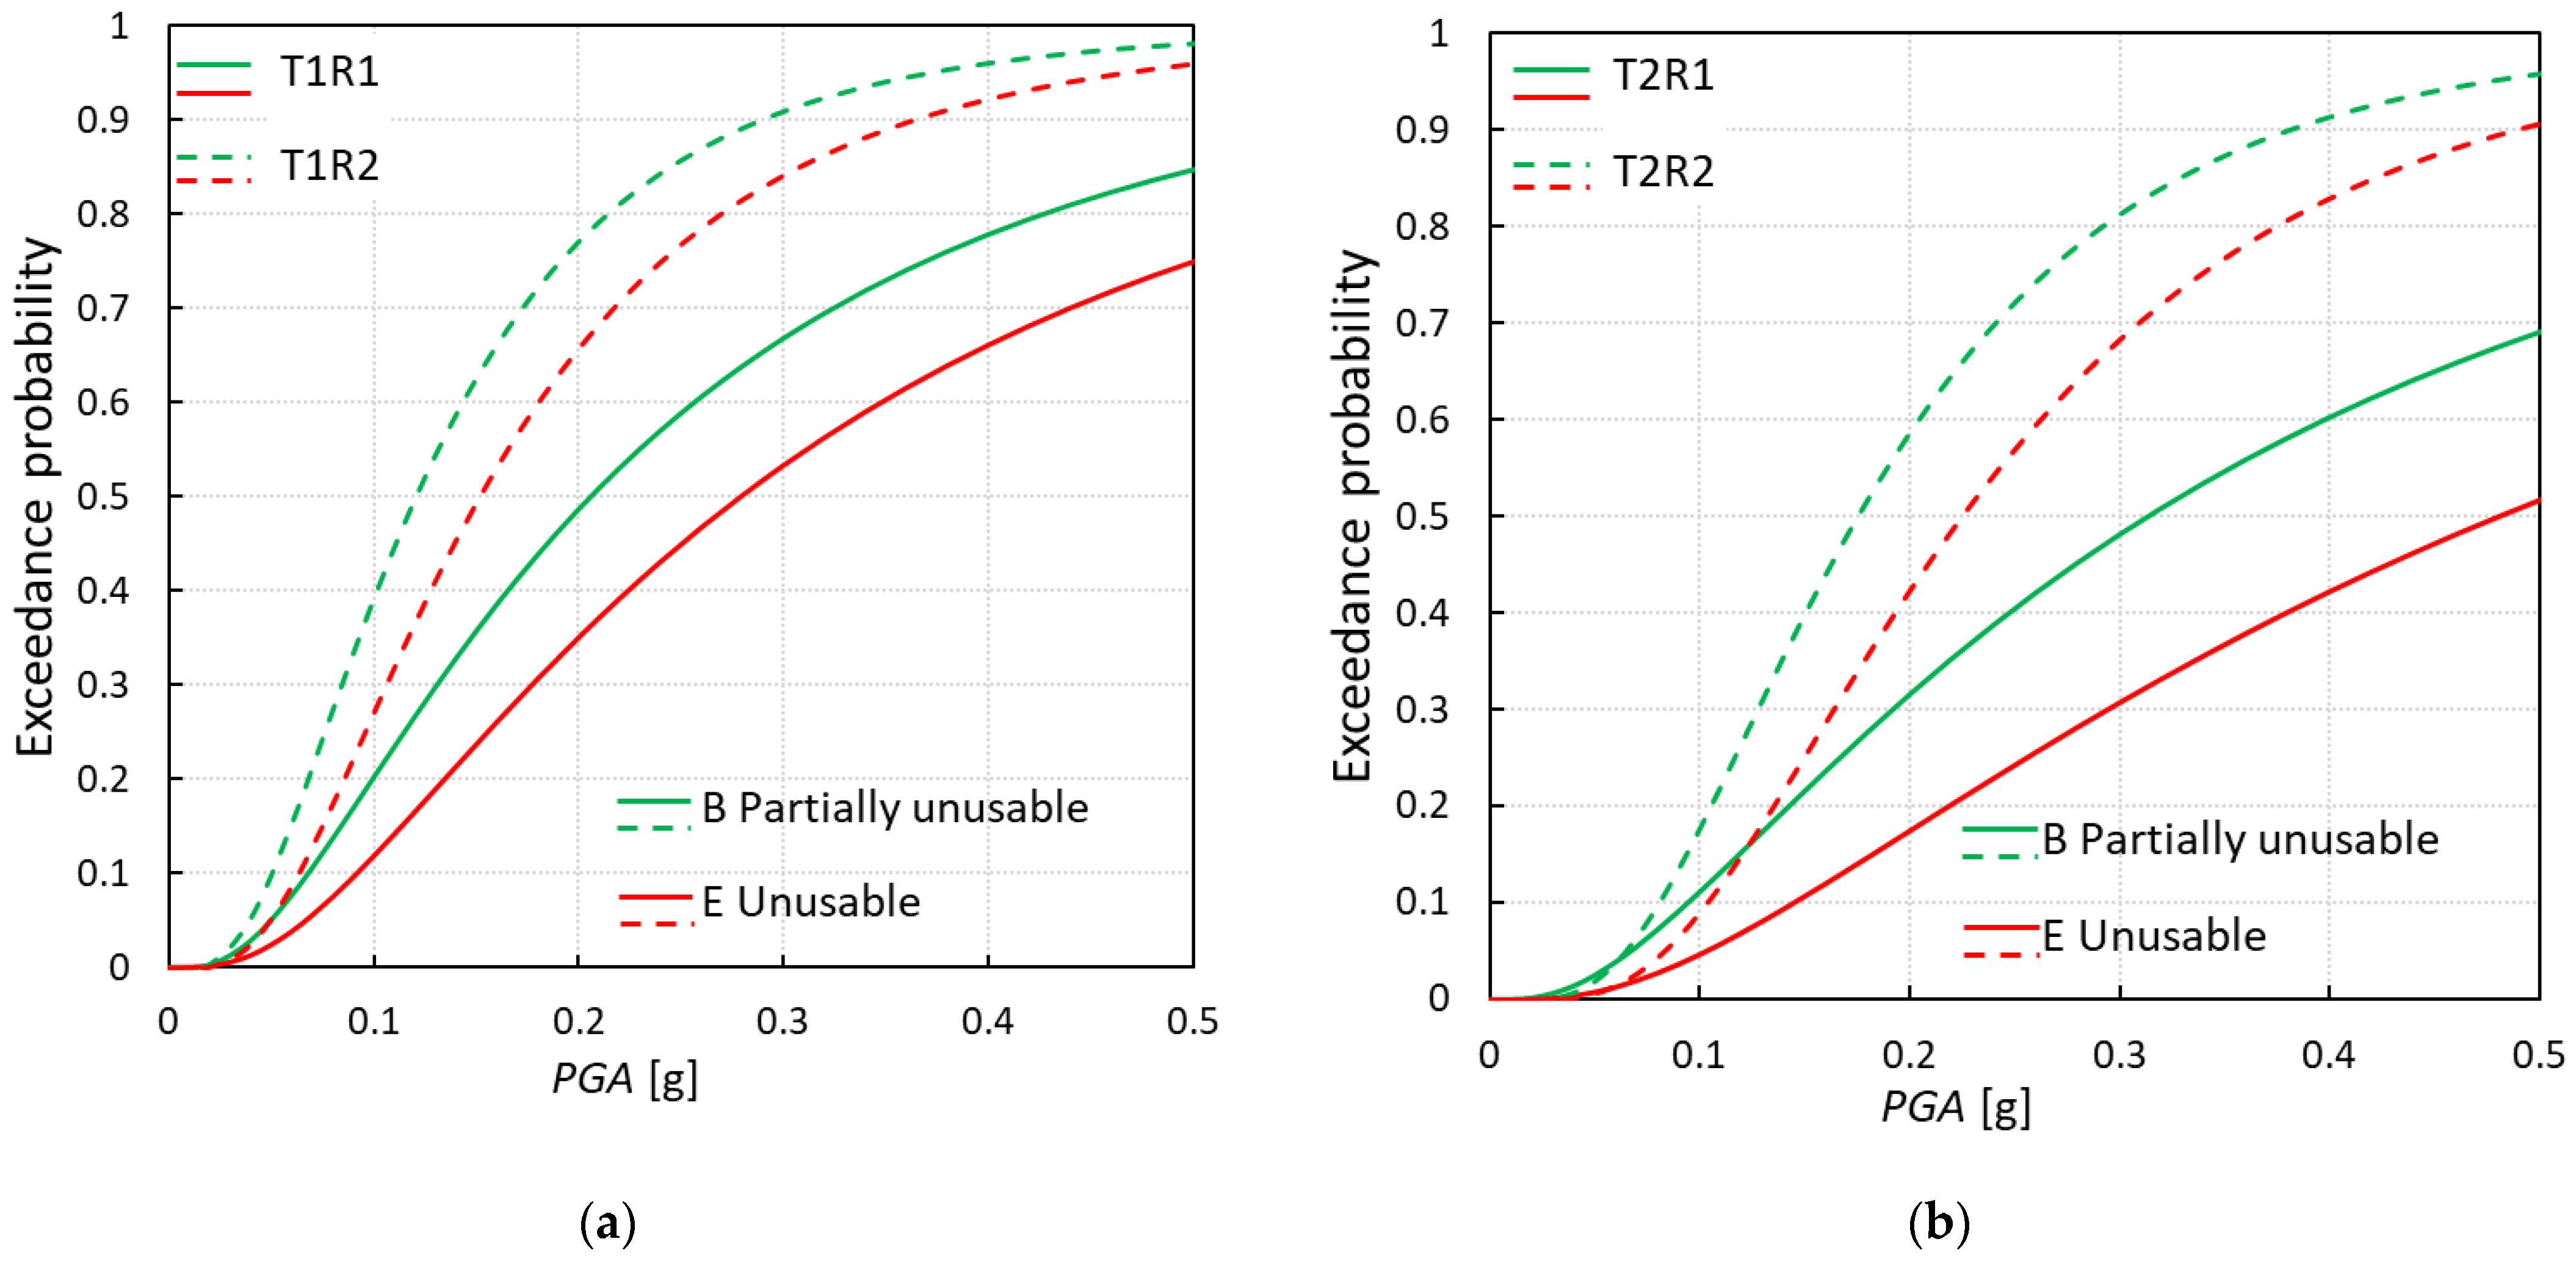
In
Figure 4, four examples of the usability functions for selected types are shown: T1R1, T1R2 in
Figure 4a and T2R1, T2R2 in
Figure 4b.
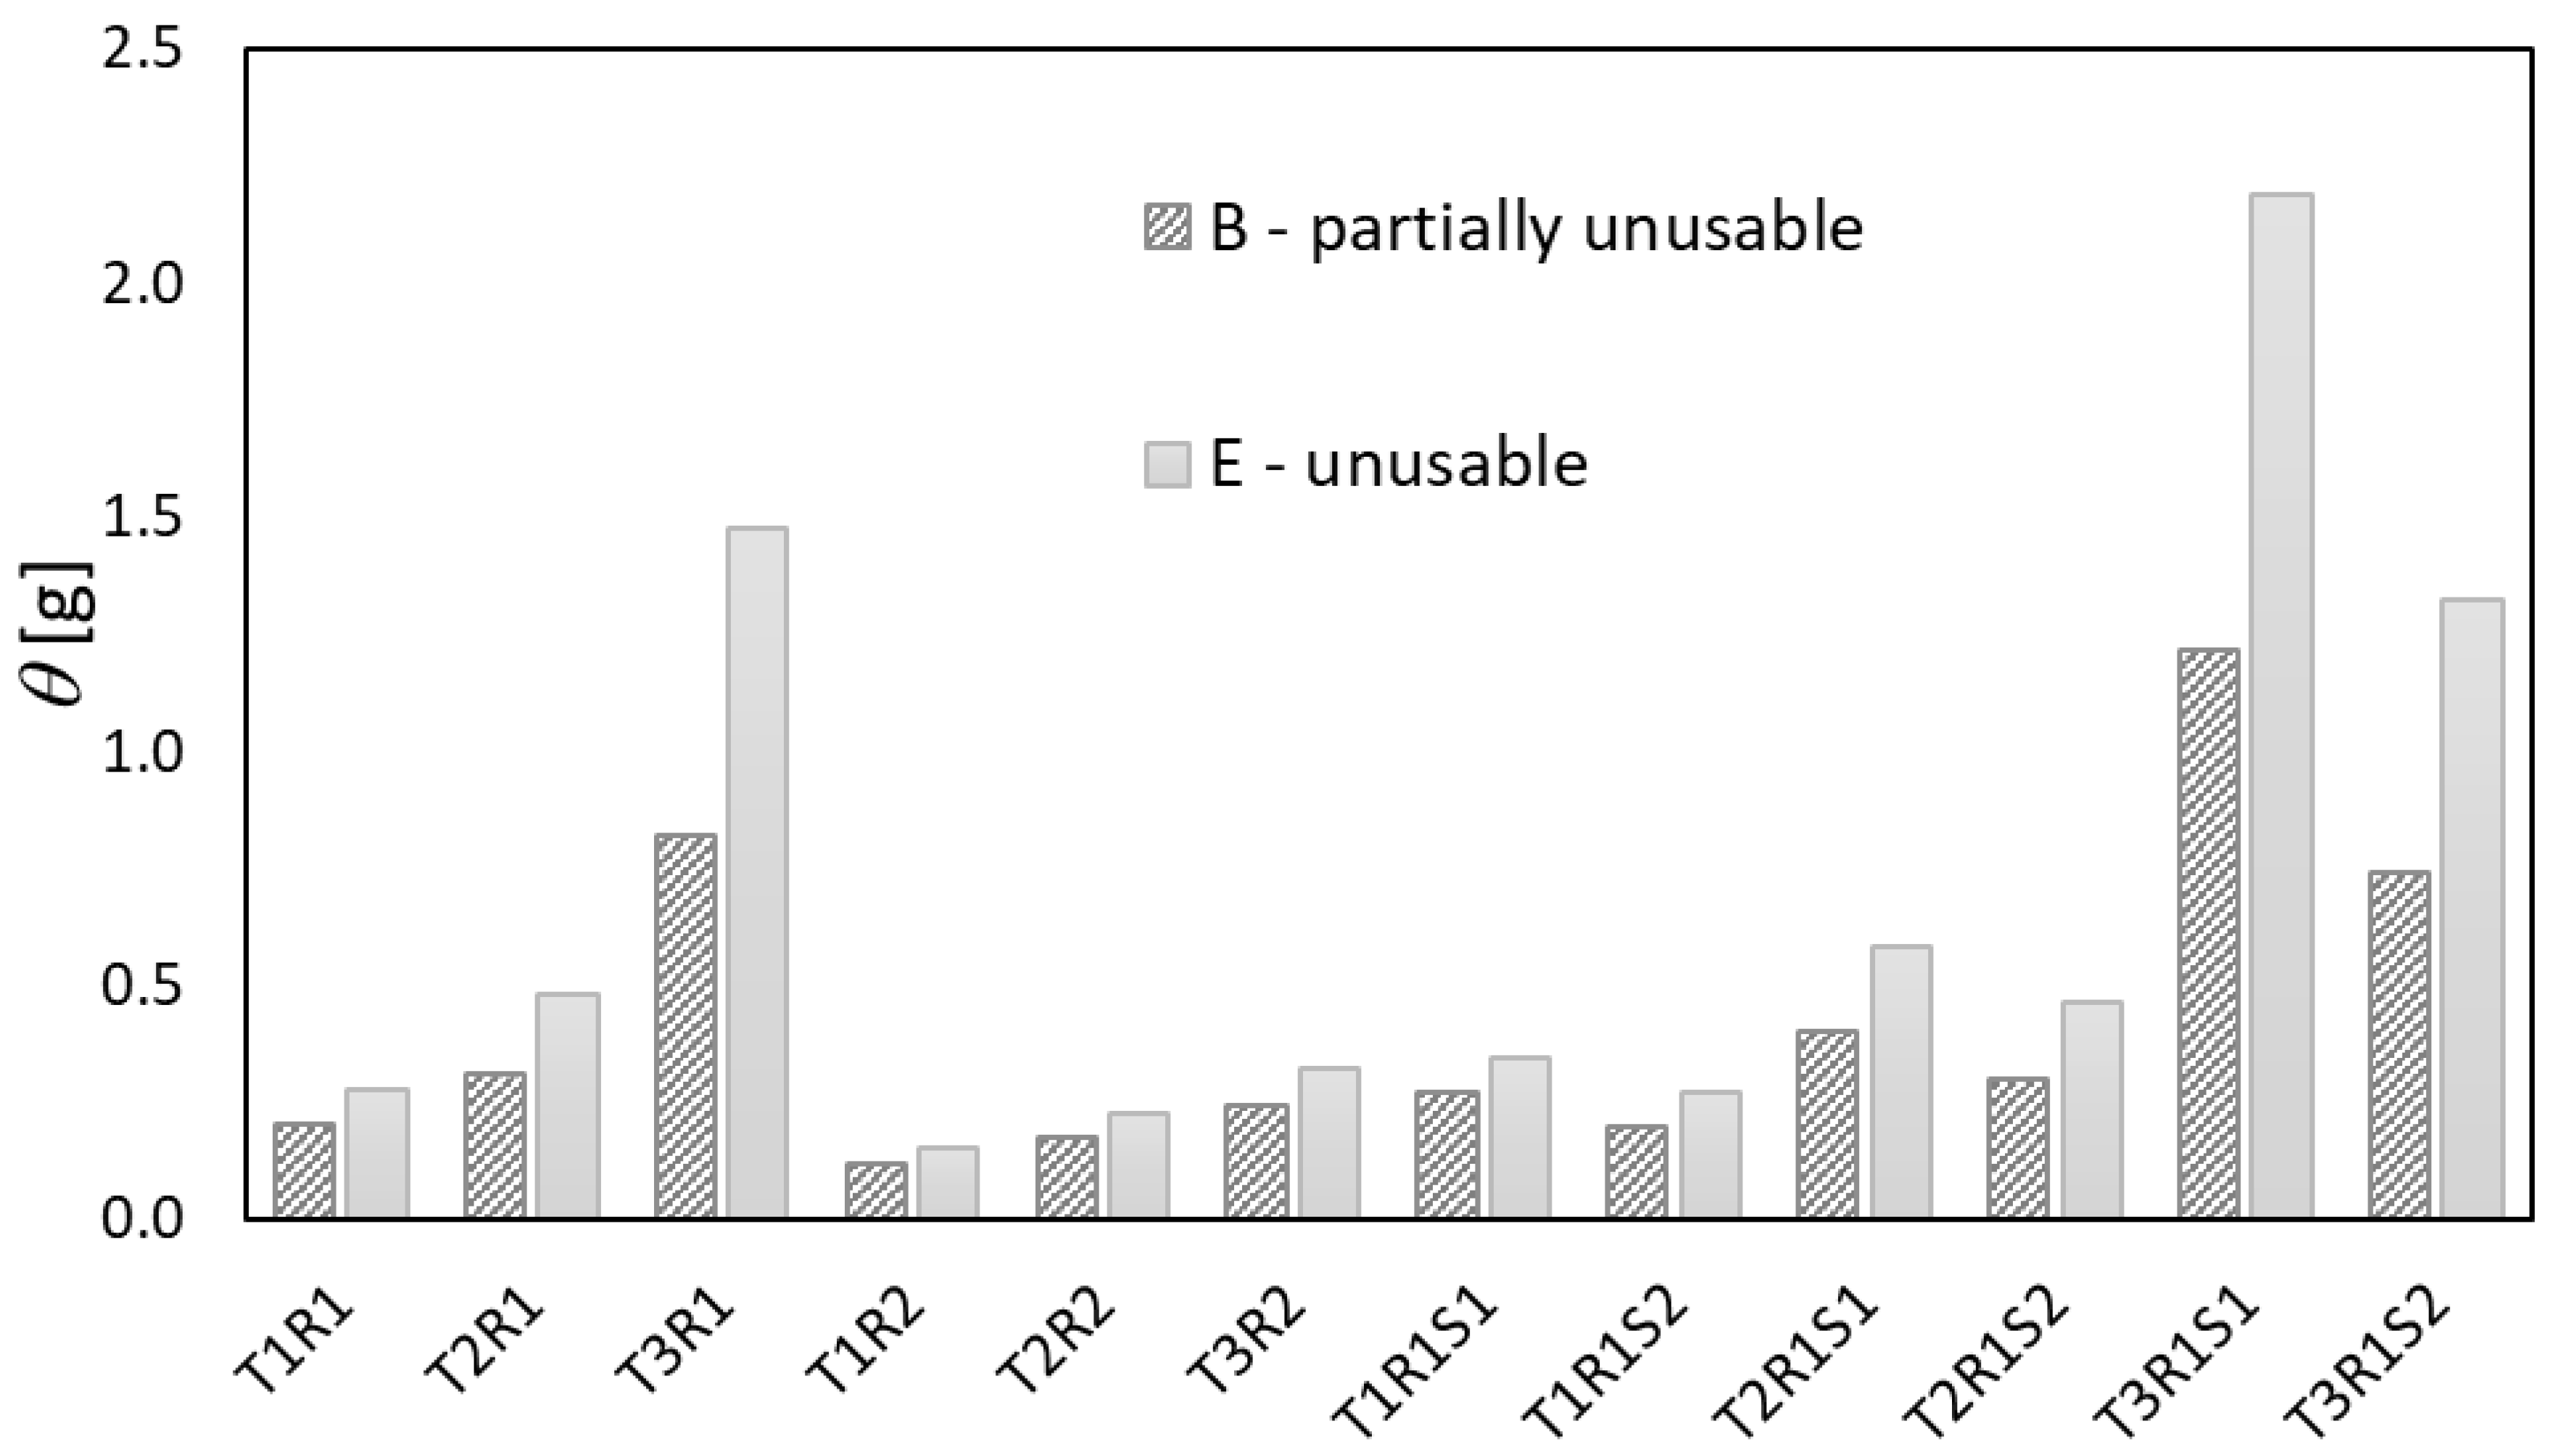
In
Figure 5, the median parameters
θ of lognormal distributions for all census-based typological classes are reported, while the lognormal standard deviation
β was presumed identical for both
USs of a given building type to preclude the intersection of the functions, following the suggestion of [
39]. It is possible to observe from the figure that unusable buildings always have higher median values than partially unusable. Then, the state of repair is the most important parameter, followed by the construction timespan parameter. Older buildings entail a higher loss-of-usability respect than the buildings built more recently. Furthermore, considering the same construction timespan, the state of repair R1 led to lower loss-of-usability if compared to buildings with state of repair R2. For types with state of repair R1, a number of stories equal to or greater than two involves a higher loss-of-usability than the single-story buildings.
Taking into account the significance of both DSs and the usability rating in the assessment of economic losses, in the next sections, the data on the damage and usability of buildings struck by L’Aquila earthquake are briefly recalled; then, the probability density function of repair costs related to RC and masonry buildings as a function of usability rating and DS are derived. Furthermore, indirect losses are also explored through the analysis of assistance population costs. The probability density functions of the population assistance costs as a function of the usability rating and the DS are also derived. Finally, a proposed correlation between the repair population assistance costs are presented.
4. Consequence Functions
The development of reliable models to generate risk maps, loss scenarios and mitigation strategies needs the definition of relationships between damage and losses. The study reported in the 2018 NRA [
22,
28] shows that the damage distribution has a substantial impact on the expected losses.
The actual repair costs,
ACR, derived from data collected in the post-earthquake reconstruction processes of residential buildings in Italy [
13,
14] are expressed with reference to the building reconstruction cost,
CU, assumed equal to1350 €/m
2. Thus, the normalized repair cost is expressed as a percentage of the reconstruction cost, %
Cr. The %
Cr has been found for five global Damage States from
DS1 to
DS5 defined in compliance with the metric introduced in EMS98 [
26].
According to actual data, the following percentage costs were found for different damage states DSs: %Cr = 2% for DS1, %Cr = 10% for DS2, %Cr = 30% for DS3, %Cr = 60% for DS4, and %Cr = 100% for DS5.
Starting from these values reported in the 2018 NRA, a further study has been carried out to provide probability distributions of %Cr instead of mean values only. The study refers to 4664 RC residential buildings and 3833 masonry residential buildings damaged by the 2009 L’Aquila earthquake. The %Cr has been computed as the ratio between ACRs computed by practitioners hired by property owners to submit request for public grants for reconstruction and CU. The ACRs are not inclusive of VAT and technical expenses, and they refer to the costs involved in restoring structural or non-structural building components to their pre-quake state.
The %Cr has been analysed as a function of the empirical damage expressed as: (i) usability rating, A, B–C, E (the tag A corresponds to usable building, the tag B to building usable only after short term countermeasures, the tag C to partially usable building, the tag E to unusable building); (ii) global damage state, DS.
The usability assessment surveys, carried out in the 2009 emergence phase utilizing the AeDES survey form [
2], allowed for the collection not only of the usability rating but also of the building types and the level of damage for structural and not structural components. In details the AeDES form includes four damage levels (
D0-no damage,
D1, slight damage,
D2–D3 medium-severe damage,
D4–D5 very heavy damage or collapse) as well as the relevant extent for structural and non-structural members (i.e., Vertical Structures,
VS, Floors,
F, Stairs,
S, Roofs,
R and Infills-Partitions,
IP).
According to [
7] for
RC buildings and [
23] for masonry buildings, these data have been converted into a global Damage State,
DS. While the second conversion considers the severity of damage and pertinent extent detected on
VS, the conversion for
RC buildings considers the highest severity of the damage detected on vs. and
IP to determine
DS.
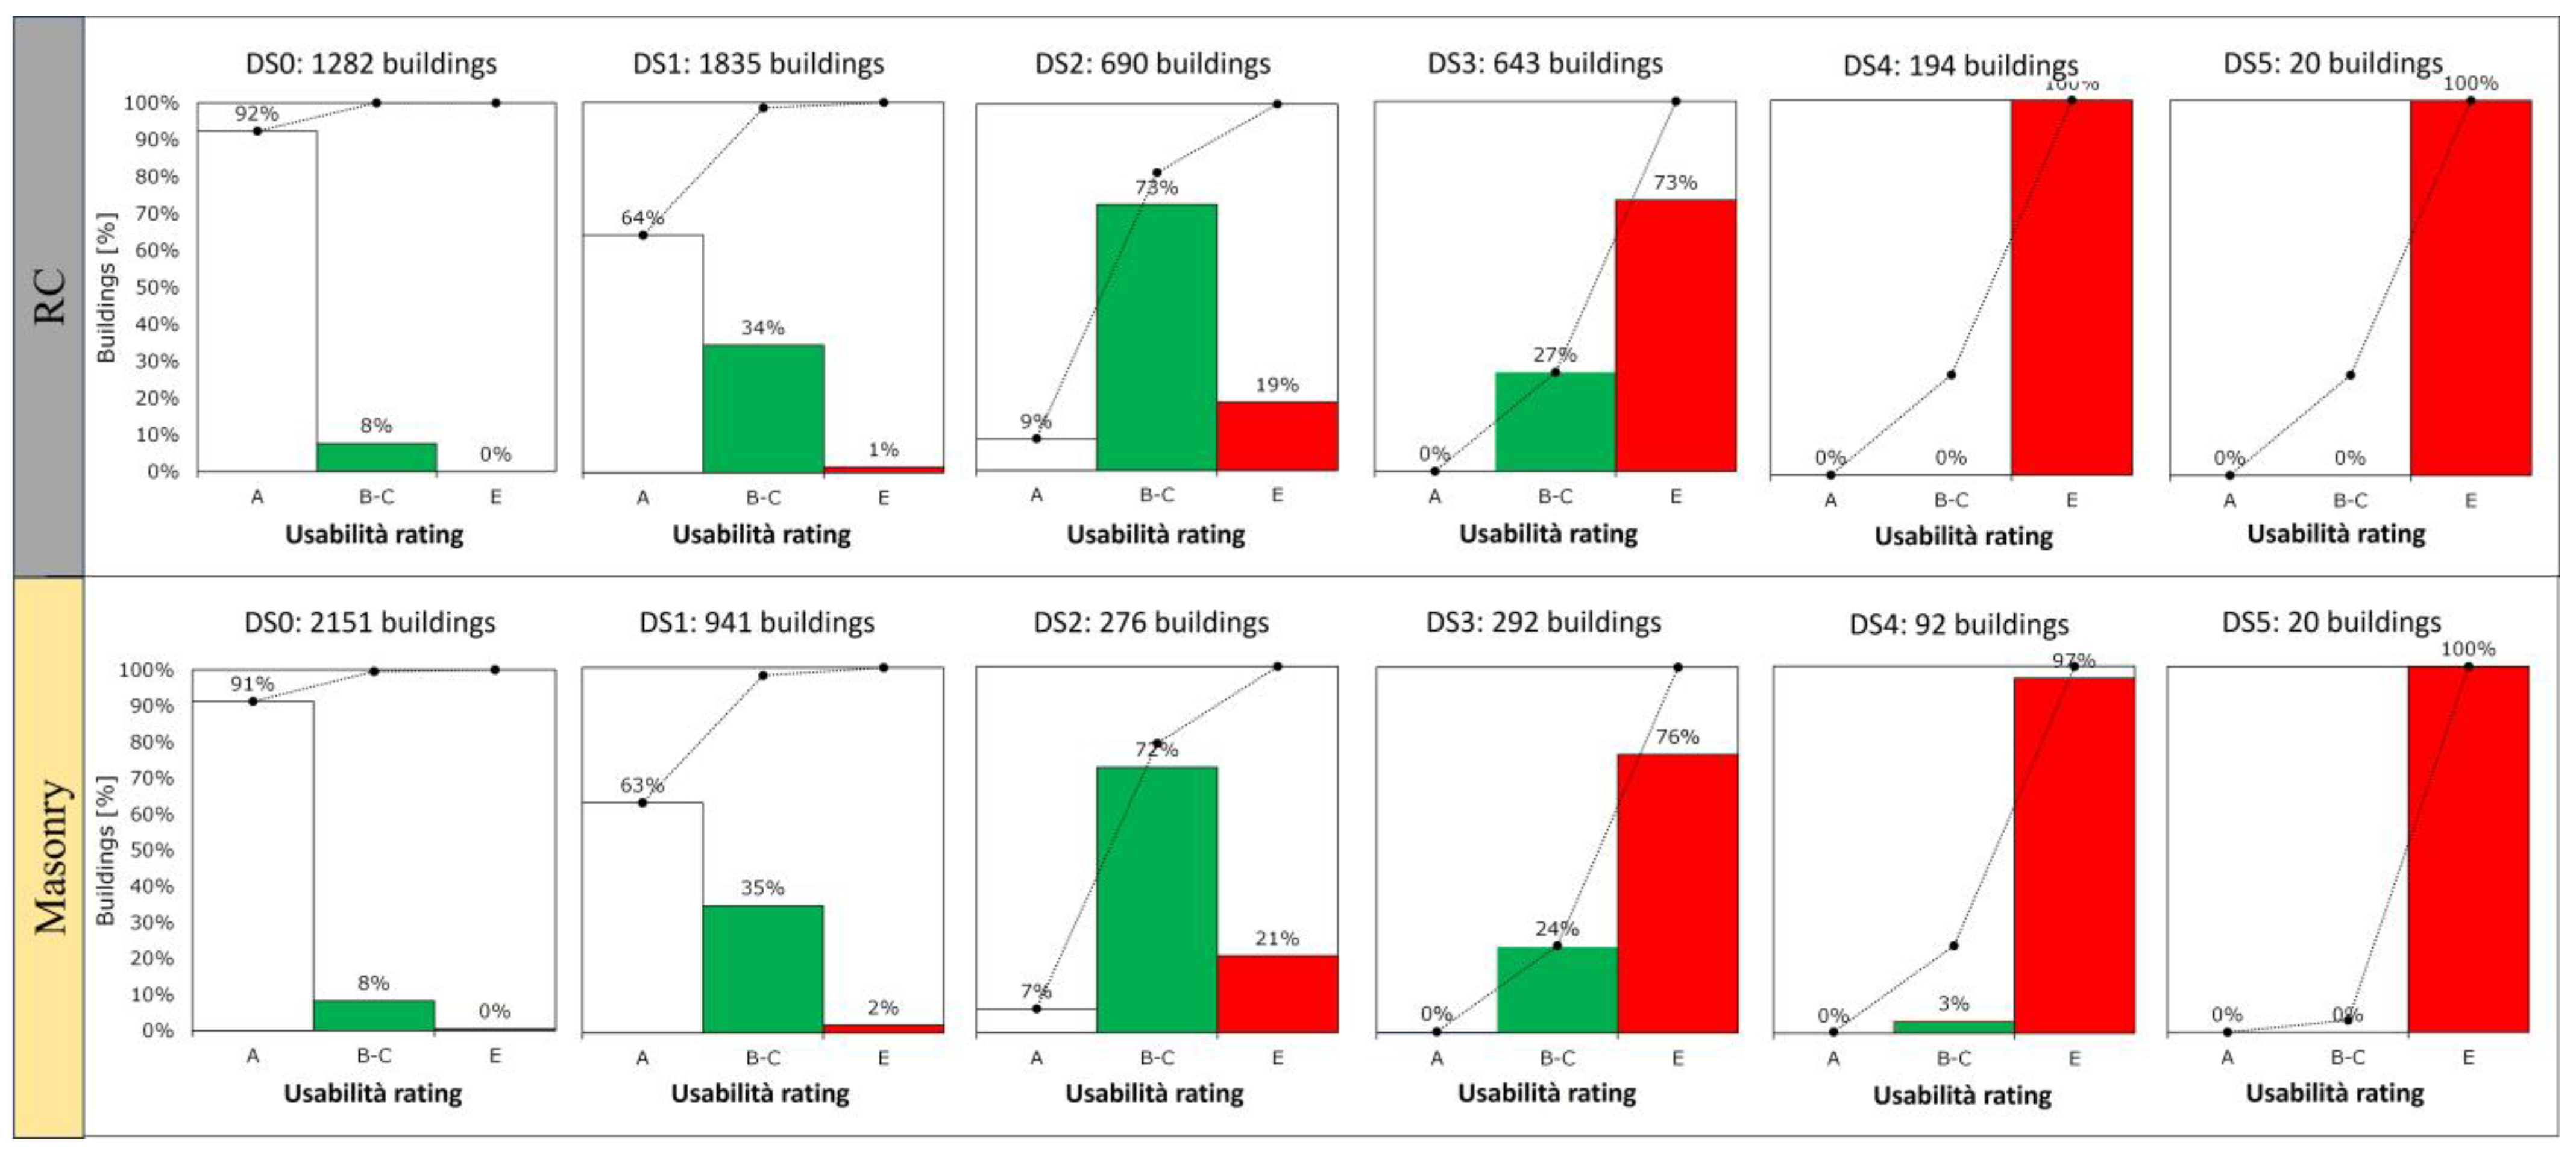
According to the elaboration of the post-earthquake empirical data, the usability rating percentages for
RC and masonry buildings are shown in
Figure 6 for each
DS. For each
DS, the number of buildings is also reported.
Figure 6 shows how the percentage of
A ratings decreases as a function of
DS and is null for
DS higher than
DS2. Since
DS3, there has been a noticeable increase in
E ratings regardless of building type.
The relationship between DS and costs is a useful tool to define loss scenarios in “peace-time” once a seismic input scenario (or, in a probabilistic approach, several potential seismic events and their relevant annual frequency of exceedance) is assumed to be in a specific area with known exposure data. By contrast, the association between costs and usability ratings is crucial to plan direct and indirect costs (i.e., the indirect cost ratio pertaining to population assistance) in the management of reconstruction phases. Indeed, the usability rating strongly affects the housing recovery time and costs for population assistance.
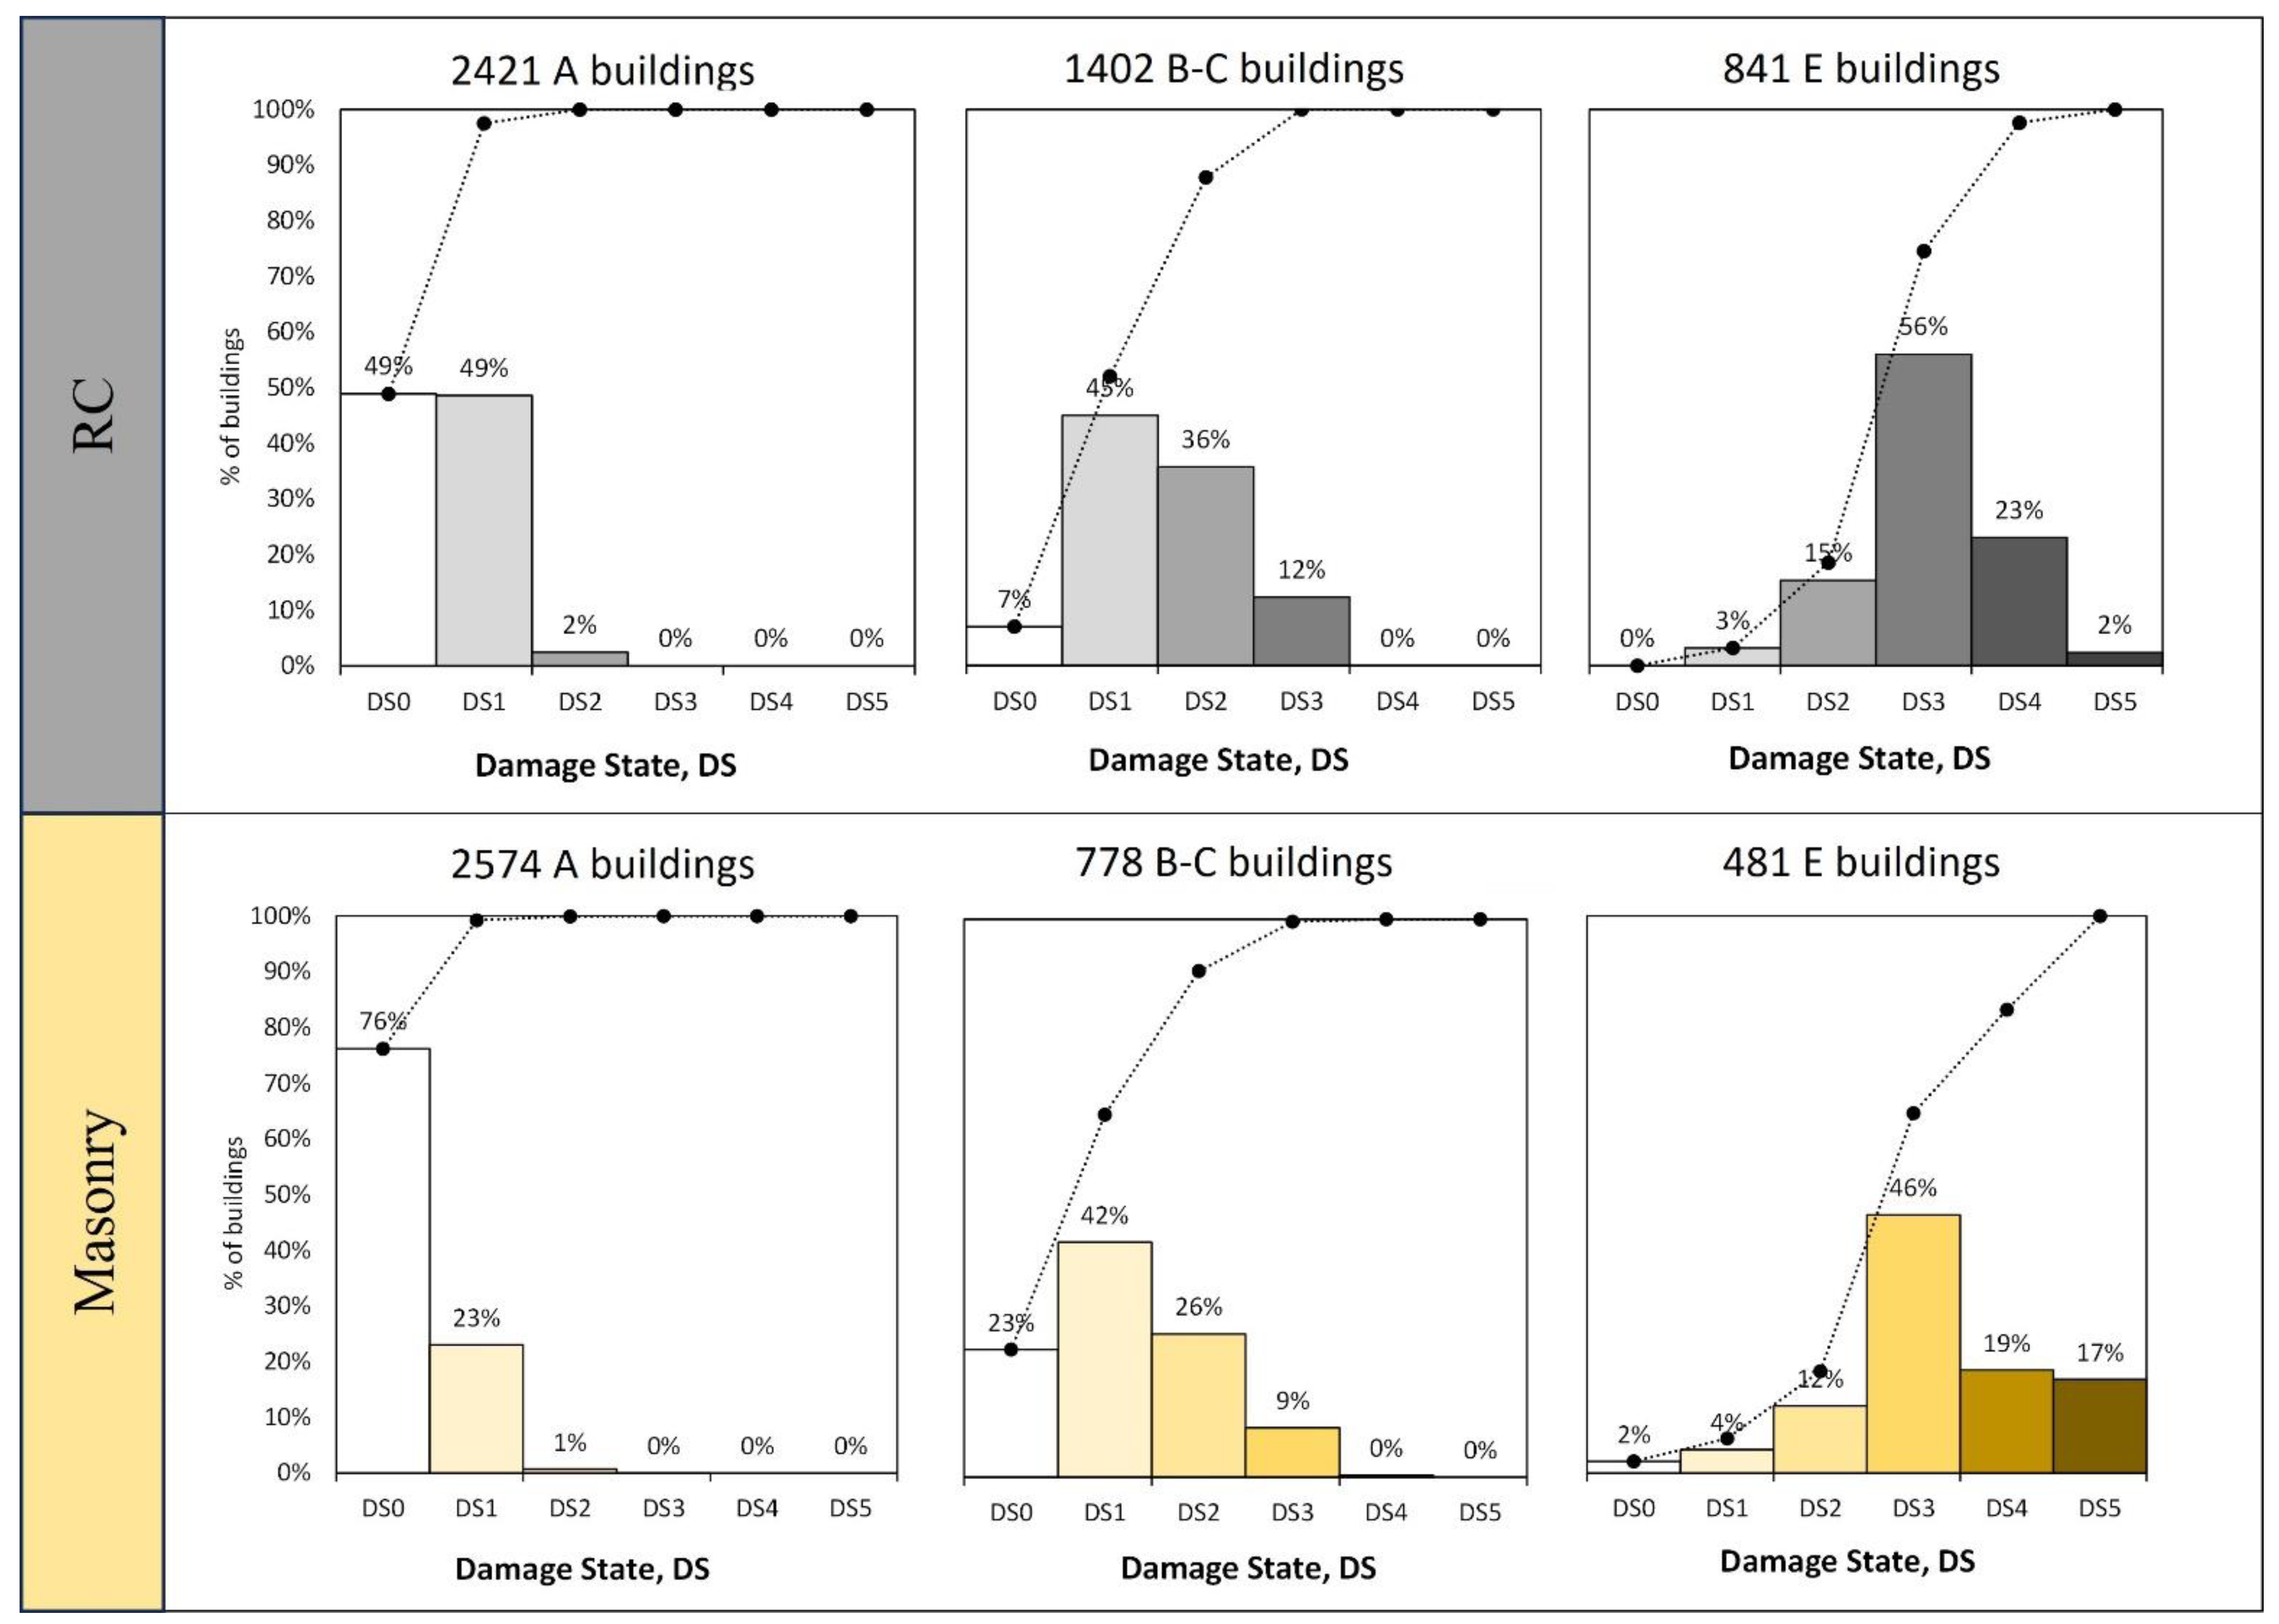
The buildings achieving certain
DSs can be easily found using fragility curves. However, this evaluation in “peace-time” is still less robust than
DSs. Indeed, there are still no accurate models based on the usability rating. Therefore, it is also useful to provide the correlation between
DS percentages associated with each usability rating as a function of building types (
Figure 7).
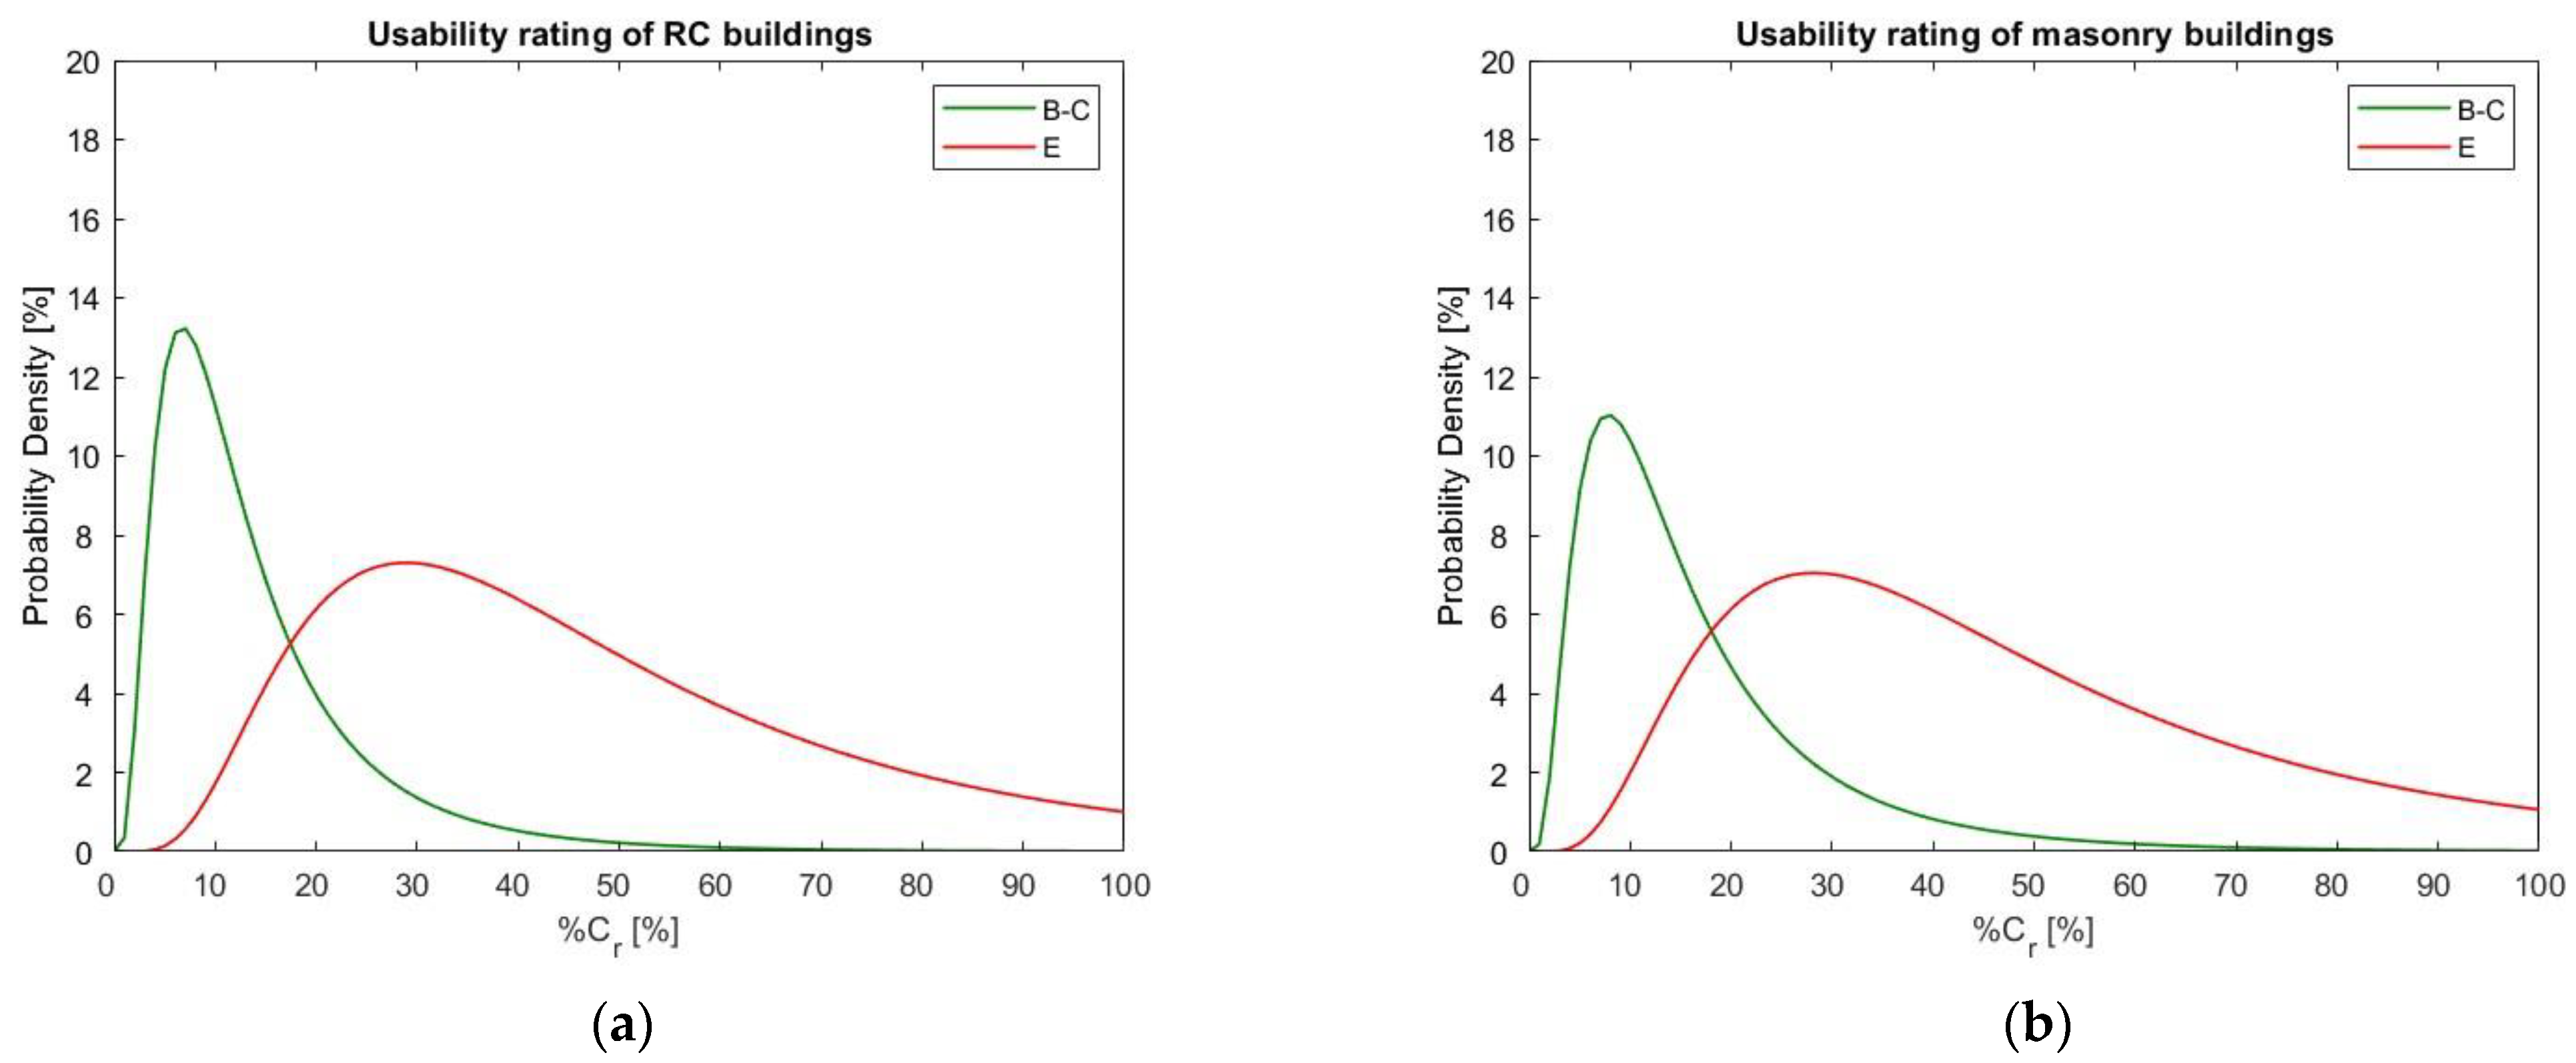
Figure 8 shows the probability density functions (
PDF) of %
Cr for
RC and masonry buildings; they have been computed assuming a best fit with actual data in terms of usability rating.
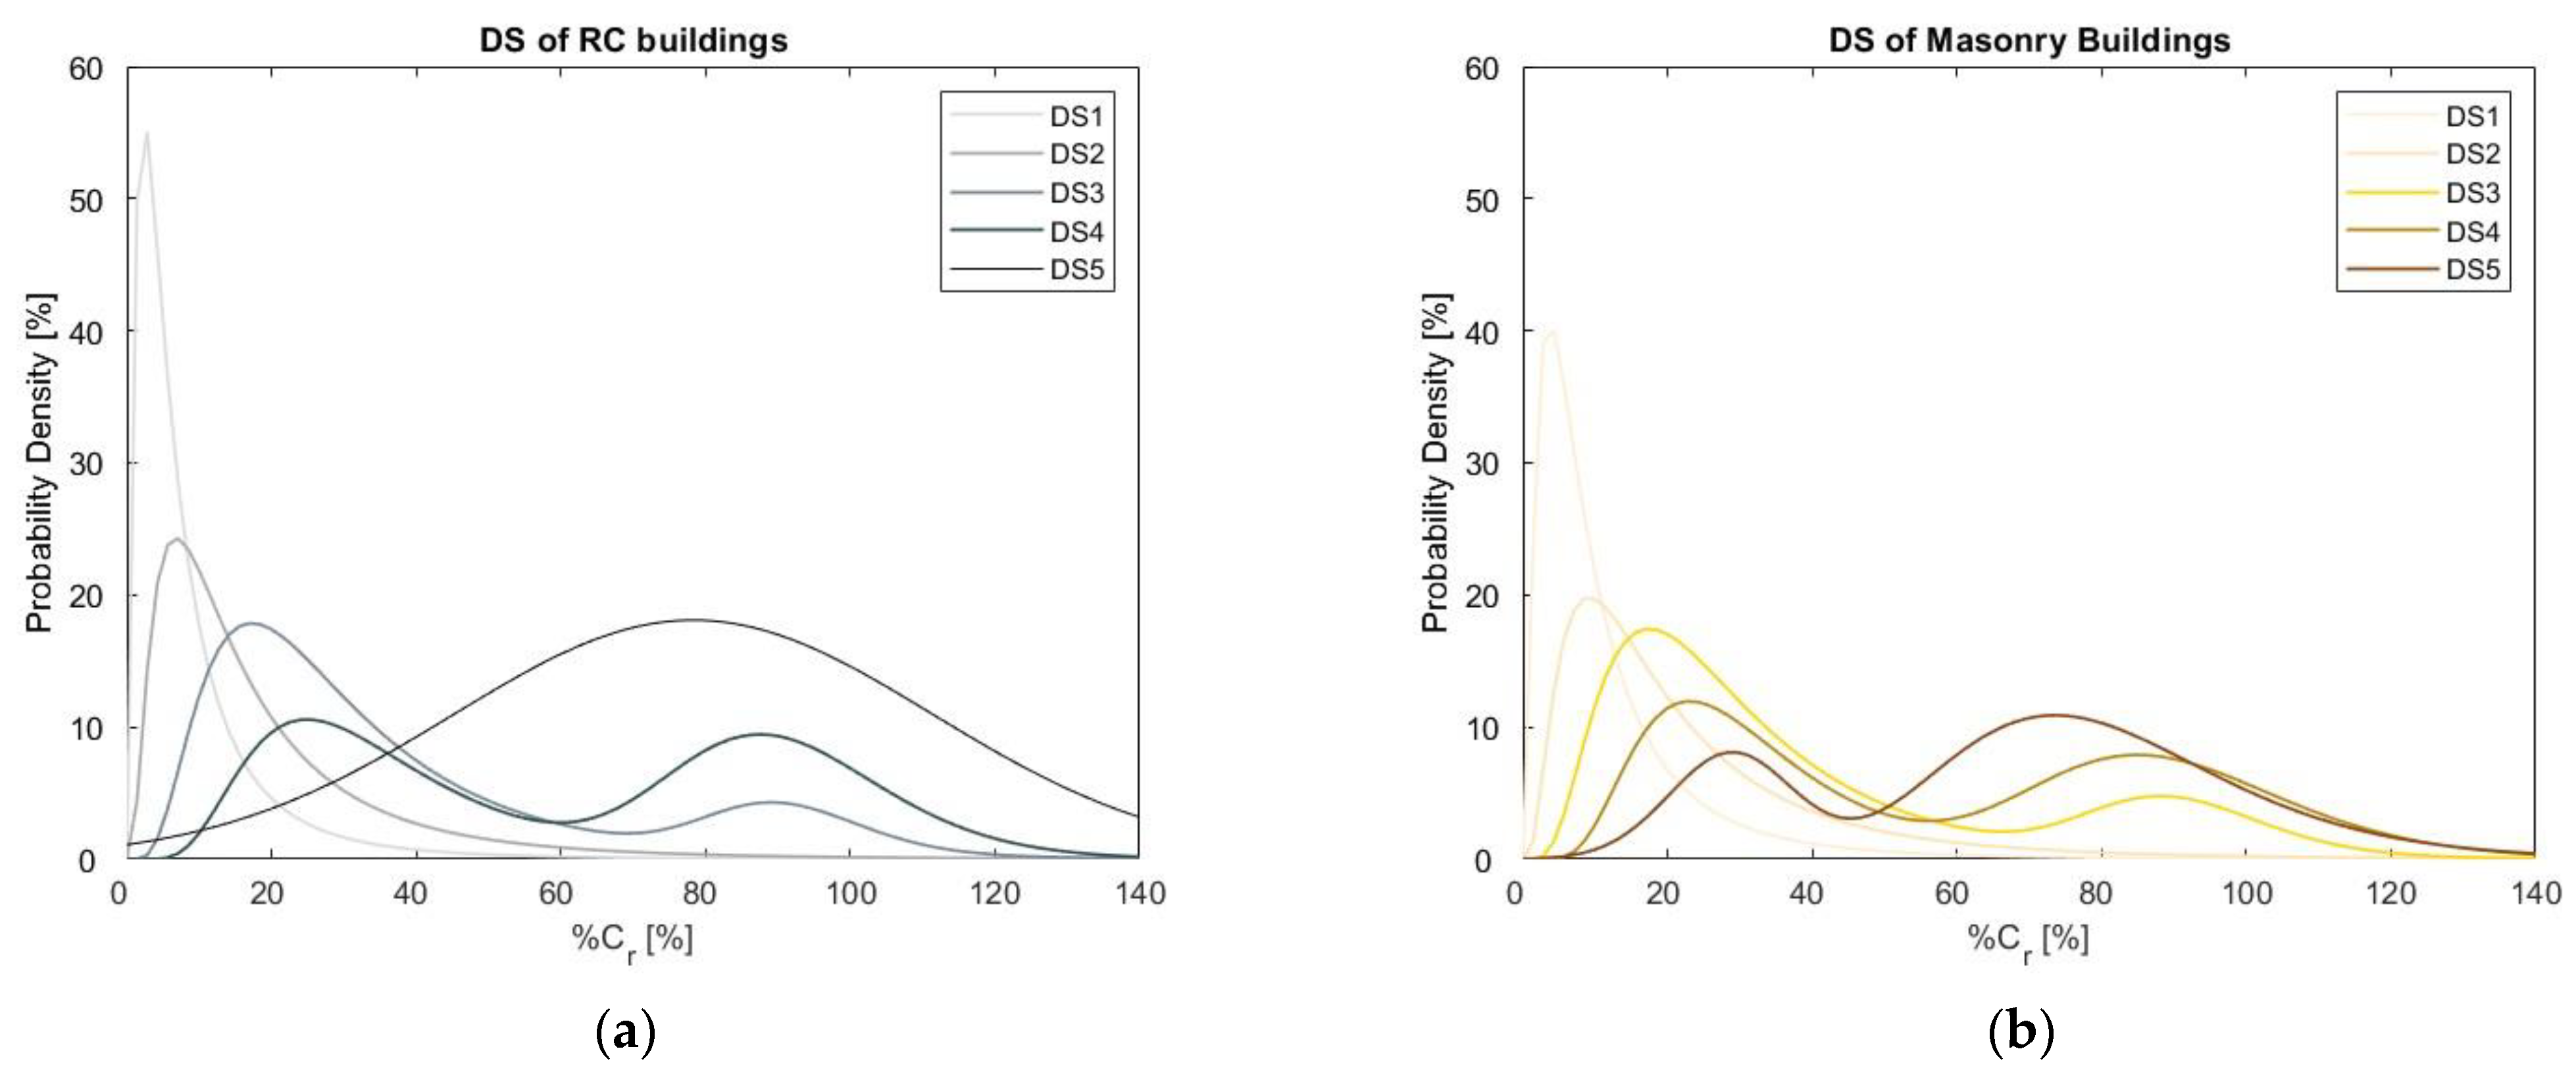
Figure 9 shows the best fitting
PDF of %
Cr for
RC and masonry buildings as a function of
DS.
The
PDF key parameters to derive the probability distribution functions of
Figure 8 and
Figure 9 are reported in [
15].
Task 4.4 also focused on the analysis of costs for population assistance, which represents a substantial amount of indirect costs. To define the relationship between level of damage and population assistance costs, a thorough examination of the types of population assistance, costs and timing of people assisted in each assistance form has been carried out; this allowed for the determination of the cost per person per month of each assistance form. In particular, five population assistance types have been adopted after the 2009 L’Aquila earthquake: (i) tents; (ii) hotels; (iii) self-accommodation grant (namely s.a.g. in the following); (iv) traditional temporary wooden-house units,
M.A.P. (“Temporary Inhabitable Modules”); (v) innovative high quality and comfort standards housing modules, so-called
C.A.S.E. project (“Anti-seismic, Sustainable and Ecologically Compatible Housing Complexes”), [
41]. The assistance cost together with the average monthly cost per person,
Ci, are reported in
Table 3 for each assistance type.
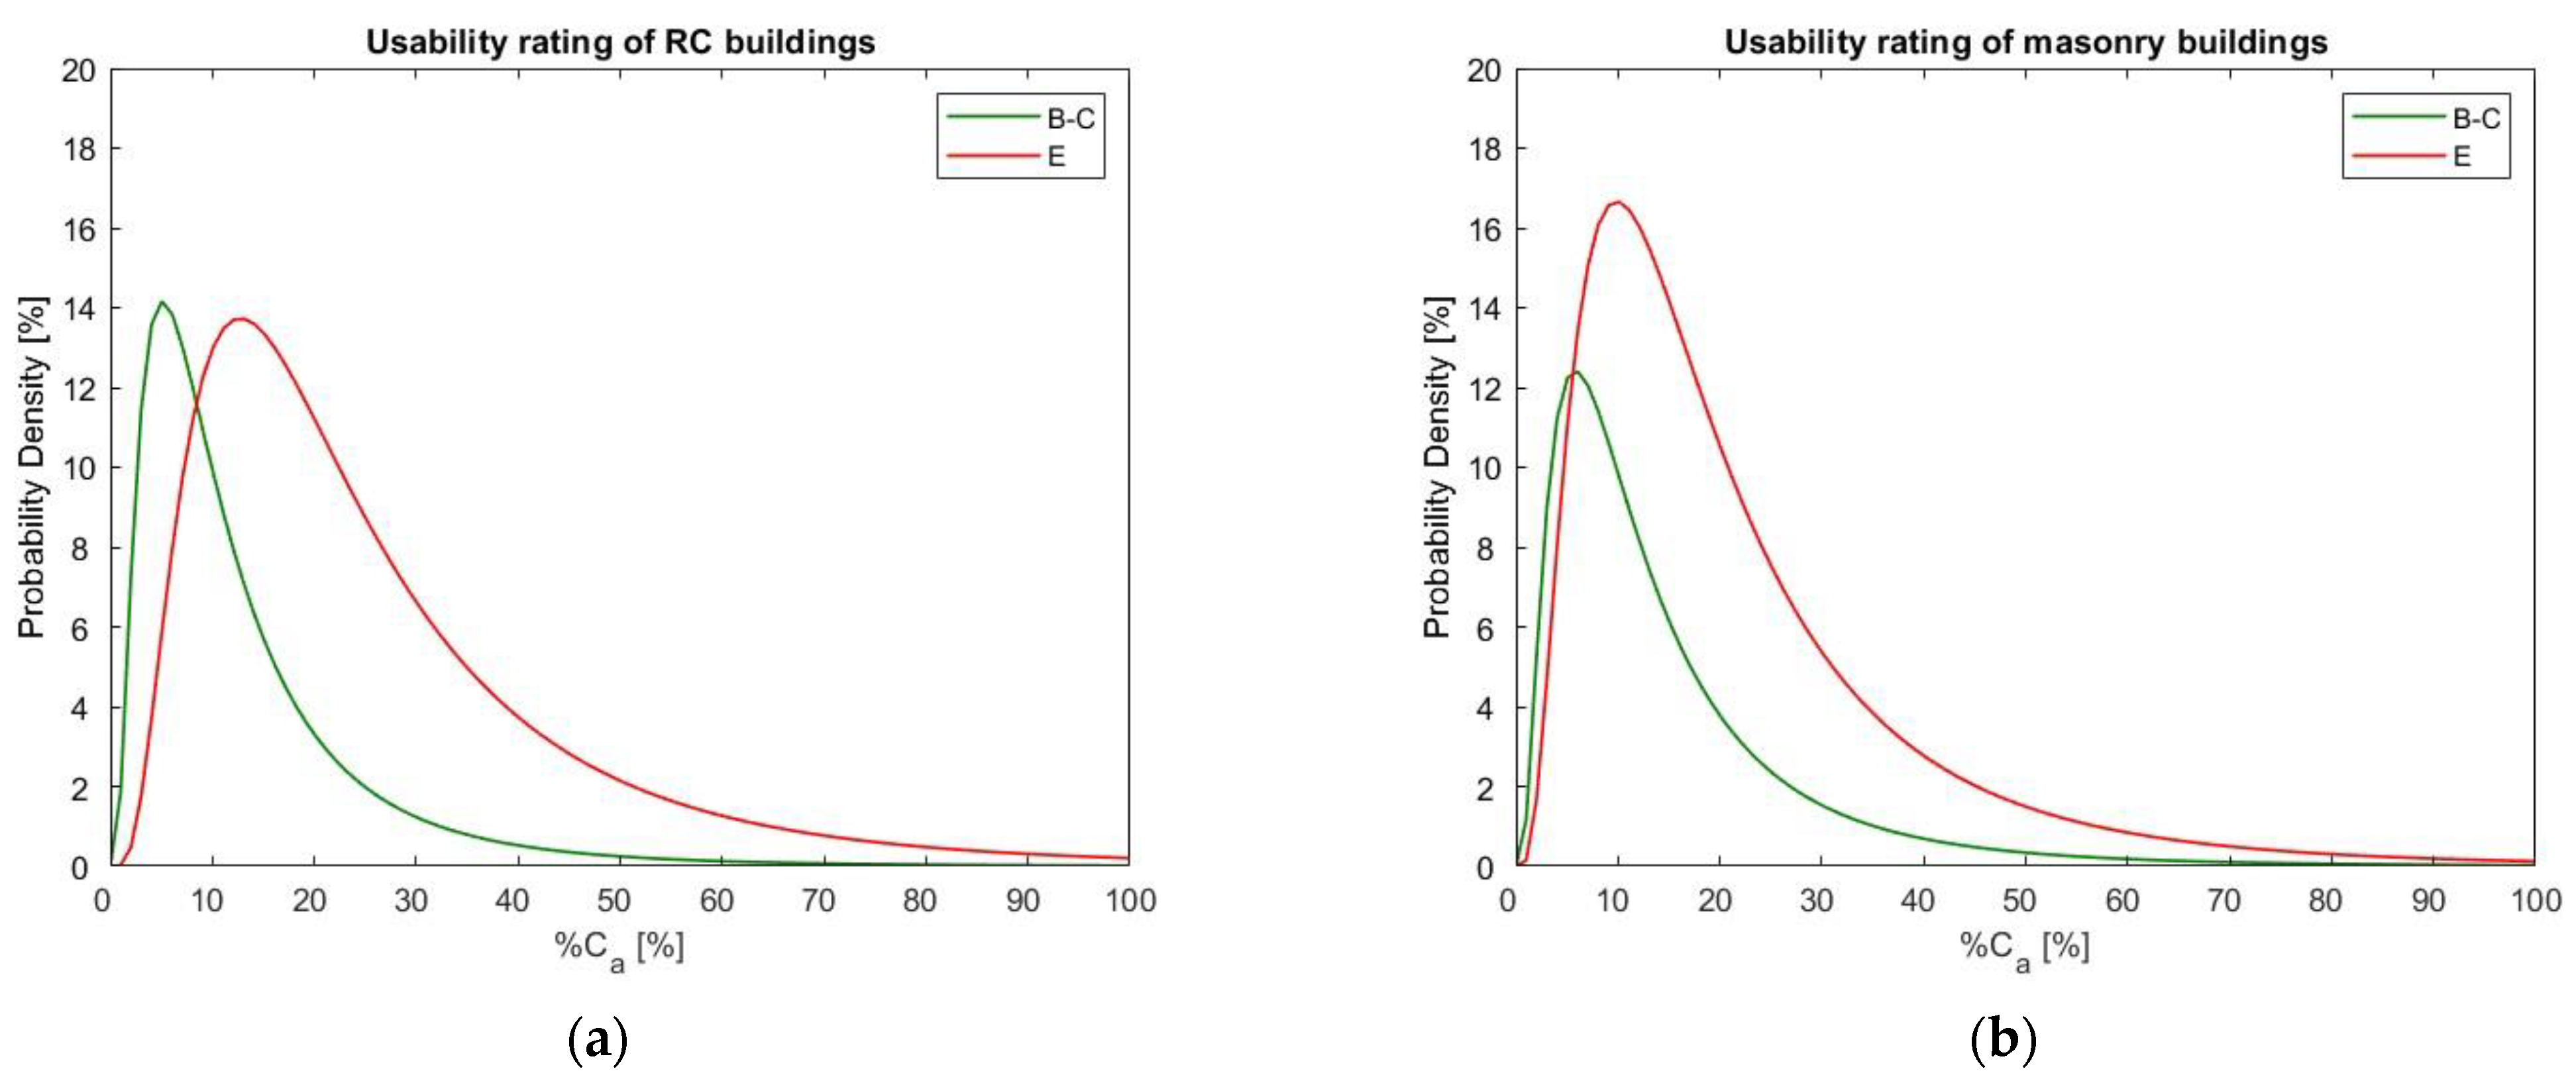
To describe the assistance population costs in terms of percentage cost with regards to the reference unit cost of a new building, namely %
Ca [
15], these costs have been connected to the building as a function of its level of damage.
Once %
Ca has been evaluated for each building, the relationship between level of damage and %
Ca has been investigated.
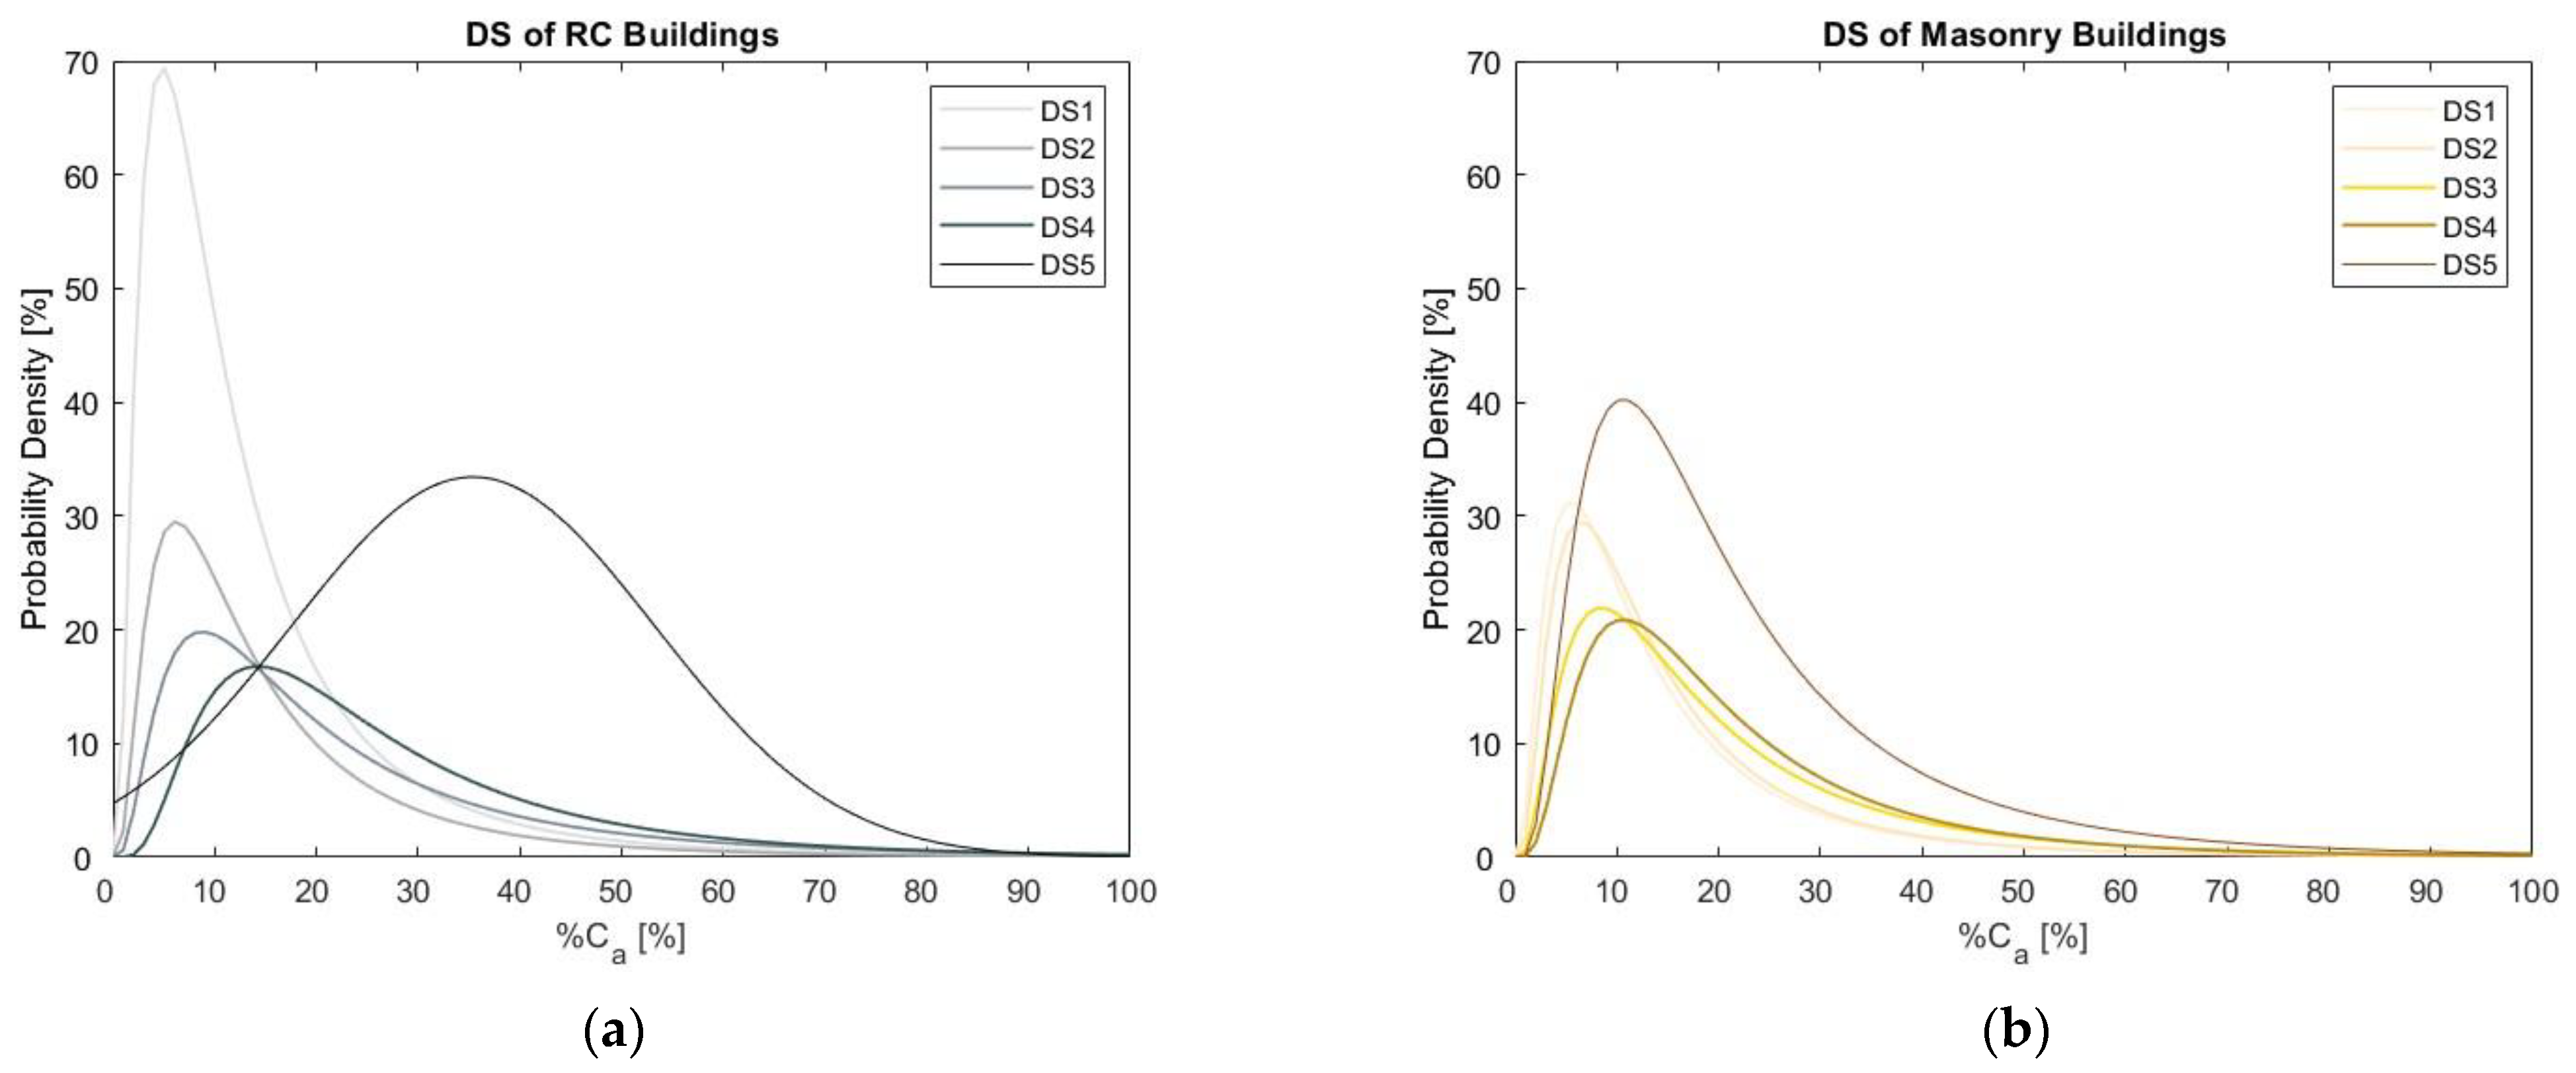
Figure 10 shows the best fitting PDF of %
Ca for
RC and masonry buildings as a function of usability ratings.
Analogously,
Figure 11 shows the best fitting probability density function (PDF) of %
Ca for
RC and masonry buildings as a function of
DS.
The PDF key parameters to derive the probability distribution functions of
Figure 10 and
Figure 11 are reported in [
15].
The PDFs of %Cr and %Ca can be used to assess seismic loss scenarios at large scale; they enable correlation between repair and population assistance costs to damage (usability rating or damage states) determined by post-earthquake data or fragility curves.
Finally, through Task 4.4, a link between direct costs (measured in terms of repair costs) and indirect costs (measured in terms of population assistance costs) at the building level has been empirically established. This relationship, allowing for an immediate determination of %
Ca once %
Cr is derived through literature available procedures (e.g., Performance Assessment Calculation Tool (PACT) etc.), has been expressed as a trilinear %
Cr–%
Ca relationship as follows:
Note that the 5%Cr and 25%Cr limits of the trilinear function were defined by considering the 84th percentile of %Cr for A rating and B–C rating buildings, respectively.
5. Conclusions
In the framework of the 2019–2021 ReLUIS (Network of the University Laboratories of Seismic Engineering) research project, the Work Package, WP4 “Seismic Risk and Damage Maps at National scale—MARS”, and in particular Task 4.4—“Risk: evaluation of consequences and economic losses”, specifically focused on the definition of tools and functions to predict direct and indirect losses due to seismic actions. The work carried out involved the assessment and calibrations of models and tools to derive human casualties, deaths and injured as well as repair costs and population assistance costs associated with buildings damaged by seismic actions. To this aim, the effects of seismic actions on buildings were analysed in terms of buildings’ usability and damage state (DS).
The studies carried out to evaluate Casualty Estimation Models (CEMs) allowed for the clarification of strong and weak points of models in the available literature and to calibrate an updated model to estimate human casualties (deaths and injured) for the Italian context. It explicitly accounts for the occupancy rate at the time of the event; the casualty rates depend on the severe damage levels and the building types, reinforced concrete and masonry.
For the loss estimation, fragility curves in terms of loss-of-usability were defined for partially unusable and unusable buildings. The proposed models are suitable for implementing seismic risk scenarios for loss assessment. In fact, there is a strong relationship between usability and repair costs as well as the time required to assist the population, resulting in both direct and indirect losses.
The relationships to correlate usability ratings (immediately available in the post-earthquake) and DS (easily computable by using existing empirical or mechanical based fragility functions) were defined according to data collected in the reconstruction processes of recent Italian earthquakes. Consequence functions were also estimated to derive buildings’ repair costs, expressed as %Cr, the percentage ratio between actual repair costs (ACRs) and building reconstruction cost, CU, assumed as 1350 €/m2. The probability density functions expressing %Cr as a function of buildings’ usability ratings or DS were calibrated; they can be used to determine risk maps in a probabilistic framework by associating not only mean or percentile costs at given damage levels but also accounting for significant uncertainties related to the repair costs of structural and non-structural building components.
A strong effort aimed to define indirect losses expressed in the form of costs for population assistance. The analysis of population assistance costs allowed for the derivation of mean Cost/month/person, Ci, associated with several assistance forms commonly adopted in the post-earthquake emergency phases (i.e., tents; hotels; self-accommodation grant traditional temporary wooden-house units, M.A.P., innovative high quality and comfort standards housing modules). According to these data, the probability density functions expressing %Ca (the percentage ratio between population assistance costs and building reconstruction cost, CU) as a function of buildings’ usability ratings or DS were also calibrated. Finally, a relationship to directly correlate %Cr–%Ca has been calibrated.
The updated human casualty model and the newly proposed consequence functions in terms of reconstruction and assistance percentages relative to construction cost deliver very valuable information for policymakers. They will be used to consider expected losses for different scenarios and to compare these losses with the budget necessary for preventive interventions, as soon as models accounting for retrofitted buildings are developed in a fashion similar to the one used in this paper.
The activities carried out strongly allowed for the refinement of available tools and models to assess losses and to define reliable risk maps. Future studies are still needed to validate the estimation models, relationships and consequence function herein presented. In the future, the collection and analysis of data derived from other seismic events at national and international level are strongly required to achieve such crucial goals.


 ,
, 


