Article

Numerical Analysis of Concrete Deep Beams Reinforced with Glass Fiber-Reinforced Polymer Bars

Department of Civil and Environmental Engineering, College of Engineering, Al Ain Campus, United Arab Emirates University, Al Ain 15551, United Arab Emirates
*
Author to whom correspondence should be addressed.
Buildings 2023, 13(11), 2767; https://doi.org/10.3390/buildings13112767
Submission received: 2 October 2023 / Revised: 27 October 2023 / Accepted: 30 October 2023 / Published: 1 November 2023
(This article belongs to the Section Building Materials, and Repair & Renovation)

Abstract

:
This research aimed to generate data through a verified numerical model. The data were subsequently used to introduce a simplified analytical expression for the prediction of the shear strength of concrete deep beams reinforced with glass fiber-reinforced polymer (GFRP) reinforcing bars. A three-dimensional (3D) numerical simulation model for a large-scale GFRP-reinforced concrete deep beam (300 × 1200 × 5000 mm) was developed and validated against published experimental data. A parametric study was then conducted to examine the effects of key variables on the behavior and shear strength of GFRP-reinforced concrete deep beams. Eighteen 3D numerical models were developed to study the interaction between the concrete compressive strength (f’c), the shear span-to-depth ratio (a/h), the spacing between web reinforcement (s), and the shear strength. The a/h value was either 1.0 or 1.5. The values of f’c were 28, 37, and 50 MPa. The spacings between the web reinforcement, if present, were 100 and 200 mm. The results of the parametric study indicated that the shear strength of deep beam models increased almost linearly with an increase in f’c and a decrease in the stirrup spacing irrespective of the value of a/h. The strength reduction caused by increasing a/h was more pronounced for the beam models with the lower f’c and greater stirrup spacing. The simplified analytical expression introduced in the present study provided a reasonable prediction for the shear strength of GFRP-reinforced concrete deep beams.

1. Introduction

Reinforced concrete (RC) deep beams (i.e., shear span-to-depth ratio (a/h) ≤ 2 [1]) are typically used as transfer girders in buildings and bridges. The analysis of deep beams is considered a complex problem since these structural elements are influenced by both statical and geometric discontinuities and are referred to as discontinuity regions (D regions) [2,3,4]. The discontinuity in statical loading or geometry causes a complex flow of internal stresses and nonlinear distribution of longitudinal strains within the cross section. Nonmetallic fiber-reinforced polymer (FRP) reinforcing bars are considered a viable alternative to conventional steel reinforcement because of their high strength, light weight, and noncorrosive nature [5,6,7,8,9]. As such, the use of GFRP bars in RC deep beams eliminates corrosion problems and magnetic interference [5,6,7,8,9]. The problem becomes even more challenging when conventional steel reinforcing bars are replaced by nonmetallic reinforcement such as glass fiber-reinforced polymer (GFRP) bars.
Numerous studies examined the shear behavior of FRP-reinforced concrete deep beams without web reinforcement [10,11,12,13,14,15,16,17,18,19]. The shear capacity of deep beams reinforced with FRP bars improved with an increase in the value of a/h, the modulus of elasticity and reinforcement ratio of longitudinal FRP bars, and the concrete compressive strength [10,11,12,13,14,15,16,17,18,19]. Omeman et al. [10] reported that deep beams reinforced with carbon-FRP bars having a higher value of a/h and an increased effective depth exhibited a more catastrophic failure mode than that of their counterparts with a lower a/h and a reduced effective depth. The results of a study by Abed et al. [11] indicated that increasing the concrete strength of deep beams reinforced with longitudinal GFRP bars from 43 to 51 MPa (19%) increased the shear capacity by 44%. An additional increase in the concrete strength from 51 to 65% (27%) did not result in a proportional increase in the shear capacity, where an additional shear strength gain of 7% only was recorded [11]. Increasing the longitudinal FRP reinforcement ratio by 50 and 100% increased the shear strength by 46% and 70%, respectively [10,11]. Farghaly and Benmokrane [12] reported that increasing the longitudinal FRP reinforcement ratio controlled the widening of the shear crack, where an increase in the FRP reinforcement ratio by 80% resulted in an average reduction in the crack width of 47%. Increasing the section height reduced the normalized shear stress at the ultimate load of FRP-reinforced deep beams with an a/h of 1.0 [13]. The effect of the section size was insignificant for the deep beams having a beam height (h) ≤ 600 mm and an a/h of 1.2 and 1.7 [13]. Kim et al. [14] indicated that the increase in the shear capacity of FRP-reinforced deep beams due to decreasing a/h, increasing h, or the longitudinal reinforcement ratio can be ascribed to an increase in the angle of inclination and/or width of the inclined concrete strut that governed the beam failure. Liu et al. [15] reported that decreasing the a/h by 11 and 24% increased the shear strength of FRP-reinforced deep beams by 32 and 43%, respectively. An inverse linear correlation between the shear capacity and the cubic root of the shear span-to-effective depth ratio (a/d) was reported for deep beams reinforced with FRP bars [16,17]. Abu-Obaida et al. [18] reported that a significant increase in the longitudinal FRP reinforcement ratio together with the concrete strength was detrimental to the shear strength of FRP-reinforced short beams without web reinforcement due to a change in the mode of failure from strut crushing to diagonal splitting. Mohamed et al. [19] concluded that the use of vertical FRP stirrups improved the shear capacity of FRP-reinforced large-scale deep beams by 20%, whereas the use of horizontal web reinforcement solely was detrimental to the shear strength because of the high tensile strains in the horizontal bars that induced deterioration and softening of the concrete in the diagonal strut.
Despite their corrosion resistance, there are limitations that might hinder the widespread use of GFRP bars in the construction industry. Due to the reduced modulus of elasticity of GFRP, large-scale GFRP-reinforced concrete deep beams exhibit lower cracking load and less post-cracking stiffness than those of similar beams reinforced with conventional steel bars [20]. The GFRP reinforcing bars are vulnerable to degradation in properties when exposed to harsh environmental conditions [21,22]. Furthermore, the creep rupture phenomenon limits the efficient utilization of GFRP strength under service loads [5,21]. The surface texture would influence the bond behavior of GFRP bars particularly at elevated temperatures [23].
The performance prediction of GFRP-reinforced concrete deep beams is a challenging task. Although the strut-and-tie method (STM) satisfies principles of equilibrium and compatibility, existing codes adopting this method accentuate only its basic mechanics [24]. Furthermore, the uncertainties in defining the strength and dimensions of the idealized truss model adversely affect the accuracy of the STM [25,26]. As such, there is a need to develop a simplified analytical expression that can provide reasonable prediction for the shear strength of GFRP-reinforced concrete deep beams with web reinforcement. The development of such an analytical expression requires the analysis of reliable results of GFRP-reinforced concrete deep beams with different properties. Experimental testing of large-scale GFRP-reinforced concrete deep beams is considered an uneconomical solution to such data. The use of computers and numerical simulation tools have made it feasible to perform analyses of such complex structural members.
This research aimed to study the interrelationships between the concrete compressive strength, the shear span ratio, the spacing between web GFRP reinforcements, and the shear strength of GFRP-reinforced concrete deep beams through numerical analysis. A three-dimensional (3D) simulation model capable of predicting the structural behavior of GFRP-reinforced concrete beams was developed in this study using GID-ATENA® software v. 5.9 [27]. The results of the simulated model were validated against published experimental data. A parametric study was conducted to investigate the influence of key parameters affecting the structural behavior of GFRP-reinforced concrete deep beams. Based on the results of the parametric study, a refined simplified analytical formula was introduced for the shear strength prediction of GFRP-reinforced concrete deep beams.

2. Research Objectives

Numerical analysis is considered a valuable alternative to experimental testing, particularly for large-scale GFRP-reinforced concrete deep beams. The data generated through verified numerical modeling can be utilized to develop a simplified analytical expression that can be used by practitioners for the shear strength prediction of GFRP-reinforced concrete deep beams. The specific objectives of this research were as follows:
  • Develop a three-dimensional (3D) numerical simulation model for a large-scale deep beam internally reinforced with GFRP bars.
  • Verify the prediction of the numerical model through a comparative analysis with published experimental data.
  • Conduct a parametric study to examine the effects of key parameters on the shear behavior of concrete deep beams internally reinforced with GFRP bars.
  • Introduce a refined simplified analytical formula that can predict the shear capacity of concrete deep beams reinforced with GFRP bars.

3. Model Development

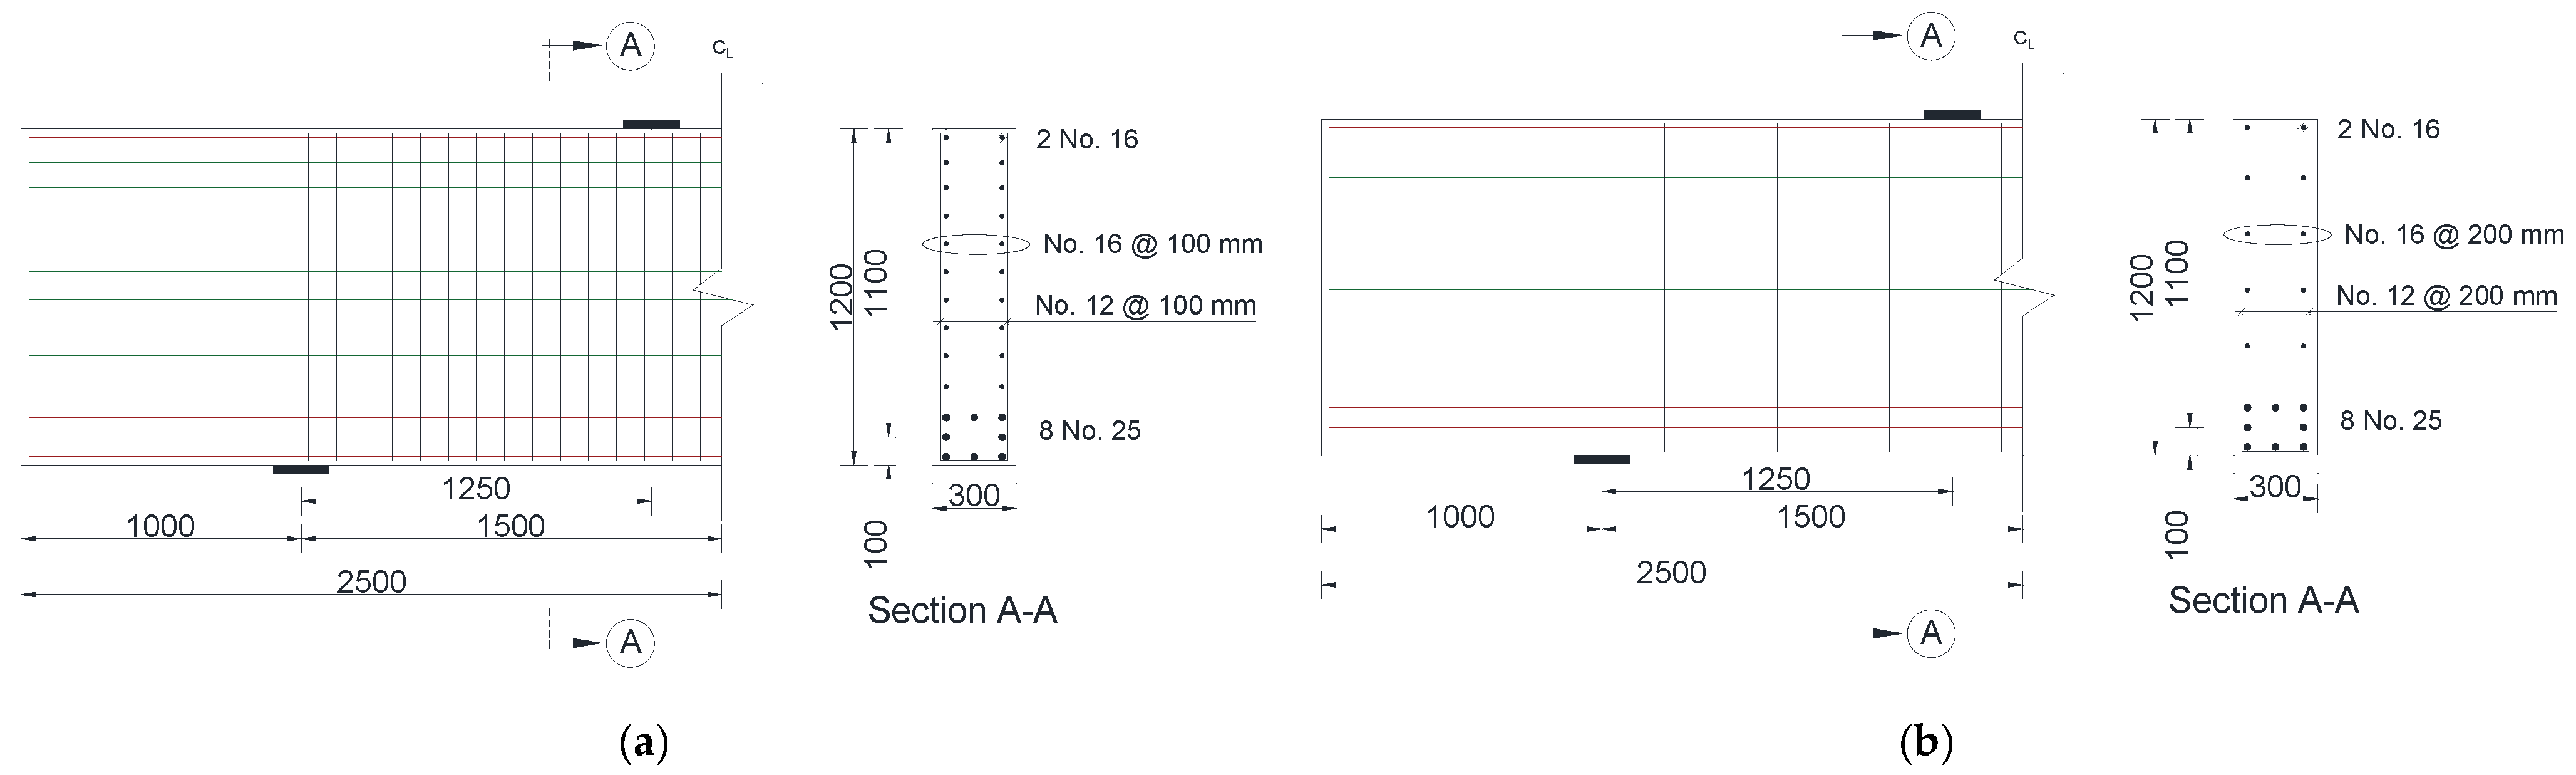
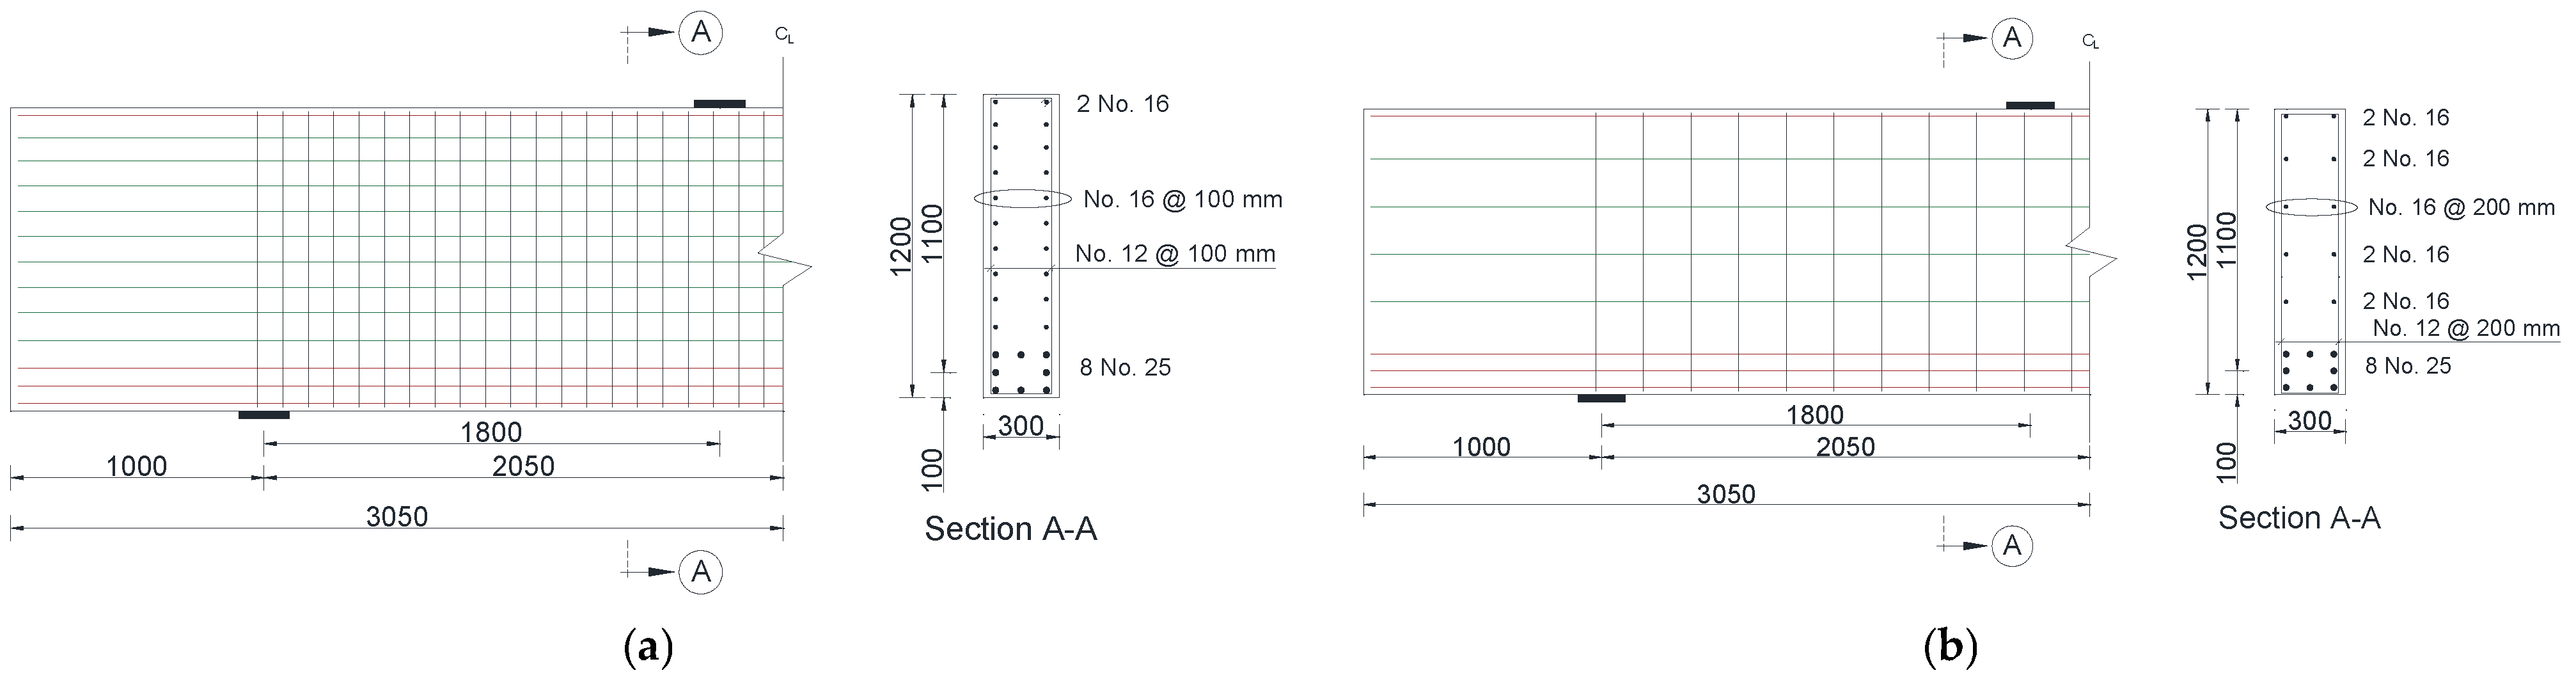
3.1. Geometry and Properties of Materials

A deep beam model was developed for the purpose of verification against published experimental data [20]. The deep beam model had a rectangular cross-section of 300 mm in width and 1200 mm in depth. The length of the beam was 5000 mm with an effective span of 3000 mm. The shear span-to-depth ratio (a/h) was 1.04, resulting in a shear span of 1250 mm and a constant moment region of 500 mm. Figure 1 shows the concrete dimensions, the details of reinforcement, and the location of monitoring points on the GFRP reinforcing bars of the modeled deep beam. The beam was reinforced with eight longitudinal GFRP reinforcing bars with a diameter of 25 mm (No. 25) at the tension side and two GFRP bars with a diameter of 16 mm (No. 16) at the compression side. The concrete cover to the center of the tensile GFRP reinforcement was 100 mm, rendering an effective depth of d = 1100 mm. The web reinforcement included vertical and horizontal GFRP bars with diameters of 12 mm (No. 12) and 16 mm (No. 16), respectively, placed at a spacing of 200 mm in both directions. Steel plates (200 mm × 300 mm × 30 mm) were placed at the load and support points to reduce the stress concentration at these locations. The cylindrical compressive strength (f’c) of the concrete was 37 MPa. GFRP bars No. 12, 16, and 25 had cross-sectional areas of 127, 198, and 507 mm2; guaranteed tensile strengths of 1019, 1184, and 1000 MPa; and elastic moduli of 50.0, 62.5, and 66.4 GPa, respectively [20]. It is noteworthy that the bent portions of the vertical stirrups had a guaranteed tensile strength of 459 MPa [20].

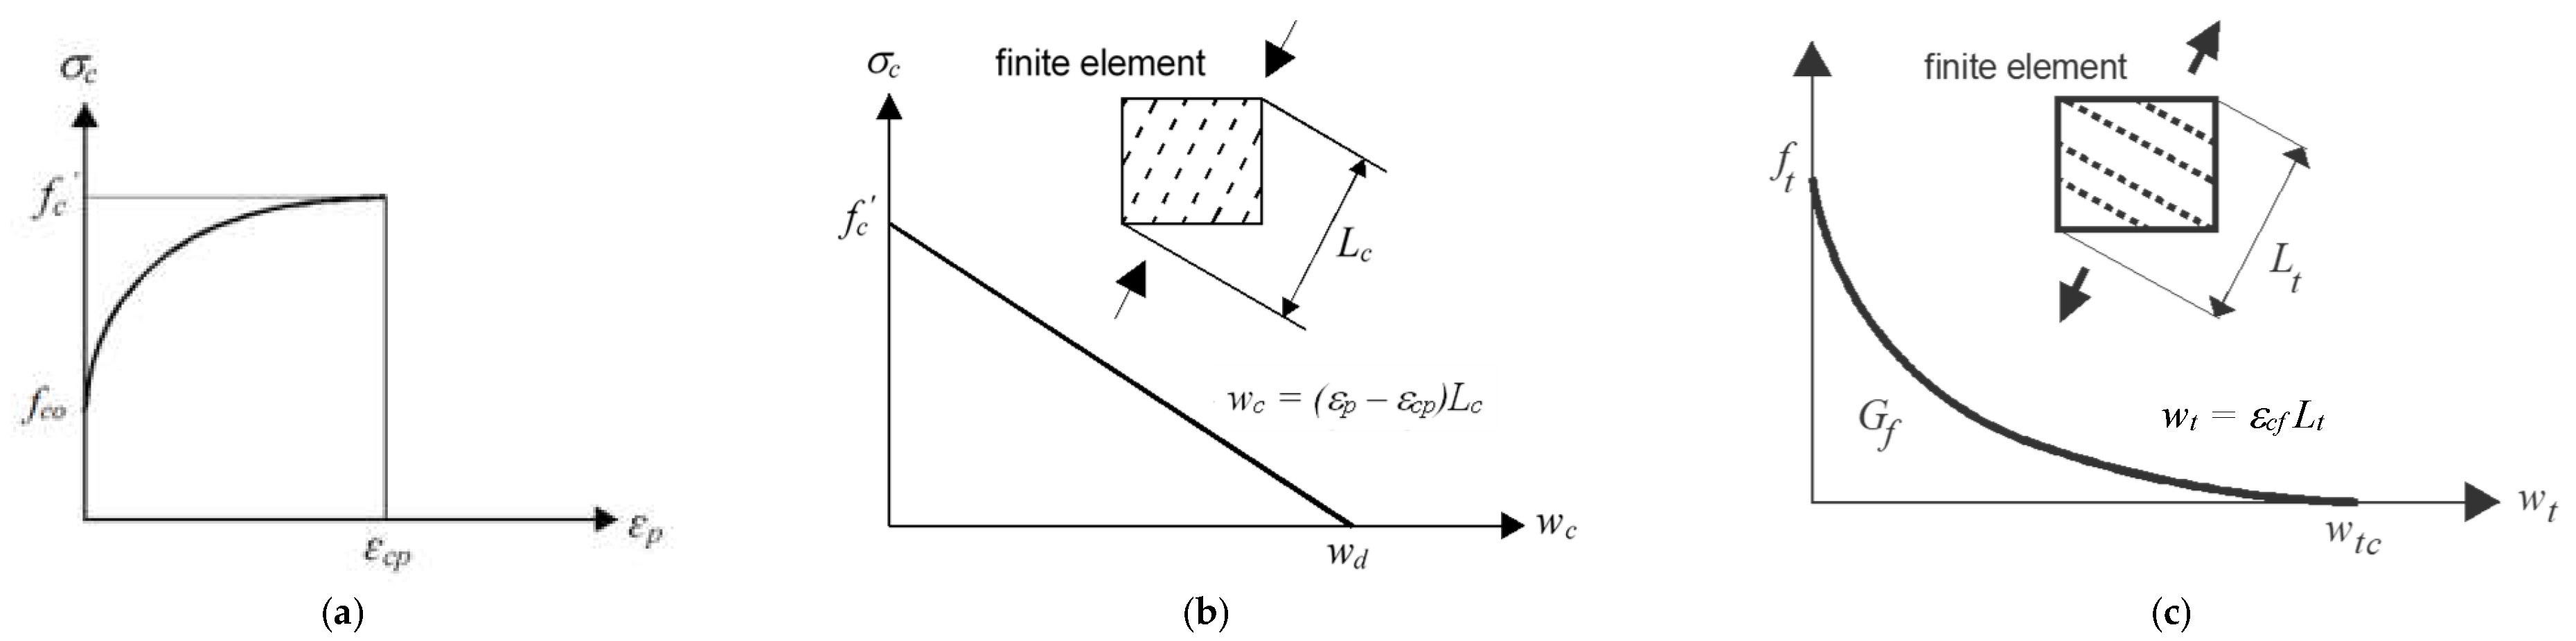
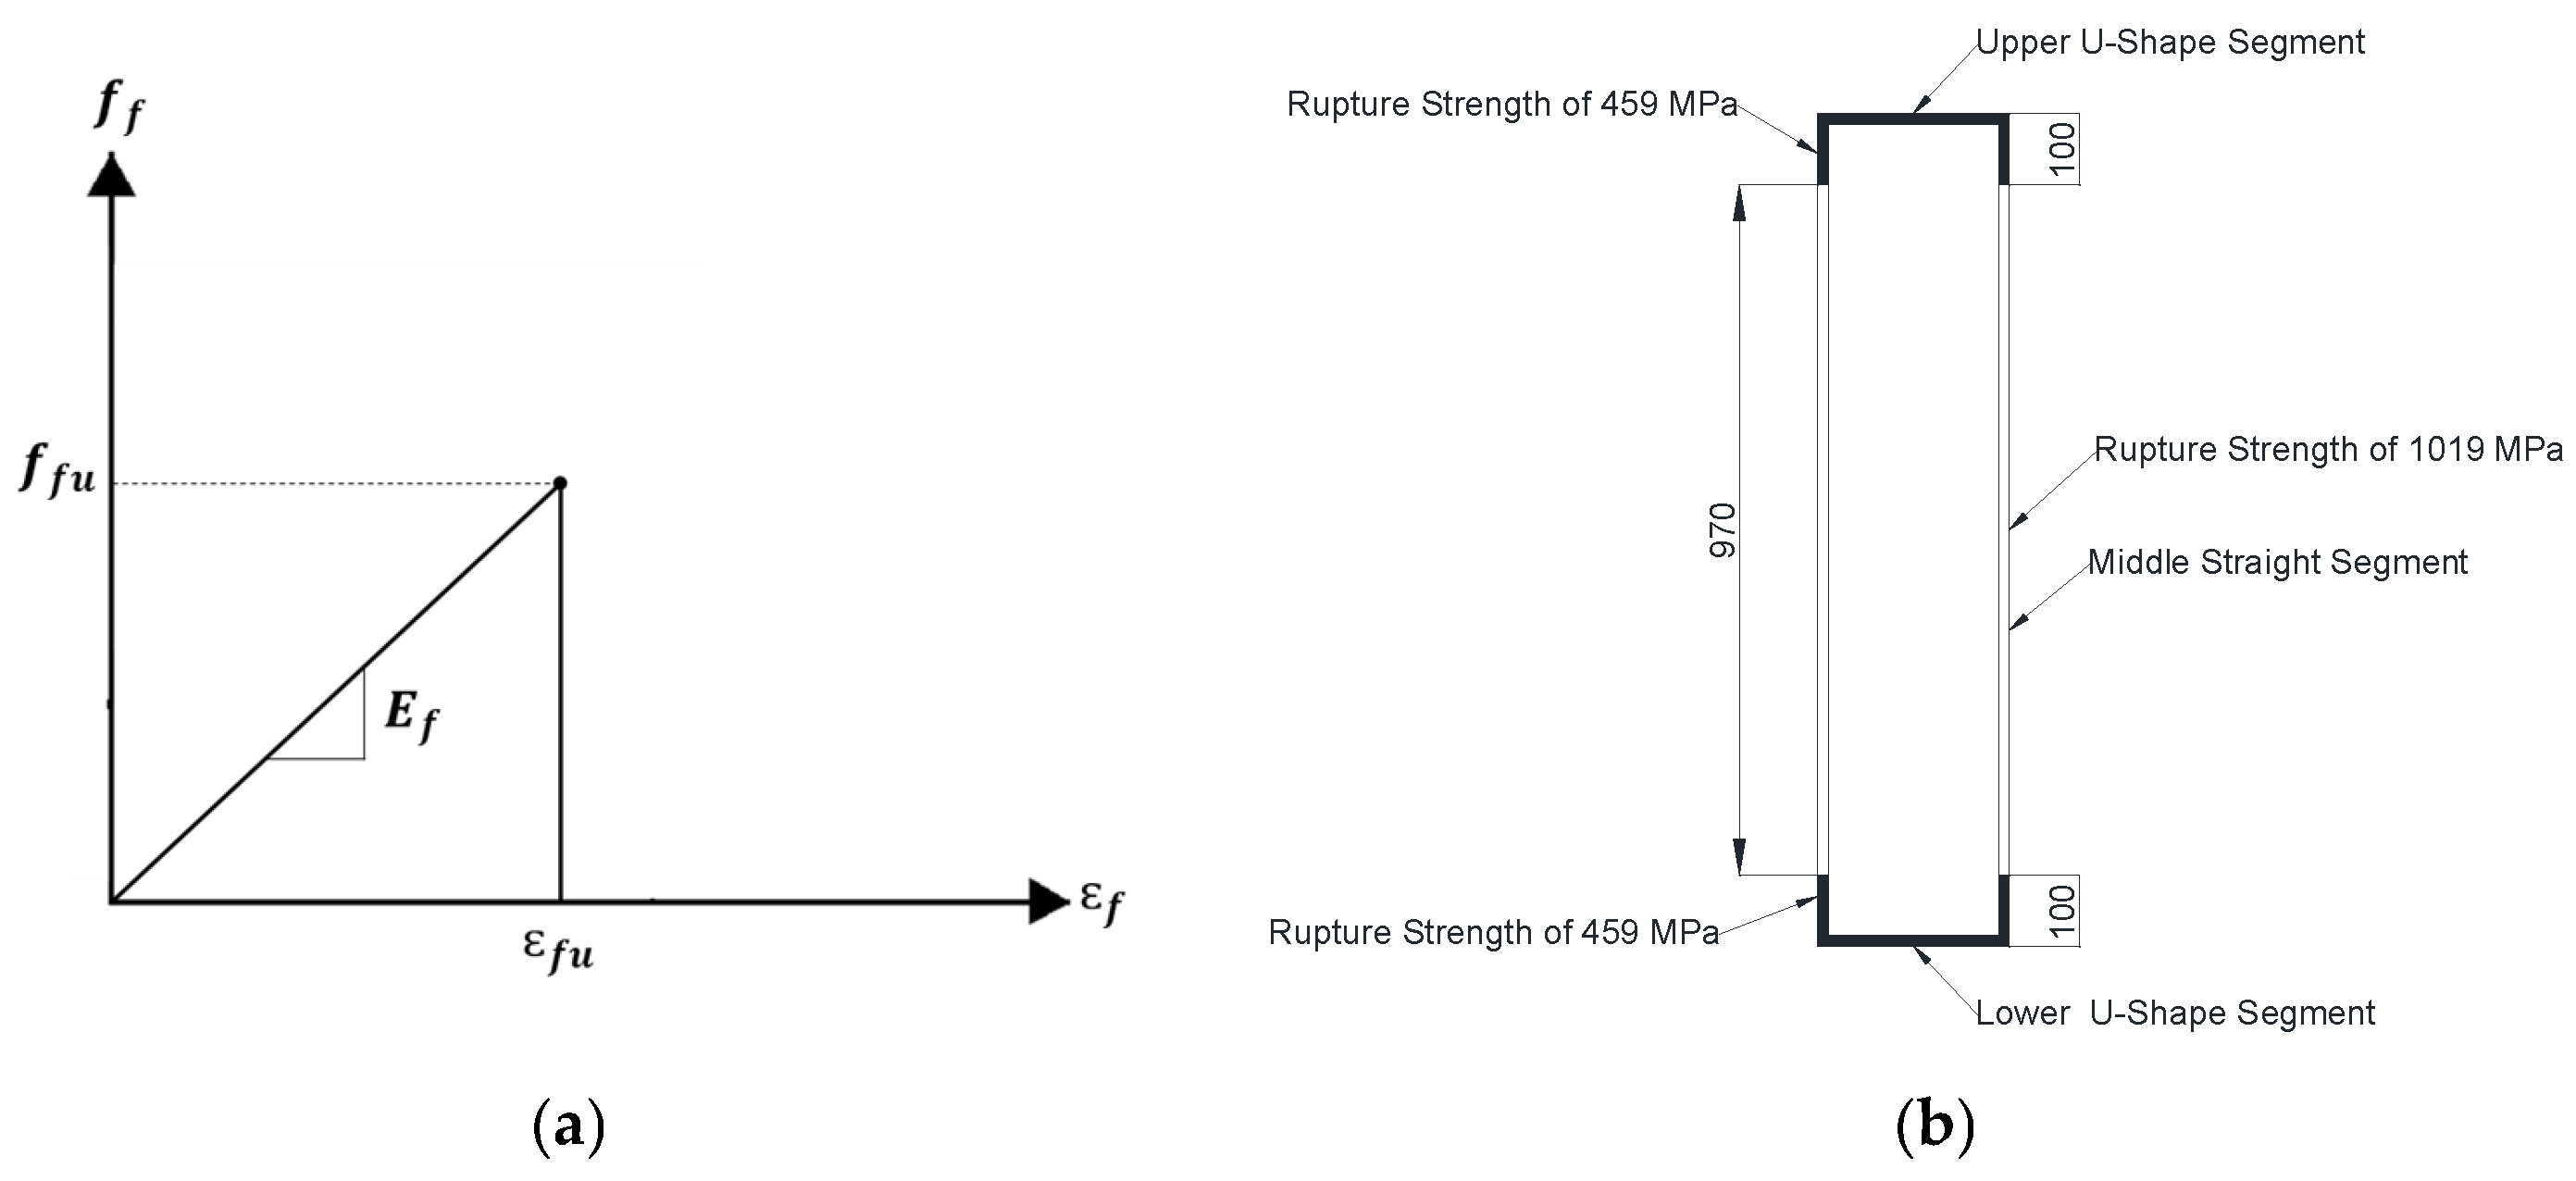
3.2. Material Constitutive Laws

The constitutive model of the concrete (CC3DNonLinCementitious2) was adopted in the numerical analysis. The uniaxial constitutive laws of concrete in compression and tension are shown in Figure 2. As shown in Figure 2a, the non-linear compressive behavior starts at a stress value of f’co = 2.1ft, where ft is the concrete tensile stress that is generated automatically by the software based on the concrete compressive strength [27]. The strain hardening phase ends at a peak stress of f’c and a corresponding plastic strain εcp generated automatically by the software based on the concrete compressive strength [27]. The compressive softening law is linearly descending as depicted in Figure 2b. The compressive stress is inversely proportional to the compressive displacement (wc) through the length scale (Lc). The value of wc can be calculated by (εpεcp)/Lc at any plastic strain value εp. The compressive displacement (wd) is reached at the complete release of stress and has a value of 0.5 mm [27]. The tensile softening law of concrete is shown in Figure 2c.
The built-in fracture model of the concrete adopts the classical orthotropic smeared crack approach and crack band concept. Within the smeared concept, the fixed crack model was adopted in the present study. In such a case, the direction of the crack is determined by the direction of the principal stress at the onset of crack initiation. The crack direction is fixed upon its initiation representing the axis of the orthotropy of the concrete material [27]. The softening behavior of concrete in tension is characterized by an exponential function linking the tensile stress (σt) to the crack opening displacement (wt) through the length scale (Lt). The value of wt is calculated by the product of the fracturing strain (εcf) and Lt. The complete release of tensile stress is reached at a specific crack opening (wtc) that is generated by the software based on the values of ft and the specific fracture energy of the material (Gf). The key input parameters of the concrete material used in the analysis along with their corresponding built-in equations are provided in Table 1 [27]. It is noteworthy that adopting the smeared approach to model cracking means that material properties defined for a material point are valid within a certain material volume, which is in this case associated with the entire finite element.
Figure 2. Concrete constitutive laws: (a) compressive hardening, (b) compressive softening, and (c) tensile softening.
Buildings 13 02767 g002
The GFRP bars were modeled as linear elastic until failure (Figure 3a). The symbols Ef, ff, ɛf, ffu, and ɛfu refer to the elastic modulus, stress, strain, ultimate strength, and ultimate strain of the GFRP bars, respectively. The ultimate strength of the bent portions at the corners of the GFRP stirrups (459 MPa) was lower than that of the straight portions (1019 MPa). As such, it was necessary to divide the stirrups into segments so that a lower strength could be assigned to the corner segments. The vertical GFRP stirrups were divided into four components: two U-shaped segments in the upper and lower parts and two straight segments for the remaining parts of the stirrups’ legs as shown in Figure 3b. It is noteworthy that all segments of the stirrups were fully connected to each other, thus simulating stirrups with different properties at the corners. The steel plates placed at the load and support points were modeled as linear elastic. A perfect bond was assumed between the GFRP reinforcing bars and the concrete. A previous study indicated the adequacy of this assumption to provide a reasonable prediction of the ultimate load capacity of GFRP-reinforced concrete members [28]. The comparative analysis between the prediction of the simulation model and the published experimental results, presented in Section 4, verifies the validity of this assumption. It is imperative, however, to consider the degradation in the mechanical properties and the bond characteristics of GFRP reinforcing bars reported in the literature [21,22,23] when simulating the behavior of GFRP-reinforced concrete structural members exposed to harsh environmental conditions.
Figure 3. GFRP models: (a) tensile stress–strain response of straight GFRP bars and (b) segments of the vertical stirrups (dimensions are in mm).
Buildings 13 02767 g003
Table 1. Input data for concrete properties.
ParameterDescriptionEquationValueUnit
f’cCompressive
strength
N/A37.00MPa
EcElastic
modulus
21,500 × f c 10 1 3 33,254MPa
ΜPoisson’s
ratio
Default value0.2N/A
ftTensile
strength
f t = 0.3 f c k 2 3 f c k = f c 8 2.83MPa
GfSpecific fracture
energy
G f = 0.000025 f t 70.75N/m
εcp*Plastic concrete strain at
compressive strength
f c / E c 0.0011N/A
f’coOnset of non-linear behavior in compression2.1 ft5.94MPa
wdCritical compressive
displacement
N/A0.50mm
εcp* = ε c o ε r e , where, ε c o = total strain at compressive strength (2 f c / E c ) [29] and ε r e = elastic recovered strain at compressive strength ( f c / E c ).

3.3. Element Types and Boundary Conditions

The concrete and steel plates were modeled using solid 3D brick elements, whereas the GFRP bars were modeled as one-dimensional discrete elements embedded into the concrete brick elements. Modeling the reinforcement as discrete elements means that they remain in the uniaxial stress state. It is recommended by the software manual to have a minimum of four to six elements in the shortest dimension of the member to ensure the convergence of the solution, while minimizing the computational time [27]. The shortest dimension of the beam in this study is 300 mm, which corresponds to a minimum recommended mesh size in the range of 50 to 75 mm. A mesh sensitivity analysis was conducted using different mesh sizes of 100, 75, 50, and 35 mm. The difference between the prediction of the model with 50 mm mesh size and that of the models with 100 and 75 mm mesh sizes was within 17%. In contrast, the difference between the prediction of the model with 35 mm mesh size and that with 50 mm mesh size was only 6%, indicating the stabilization of the numerical results. As such, a mesh size of 50 mm was selected to optimize the processing time since further reduction in the mesh size had a negligible effect on the numerical prediction. To take advantage of the plane of symmetry in the geometry and loading condition and reduce the overall computational time, only half of the beam was modeled. The used brick element had a dimension of 50 × 50 × 50 mm, rendering a total of 7200 elements within the half beam model. The movements in the vertical and transverse directions of the bottom steel support plate were restricted by means of a line support placed at the middle of the bottom surface of the plate. Surface supports were used to restrain the movement of the plane of symmetry in the longitudinal direction. The modeled deep beam was loaded by an imposed incremental displacement at the middle of the top steel plate at a rate of 0.1 mm per step. The load and midspan deflection were monitored by means of monitoring points placed at the corresponding locations. The top and bottom steel plates were connected to the beam through fixed contacts. The standard Newton–Raphson iterative solution method was adopted in the analysis. The iteration had to satisfy a tolerance limit of the convergence criteria of 1%. Figure 4a shows the meshed concrete of the modeled deep beam. Figure 4b shows the flexural and web reinforcements of the numerical model, noting that the meshed concrete was not displayed in Figure 4b for clarity.

4. Model Verification

This section presents a comparative analysis between the prediction of the modeled deep beam and the experimental results published in the literature [20]. The results in the comparative analysis included the load deflection response, ultimate load, deflection capacity, crack propagation, failure mechanism, and stresses and strains in the GFRP reinforcement. It is noteworthy that the total load (Ptotal) represents two times the plate load (Pplate), noting that the plate load equals the support reaction (Vu). Figure 5 shows the statical system of the deep beam investigated in the present study.

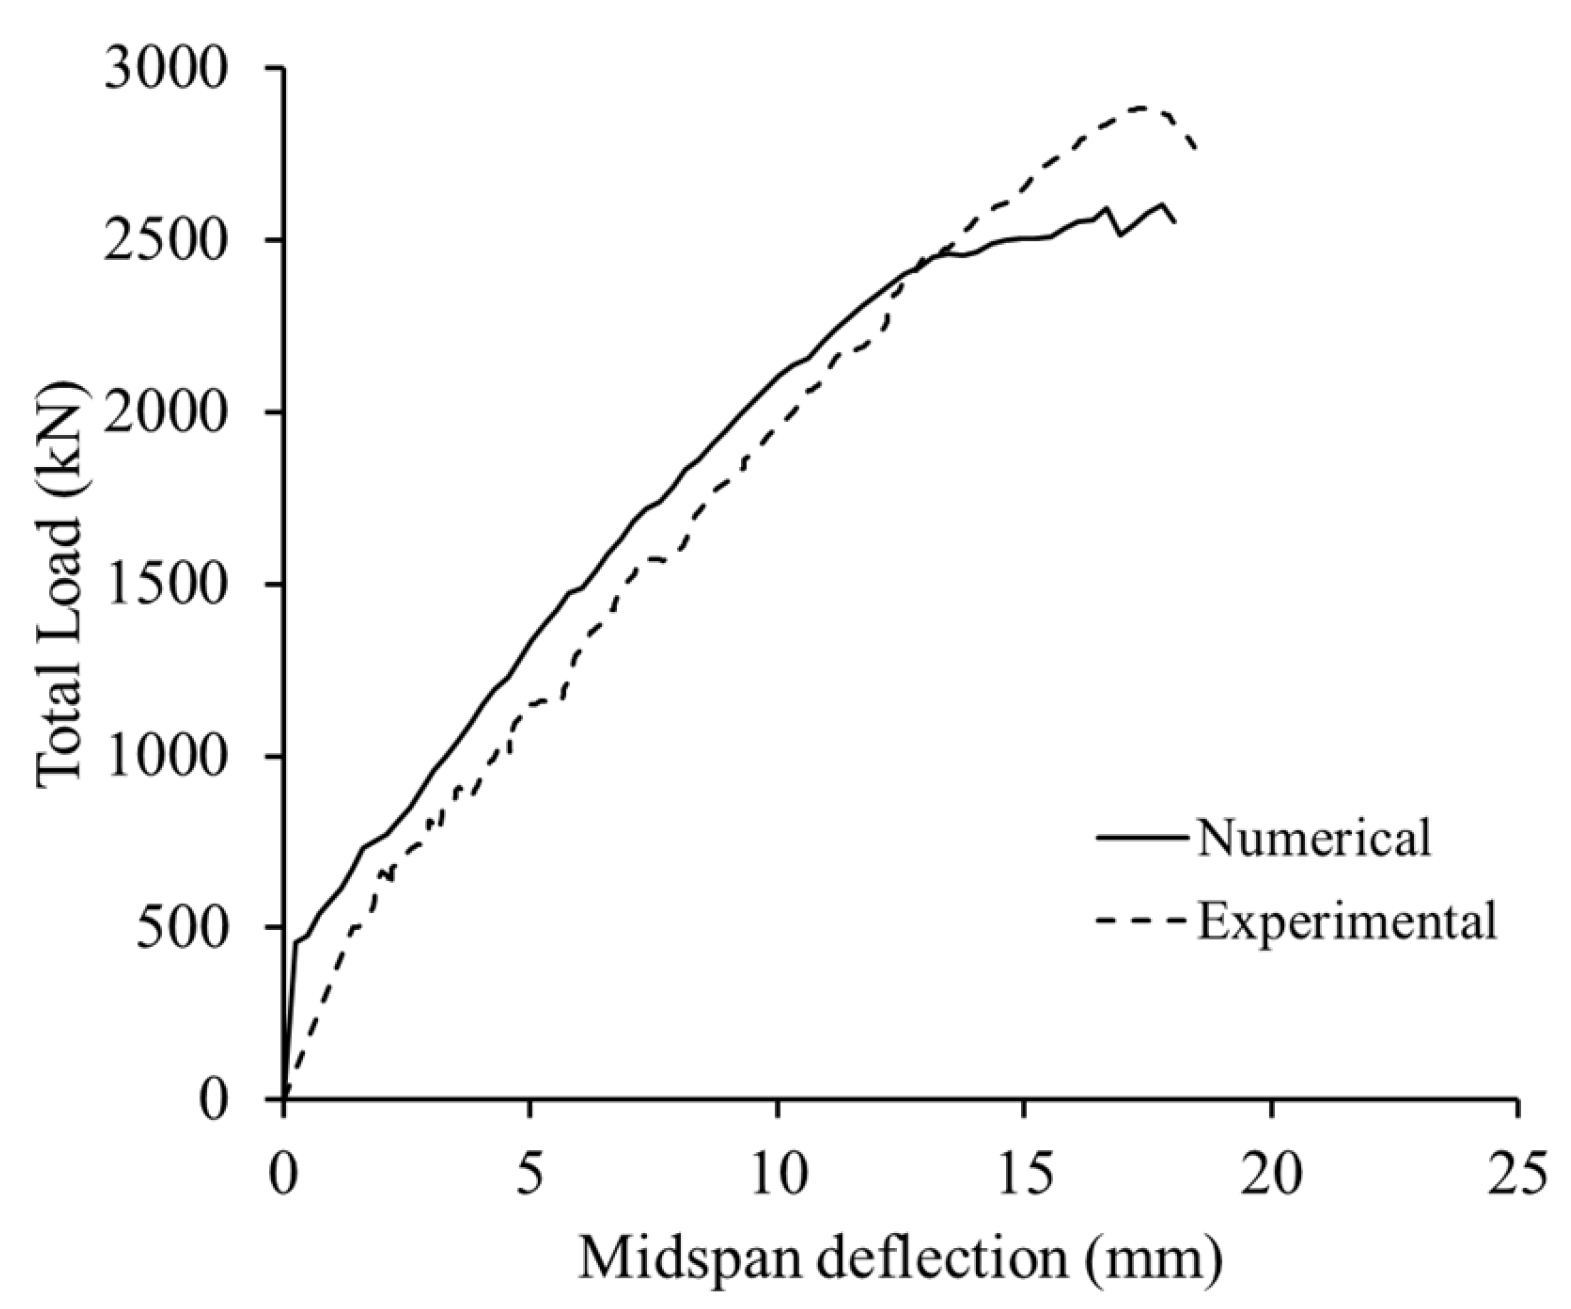
4.1. Load–Deflection Response

Figure 6 shows a comparison between the predicted and experimental load–deflection response. The response of the deep beam model started by a linear branch followed by a drop at the onset of initiation of cracking at an approximate load of 500 kN. Then, the deflection continued to increase but at a higher rate. There was a deviation between the pre-cracking stiffness predicted numerically and that measured experimentally. This behavior is expected, particularly, for such a large-scale deep beam. The actual deep beam could have had shrinkage cracks prior to testing due to its large surface area, which might have reduced its initial stiffness in the pre-cracking stage. It is noteworthy that the post-cracking stiffness of the beam predicted numerically almost coincided with that measured experimentally despite the probable minor settlement of the supports that could have happened during testing. Due to a progressive development of cracks in the post-cracking phrase, the deep beam model exhibited a quasilinear response that was in alignment with the experimental results. The post-cracking stiffness of the beam predicted numerically almost coincided with that measured experimentally. The experimental and numerical ultimate loads of the modeled deep beam were 2904 kN and 2601 kN, respectively. The difference between the numerical and experimental ultimate loads was within the 10% error band. The experimental and numerical deflection at ultimate loads of the modeled deep beam were 17.3 mm and 17.8 mm, respectively. The deviation between the deflection capacity predicted numerically and that obtained from the tests did not exceed 3%. The differences between the experimental and numerical results were within the typical margin of error considering the variability in the shear test results.

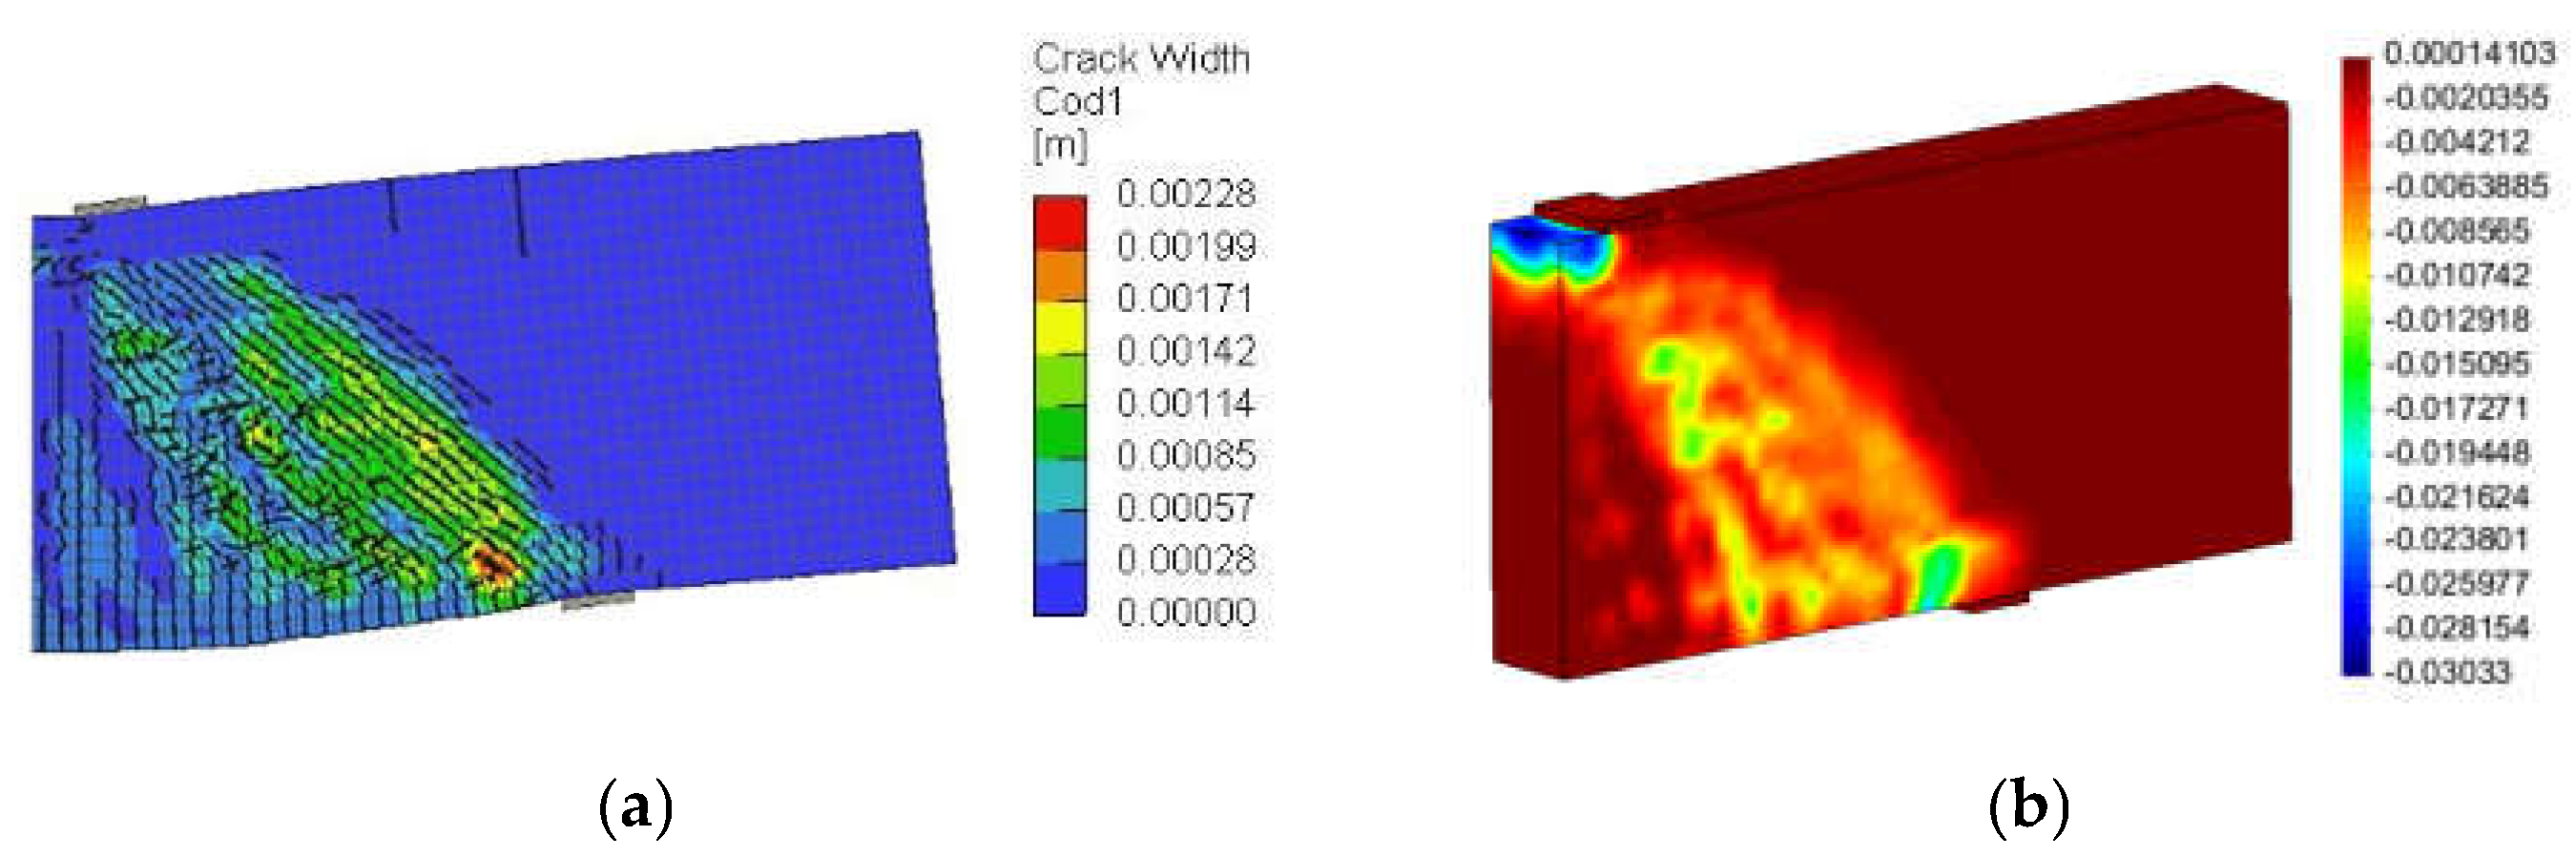
4.2. Crack Pattern and Failure Mode
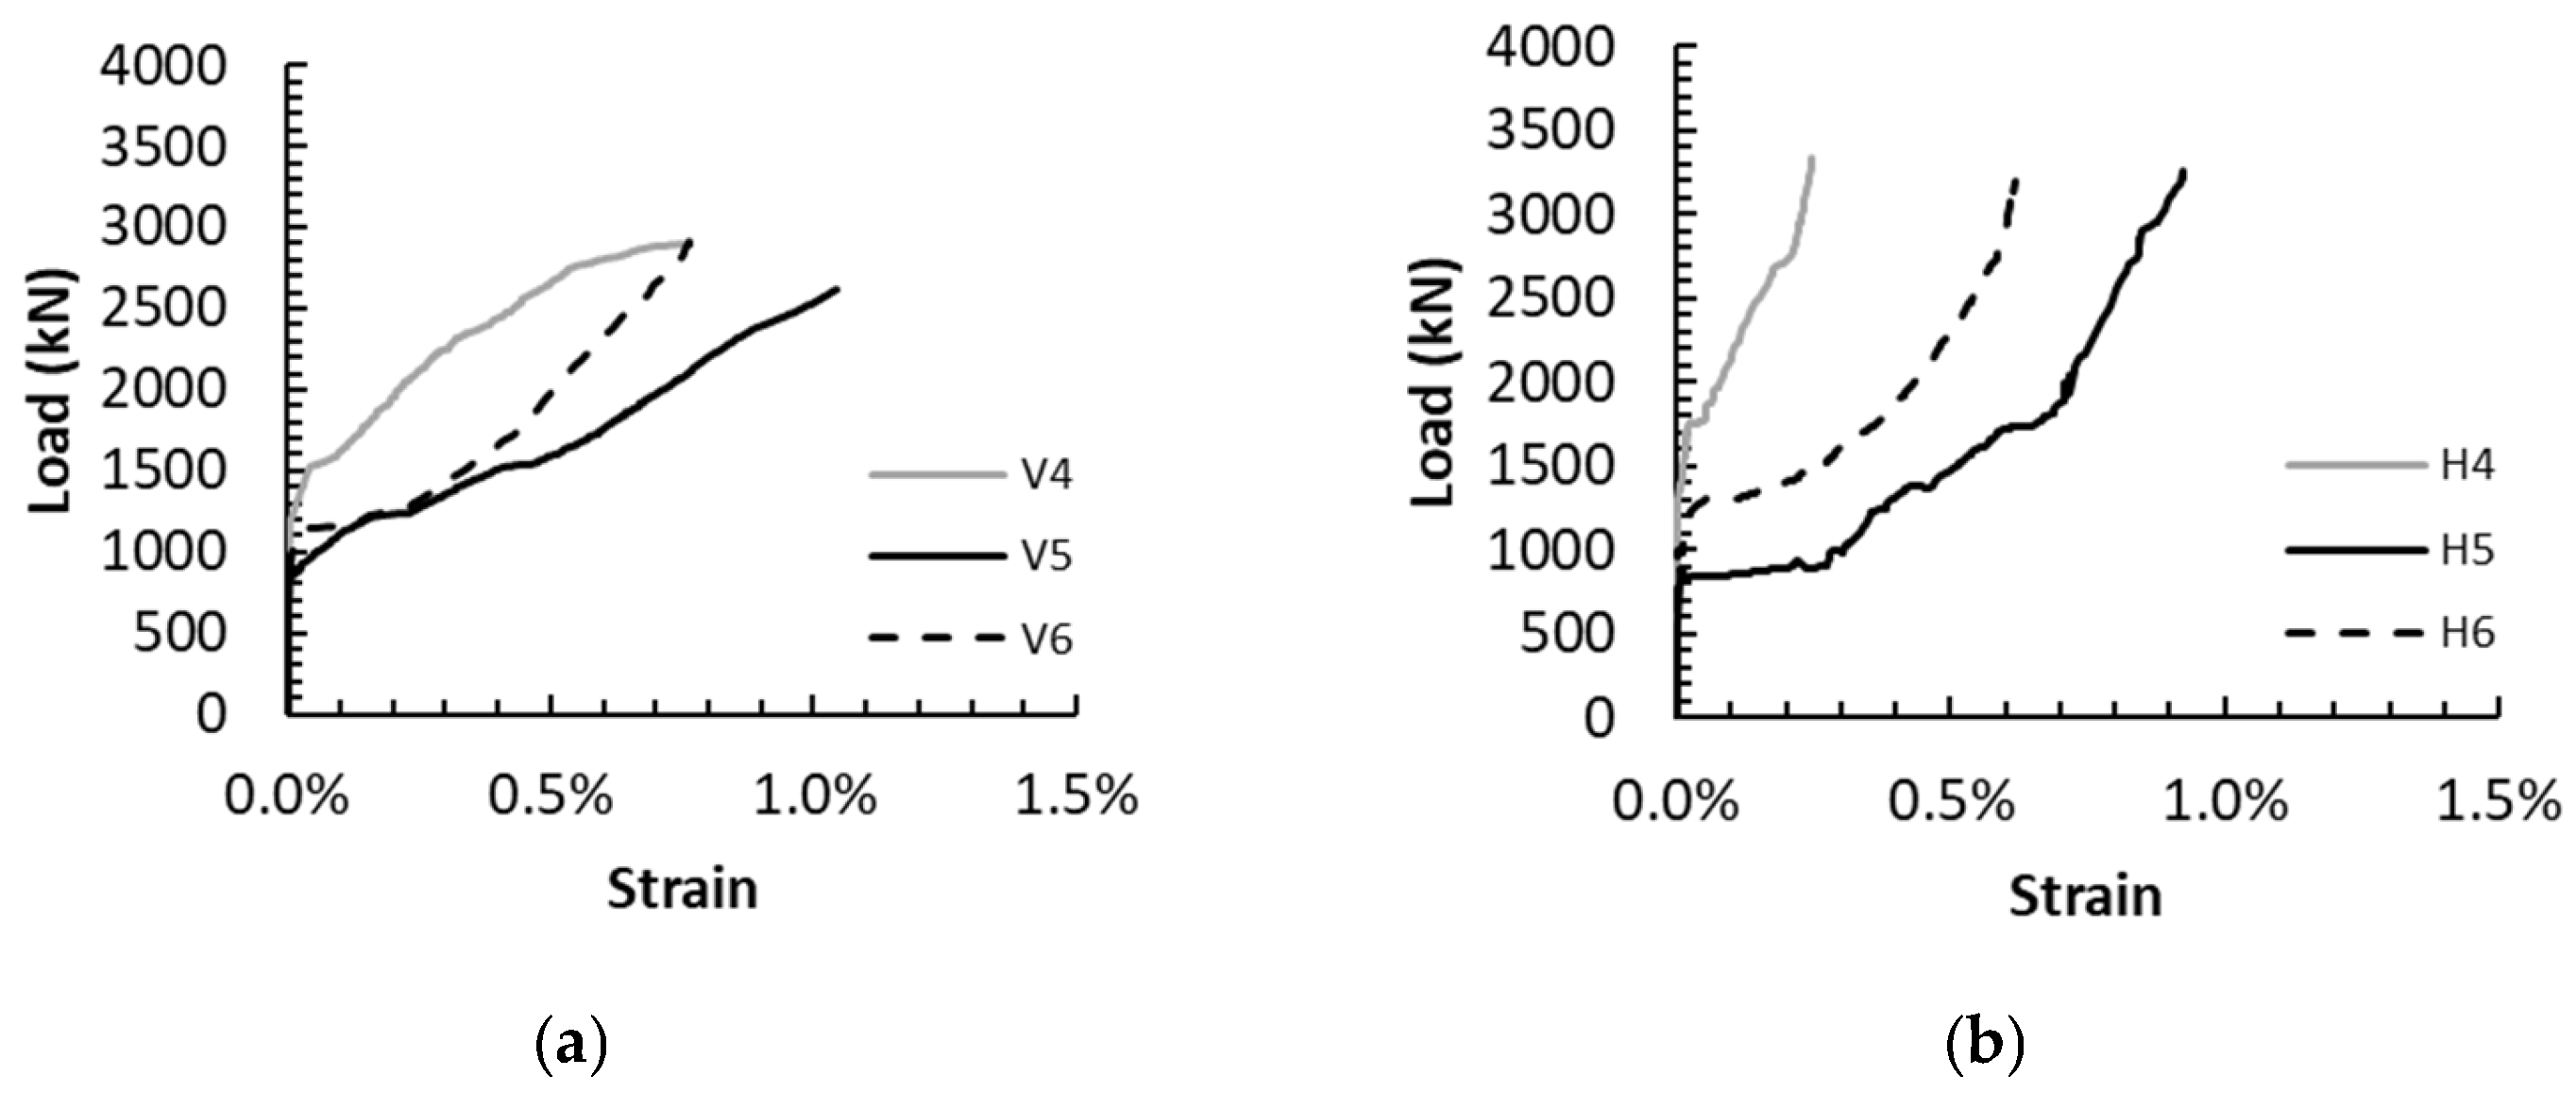
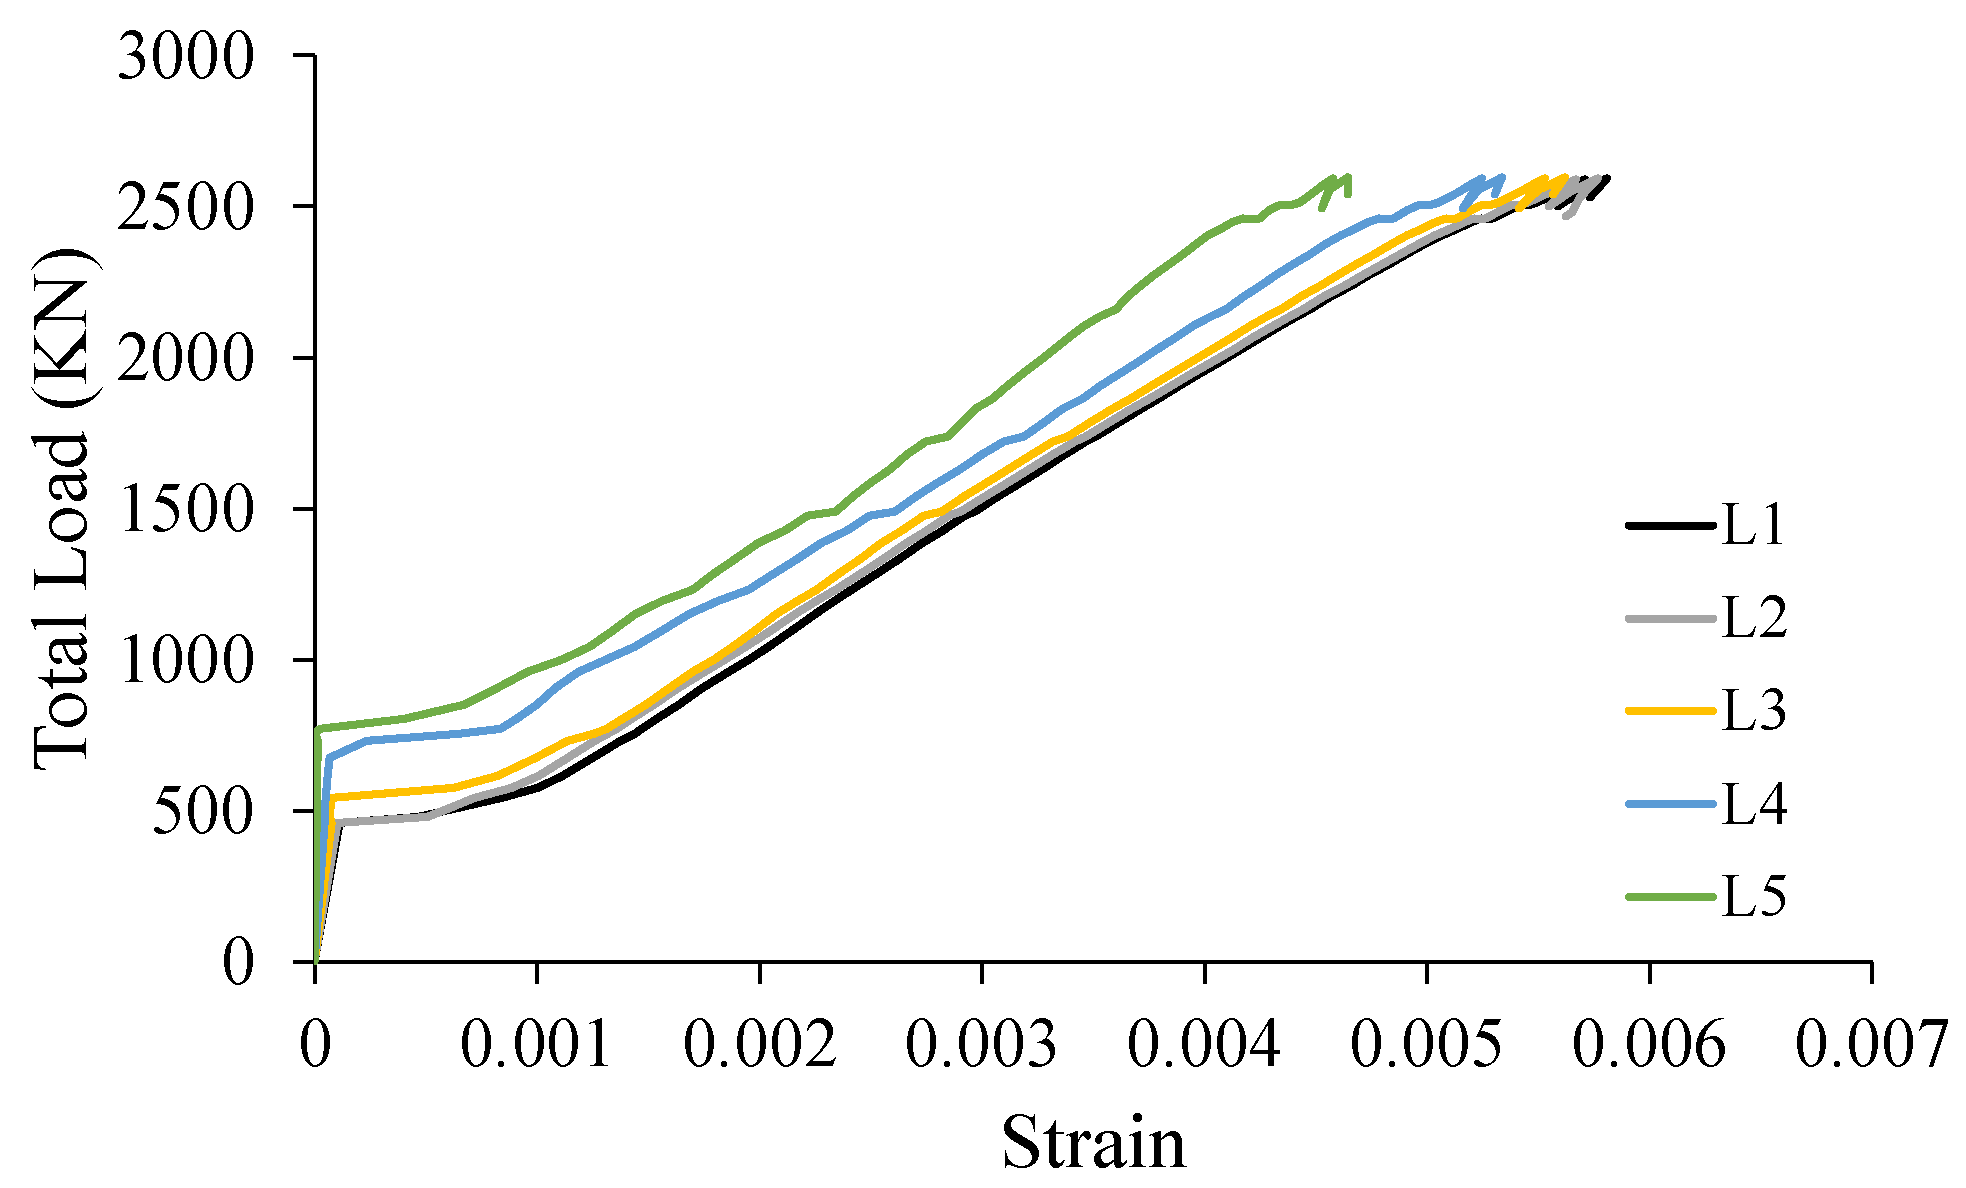
The numerical crack pattern and the minimum principal strain in the concrete at the ultimate load are provided in Figure 7a,b, respectively. The contours in Figure 7a show the distribution of cracks. Only cracks with a width ≥ 0.1 mm are marked with black lines since the minimum displayed crack width was set to be 0.1 mm. The numerical prediction indicated initiation of flexural cracks prior to shear cracks. The published data also indicated the initiation of flexural cracks early at 18% of the ultimate load before the development of any shear cracks [20]. Diagonal cracks were then formed in the shear span as the load progressed. Additional shear cracks were developed with an increase in the applied load defining the direction of a concrete diagonal strut between the load and support points. Eventually, DB-S failed by crushing of the diagonal concrete strut formed in the shear span as manifested in Figure 7a,b. Crushing of the diagonal strut in the shear span was verified experimentally in Reference [20].

4.3. GFRP Strains

The strains predicted numerically are plotted against the load in Figure 8. The measured GFRP strain responses at the same locations are shown in Figure 9. The numerical results indicated that the vertical and horizontal web reinforcing bars were not strained until shear crack developed in the shear span at a load value of approximately 1200 to 1500 kN. Following the shear cracking, the strain increased almost linearly until the ultimate load was reached. The rate of increase in the vertical GFRP stirrups in all monitoring points was almost identical. The strain in the vertical GFRP stirrups predicted numerically at the ultimate load was approximately 0.7%. The measured strains in the vertical GFRP stirrups at the ultimate load were on average 0.8%. The maximum strain predicted numerically in the horizontal GFRP bars at the ultimate load (approx. 0.4%) was lower than that recorded in the vertical stirrups. The strains measured experimentally in the horizontal bars were on average 0.5%. It is noteworthy that the strain predicted numerically in the horizontal GFRP bars closer to the tension face tended to increase at a higher rate than that of the horizontal bars closer to the compression face (Figure 8). Experimental measurements shown in Figure 9 verified the lower strains in the horizontal GFRP bars closer to the compression face (H4).
The strains predicted numerically in the flexural reinforcement are plotted against the load in Figure 10. A bi-linear strain response was recorded for the modeled deep beam. The strain response at all locations was insignificantly different, except at the region near the support (L5) having lower strains, verifying the arch action effect. The strain profile at four loading stages, 25, 50, 75, and 100% of the shear capacity, predicted numerically and obtained from the experiment, verified the uniform distribution of strains in the flexural GFRP reinforcement within the beam span except at the support location as shown in Figure 11a,b, respectively.

4.4. GFRP Stresses

Figure 12a–c show the stresses in the vertical stirrups, horizontal web reinforcement, and flexural reinforcement of the deep beam model at peak load, respectively. It can be seen that parts of the web GFRP reinforcement crossing the diagonal strut exhibited the highest stresses. As shown in Figure 12a, a concentration of stresses occurred in the top horizontal portion of the vertical stirrup under the load point. The stress in this location (450 MPa) was almost equal to that of the tensile strength of the bent portion of GFRP bars (459 MPa), indicating localized rupture of GFRP at this location. These numerical findings are consistent with the published experimental data, which indicated that the crushing of the diagonal concrete strut in the deep beam was accompanied by a localized rupture at the bent portion of the vertical stirrups [20]. The stresses in the horizontal and flexural GFRP reinforcements shown in Figure 12b,c, respectively, were well below their guaranteed rupture strengths. The maximum stress in the flexural reinforcement at peak load was 390 MPa (i.e., 39% of the tensile strength of straight GFRP bars). The maximum stress in the horizontal web reinforcement at peak load was 304 MPa (i.e., 26% of the tensile strength of horizontal web GFRP bars).

5. Parametric Study

The numerical model developed and verified in the current study predicted the performance of the GFRP-reinforced concrete deep beam with good accuracy. As such, it was adopted to further investigate the effect of varying the shear span-to-depth ratio (a/h) and concrete compressive strength on the behavior of GFRP-reinforced concrete deep beams with and without web reinforcements. These models had the same geometry and reinforcement as the model verified earlier. The results of the parametric study are presented in this section. The results include the load–deflection response, crack propagation, failure mechanism, and stresses in the GFRP reinforcement.

5.1. Deep Beam Models without Web Reinforcement

The parameters of the deep beam models without web reinforcement are summarized in Table 2. The variables were the value of a/h and the concrete compressive strength (f’c). The a/h value was either 1.0 or 1.5. The values of f’c were 28, 37, and 50 MPa, representing low (L), moderate (M), and high (H) concrete compressive strengths, respectively. Figure 13a,b show details of reinforcement of the numerical models of this group with a/h values of 1.0 and 1.5, respectively.

5.1.1. Load–Deflection Response

Figure 14a,b show the load–deflection responses of the deep beam models without web reinforcement having a/h values of 1.0 and 1.5, respectively. The beam models exhibited a bi-linear response, irrespective of the values of f’c and a/h. In the first stage, a linear response was recorded until the initiation of flexural cracks, which caused a change in the slope of the load–deflection response. Changing the concrete compressive strength insignificantly reduced the post-cracking stiffness of the beam models. Nevertheless, the beam models with a/h = 1.5 exhibited a reduced flexural cracking load and post-cracking stiffness compared with those of their counterparts with a/h =1.0. The deflection continued to increase with an increase in the applied load until the ultimate load was reached. The beam models with the higher f’c of 50 MPa failed at a deflection capacity greater than that of their counterparts with the low and moderate f’c of 28 and 37 MPa, respectively. Furthermore, the beam models with a/h =1.5 had a higher deflection capacity than that of their counterparts with a/h =1.0.
Table 3 presents the ultimate load and the deflection capacity for the deep beam models without web reinforcement. The ultimate loads of the models increased with an increase in the concrete compressive strength. The strengths of the deep beam models SDB-1.0-M and SDB-1.0-H were 11 and 43% higher than that of the model SDB-1.0-L. Similarly, the ultimate loads of the deep beam models SDB-1.5-M and SDB-1.5-H were 17 and 49% higher than that of the model SDB-1.5-L. The ultimate loads of the deep models with a/h = 1.5 were lower than those of their counterparts with a/h = 1.0. The beam models SDB-1.5-L, SDB-1.5-M, and SDB-1.5-H with the low (L), moderate (M), and high (H) concrete compressive strengths showed strength reductions of 41, 38, and 38%, respectively, due to increasing the value of a/h from 1.0 to 1.5. These results indicate that varying the concrete compressive strength had almost no effect on the percent strength reduction caused by increasing the value of a/h from 1.0 to 1.5. The deflection capacity of the beam models with the low and moderate f’c were insignificantly different, irrespective of a/h. The beam models with the higher concrete compressive strength failed at a higher deflection capacity than that of their counterparts with low and moderate concrete compressive strength. Figure 15 shows the effects of f’c and a/h on the strength of the deep beam models without web reinforcement. The ultimate load increased almost linearly with an increase in f’c, irrespective of the value of a/h. The beam models with a/h = 1.0 exhibited higher strengths than those of their counterparts with a/h = 1.5. The strength gain caused by reducing the value of a/h from 1.5 to 1.0 was in the range of 64% with a minimum of 61% and a maximum of 69%.

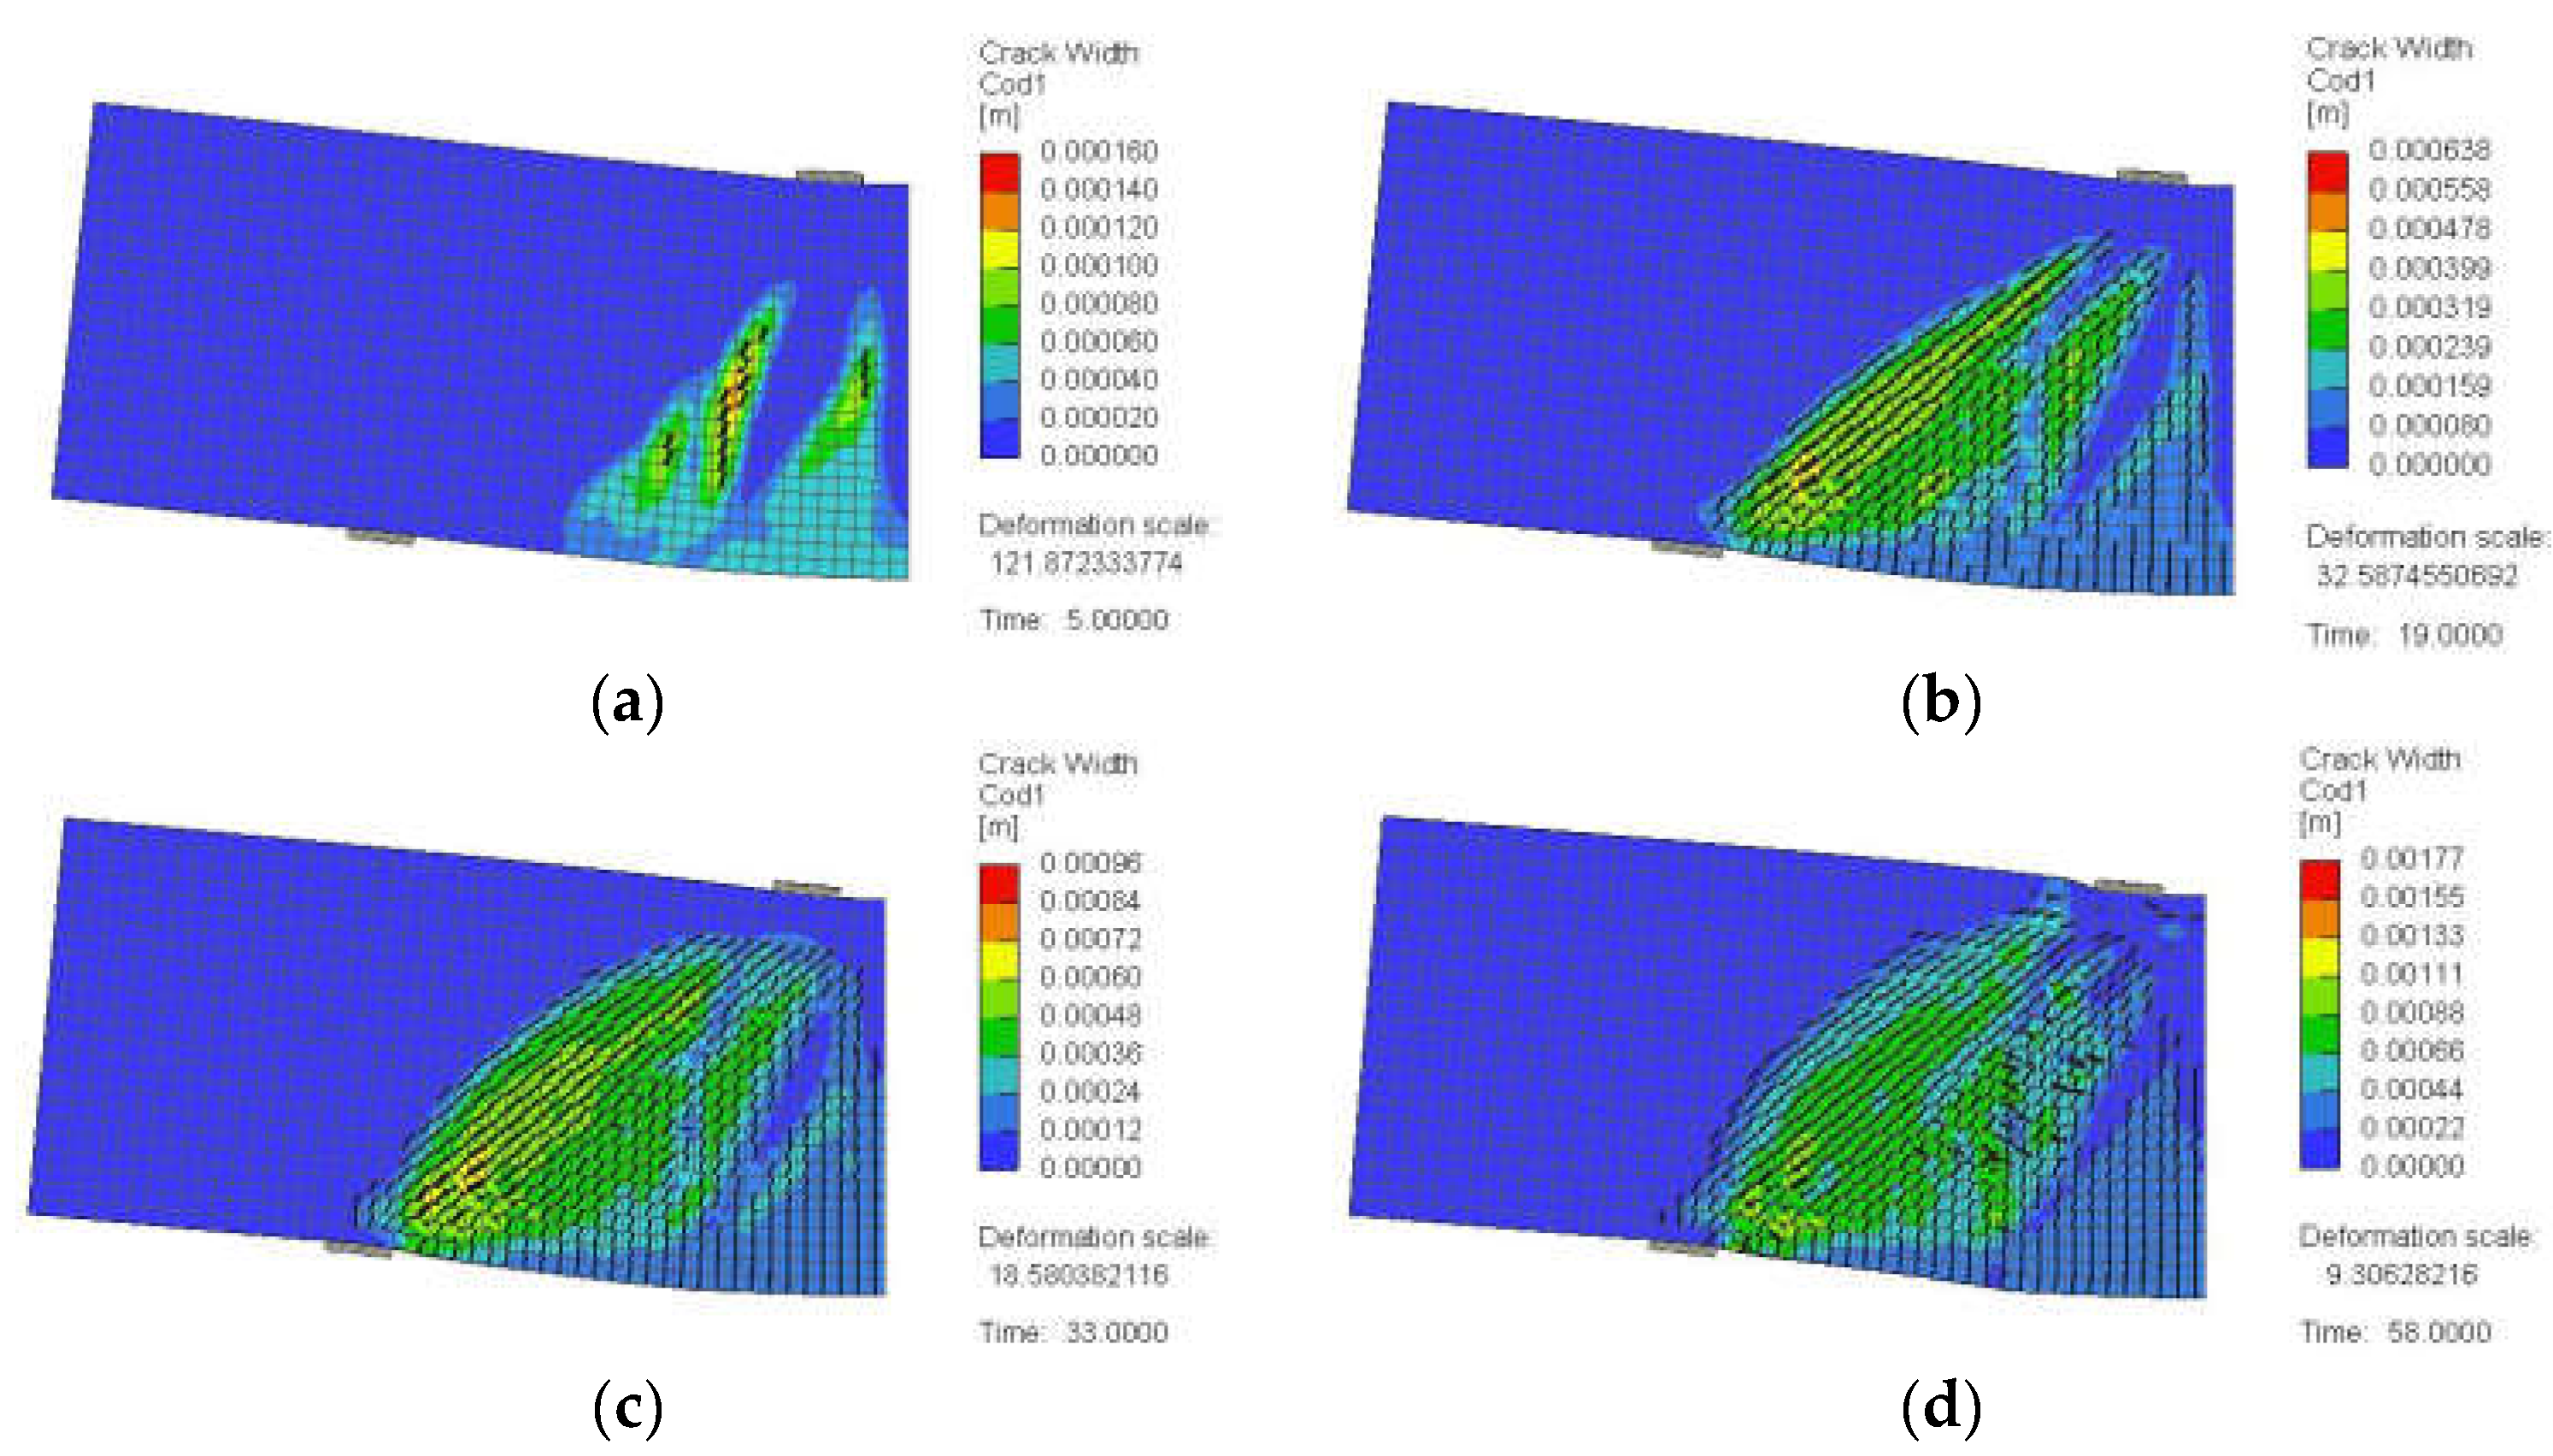
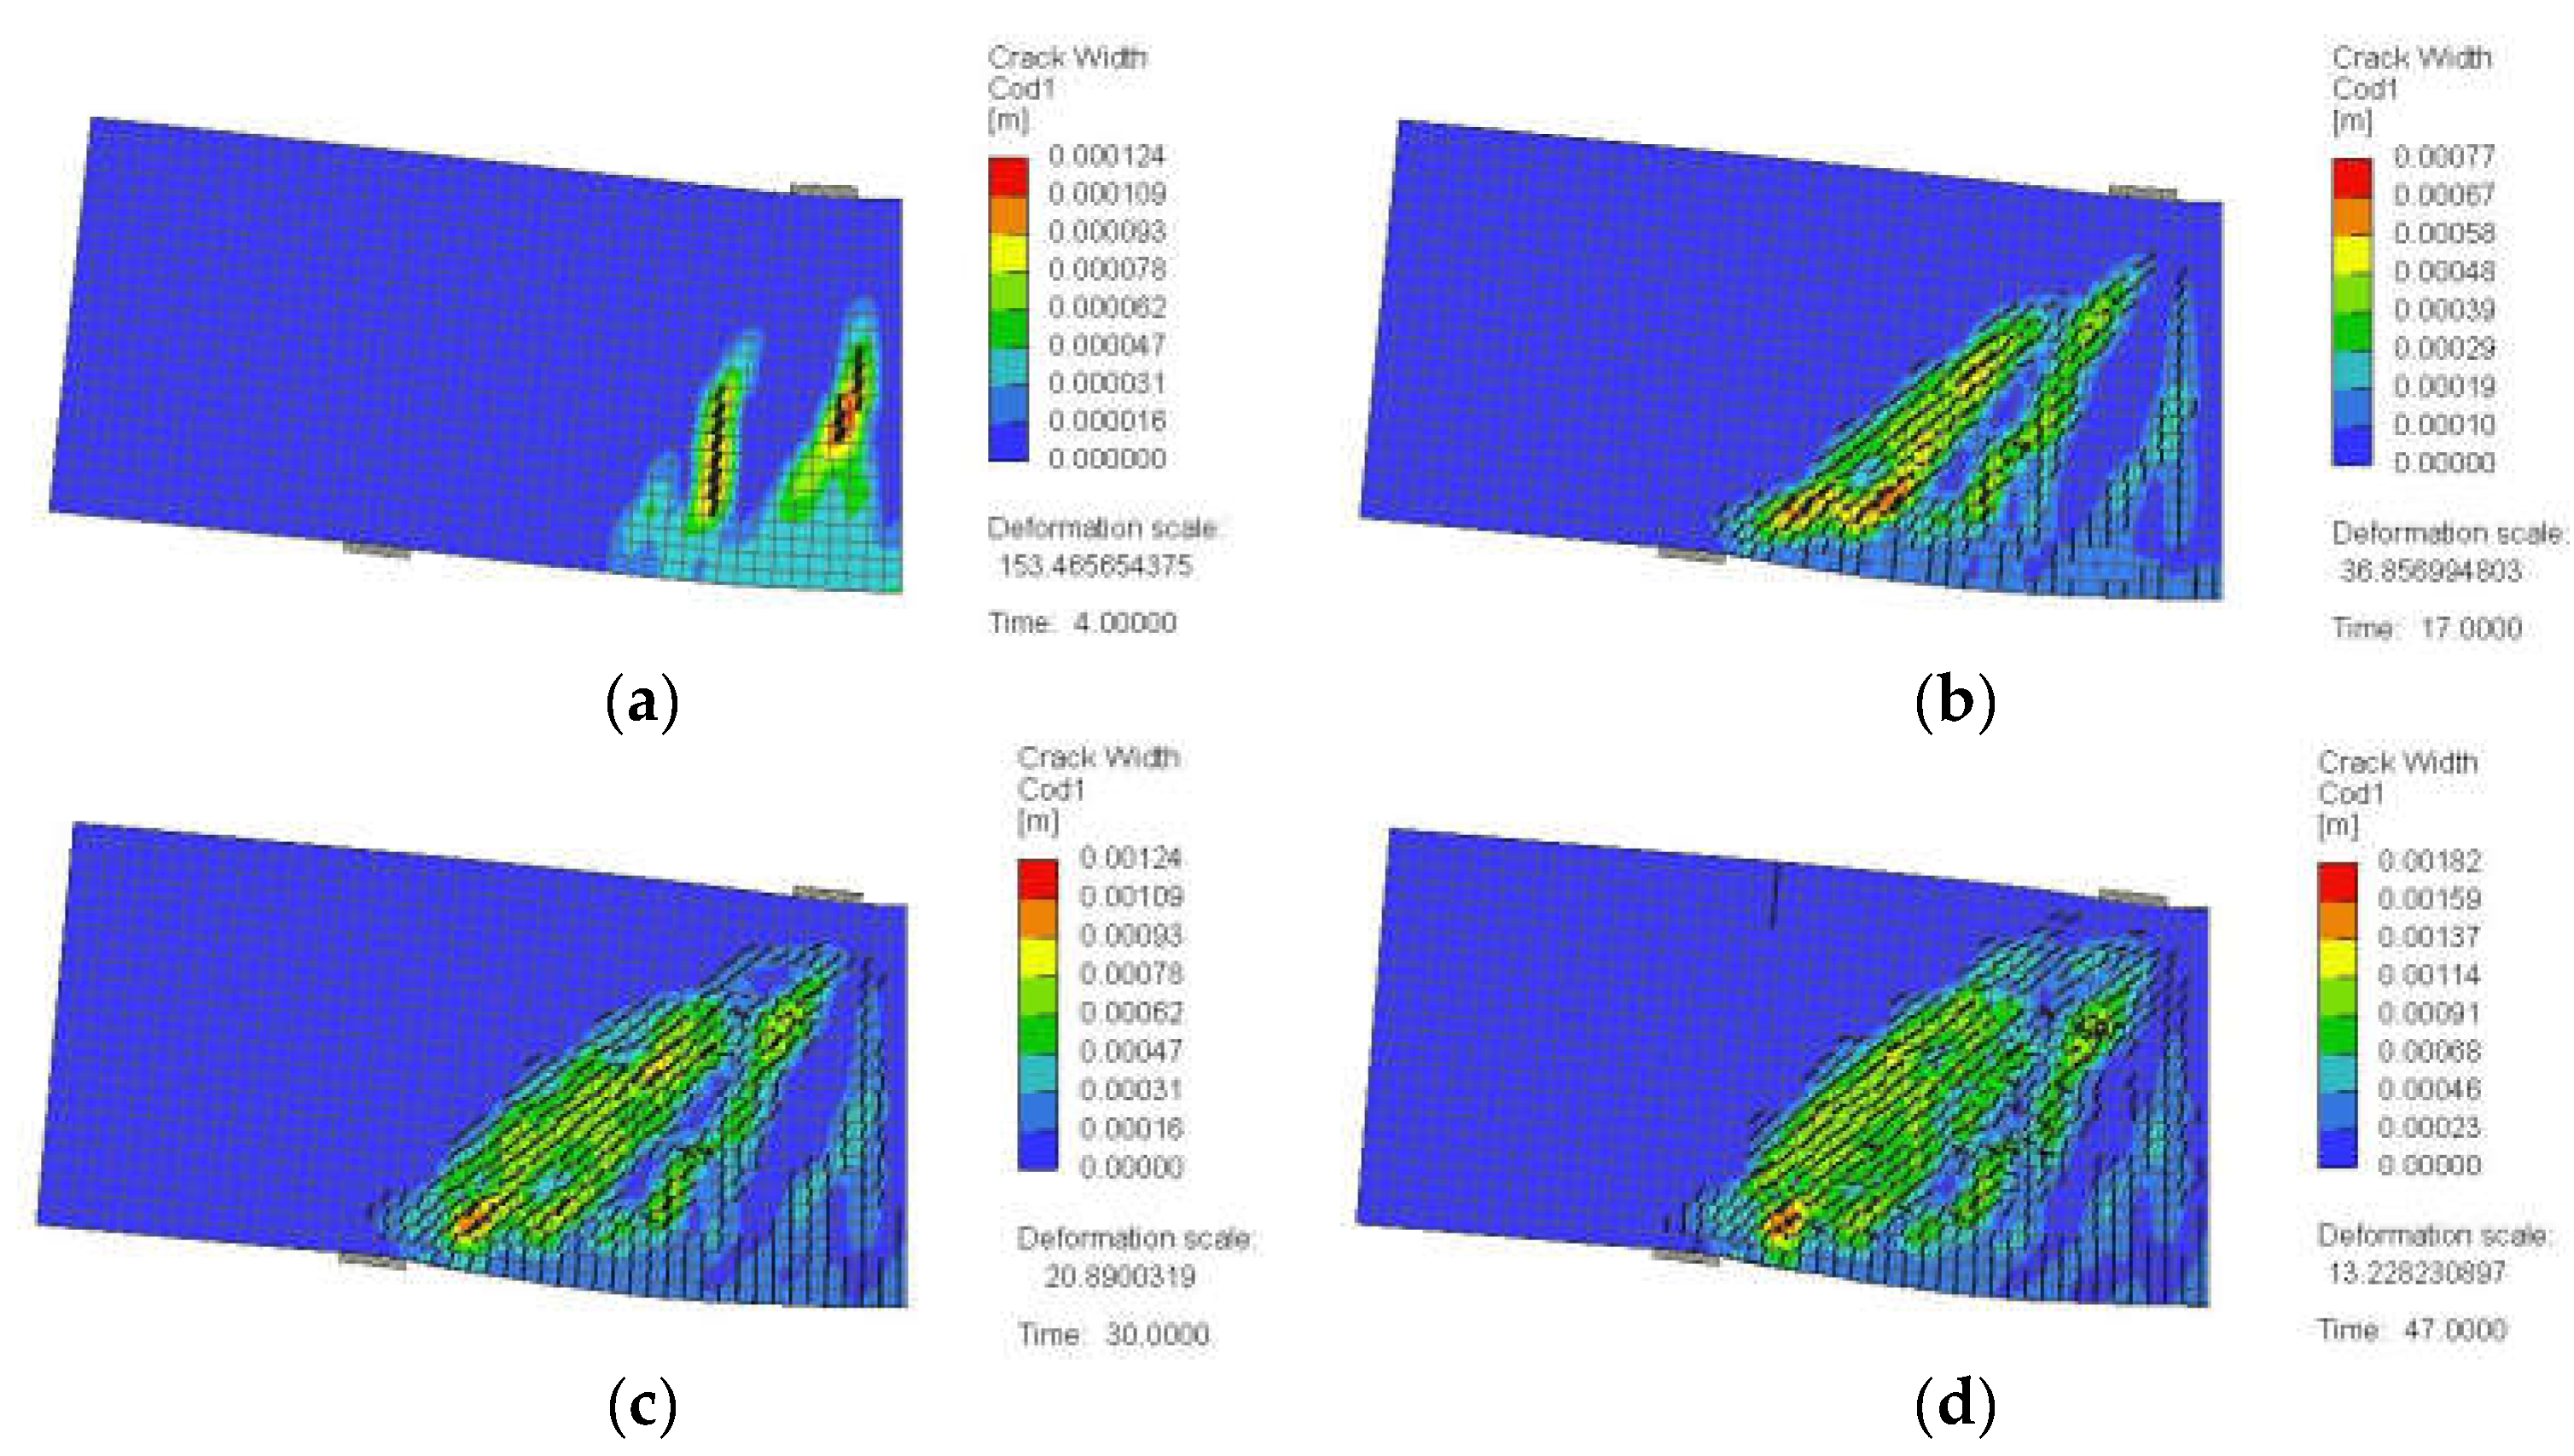
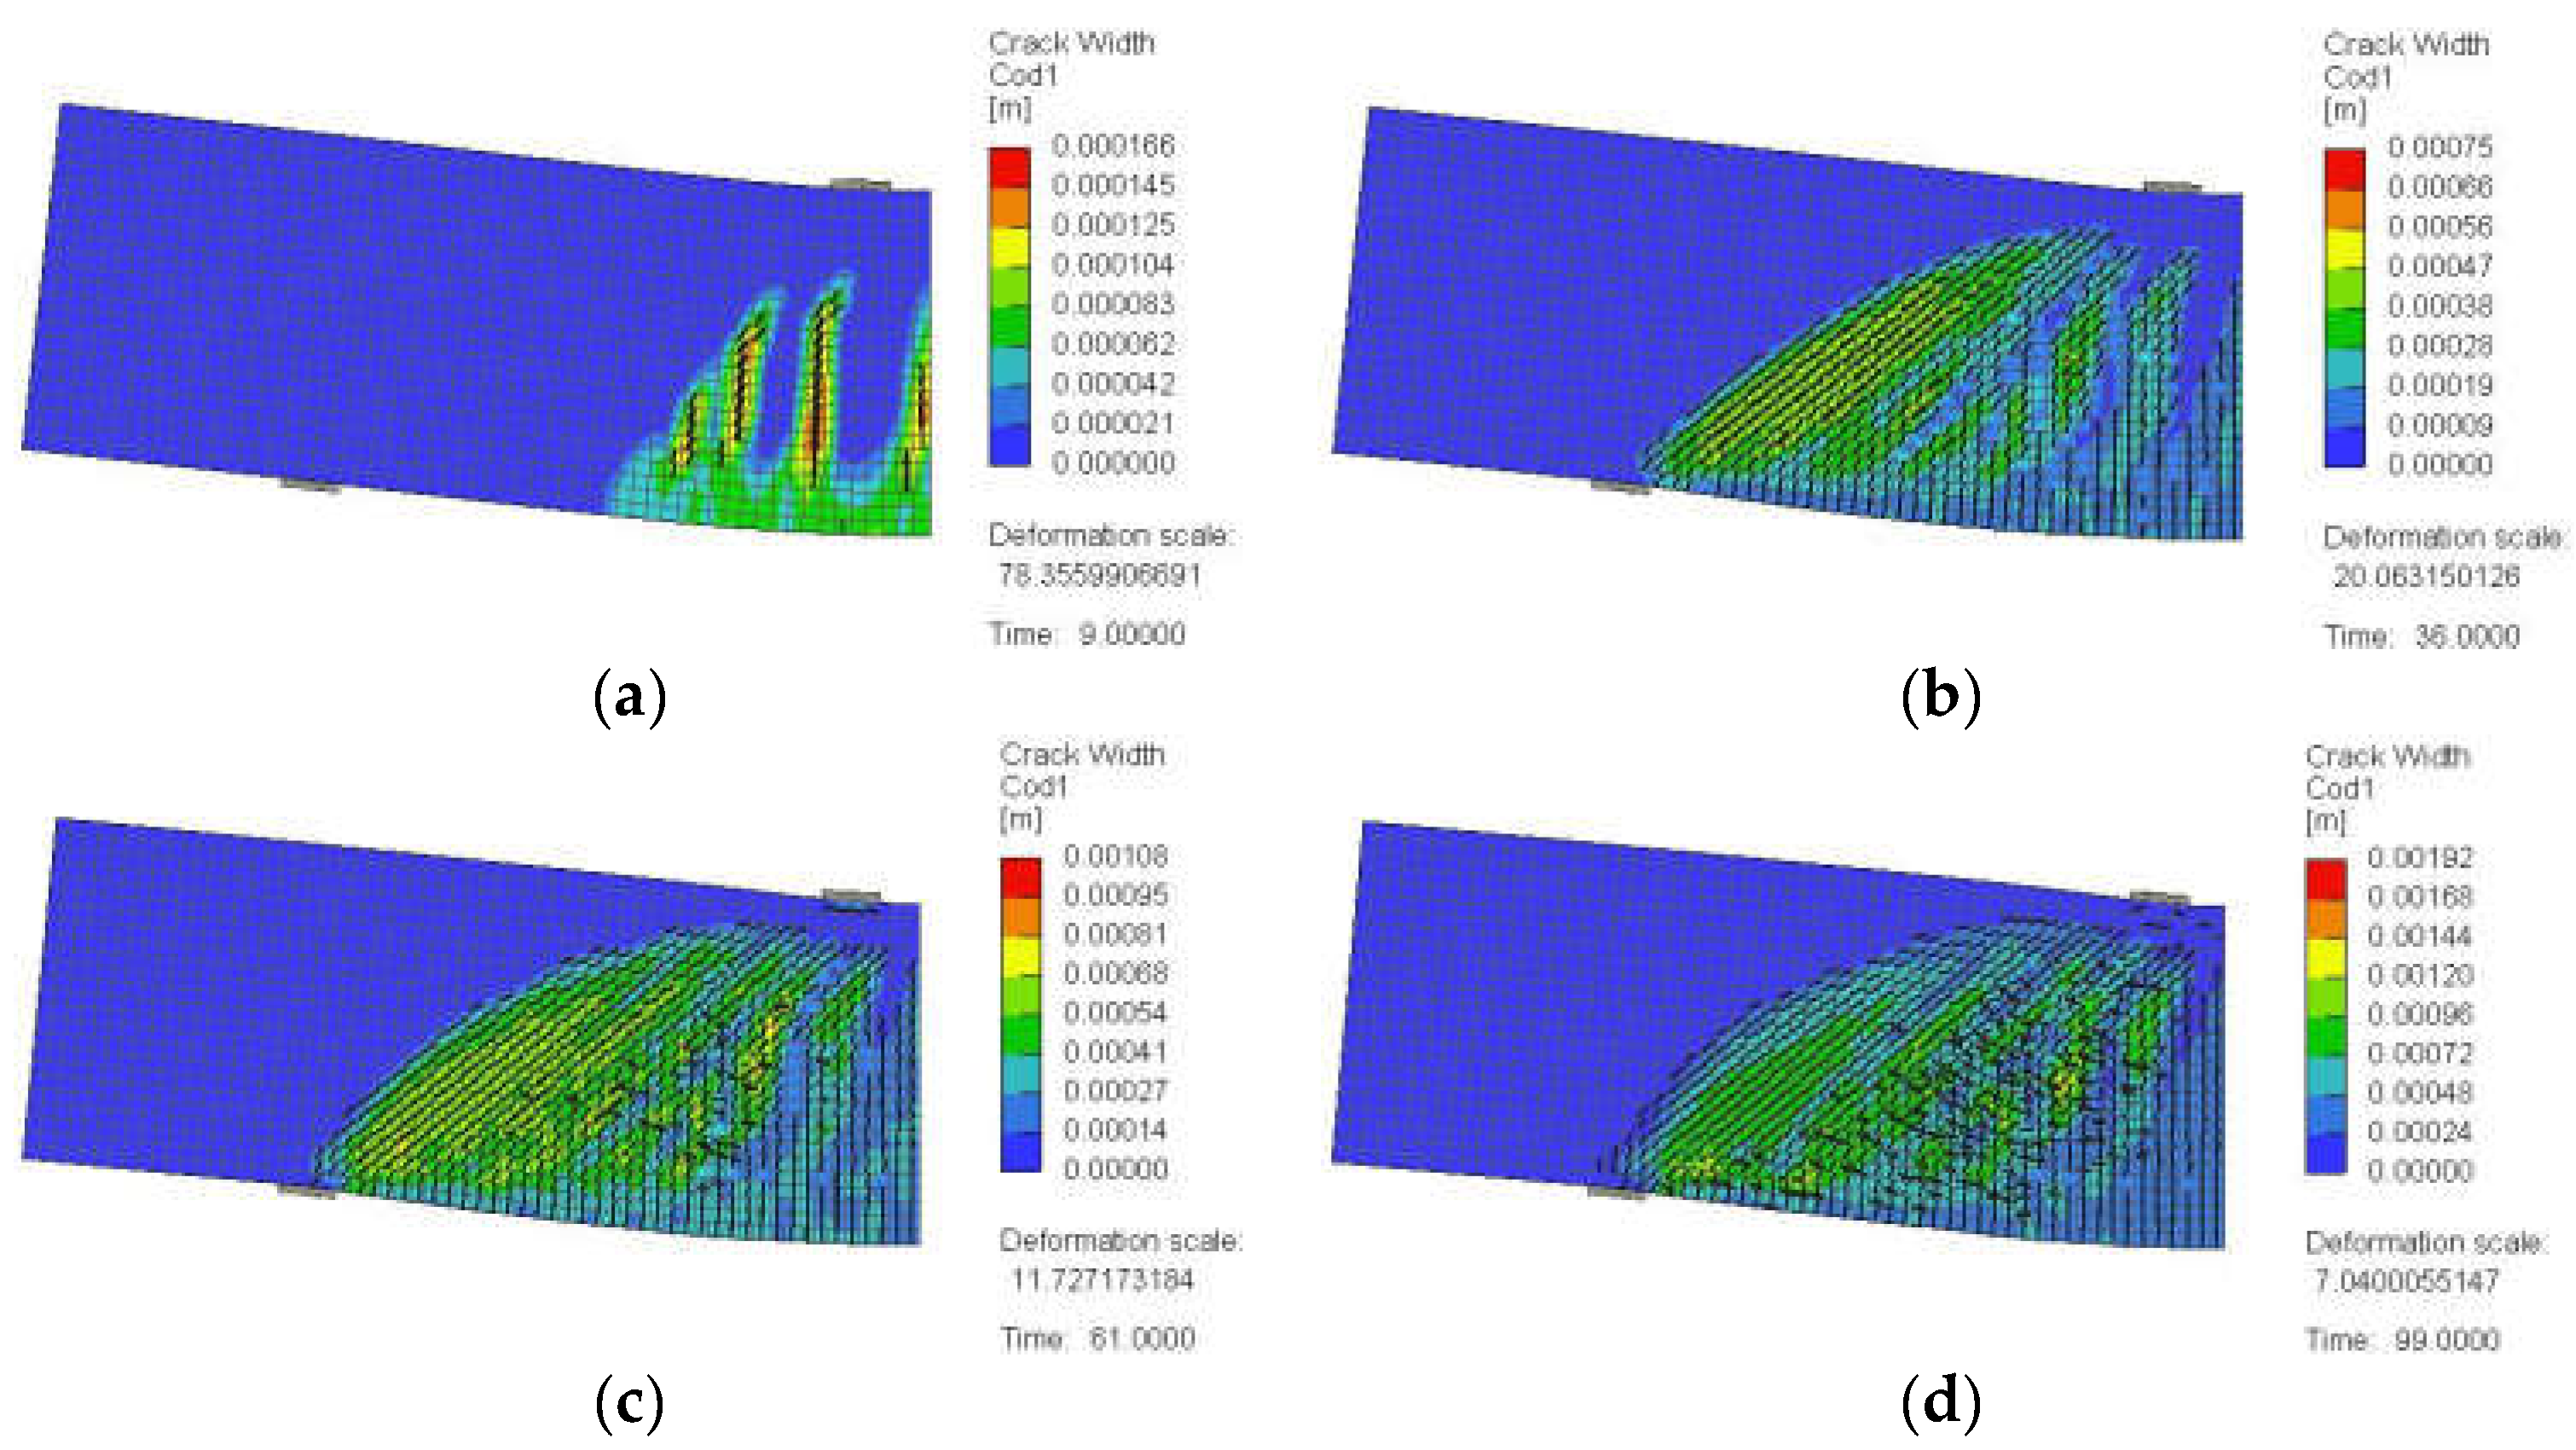
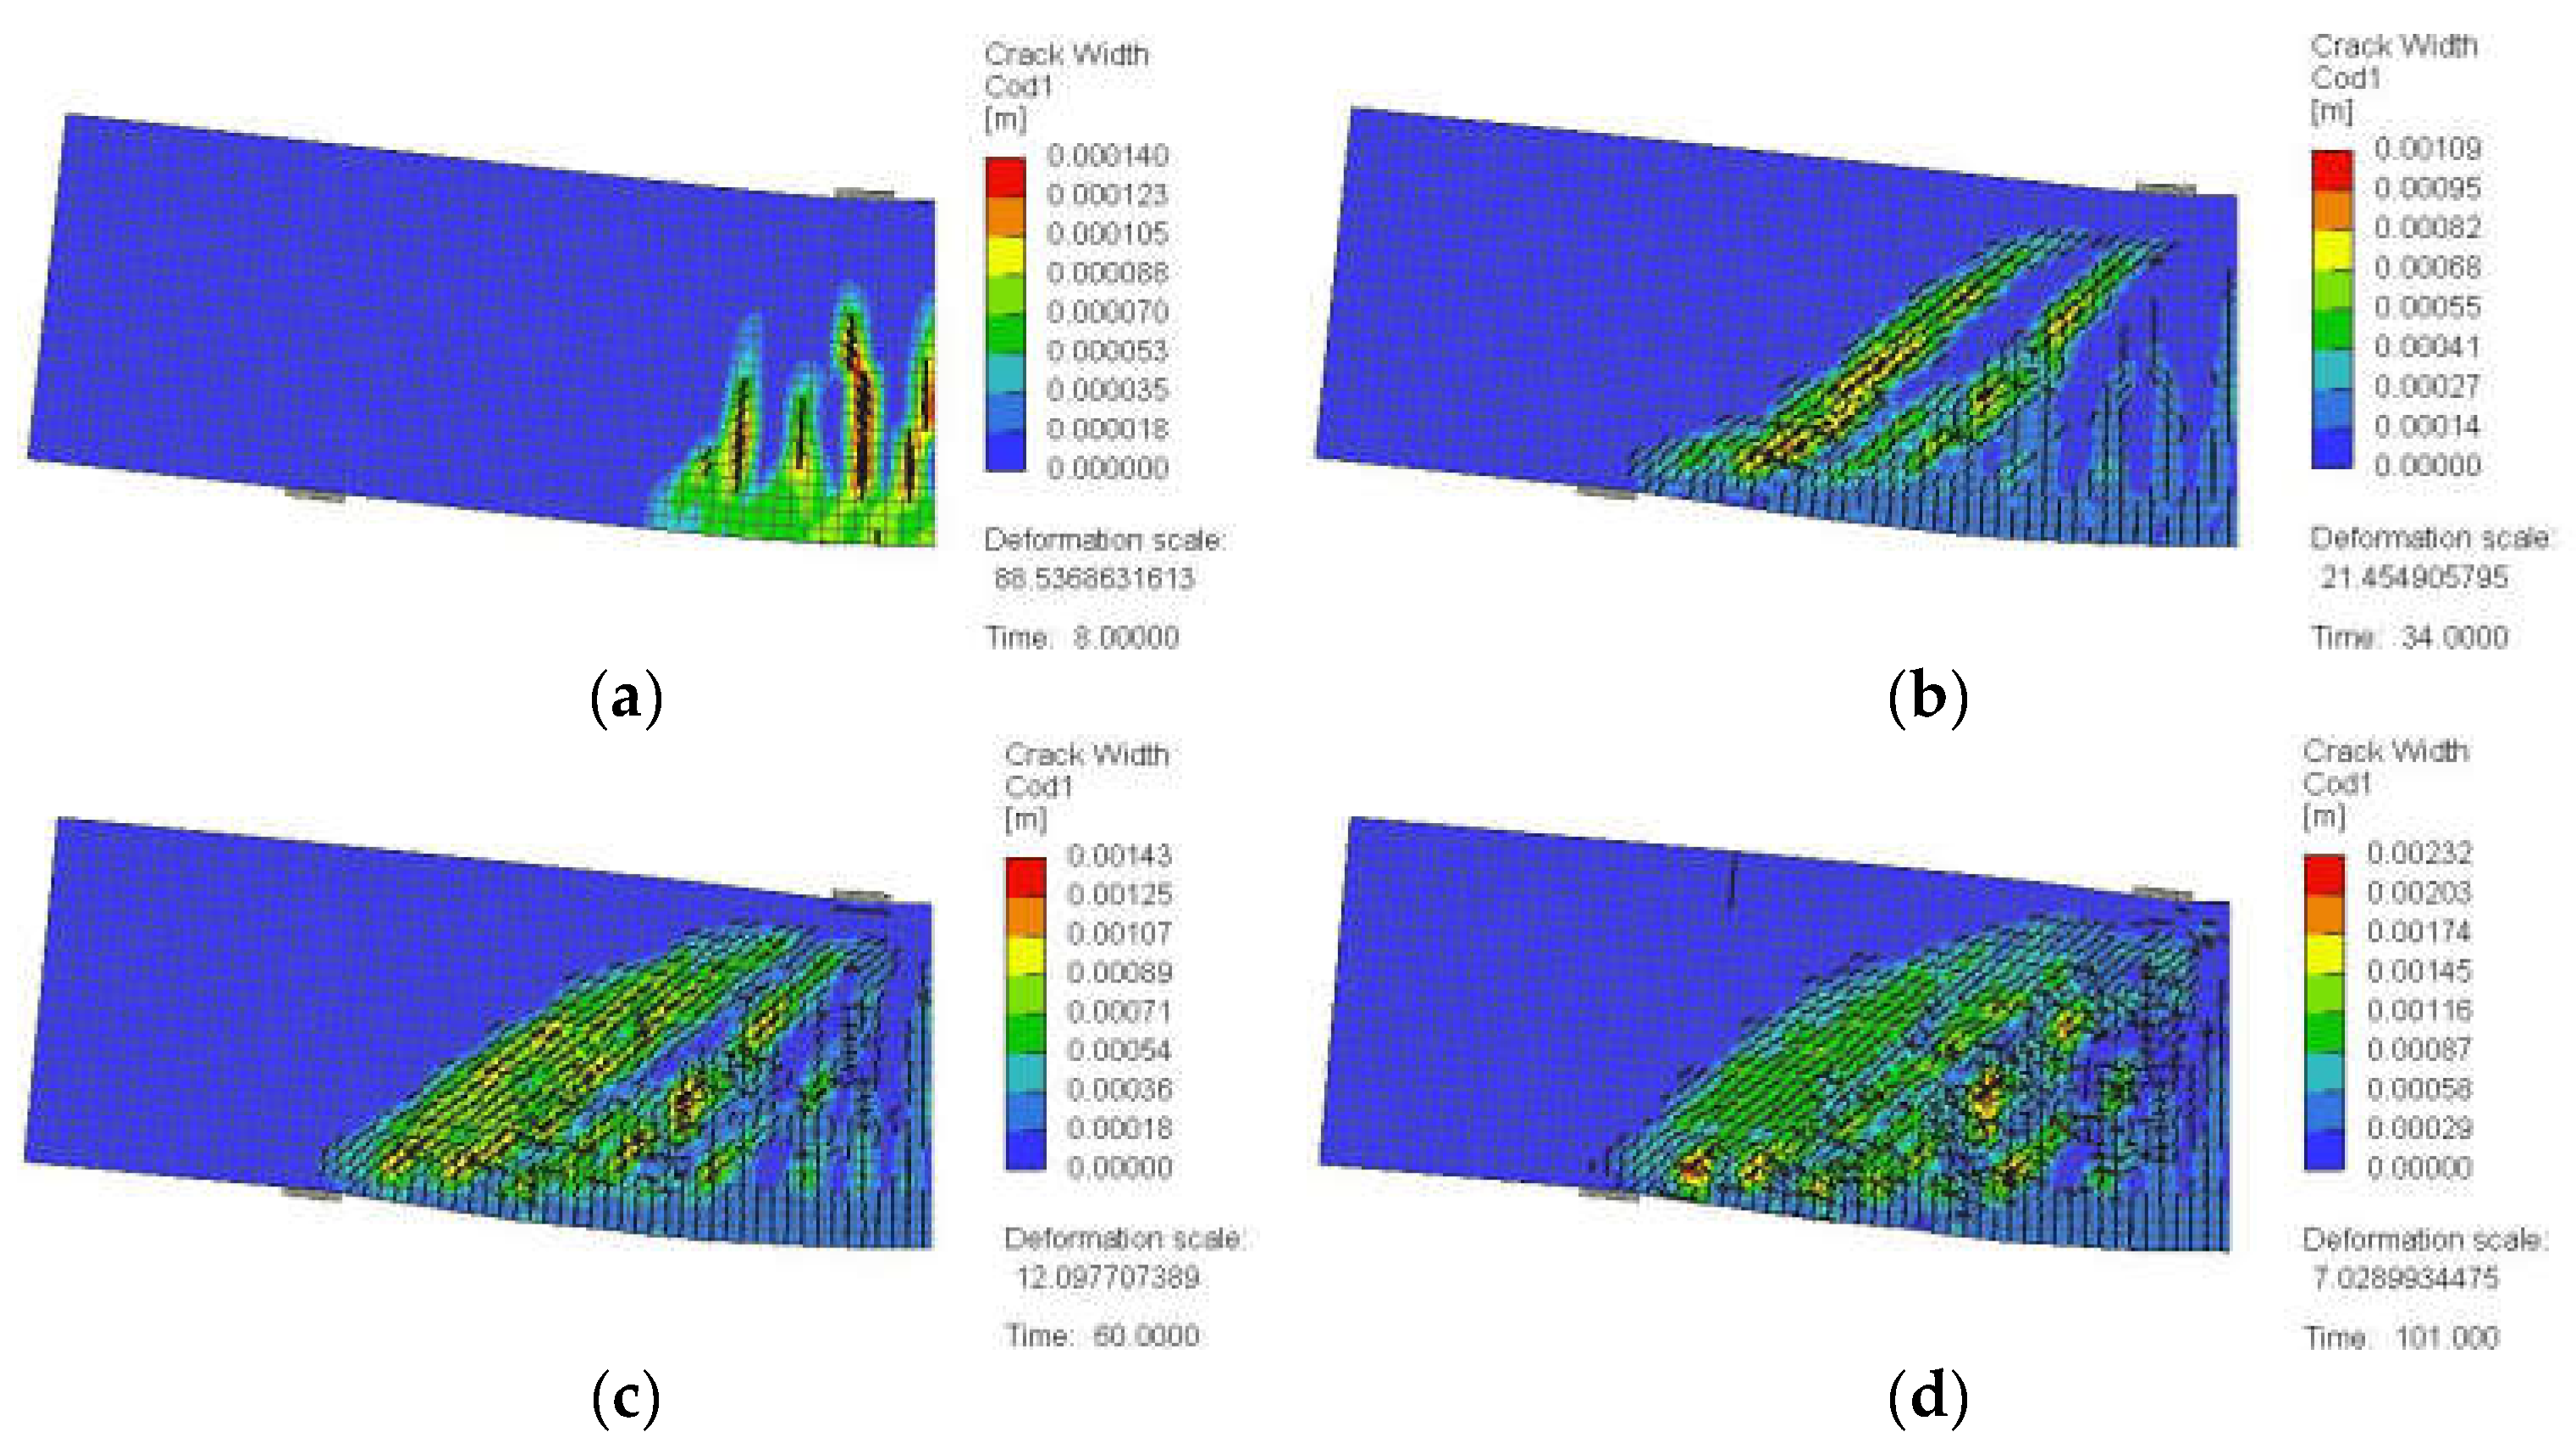
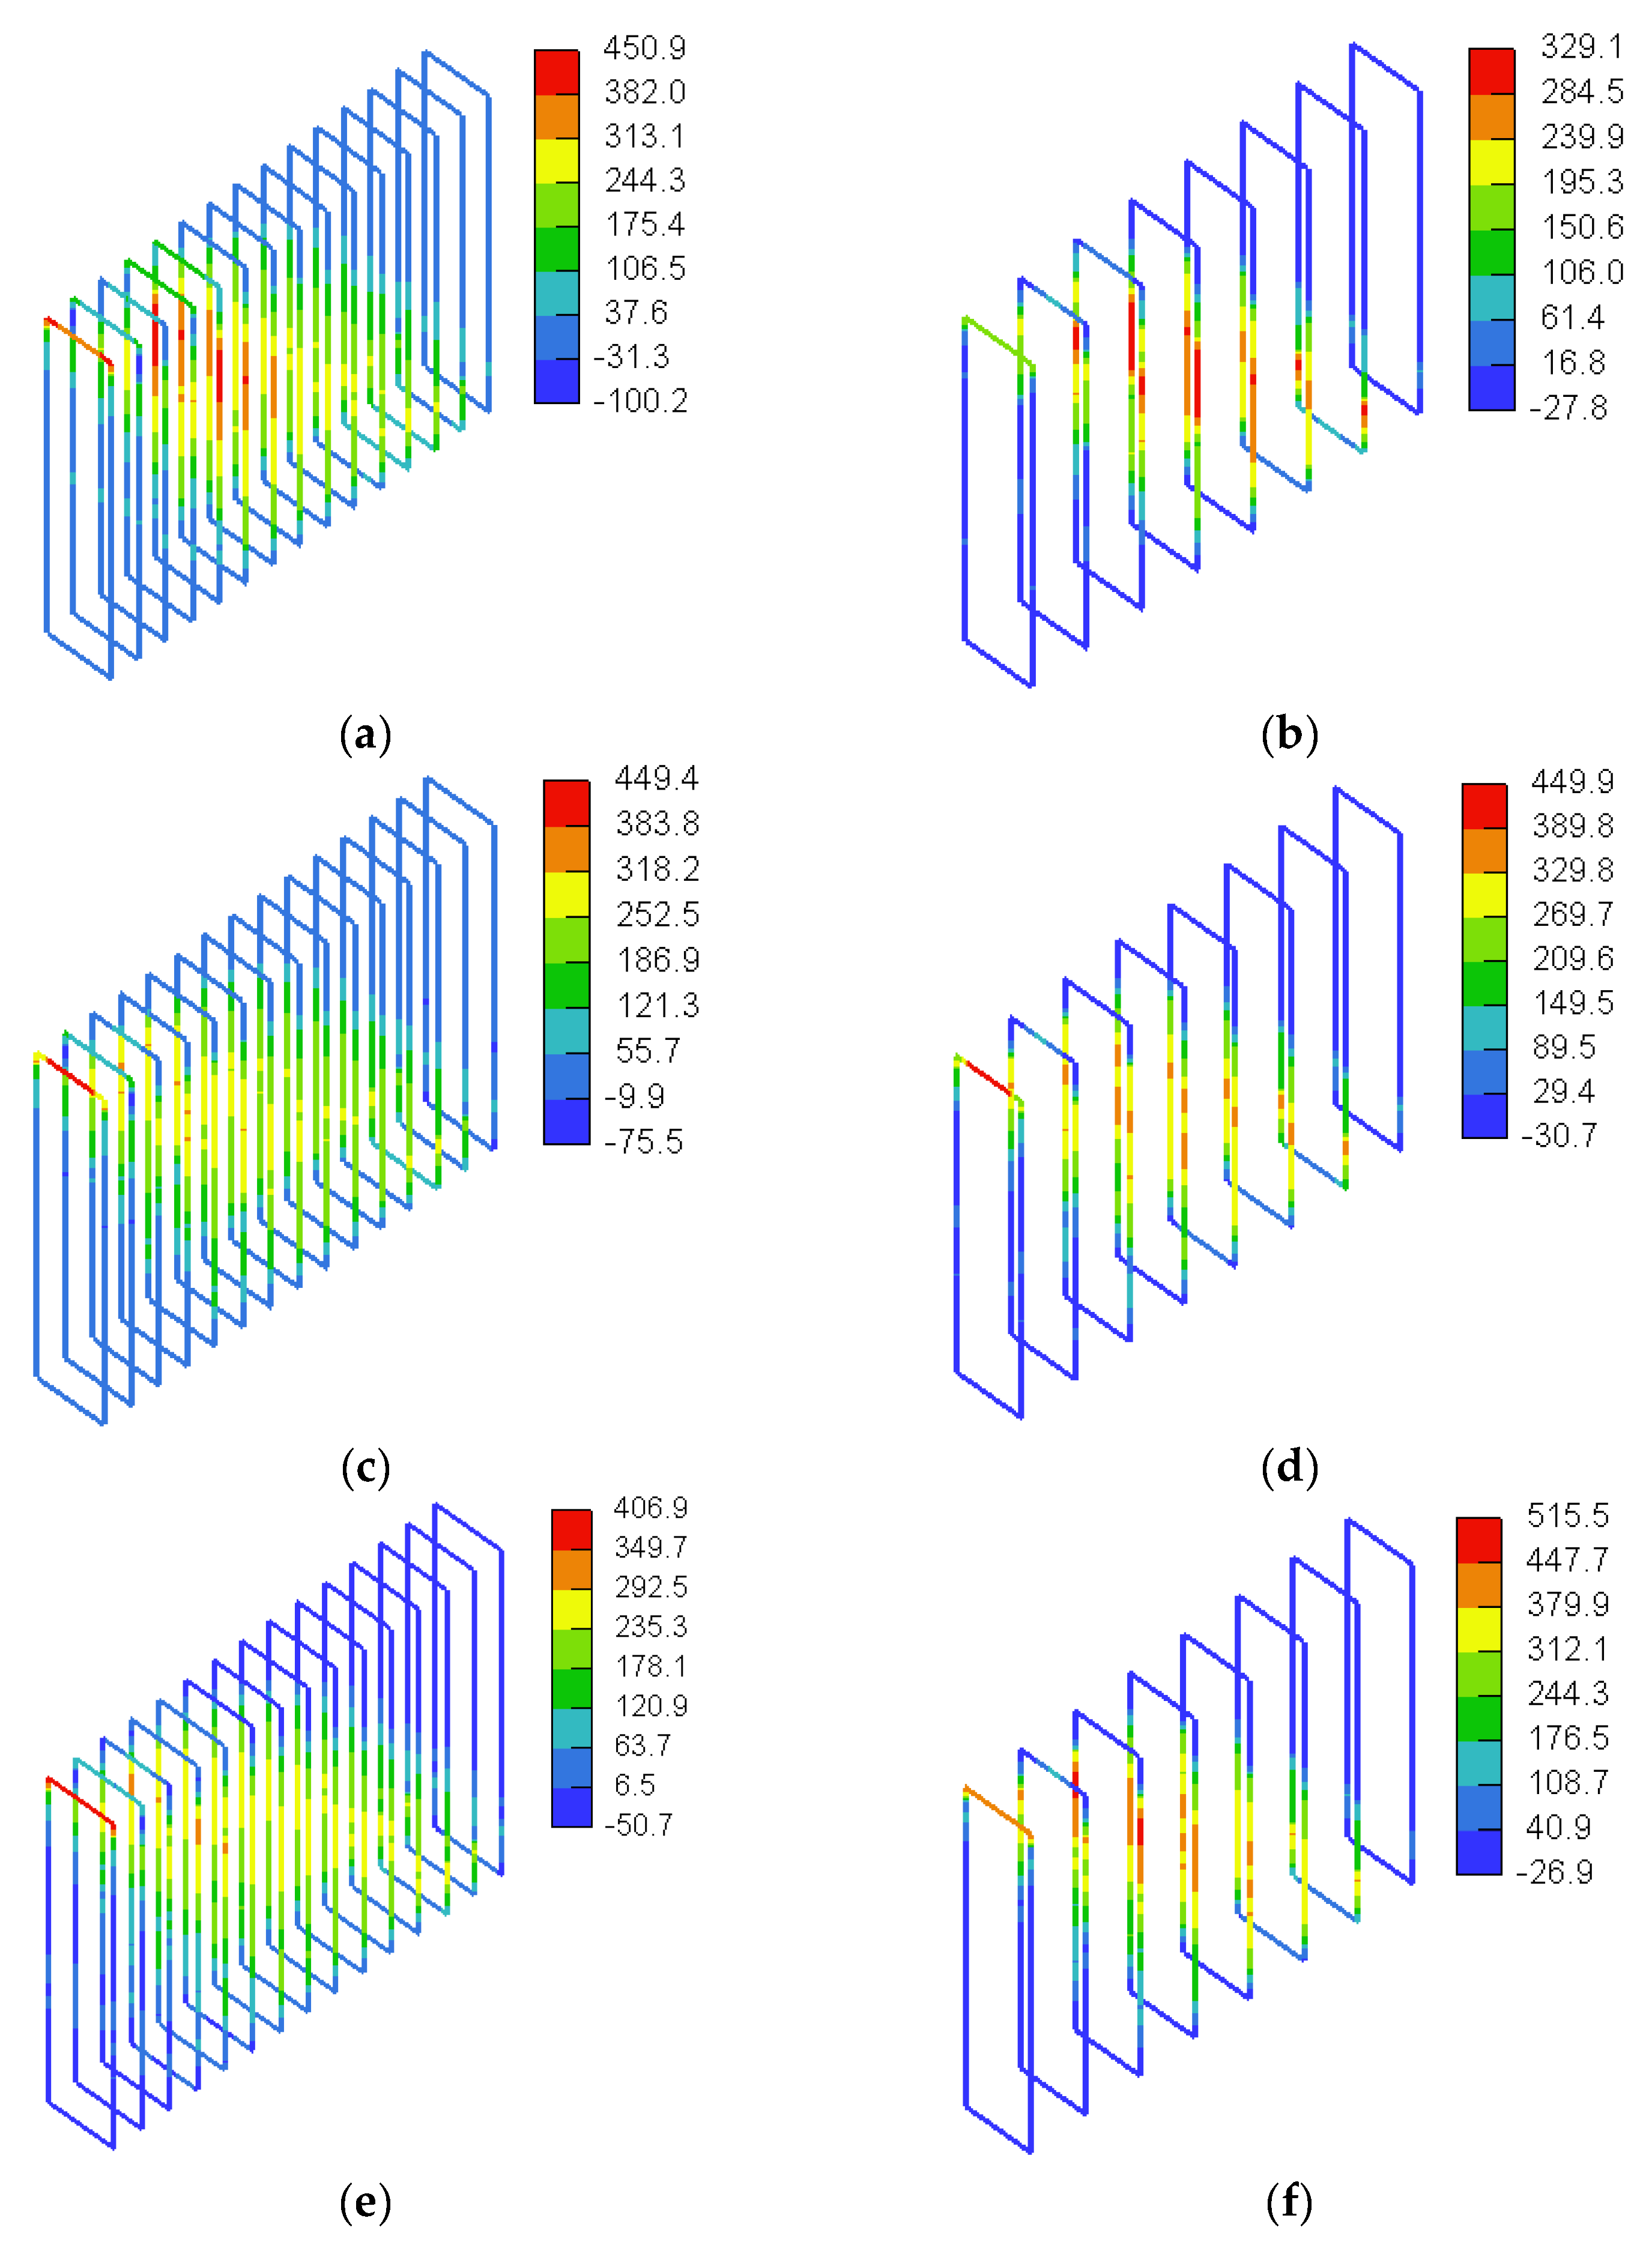
5.1.2. Crack Pattern and Failure Mechanism

Figure 16 shows the crack development and propagation for a sample deep beam model without web reinforcement (SDB-1.0-M). The crack patterns at different stages of loading (25%, 50%, 75%, and 100% of the ultimate load) are displayed to understand the progress of cracking during loading. In each subfigure, there are contours indicating the distribution of cracks and a legend for the crack width values. Since the minimum displayed crack width was set to be 0.1 mm, only cracks with a width ≥ 0.1 mm are marked with black lines. The beam model exhibited flexural cracks in the midspan and in the shear span region closer to the load point prior to the initiation of any shear cracks. When the load was increased, shear cracks very close to each other simulating almost one unified major shear crack were developed in the shear span with an angle of inclination of approximately 60° from the horizontal direction. This shear crack was connected to another splitting crack developed horizontally at the level of the flexure reinforcement due to the absence of vertical stirrups. Eventually, the beam model failed in a shear–tension mode of failure.

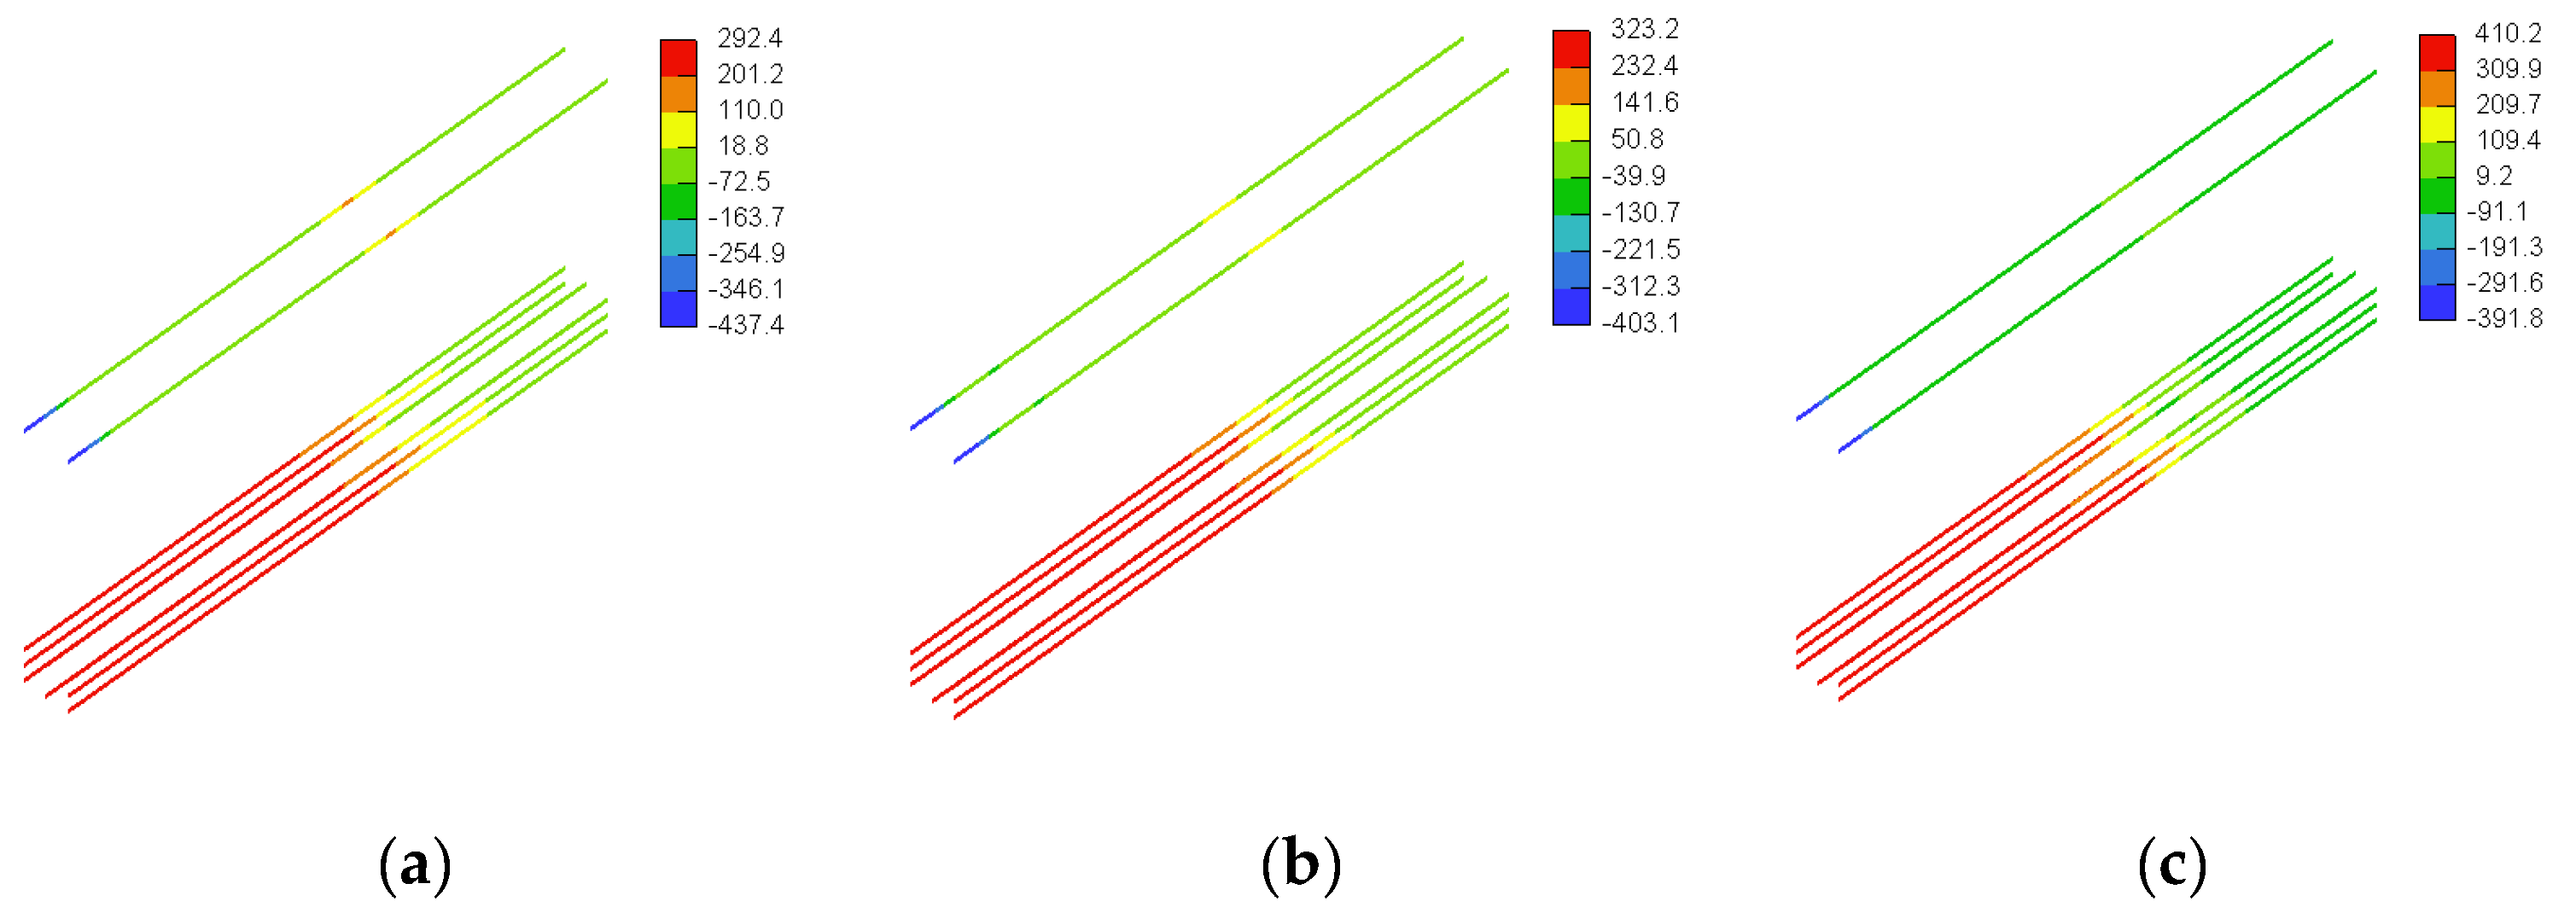
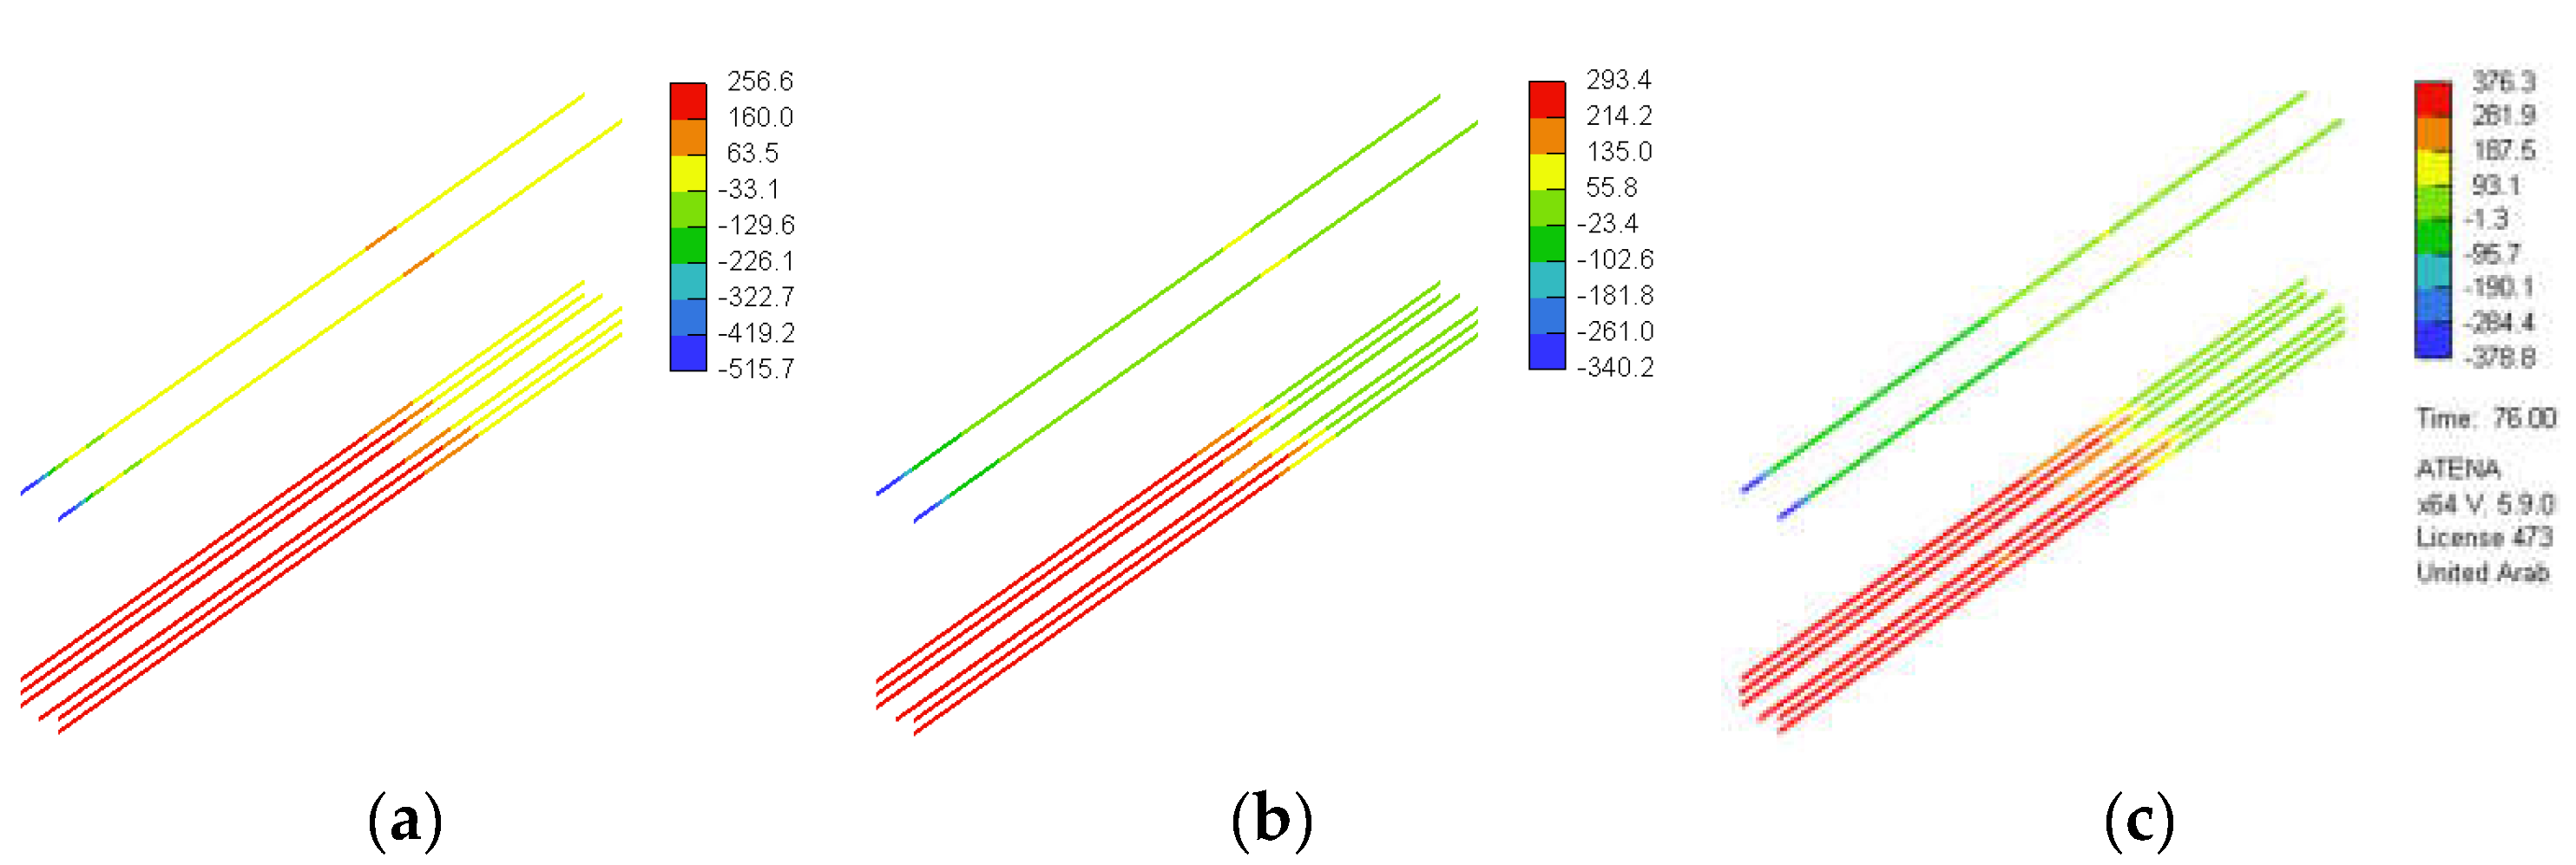
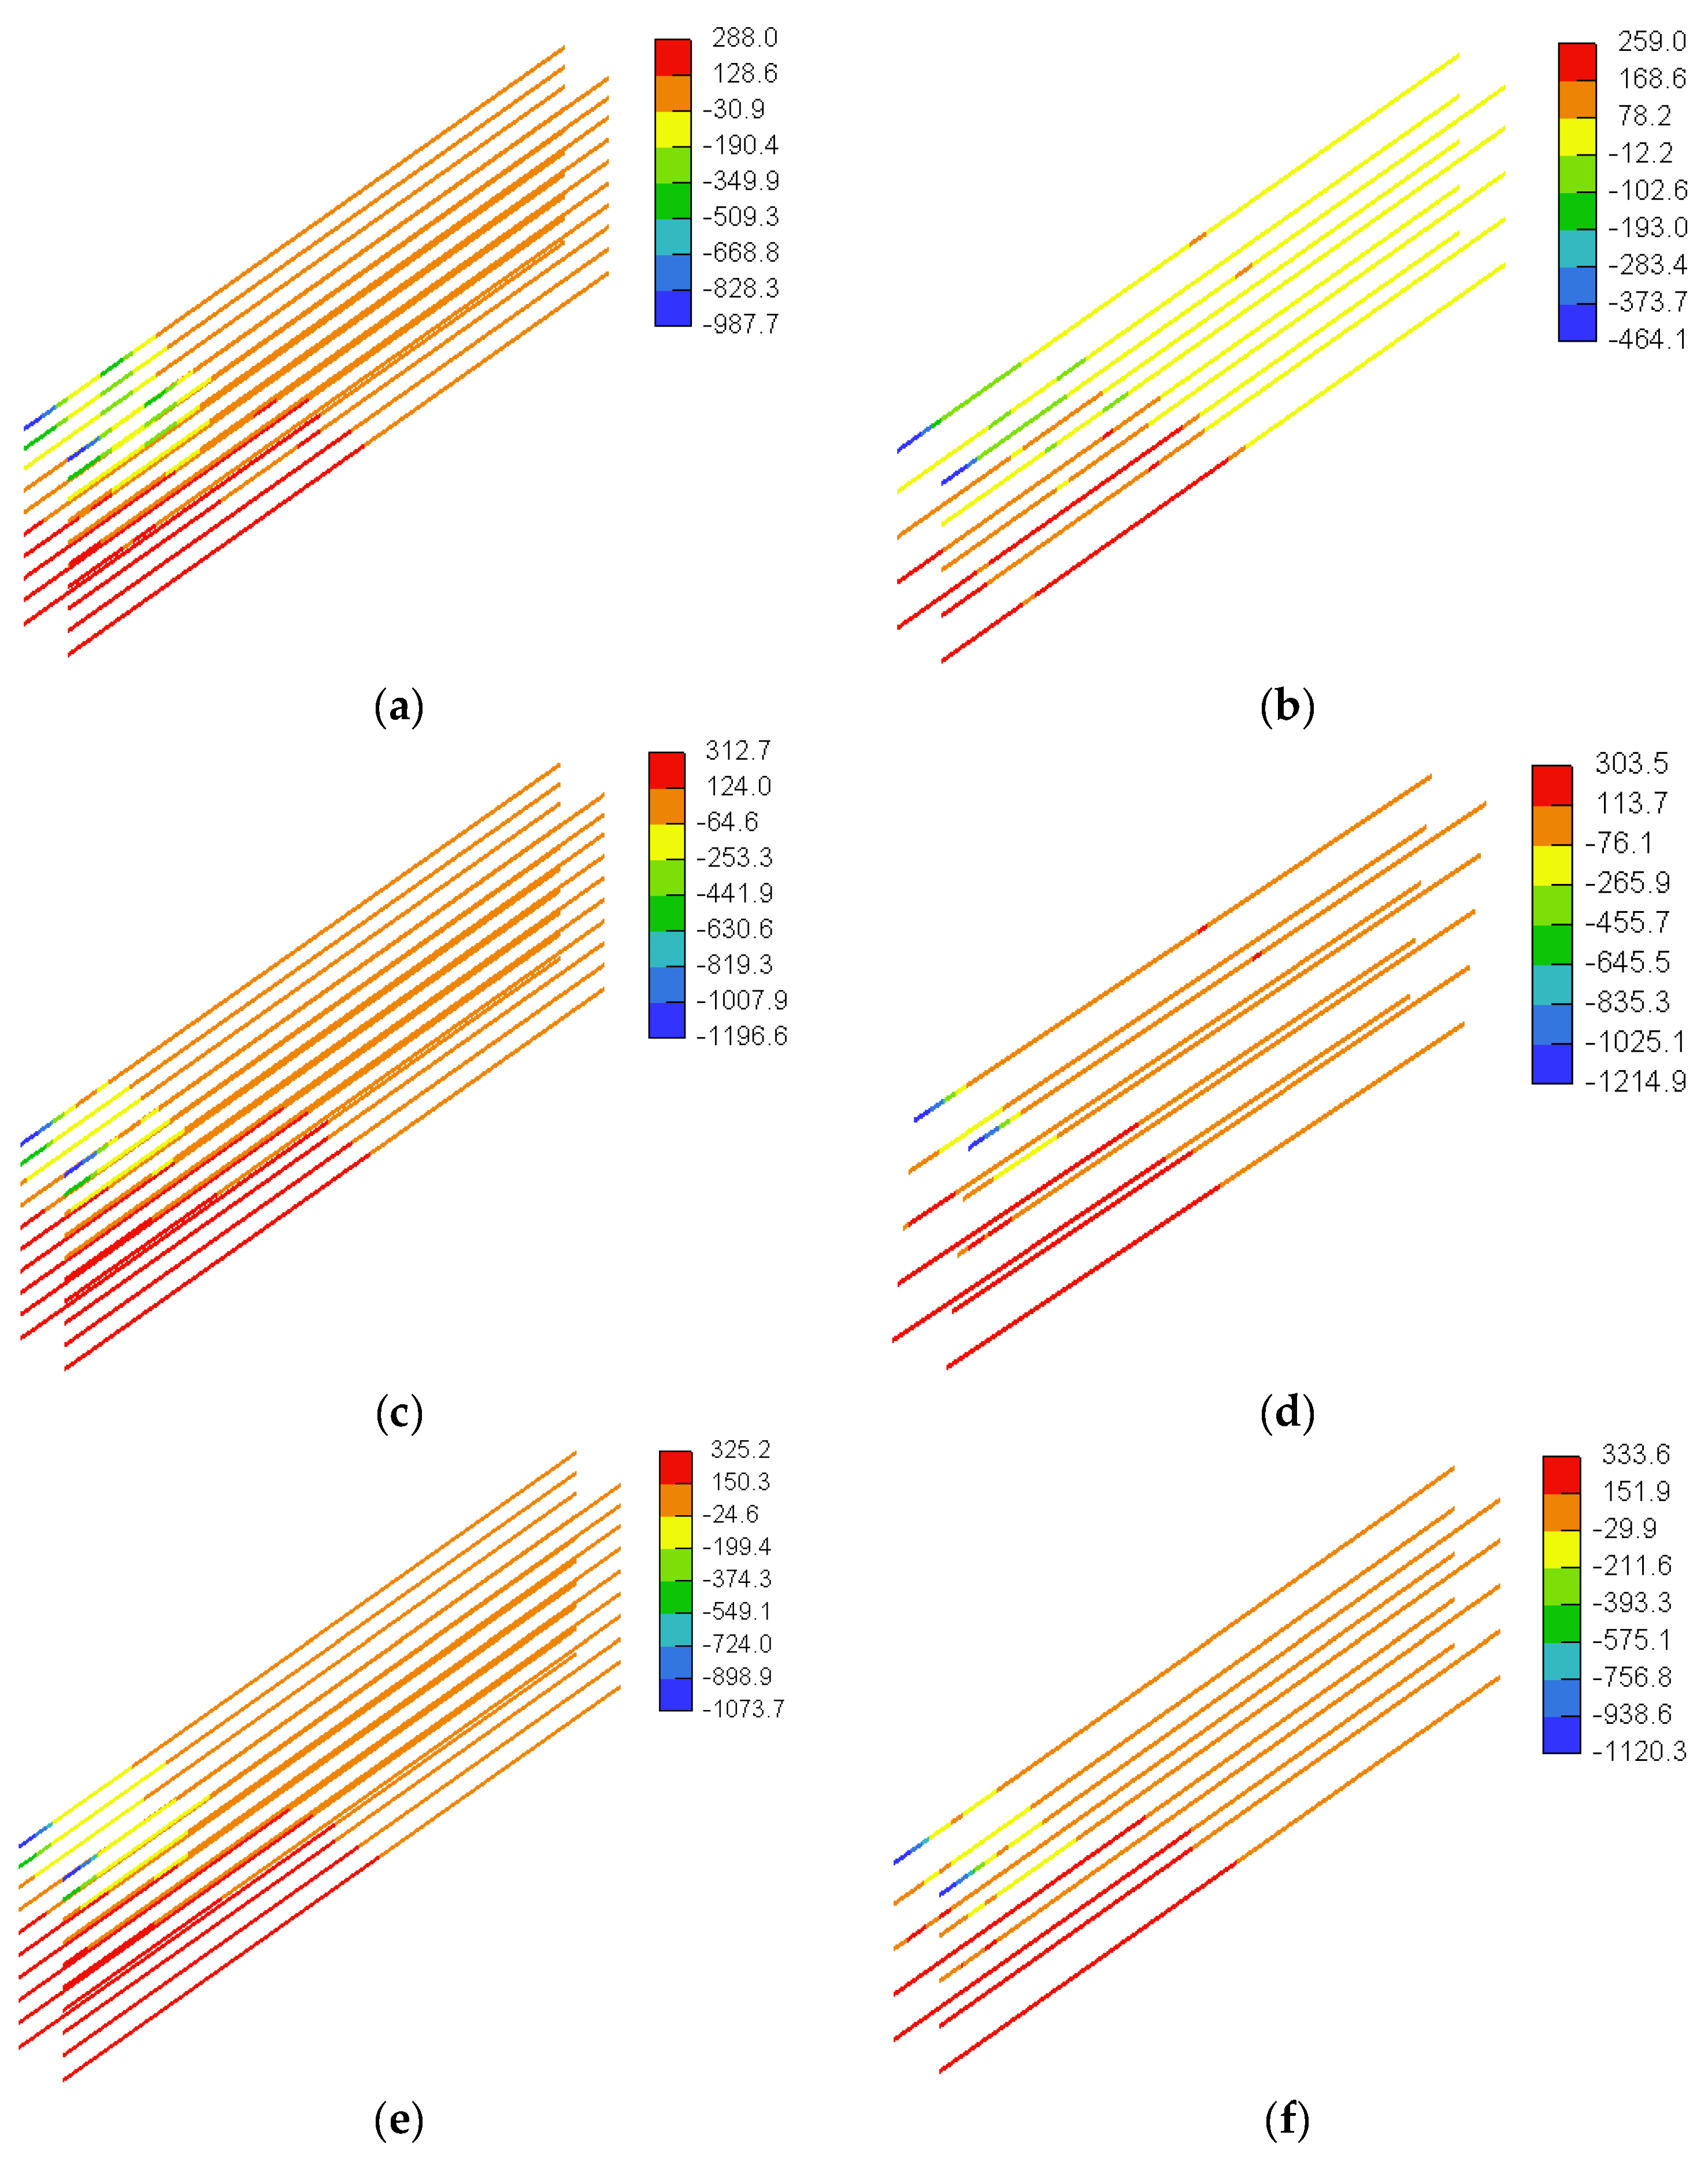
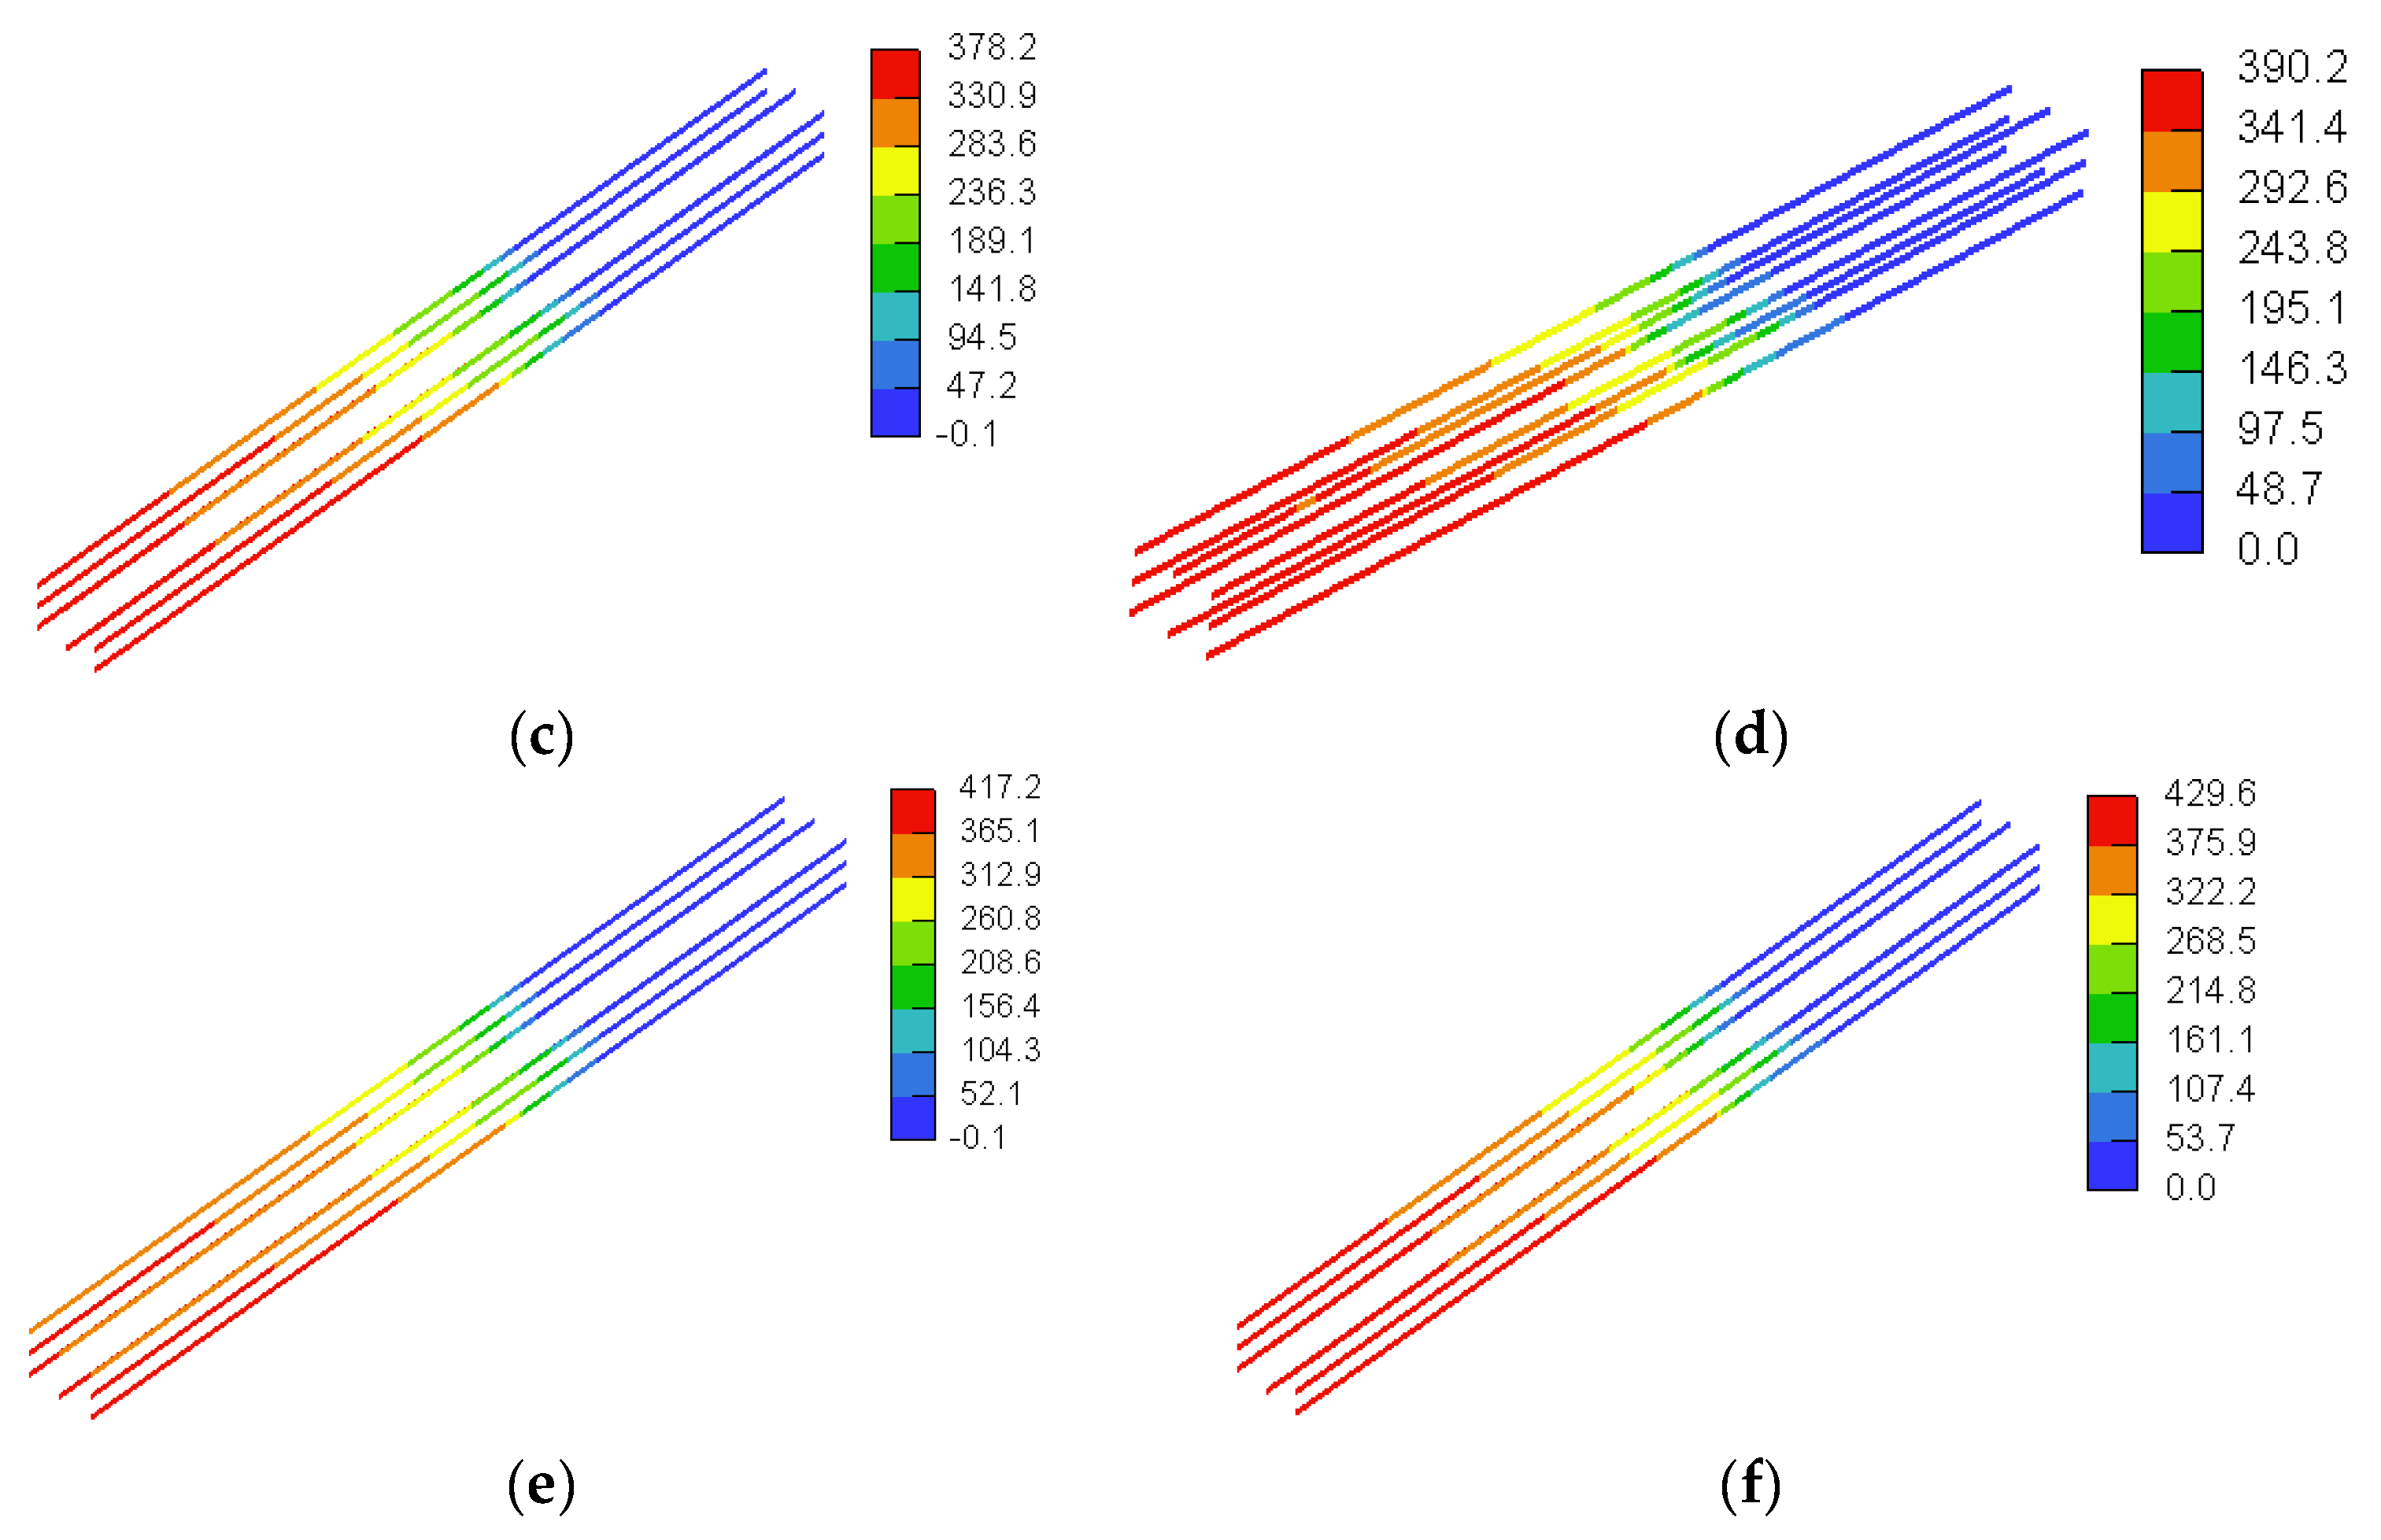
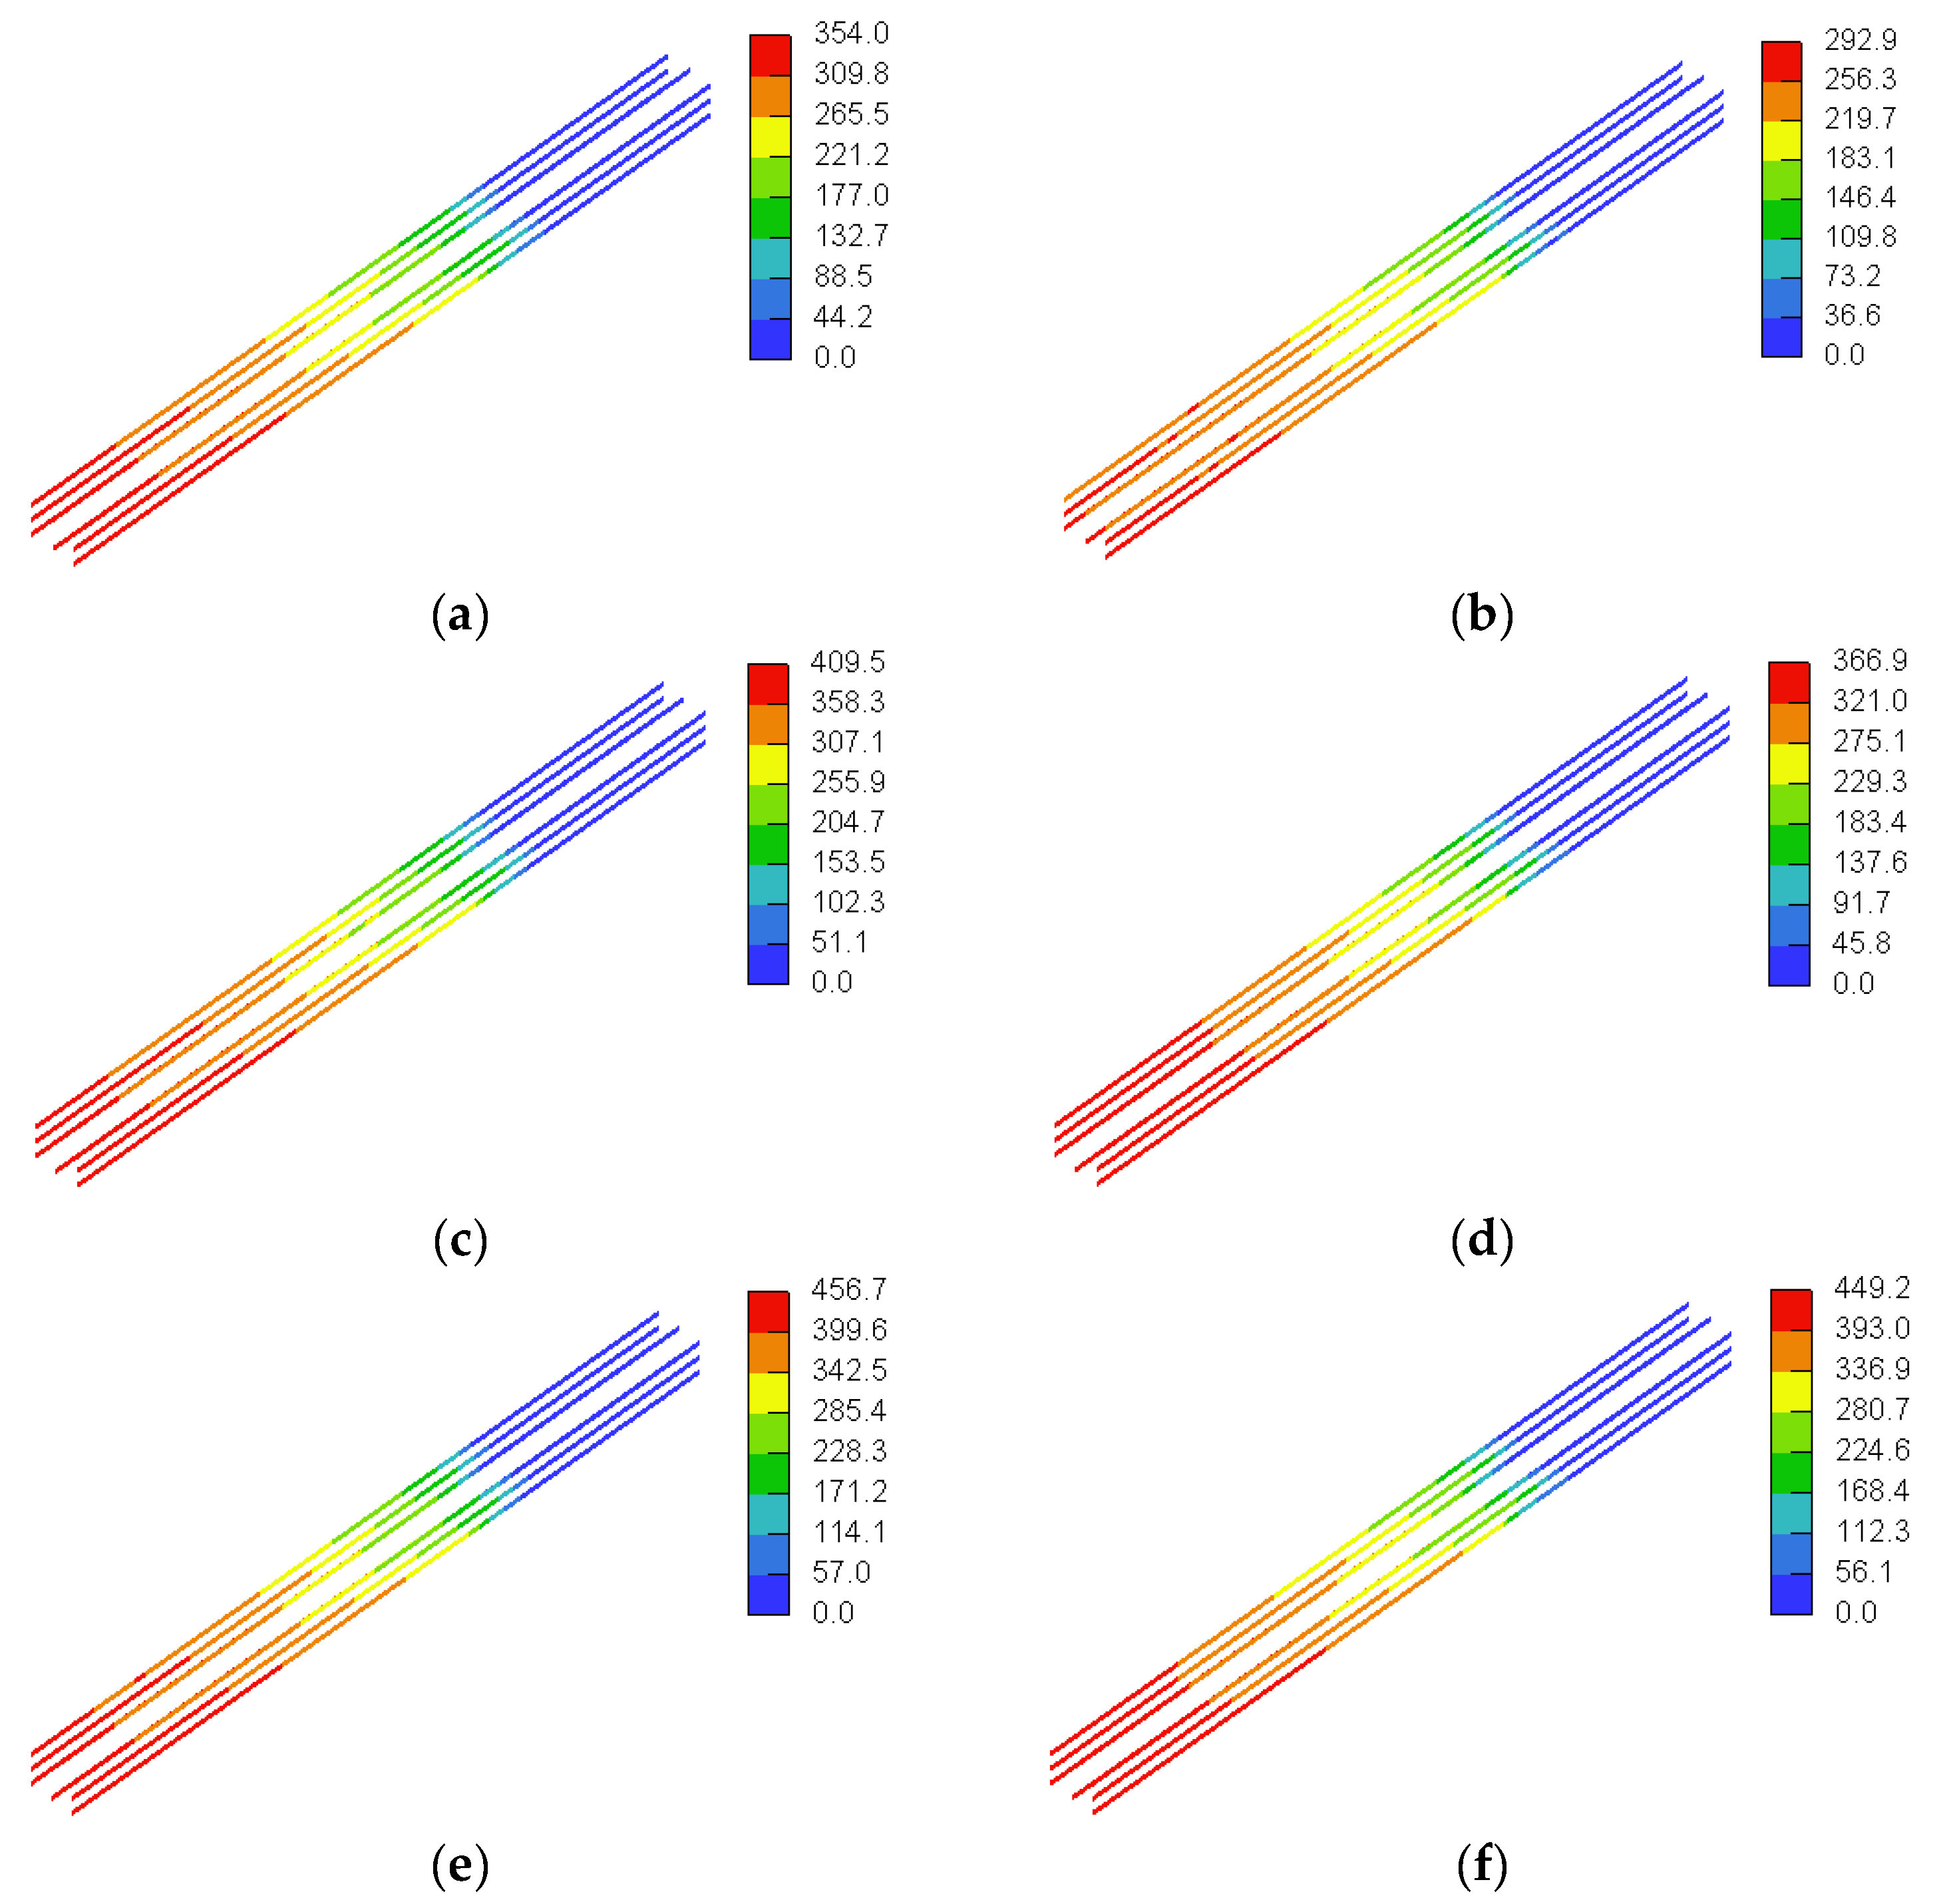
5.1.3. GFRP Stresses

Figure 17 and Figure 18 show general 3D views of the stresses in the GFRP reinforcement predicted numerically for the beam models with a/h = 1.0 and a/h = 1.5, respectively. It is evident that the flexural GFRP reinforcement at the tension side acted as a tie because they featured a uniform stress distribution along the shear span. The beam models with the higher concrete compressive strength sustained a higher ultimate load and, hence, featured higher GFRP stresses at peak load than those of the beam models with lower concrete compressive strengths. The flexural GFRP reinforcing bars did not reach their tensile strengths in any of the beam models. For the beam models with a/h = 1 (Figure 17), the GFRP stress in the flexural reinforcement at tension side at peak load was on average 342 MPa (i.e., 34% of the tensile strength of straight GFRP bars), with a minimum of 292 (i.e., 29% of the tensile strength of straight GFRP bars) and a maximum of 410 MPa (i.e., 41% of the tensile strength of straight GFRP bars). The maximum GFRP stresses at peak load for the beam models with a/h = 1.5 were slightly lower than those of their counterparts with a/h = 1.0. For the beam models with a/h = 1.5 (Figure 18), the GFRP stress in the flexural reinforcement at tension side at peak load was on average 308 MPa (i.e., 31% of the tensile strength of straight GFRP bars), with a minimum of 256 (i.e., 26% of the tensile strength of straight GFRP bars) and a maximum of 376 MPa (i.e., 38% of the tensile strength of straight GFRP bars).

5.2. Deep Beam Models with Web Reinforcement

Parameters of the deep beam models with web reinforcement are summarized in Table 4. The variables were the value of a/h, the concrete compressive strength (f’c), and the spacing between the web reinforcement (s). The beam models had a/h value of either 1.0 or 1.5. The values of f’c were 28, 37, and 50 MPa, representing low (L), moderate (M), and high (H) concrete strengths, respectively. The spacing between the web reinforcement was either 100 or 200 mm, which corresponded to 0.08h and 0.17h, respectively. Figure 19 and Figure 20 show details of the reinforcement of the numerical models of this group with a/h values of 1.0 and 1.5, respectively.

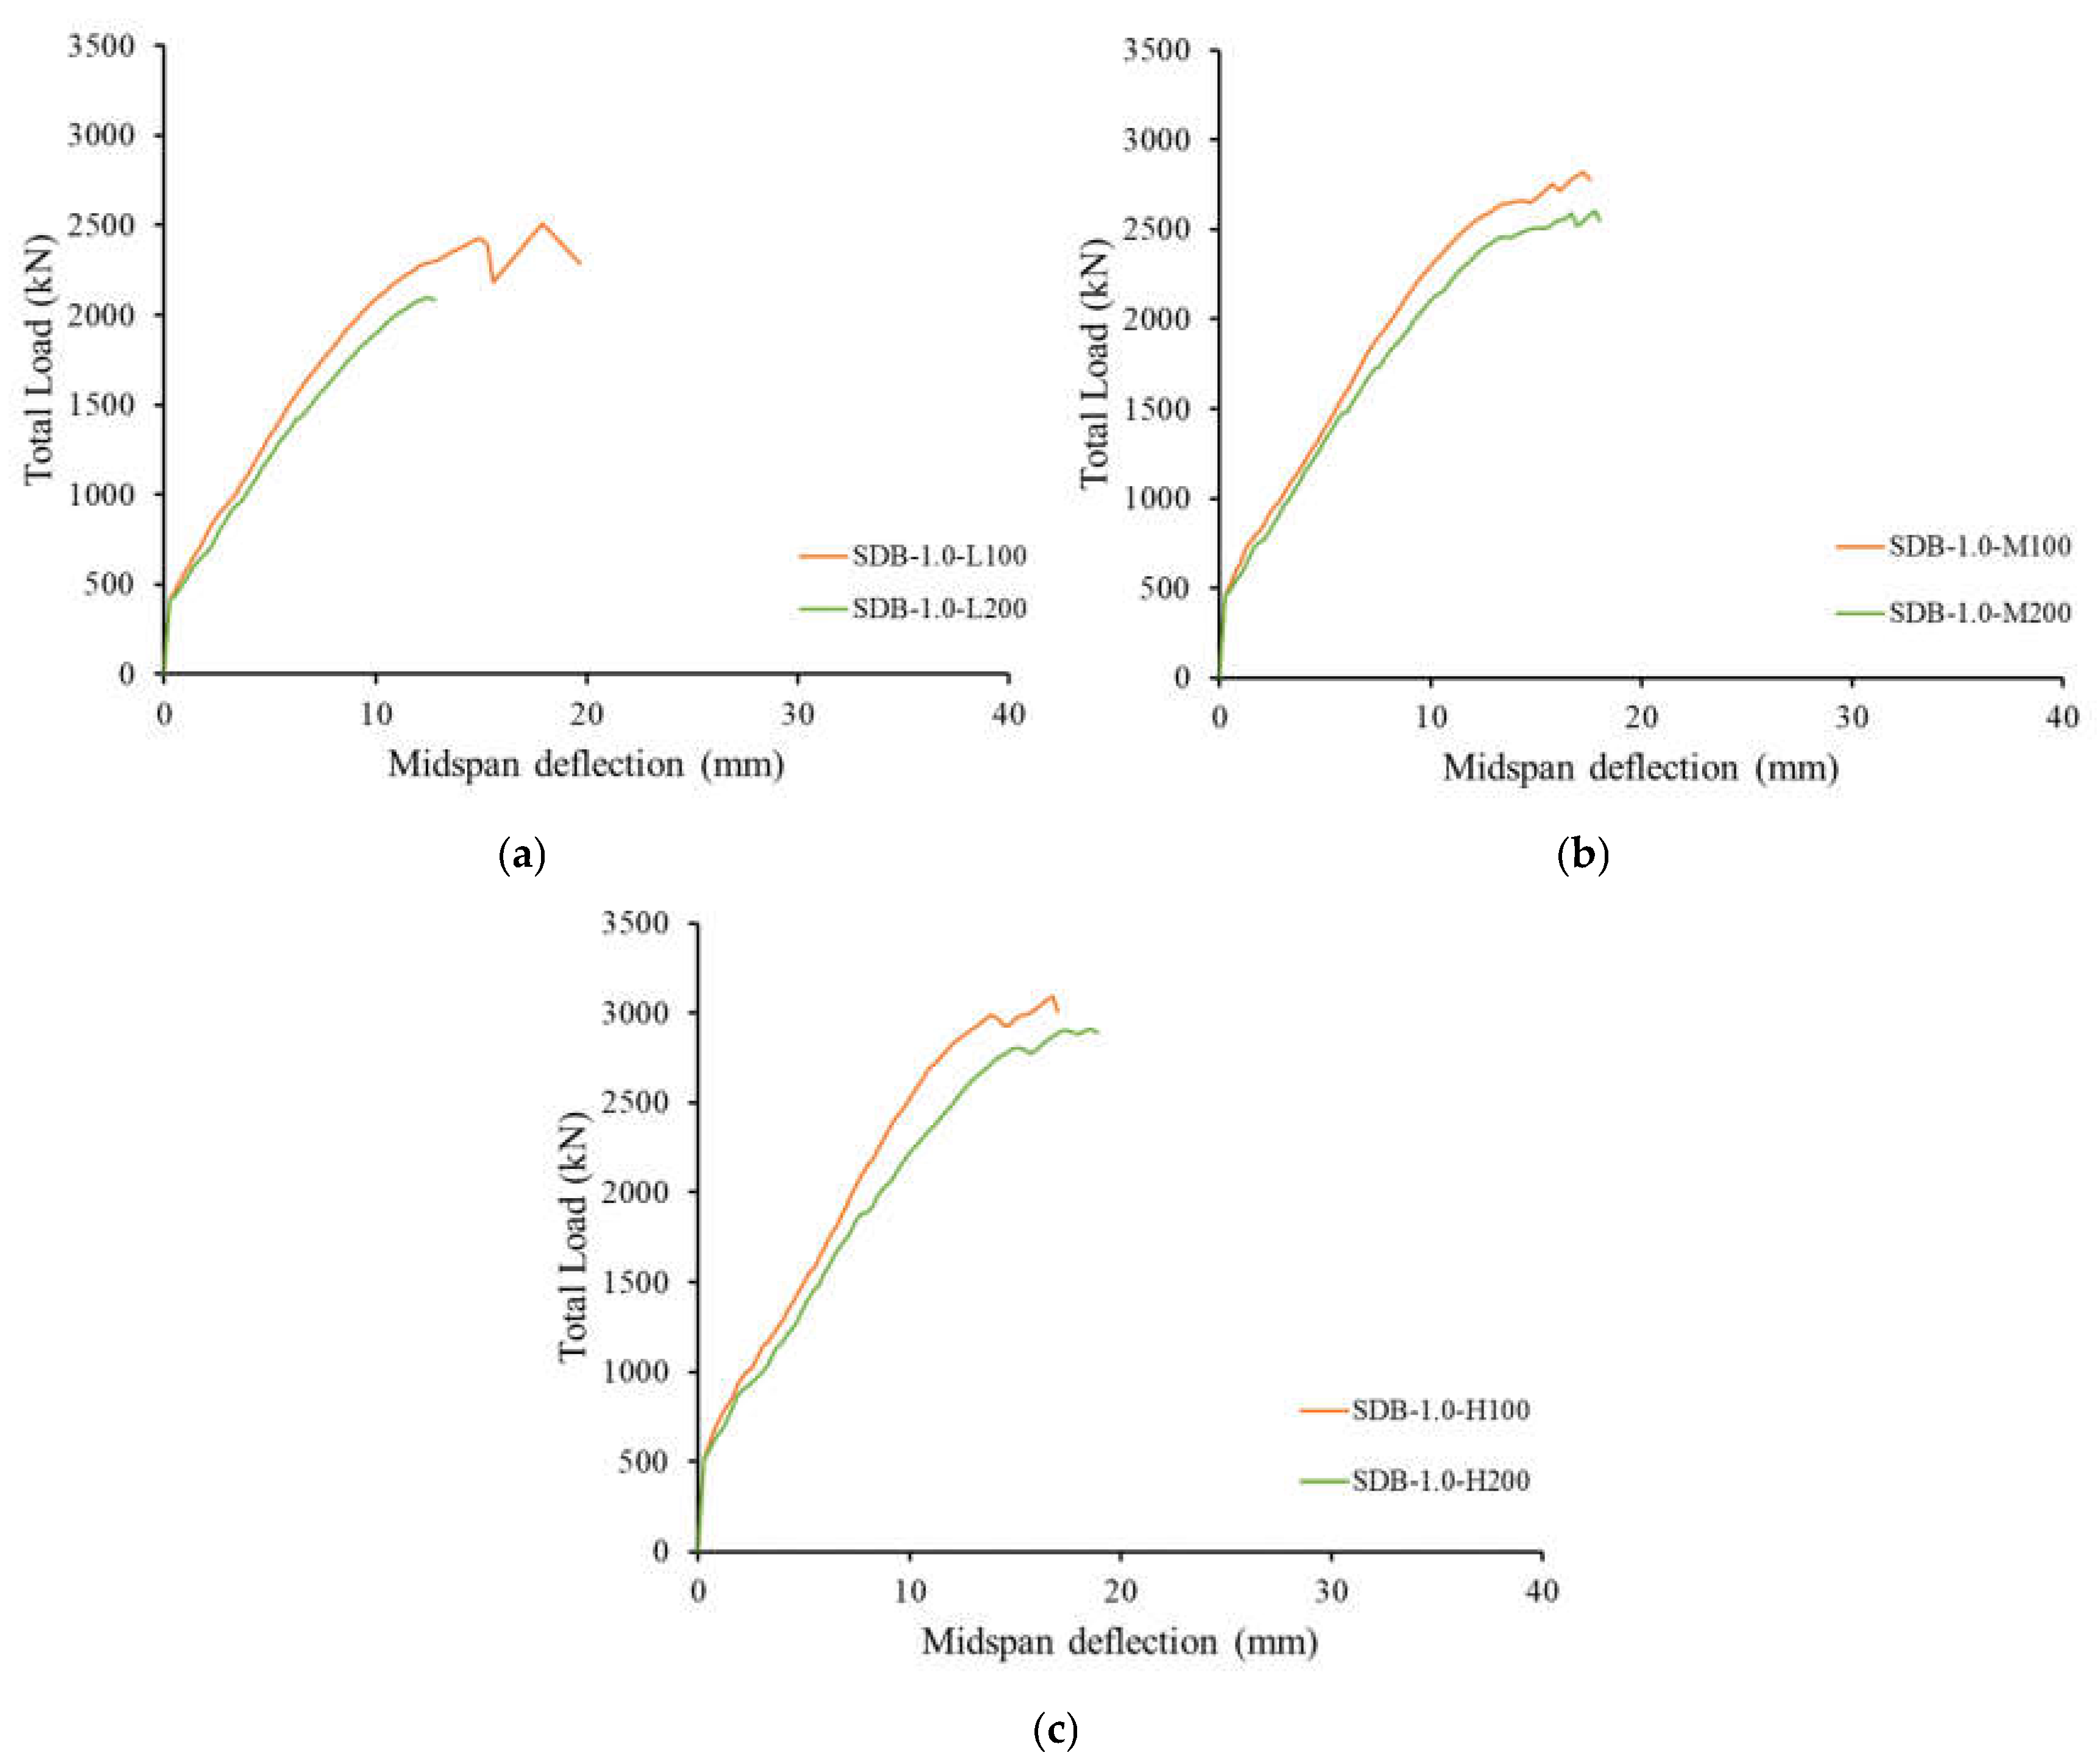
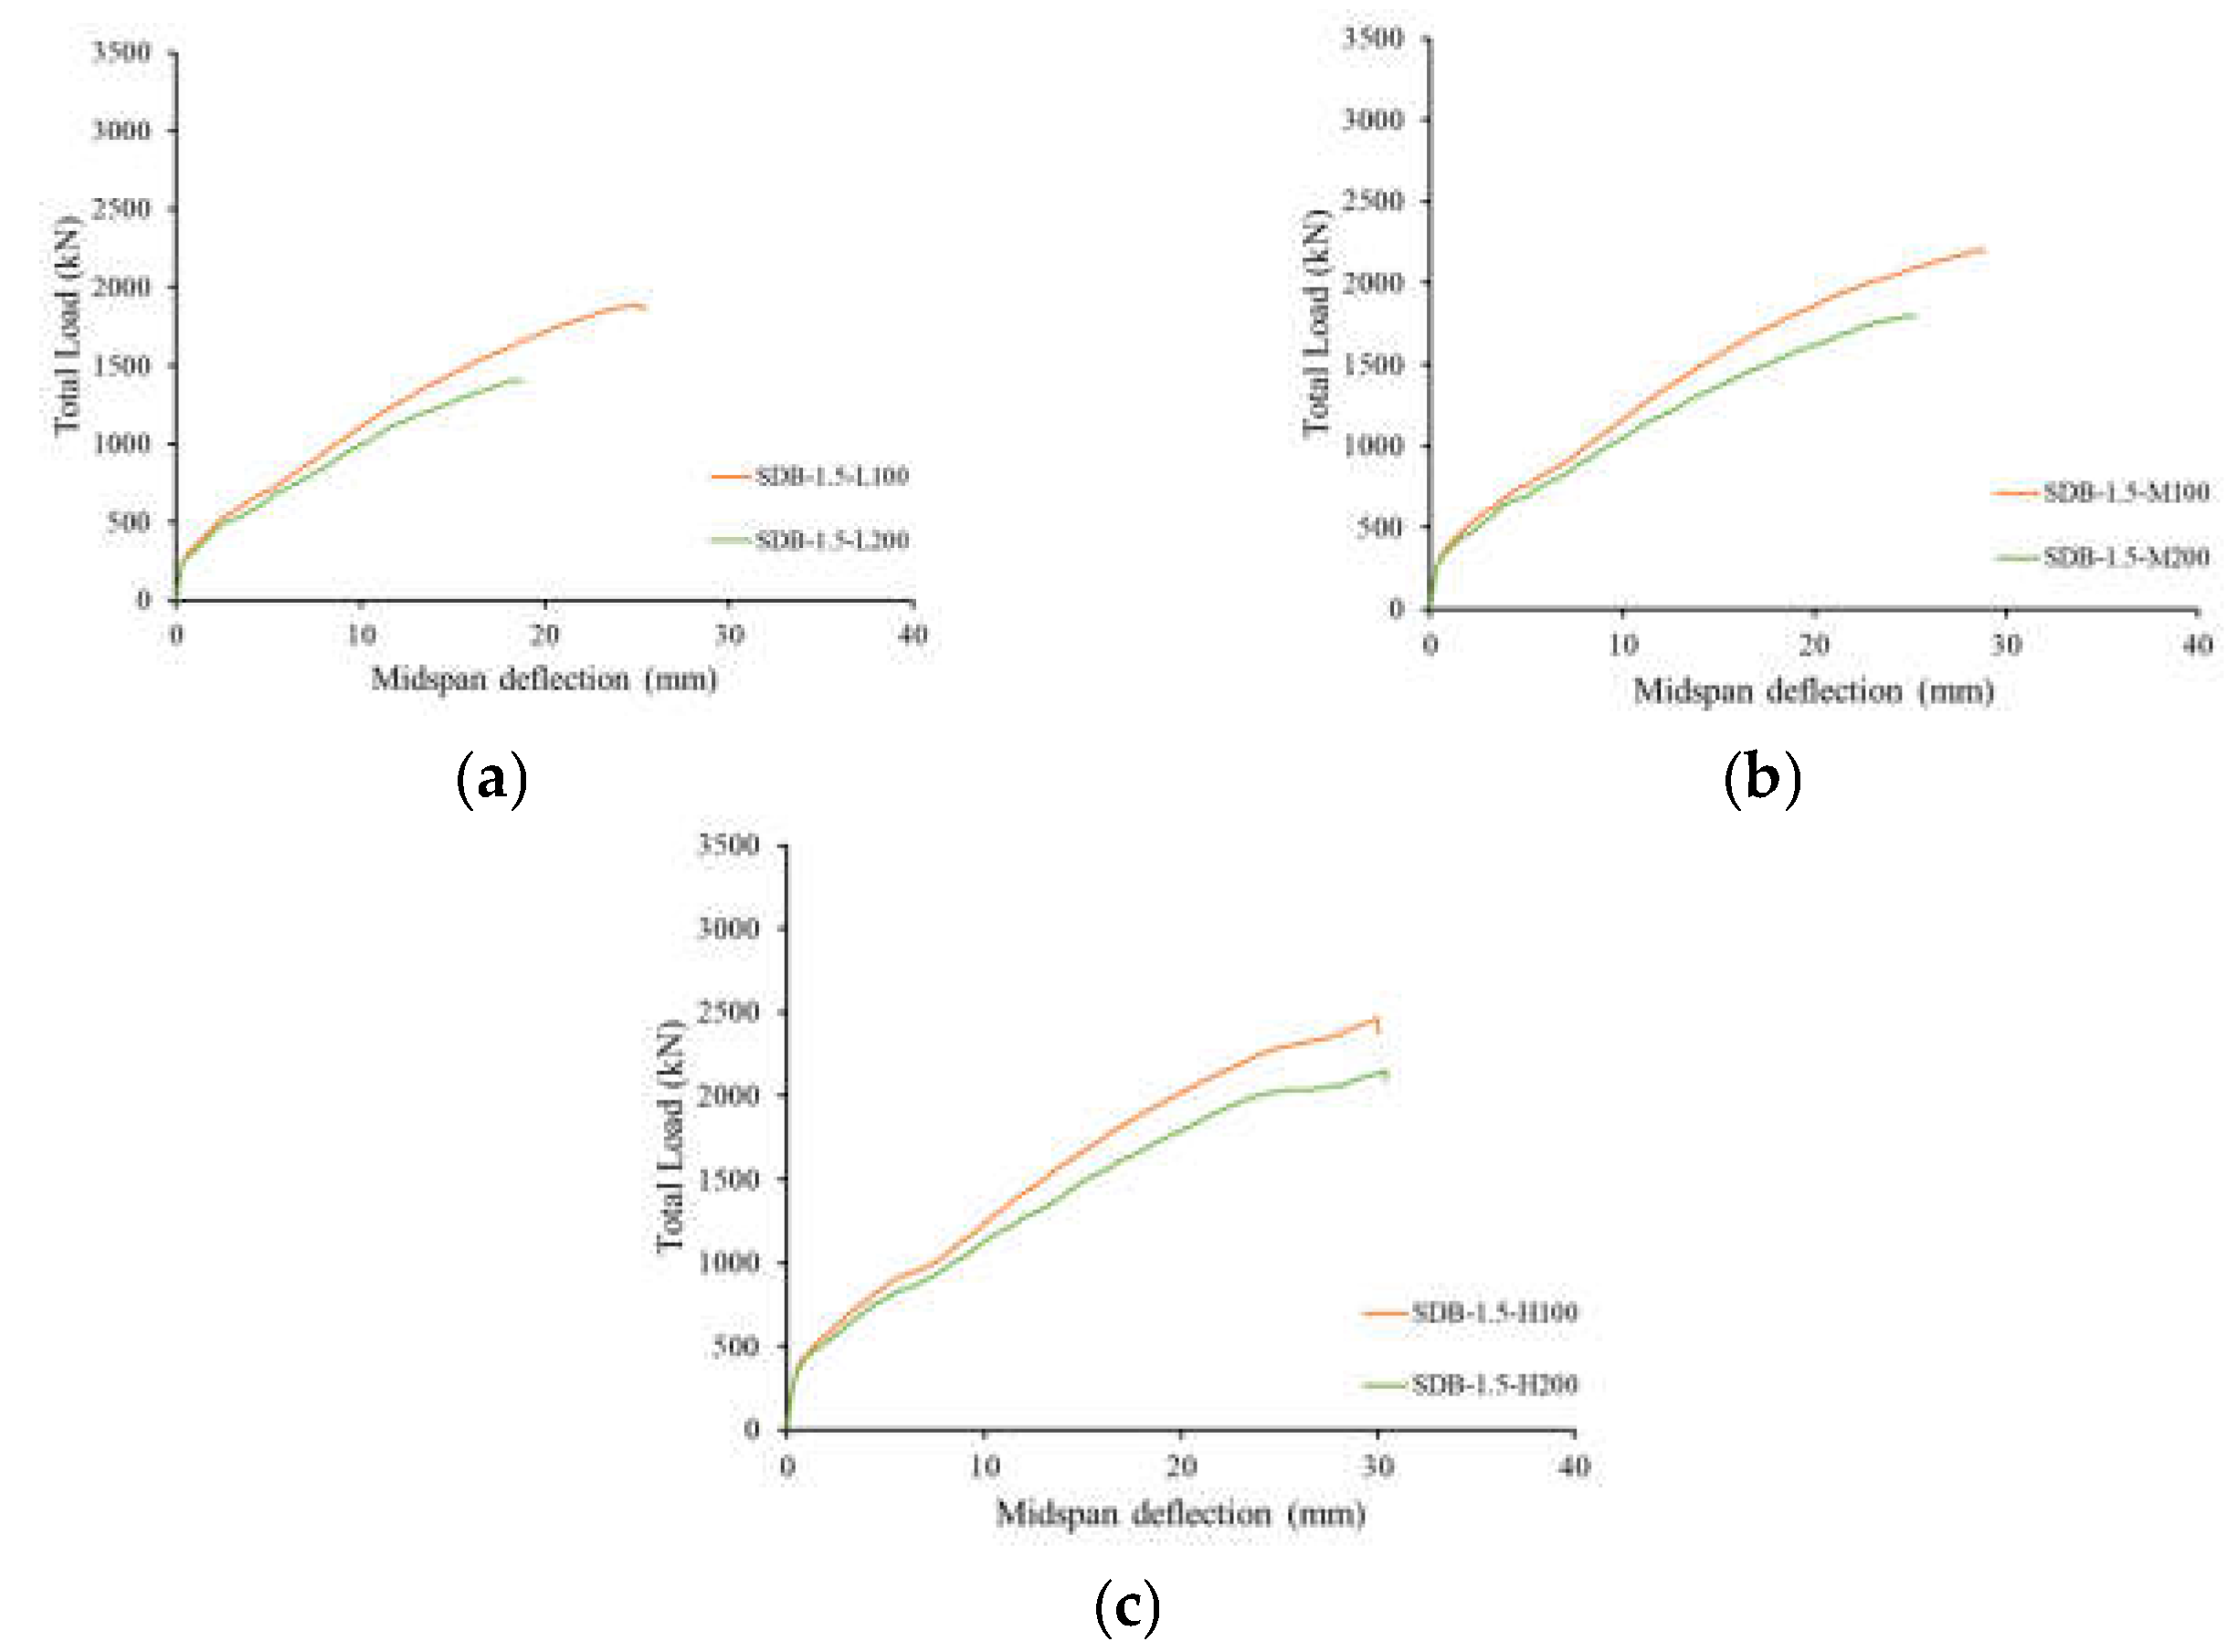
5.2.1. Load–Deflection Response

Figure 21 and Figure 22 show the load–deflection responses of the deep beam models with web reinforcement having a/h values of 1.0 and 1.5, respectively. At the early stage of loading, the deflection increased linearly with an increase in the applied load until flexural cracking occurred. Following flexural cracking, the deflection continued to increase in a quasilinear fashion at a higher rate until the ultimate load was reached. The development and/or initiation of major shear cracks at load values close to the ultimate load caused a load decay and/or another minor change in the slope of the load–deflection response prior to reaching the ultimate load. Figure 21 and Figure 22 show that the flexural cracking load slightly increased with an increase in the compressive strength of the concrete. Changing the spacing between the web reinforcement did not affect the pre-cracking stiffness. Nevertheless, the post-cracking stiffness of the beam models with the larger spacing of 200 mm was slightly lower than that of their counterparts with the smaller spacing of 100 mm. The deflection capacity was not significantly affected by the spacing between the web reinforcement, except for the beam models with the low concrete grade of 28 MPa, where a reduced deflection capacity was recorded for the deep beam models with the larger spacing between web reinforcement. When the responses of the beam models with an a/h of 1.0 (Figure 21) are compared with those of their counterparts, with an a/h of 1.5 (Figure 22), it can be seen that an increase in a/h reduced the cracking load, post-cracking stiffness, and ultimate load. The deep beam models with an a/h of 1.0 failed, however, at deflection values lower than those of their counterparts with an a/h of 1.5.
Table 5 presents the ultimate load and the deflection capacity for the deep beam models of this group. The ultimate loads of the deep models with a/h = 1.5 were lower than those of their counterparts with a/h = 1.0. The beam models SDB-1.5-L100, SDB-1.5-M100, and SDB-1.5-H100 with s = 100 mm exhibited strength reductions of 25, 22, and 21%, respectively, due to increasing the value of a/h from 1.0 to 1.5. Their counterpart beam models SDB-1.5-L200, SDB-1.5-M200, and SDB-1.5-H200 with s = 200 mm exhibited greater strength reductions of 33, 31, and 26%, respectively, due to increasing the value of a/h from 1.0 to 1.5. These results indicate that the strength reduction caused by increasing the value of a/h tended to decrease with an increase in the concrete compressive strength. Furthermore, the strength reduction caused by increasing the value of a/h was more pronounced for the beam models with a lower amount of web reinforcement (i.e., greater spacing between web reinforcement). Generally, the beam models with a/h = 1.5 failed at a greater deflection capacity than that of their counterparts with a/h = 1.0. Such an increase in the deflection capacity due to increasing the value of a/h was more significant for the beam models with higher concrete strength. Average increases of 44, 53, and 71% in the deflection capacity were recorded for the beam models with low (L), moderate (M), and high (H) concrete compressive strengths, respectively.
Figure 23a,b show the effect of the concrete compressive strength and spacing between web reinforcement on the strength of the deep beam models with a/h values of 1.0 and 1.5, respectively. It is evident that the ultimate load increased almost linearly with an increase in the concrete compressive strength, irrespective of the value of a/h and the spacing between the web reinforcement. It is evident that increasing the amount of web reinforcement through the use of a reduced spacing of 100 mm instead of 200 mm increased the strength of the beam models. The strength gain caused by increasing the amount of the web reinforcement was, however, dependent on the concrete strength and the value of a/h. Figure 24 shows the effect of f’c and a/h on the strength gain caused by increasing the amount of the web reinforcement in the deep beam models (i.e., decreasing the stirrup spacing from 200 to 100 mm). The ultimate loads of the models with a stirrup spacing of 100 mm were compared with those of their counterparts with a stirrup spacing of 200 mm to obtain the corresponding strength gain caused by increasing the amount of web reinforcement. For the beam models with a/h = 1.0, strength gains of 20, 8, and 6% were recorded for the beam models with low (L), moderate (M), and high (H) concrete compressive strengths, respectively, due to decreasing the stirrup spacing from 200 to 100 mm. For the beam models with a/h = 1.5, decreasing the stirrup spacing from 200 to 100 mm resulted in strength gains of 34, 22, and 15% for the beam models with low (L), moderate (M), and high (H) concrete compressive strengths, respectively. These results imply that the impact of increasing the amount of web reinforcement diminished with an increase in the concrete compressive strength. Furthermore, the strength gain caused by increasing the amount of web reinforcement was more pronounced for the beam models with the greater a/h of 1.5.

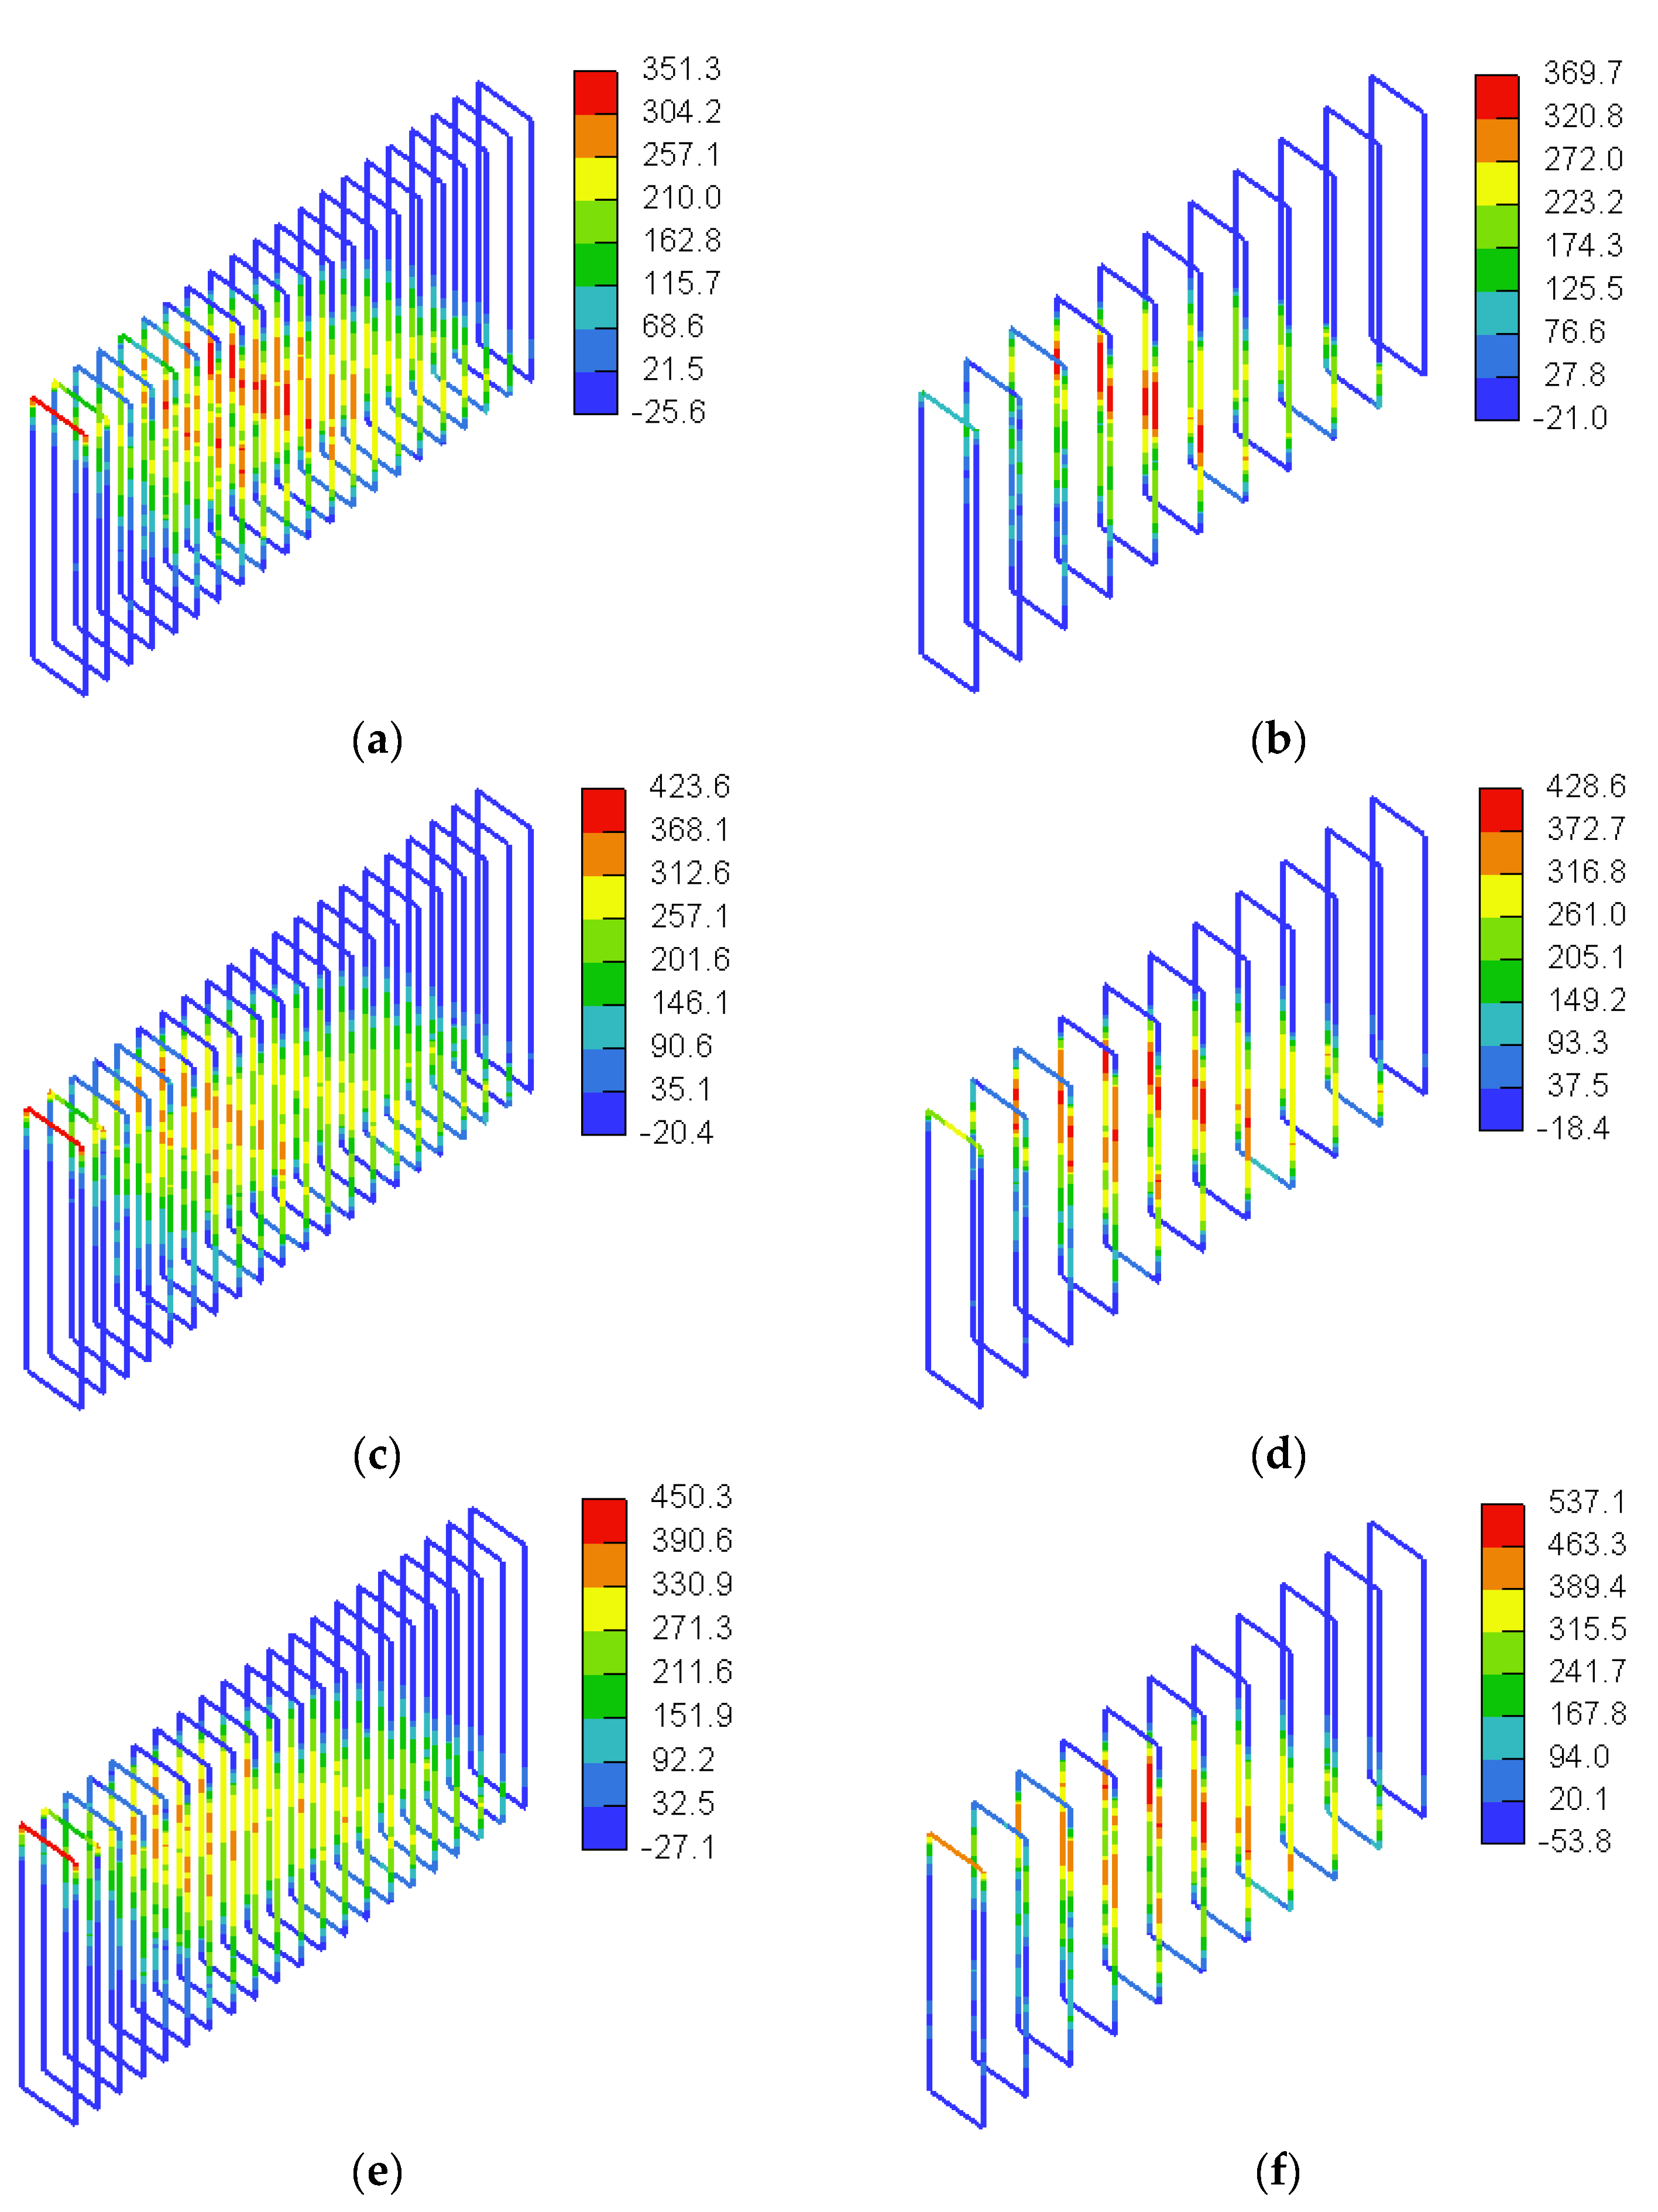
5.2.2. Crack Pattern and Failure Mechanism

Figure 25 and Figure 26 show the crack development and propagation for two sample deep beam models with a/h = 1.0 and web reinforcement spacing of 100 and 200 mm, respectively, at different loading stages. As highlighted earlier, the minimum displayed crack width has been set to be 0.1 mm, and hence, only cracks with a width ≥ 0.1 mm are marked with black lines. The contours show the crack distribution, and the legend provides the corresponding crack width values. Flexural cracks initiated first in both deep beam models of this group. As the load increased, multiple shear cracks were then developed along the natural load path connecting the load and support plates, noting that the beam models with the larger spacing of s = 200 mm exhibited fewer shear cracks within the shear span than those of the models with the smaller spacing of s = 100 mm. Further increase in the applied load resulted in the development of additional shear cracks until the ultimate load was reached along the strut connecting the support and load plates. It is noteworthy that the beam models with s = 100 mm exhibited a bottle-shaped strut at the ultimate load. Figure 27 and Figure 28 show the crack development and propagation for two sample deep beam models with a/h = 1.5 and web reinforcement spacing of 100 and 200 mm, respectively, at different loading stages. Flexural cracks were initiated at the early stage of loading in the midspan and in the region of the shear span closer to the load points. Several shear cracks were then developed in the shear span. The beam models with the smaller spacing of s = 100 mm exhibited a higher number of well-distributed shear cracks within the shear span than those of the models with the larger spacing of s = 200 mm. Further increase in the applied load resulted in development of additional shear cracks until the ultimate load was reached along the diagonal struts formed in the shear span. A fan-shaped distribution of diagonal cracks was formed at the ultimate load.

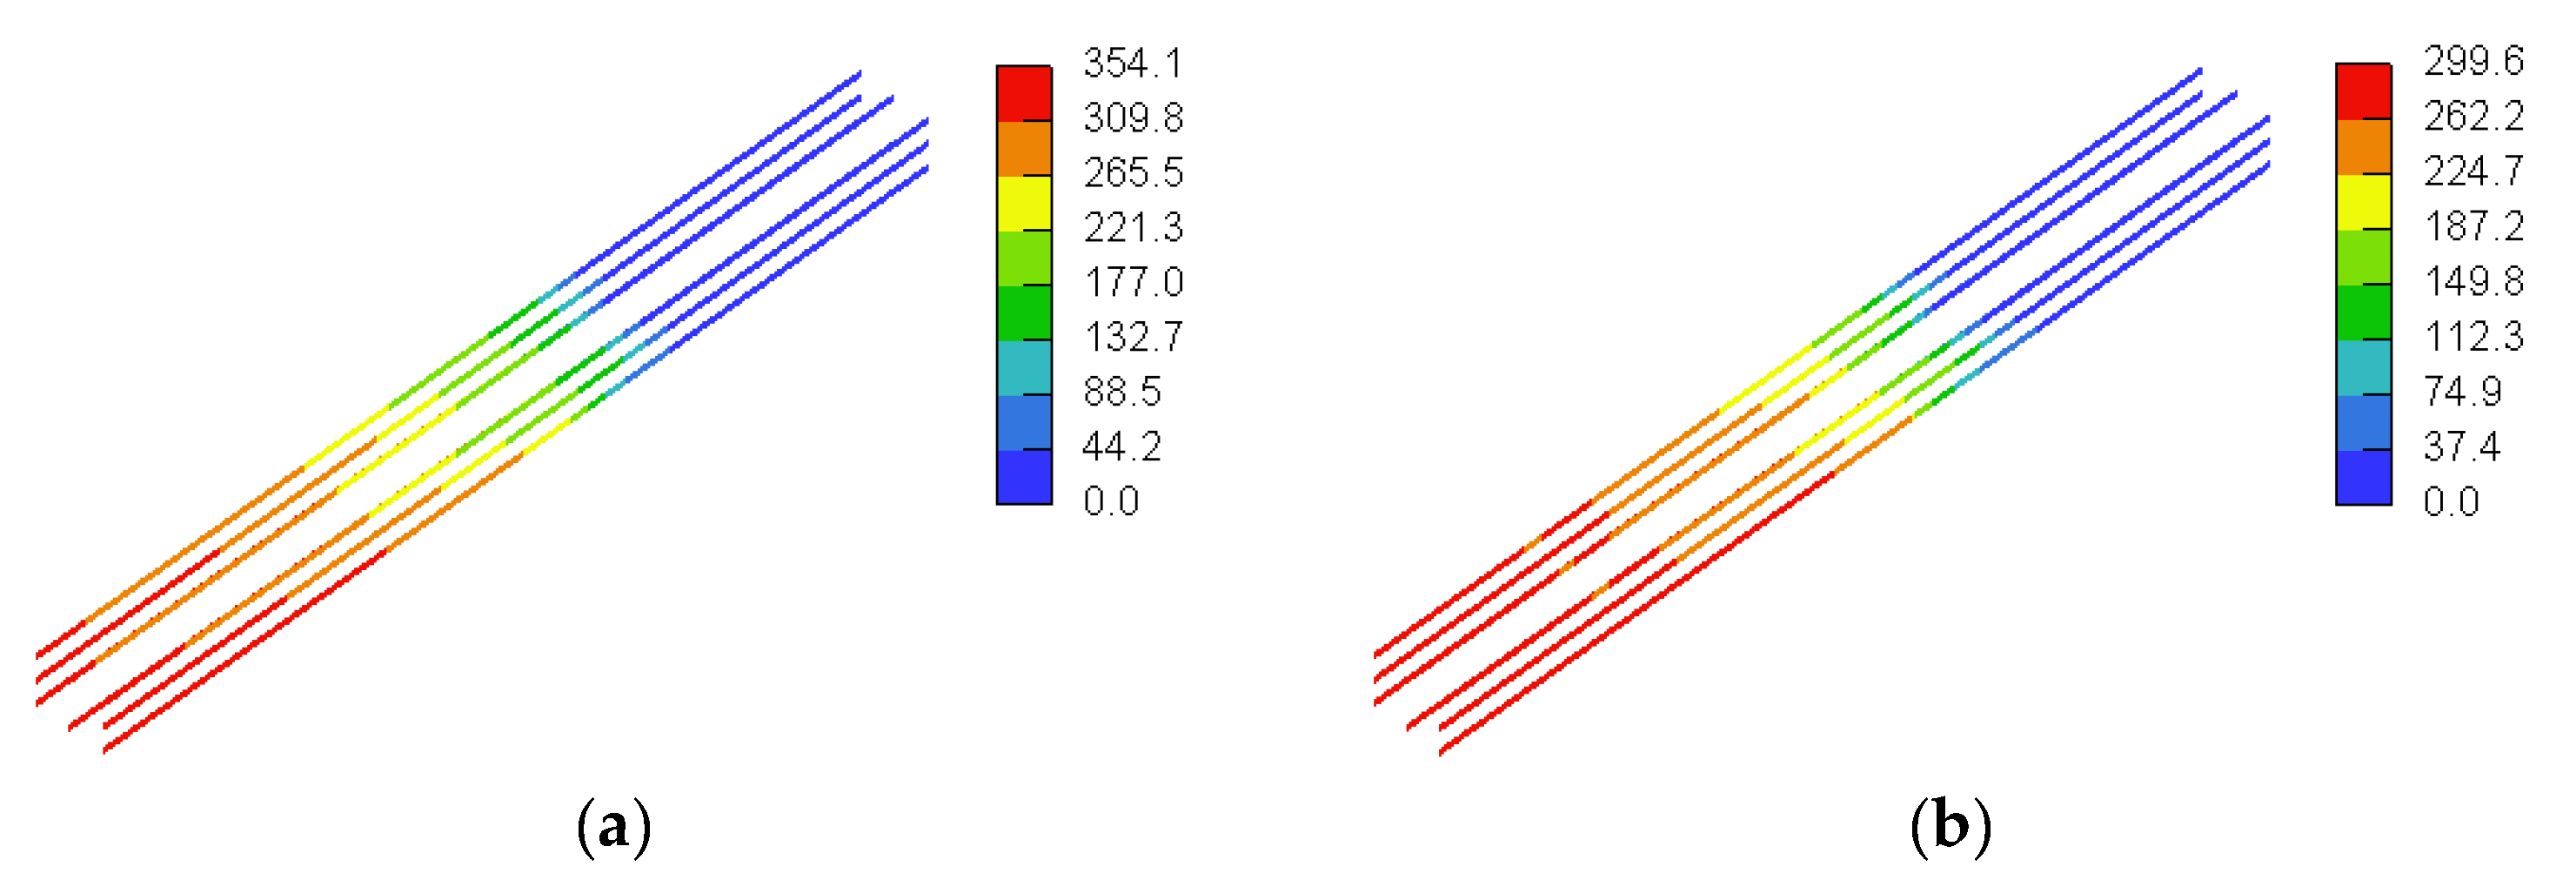
5.2.3. GFRP Stresses

Figure 29 and Figure 30 show general 3D views of the stresses in the vertical GFRP stirrups predicted numerically for the beam models with a/h = 1.0 and a/h = 1.5, respectively. From Figure 29, it can be seen that the top horizontal part along with the top bent portions of the vertical GFRP stirrup under the load plate in most of the beam models with a/h = 1.0 almost reached the tensile strength of the bent portion of the GFRP bars. The beam model SDB-1.0-L200 was an exception where a maximum stress of 329 MPa (i.e., 72% of the tensile strength of the bent portion of GFRP bars) was recorded in the vertical GFRP stirrups. From Figure 30, it can be seen that none of the vertical GFRP stirrups for the beam models with a/h = 1.5 reached their tensile strengths, except in model SDB-1.5-H200. The top horizontal part along with the top bent portions of the vertical GFRP stirrup under the load plate in the model almost reached the tensile strength of the bent portion of GFRP (459 MPa). Figure 30 also shows that the stresses in the vertical GFRP stirrups at peak load tended to increase with an increase in the concrete compressive strength. It seems that increasing the concrete compressive strength delayed the failure of the beam and allowed the GFRP stirrups to exhibit higher stresses prior to failure.
Figure 31 and Figure 32 show stresses in the horizontal web reinforcement predicted numerically for the beam models with a/h = 1.0 and a/h = 1.5, respectively. None of the horizontal web reinforcing bars reached their tensile strength. The maximum stress in the horizontal GFRP bars was on average 304 MPa (26% of the tensile strength of straight GFRP bars) for the beam models with a/h = 1.0 and 334 MPa for the beam models with a/h = 1.5 (28% of the tensile strength of straight GFRP bars). The stresses in the horizontal web reinforcement at peak load tended to increase with an increase in the concrete compressive strength and the amount of web reinforcement. Increasing the concrete compressive strength and/or amount of web reinforcement allowed the beam models to sustain higher loads prior to the ultimate load, thus allowing the horizontal GFRP reinforcement to contribute further to the shear capacity through sustaining additional stresses prior to ultimate load. Figure 33 and Figure 34 show stresses in the tensile flexural reinforcement predicted numerically for the beam models with a/h = 1.0 and a/h = 1.5, respectively. The tensile flexural reinforcing bars did not reach the tensile strength of straight GFRP bars in any of the models. The stress in the flexural reinforcement was almost uniform within the shear span, except in the region very close to the upper plate and beyond which showed reduced GFRP stresses. The uniform stress distribution of the GFRP in the shear span is ascribed to the arch action effect, in which the flexural reinforcing bars act as a tie. The maximum stress in the flexural GFRP bars was on average 378 MPa (38% of the tensile strength of straight GFRP bars) for the beam models with a/h = 1.0 and 388 MPa for the beam models with a/h = 1.5 (39% of the tensile strength of straight GFRP bars). The beam models with the higher concrete compressive strength exhibited higher GFRP stresses at peak load. The delayed failure of the beam models with the higher concrete compressive strength allowed the beam to sustain additional loads and induce extra stresses in the flexural GFRP bars prior to the ultimate load.

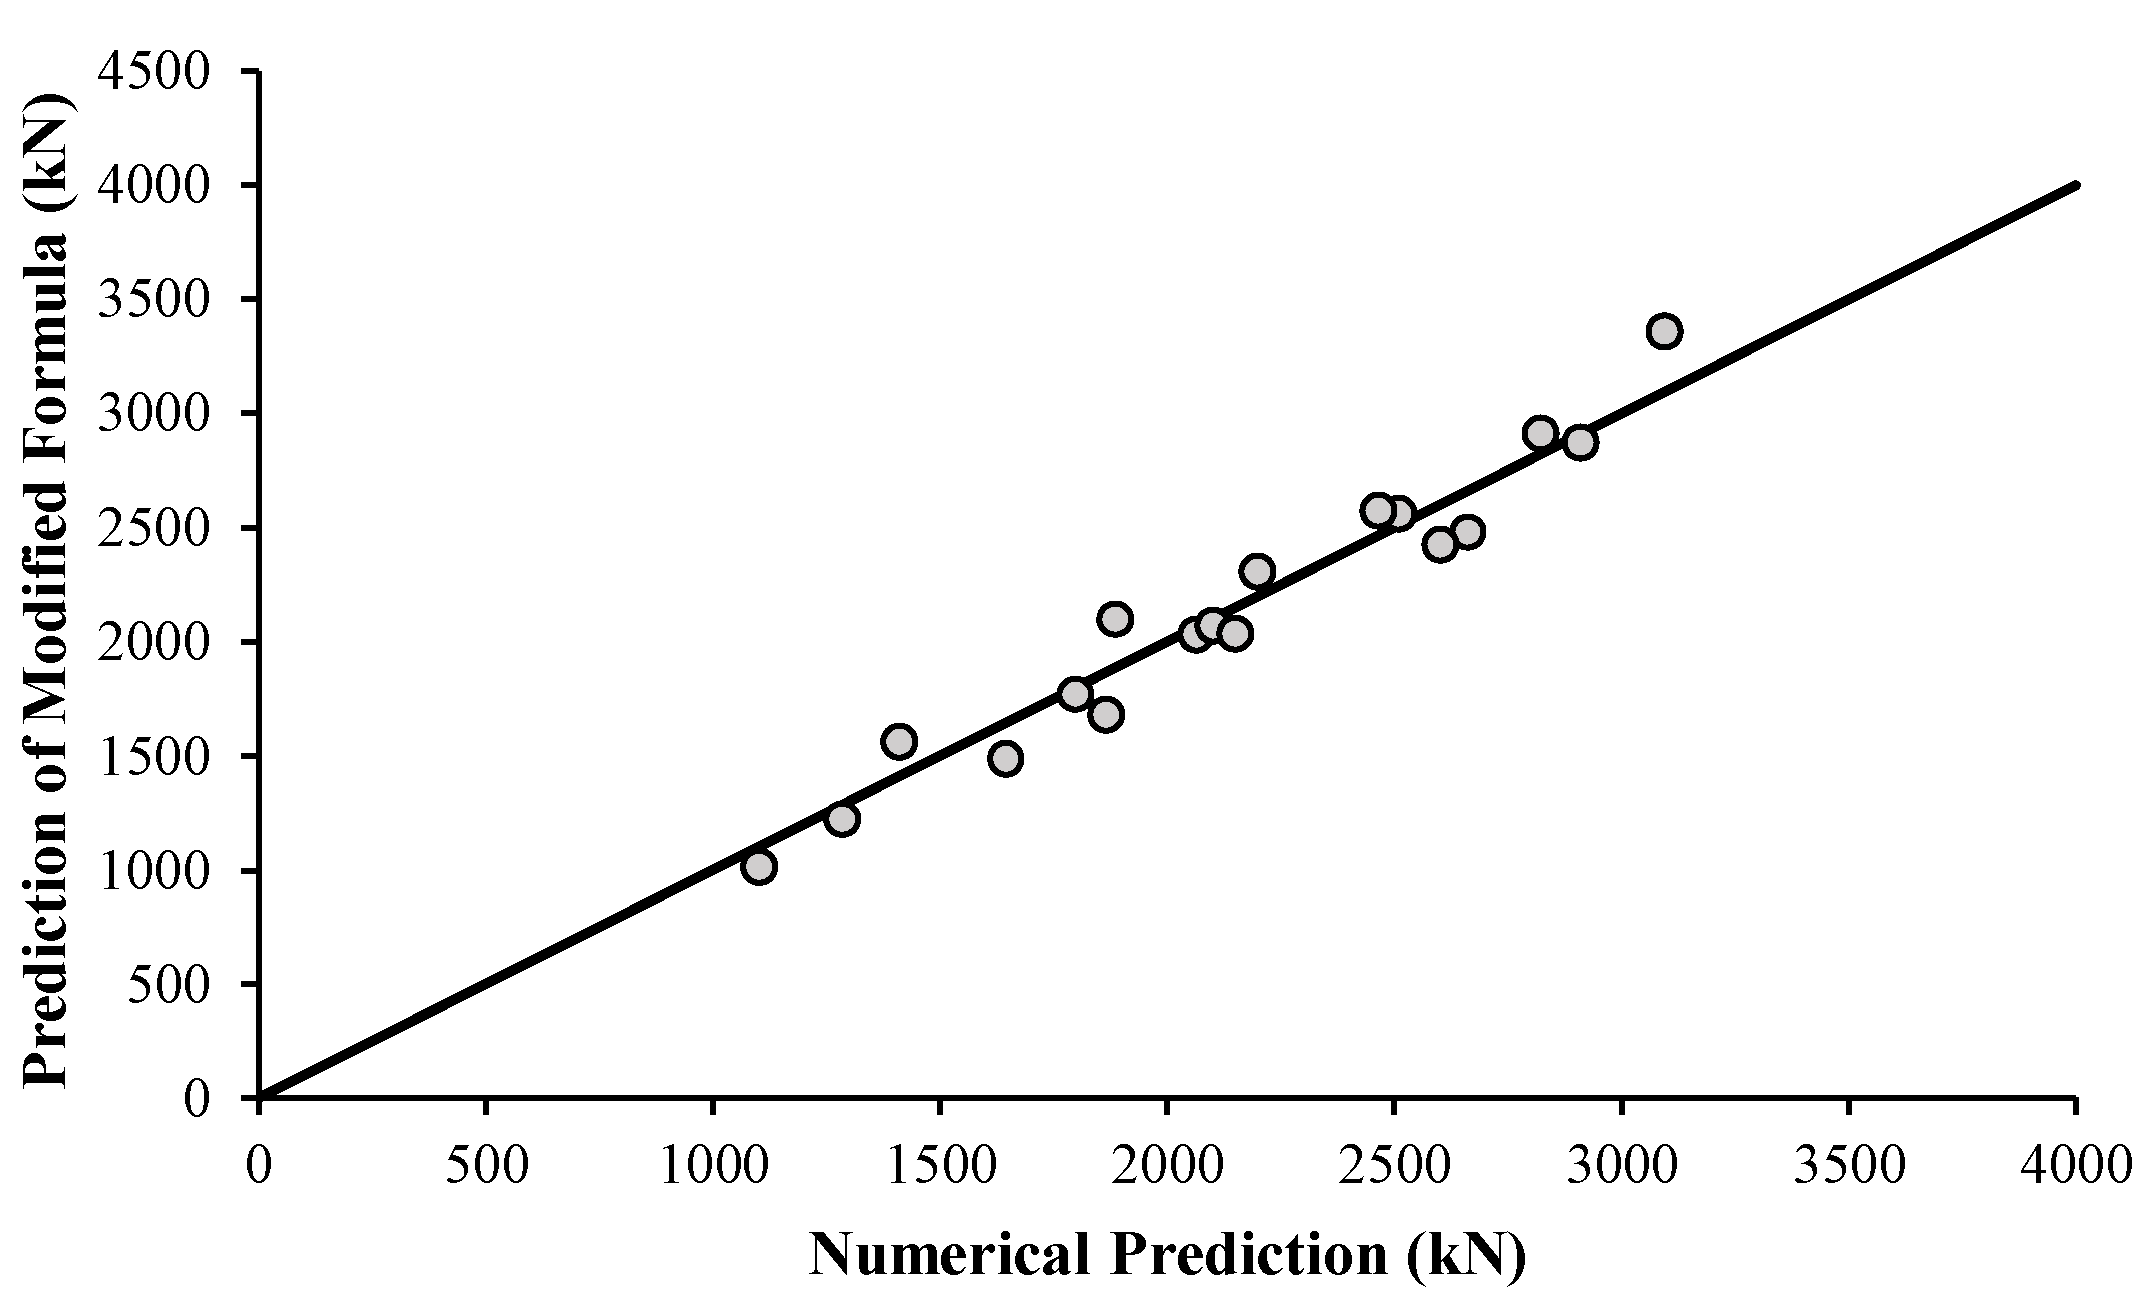
6. Simplified Analytical Formulas

Kong et al. [30] proposed Equation 1 to estimate the shear strength (Vu) of solid concrete deep beams reinforced with steel bars, noting that the total ultimate load (Ptotal) of the deep beam of the present study equals 2Vu (see Figure 5). In these equations, X is the clear shear span, ft is the tensile strength of the concrete, b is the width of the beam, h is the total depth of the beam, A is the area of an individual web bar or a main reinforcing bar, y1 is the depth at which a typical bar intersects a potential critical shear crack, α1 is the angle of inclination between a typical bar and the critical shear crack, C1 is 1.4 for normal weight concrete, and C2 is 300 N/mm2 for deformed steel bars.
Table 6 compares predictions of Kong et al.’s [30] equation for the deep beams included in the parametric study with the strengths predicted by the numerical analysis. It is evident that Kong et al.’s [30] model significantly overestimated the ultimate loads of the deep beam models by up to 82%. This unconservative prediction could be attributed to two reasons. First, this can be due to a reduction in the contribution of the concrete to the shear capacity caused by the increased transverse strain due to stressing of the GFRP bars and the increased crack width of the inclined shear cracks developed along the strut developed in the shear span. The second reason could be the reduced dowel action caused by the change in the properties of the reinforcing bars from steel to GFRP. The replacement of the steel reinforcement by GFRP bars necessitates a modification in the contribution of the concrete to the shear resistance to account for the increased crack width on the strut capacity and in the C2 value for the main longitudinal bars to account for an anticipated reduction in the dowel action in GFRP-reinforced concrete deep beams. As such, Equation (2), proposed in the present study, represents a modified formula to estimate Vu of solid concrete deep beams reinforced with GFRP bars, where Af is the individual area of a main reinforcing bar, Aw is the individual area of a web reinforcing bar, Ef is the elastic modulus of the main GFRP reinforcing bars (66.4 GPa), and Es is the elastic modulus of steel bars (200 GPa). As shown in Table 6, predictions of the modified analytical formula are in good agreement with the numerical results. The total ultimate loads predicted by the modified analytical formula were within an 11% error band. The minor deviation between predictions of the analytical formula and the numerical results verifies its capacity to provide reasonable predictions for the ultimate load of solid GFRP-reinforced concrete deep beams. Predictions of the modified formulas are plotted against predictions of the deep beam models included in the parametric study in Figure 35. It can be seen that the modified analytical formula proposed in this study can provide reasonable predictions for the ultimate load of GFRP-reinforced concrete deep beams.
V u =   C 1 1     0.35 X h f t bh + C 2 A y 1 h sin 2 α 1
V u = C 1 1 0.50 X h f t bh + C 2 E f E s A f y 1 h sin 2 α 1 + C 2 A w y 1 h sin 2   α 1
Table 6. Comparison between predictions of analytical formulas and numerical results.
ModelTotal Ultimate Load (kN)
NumericalKong et al. [30] (Equation (1))Modified Formula (Equation (2))
PredictionError (%) *PredictionError (%) *
SDB-1.0-L18652819+511678−10
SDB-1.0-M20643253+582030−2
SDB-1.0-H26613805+432478−7
SDB-1.5-L11011998+811013−8
SDB-1.5-M12842332+821221−5
SDB-1.5-H16442756+681487−10
SDB-1.0-L10025103700+4725592
SDB-1.0-L20021003214+532072−1
SDB-1.0-M10028214134+4729113
SDB-1.0-M20026013647+402424−7
SDB-1.0-H10030944686+513358+9
SDB-1.0-H20029094200+442872−1
SDB-1.5-L10018853082+632097+11
SDB-1.5-L20014112546+801560+11
SDB-1.5-M10021993416+5523065
SDB-1.5-M20017972879+601769−2
SDB-1.5-H10024643840+5625714
SDB-1.5-H20021493304+542034−5
*   Error   ( % ) = Formula Numerical Numerical × 100 .
Figure 35. Predictions of the modified analytical formula versus numerical predictions.
Buildings 13 02767 g035

7. Conclusions

Three-dimensional (3D) simulation models capable of predicting the structural behavior of GFRP-reinforced concrete beams were developed and validated against published experimental data. A parametric study was carried out to investigate the influence of key parameters affecting the structural behavior of GFRP-reinforced concrete deep beams. The results of the parametric study were used to introduce a refined simplified analytical expression for the prediction of the shear strength of GFRP-reinforced concrete deep beams. Based on the results of the numerical analysis, the following conclusions are drawn:
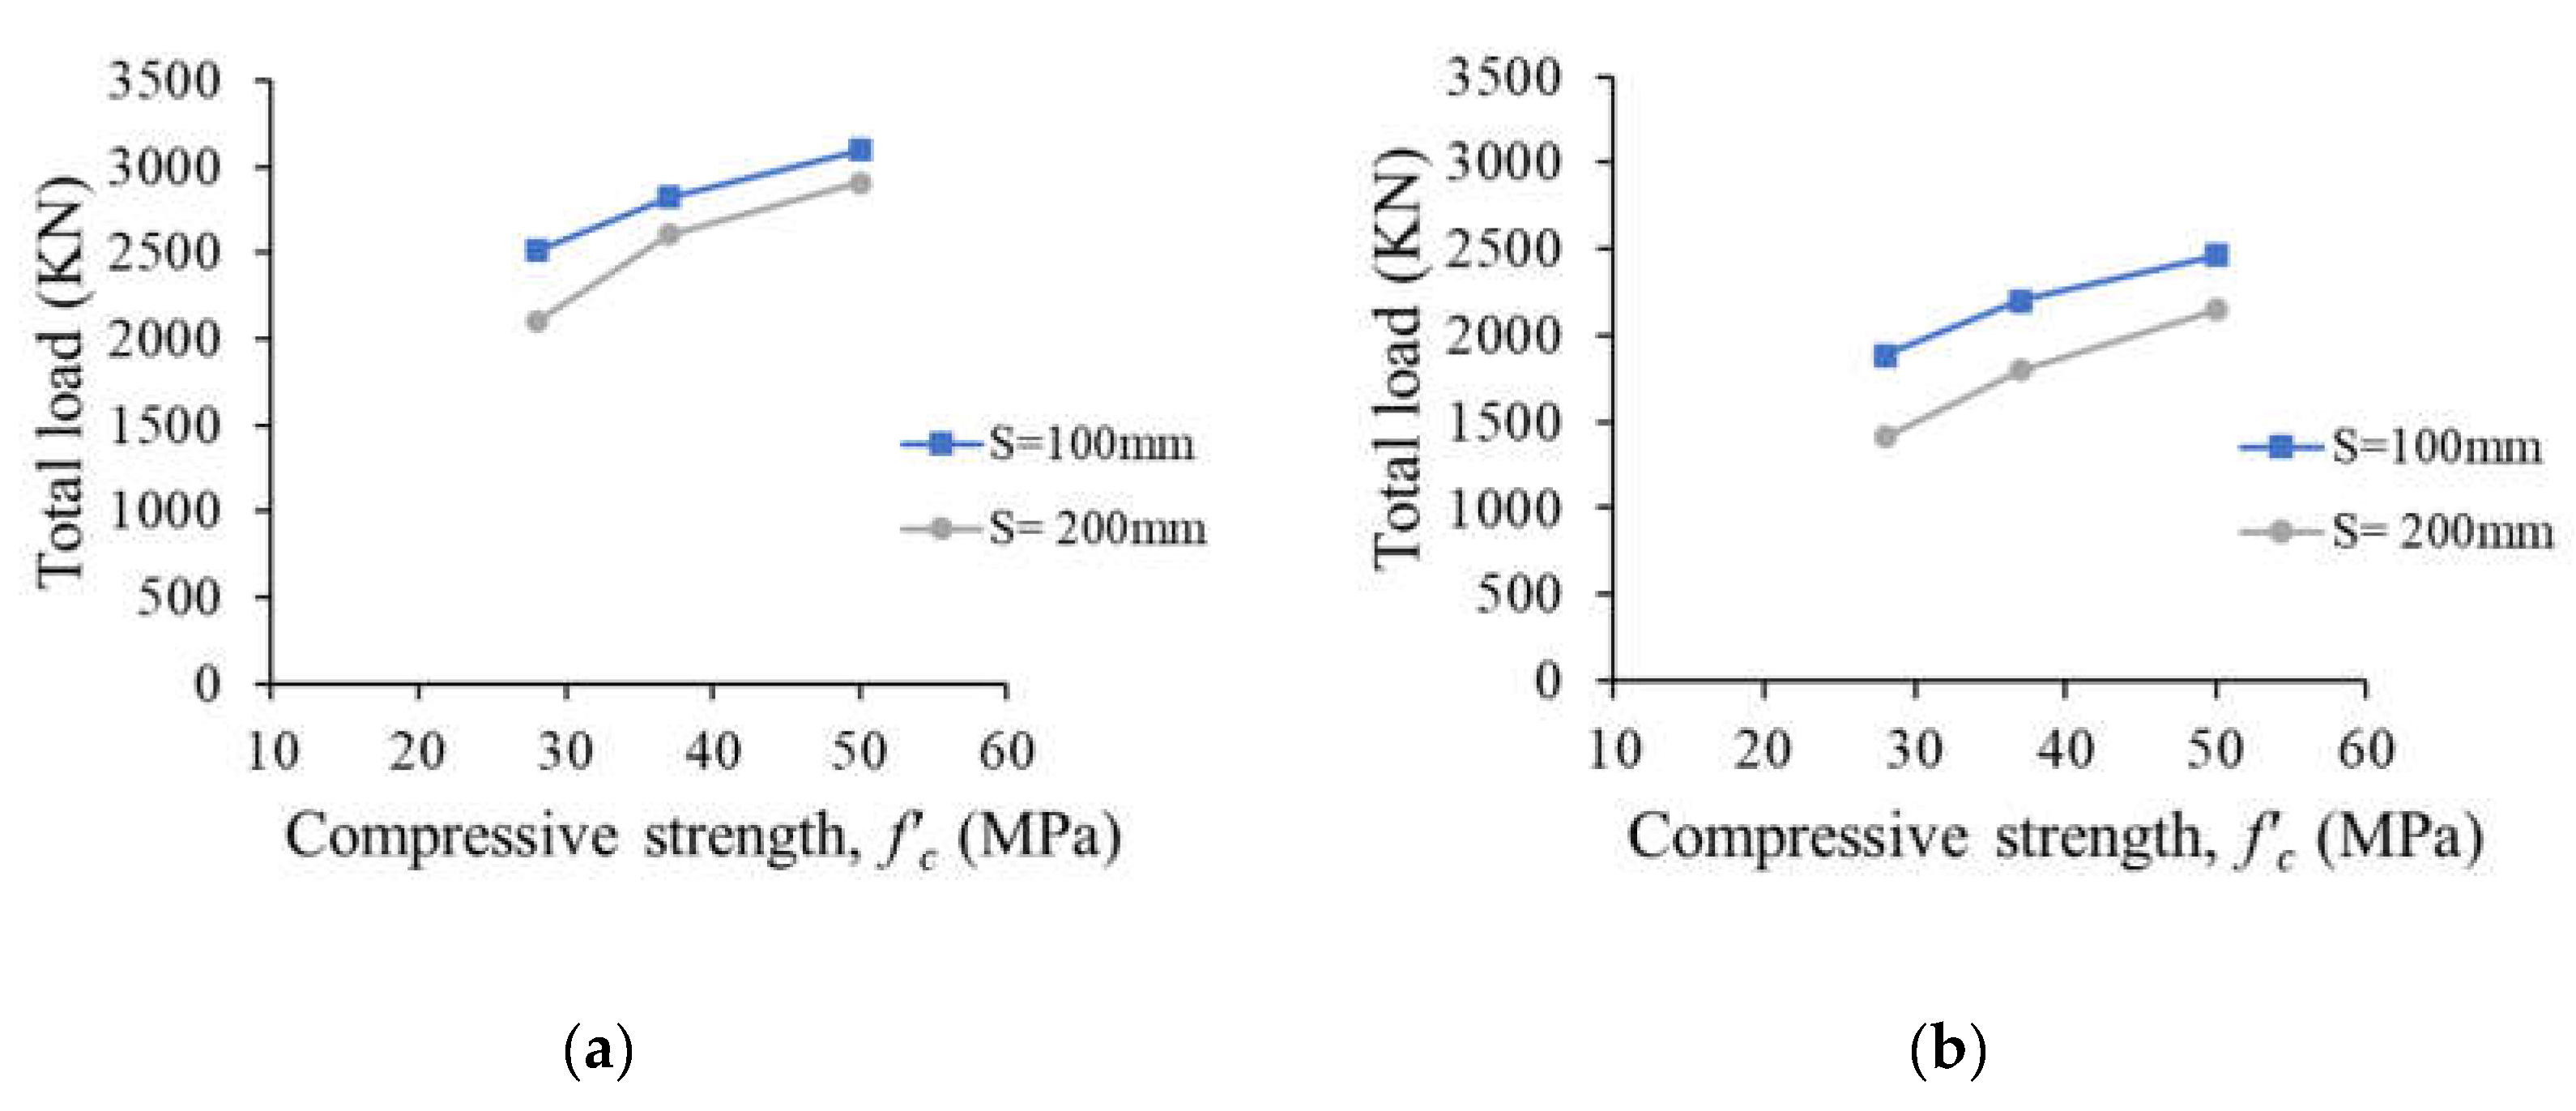
  • The shear strength of the deep beam models increased almost linearly with an increase in f’c and a decrease in the spacing between the web reinforcement, irrespective of the value of a/h.
  • In the absence of web GFRP reinforcement, varying the concrete compressive strength had almost no effect on the percent strength reduction caused by increasing the value of a/h from 1.0 to 1.5.
  • For the deep beam models with web GFRP reinforcement, the strength reduction caused by increasing the value of a/h tended to decrease with an increase in the concrete compressive strength and the spacing between the web GFRP reinforcement.
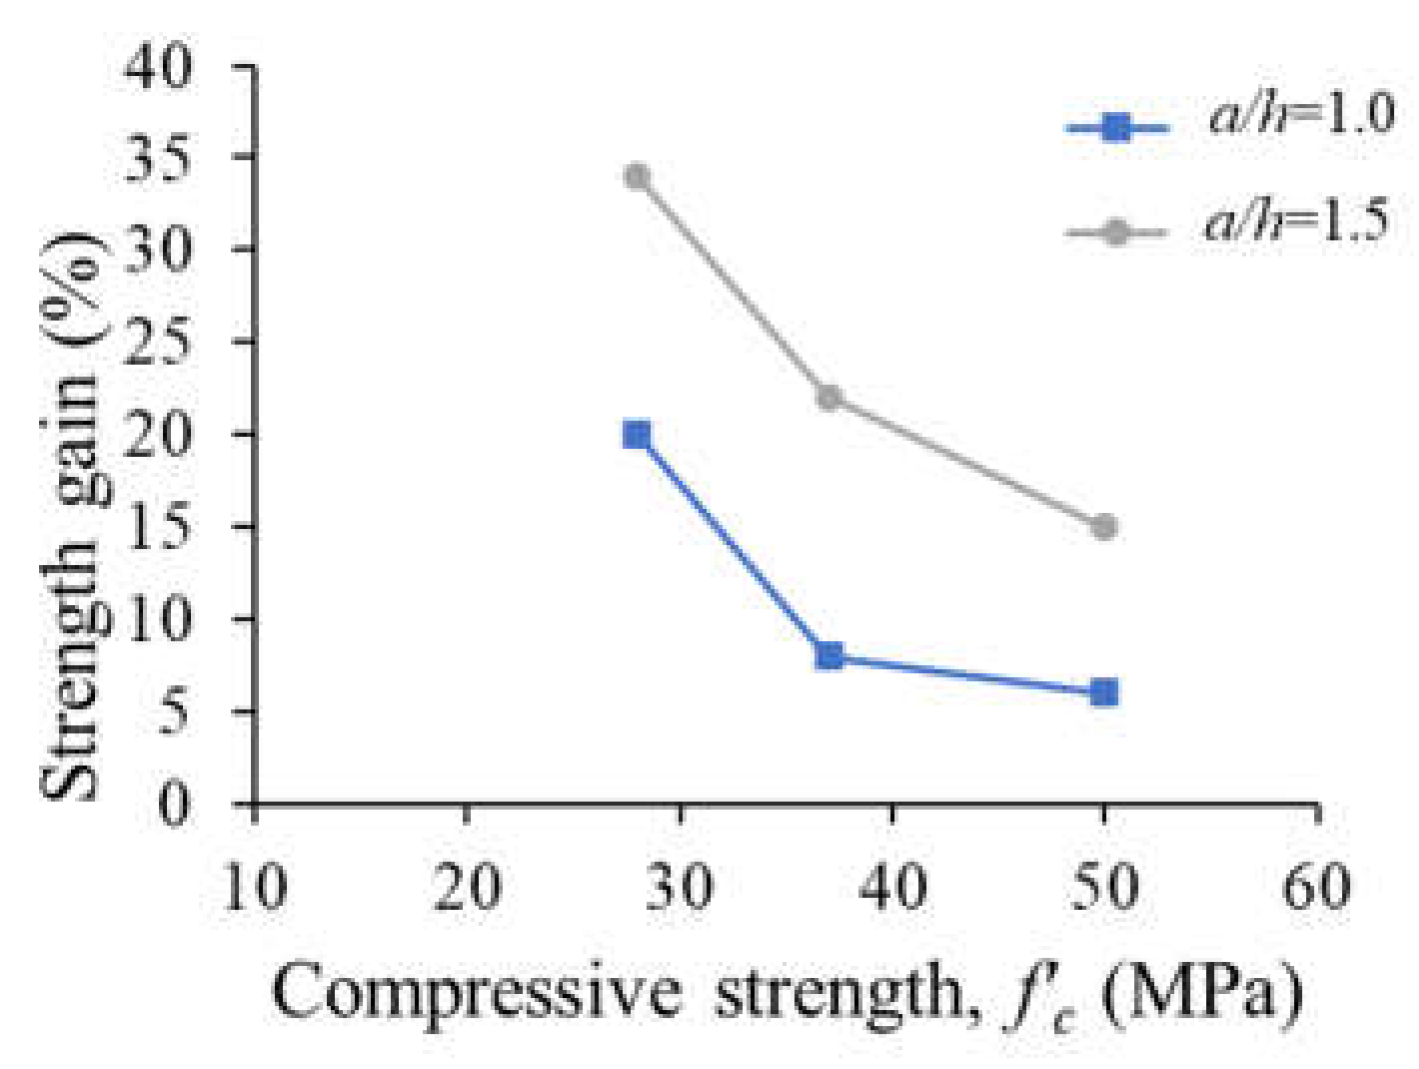
  • The strength gain caused by decreasing the spacing between the web GFRP reinforcements was more pronounced for the beam models with lower f’c and greater a/h of 1.5.
  • The refined analytical expression introduced in the present study provided reasonable predictions for the shear strength of GFRP-reinforced concrete deep beams.
This research furnished valuable data on the nonlinear behavior of GFRP-reinforced concrete deep beams. The data were subsequently used to develop an analytical expression for the prediction of the shear strength of GFRP-reinforced concrete deep beams. Future research shall examine the behavior of GFRP-reinforced concrete deep beams at the serviceability limit state. The effects of elevated temperature and harsh environments on the behavior of GFRP-reinforced concrete deep beams shall be considered in numerical analyses and experiments of future studies.

Author Contributions

Conceptualization, T.E.-M. and N.K.; methodology, A.S.-S., T.E.-M. and N.K.; software, A.S.-S. and N.K.; validation, A.S.-S., T.E.-M. and N.K.; formal analysis, A.S.-S., T.E.-M. and N.K.; investigation, A.S.-S., T.E.-M. and N.K.; resources, T.E.-M.; data curation, A.S.-S.; writing—original draft preparation, A.S.-S., T.E.-M. and N.K.; writing—review and editing, A.S.-S., T.E.-M. and N.K.; visualization, A.S.-S.; supervision, T.E.-M. and N.K.; project administration, T.E.-M.; funding acquisition, T.E.-M. All authors have read and agreed to the published version of the manuscript.

Funding

This project is supported by United Arab Emirates University (UAEU) (grant number 12N110).

Institutional Review Board Statement

Not applicable.

Informed Consent Statement

Not applicable.

Data Availability Statement

The data presented in this study are available on request from the corresponding author. The data are not publicly available due to privacy issues.

Conflicts of Interest

The authors declare no conflict of interest.

References

  1. American Concrete Institute ACI. Building Code Requirements for Structural Concrete and Commentary on Building Code Requirements for Structural Concrete (ACI 318R-19); American Concrete Institute (ACI): Farmington Hills, MI, USA, 2014. [Google Scholar]
  2. MacGregor, J.; Wight, J. Reinforced Concrete Mechanics and Design, 4th ed.; Prentice Hall: Singapore, 2005. [Google Scholar]
  3. Kong, F. Reinforced Concrete Deep Beams; Blackie and Son Ltd.: London, UK, 1999. [Google Scholar]
  4. Mansour, M.; Tan, K.-H. Concrete Beams with Openings Analysis and Design; CRC Press: New York, NY, USA, 1999. [Google Scholar]
  5. ACI Committee 440. Guide for the Design and Construction of Structural Concrete Reinforced with Fiber-Reinforced Polymer (FRP) Bars (ACI 440.1R-15); American Concrete Institute (ACI): Farmington Hills, MI, USA, 2019. [Google Scholar]
  6. Bakis, C.; Bank, L.; Brown, V.; Cosenza, E.; Davalos, J.; Lesko, J.; Machida, A.; Rizkalla, S.; Triantafillou, T. Fiber-reinforced polymer composites for construction-state-of-the-art review. J. Compos. Constr. 2002, 6, 73–87. [Google Scholar] [CrossRef]
  7. Bank, L. Composites for Construction: Structural Design with FRP Materials; John Wiley & Sons: Hoboken, NJ, USA, 2006. [Google Scholar]
  8. Gangarao, H.; Taly, N.; Vijay, P. Reinforced Concrete Design with FRP Composites; CRC Press: New York, NY, USA, 2006. [Google Scholar]
  9. Nanni, A.; De Luca, A.; Zadeh, H. Reinforced Concrete with FRP Bars: Mechanics and Design; CRC Press: New York, NY, USA, 2014. [Google Scholar]
  10. Omeman, Z.; Nehdi, M.; El-Chabib, H. Experimental study on shear behavior of carbon fiber-reinforced polymer reinforced concrete short beams without web reinforcement. Can. J. Civ. Eng. 2008, 35, 1–10. [Google Scholar] [CrossRef]
  11. Abed, F.; El-Chabib, H.; Alhamaydeh, M. Shear characteristics of GFRP reinforced polymer reinforced concrete deep beams without web reinforcement. J. Reinf. Plast. Compos. 2012, 31, 1063–1073. [Google Scholar] [CrossRef]
  12. Farghaly, A.S.; Benmokrane, B. Shear Behavior of FRP-Reinforced Concrete Deep Beams without Web Reinforcement. J. Compos. Constr. 2013, 17, 04013015. [Google Scholar] [CrossRef]
  13. Andermatt, M.F.; Lubell, A.S. Behavior of Concrete Deep Beams Reinforced with Internal Fiber-Reinforced Polymer—Experimental Study. ACI Struct. J. 2013, 110, 47. [Google Scholar]
  14. Kim, D.; Lee, J.; Lee, Y.H. Effectiveness factor of strut-and-tie model for concrete deep beams reinforced with FRP rebars. Compos. Part B 2014, 56, 117–125. [Google Scholar] [CrossRef]
  15. Liu, H.; Yang, J.; Wang, X.; Han, D. Experimental Study on Shear Behavior of BFRP-reinforced Recycled Aggregate Concrete Deep Beams Without Stirrups. KSCE J. Civ. Eng. 2017, 21, 2289–2299. [Google Scholar] [CrossRef]
  16. Alhamad, S.; Al-Banna, Y.; Al-Osman, A.; Mouthassseeb, J.; Abdalla, S.; Abed, F. Effect of shear span-to-depth ratio on the shear behavior of BFRP-RC deep beams. MATEC 2017, 120, 01012. [Google Scholar] [CrossRef]
  17. Abed, F.; El-Refai, A.; Abdalla, S. Experimental and finite element investigation of the shear performance of BFRP-RC short beams. Structures 2019, 20, 689–701. [Google Scholar] [CrossRef]
  18. Abu-Obaida, A.; El-Ariss, B.; El-Maaddawy, T. Behavior of Short-Span Concrete Members Internally Reinforced with Glass Fiber–Reinforced Polymer Bars. J. Compos. Constr. 2018, 22, 04018038. [Google Scholar] [CrossRef]
  19. Mohamed, K.; Farghaly, A.S.; Benmokrane, B. Effect of Vertical and Horizontal Web Reinforcement on the Strength and Deformation of Concrete Deep Beams Reinforced with GFRP Bars. J. Struct. Eng. 2017, 143, 04017079. [Google Scholar] [CrossRef]
  20. Frappier, J.; Mohamed, K.; Farghaly, A.; Benmokrane, B. Behavior and strength of glass fiber-reinforced polymer reinforced concrete deep beams with web openings. ACI Struct. J. 2019, 116, 275–285. [Google Scholar] [CrossRef]
  21. El-Hassan, H.; El-Maaddawy, T.; Al-Sallamin, A.; Al-Saidy, A. Durability of glass fiber-reinforced polymer bars conditioned in moist seawater-contaminated concrete under sustained load. Constr. Build. Mater. 2018, 175, 1–13. [Google Scholar] [CrossRef]
  22. El-Hassan, H.; El-Maaddawy, T.; Al-Sallamin, A.; Al-Saidy, A. Performance evaluation and microstructural characterization of GFRP bars in seawater-contaminated concrete. Constr. Build. Mater. 2017, 147, 66–78. [Google Scholar] [CrossRef]
  23. Rosa, C.I.; Firmo, J.; Correia, J.; Mazzuca, P. Influence of elevated temperatures on the bond behaviour of ribbed GFRP bars in concrete. Cem. Concr. Compos. 2021, 122, 104119. [Google Scholar] [CrossRef]
  24. CSA S806-12; Design and Construction of Building Structures with Fiber-Reinforced Polymers. Canadian Standards Association: Mississauga, ON, Canada, 2012.
  25. Mansour, M.; El-Maaddawy, T. Testing and modeling of deep beams strengthened with NSM-CFRP reinforcement around cutouts. Case Stud. Constr. Mater. 2021, 15, e00670. [Google Scholar] [CrossRef]
  26. Arabasi, S.; El-Maaddawy, T. Reinforcing of discontinuity regions in concrete deep beams with GFRP composite bars. Compos. Part C Open Access 2020, 3, 100064. [Google Scholar] [CrossRef]
  27. ATENA Computer Software, Cervenka Consulting s.r.o.: Prague, Czech Republic. Available online: https://www.cervenka.cz/ (accessed on 25 March 2022).
  28. Gooranorimi, O.; Claure, G.; Suaris, W.; Nanni, A. Bond-slip effect in flexural behavior of GFRP RC slabs. Compos. Struct. 2018, 193, 80–86. [Google Scholar] [CrossRef]
  29. Hognestad, E.; Hanson, N.; McHenry, D. Concrete Stress Distribution in Ultimate Strength Design. ACI Struct. J. 1955, 52, 455–479. [Google Scholar]
  30. Kong, F.; Robins, P.; Singh, A.; Sharp, G. Shear analysis and design of reinforced concrete deep beams. Struct. Eng. 1972, 50, 405–409. [Google Scholar]
Figure 1. Details of the deep beam model (dimensions are in mm).
Buildings 13 02767 g001
Figure 4. Numerical model (dimensions are in mm): (a) meshed concrete deep beam and (b) flexural and web reinforcement.
Buildings 13 02767 g004
Figure 5. Statical system of the deep beam.
Buildings 13 02767 g005
Figure 6. Numerical and experimental load–deflection response of the deep beam.
Buildings 13 02767 g006
Figure 7. Results of the deep beam: (a) numerical crack pattern and (b) minimum principal strain in concrete.
Buildings 13 02767 g007
Figure 8. Numerical GFRP strains in web reinforcement: (a) vertical stirrups and (b) horizontal bars.
Buildings 13 02767 g008
Figure 9. GFRP strains in web reinforcement from the experiment [20]: (a) vertical stirrups and (b) horizontal bars.
Buildings 13 02767 g009
Figure 10. Numerical GFRP strains in flexural reinforcement.
Buildings 13 02767 g010
Figure 11. GFRP strains in flexural reinforcement: (a) predicted and (b) experimental [20].
Buildings 13 02767 g011
Figure 12. Three-dimensional view of stresses in GFRP bars (MPa): (a) vertical stirrups, (b) horizontal web reinforcement, and (c) flexural reinforcement.
Buildings 13 02767 g012
Figure 13. Details of solid deep beams without web reinforcement (dimensions are in mm): (a) a/h =1.0 and (b) a/h = 1.5.
Buildings 13 02767 g013
Figure 14. Load–deflection responses of deep beam models without web reinforcement: (a) a/h = 1.0 and (b) a/h = 1.5.
Buildings 13 02767 g014
Figure 15. Effects of the concrete compressive strength and shear span ratio on the strength of solid beam models without web reinforcement.
Buildings 13 02767 g015
Figure 16. Crack pattern for a typical deep beam model without web reinforcement having a/h = 1.0 (SDB-1.0-M): (a) at 25% of peak load, (b) at 50% of peak load, (c) at 75% of peak load, and (d) at 100% of peak load.
Buildings 13 02767 g016aBuildings 13 02767 g016b
Figure 17. Stresses in GFRP reinforcement for models with a/h = 1 (MPa): (a) SDB-1.0-L, (b) SDB-1.0-M, and (c) SDB-1.0-H.
Buildings 13 02767 g017
Figure 18. Stresses in GFRP reinforcement for models with a/h = 1.5 (MPa): (a) SDB-1.5-L, (b) SDB-1.5-M, and (c) SDB-1.5-H.
Buildings 13 02767 g018
Figure 19. Details of solid deep beam models with web reinforcement and a/h = 1.0 (dimensions are in mm): (a) s = 100 mm and (b) s = 200 mm.
Buildings 13 02767 g019
Figure 20. Details of solid deep beam models with web reinforcement and a/h = 1.5 (dimensions are in mm): (a) s = 100 mm and (b) s = 200 mm.
Buildings 13 02767 g020
Figure 21. Load–deflection responses of deep beam models with web reinforcement having a/h = 1.0: (a) f’c = 28 MPa, (b) f’c = 37 MPa, and (c) f’c = 50 MPa.
Buildings 13 02767 g021
Figure 22. Load–deflection responses of deep beam models with web reinforcement having a/h = 1.5: (a) f’c = 28 MPa, (b) f’c = 37 MPa, and (c) f’c = 50 MPa.
Buildings 13 02767 g022
Figure 23. Effect of the concrete compressive strength and spacing between web reinforcement on the strength of deep beam models: (a) a/h = 1.0 and (b) a/h = 1.5.
Buildings 13 02767 g023
Figure 24. Effect of the concrete compressive strength and shear span-to-depth ratio on the strength gain caused by increasing the web reinforcement in deep beam models.
Buildings 13 02767 g024
Figure 25. Crack pattern for a typical deep beam model with a/h = 1.0 and web reinforcement at s = 100 mm (SDB-1.0-L100): (a) at 25% of peak load, (b) at 50% of peak load, (c) at 75% of peak load, and (d) at 100% of peak load.
Buildings 13 02767 g025
Figure 26. Crack pattern for a typical deep beam model with a/h = 1.0 and web reinforcement at s = 200 mm (SDB-1.0-L200): (a) at 25% of peak load, (b) at 50% of peak load, (c) at 75% of peak load, and (d) at 100% of peak load.
Buildings 13 02767 g026
Figure 27. Crack pattern for a typical deep beam model with a/h = 1.5 and web reinforcement at s = 100 mm (SDB-1.5-H100): (a) at 25% of peak load, (b) at 50% of peak load, (c) at 75% of peak load, and (d) at 100% of peak load.
Buildings 13 02767 g027
Figure 28. Crack pattern for a typical deep beam model with a/h = 1.5 and web reinforcement at s = 200 mm (SDB-1.5-H200): (a) at 25% of peak load, (b) at 50% of peak load, (c) at 75% of peak load, and (d) at 100% of peak load.
Buildings 13 02767 g028
Figure 29. Three-dimensional view of stresses in vertical GFRP stirrups for models with a/h = 1.0 (MPa): (a) SDB-1.0-L100, (b) SDB-1.0-L200, (c) SDB-1.0-M100, (d) SDB-1.0-M200, (e) SDB-1.0-H100, and (f) SDB-1.0-H200.
Buildings 13 02767 g029
Figure 30. Three-dimensional view of stresses in vertical GFRP stirrups for models with a/h = 1.5 (MPa): (a) SDB-1.5-L100, (b) SDB-1.5-L200, (c) SDB-1.5-M100, (d) SDB-1.5-M200, (e) SDB-1.5-H100, and (f) SDB-1.5-H200.
Buildings 13 02767 g030
Figure 31. Stresses in the horizontal GFRP web reinforcement for models with a/h = 1.0 (MPa): (a) SDB-1.0-L100, (b) SDB-1.0-L200, (c) SDB-1.0-M100, (d) SDB-1.0-M200, (e) SDB-1.0-H100, and (f) SDB-1.0-H200.
Buildings 13 02767 g031
Figure 32. Stresses in horizontal GFRP web reinforcement for models with a/h = 1.5 (MPa): (a) SDB-1.5-L100, (b) SDB-1.5-L200, (c) SDB-1.5-M100, (d) SDB-1.5-M200, (e) SDB-1.5-H100, and (f) SDB-1.5-H200.
Buildings 13 02767 g032
Figure 33. Stresses in GFRP flexural reinforcement for models with a/h = 1.0 (MPa): (a) SDB-1.0-L100, (b) SDB-1.0-L200, (c) SDB-1.0-M100, (d) SDB-1.0-M200, (e) SDB-1.0-H100, and (f) SDB-1.0-H200.
Buildings 13 02767 g033aBuildings 13 02767 g033b
Figure 34. Stresses in GFRP flexural reinforcement for models with a/h = 1.5 (MPa): (a) SDB-1.5-L100, (b) SDB-1.5-L200, (c) SDB-1.5-M100, (d) SDB-1.5-M200, (e) SDB-1.5-H100, and (f) SDB-1.5-H200.
Buildings 13 02767 g034
Table 2. Parameters of solid deep beams without web reinforcements.
a/hf’c (MPa)Model Designation
1.0
(a = 1250 mm)
28SDB-1.0-L
37SDB-1.0-M
50SDB-1.0-H
1.5
(a = 1800 mm)
28SDB-1.5-L
37SDB-1.5-M
50SDB-1.5-H
Table 3. Numerical results of the deep beam models without web reinforcement.
Model
Designation
a/hf’c
(MPa)
Ultimate Load
(kN)
Deflection at Ultimate
(mm)
SDB-1.0-L1.028186511.3
SDB-1.0-M1.037206412.1
SDB-1.0-H1.050266113.5
SDB-1.5-L1.528110118.8
SDB-1.5-M1.537128418.3
SDB-1.5-H1.550164421.9
Table 4. Parameters of deep beams with web reinforcements.
a/hf’c
(MPa)
Spacing between Web GFRP Bars (s) (mm)Model
Designation
1.0
(a = 1250 mm)
28100SDB-1.0-L100
200SDB-1.0-L200
37100SDB-1.0-M100
200SDB-1.0-M200
50100SDB-1.0-H100
200SDB-1.0-H200
1.5
(a = 1800 mm)
28100SDB-1.5-L100
200SDB-1.5-L200
37100SDB-1.5-M100
200SDB-1.5-M200
50100SDB-1.5-H100
200SDB-1.5-H200
Table 5. Numerical results of the deep beam models with web reinforcement.
Model
Designation
a/hf’c
(MPa)
Spacing between Web GFRP Bars (s) (mm)Ultimate Load
(kN)
Deflection at
Ultimate
(mm)
SDB-1.0-L1001.028100251017.9
SDB-1.0-L2001.0200210012.5
SDB-1.0-M1001.037100282117.3
SDB-1.0-M2001.0200260117.8
SDB-1.0-H1001.050100309416.8
SDB-1.0-H2001.0200290918.7
SDB-1.5-L1001.528100188525.2
SDB-1.5-L2001.5200141118.5
SDB-1.5-M1001.537100219928.5
SDB-1.5-M2001.5200179724.9
SDB-1.5-H1001.550100246430.0
SDB-1.5-H2001.5200214930.5
Disclaimer/Publisher’s Note: The statements, opinions and data contained in all publications are solely those of the individual author(s) and contributor(s) and not of MDPI and/or the editor(s). MDPI and/or the editor(s) disclaim responsibility for any injury to people or property resulting from any ideas, methods, instructions or products referred to in the content.

