
Implementation of Data from Wind Tunnel Tests in the Design of a Tall Building with an Elliptic Ground Plan

Abstract
1. Introduction
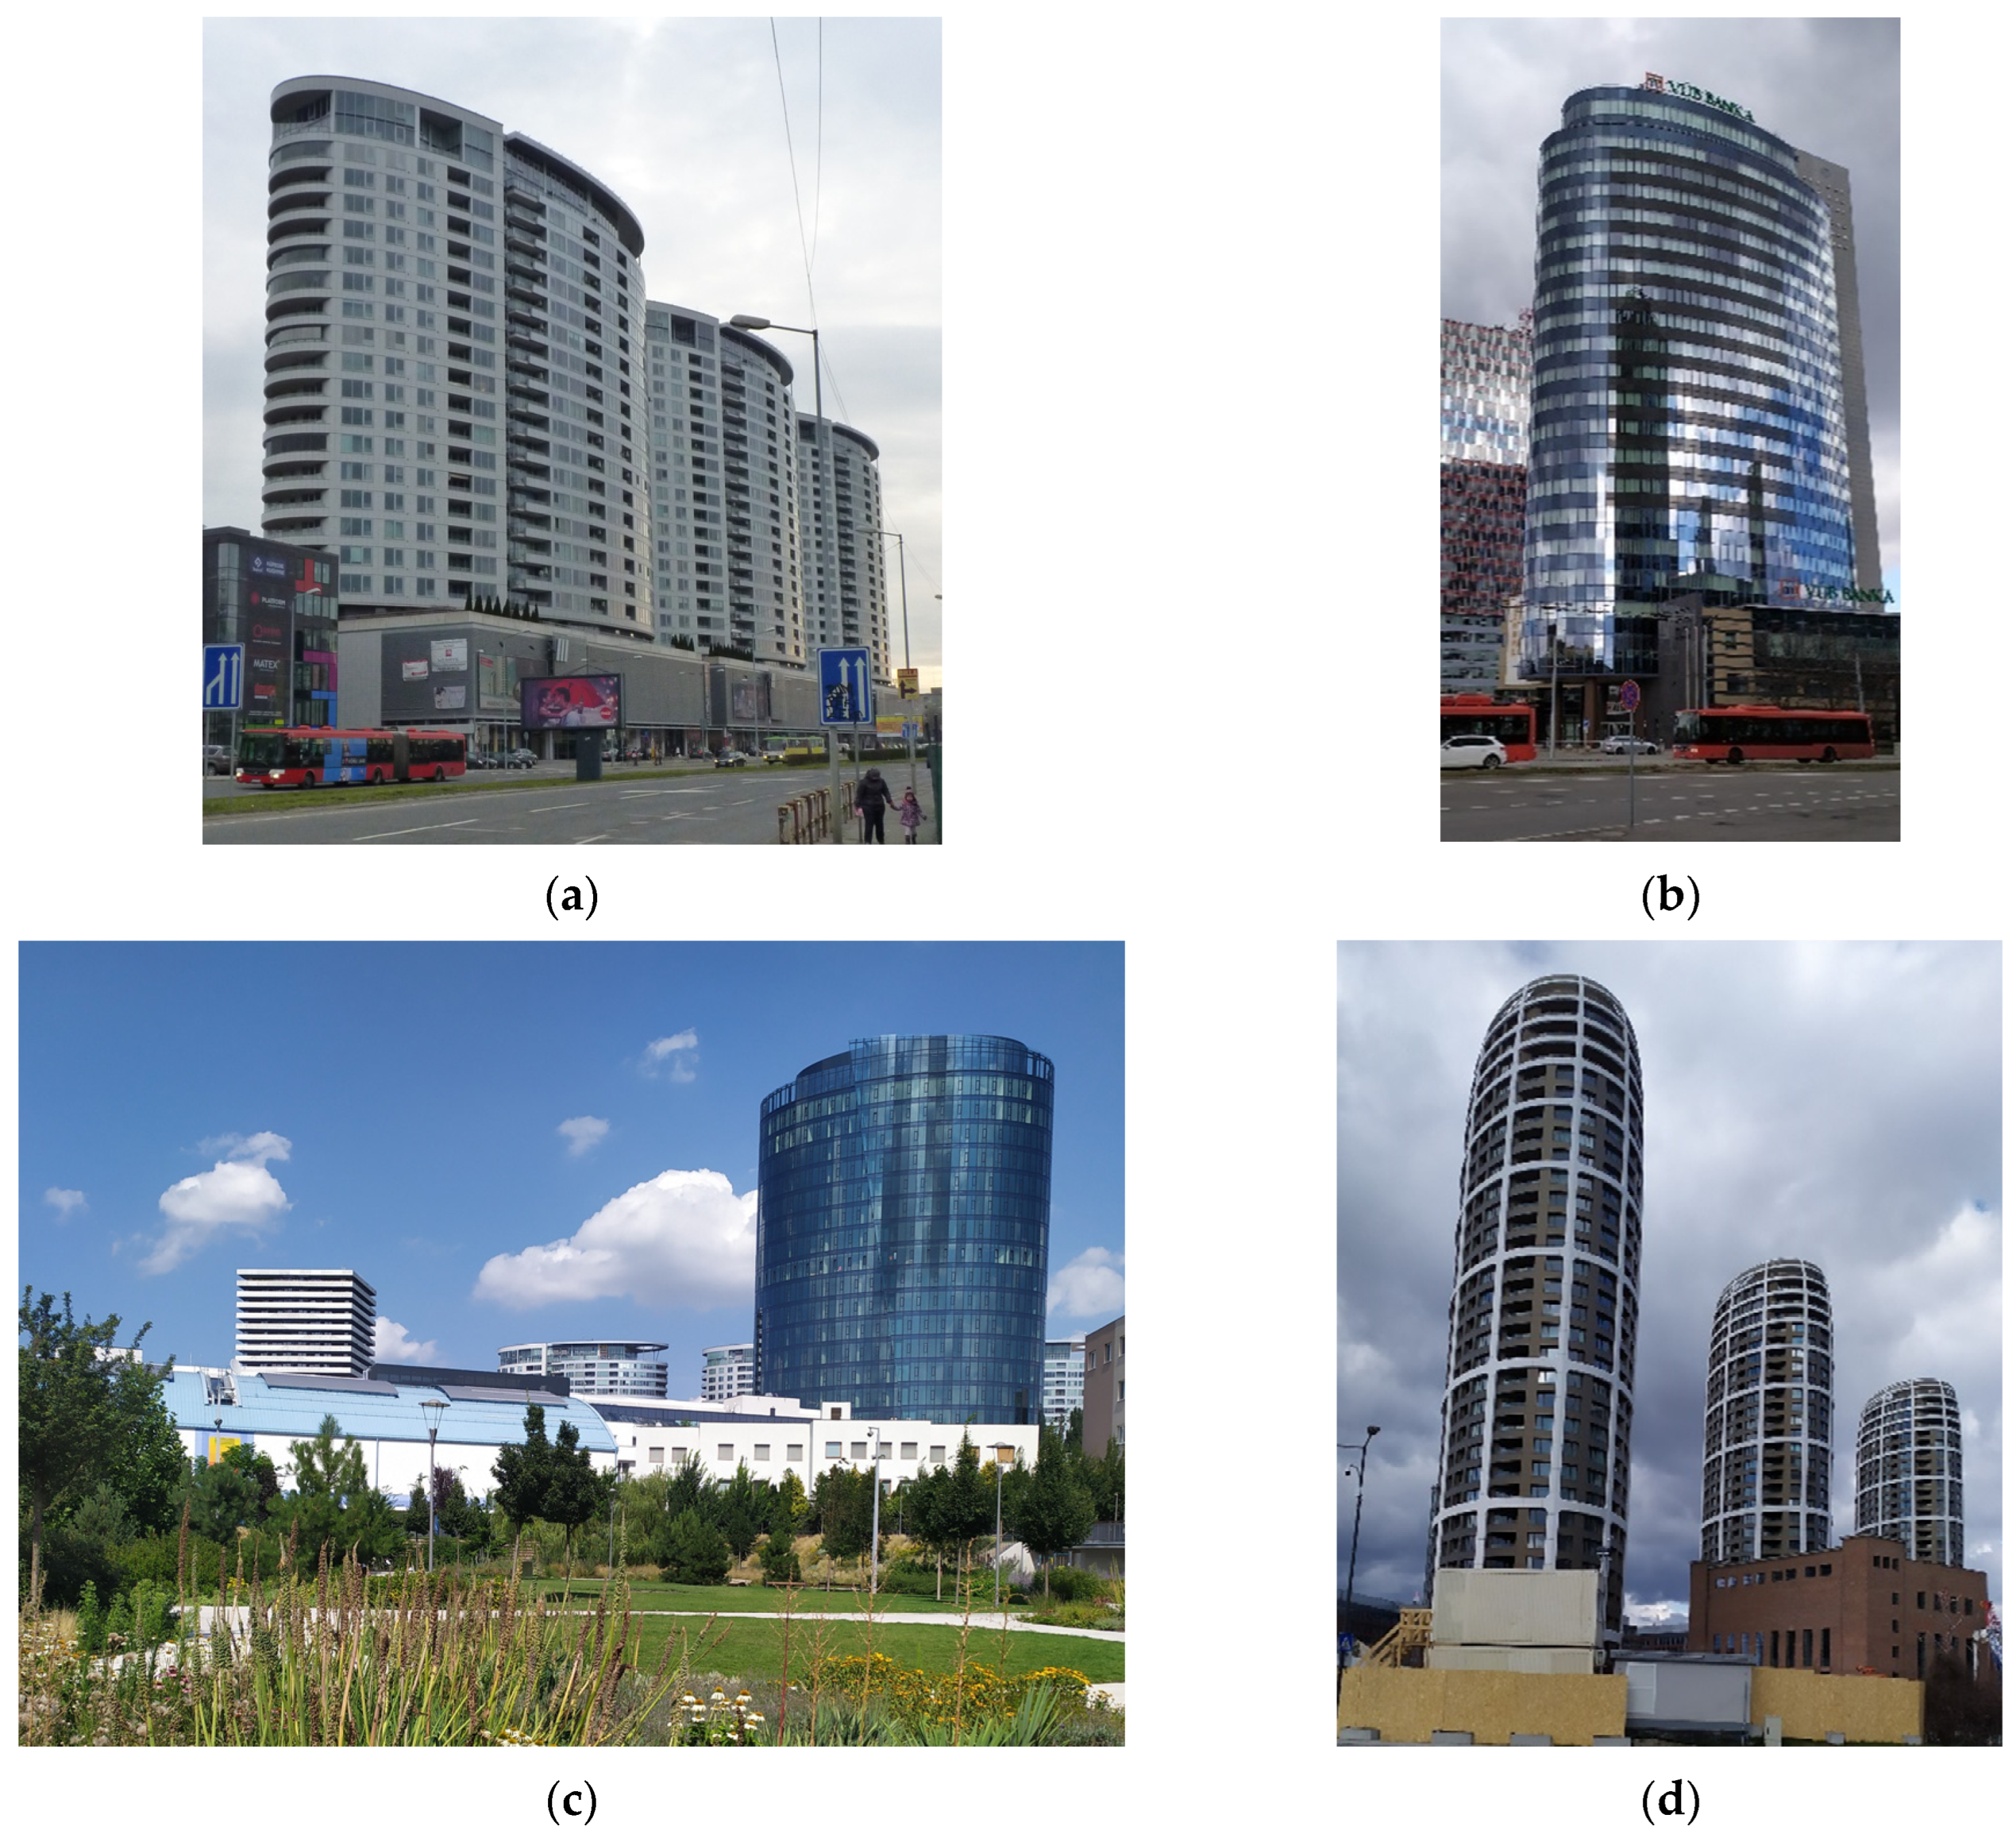
2. Description of the Building
3. The Analysis of the Effects of Wind on the Elliptical Cylinder
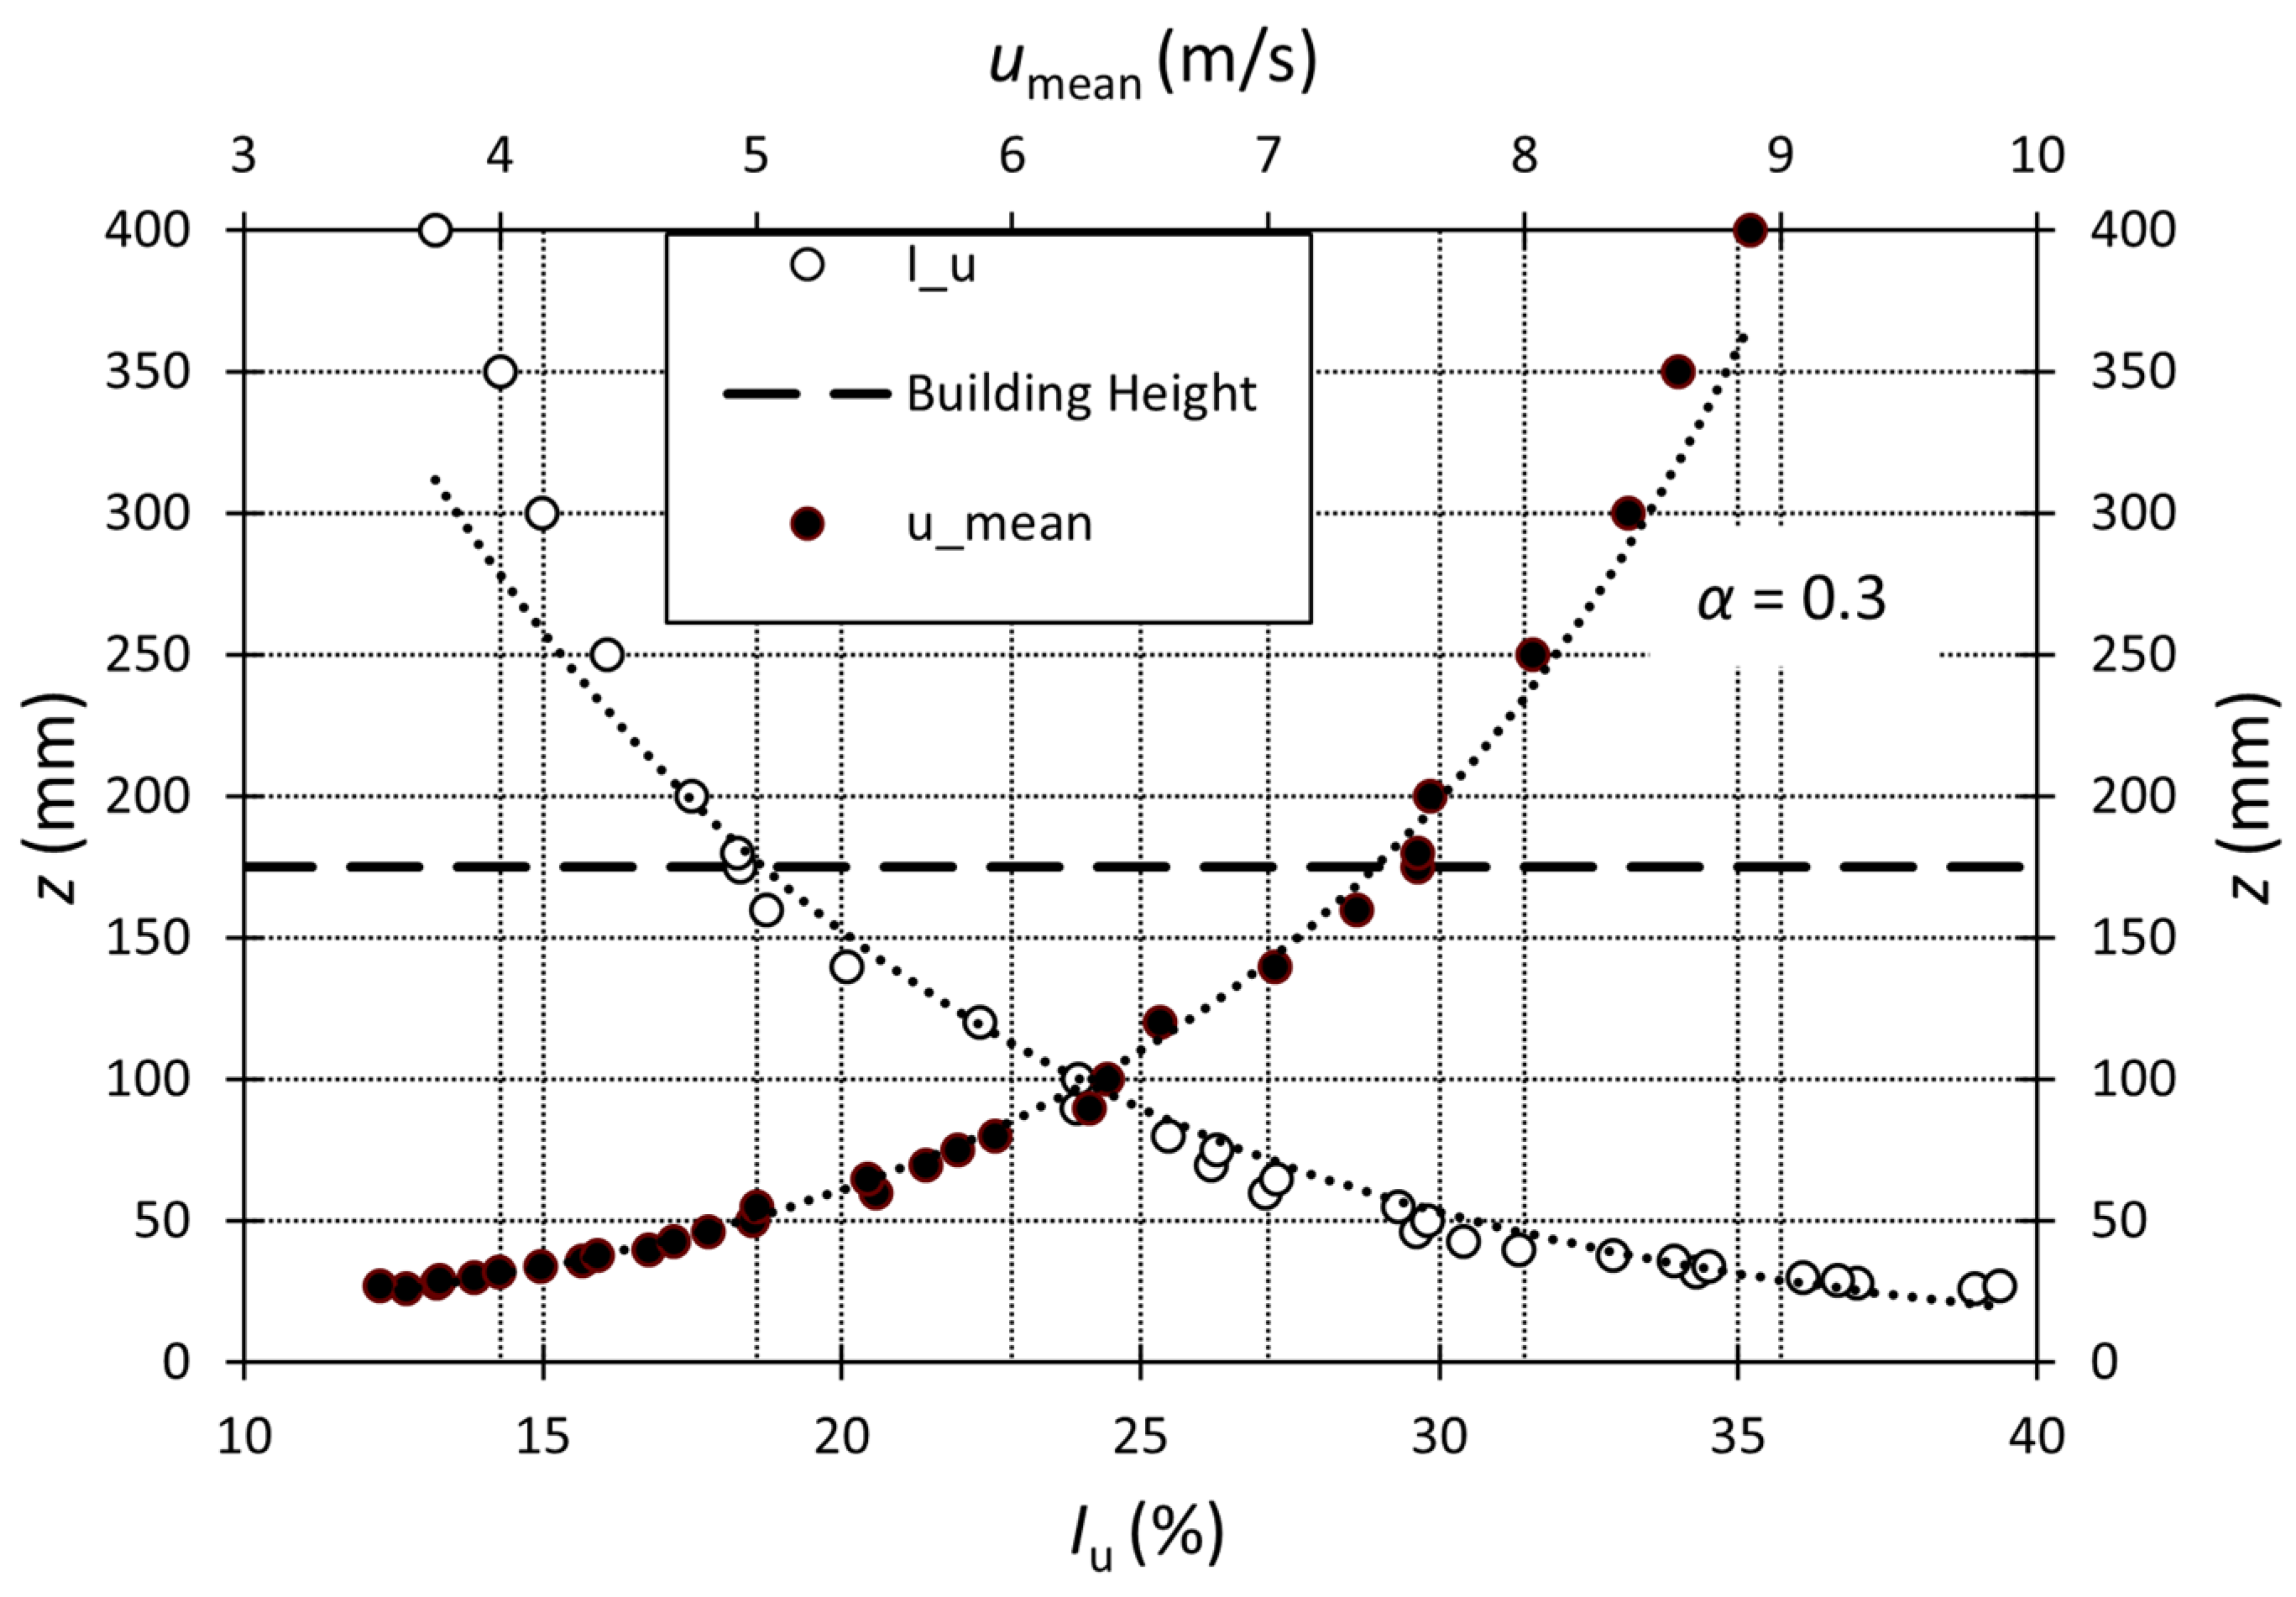
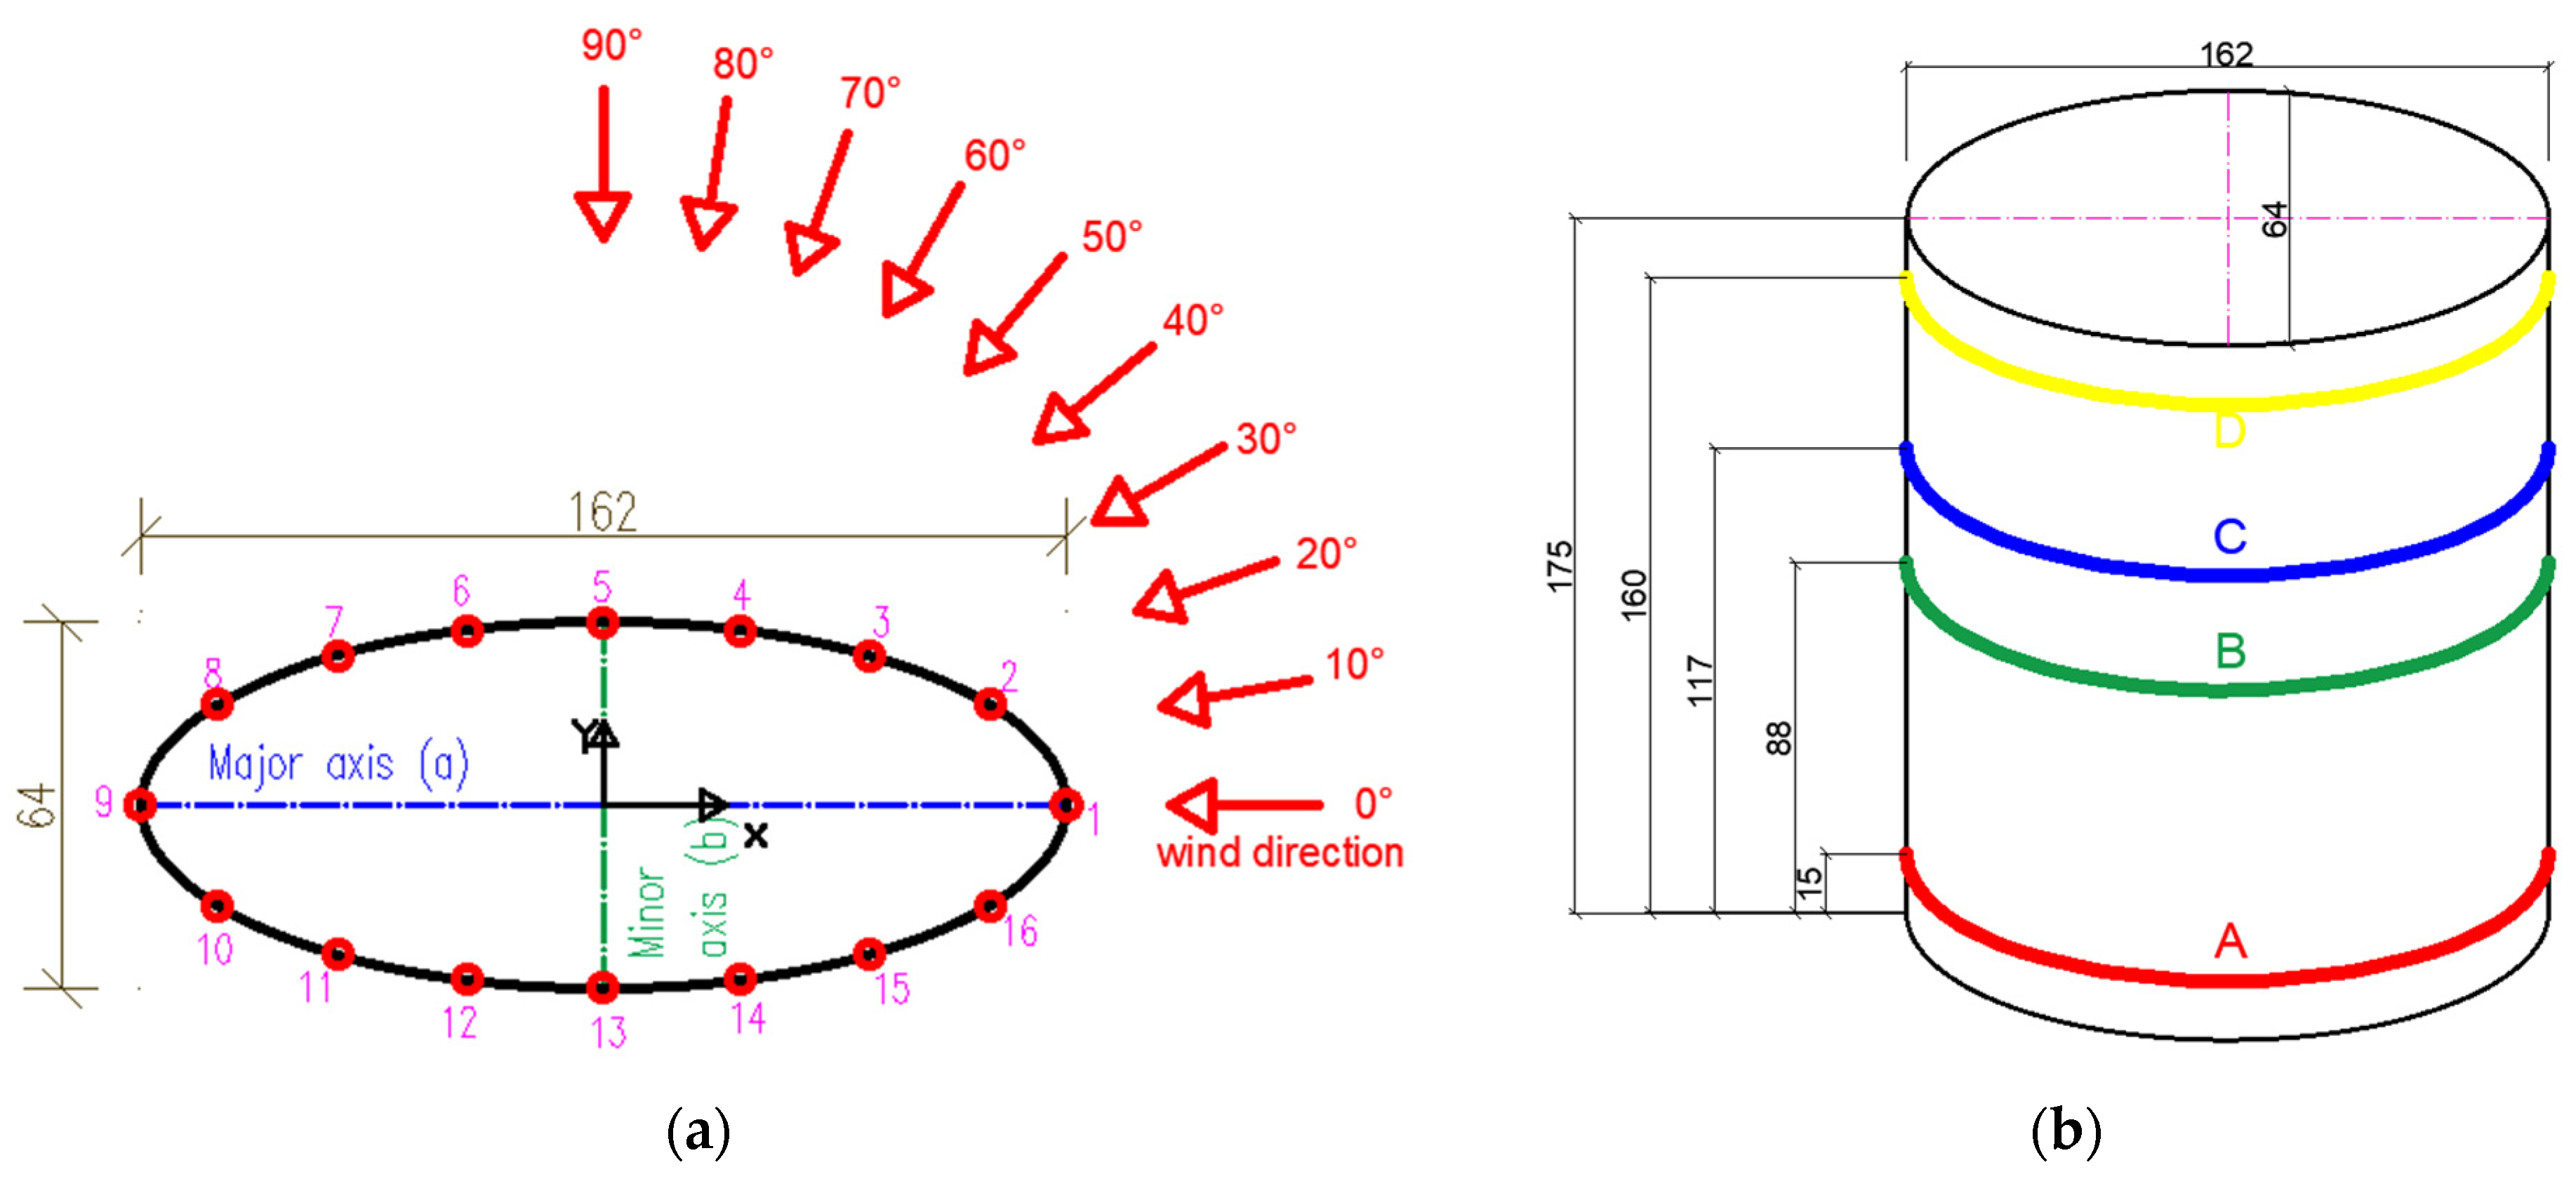
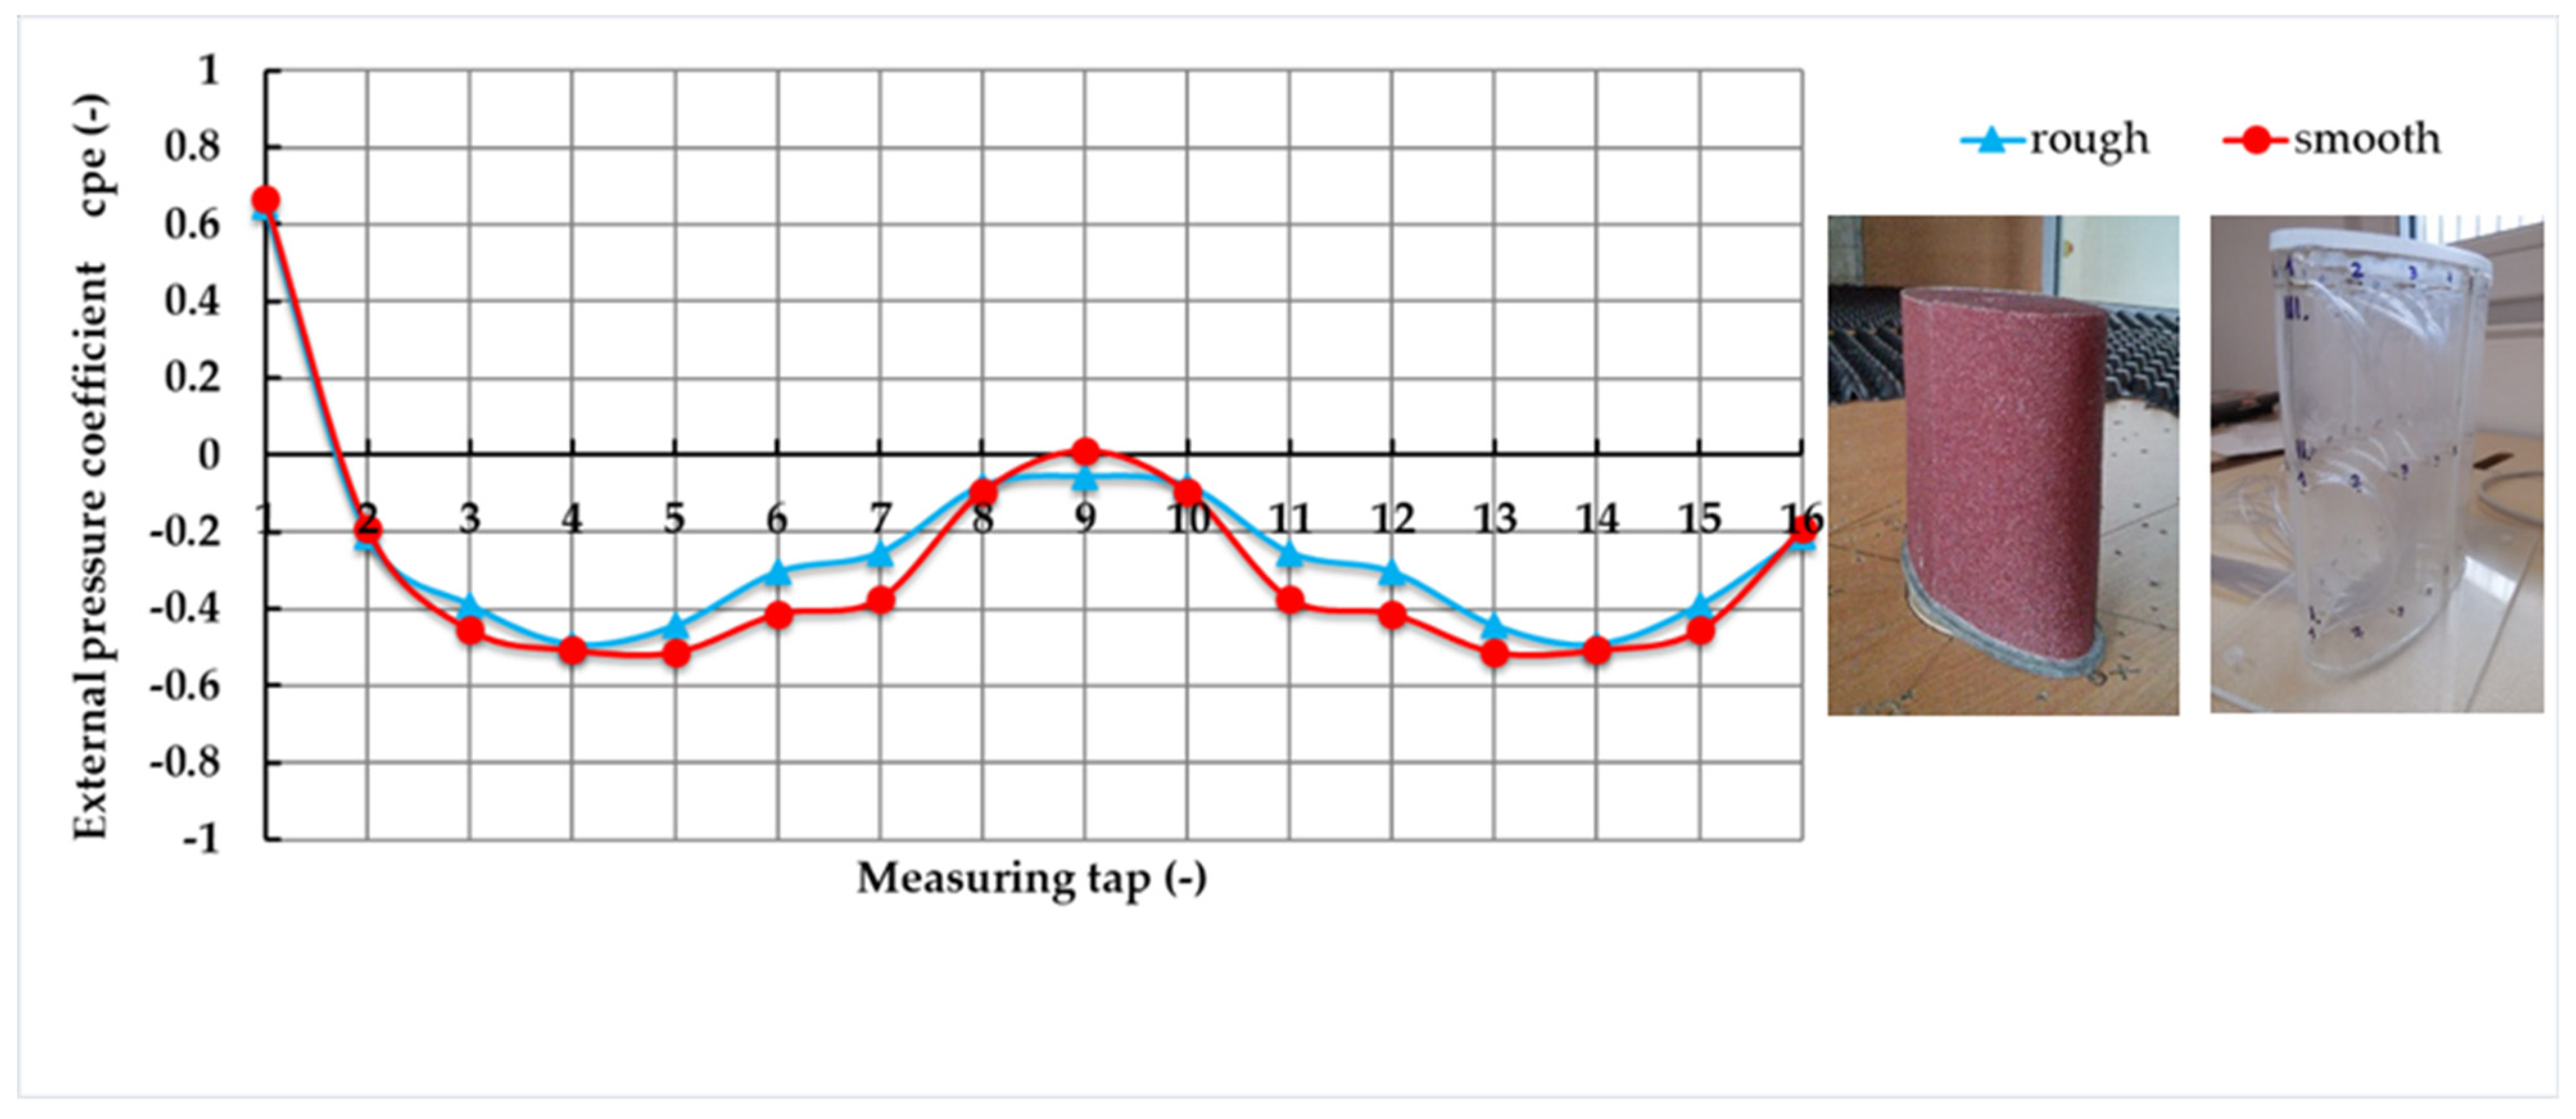
3.1. The Reduced-Scale Model and the Wind Tunnel
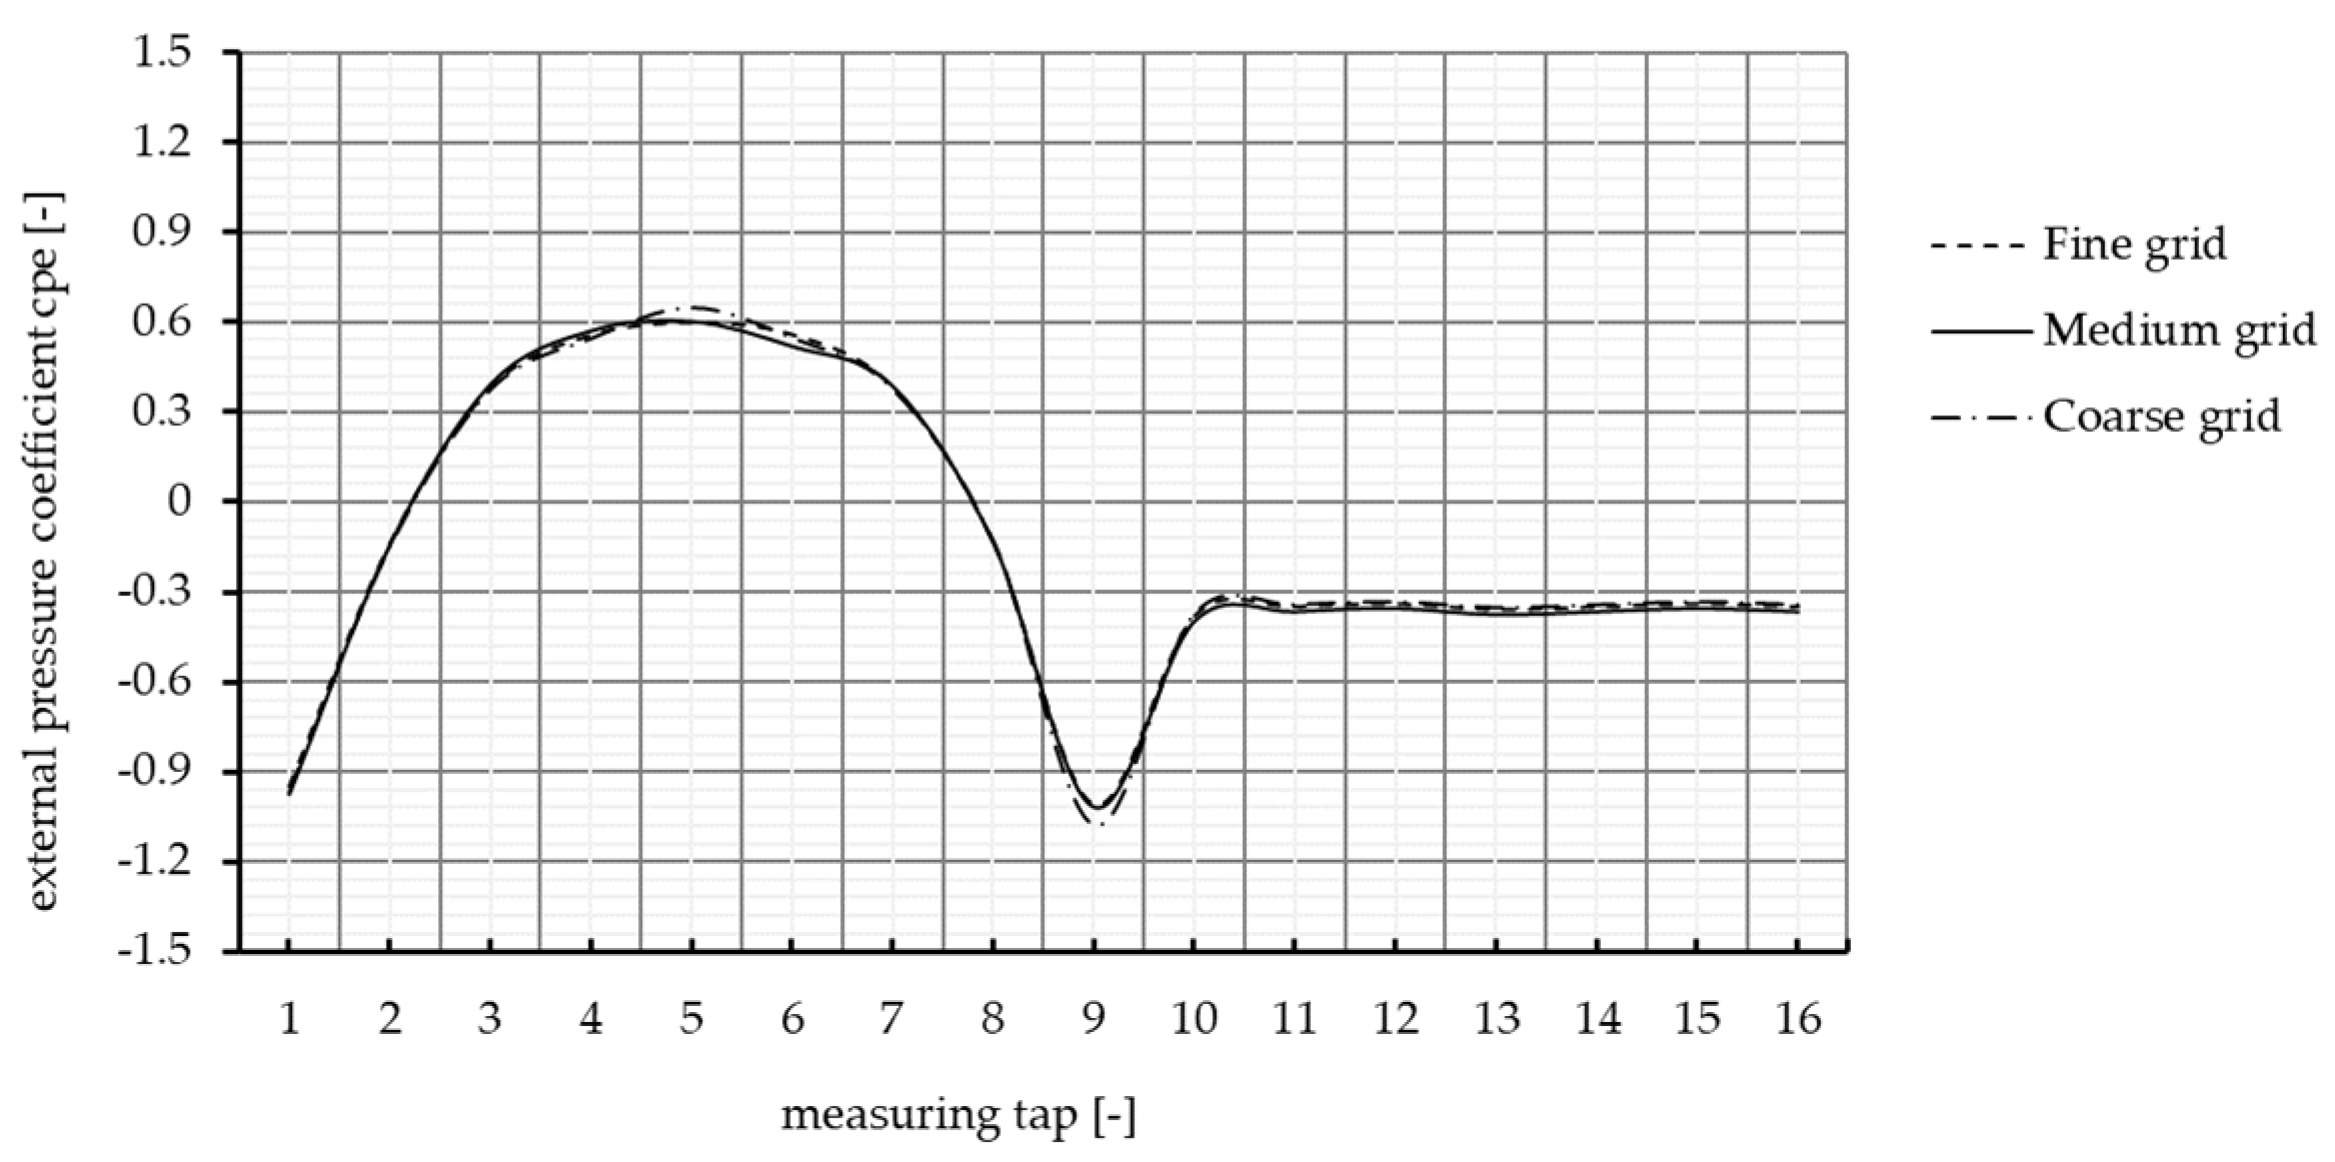
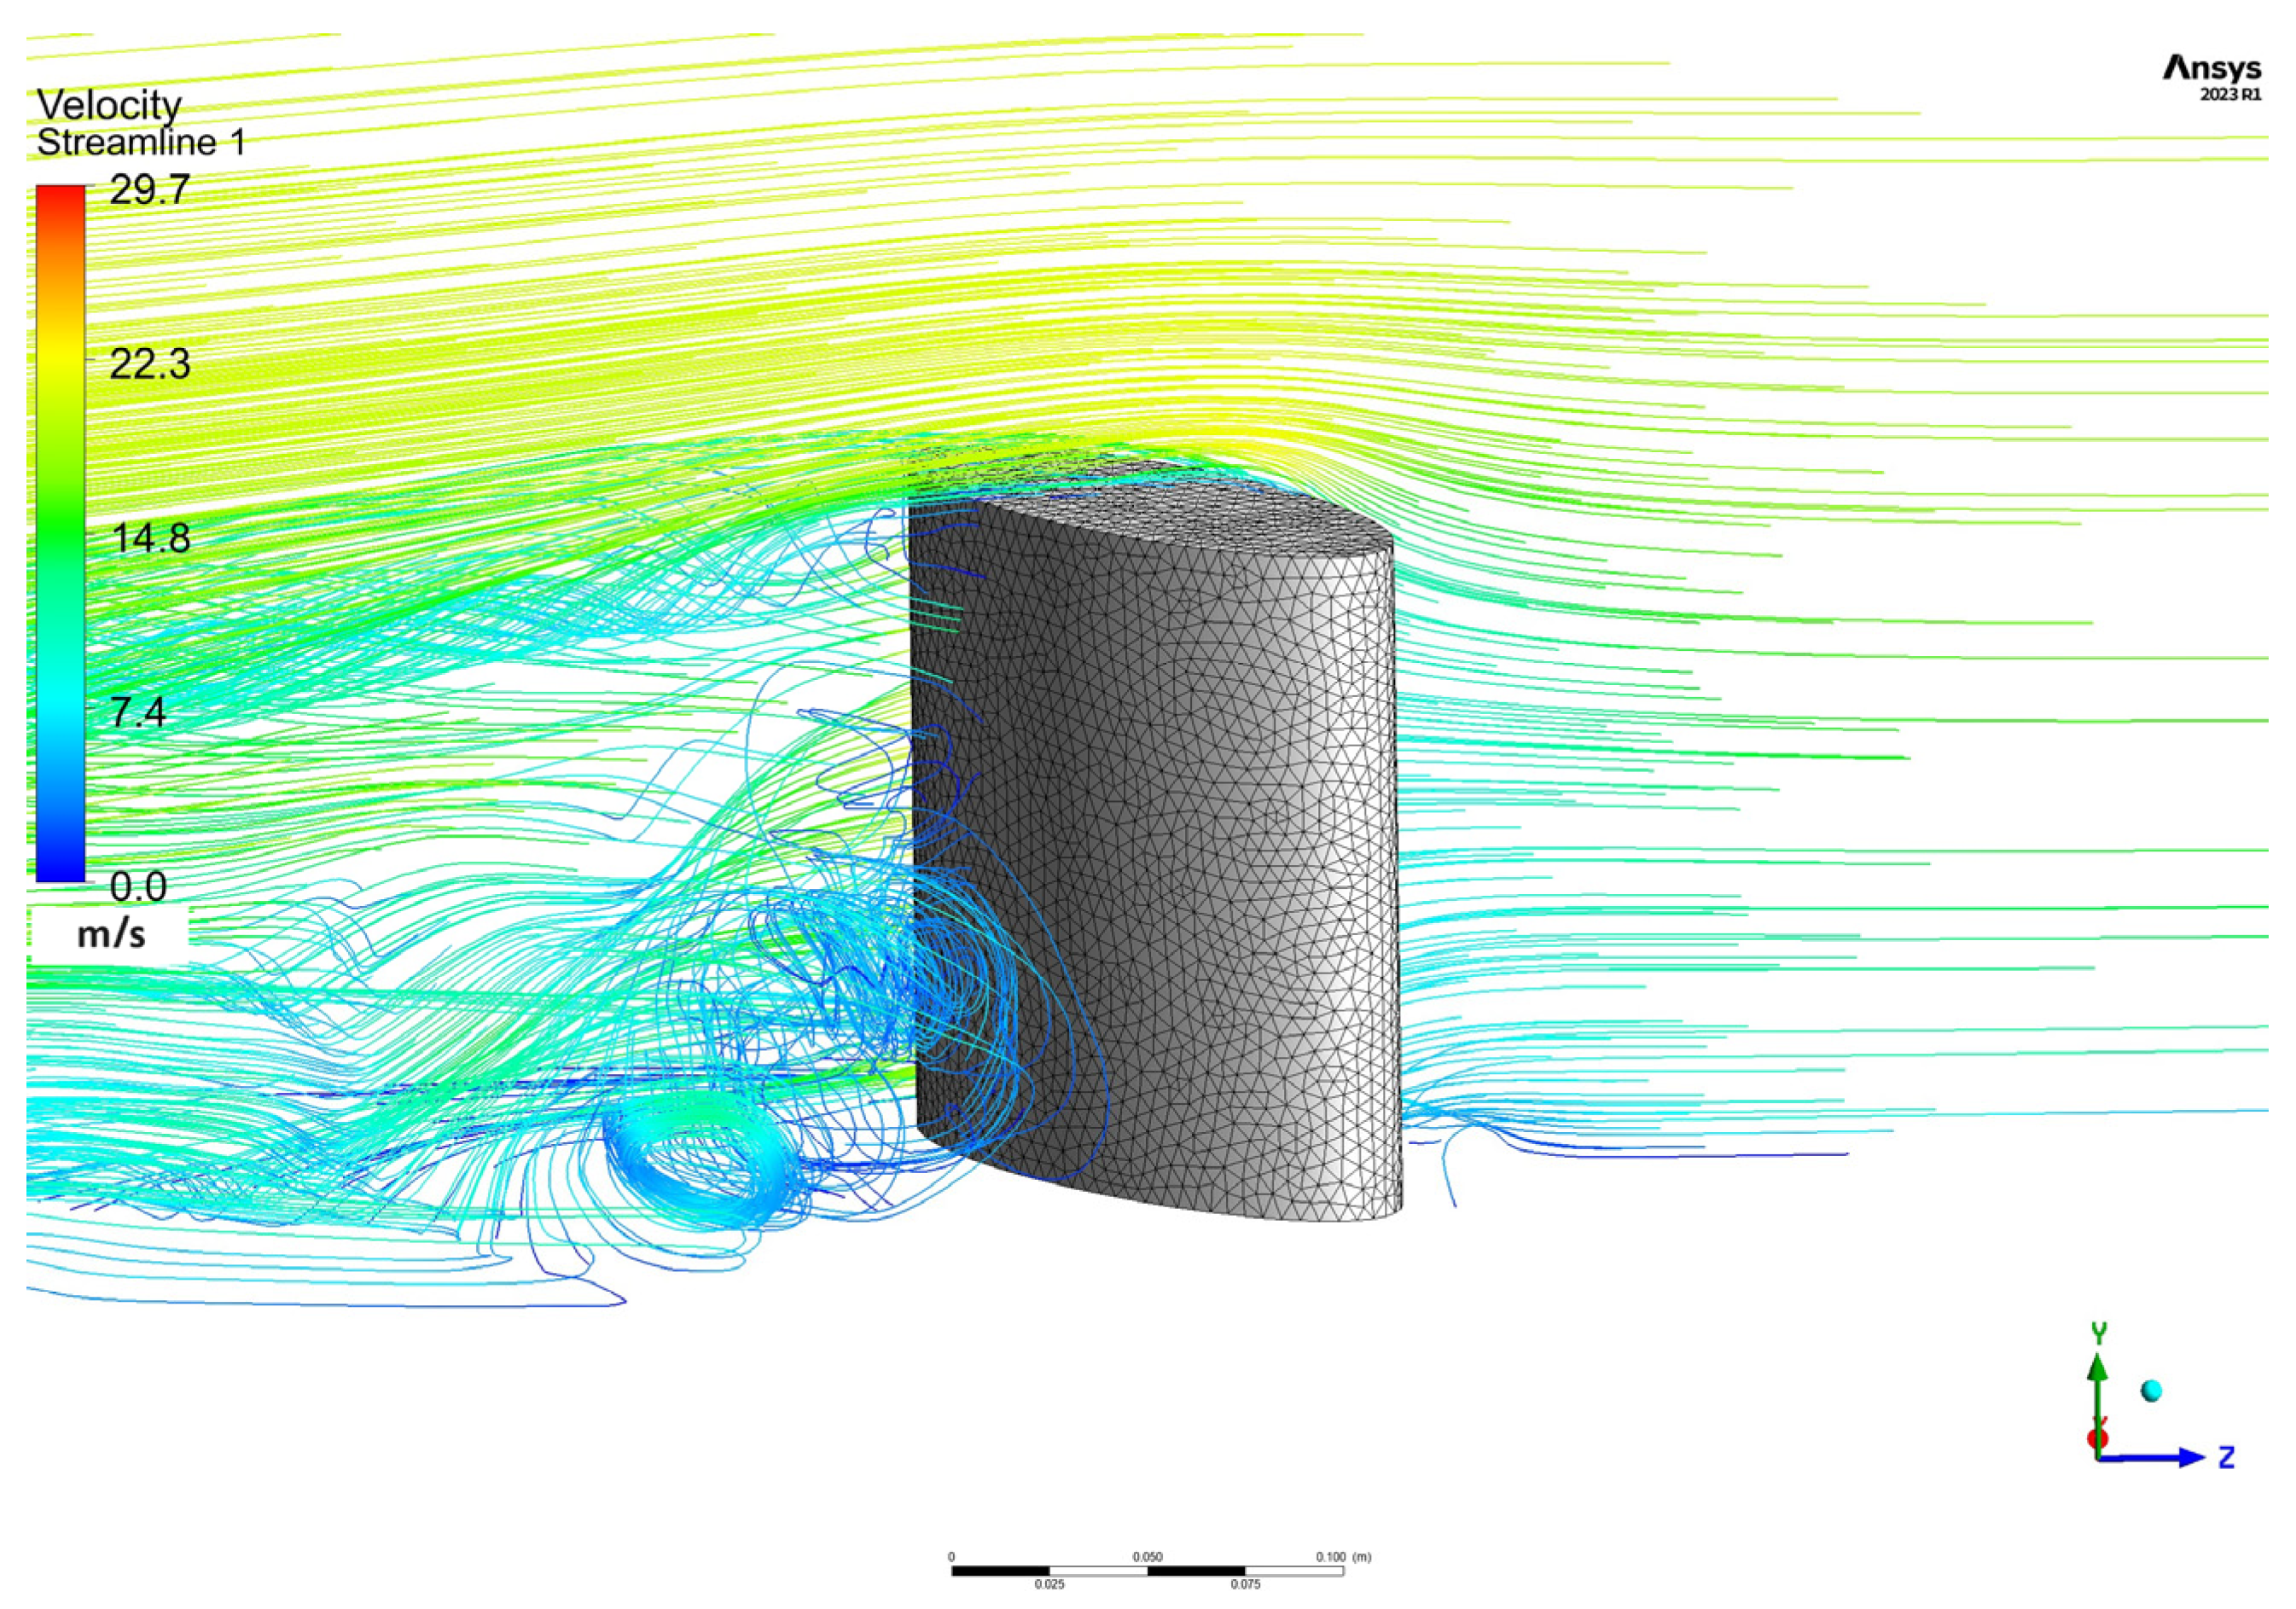
3.2. CFD Simulation in the Program ANSYS FLUENT
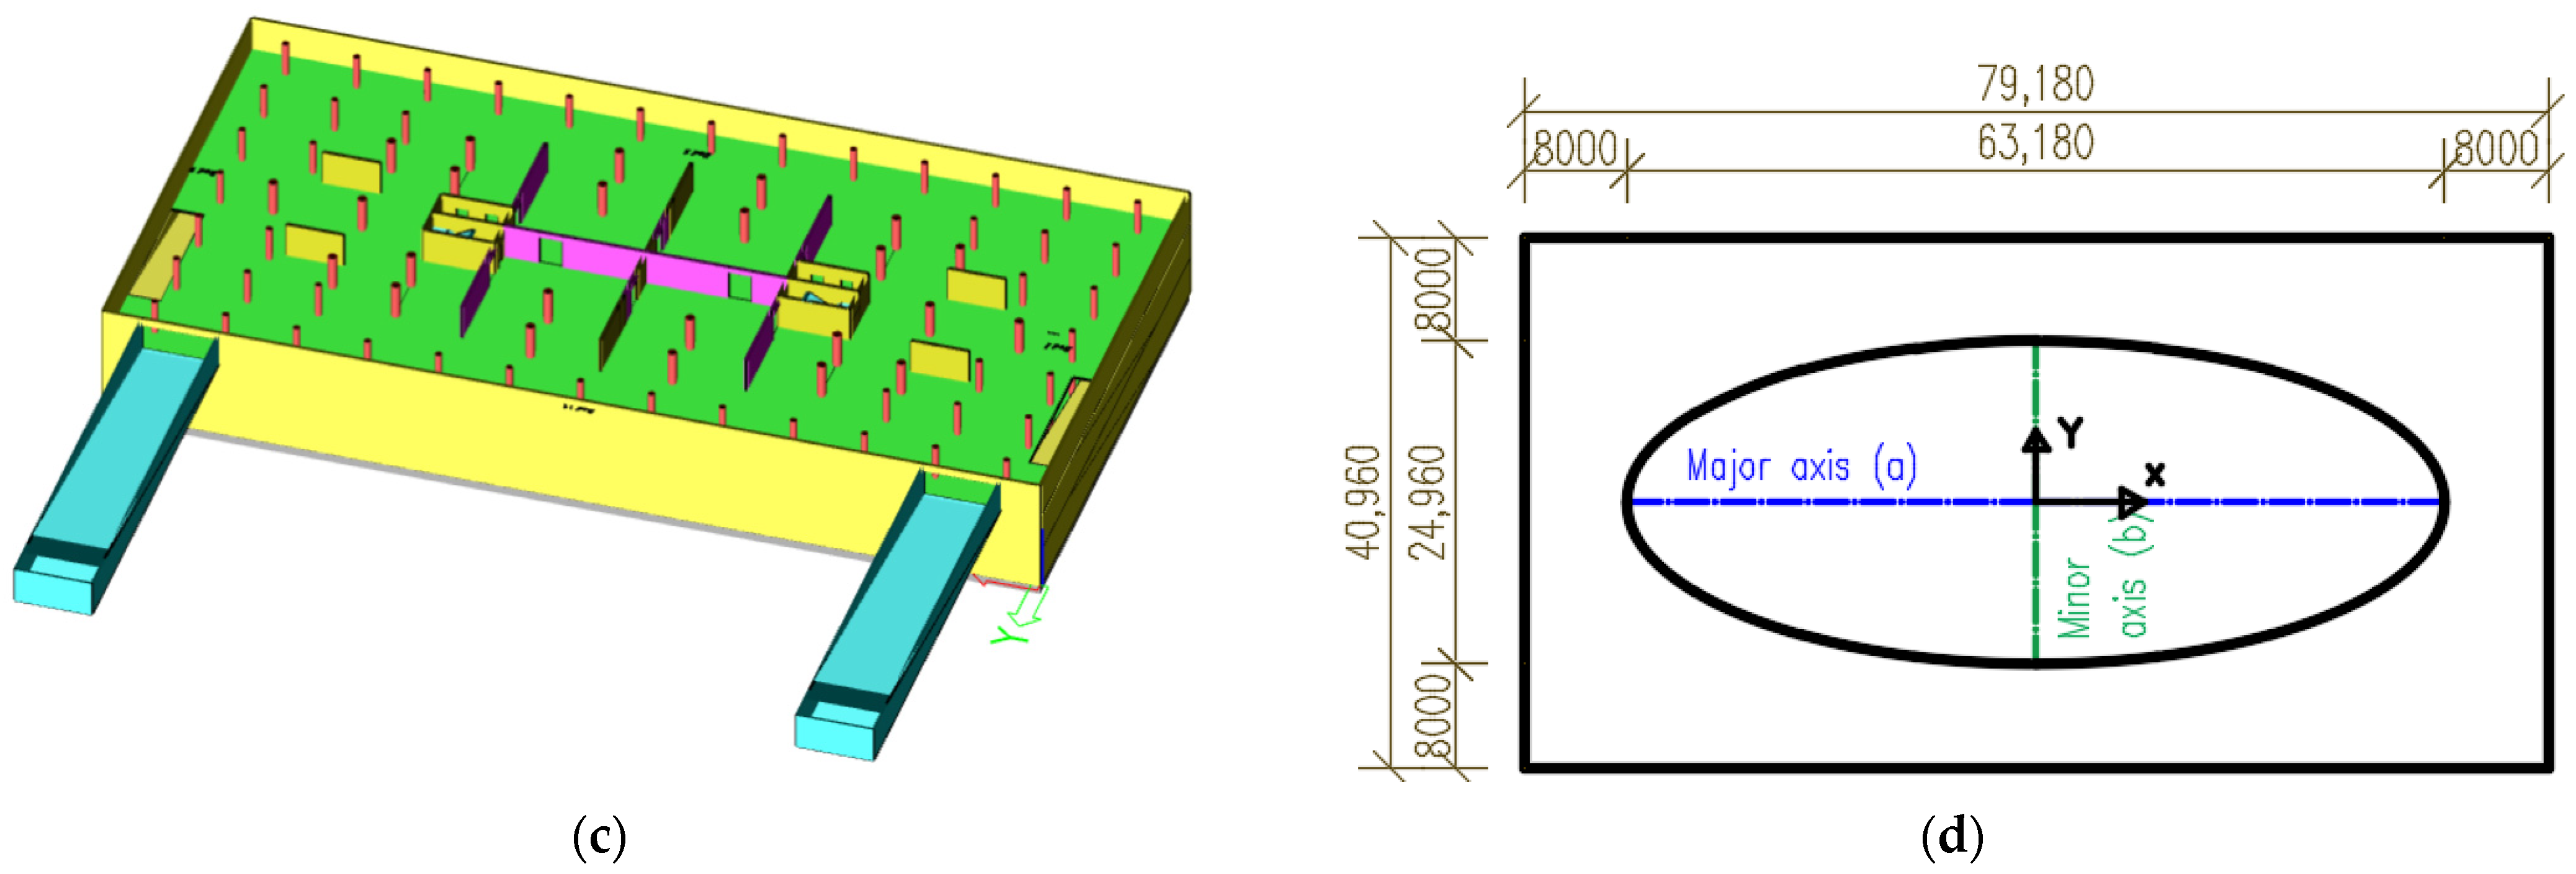
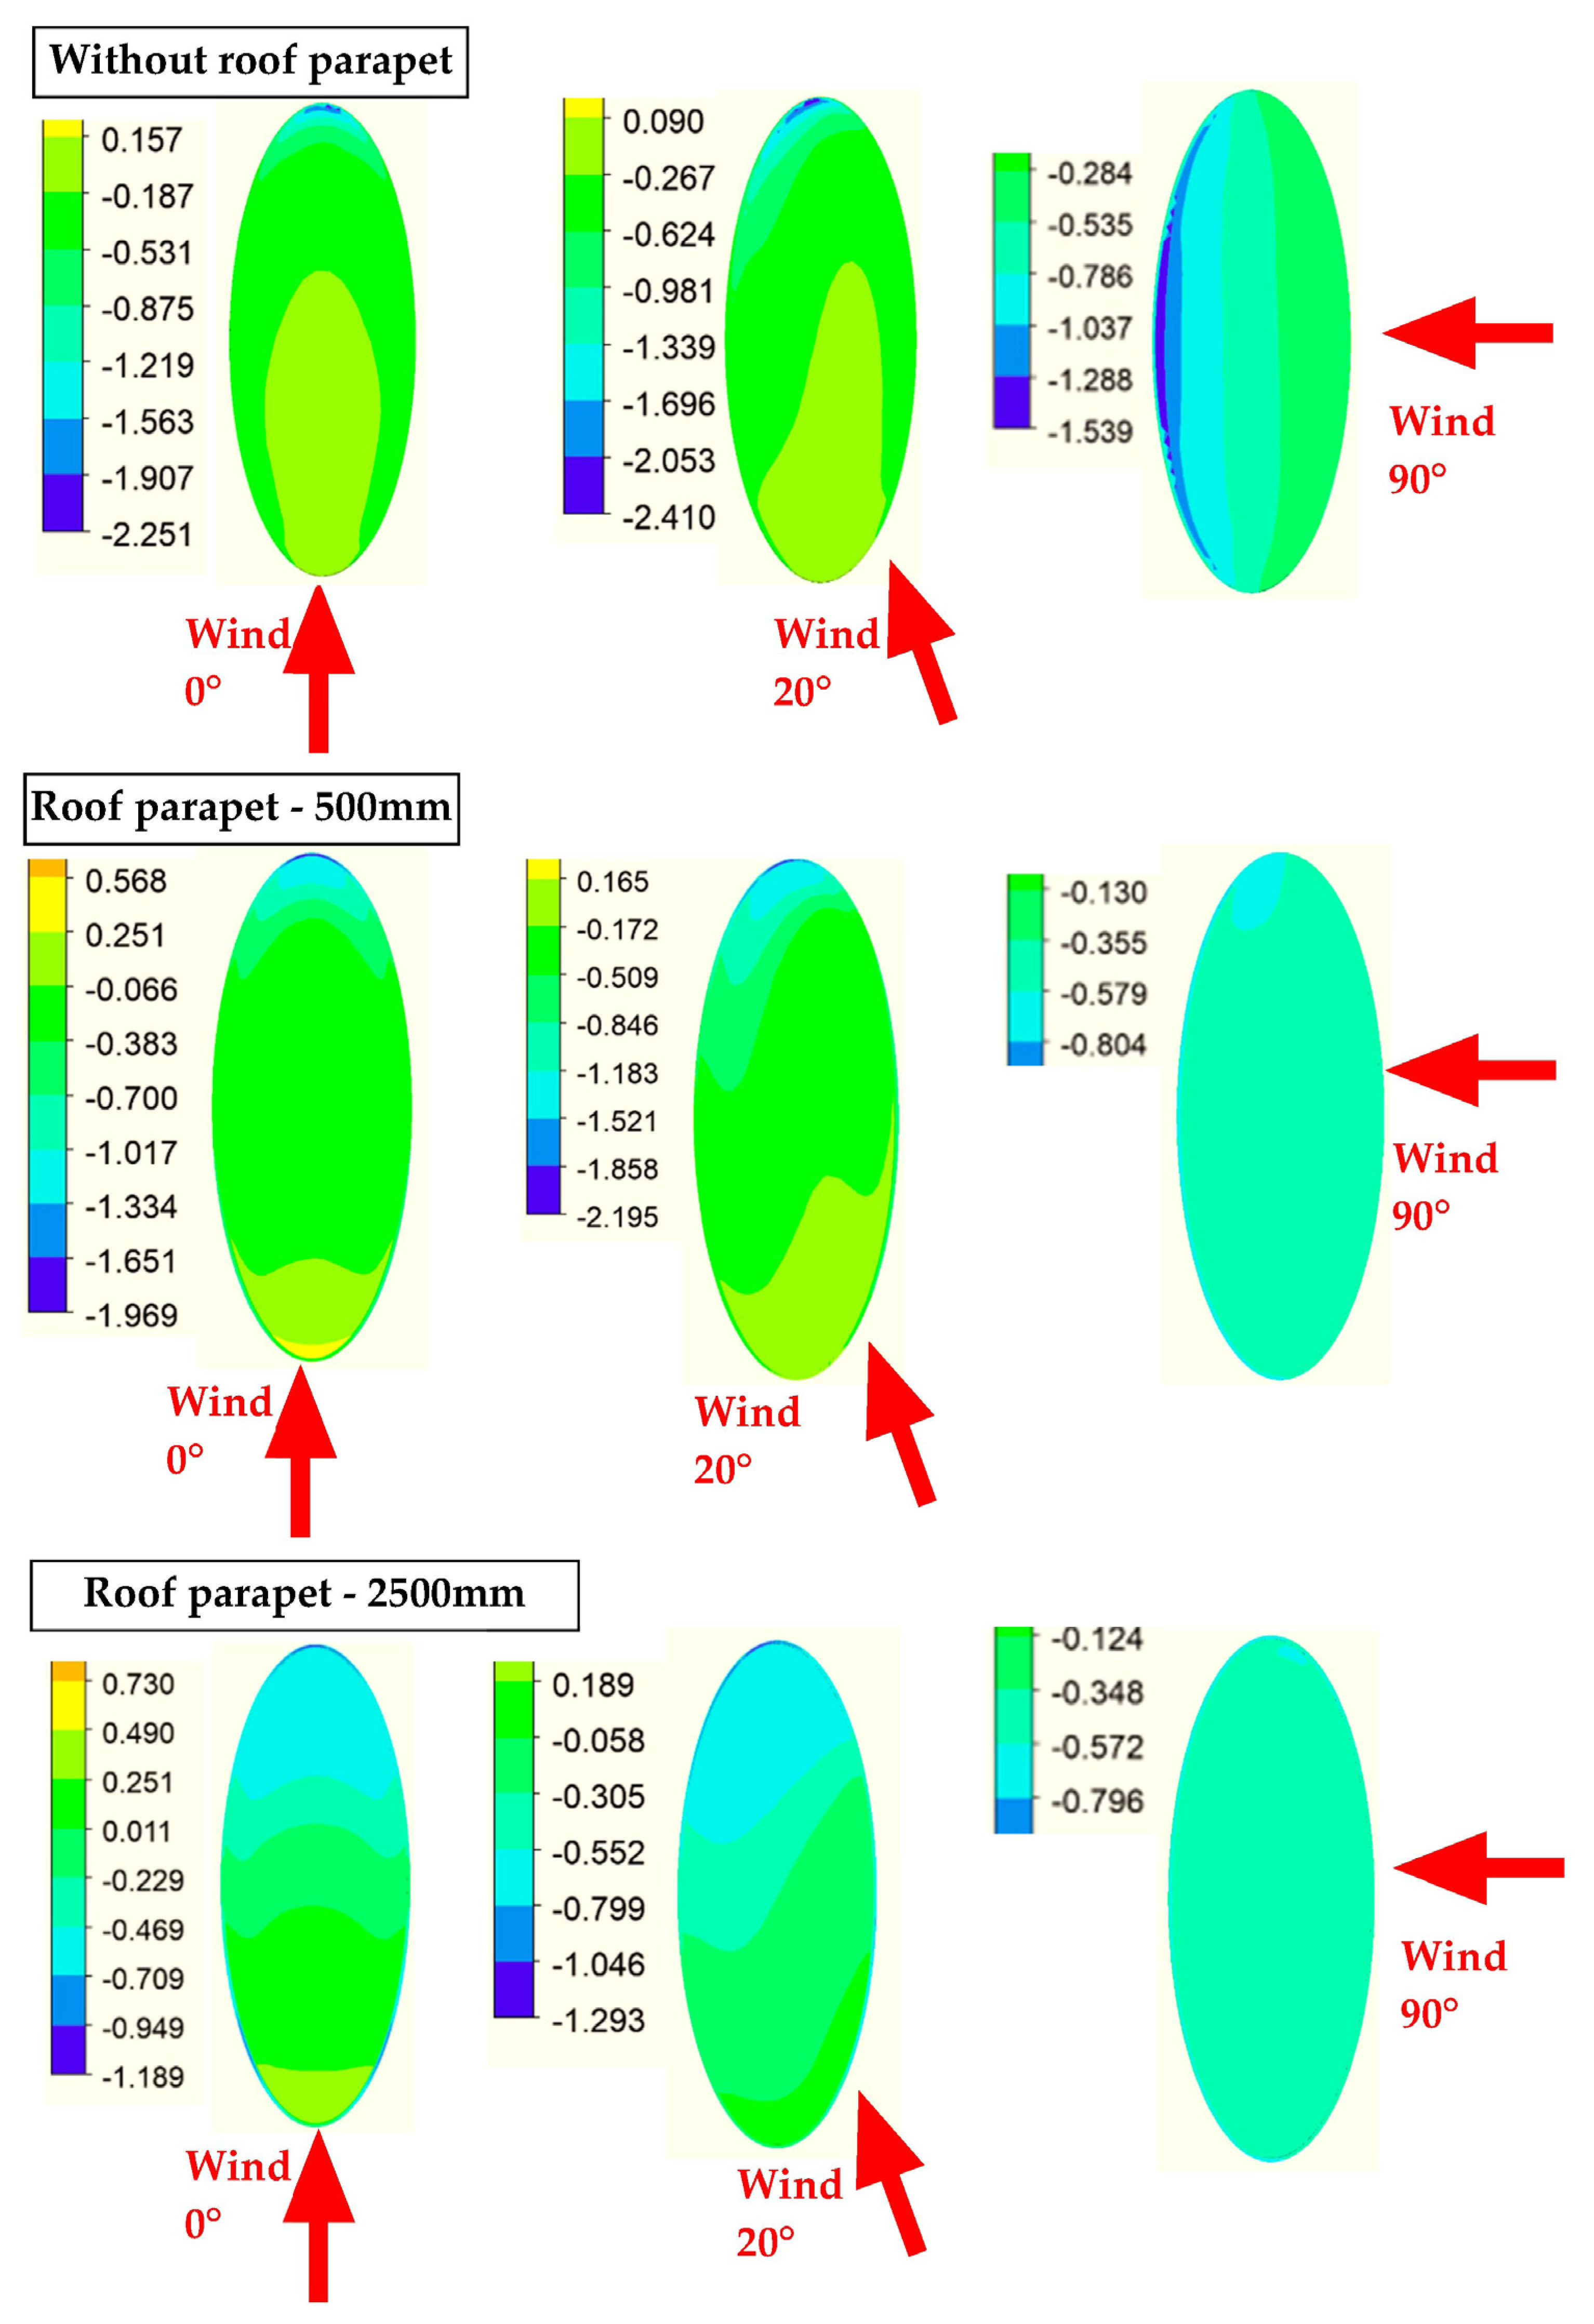
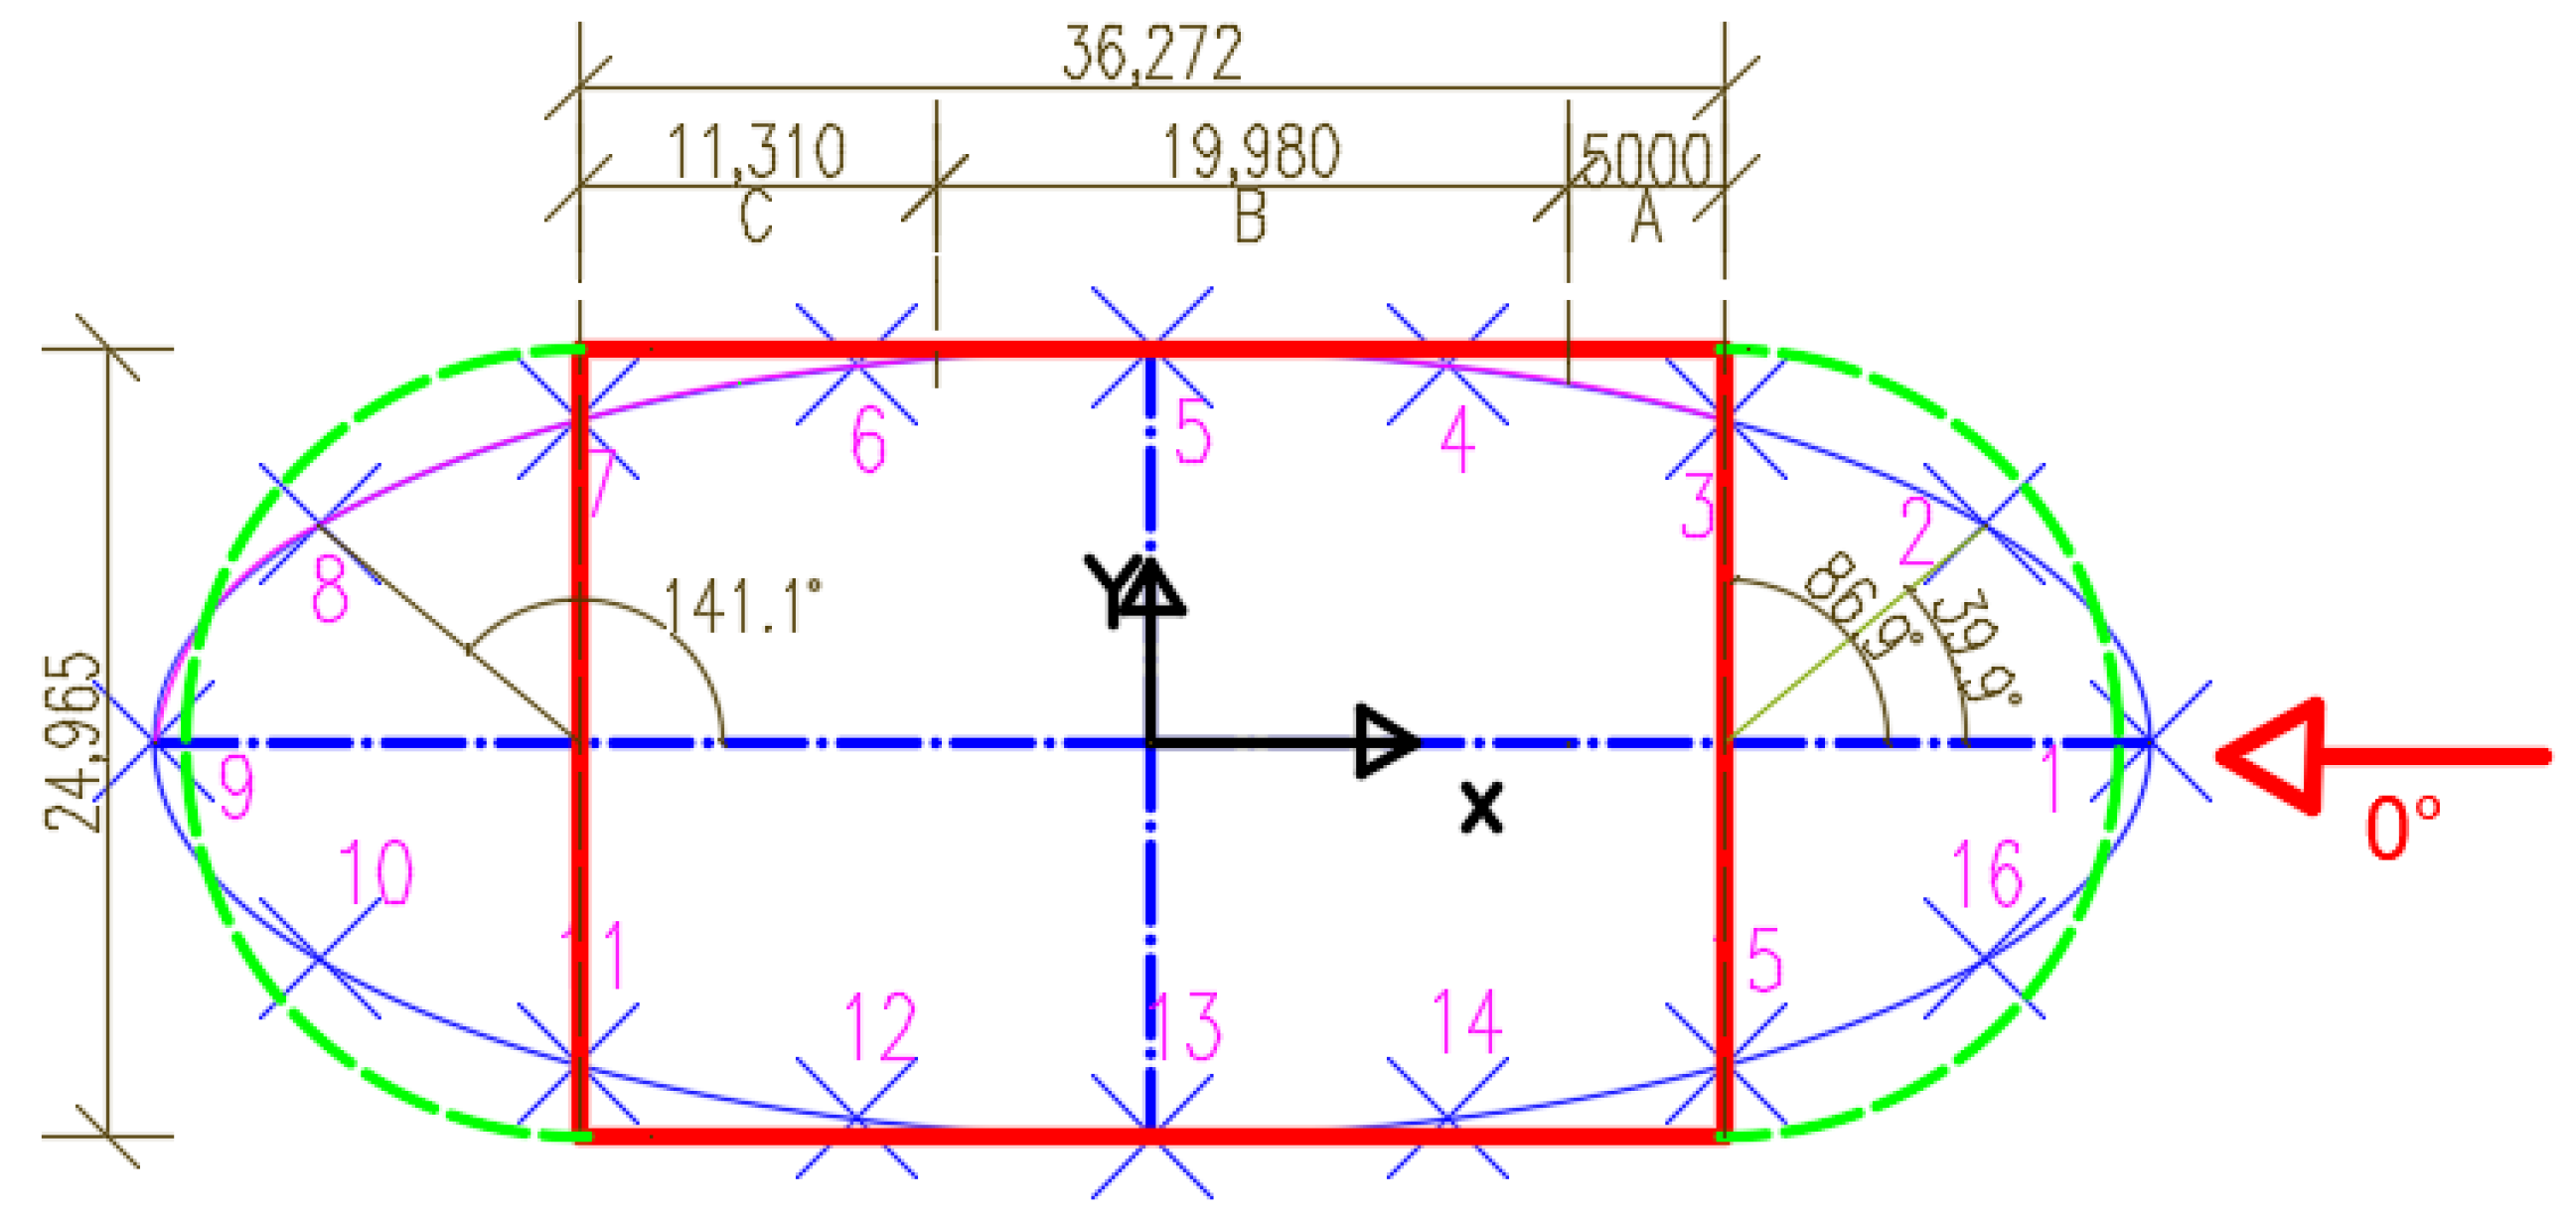
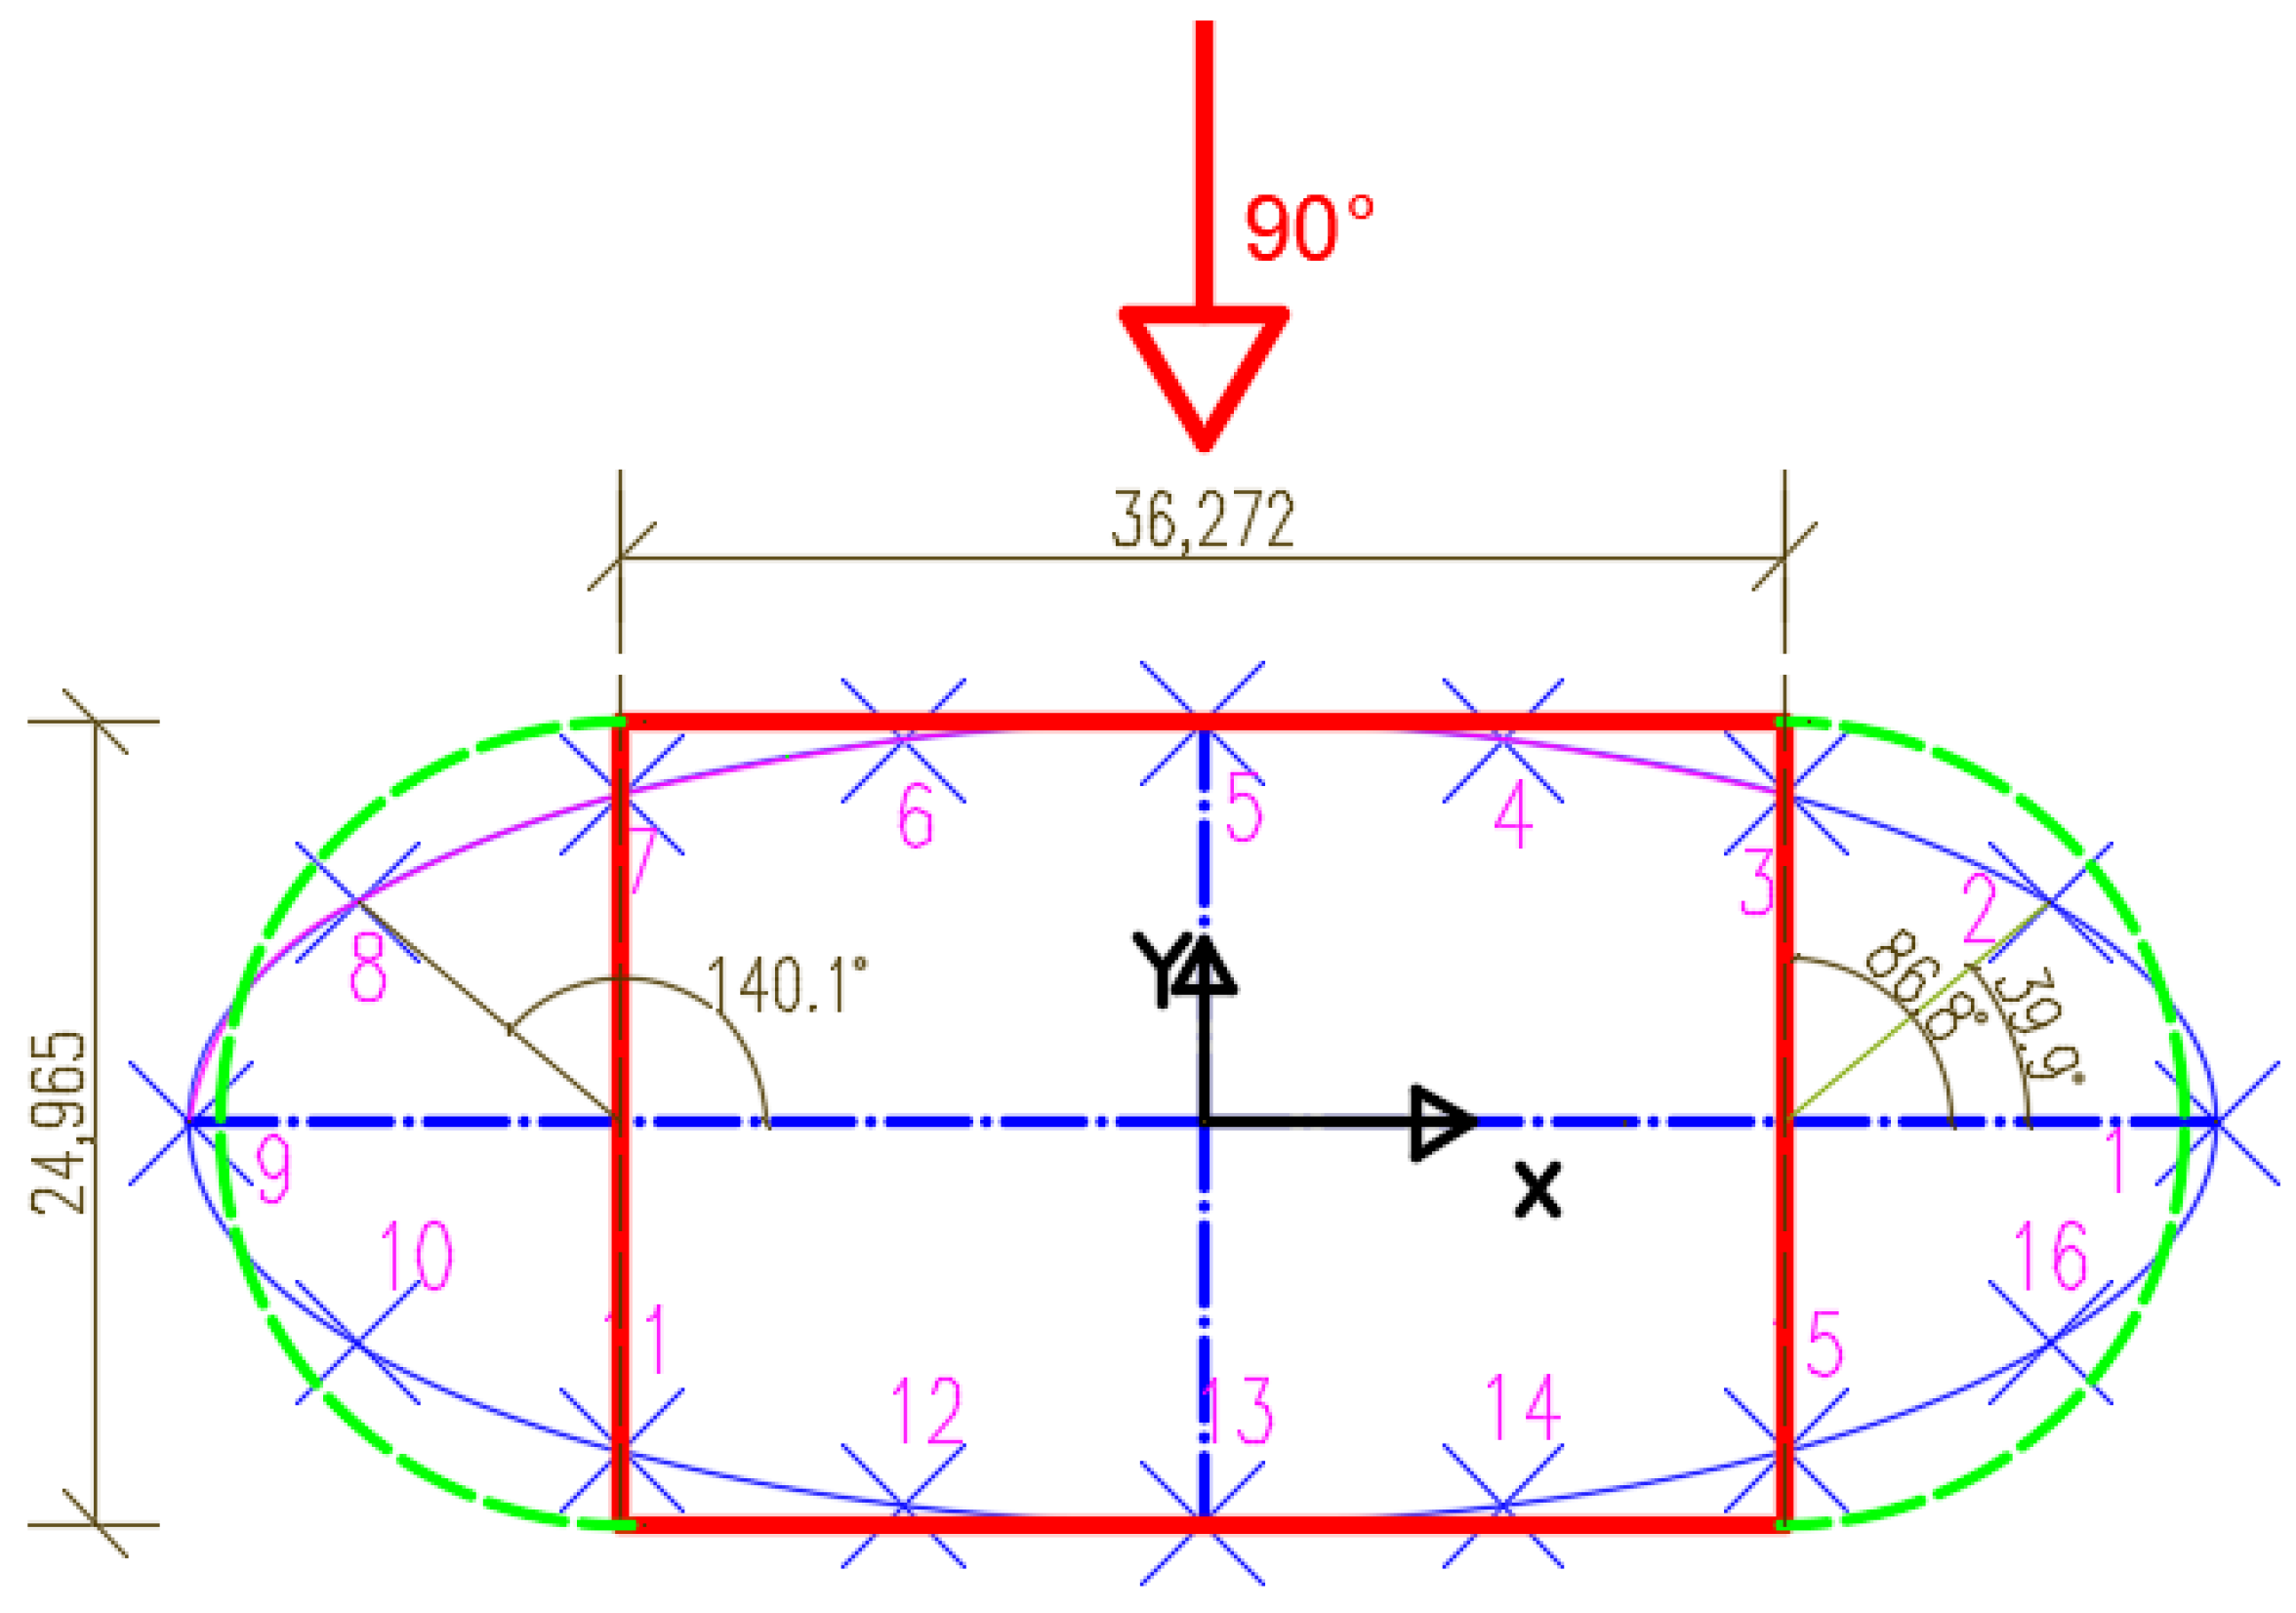
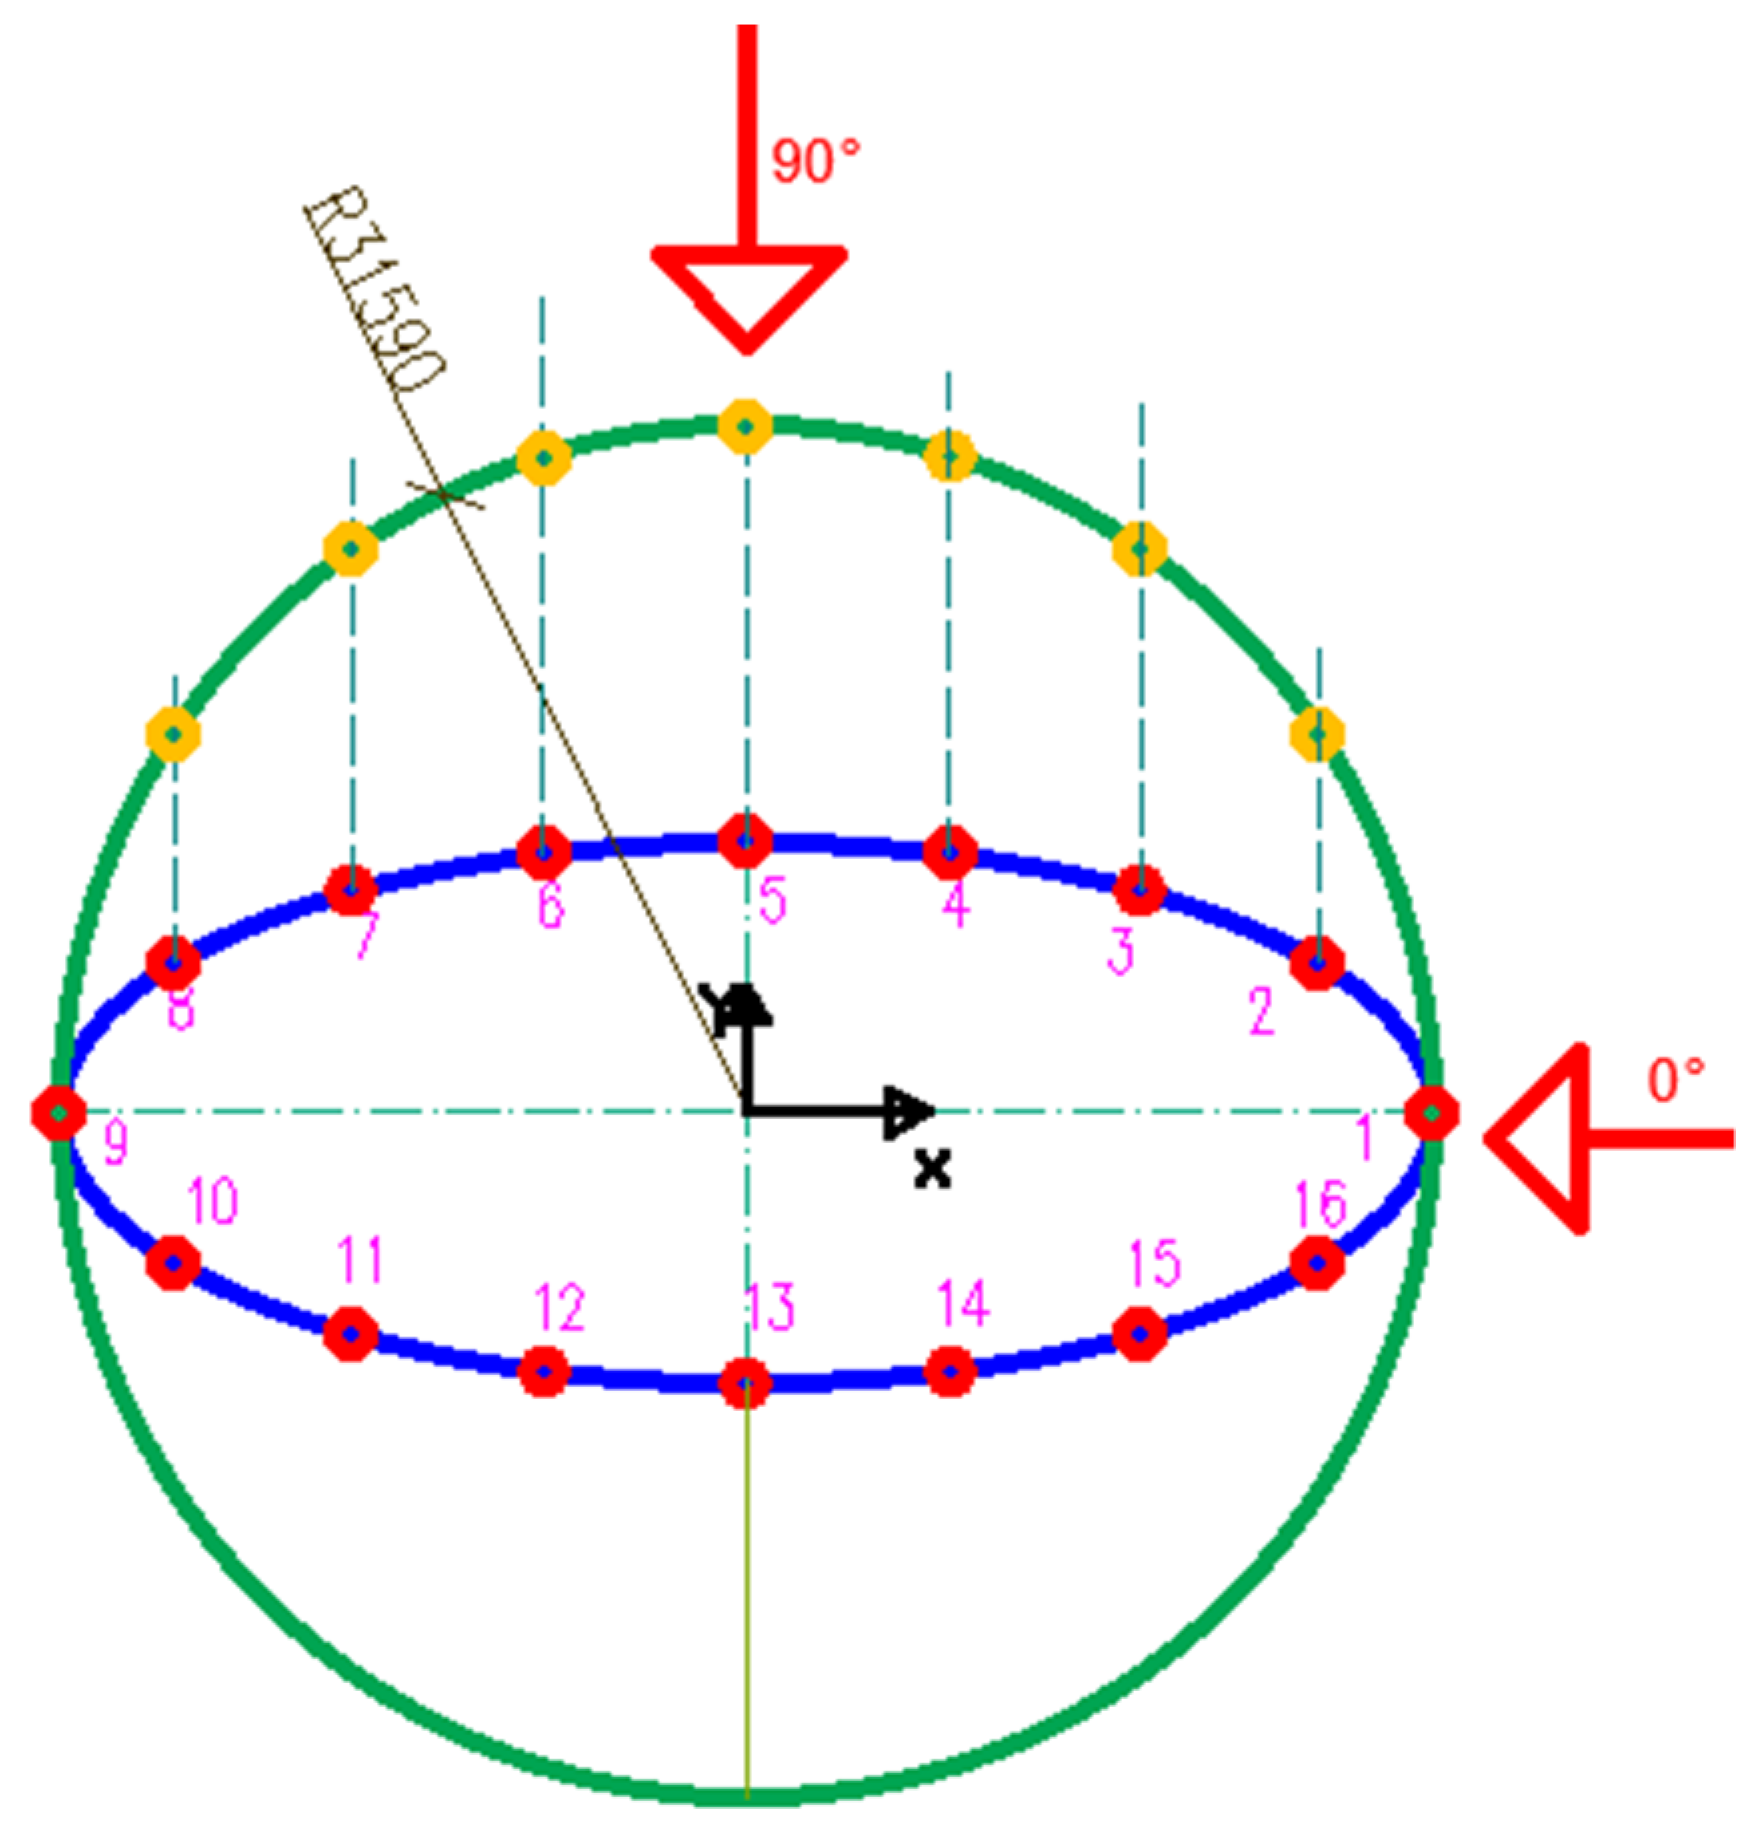
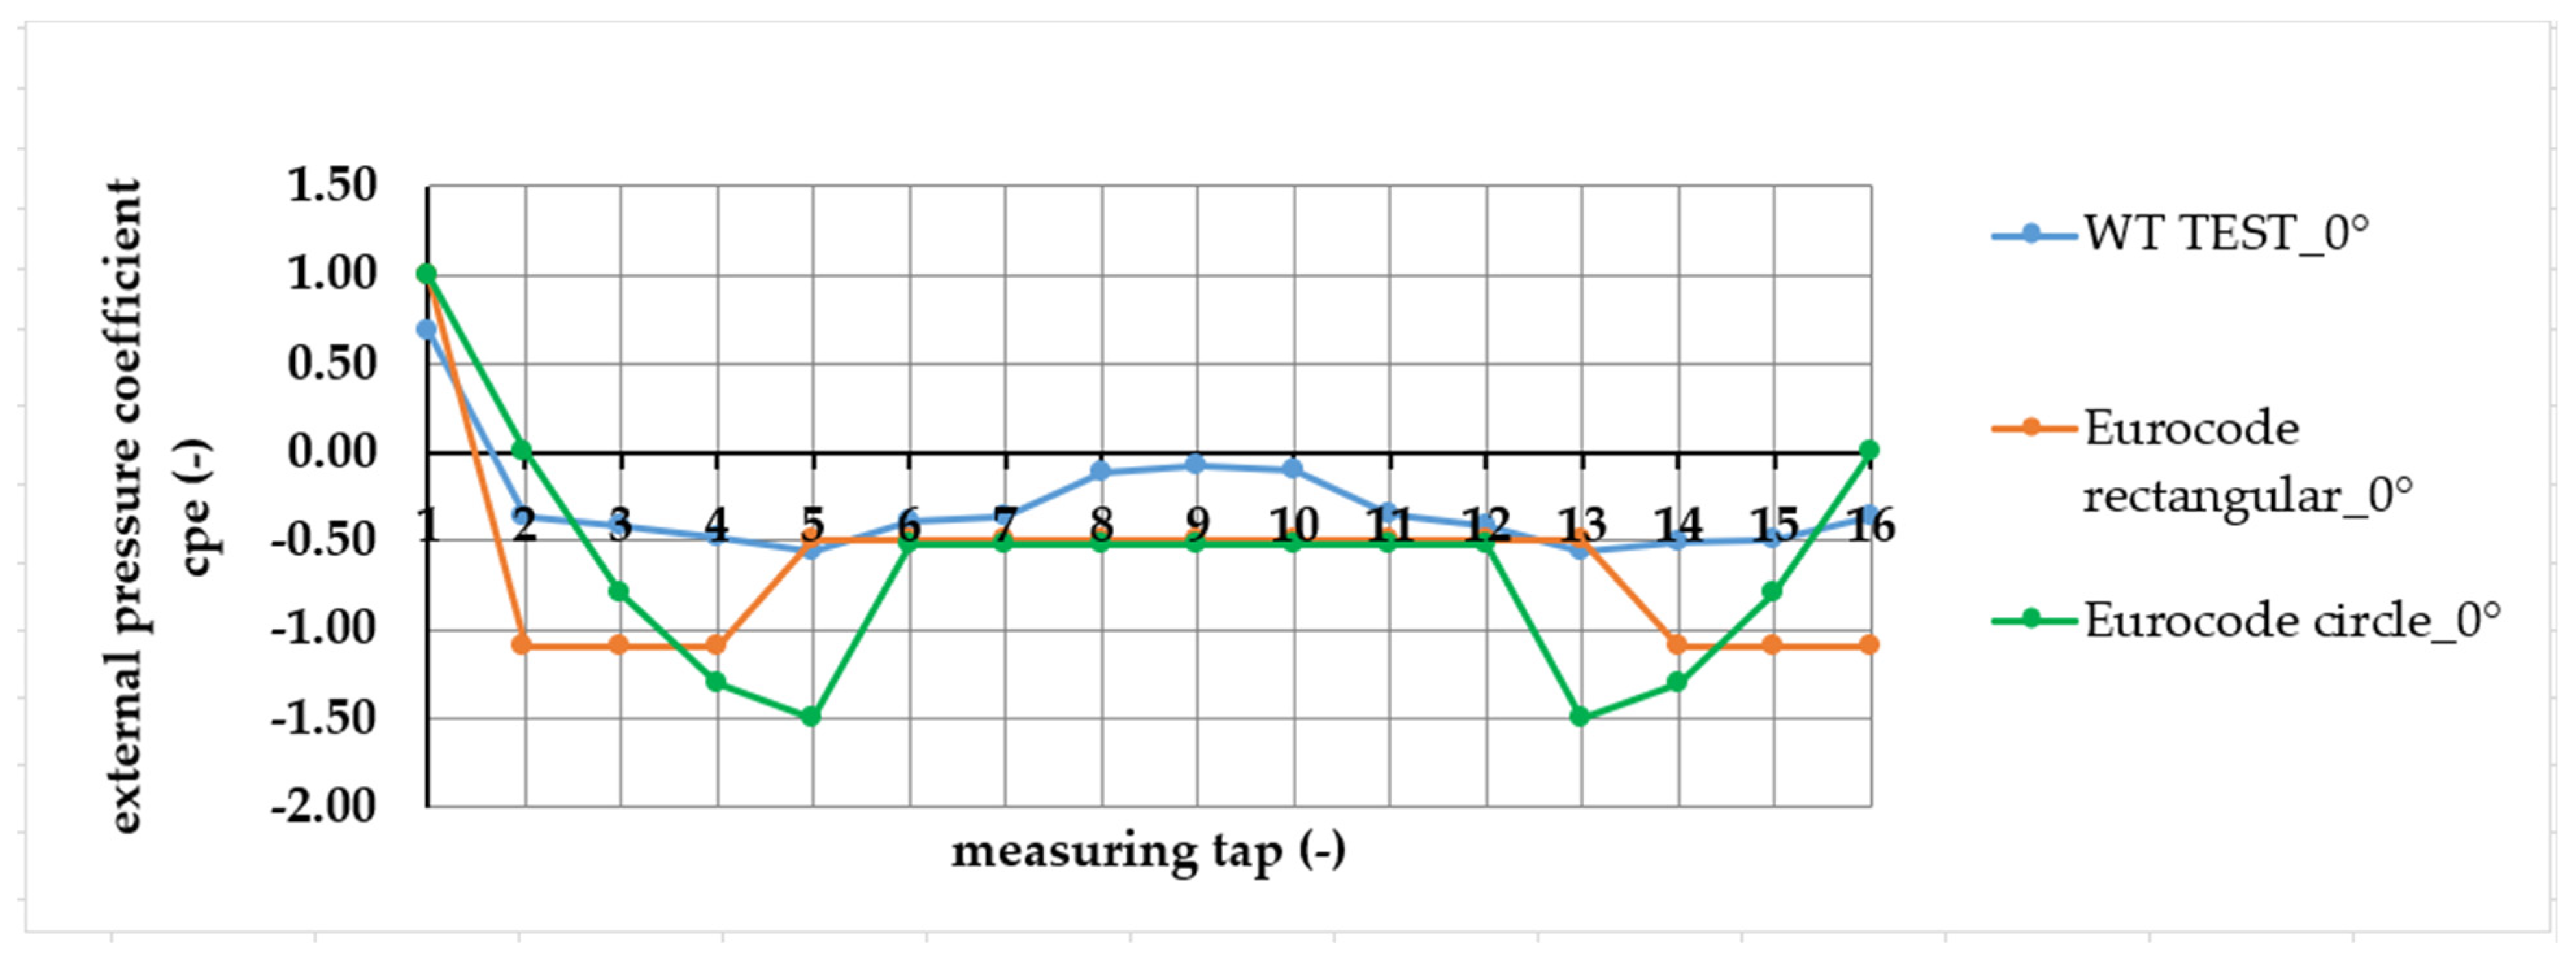
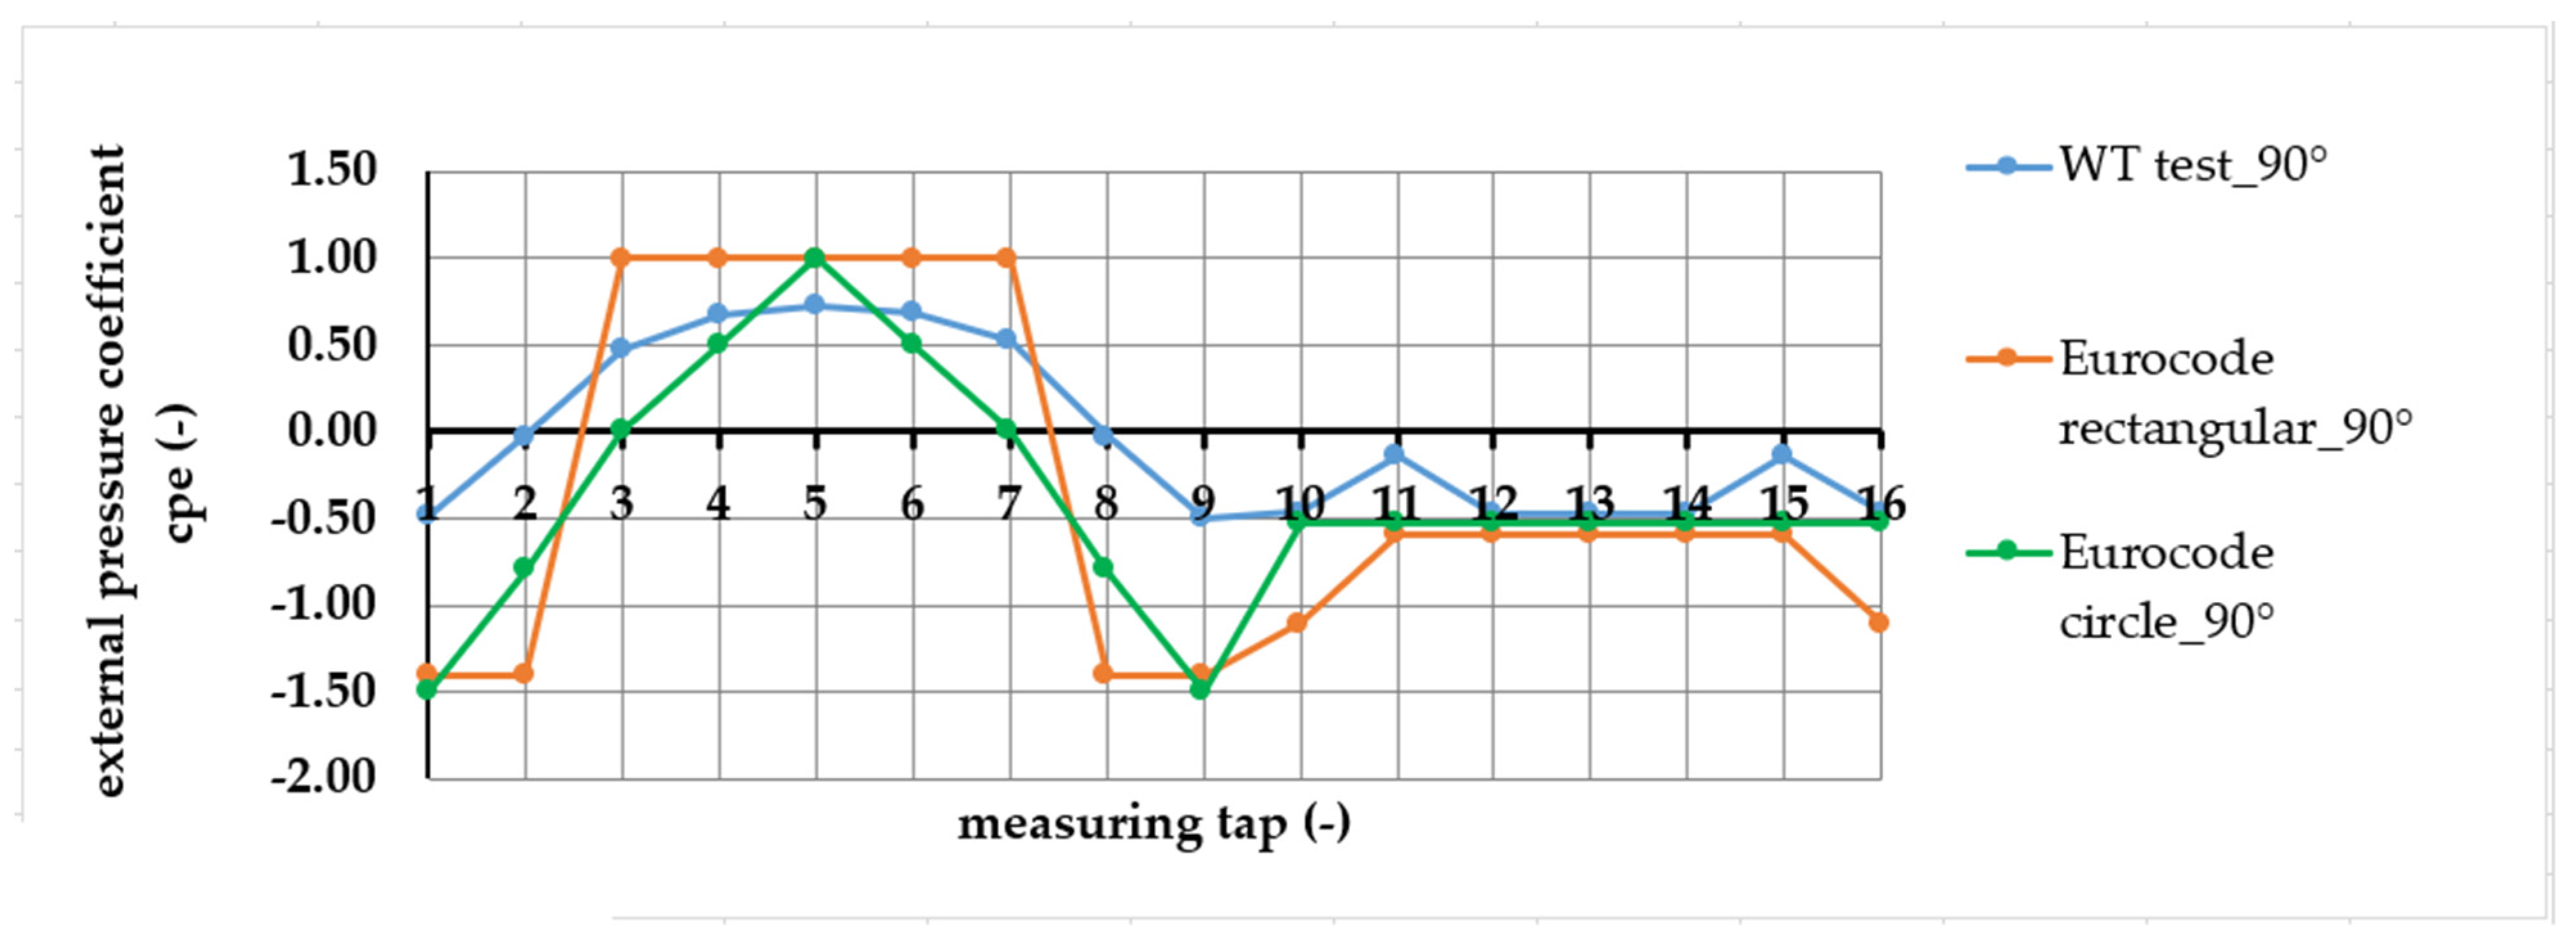
3.3. The Simplification of the Elliptic Shape
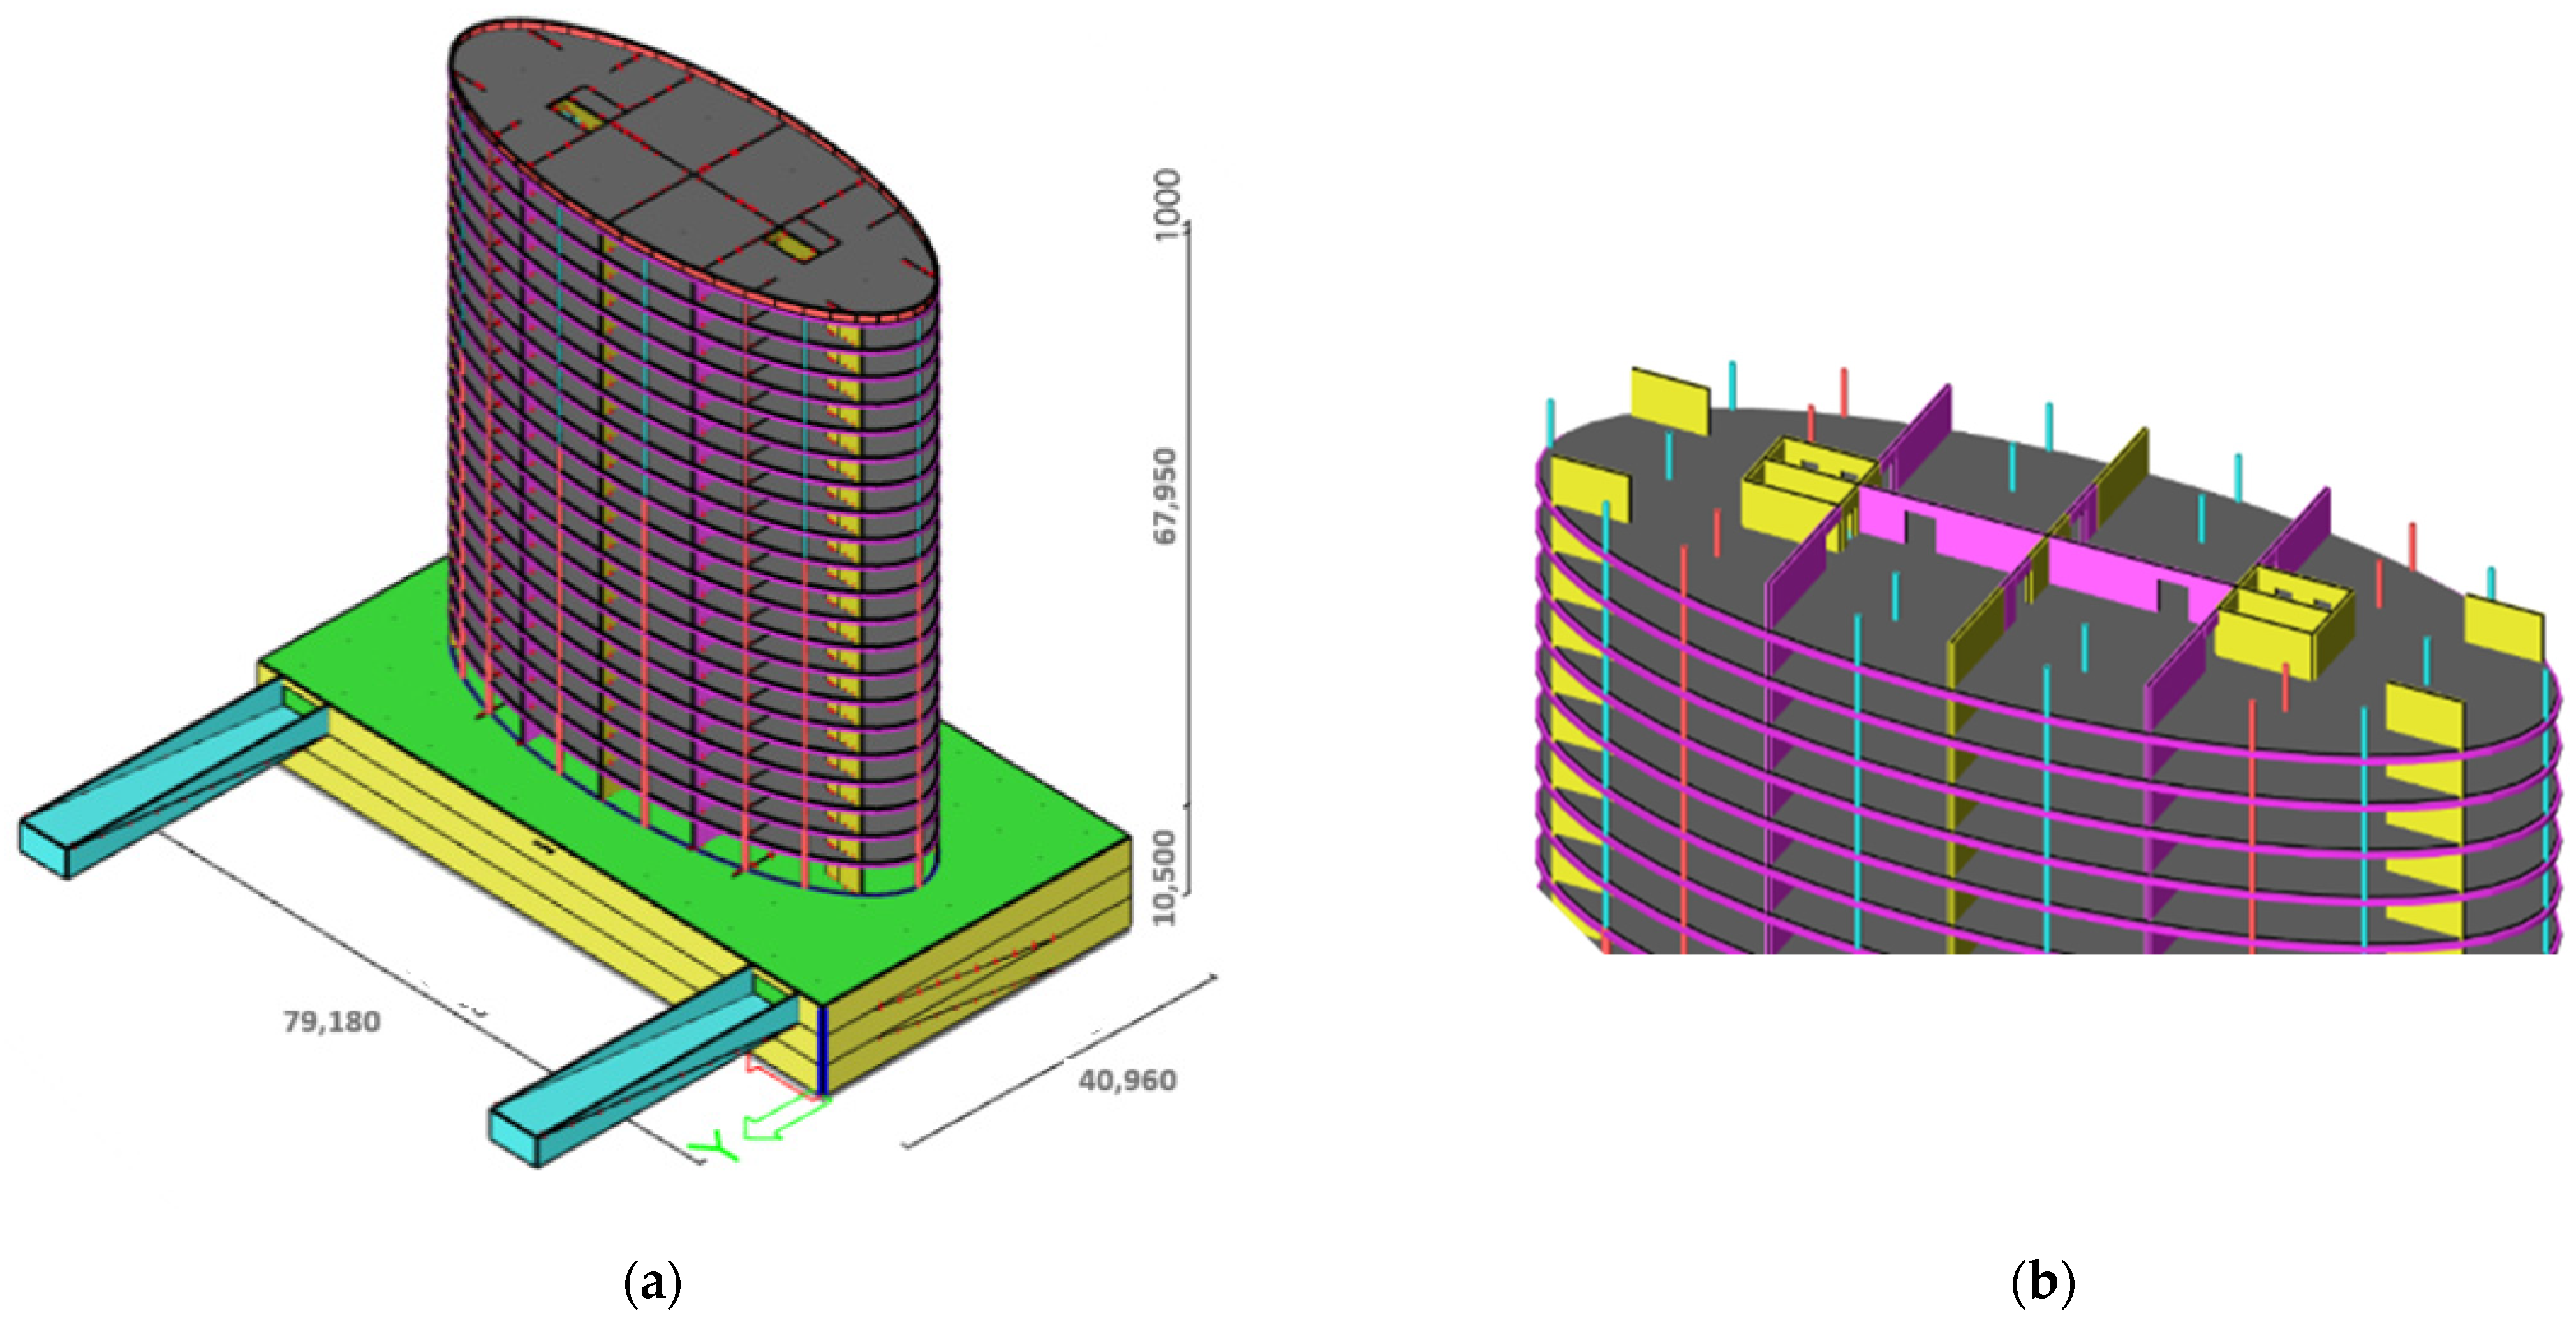
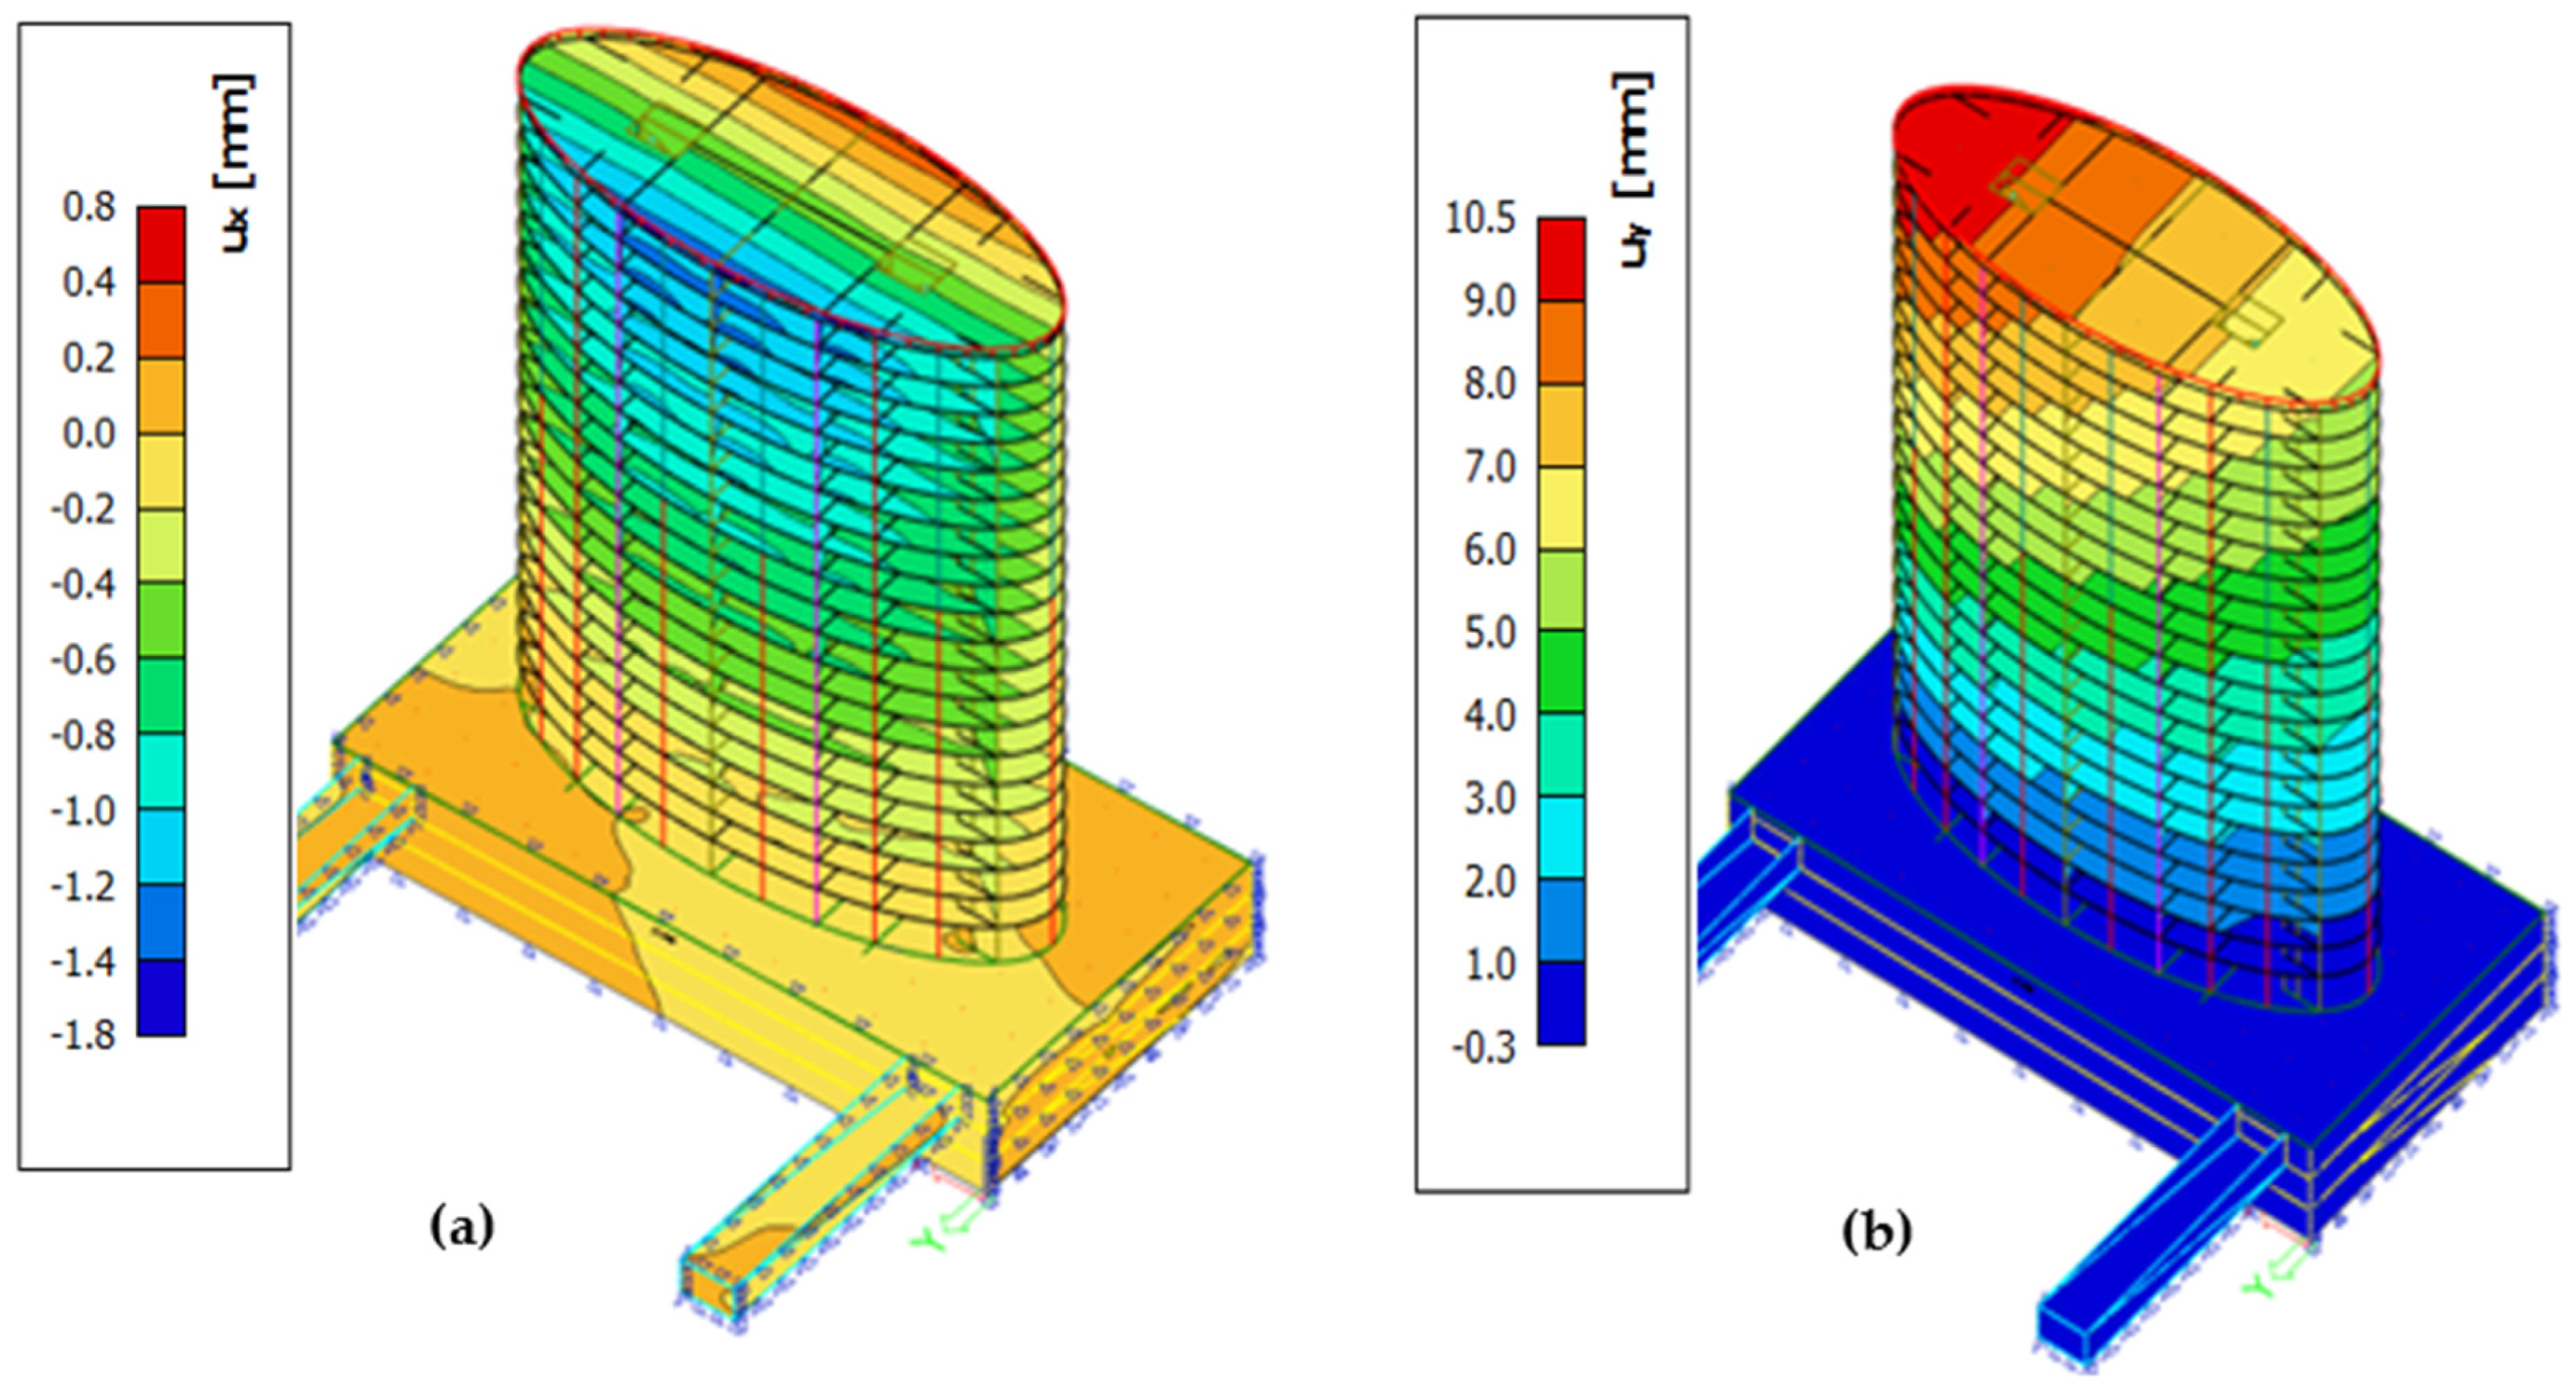
3.4. The Application of the Results to the 3D Model of the Building Used for Static and Dynamic Analysis
4. Static Analysis
4.1. Applied Loads
4.2. The Subsoil Stiffness Coefficient
4.3. The Limit Values
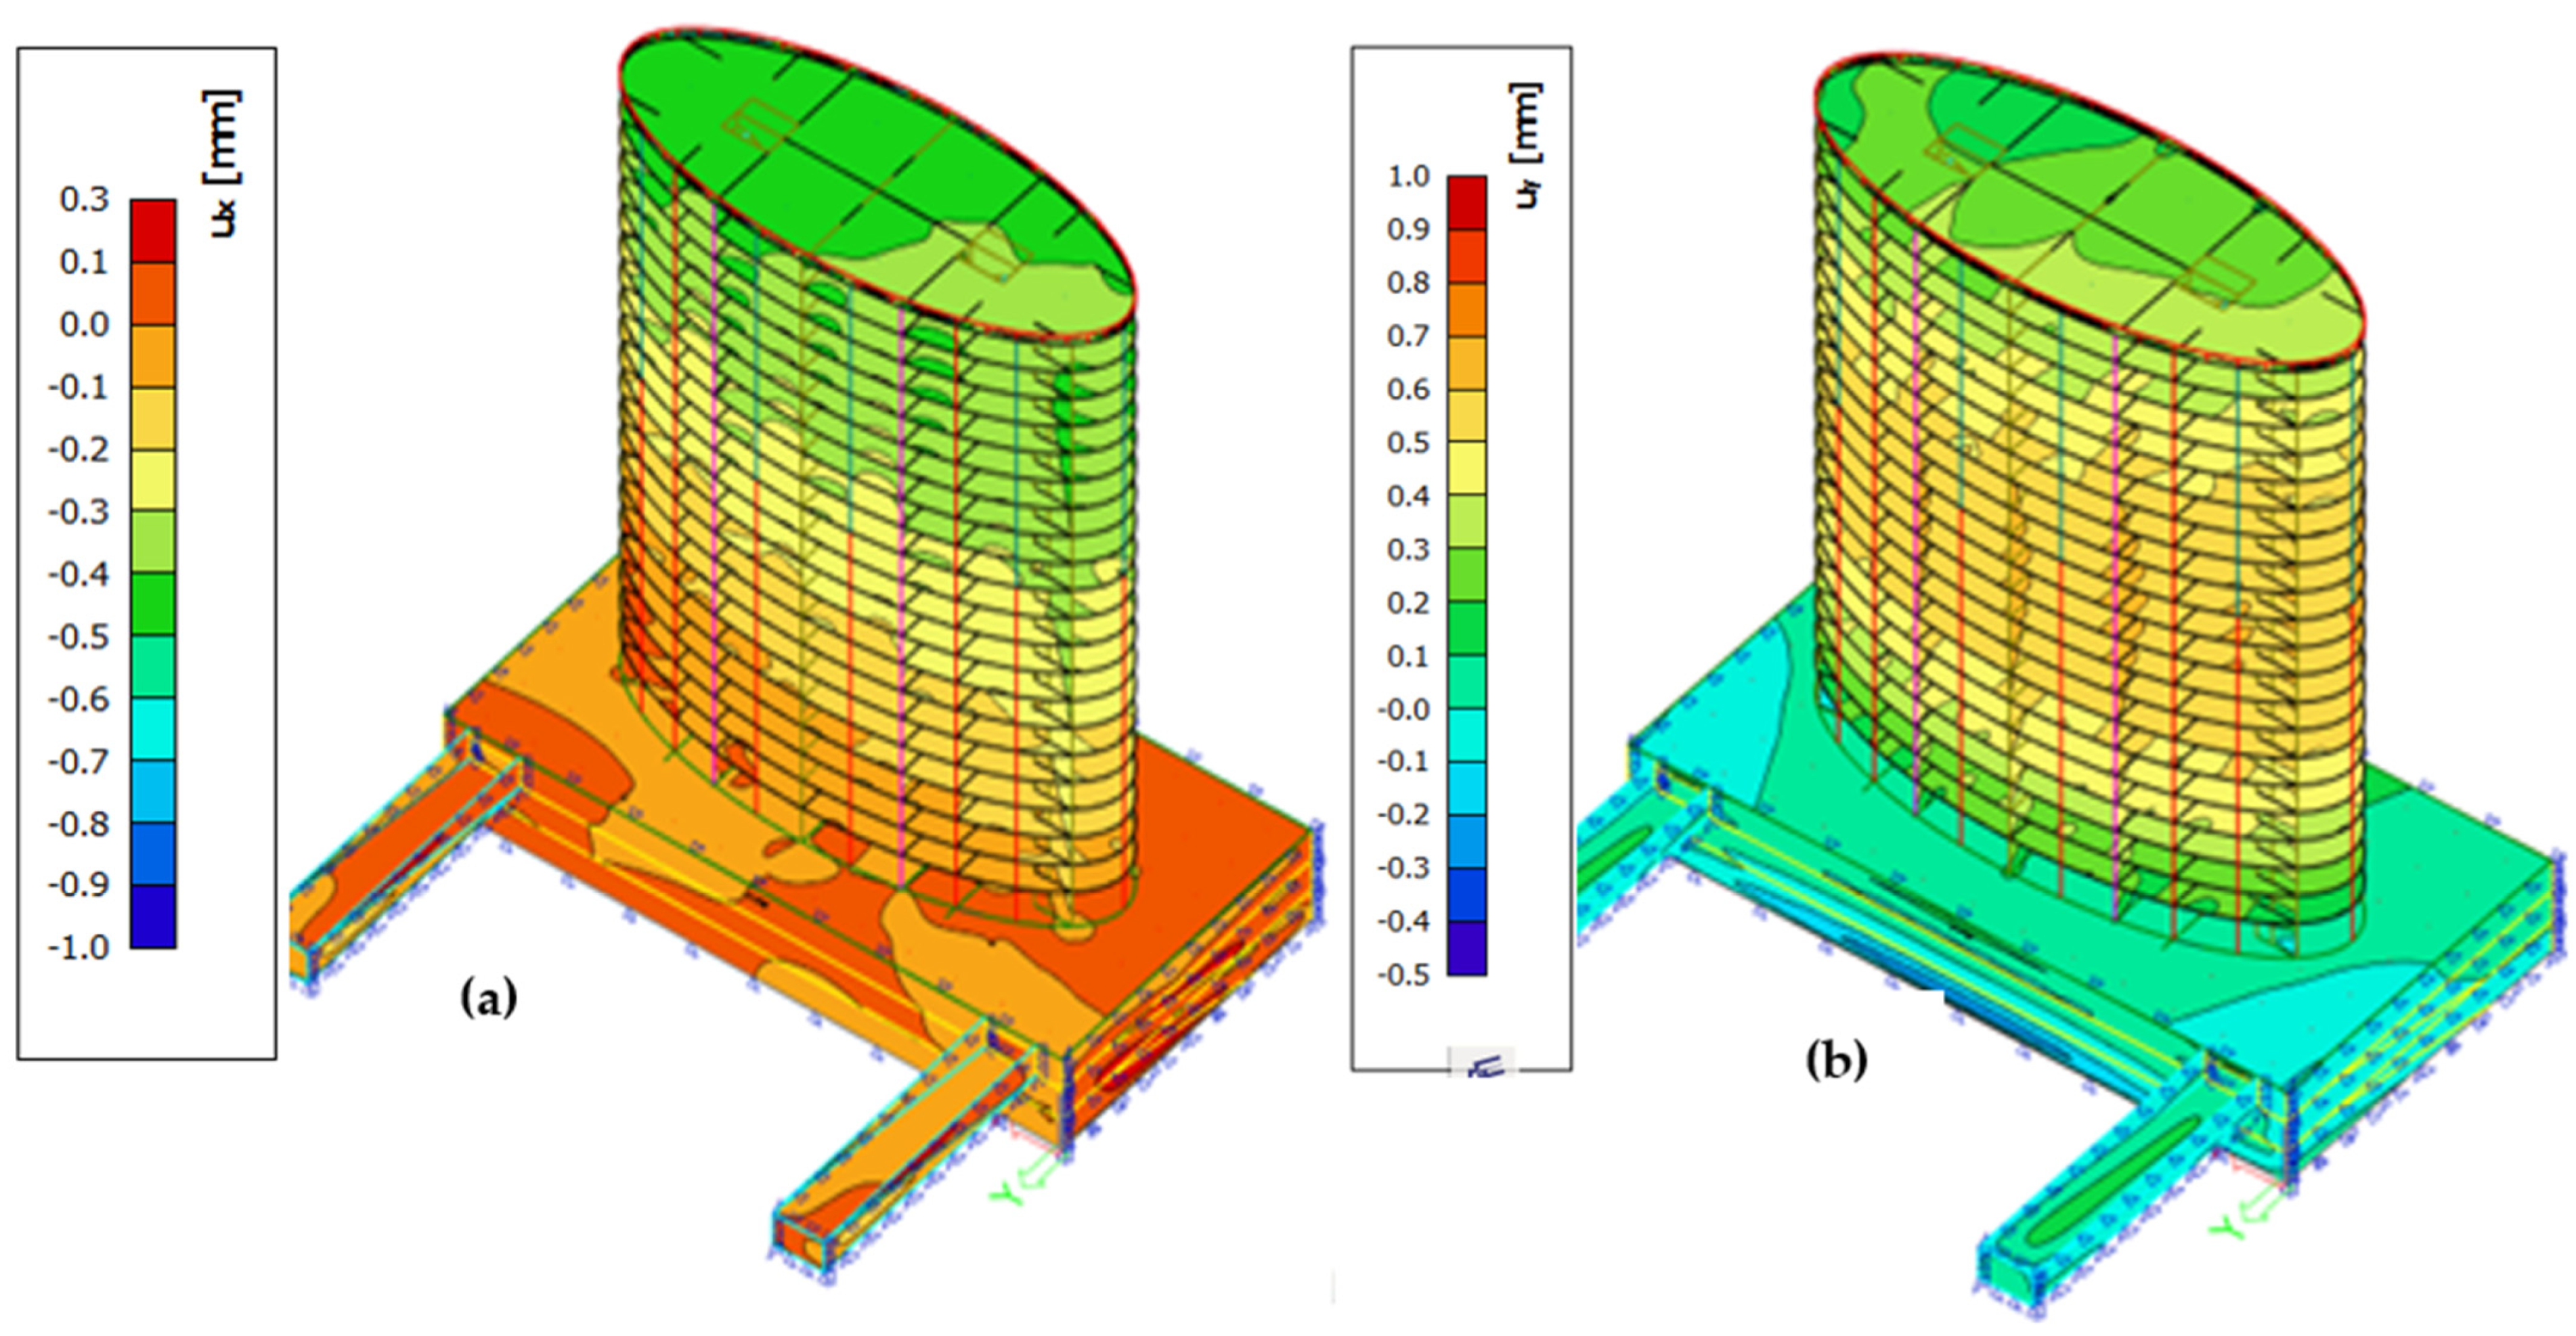
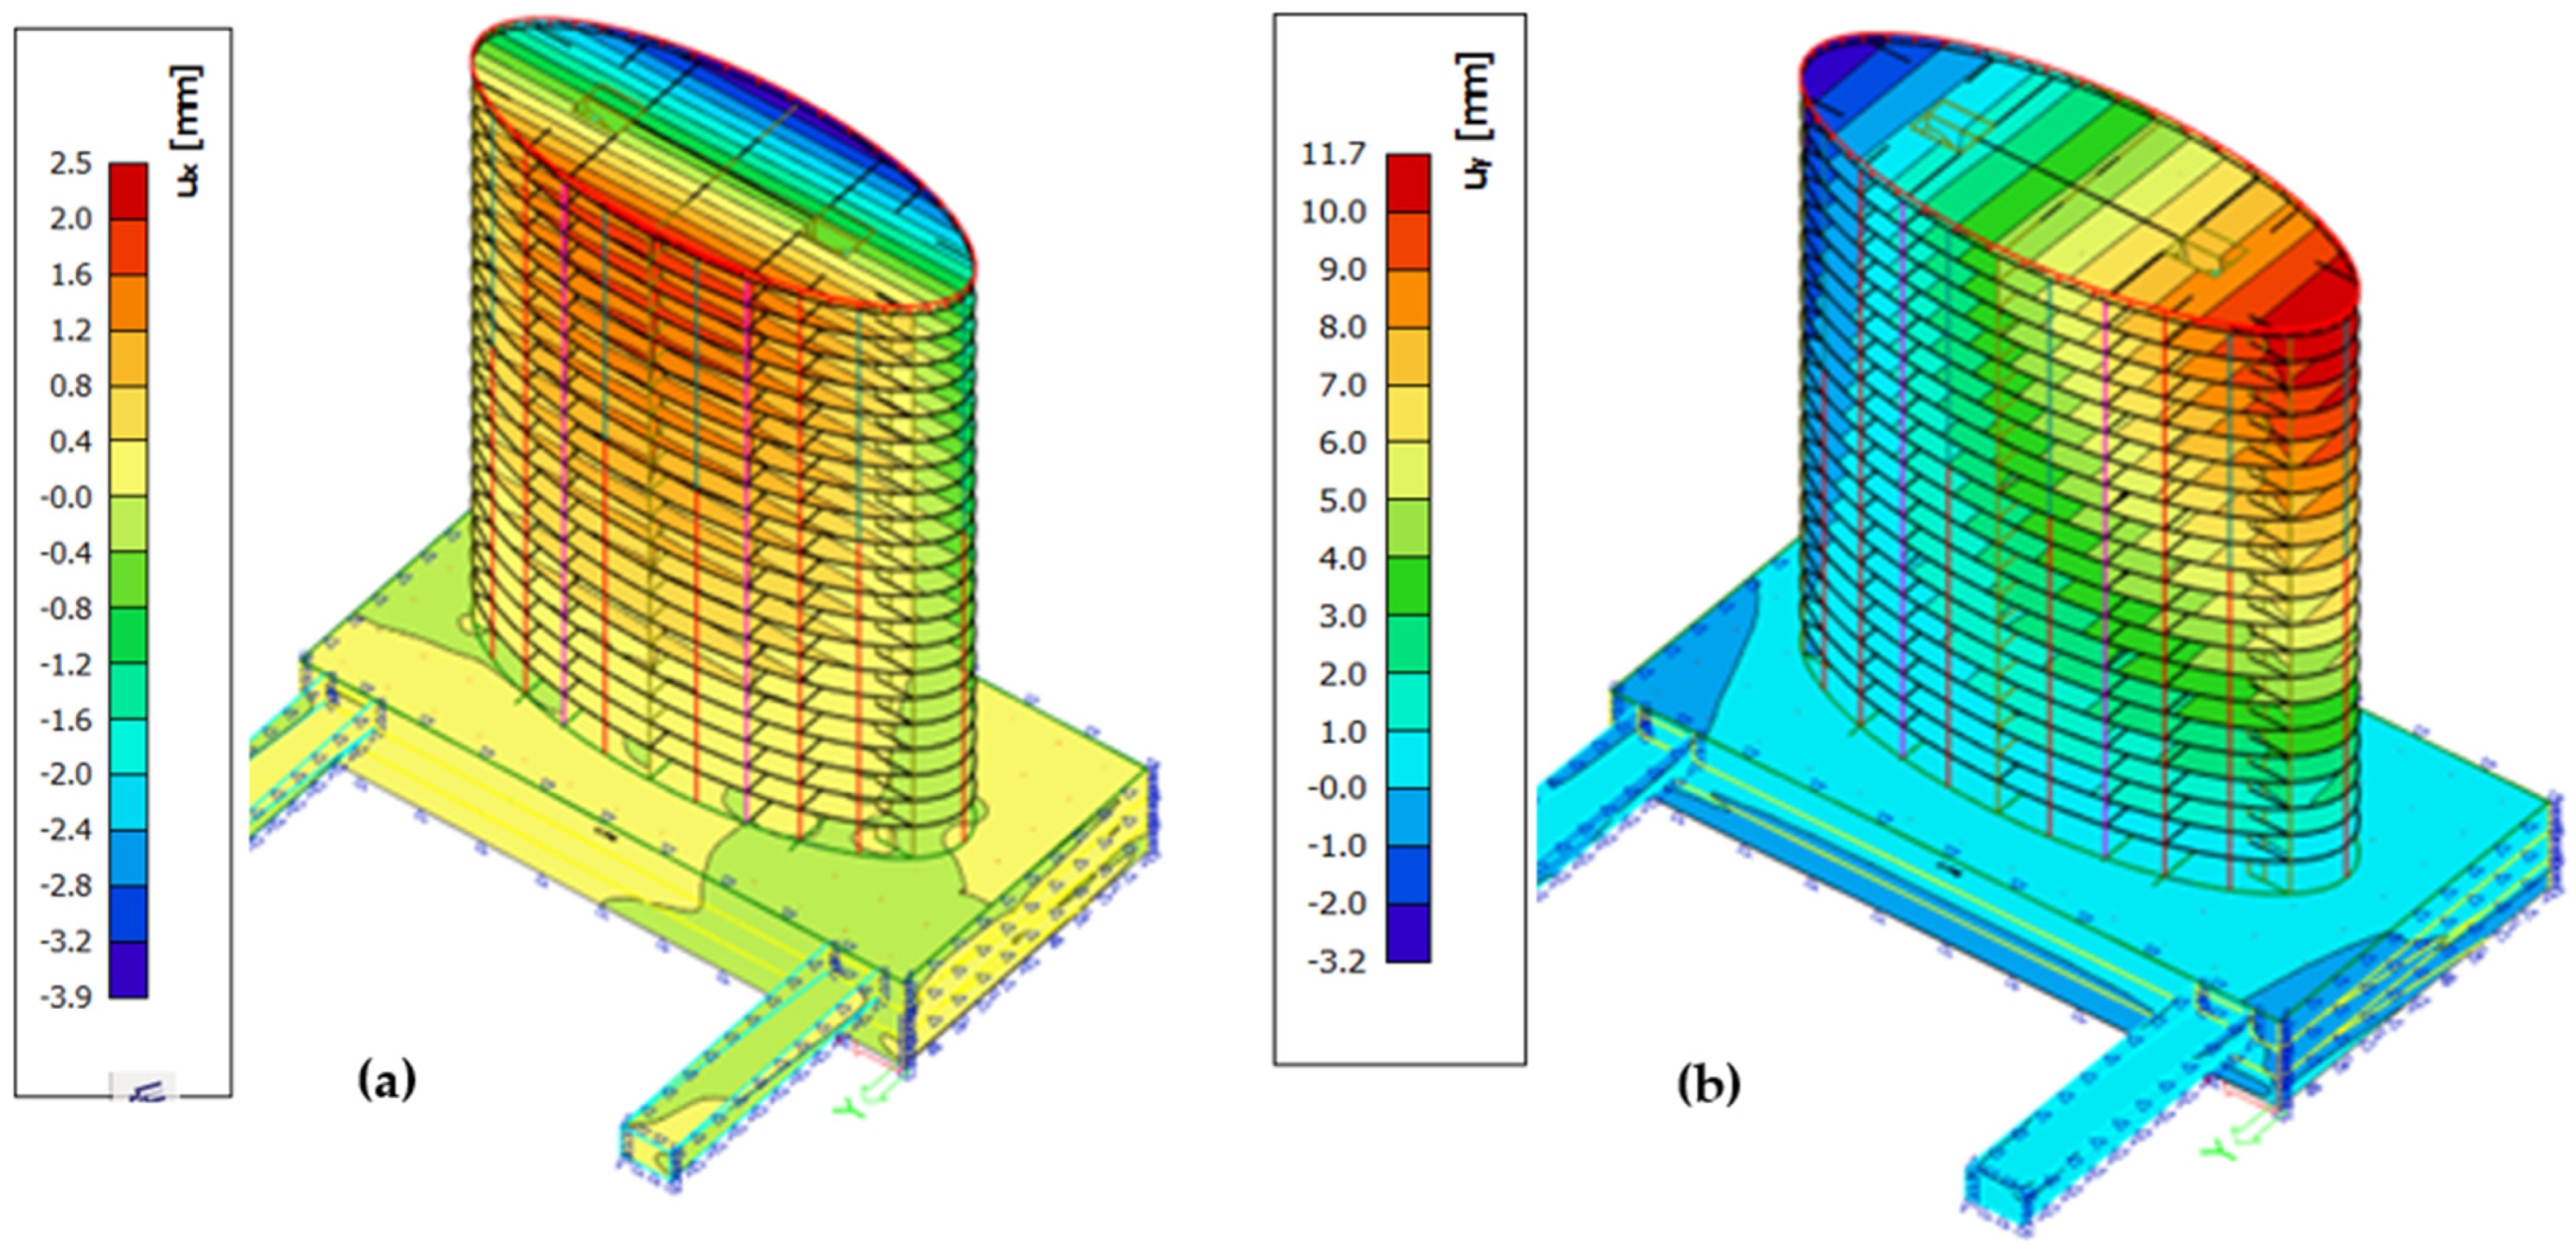
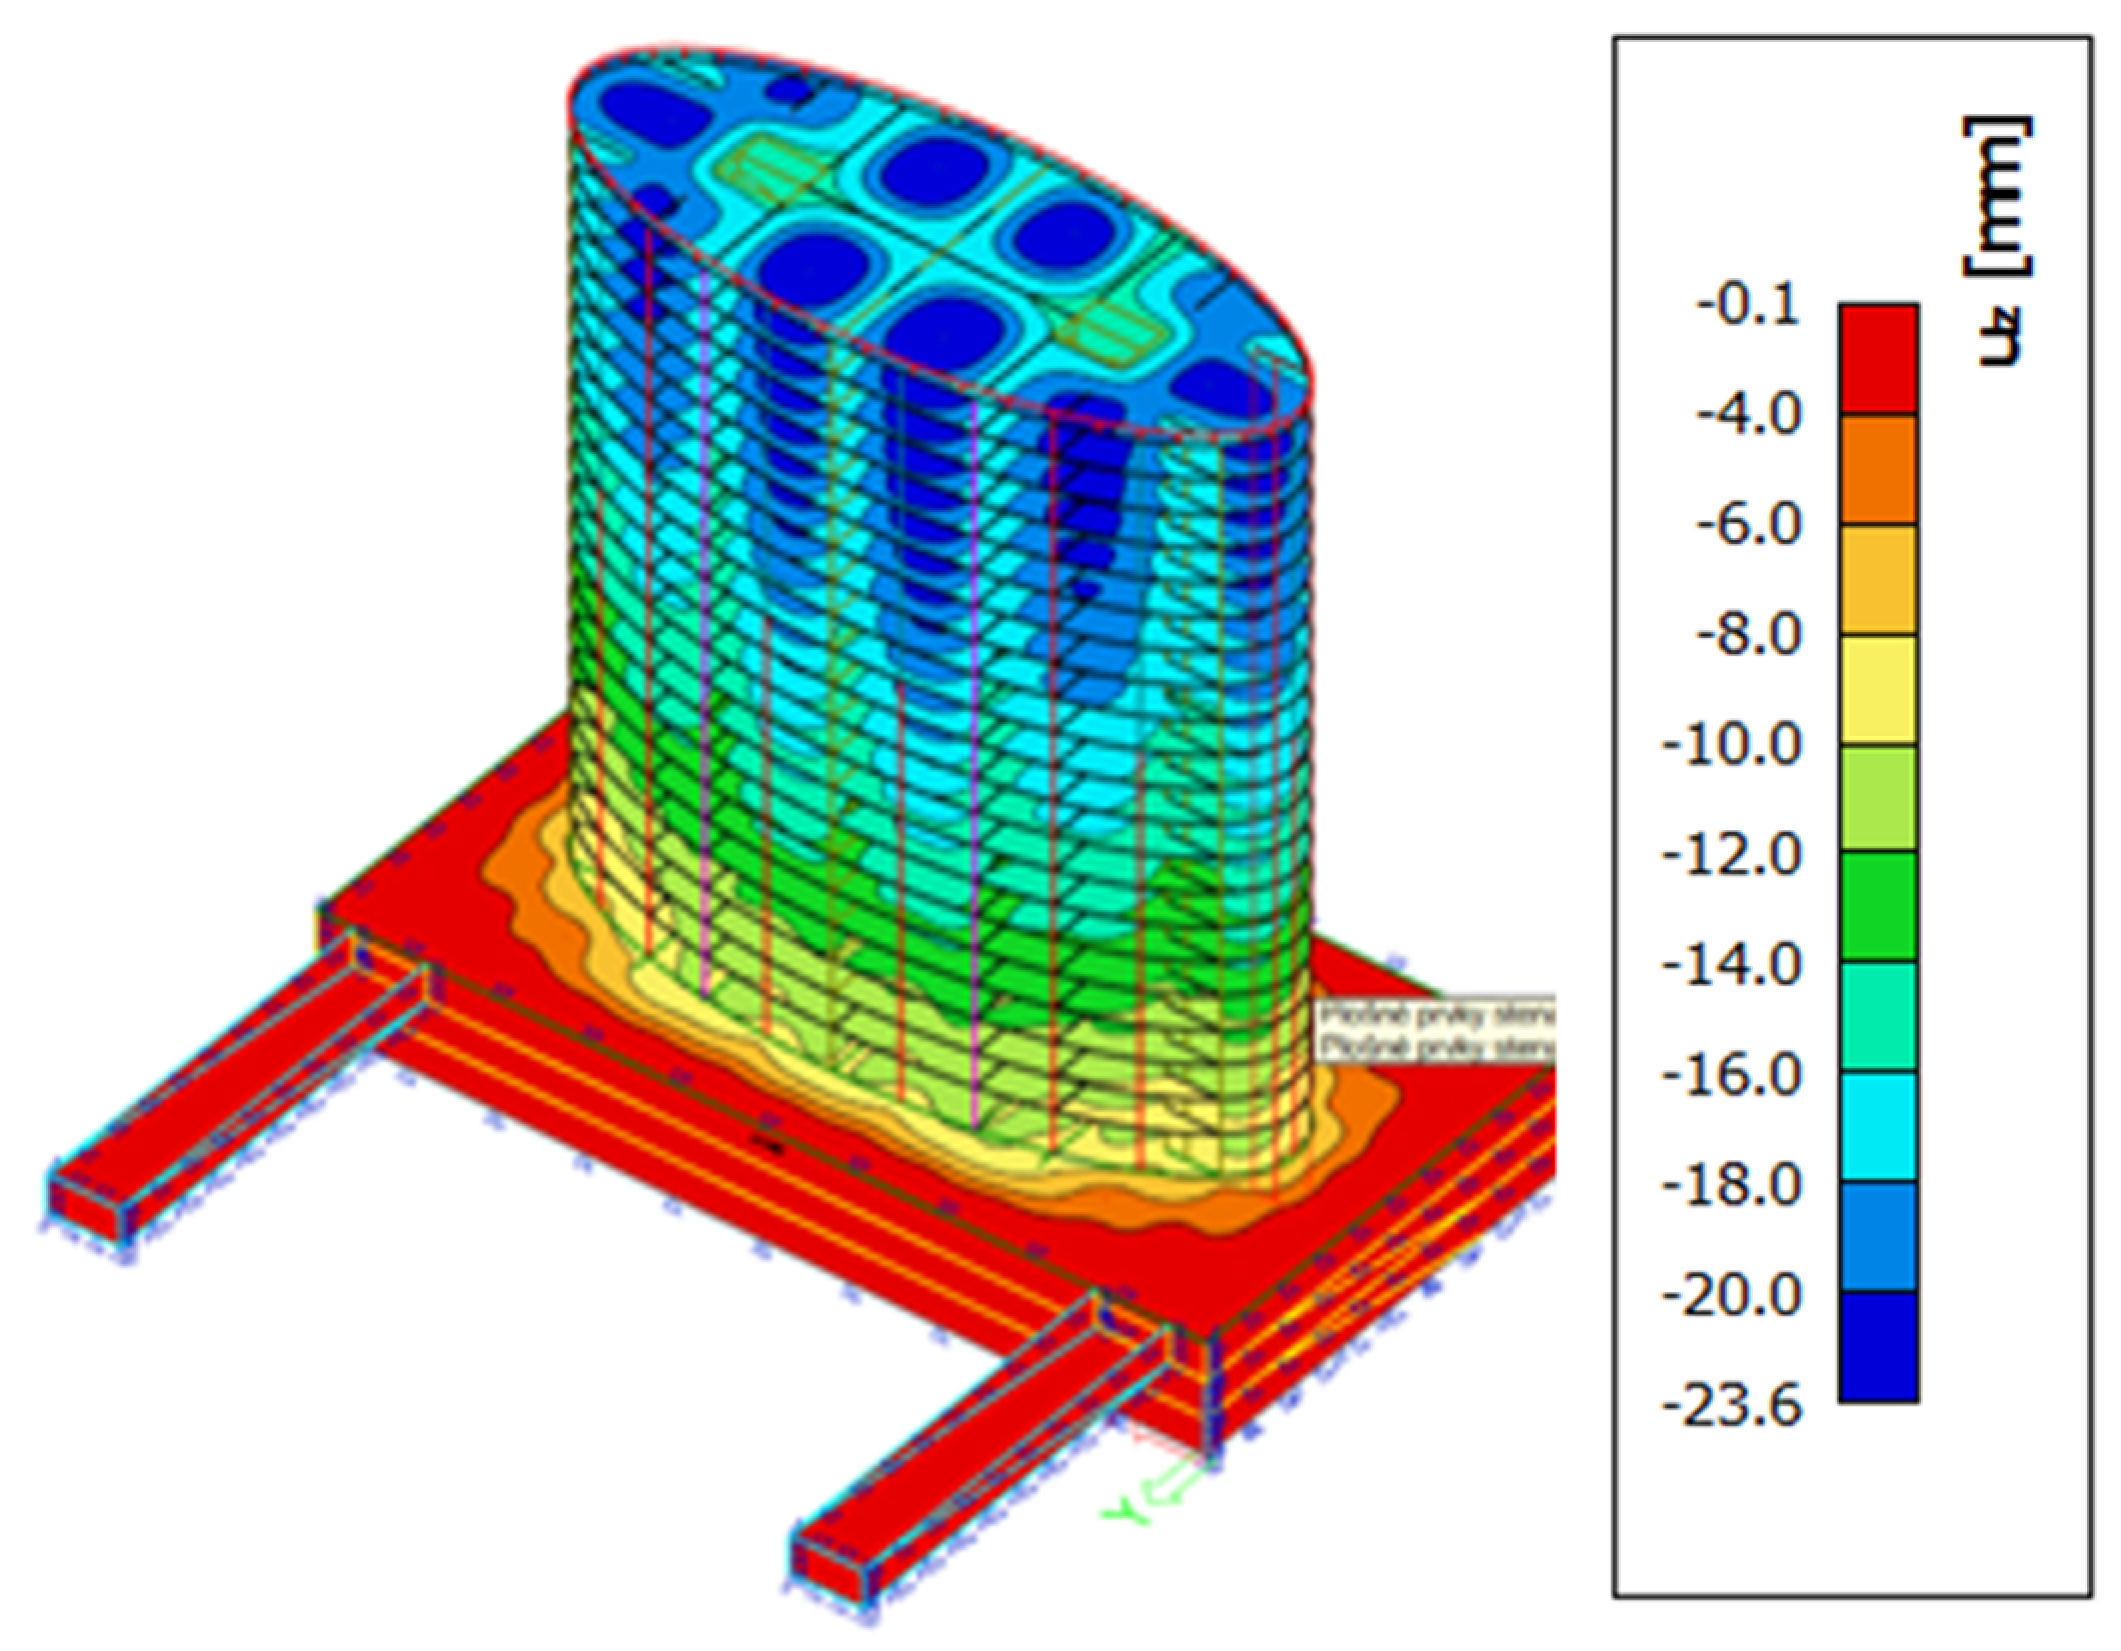
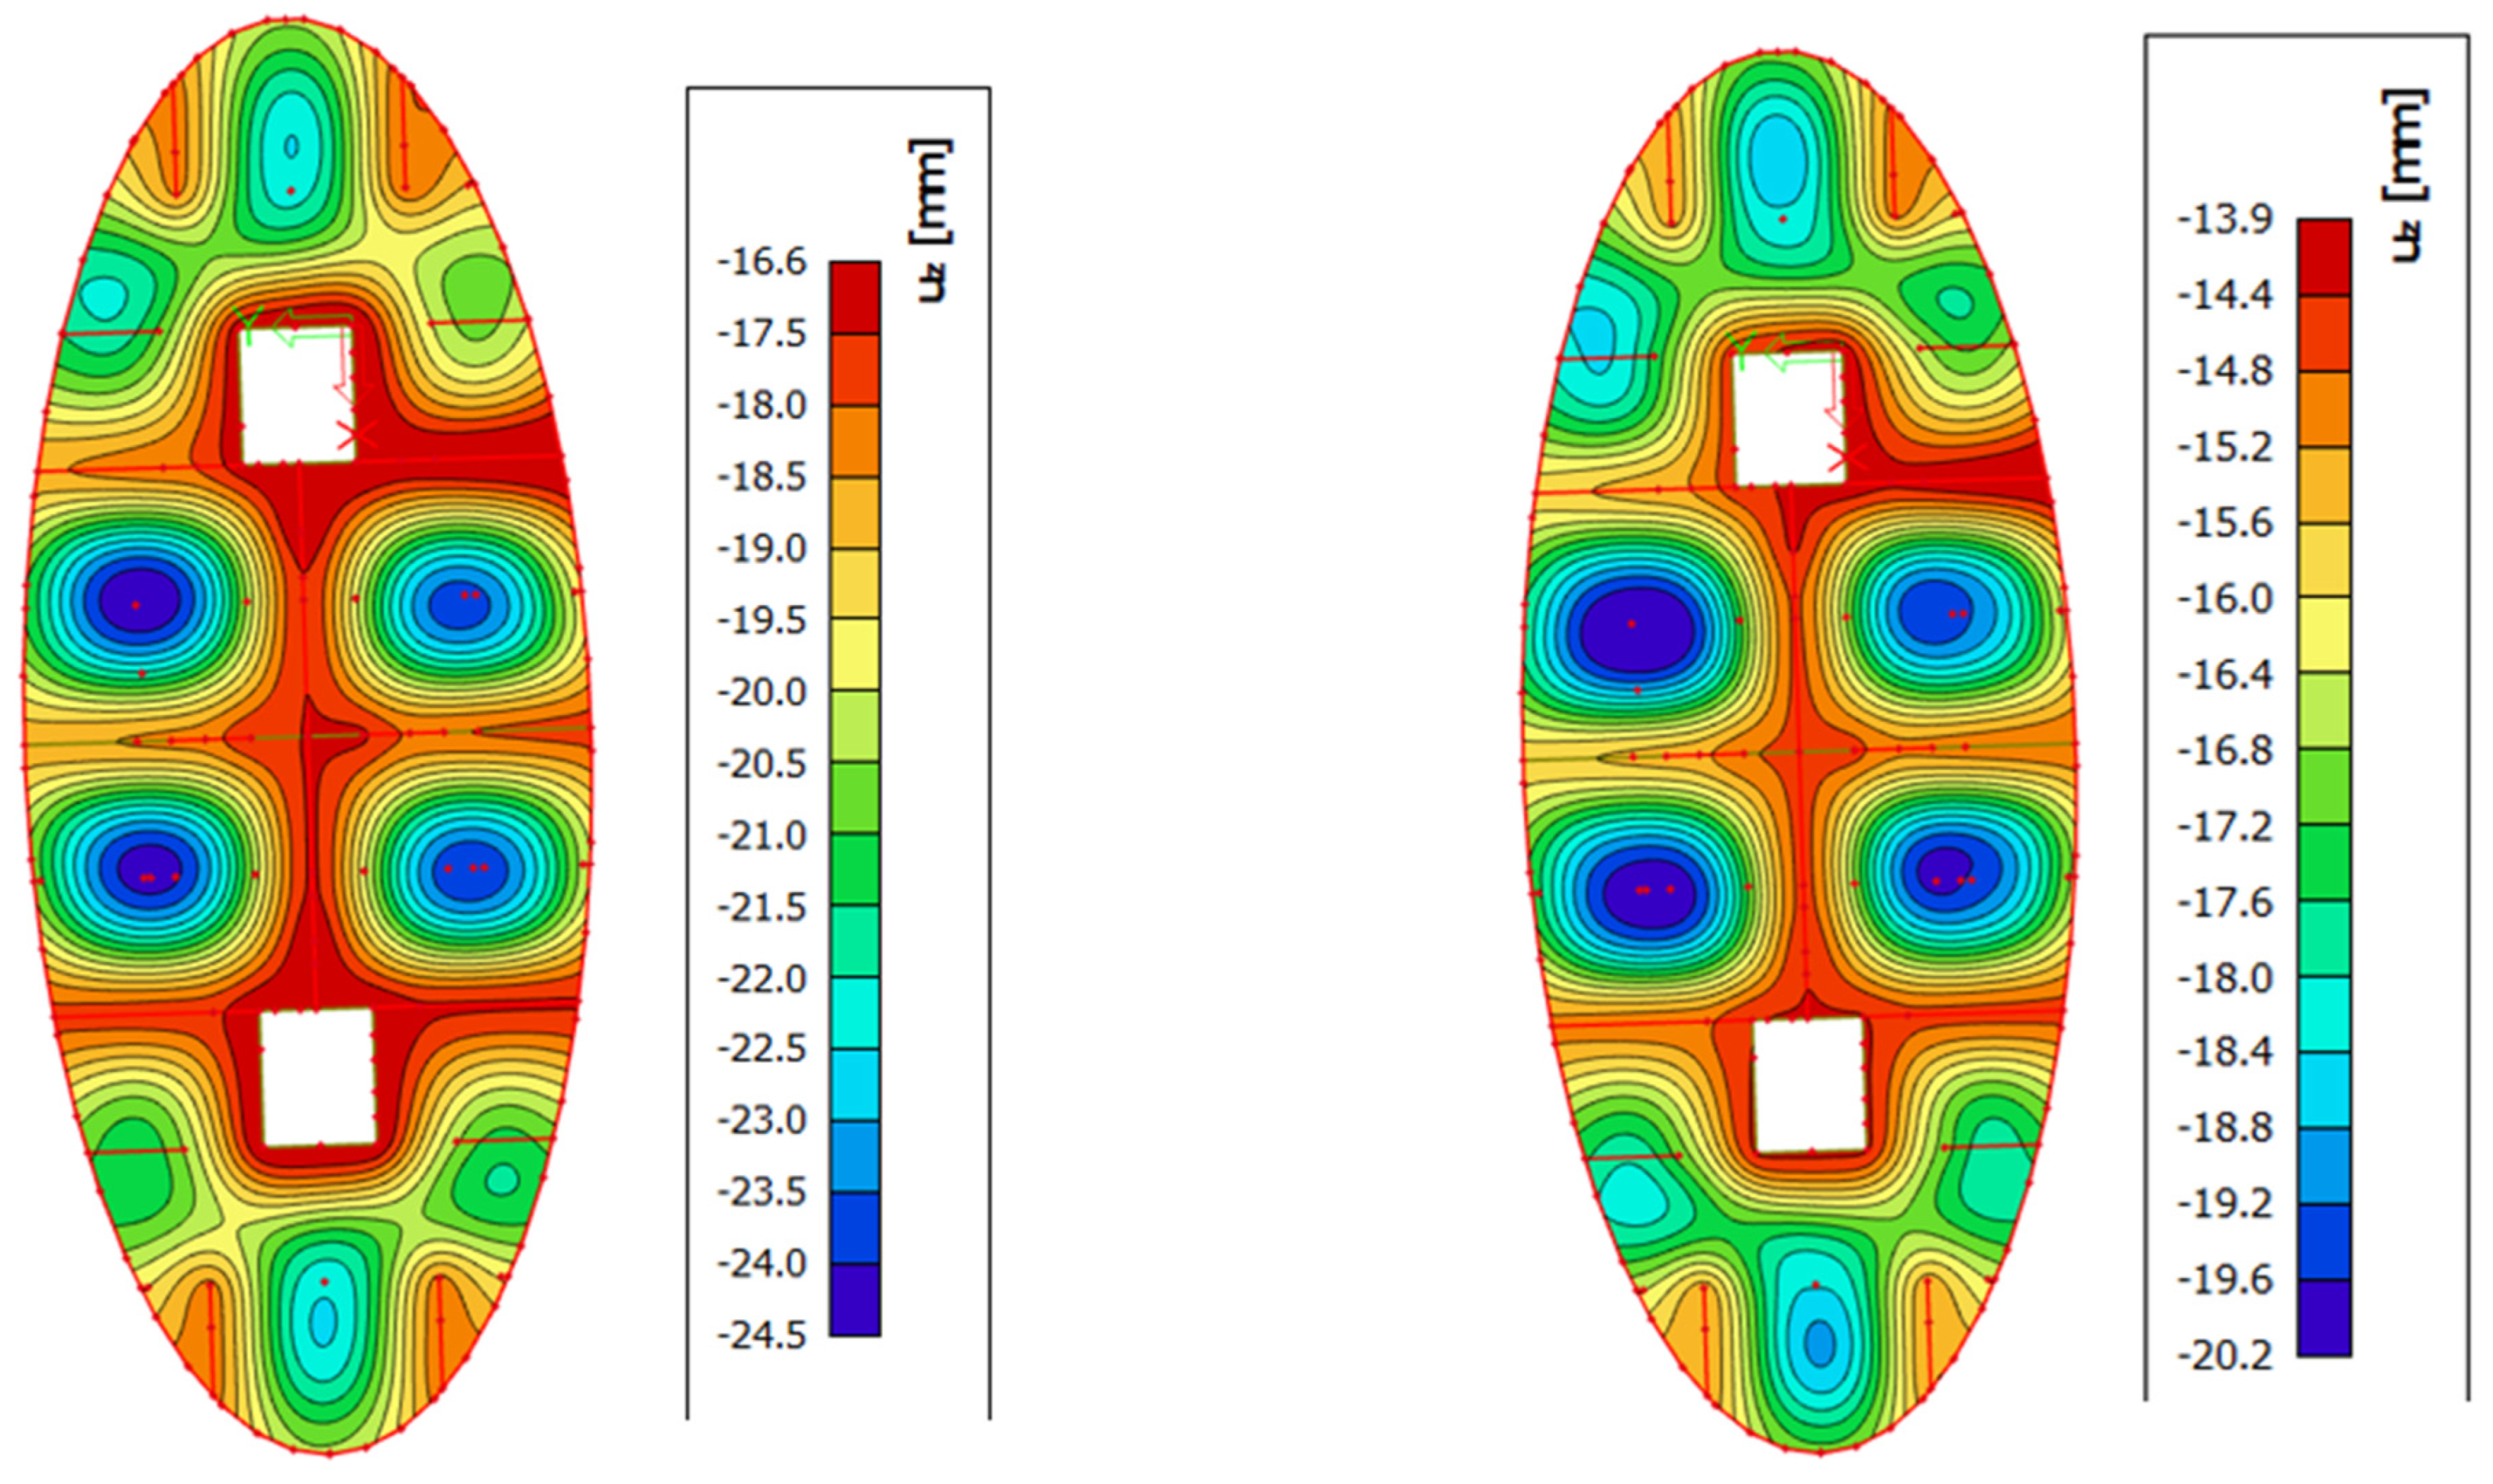
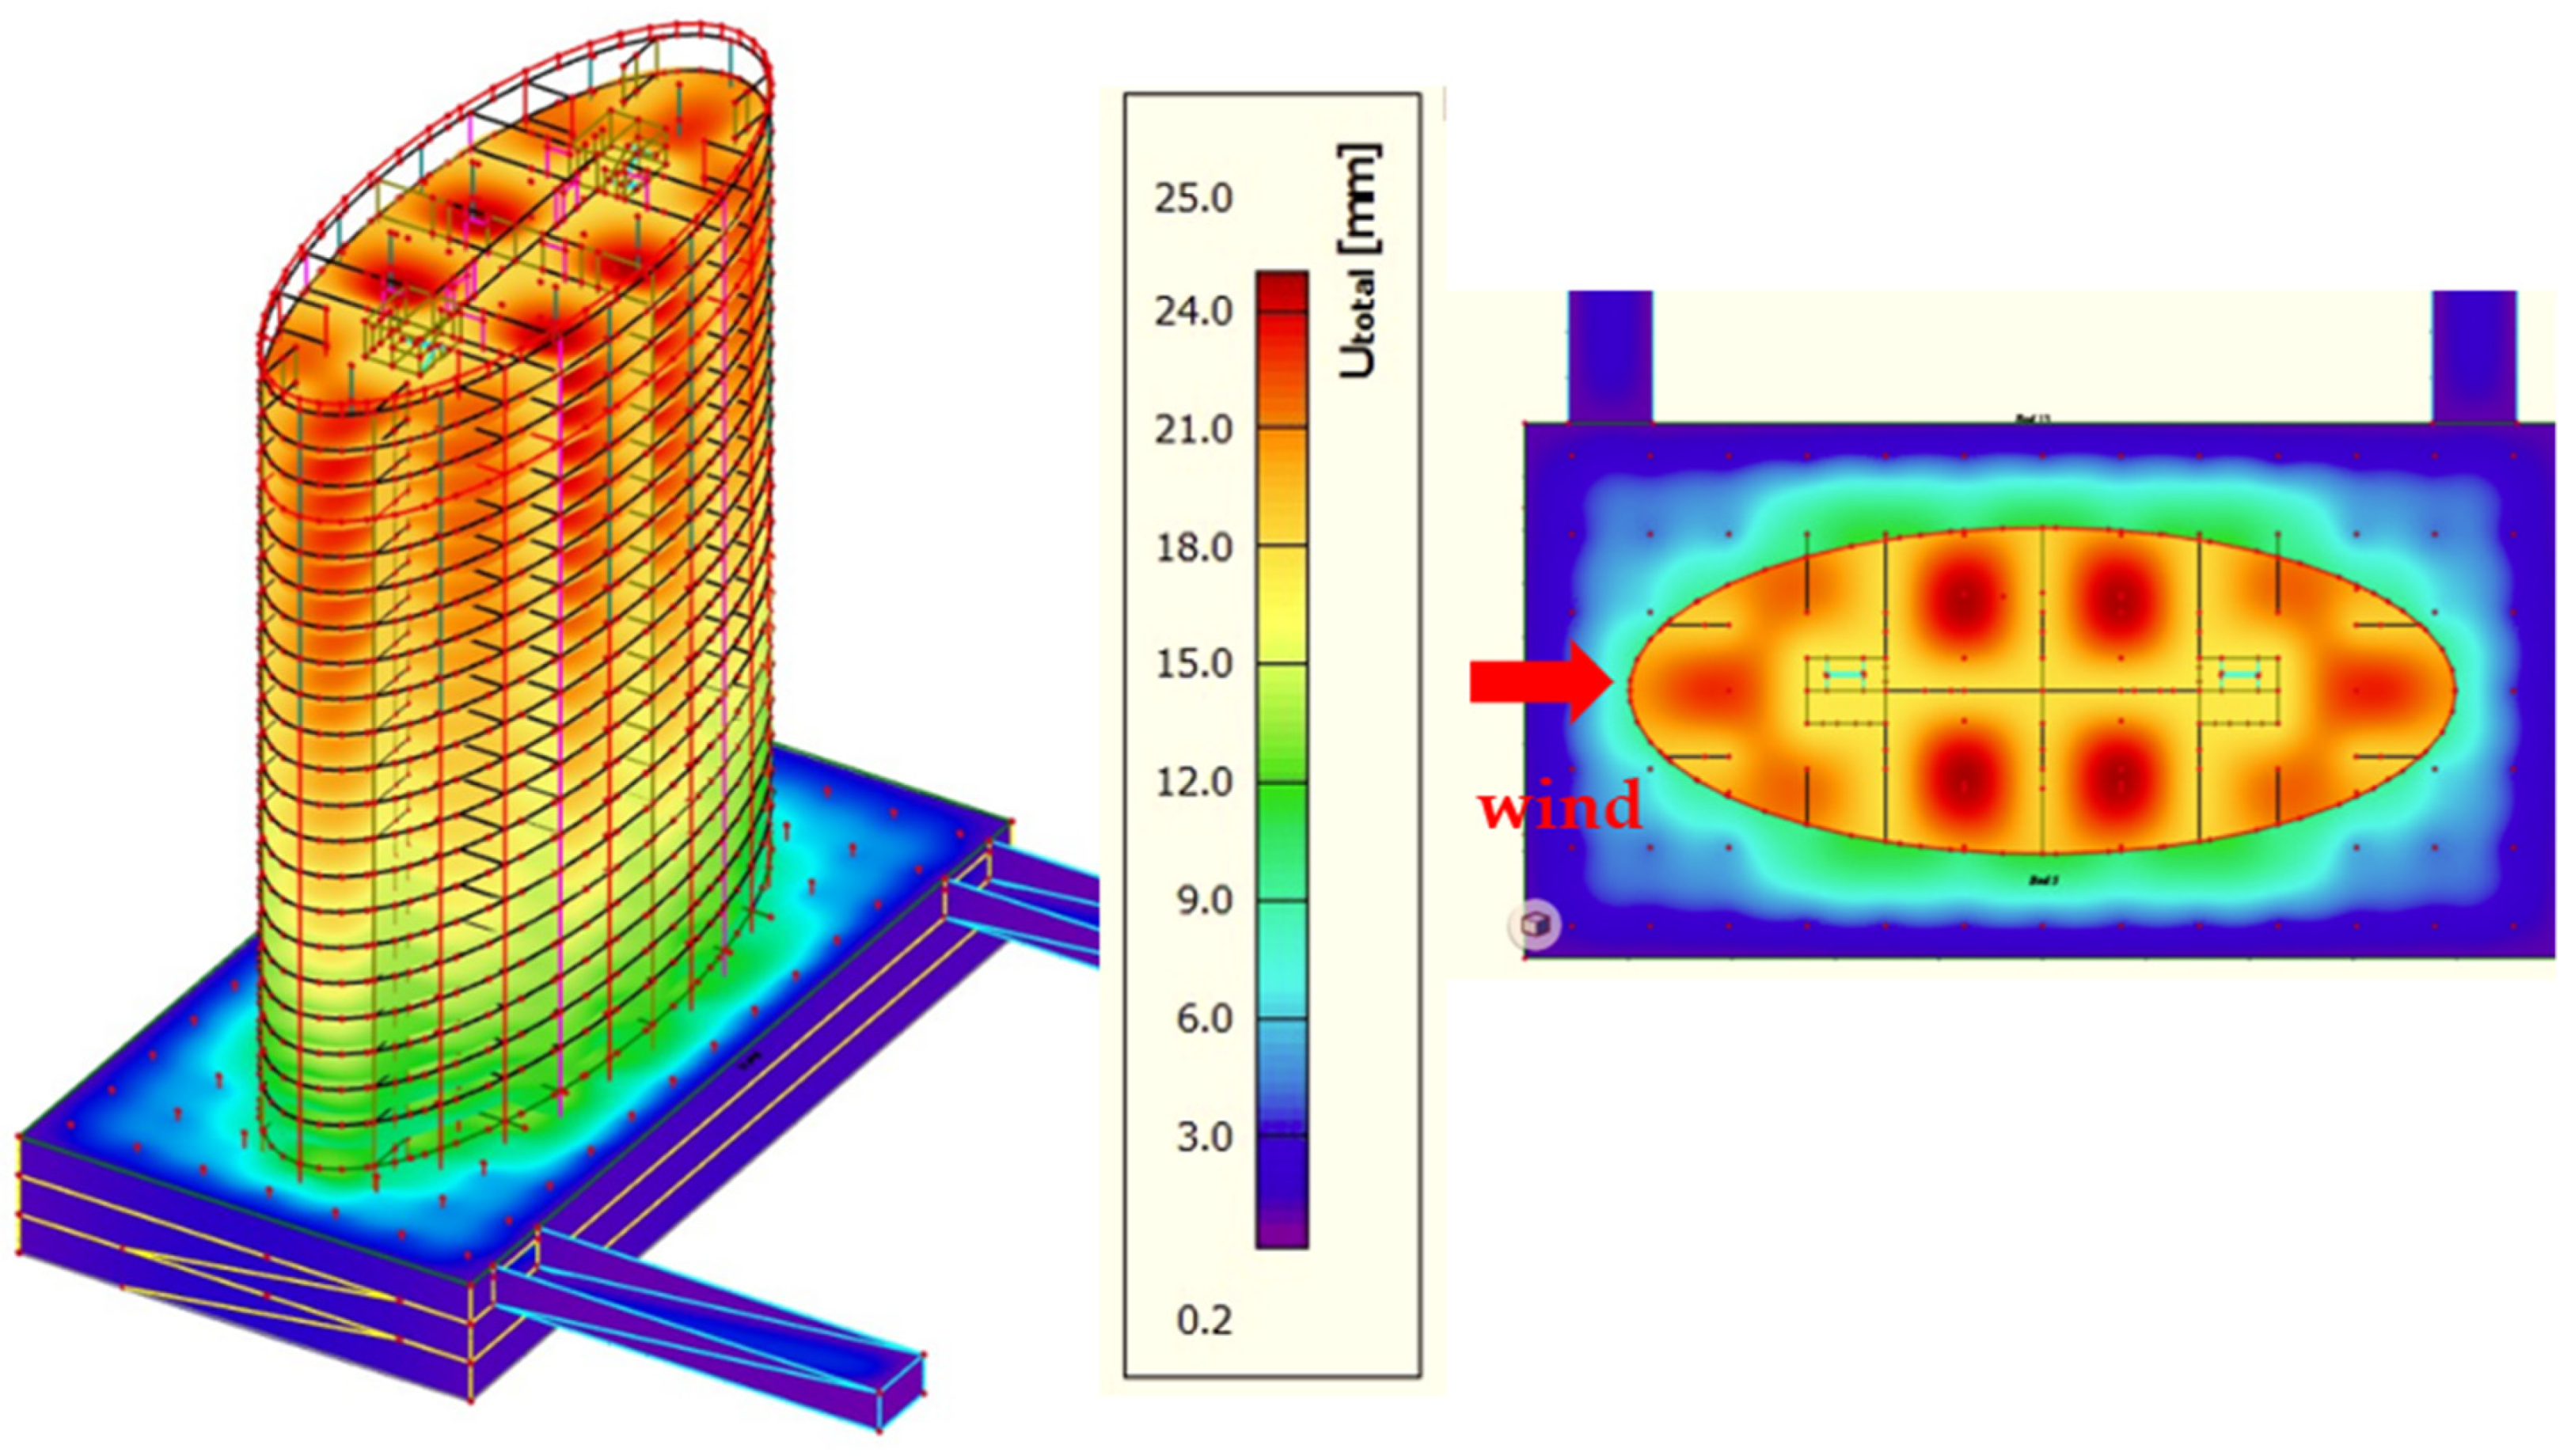
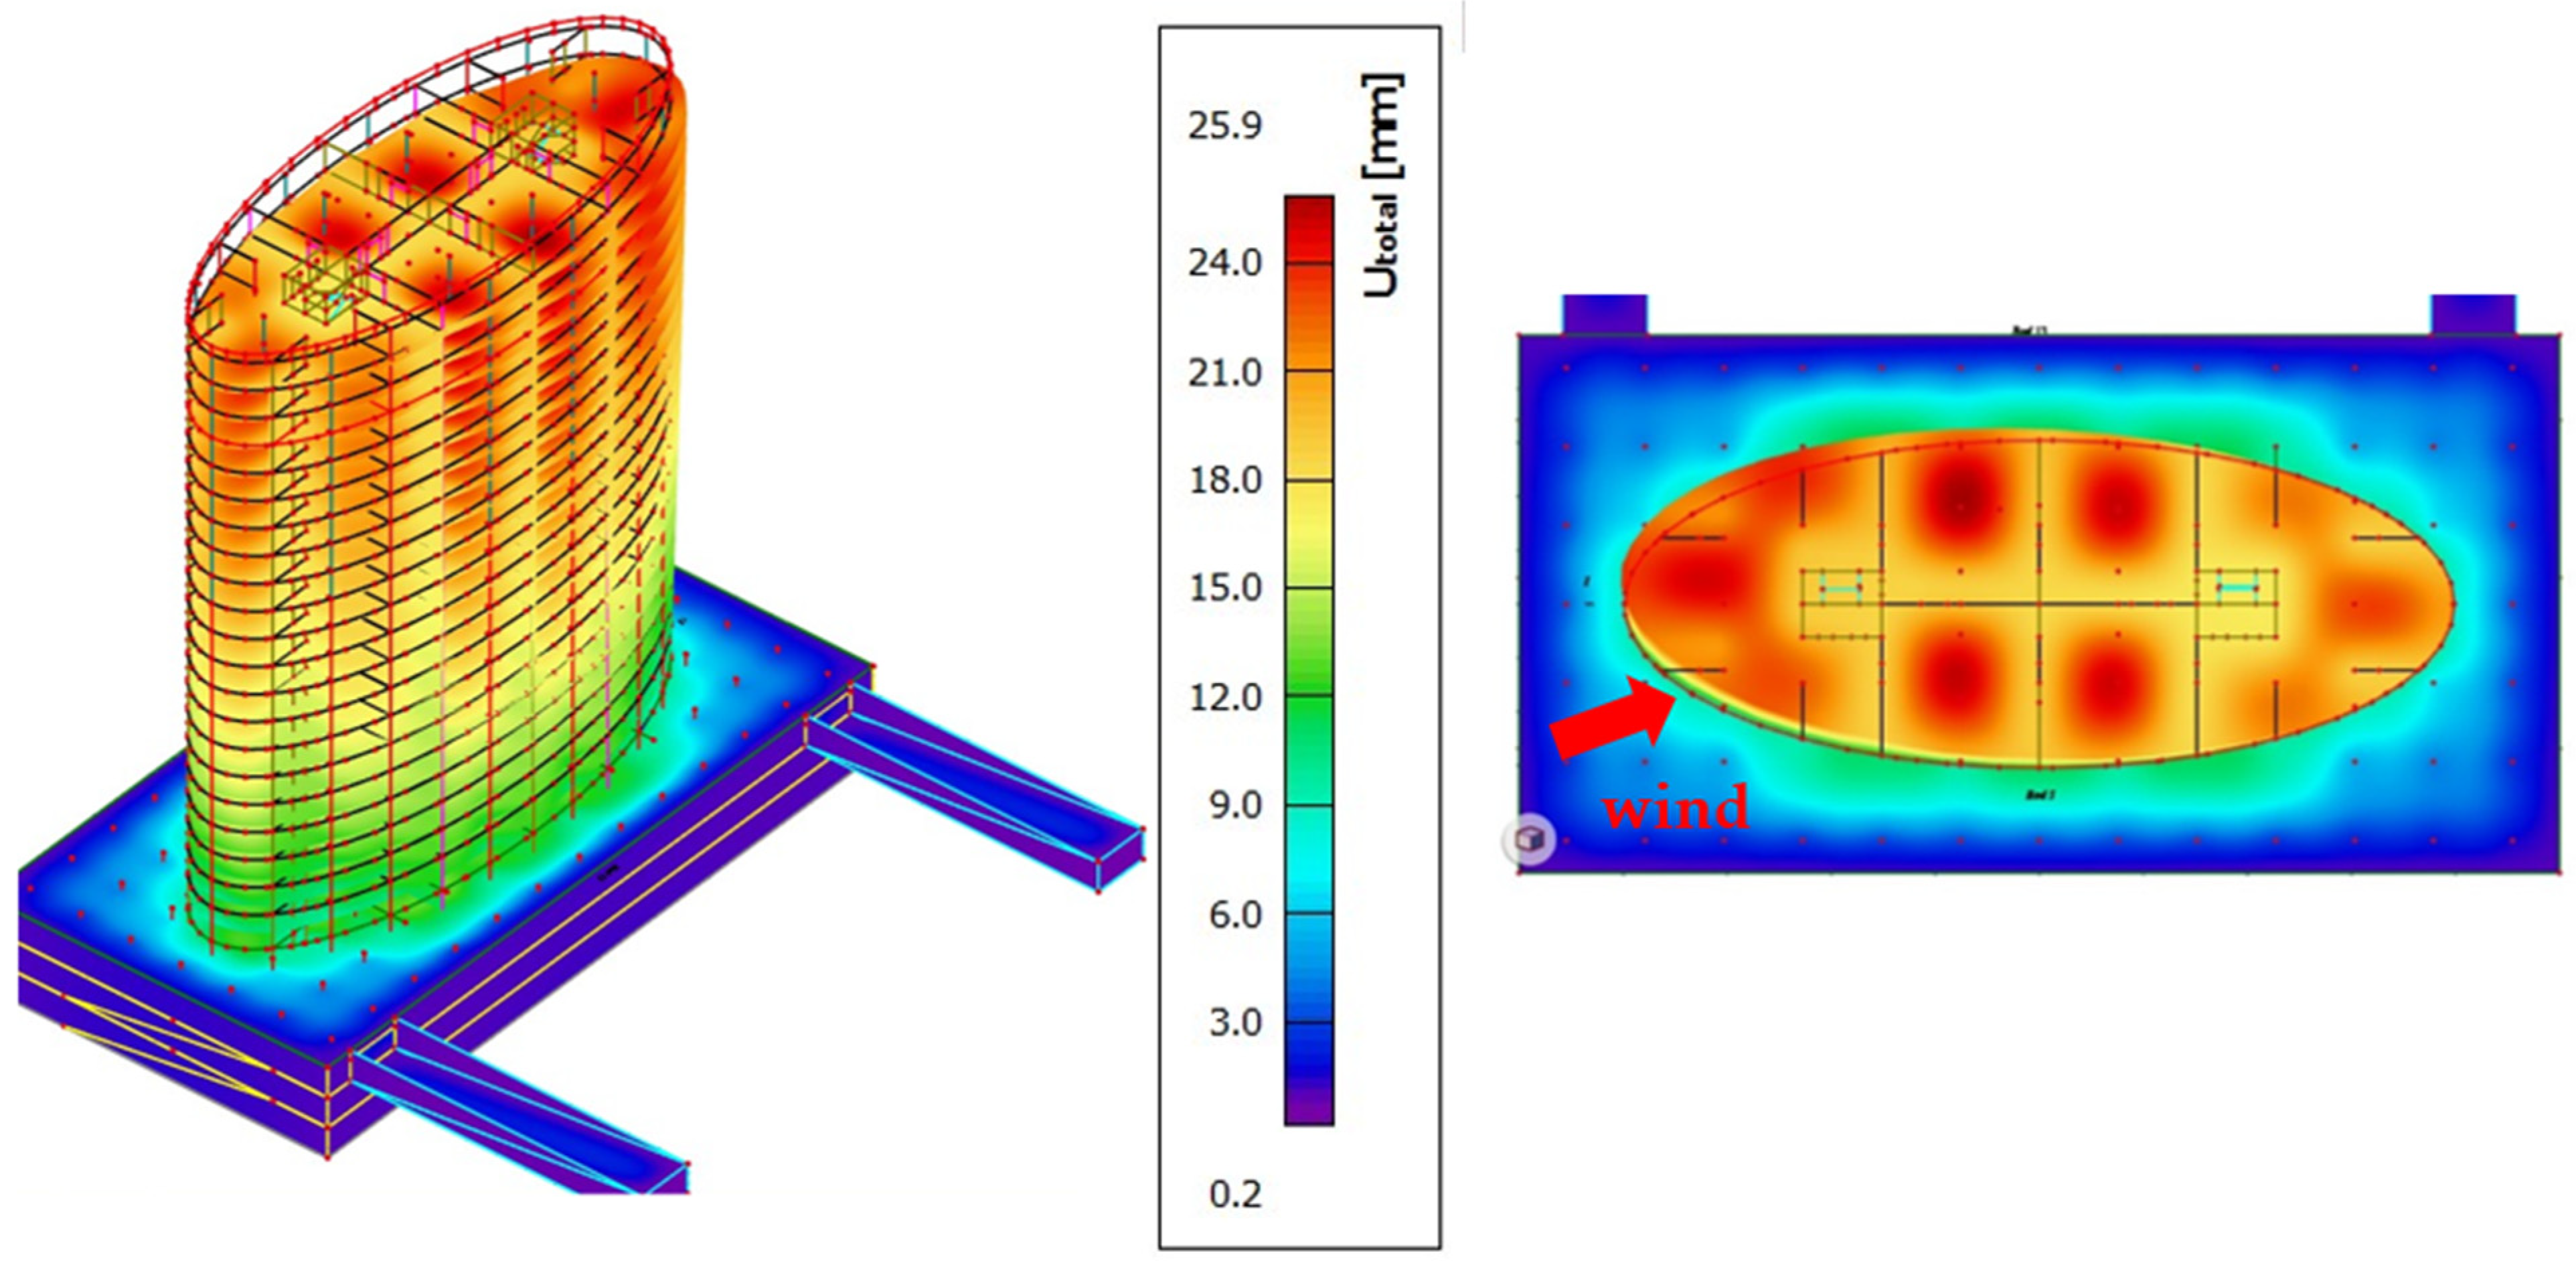
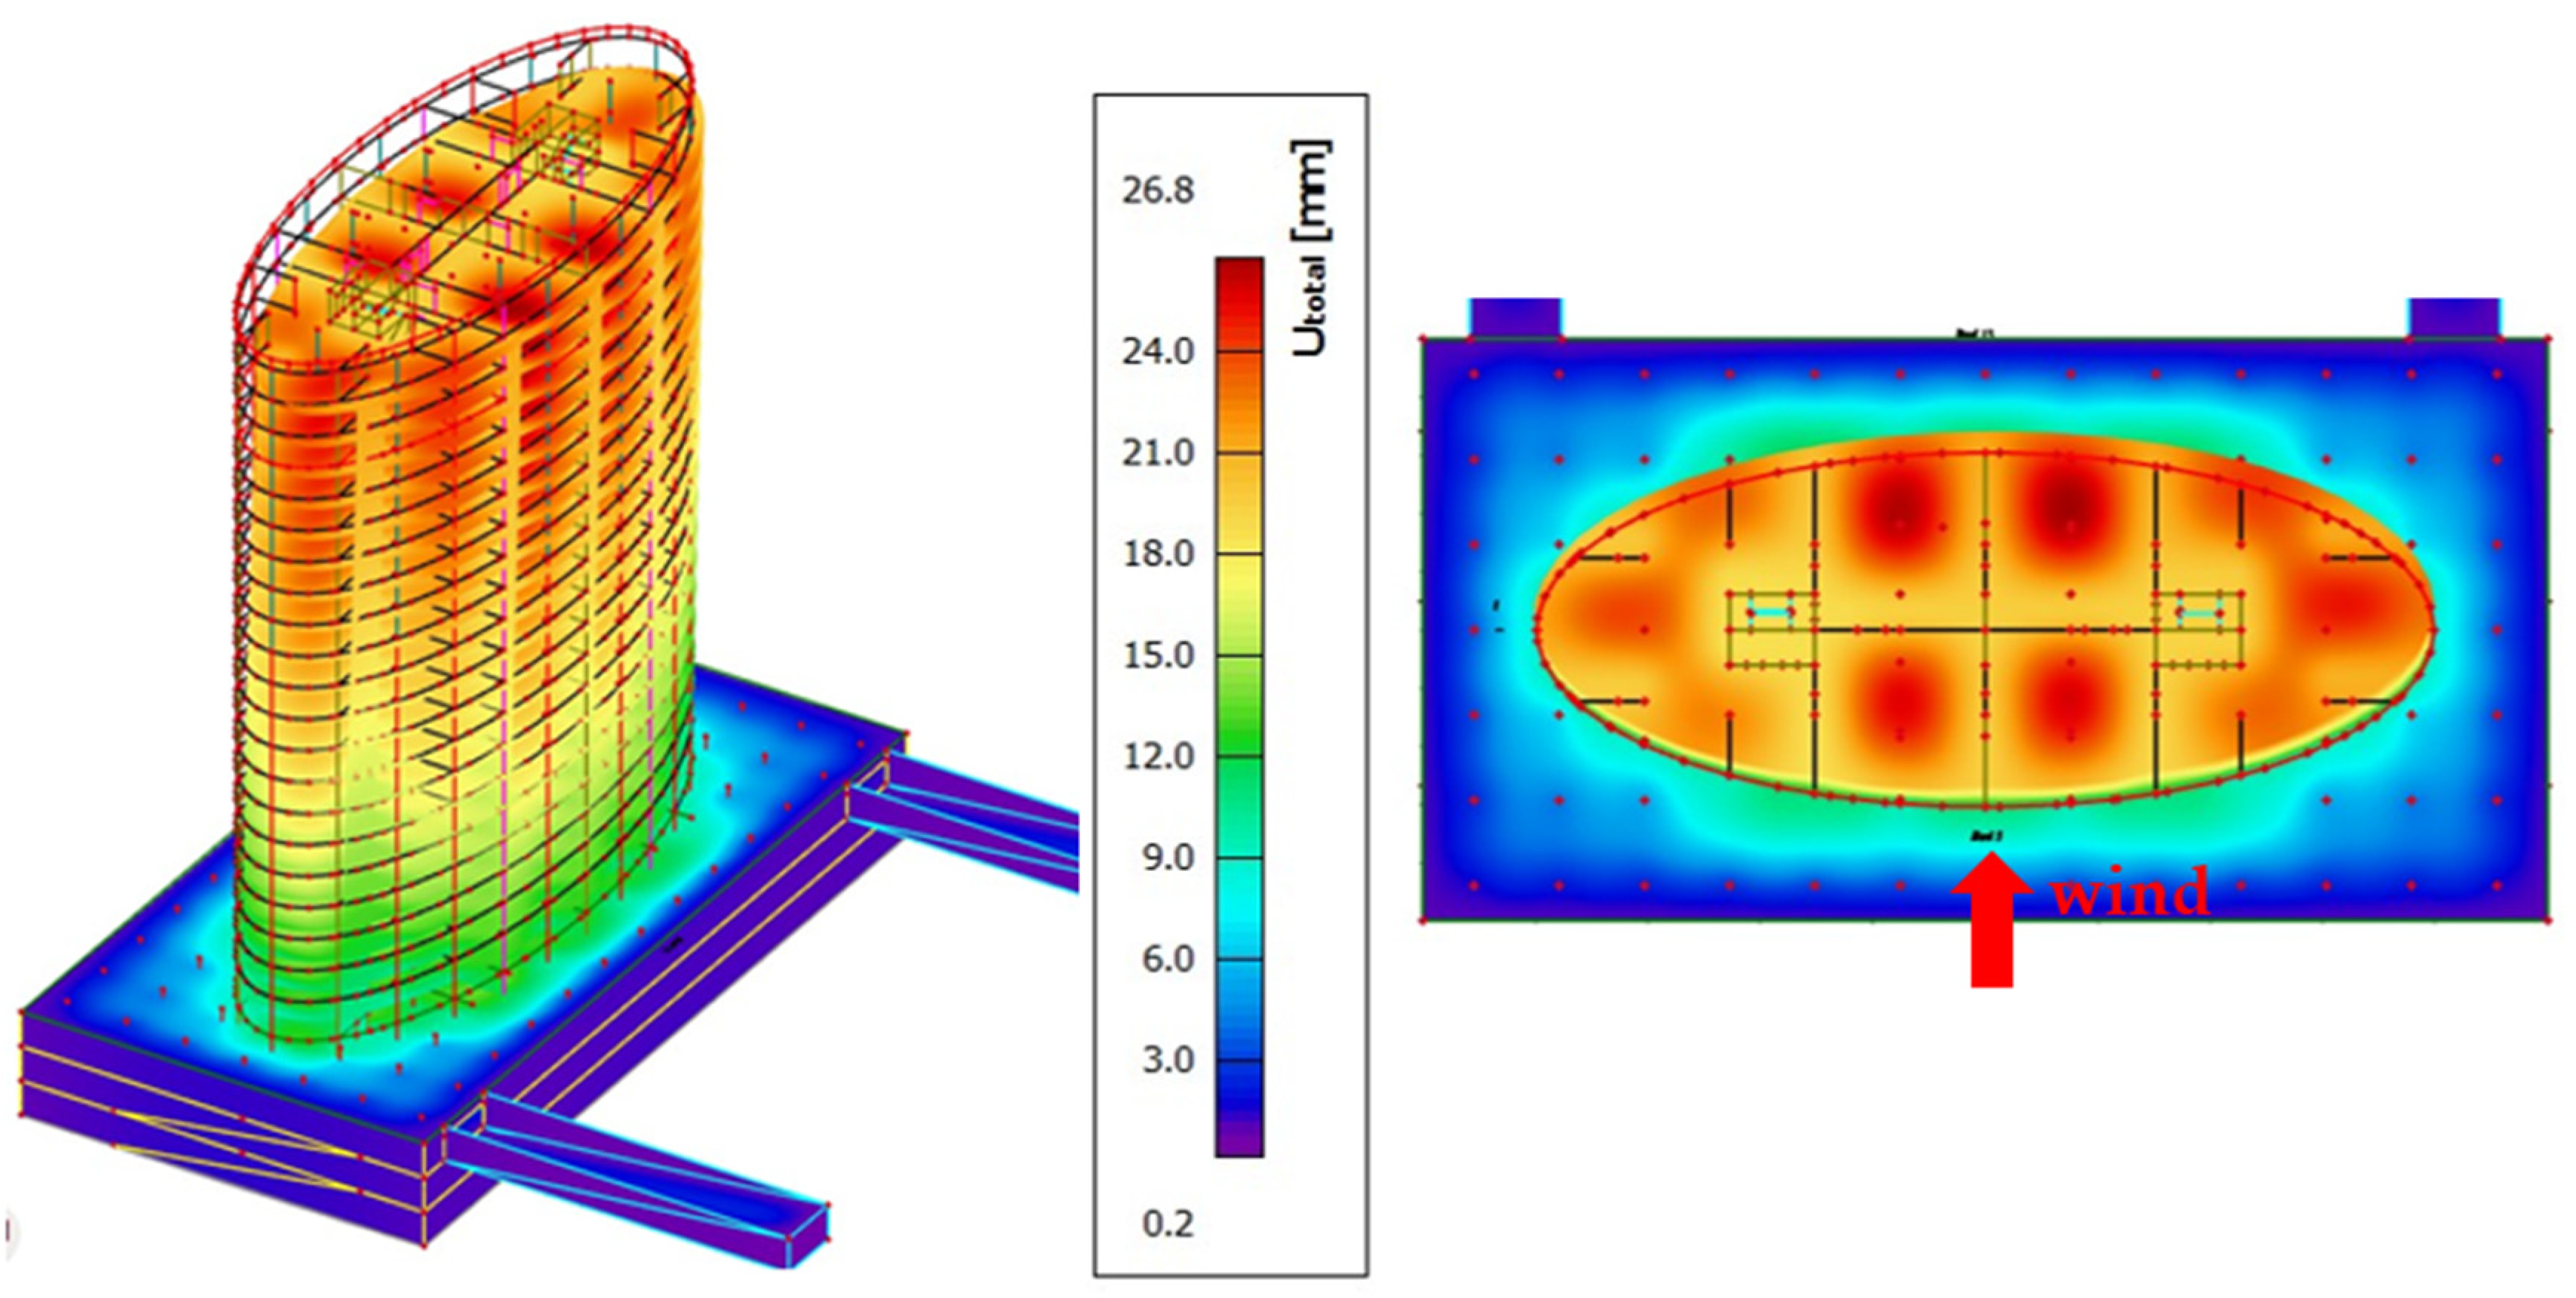
5. Results
6. Discussion
7. Conclusions
Author Contributions
Funding
Data Availability Statement
Conflicts of Interest
References
- Cresco.sk. Available online: https://www.cresco.sk/sk/projekty/rezidencne/detail/iii-veze/ (accessed on 12 April 2022). (In Slovak).
- YES IN MY BRATISLAVA. Available online: https://www.yimba.sk/narodny-futbalovy-stadion (accessed on 12 April 2022). (In Slovak).
- Officerentinfo.sk. Available online: https://www.officerentinfo.sk/article/officemarket-news/which-is-the-most-beautiful-high-rise-building-in-bratislava (accessed on 12 April 2022).
- Merrick, R.; Bitsuamlak, G. Shape effects on the wind-induced response of high-rise buildings. J. Wind. Eng. 2009, 6, 381–390. [Google Scholar]
- Zhao, D.-X.; He, B.-J. Effects of architectural shape on surface wind pressure distribution: Case studies of oval-shaped tall buildings. J. Build. Eng. 2017, 12, 219–228. [Google Scholar]
- Golasz-Szolomicka, H.; Szolomicky, J. Architectural and structural analysis of selected twisted tall buildings. Mater. Sci. Eng. 2019, 471, 052050. [Google Scholar] [CrossRef]
- Choi, J.H.; Lee, S.J. Ground effect of flow around an elliptic cylinder in a turbulent boundary layer. J. Fluids Struct. 2000, 14, 697–709. [Google Scholar] [CrossRef]
- Daichin Lee, S.J. Flow structure of the wake behind an elliptic cylinder close to a free surface. KSME Int. J. 2011, 15, 1784–1793. [Google Scholar] [CrossRef]
- Modi, V.; Wiland, E. Unsteady Aerodynamics of Stationary Elliptic Cylinders in Subcritical Flow; The University of British Columbia: Vancouver, BC, Canada, 2012. [Google Scholar] [CrossRef][Green Version]
- Shintani, K.; Umemura, A.; Takano, A. Low-Reynolds-number flow past an elliptic cylinder. J. Fluid Mech. 1983, 136, 277–289. [Google Scholar] [CrossRef]
- Johnson, S.A.; Thompson, M.C.; Hourigan, K. Predicted low frequency structures in the wake of elliptical cylinders. Eur. J. Mech. B/Fluid. 2004, 23, 229–239. [Google Scholar] [CrossRef]
- Thompson, M.C.; Radi, A.; Rao, A.; Sheridan, J.; Hourigan, K. Low-Reynolds-number wakes of elliptical cylinders: From the circular cylinder to the normal flat plate. J. Fluid Mech. 2014, 751, 570–600. [Google Scholar] [CrossRef]
- Takeuchi, T.; Maeda, J. Unsteady wind force on an elliptic cylinder subjected to a short-rise-time gust from steady flow. J. Wind. Eng. Ind. Aerod. 2013, 122, 138–145. [Google Scholar] [CrossRef]
- Sheared, G.J. Cylinders with Elliptic Cross-Section: Wake Stability with Variation in Angle of Incidence. 2007. Available online: https://sheardlab.org/assets/Sheard_iutam2007.pdf (accessed on 14 April 2022).
- Jafari, M.; Alipour, A. Aerodynamic shape optimization of rectangular and elliptical double-skin facades to mitigate wind-induced effects on tall buildings. J. Wind Eng. Ind. Aerod. 2021, 213, 104586. [Google Scholar] [CrossRef]
- Shi, X.; Alam, M.; Bai, H. Wakes of elliptical cylinders at low Reynolds number. Int. J. Heat Fluid Flow 2020, 82, 108553. [Google Scholar]
- Meleka, N.; Hekal, G.; Rizk, A. Comparative study on static and dynamic analysis of structures. Eng. Res. J. 2016, 39, 277–283. Available online: https://erjm.journals.ekb.eg/article_66395_519e40b715e2db7ef633797cde5338b9.pdf (accessed on 18 April 2022).
- STN EN 1992-1-1 Eurocode 2; Design of Concrete Structures. Part 1: General Rules and Rules for Buildings. CEN: Brussels, Belgium, 2004.
- STN EN 1998-1 Eurocode 8; Design of Structures for Earthquake Resistance. Part 1: General Rules, Seismic Actions and Rules for Buildings. CEN: Brussels, Belgium, 2005.
- STN EN 1991-1-4 Eurocode 1; Actions on Structures. Part 1-4: General Actions. Wind Actions. CEN: Brussels, Belgium, 2007.
- STN EN 1991-1-4/NA Eurocode 1; Actions on Structures. Part 1-4: General Actions. Wind Actions. National Annex. CEN: Brussels, Belgium, 2007. (In Slovak)
- Hubová, O.; Konečná, L.; Lobotka, P. Determination of the Most Suitable Place in Cross-Section of BLWT Tunnel for Calibration of Measuring Devices. In Proceedings of the 6th International Scientific Conference Dynamics of Civil Engineering and Transport Structures and Wind Engineering DYN-WIND, Žilina, Slovakia, 26–29 May 2014; pp. 86–89. [Google Scholar]
- Franek, M.; Konečná, L.; Hubová, O.; Žilinský, J. Experimental pressure measurement on elliptic cylinder. Appl. Mech. Mater. 2016, 820, 332–337. [Google Scholar] [CrossRef]
- Bearman, P.W. On vortex shedding from a circular cylinder in the critical Reynolds number regime. J. Fluid Mech. 1969, 37, 577–585. [Google Scholar] [CrossRef]
- Gu, Z.F.; Sun, T.F. On interference between two circular cylinders in staggered arrangement at high subcritical Reynolds numbers. J. Wind Eng. Ind. Aerod. 1999, 80, 287–309. [Google Scholar] [CrossRef]
- Wu, G.; Du, X.; Wang, Y. LES of flow around two staggered circular cylinders at a high subcritical Reynolds number of 1.4 × 10⁵. J. Wind Eng. Ind. Aerod. 2020, 196, 104044. [Google Scholar] [CrossRef]
- Franek, M.; Macák, M.; Žilinský, J. CFD evaluation of boundary layer and wind loads on elliptic cylinder. In Proceedings of the 4th International Conference on Applied Technology—ATF, Leuven, Belgium, 15–17 September 2016; pp. 112–117, ISBN 9789086497966. [Google Scholar]
- STN EN 1991-1-1 Eurocode 1; Actions on Structures. Part 1-1: General Actions. Densities, Self-Weight, Imposed Loads for Buildings. CEN: Brussels, Belgium, 2007.
- STN EN 1991-1-1/NA Eurocode 1; Actions on Structures. Part 1-1: General Actions. Densities, Self-Weight, Imposed Loads for Buildings. National Annax. CEN: Brussels, Belgium, 2004.
- STN EN 1991-1-3 Eurocode 1; Actions on Structures. Part 1-1: General Actions. Snow Loads. CEN: Brussels, Belgium, 2007.
- STN EN 1991-1-3/NA1 Eurocode 1; Actions on Structures. Part 1-1: General Actions. Snow Loads. National Annex. CEN: Brussels, Belgium, 2007.
- Jendželovský, N. The Modelling of Foundations by Finite Element Method, 1st ed.; STU Publishing House: Bratislava, Slovakia, 2009. (In Slovak) [Google Scholar]
- Frankovská, J.; Súľovská, M.; Turček, P. The Foundation of Structures. Background Papers for Design of Foundations, 1st ed.; STU Publishing House: Bratislava, Slovakia, 2011. (In Slovak) [Google Scholar]
- Turček, P.; Hulla, J. The Foundation of Structures, 2nd ed.; Jaga Group: Bratislava, Slovakia, 2004. (In Slovak) [Google Scholar]
- STN EN 1997-1 Eurocode 7; Geotechnical Desing. Part 1: General Rules. CEN: Brussels, Belgium, 2005.
- Harvan, I. Resistance of the Tall and Super-Tall Building on the Wind Effects and Effects of Earthquakes. ABS, 2011. Available online: https://www.asb.sk/stavebnictvo/odolnost-vysokych-asupervysokych-budov-proti-ucinkom-vetra-azemetraseni (accessed on 20 May 2022). (In Slovak).


| Measuring Point (-) | Mean Values | “Envelope of the Data” | ||||
|---|---|---|---|---|---|---|
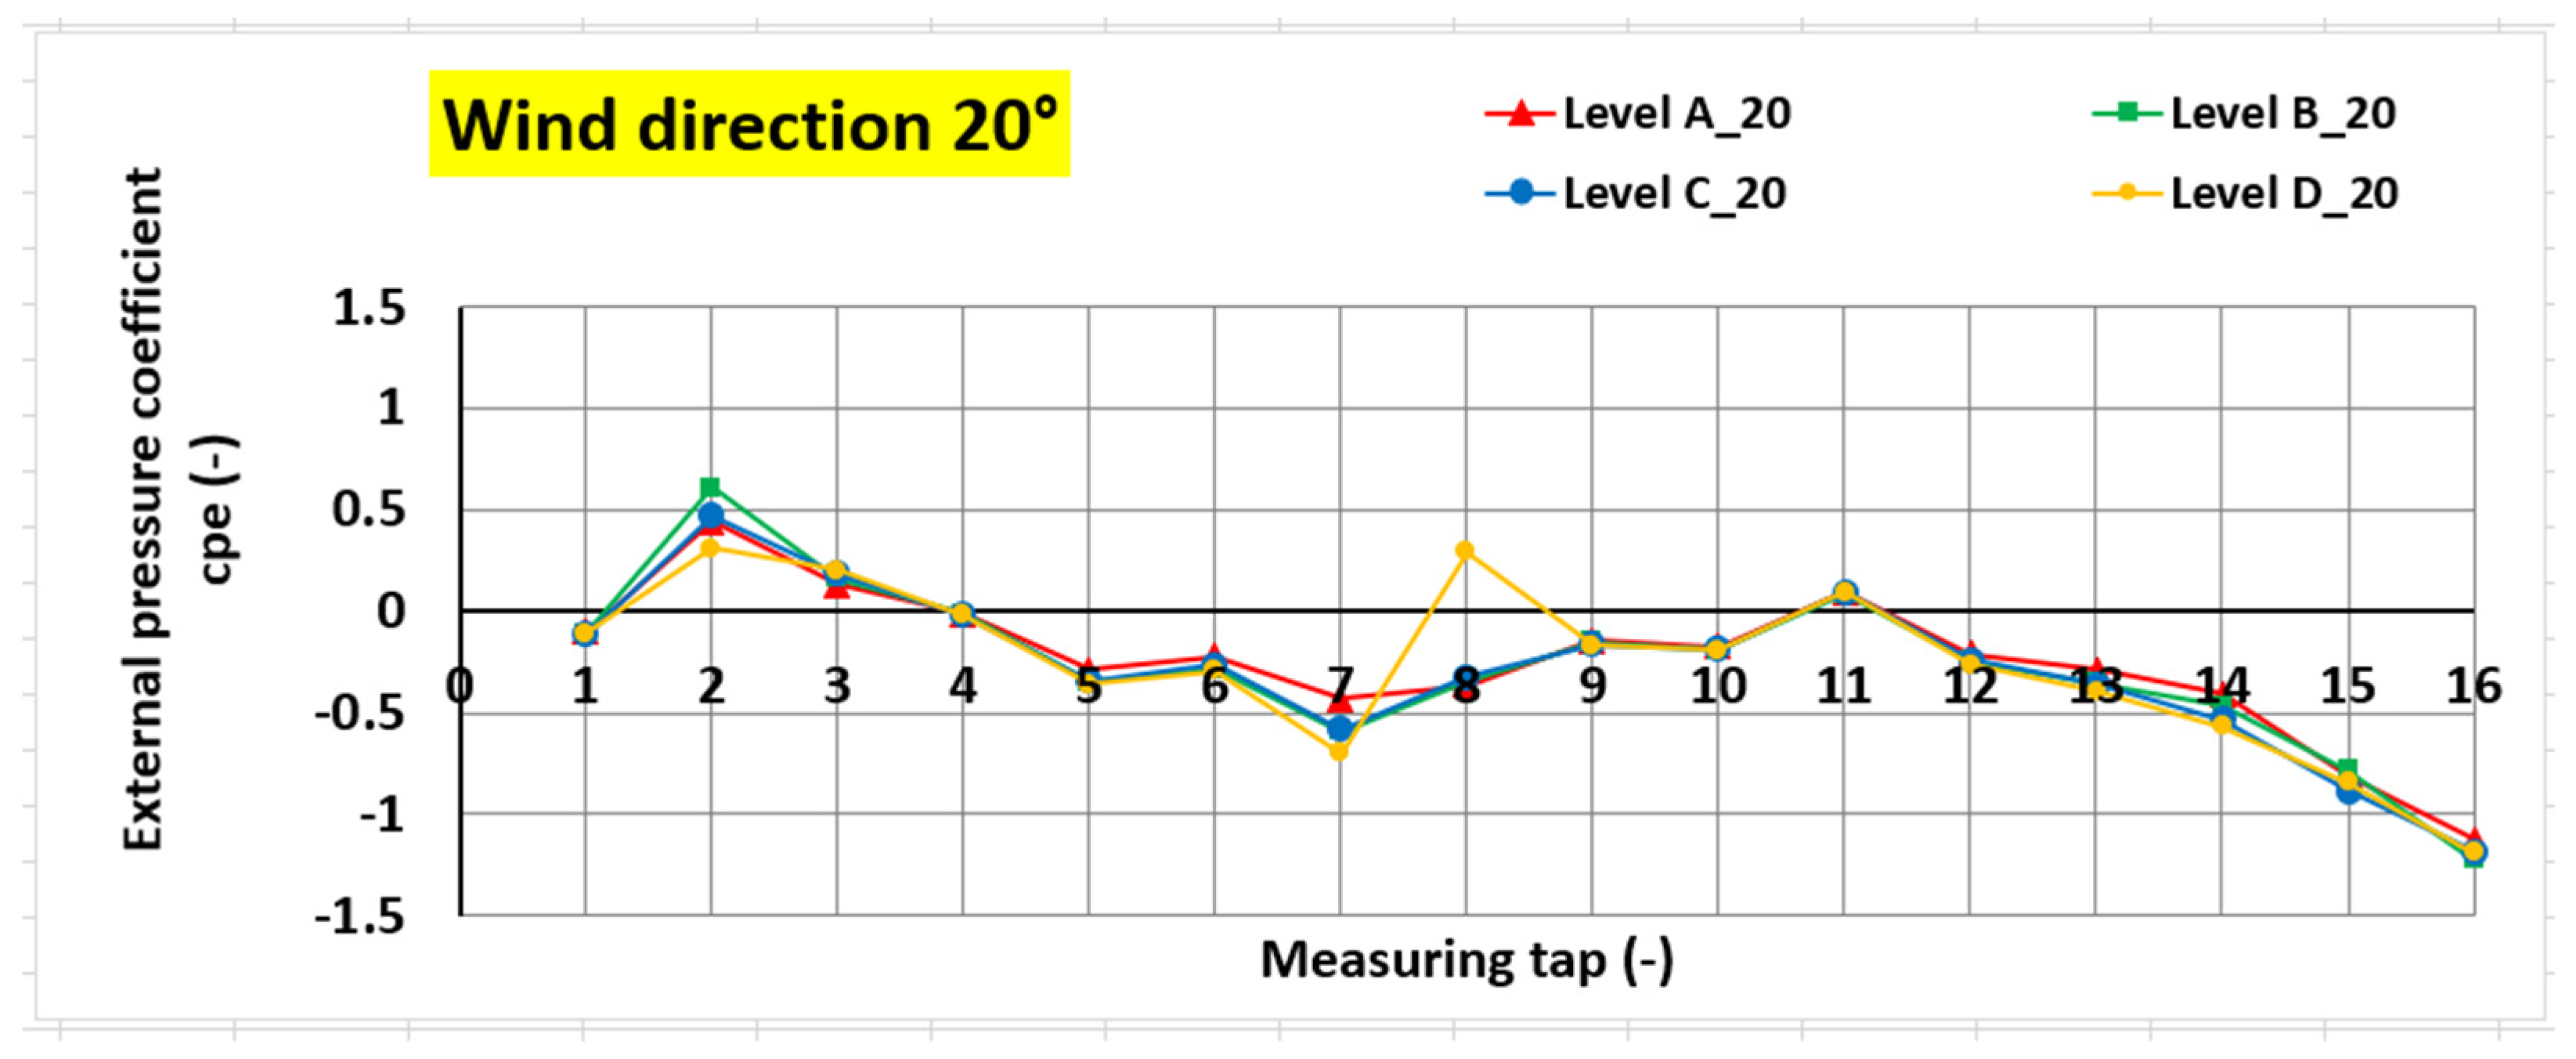
| 0° | 90° | 20° | 0° | 90° | 20° | |
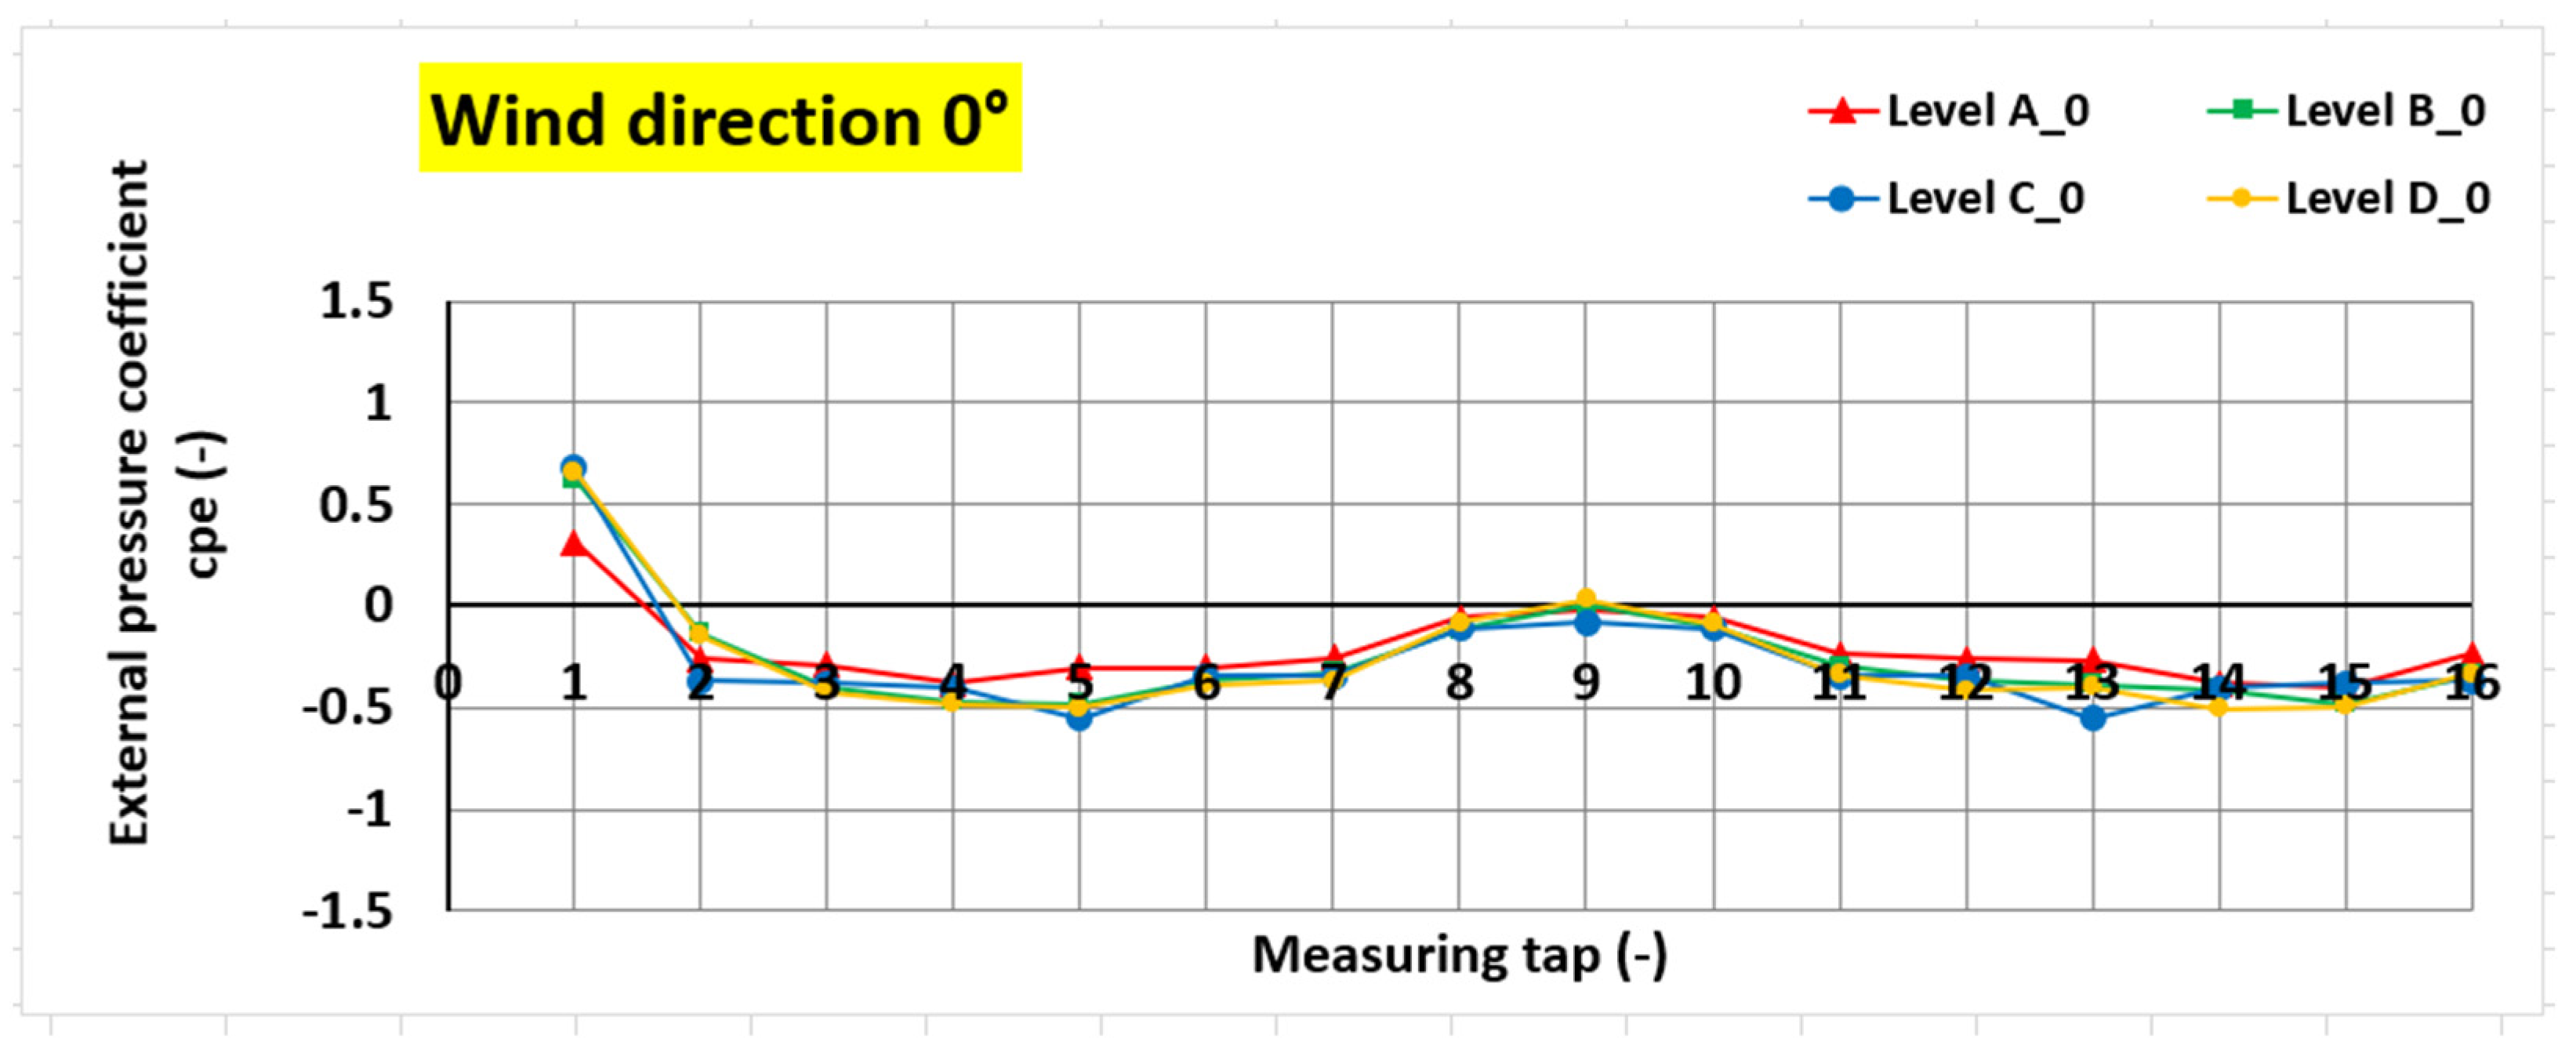
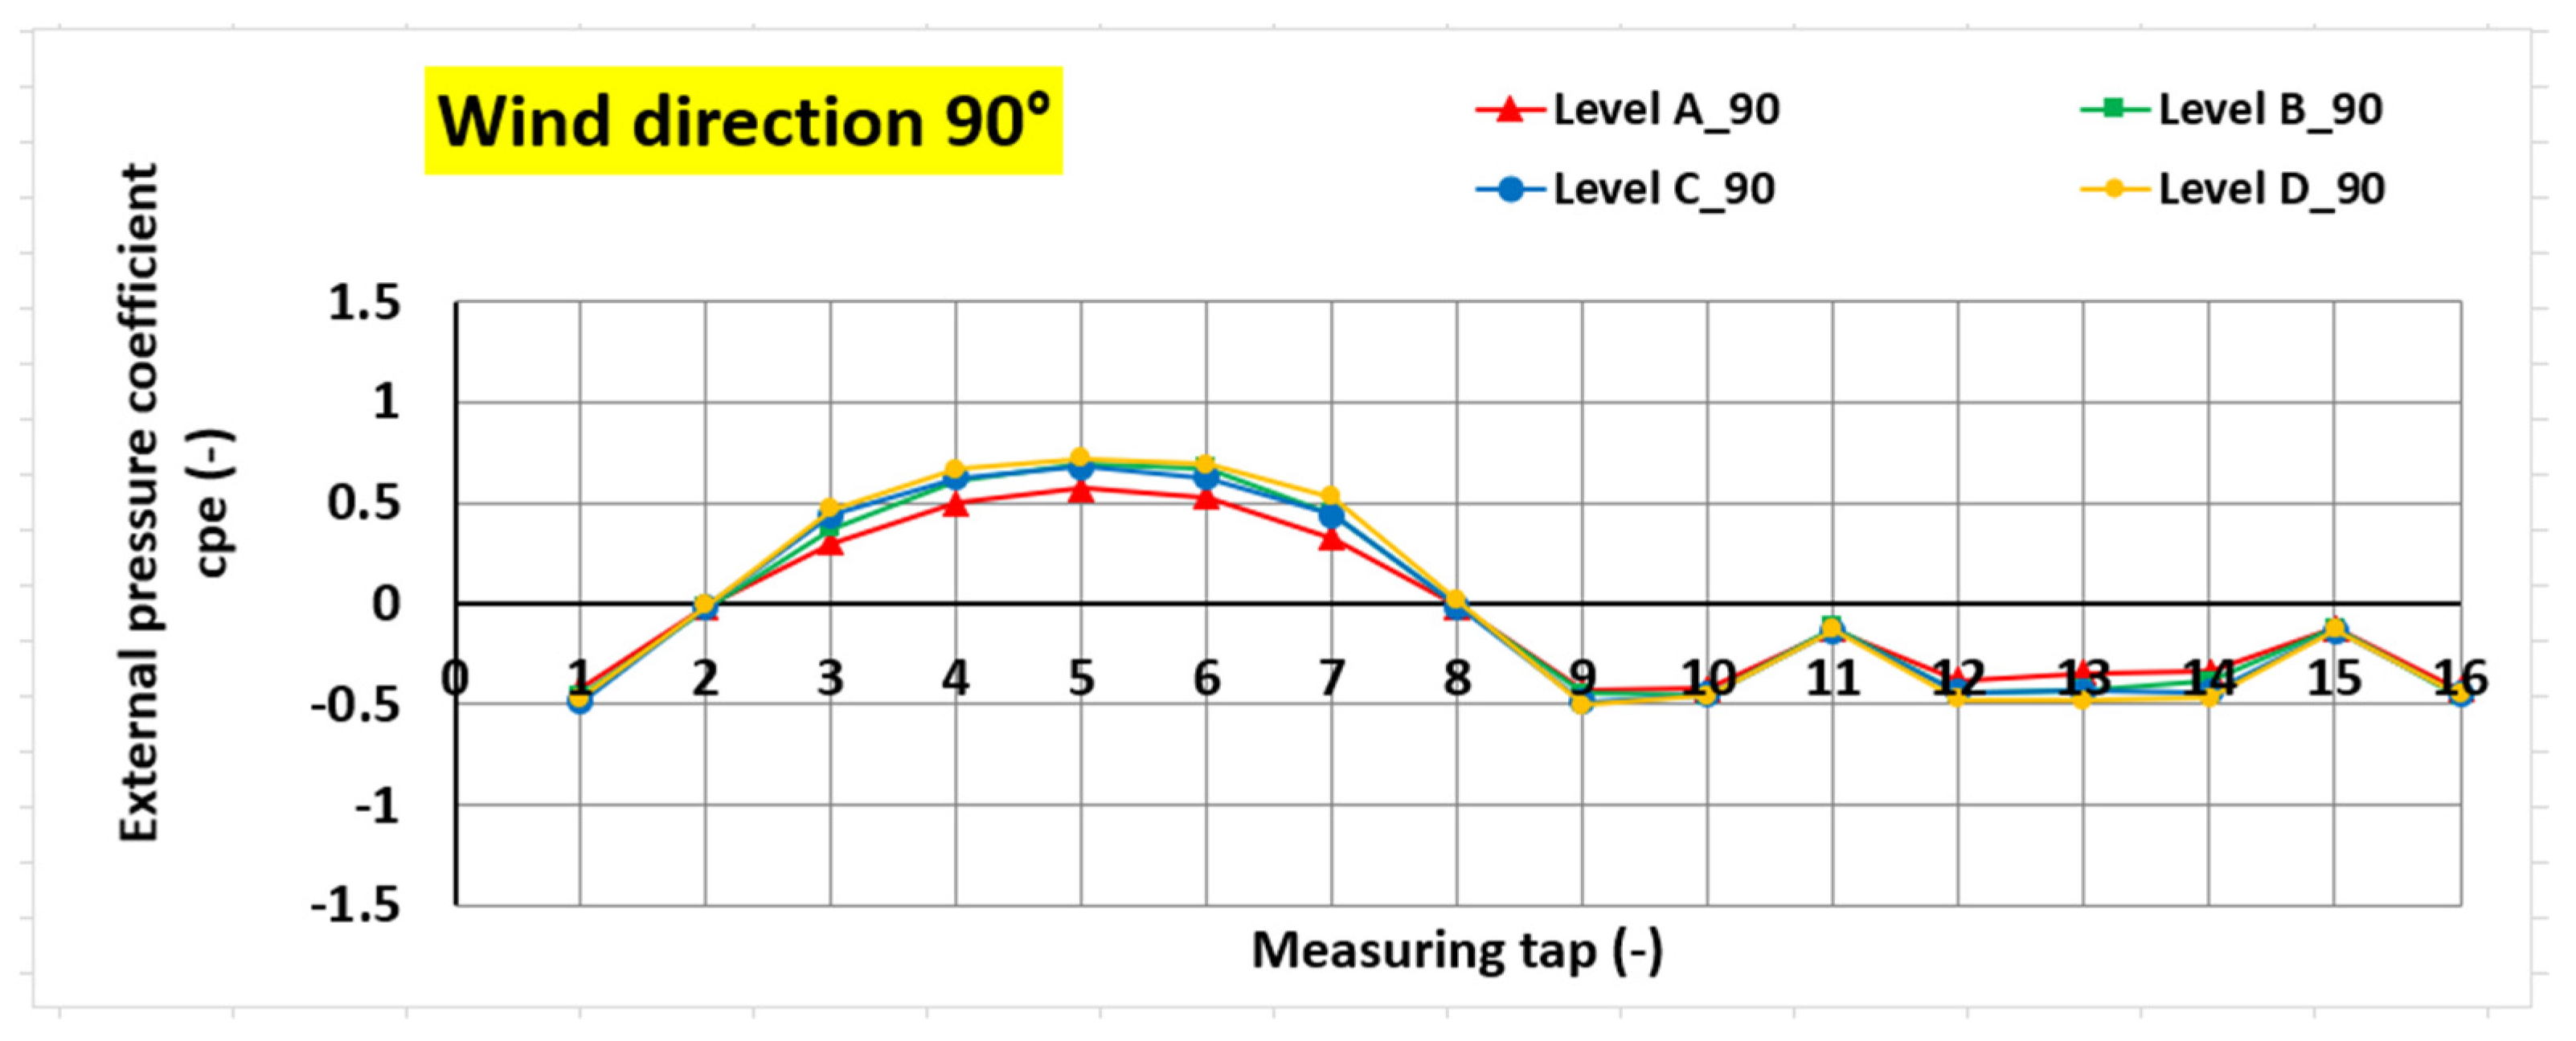
| 1 | 0.57 | −0.46 | −0.11 | 0.68 | −0.49 | −0.11 |
| 2 | −0.23 | −0.02 | 0.46 | −0.37 | −0.02 | 0.61 |
| 3 | −0.37 | 0.40 | 0.17 | −0.42 | 0.47 | 0.20 |
| 4 | −0.43 | 0.60 | −0.02 | −0.48 | 0.67 | −0.02 |
| 5 | −0.46 | 0.67 | −0.33 | −0.55 | 0.72 | −0.36 |
| 6 | −0.35 | 0.63 | −0.27 | −0.39 | 0.69 | −0.29 |
| 7 | −0.32 | 0.43 | −0.58 | −0.37 | 0.53 | −0.70 |
| 8 | −0.09 | −0.01 | −0.18 | −0.12 | −0.02 | −0.36 |
| 9 | −0.02 | −0.47 | −0.16 | −0.08 | −0.51 | −0.17 |
| 10 | −0.09 | −0.45 | −0.19 | −0.11 | −0.46 | −0.19 |
| 11 | −0.30 | −0.13 | 0.09 | −0.35 | −0.14 | 0.10 |
| 12 | −0.35 | −0.44 | −0.24 | −0.41 | −0.48 | −0.26 |
| 13 | −0.40 | −0.42 | −0.35 | −0.55 | −0.48 | −0.39 |
| 14 | −0.42 | −0.41 | −0.49 | −0.50 | −0.47 | −0.57 |
| 15 | −0.44 | −0.13 | −0.83 | −0.49 | −0.14 | −0.89 |
| 16 | −0.32 | −0.45 | −1.18 | −0.37 | −0.47 | −1.22 |
| Wind Direction (°) | Resultant Force (kN) | Force Arm (m) | Angle of the Force (°) | Torsional Moment (kNm) |
|---|---|---|---|---|
| 0 | 0.34 | −77.48 | 147 | −26.48 |
| 20 | 27.55 | −29.74 | 275 | −819.35 |
| 90 | 60.95 | 0.44 | 270 | 26.94 |
| Wind Direction (°) | Resultant Force (kN) | Force Arm (m) | Angle of the Force (°) | Torsional Moment (kNm) |
|---|---|---|---|---|
| 0 | 8.65 | −15.00 | 188 | −129.77 |
| 20 | 51.76 | −31.02 | 272 | −1605.58 |
| 90 | 126.42 | 0.61 | 271 | 77.20 |
| Wind Direction (°) | Resultant Force (kN) | Force Arm (m) | Angle of the Force (°) | Torsional Moment (kNm) |
|---|---|---|---|---|
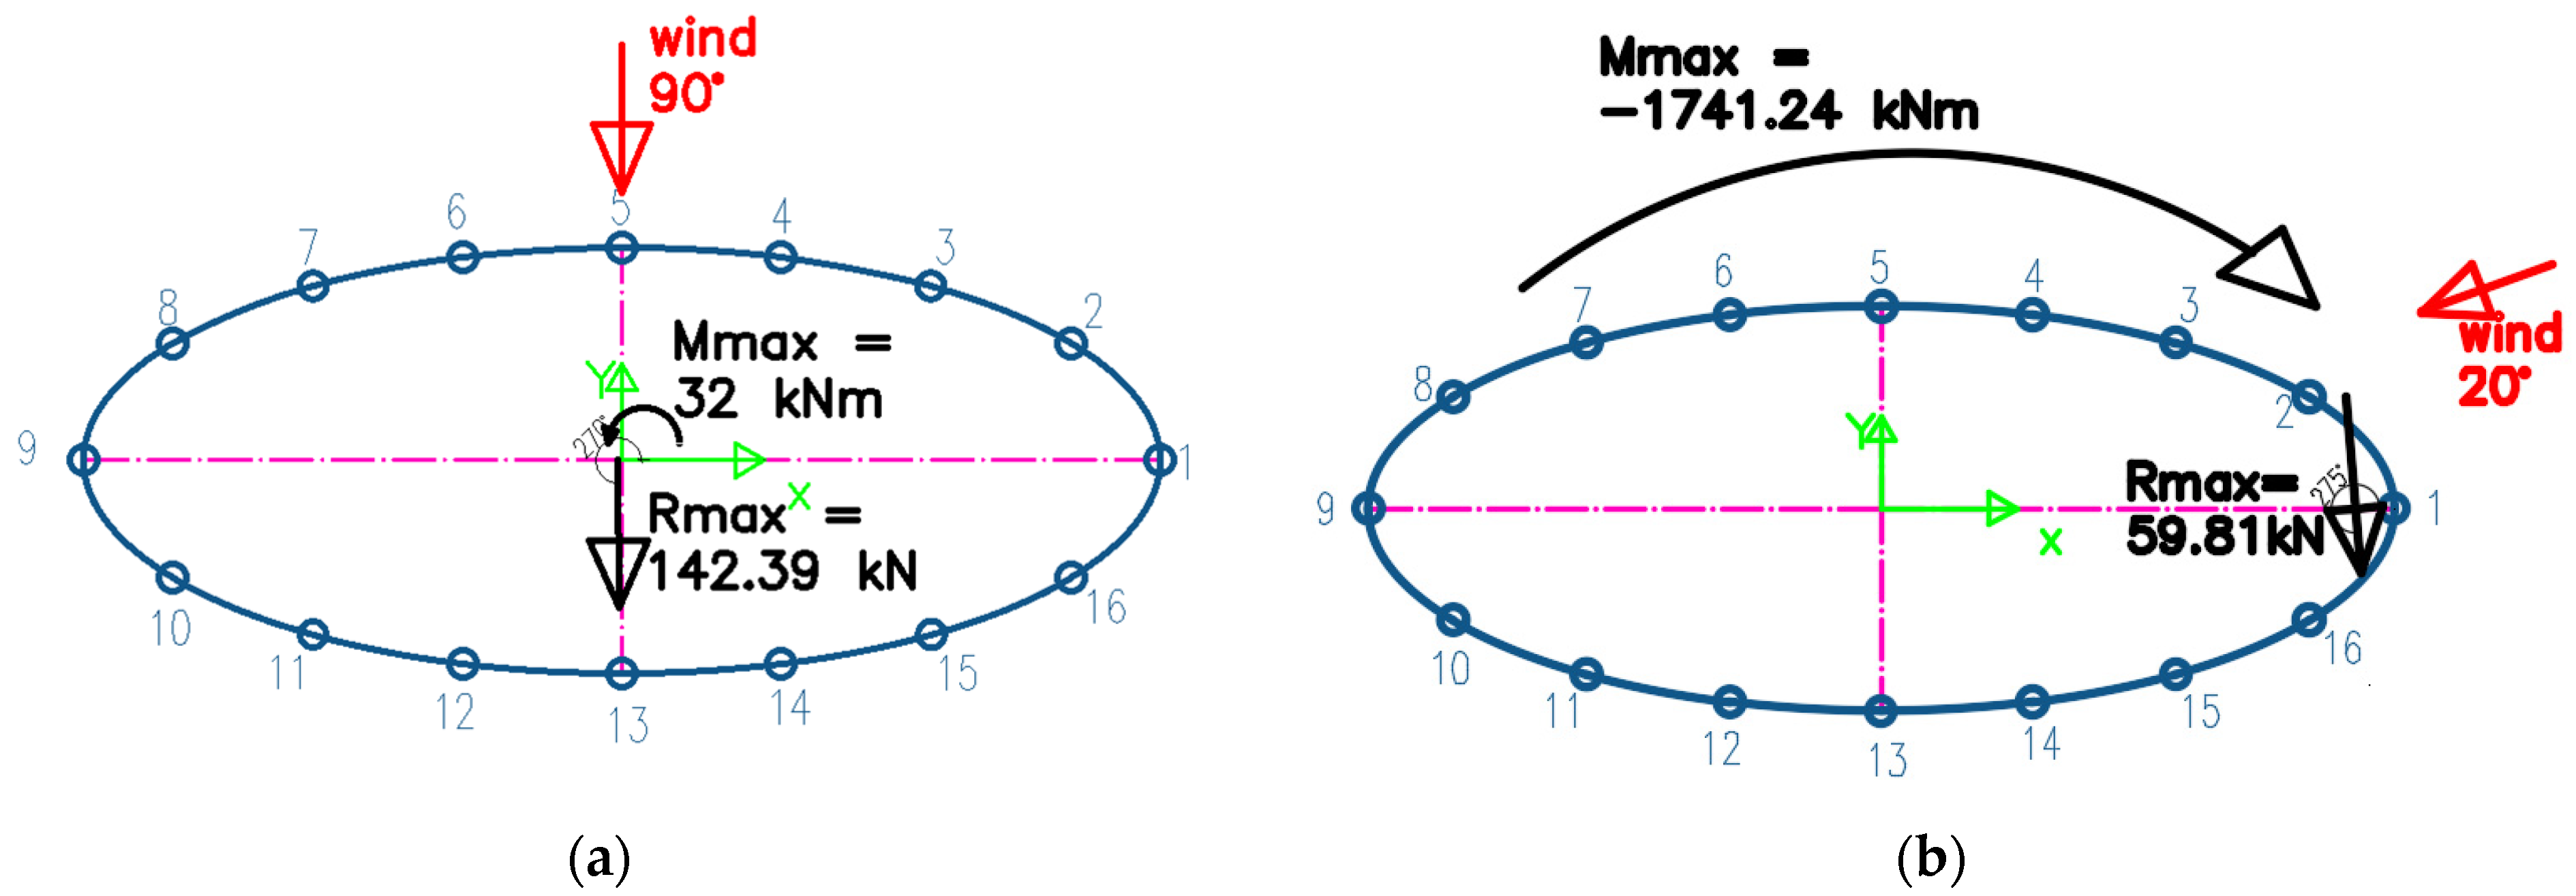
| 0 | 10.99 | −0.04 | 180 | 0.47 |
| 10 | 30.47 | −33.43 | 265 | −1018.50 |
| 20 | 59.81 | −29.11 | 275 | −1741.24 |
| 30 | 71.47 | −22.85 | 270 | −1632.84 |
| 40 | 83.78 | −17.42 | 266 | −1459.28 |
| 50 | 104.23 | −12.69 | 264 | −1322.31 |
| 60 | 124.84 | −9.16 | 265 | −1143.94 |
| 70 | 133.43 | −6.46 | 266 | −862.02 |
| 80 | 149.04 | −3.35 | 268 | −499.85 |
| 90 | 142.39 | 0.22 | 270 | 32.00 |
| Wind Direction (°) | Resultant Force (kN) | Force Arm (m) | Angle of the Force (°) | Torsional Moment (kNm) |
|---|---|---|---|---|
| 0 | 11.05 | −13.25 | 202 | −146.36 |
| 20 | 77.43 | −19.64 | 281 | −1520.86 |
| 90 | 171.19 | 0.52 | 270 | 88.96 |
| Subsoil Stiffness Coefficient (MN/m3) | Wind Direction | Limit Value (mm) | |||||
|---|---|---|---|---|---|---|---|
| 0° | 20° | 90° | |||||
| 25 | −0.5 | 0.2 | −3.6 | −2.6 | 0.4 | 6.7 | |
| 40.421 | −0.5 | 0.2 | −3.6 | −2.9 | 0.4 | 6.1 | |
| 50 | −0.5 | 0.1 | −3.6 | −2.9 | 0.3 | 5.8 | 40 |
| 100 | −0.5 | 0 | −3.6 | −3.2 | 0.3 | 5.2 | |
| Subsoil Stiffness Coefficient (MN/m3) | Wind Direction | Limit Value (mm) | |||||
|---|---|---|---|---|---|---|---|
| 0° | 20° | 90° | |||||
| 25 | −0.3 | 0.5 | 2.3 | 12.2 | −1.4 | 11.0 | |
| 40.421 | −0.3 | 0.4 | 2.2 | 11.7 | −1.4 | 10.4 | |
| 50 | −0.4 | 0.4 | 2.2 | 11.5 | −1.4 | 10.1 | 40 |
| 100 | −0.4 | 0.3 | 2.1 | 10.8 | −1.4 | 9.3 | |
| Slab No. | Structural Height | The Limit Value SH/1500 | Horizontal Displacement uup | Horizontal Displacement udown | Difference uup − udown | Advisement |
|---|---|---|---|---|---|---|
| (-) | (mm) | (mm) | (mm) | (mm) | (mm) | |
| 21 | 3200 | 2.13 | 2.2 | 2.1 | 0.1 | satisfied |
| 20 | 3200 | 2.13 | 2.1 | 2 | 0.1 | satisfied |
| 19 | 3200 | 2.13 | 2 | 1.9 | 0.1 | satisfied |
| 18 | 3200 | 2.13 | 1.9 | 1.8 | 0.1 | satisfied |
| 17 | 3200 | 2.13 | 1.8 | 1.7 | 0.1 | satisfied |
| 16 | 3200 | 2.13 | 1.7 | 1.6 | 0.1 | satisfied |
| 15 | 3200 | 2.13 | 1.6 | 1.5 | 0.1 | satisfied |
| 14 | 3200 | 2.13 | 1.5 | 1.4 | 0.1 | satisfied |
| 13 | 3200 | 2.13 | 1.4 | 1.3 | 0.1 | satisfied |
| 12 | 3200 | 2.13 | 1.3 | 1.2 | 0.1 | satisfied |
| 11 | 3200 | 2.13 | 1.2 | 1.1 | 0.1 | satisfied |
| 10 | 3200 | 2.13 | 1.1 | 1 | 0.1 | satisfied |
| 9 | 3200 | 2.13 | 1 | 0.9 | 0.1 | satisfied |
| 8 | 3200 | 2.13 | 0.9 | 0.8 | 0.1 | satisfied |
| 7 | 3200 | 2.13 | 0.8 | 0.7 | 0.1 | satisfied |
| 6 | 3200 | 2.13 | 0.7 | 0.6 | 0.1 | satisfied |
| 5 | 3200 | 2.13 | 0.6 | 0.5 | 0.1 | satisfied |
| 4 | 3200 | 2.13 | 0.5 | 0.3 | 0.2 | satisfied |
| 3 | 3200 | 2.13 | 0.4 | 0.2 | 0.2 | satisfied |
| 2 | 3200 | 2.13 | 0.3 | 0.1 | 0.2 | satisfied |
| 1 | 3950 | 2.63 | 0.2 | 0 | 0.2 | satisfied |
| Slab No. | Structural Height | The Limit Value SH/1500 | Horizontal Displacement uup | Horizontal Displacement udown | Difference uup − udown | Advisement |
|---|---|---|---|---|---|---|
| (-) | (mm) | (mm) | (mm) | (mm) | (mm) | |
| 21 | 3200 | 2.13 | 11.7 | 11.3 | 0.4 | satisfied |
| 20 | 3200 | 2.13 | 11.3 | 10.9 | 0.4 | satisfied |
| 19 | 3200 | 2.13 | 10.9 | 10.5 | 0.4 | satisfied |
| 18 | 3200 | 2.13 | 10.5 | 10.1 | 0.4 | satisfied |
| 17 | 3200 | 2.13 | 10.1 | 9.6 | 0.5 | satisfied |
| 16 | 3200 | 2.13 | 9.6 | 9.1 | 0.5 | satisfied |
| 15 | 3200 | 2.13 | 9.1 | 8.6 | 0.5 | satisfied |
| 14 | 3200 | 2.13 | 8.6 | 8.1 | 0.5 | satisfied |
| 13 | 3200 | 2.13 | 8.1 | 7.5 | 0.6 | satisfied |
| 12 | 3200 | 2.13 | 7.5 | 7 | 0.5 | satisfied |
| 11 | 3200 | 2.13 | 7 | 6.4 | 0.6 | satisfied |
| 10 | 3200 | 2.13 | 6.4 | 5.8 | 0.6 | satisfied |
| 9 | 3200 | 2.13 | 5.8 | 5.2 | 0.6 | satisfied |
| 8 | 3200 | 2.13 | 5.2 | 4.6 | 0.6 | satisfied |
| 7 | 3200 | 2.13 | 4.6 | 4 | 0.6 | satisfied |
| 6 | 3200 | 2.13 | 4 | 3.4 | 0.6 | satisfied |
| 5 | 3200 | 2.13 | 3.4 | 2.8 | 0.6 | satisfied |
| 4 | 3200 | 2.13 | 2.8 | 2.2 | 0.6 | satisfied |
| 3 | 3200 | 2.13 | 2.2 | 1.6 | 0.6 | satisfied |
| 2 | 3200 | 2.13 | 1.6 | 1 | 0.6 | satisfied |
| 1 | 3950 | 2.63 | 1 | 0 | 1 | satisfied |
Disclaimer/Publisher’s Note: The statements, opinions and data contained in all publications are solely those of the individual author(s) and contributor(s) and not of MDPI and/or the editor(s). MDPI and/or the editor(s) disclaim responsibility for any injury to people or property resulting from any ideas, methods, instructions or products referred to in the content. |
© 2023 by the authors. Licensee MDPI, Basel, Switzerland. This article is an open access article distributed under the terms and conditions of the Creative Commons Attribution (CC BY) license (https://creativecommons.org/licenses/by/4.0/).
Share and Cite
Hubová, O.; Macák, M.; Franek, M.; Ivánková, O.; Konečná, L.B. Implementation of Data from Wind Tunnel Tests in the Design of a Tall Building with an Elliptic Ground Plan. Buildings 2023, 13, 2732. https://doi.org/10.3390/buildings13112732
Hubová O, Macák M, Franek M, Ivánková O, Konečná LB. Implementation of Data from Wind Tunnel Tests in the Design of a Tall Building with an Elliptic Ground Plan. Buildings. 2023; 13(11):2732. https://doi.org/10.3390/buildings13112732
Chicago/Turabian StyleHubová, Oľga, Marek Macák, Michal Franek, Oľga Ivánková, and Lenka Bujdáková Konečná. 2023. "Implementation of Data from Wind Tunnel Tests in the Design of a Tall Building with an Elliptic Ground Plan" Buildings 13, no. 11: 2732. https://doi.org/10.3390/buildings13112732
APA StyleHubová, O., Macák, M., Franek, M., Ivánková, O., & Konečná, L. B. (2023). Implementation of Data from Wind Tunnel Tests in the Design of a Tall Building with an Elliptic Ground Plan. Buildings, 13(11), 2732. https://doi.org/10.3390/buildings13112732