Abstract
Public buildings consume the largest proportion of total energy consumption and carbon dioxide emissions in the building sector of China. Enhancing building energy efficiency becomes a necessary way to reduce greenhouse gas emissions and energy waste. In this study, 10-year real data from 2000 buildings covering five different types of public buildings in a hot summer and cold winter zone in eastern coastal China were investigated to analyze energy-saving potential (ESP) and the impacts of various influencing factors on building energy performance. The concept of energy consumption limit (ECL) was proposed and used for identifying high energy-consuming buildings and the calculation of ESP. Hotels, shopping malls, and office buildings were the top three types of buildings with high ESP. ESP for the high energy-consuming buildings based on the benchmark limits was more than 18%, and that for three-star hotels and shopping malls was 51%. In addition, a correlation analysis between energy consumption and influencing factors was carried out, which laid the foundation for the development of building energy performance assessment and diagnosis tools.
1. Introduction
Globally, the building sector is recognized as the main energy consumer and greenhouse gas producer, leading to an increase in the global greenhouse effect. According to the 2019 Global Status Report for Buildings and Construction, buildings accounted for a major share of both final energy consumption (30%) and energy-related CO2 emissions (28%) globally []. In China, according to a research report, building energy consumption and carbon emissions accounted for 20.6% and 19.4% of the total national energy consumption and carbon emissions, respectively [,]. Excessive emissions of greenhouse gases and severe waste of building energy can cause serious climate anomalies, which will lead to a series of serious environmental problems such as sea level rise, abnormal changes in rainfall distribution, and frequent floods and droughts. To reduce building energy consumption and promote the realization of the goal of carbon neutrality by 2050, building practitioners around the world are actively responding to national policies, and building energy performance has been a popular research topic in the academic field.
Enhancing building energy efficiency becomes a necessary way to reduce greenhouse gas emissions and energy waste. UNEP (United Nations Environment Programme) defined building energy efficiency as “using less energy without compromising the performance of the building, which can be achieved by reducing unnecessary energy use in buildings” []. The energy performance of a building was described by the EPBD (Energy Performance of Buildings Directive) as “the amount of energy actually consumed or estimated to meet the different needs associated with a standardized use of the building” []. Research on building energy performance can be roughly divided into four aspects, including assessment, prediction [,], retrofit [,], and management [,]. Building energy performance assessment can be regarded as the basic part of the four respects mentioned. Two objectives for evaluating the energy performance of a building are energy efficiency benchmarking and fault detection and diagnosis (FDD). Energy efficiency benchmarking of buildings is usually used to evaluate relative energy efficiency and carbon emissions in comparison with a reference value. Four common classification tools have come into service for increasing awareness among stockholders and the public about energy conservation and improving building energy efficiency, including energy benchmarking, energy rating, energy labeling, and energy certification []. FDD is considered one of the methods to establish energy performance assessment schemes and methods [], which has been used to determine poor energy performance areas and causes at the whole building level [,], system level [,], or multi-level [,]. FDD can help pinpoint defects, such as the degradation of air-conditioning systems, and provide suggestions for building retrofits. FDD plays an important role in reducing energy waste, maintaining a comfortable indoor environment, and improving the maintenance efficiency of equipment [].
There are some studies [,,,] related to the influencing factors on building energy performance. These factors can be classified into three main groups according to the different sources and whether they are influenced by human behavior: technical and physical factors, human-influenced factors, and social and economic factors. Technical and physical factors include building envelope, climate, building service systems, and other issues that cannot be easily changed during building operation by building occupants and operators. Human-influenced factors are operation and maintenance factors, occupant behavior, indoor environment conditions, and other issues that can be changed or are defined by building occupants/operators. Social and economic factors include local habits regarding building use, energy prices, dominating energy sources in certain areas, the energy-related attitude of occupants, political conditions, etc.
Different types of buildings have their own functions and unique characteristics. There are some studies [,,,] related to the influencing factors on building energy performance. Some studies have researched the energy consumption of office buildings [], hospital buildings [,], commercial buildings [], and hotel buildings [,,,]. The research mainly focuses on the impacts of energy consumption, the performance of energy consumption, the analysis and evaluation of energy consumption, and model and energy benchmarks for energy consumption. Hotel buildings were taken as an example here. Hotel buildings have different functional areas with different energy characteristics, resulting in more complicated energy consumption patterns when compared with commercial and office buildings []. Star rating as one of the influencing factors is very important because it directly affects the operation status and energy consumption of hotels. That means the number of guestrooms, percentage of gross floor area (GFA) of each functional zone, and other factors could be affected. Higher-rated hotels have a larger GFA of the public zone, and the guestrooms’ area is accordingly reduced []. Among them, public areas may include spas, fitness rooms, and swimming pools. On the contrary, economy hotels have a relatively larger GFA in guestrooms and a smaller GFA in the public zone. Activities in the public area provide a higher level and more comfortable service to customers, which may result in higher energy consumption at the same time []. The diversity of customer requirements could lead to the complexity of hotel use. Except for the GFA of each function zone, different classes of hotels also have different design criteria in lighting, indoor thermal and humidity environments, and others. Therefore, the star rating of hotels is usually first stated before conducting an energy analysis. Bohdanowicz et al. [] surveyed the energy use of upscale and mid-market hotels. The visible differences in energy consumption between the two classes of hotels indicated that it is necessary to classify hotels into sufficiently specialized sub-groups representing facilities with comparable properties. Sheng et al. [], targeting five-star hotels, analyzed the yearly energy consumption of nearly 300 hotels. Priyadarsini et al. [] collected energy information from hotel buildings in Singapore, which were first classified as five-star, four-star, and three-star hotels. The analysis showed that there was no obvious difference in energy use intensity between four-star and five-star hotels, which were higher than three-star hotels []. Xin et al. [] determined the energy use quota against four-star and five-star luxury hotels together in the Hainan province of China through statistical analysis. In addition to the star rating mentioned above, worker density, retrofit year, occupancy rate, average room rate, facilities and services, and other considerations may have various impacts on the energy efficiency of hotel buildings. However, in some cases, hotels’ energy usage was not well correlated with some factors, such as occupancy srate [,] andyear of construction [] due to regional characteristics.
All the above research has proven that public buildings have enormous energy-saving potential, and some studies have illustrated the influencing factors of energy consumption. However, the relationship between energy consumption characteristics and the influencing factors of various buildings has not been studied based on climate and regional characteristics. In fact, energy consumption characteristics for different types of buildings in various climate zones and countries are different. It is necessary to carry out energy consumption statistics to comprehensively understand the characteristics of building energy consumption and energy-consuming patterns, which can provide data support for exploring the energy-saving potential and further planning and designing cost-effective retrofitting solutions.
This paper investigates the energy consumption and the influencing factors of several types of buildings, including office buildings, shopping malls, hotels, hospitals, and commercial buildings, in a hot summer and cold winter zone in China. The results can provide guidance for improving the energy efficiency of public buildings in hot summer and cold winter zones.
2. Research Methodology
2.1. Research Conceptual Framework
The research conceptual framework is shown in Figure 1. Firstly, a survey questionnaire on energy consumption and influencing factors in public buildings was completed. Secondly, the survey was carried out on-site to obtain building and energy consumption data. Thirdly, data filtering and proofreading were performed. Lastly, the characteristics of the main influencing factors in building energy consumption were analyzed.
Figure 1.
Research conceptual framework.
2.2. Data Collection
Data collection, as the first and most basic part of scientific data analysis, involves several general steps: (1) clear the purpose of the data analysis; (2) identify investigation objects, including building type, the number of buildings, building energy consumption data, and influencing factors; (3) choose a suitable data collection method; and (4) conduct surveys and collect data. In the second step, it is necessary to pay special attention to the fact that different types of buildings have their own functions and unique characteristics when gathering information. Clarifying the amount of sample information before taking action to collect data and ensuring the accuracy of the obtained information in the process of data collection are essential for assessing building energy performance.
(1) Data collection content
In this study, different types of public buildings, including office buildings, shopping malls, hotels, hospitals, and commercial buildings, were surveyed in a hot summer and cold winter zone in eastern coastal China. A total of 2000 buildings that cover the above-mentioned five types of public buildings are the investigated objects. The influencing factors to be collected mainly include basic building information such as building age, floor area, building envelope, air-conditioning systems, and energy-using equipment. Building energy consumption information refers to all energy form data, which may include electricity, coal, oil, gas, steam, purchased cooling and heat, and renewable energy.
(2) Data collection method
The face-to-face questionnaire was selected as the data collection method. The questionnaire was designed based on building types, which took individual characteristics into account. The questionnaire was distributed, filled out, and collected on a face-to-face basis, which was carried out simultaneously with relevant information checking and some in situ measurements for achieving timely and effective communication. The investigators can check the architectural design drawings, energy bills, and equipment operation records. The necessary field testing of building envelope performance and equipment energy efficiency parameters was also conducted.
(3) Energy usage data processing
Energy usage in different forms was all converted into standard coal by multiplying the conversion coefficient for summation and comparison. The total energy consumption of a building was the sum of the standard coal of various forms of energy. The conversion coefficients used are listed in Table 1. In addition to the standard coal conversion, for different types of public buildings, the average annual energy consumption per square meter (AE) was adopted as an indicator parameter for further data analysis, which can be calculated using the ratio of the 10-year average of total building energy consumption (kgce/a) to the total area (m2).
Table 1.
Conversion coefficient of various energies to standard coal.
2.3. Analysis Method
In this study, the term energy consumption limit (ECL) was defined in a new way. ECL can be used as an evaluation basis to further determine the building energy-saving potential for the five different types of public buildings investigated. The definition of ECL and the analysis process for building energy-saving potential are presented as follows:
(1) Building ranking.
For a certain type of building, all buildings were first ranked based on the average annual energy consumption per square meter in ascending order and were numbered as Ni from 1 to Nmax. Nmax is the building number with the highest energy consumption. The percentage ranking number Nip was used to describe the energy performance ranking of the buildings, which was calculated as a percentage of the ratio of Ni to Nmax.
(2) Energy consumption limit (ECL)
ECL refers to the energy level that existing buildings and relevant equipment consume in normal operation. For most buildings, the energy consumption per floor area should be close to and within the ECL. ECL should have characteristics that clearly distinguish buildings between reasonable energy consumption and high energy consumption. In other words, there should be a significant difference between the building energy consumption trends on both sides of the ECL. Beyond the ECL, energy consumption increases significantly. For the same type of buildings with different years of construction, the ranked buildings may be divided into multiple segments by critical points. This was mainly due to the use of different building construction standards and equipment forms, resulting in non-unique ECL.
(3) Energy saving potential (ESP)
ESP refers to the amount of energy savings that can be achieved by reducing existing actual energy consumption to a reasonable ECL through retrofits and management technologies. Energy-saving potential (ESP) is expressed in Equation (1).
where AE represents the average annual energy consumption per square meter.
2.4. Classification of Influencing Factors
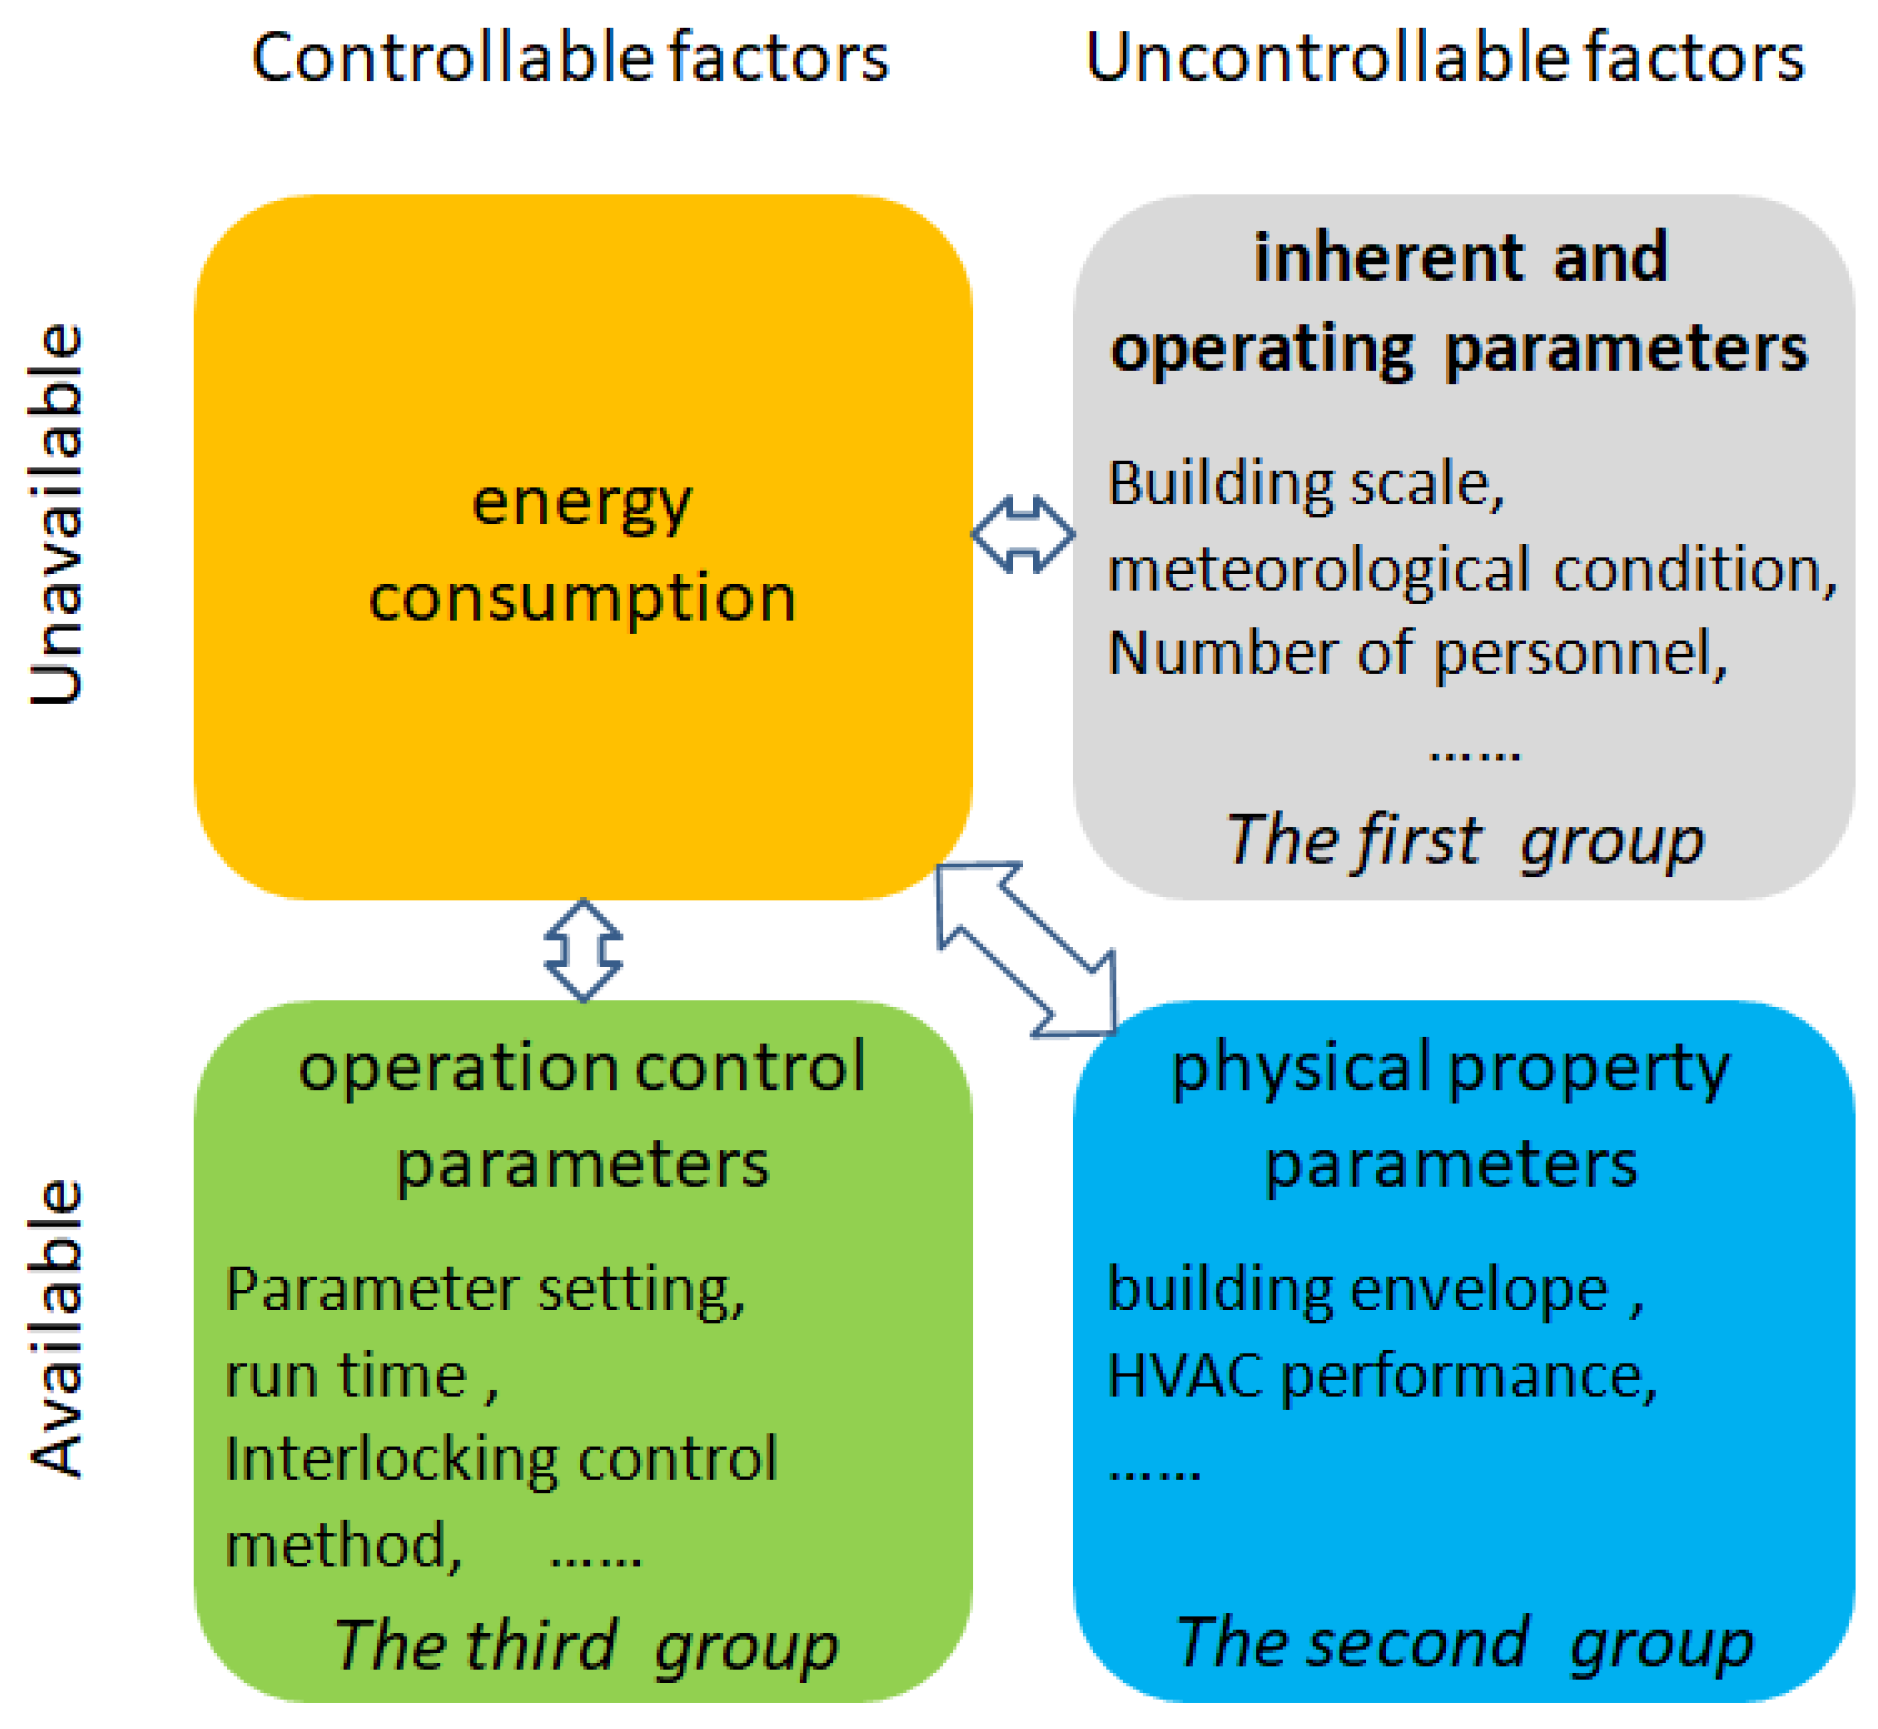
The influencing factors on building energy performance are classified into three groups according to whether users can control and utilize them to improve the operating efficiency of buildings. They include inherent and operating parameters, physical property parameters, and operation control parameters. If the factors can be changed to improve the energy efficiency of buildings without impacting building functions during construction or operation, they are defined as available. The factors that can be changed by occupants during building operations are classified as controllable. If the factors can be changed only during the construction stage of buildings, they are defined as uncontrollable. The relationships between building energy consumption and various influencing factors are shown in Figure 2. The first group of factors is defined as the inherent operating parameters related to building functions. The factors in the first group are uncontrollable and unavailable to improve the operating energy efficiency of buildings, which include factors such as building scale, climate, and occupancy. The second group of factors consists of the physical characteristic parameters of the building structure and air-conditioning systems, which are uncontrollable and available to improve the operating efficiency of buildings. Factors that can be controlled and available to improve building operating efficiency are related to the operating parameters of building energy use, which are classified as the third group. Overall, the first and second groups of factors can be classified into the uncontrollable category. It is noted that the available category covers the second and third groups of factors, which can be changed during building construction or operation by occupants to improve building energy performance.
Figure 2.
Classification of influencing factors.
2.5. Description of Climate Classification
The climate zones in China are determined according to the current national standard, ‘Code for Thermal Design of Civil Buildings’ (GB 50176) []. It is mainly divided into five climate zones as shown in Figure 3, including severe cold regions, cold regions, hot summer and cold winter regions, hot summer and warm winter regions, and temperate regions.
Figure 3.
The first-level zoning indicators for building thermal design.
The first-level zoning indicators for building thermal design are divided into primary indicators and auxiliary indicators, as listed in Table 2.
Table 2.
The first-level zoning indicators for building thermal design.
This article selected hot summer and cold winter zones with a wide geographical area, a developed economy, and high requirements for air conditioning. The building energy consumption and the influencing factors were investigated, and the energy consumption characteristics were analyzed.
3. Results and Discussion
3.1. Overview of the Survey
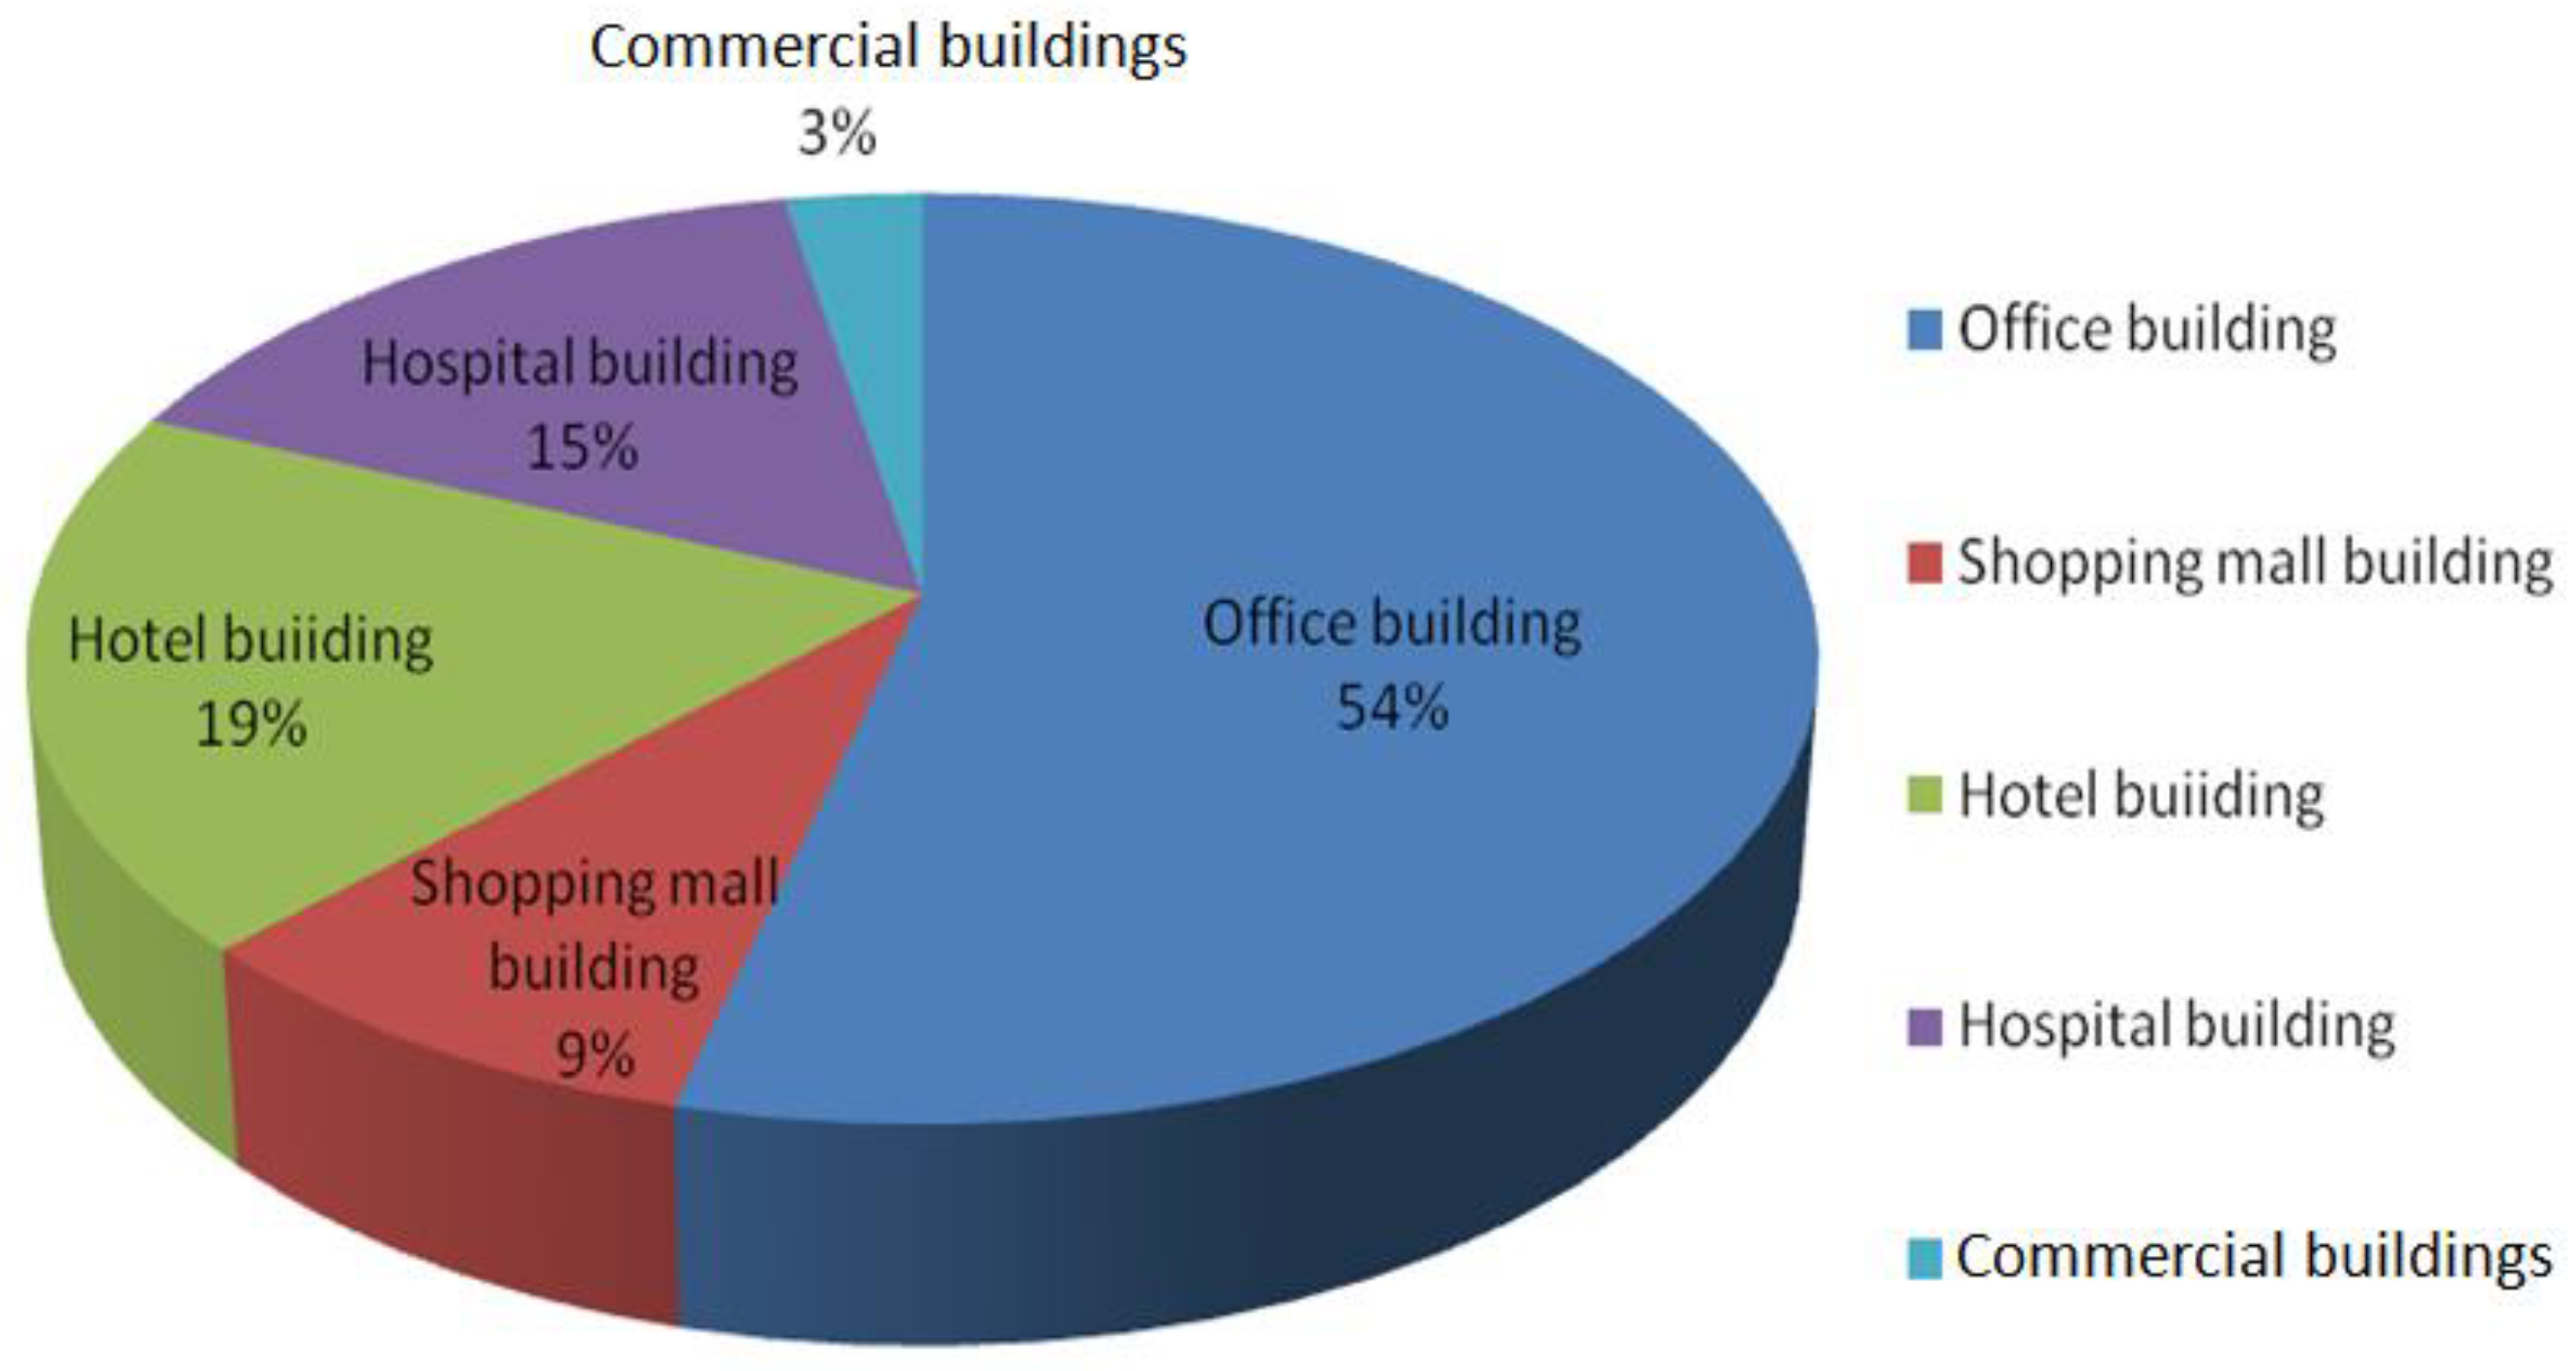
A total of more than 2000 public buildings were surveyed, of which 1339 buildings had valid data. Five types of buildings, including office buildings, shopping malls, hotels, hospitals, and commercial buildings, were covered in this investigation. In this study, for the hospitals, we surveyed energy information with a focus on the secondary and tertiary hospitals. For commercial buildings, we targeted the business halls of banks, the service halls of communication companies, and investment and entrepreneurship centers. The floor area and proportions of different types of public buildings are summarized in Table 3 and Figure 4, respectively.
Table 3.
Floor areas of different types of public buildings.
Figure 4.
Floor area proportions of public buildings.
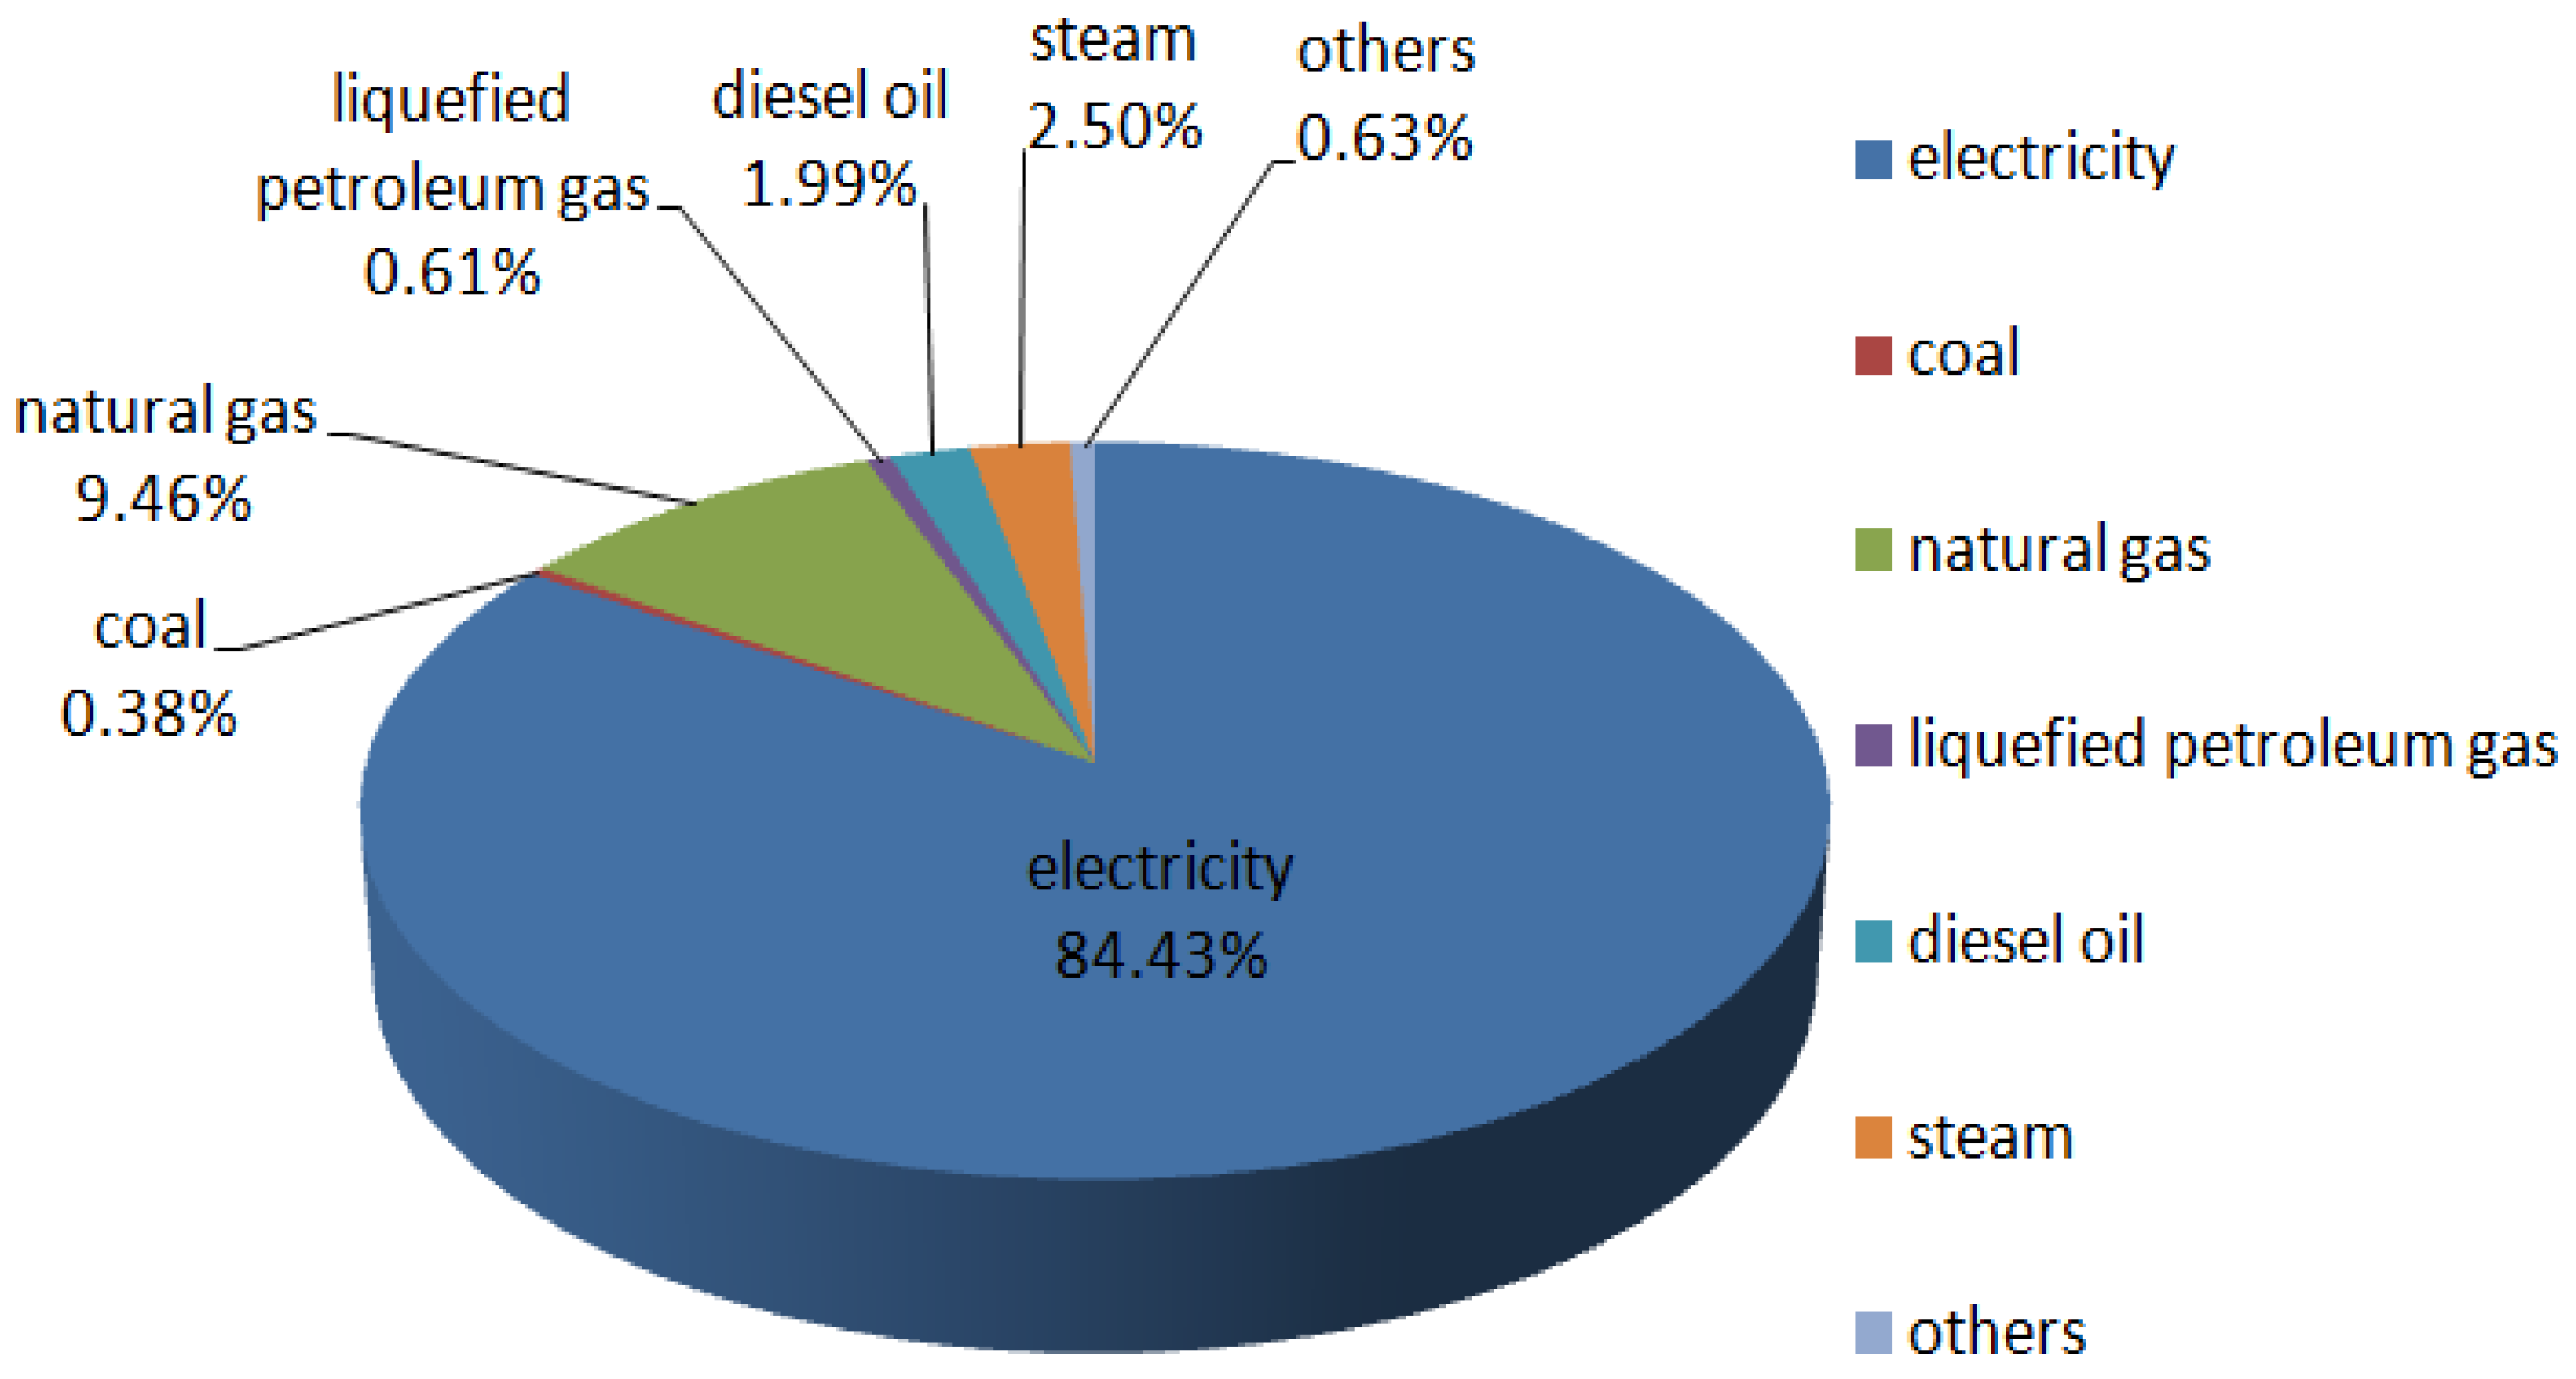
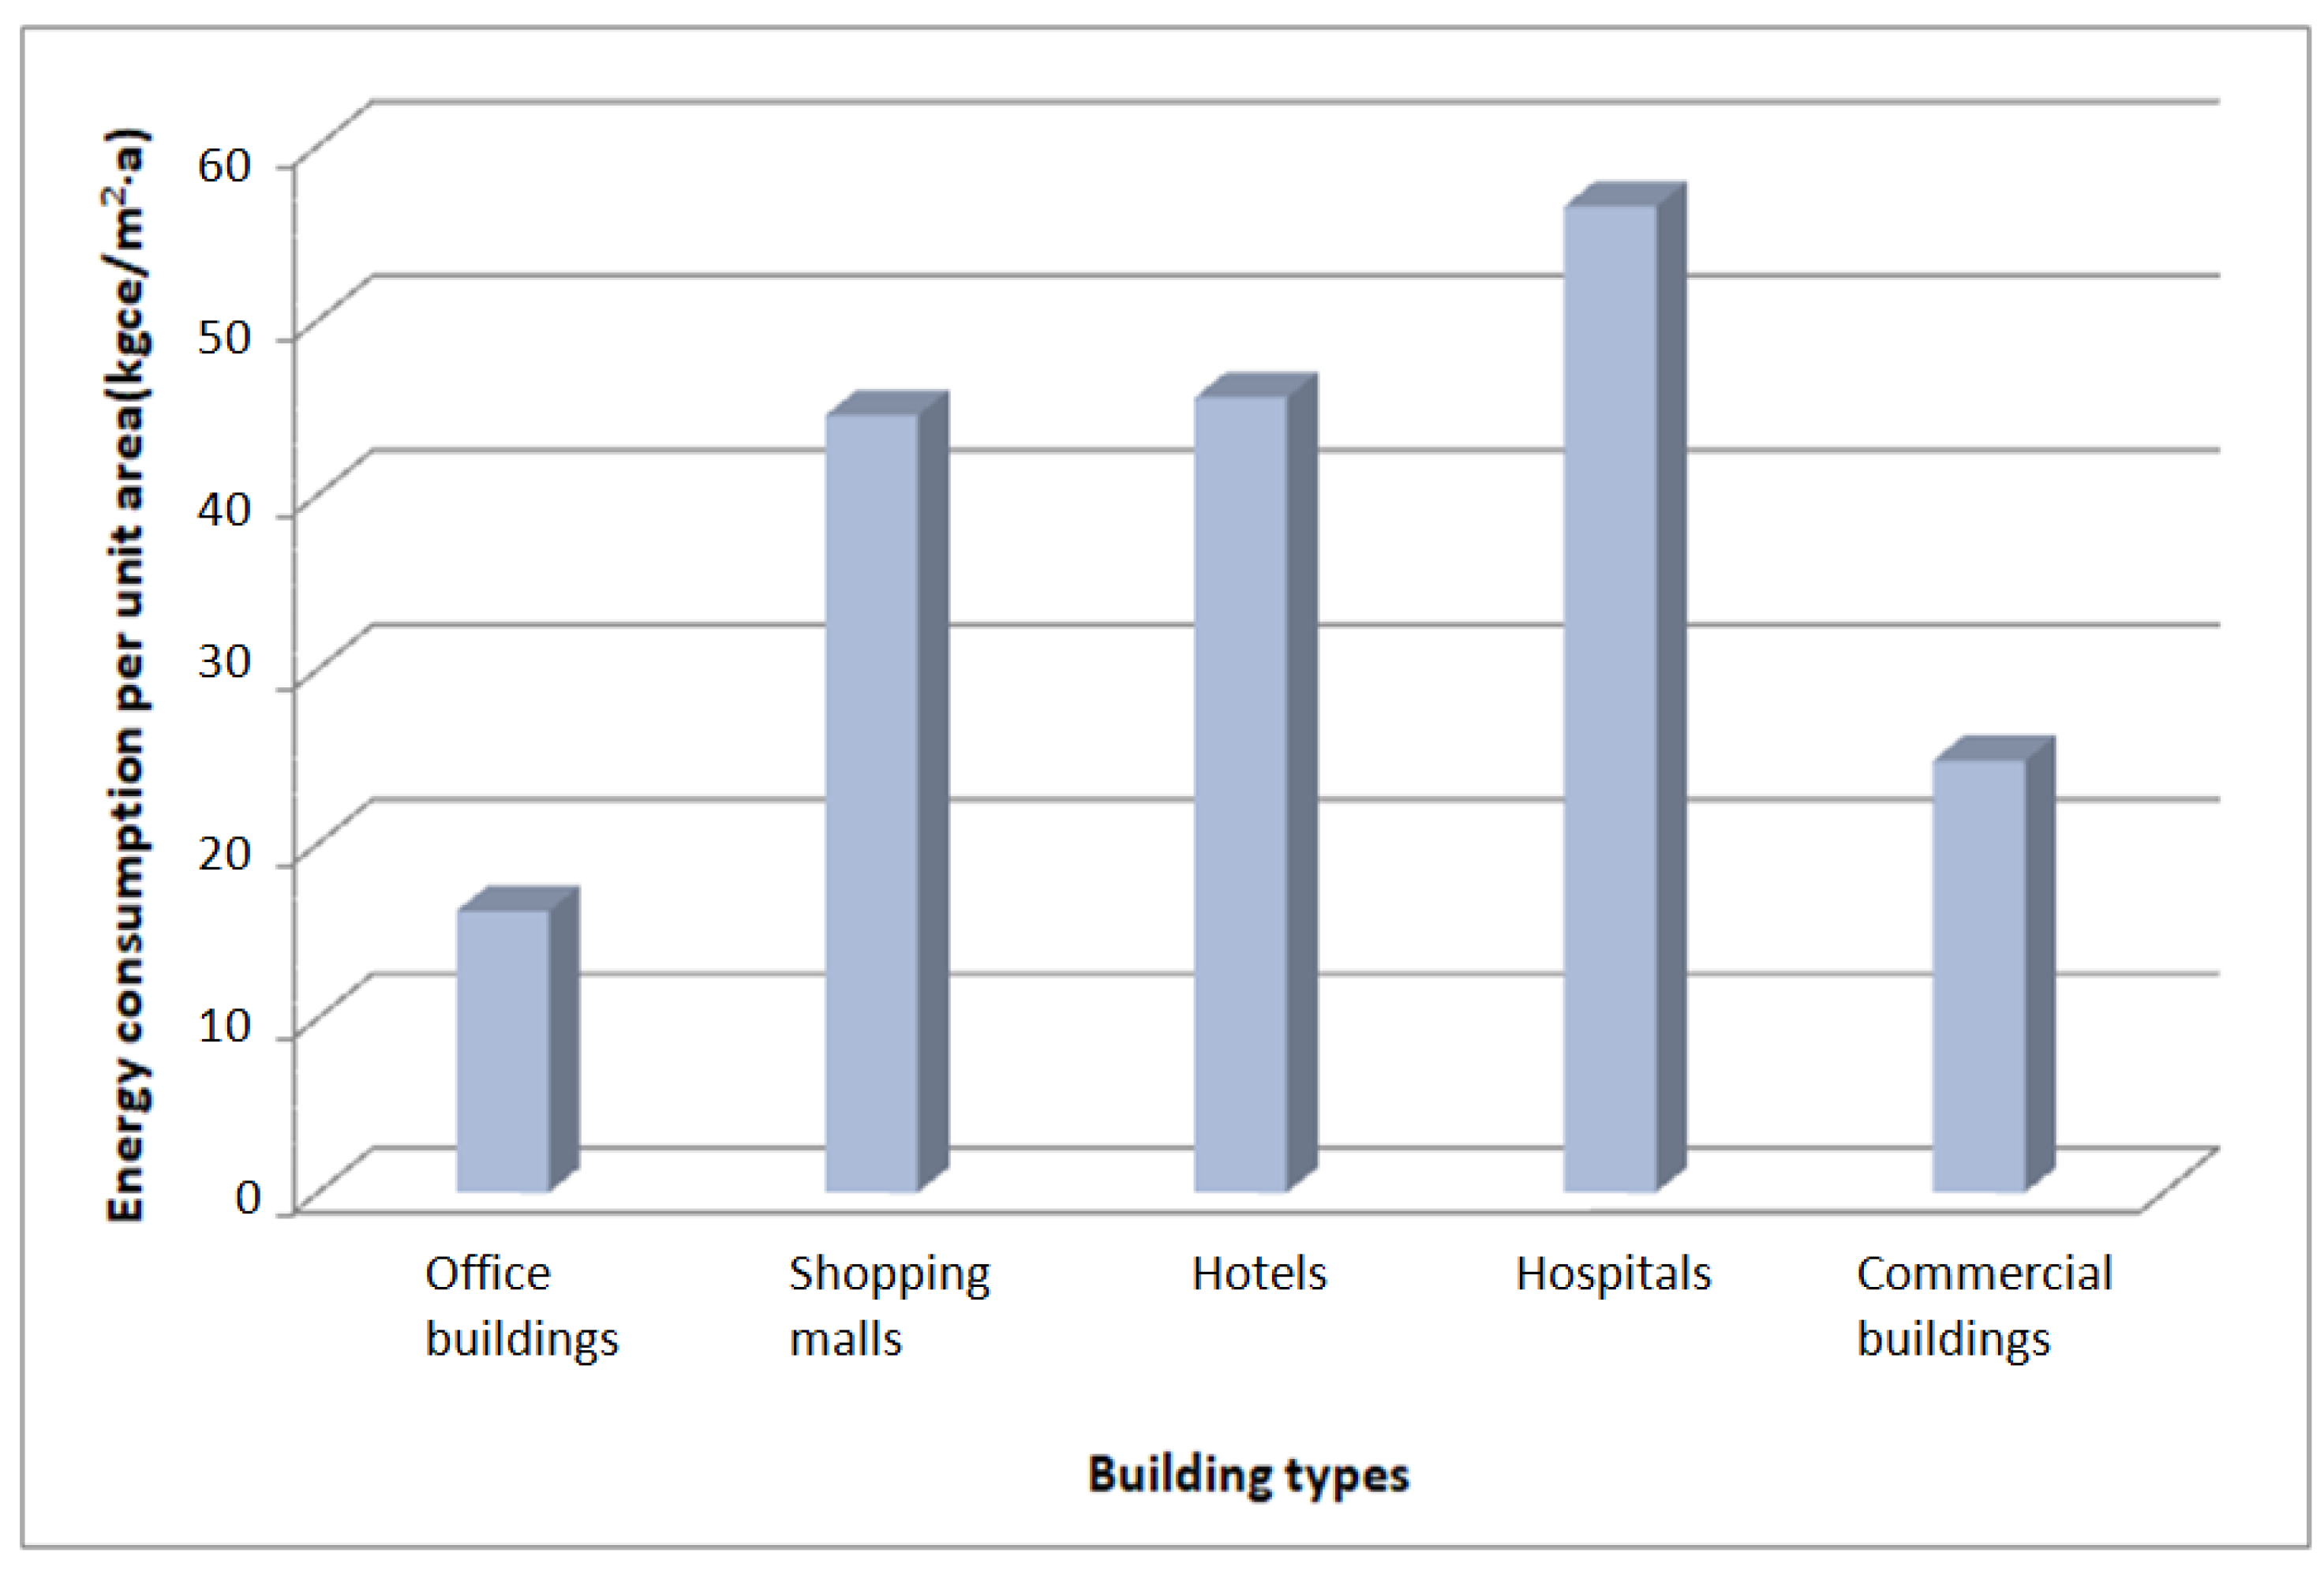
The survey results showed that the energy forms in coastal areas of hot summer and cold winter climatic regions mainly included electricity, coal, natural gas, liquefied petroleum gas, diesel, and steam. The proportion of energy consumption is shown in Figure 5. The average annual energy consumption per square meter of different types of public buildings is presented in Figure 6.
Figure 5.
The proportion of energy consumption structure.
Figure 6.
Average annual energy consumption per square meter of public buildings.
From Figure 5, it can be seen that electricity (84.44%) accounted for the largest proportion of energy consumption, followed by natural gas (9.46%). Energy consumption in the surveyed areas was dominated by electricity and natural gas. Therefore, more attention needs to be paid to the application of energy-saving technologies for electricity and natural gas for building energy conservation.
From Figure 6, it can be observed that hospitals, hotels, and shopping malls showed higher energy consumption than office and commercial buildings. It is necessary to take effective action to enhance their energy efficiency. Compared with these three types of high energy-consuming buildings, the total area of office buildings is larger. Because of the relatively large total building area, it is also important to improve the energy efficiency of office buildings.
3.2. Building Energy Consumption Characteristics and Energy Saving Potential
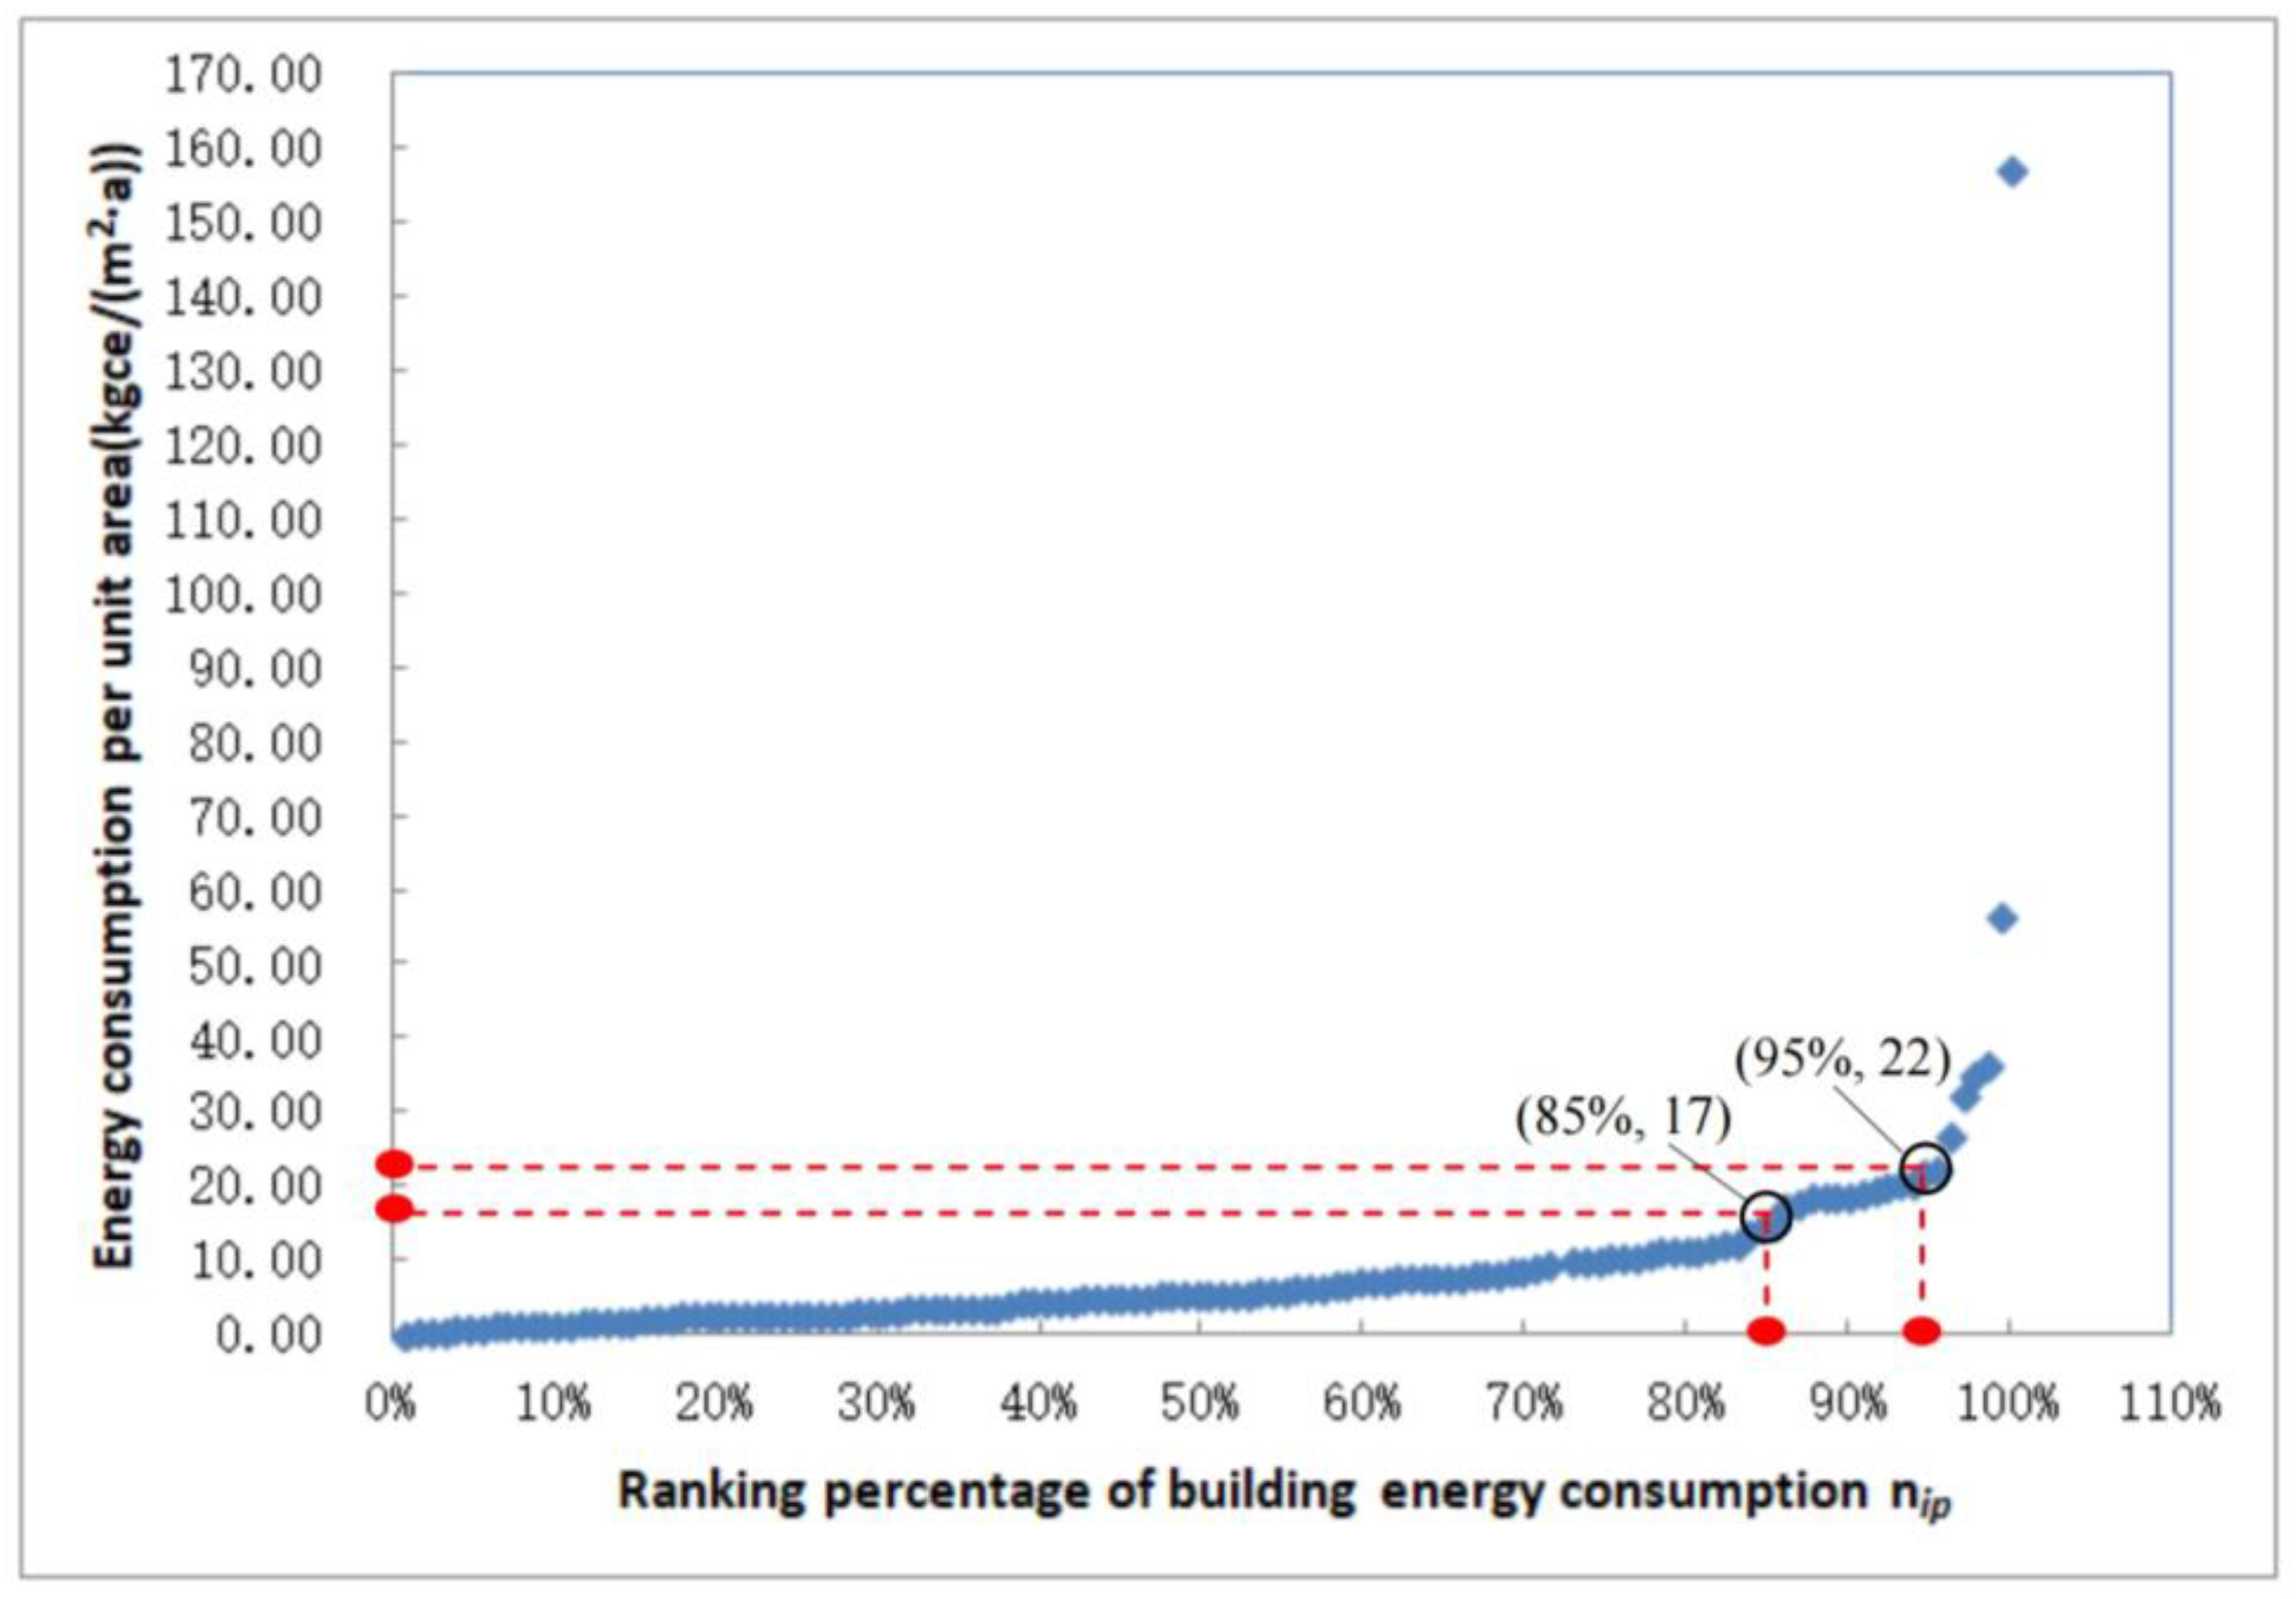
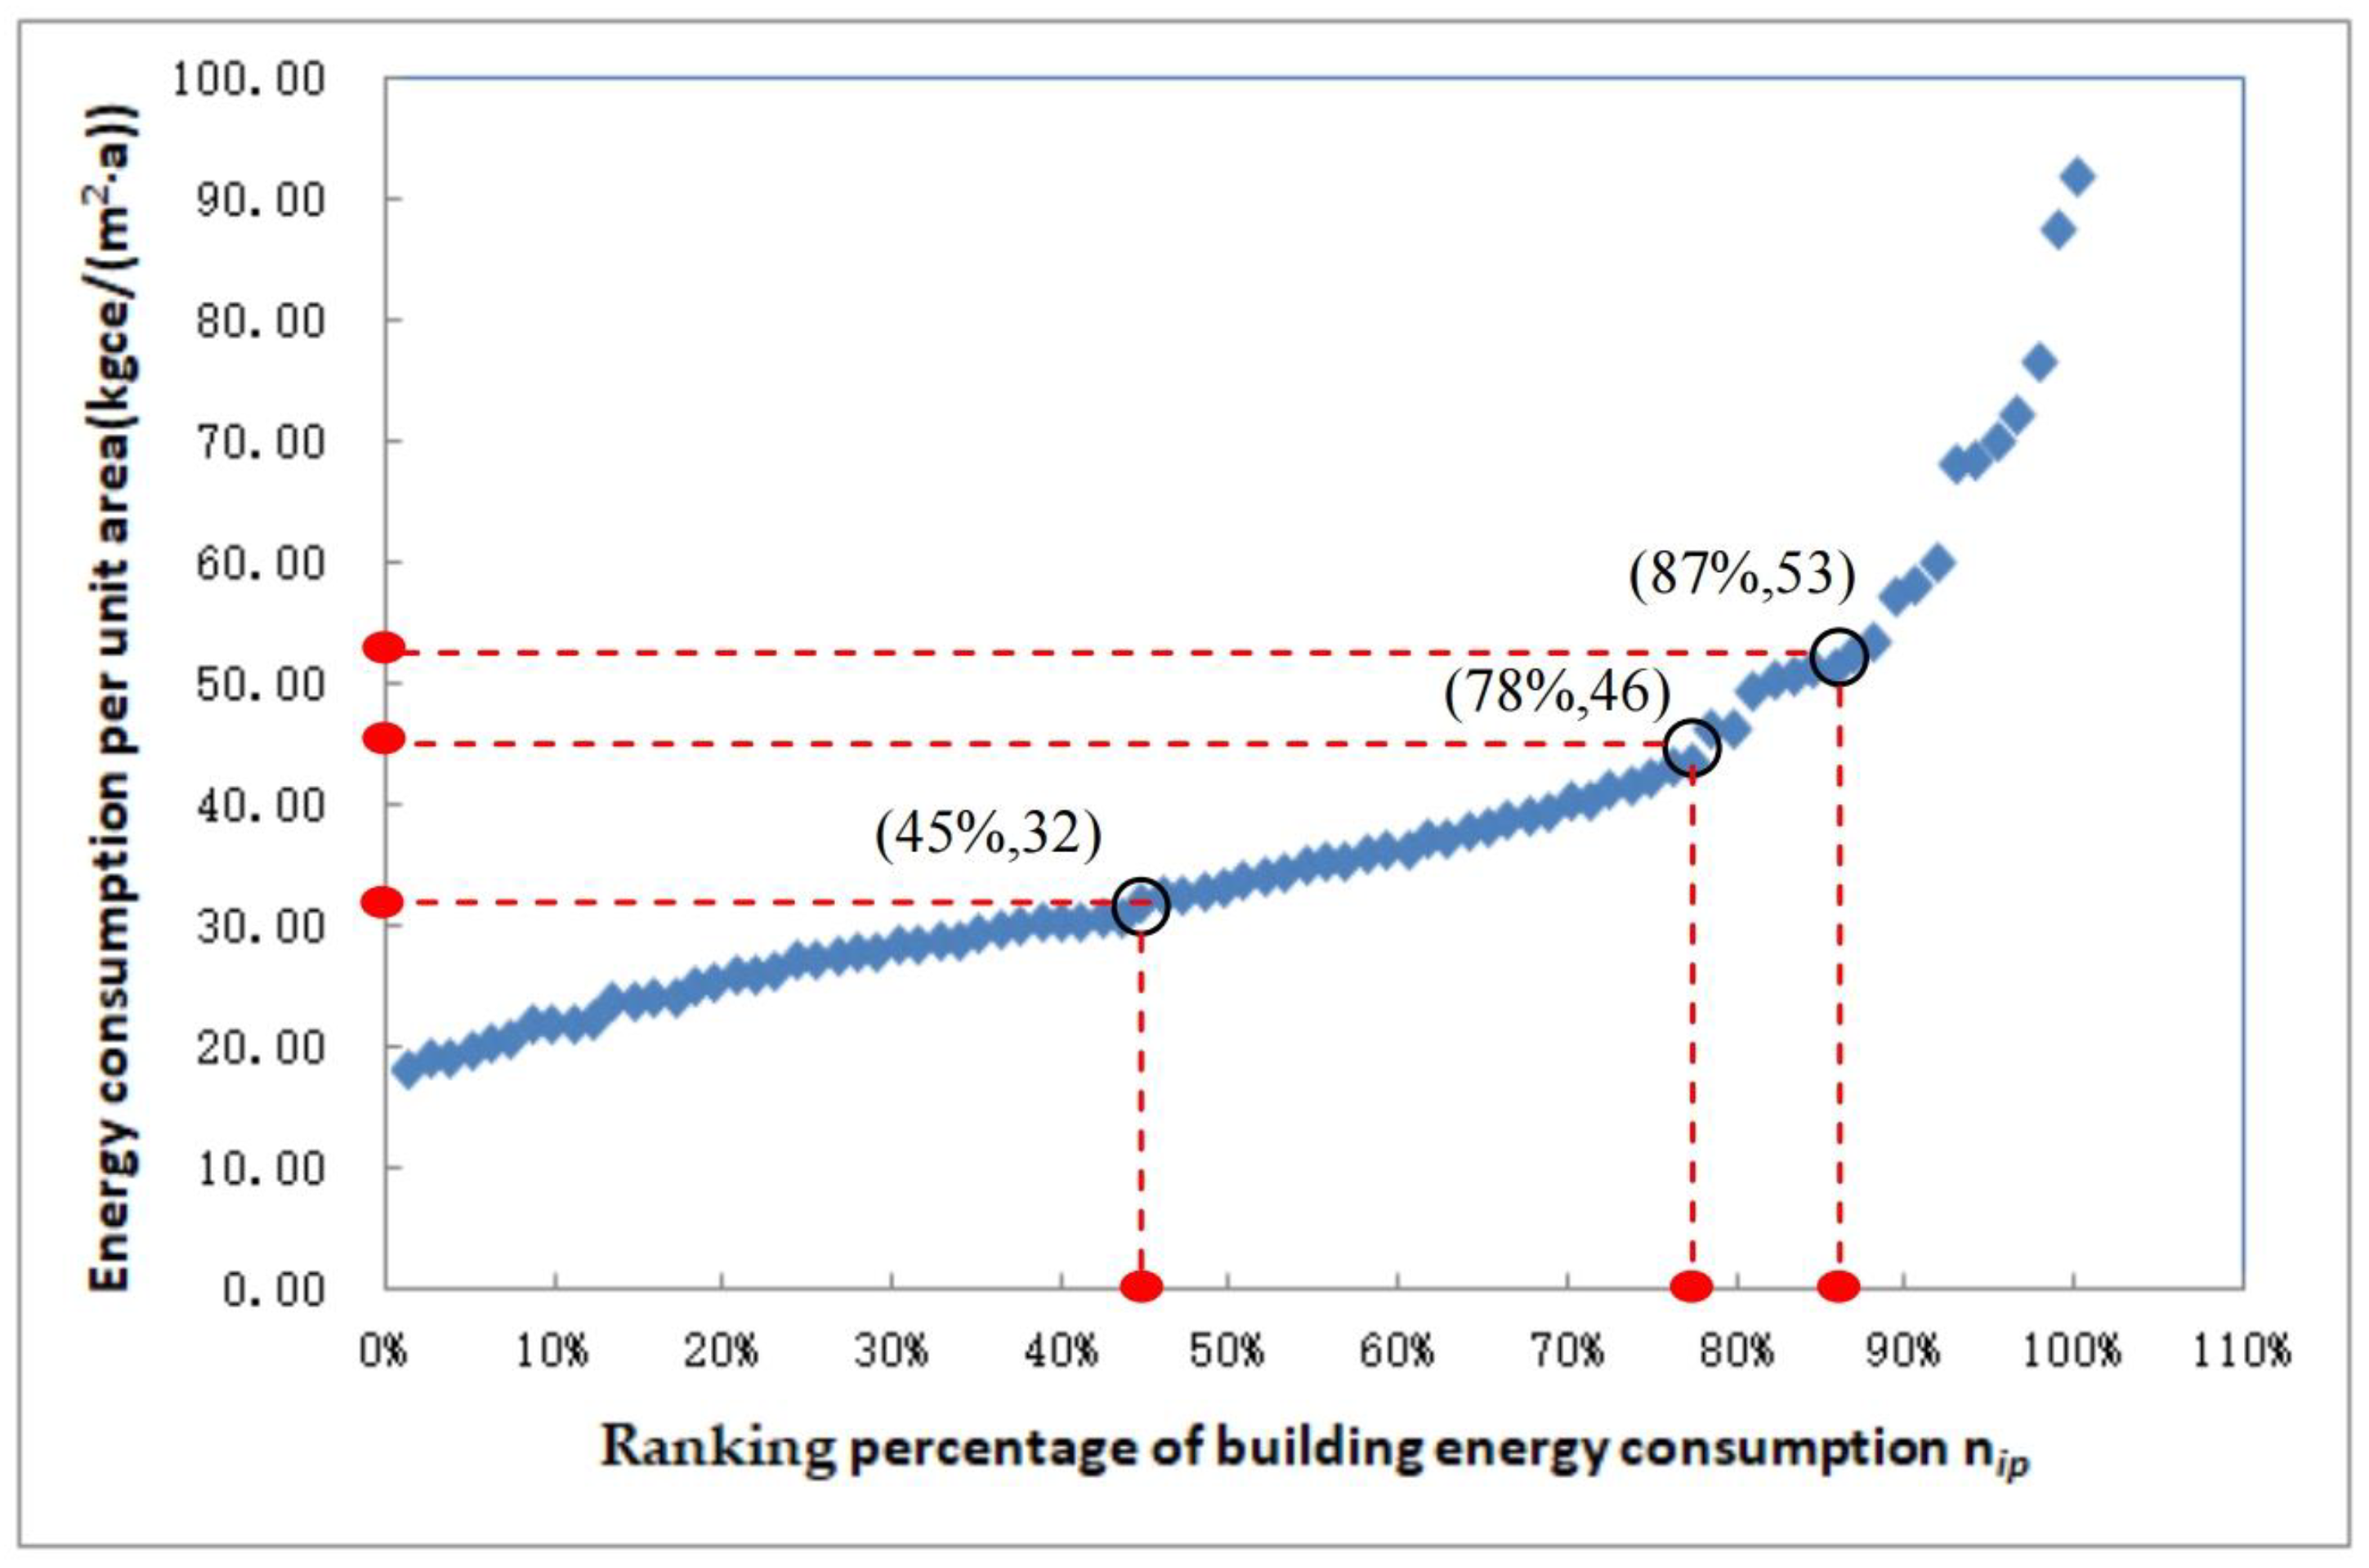
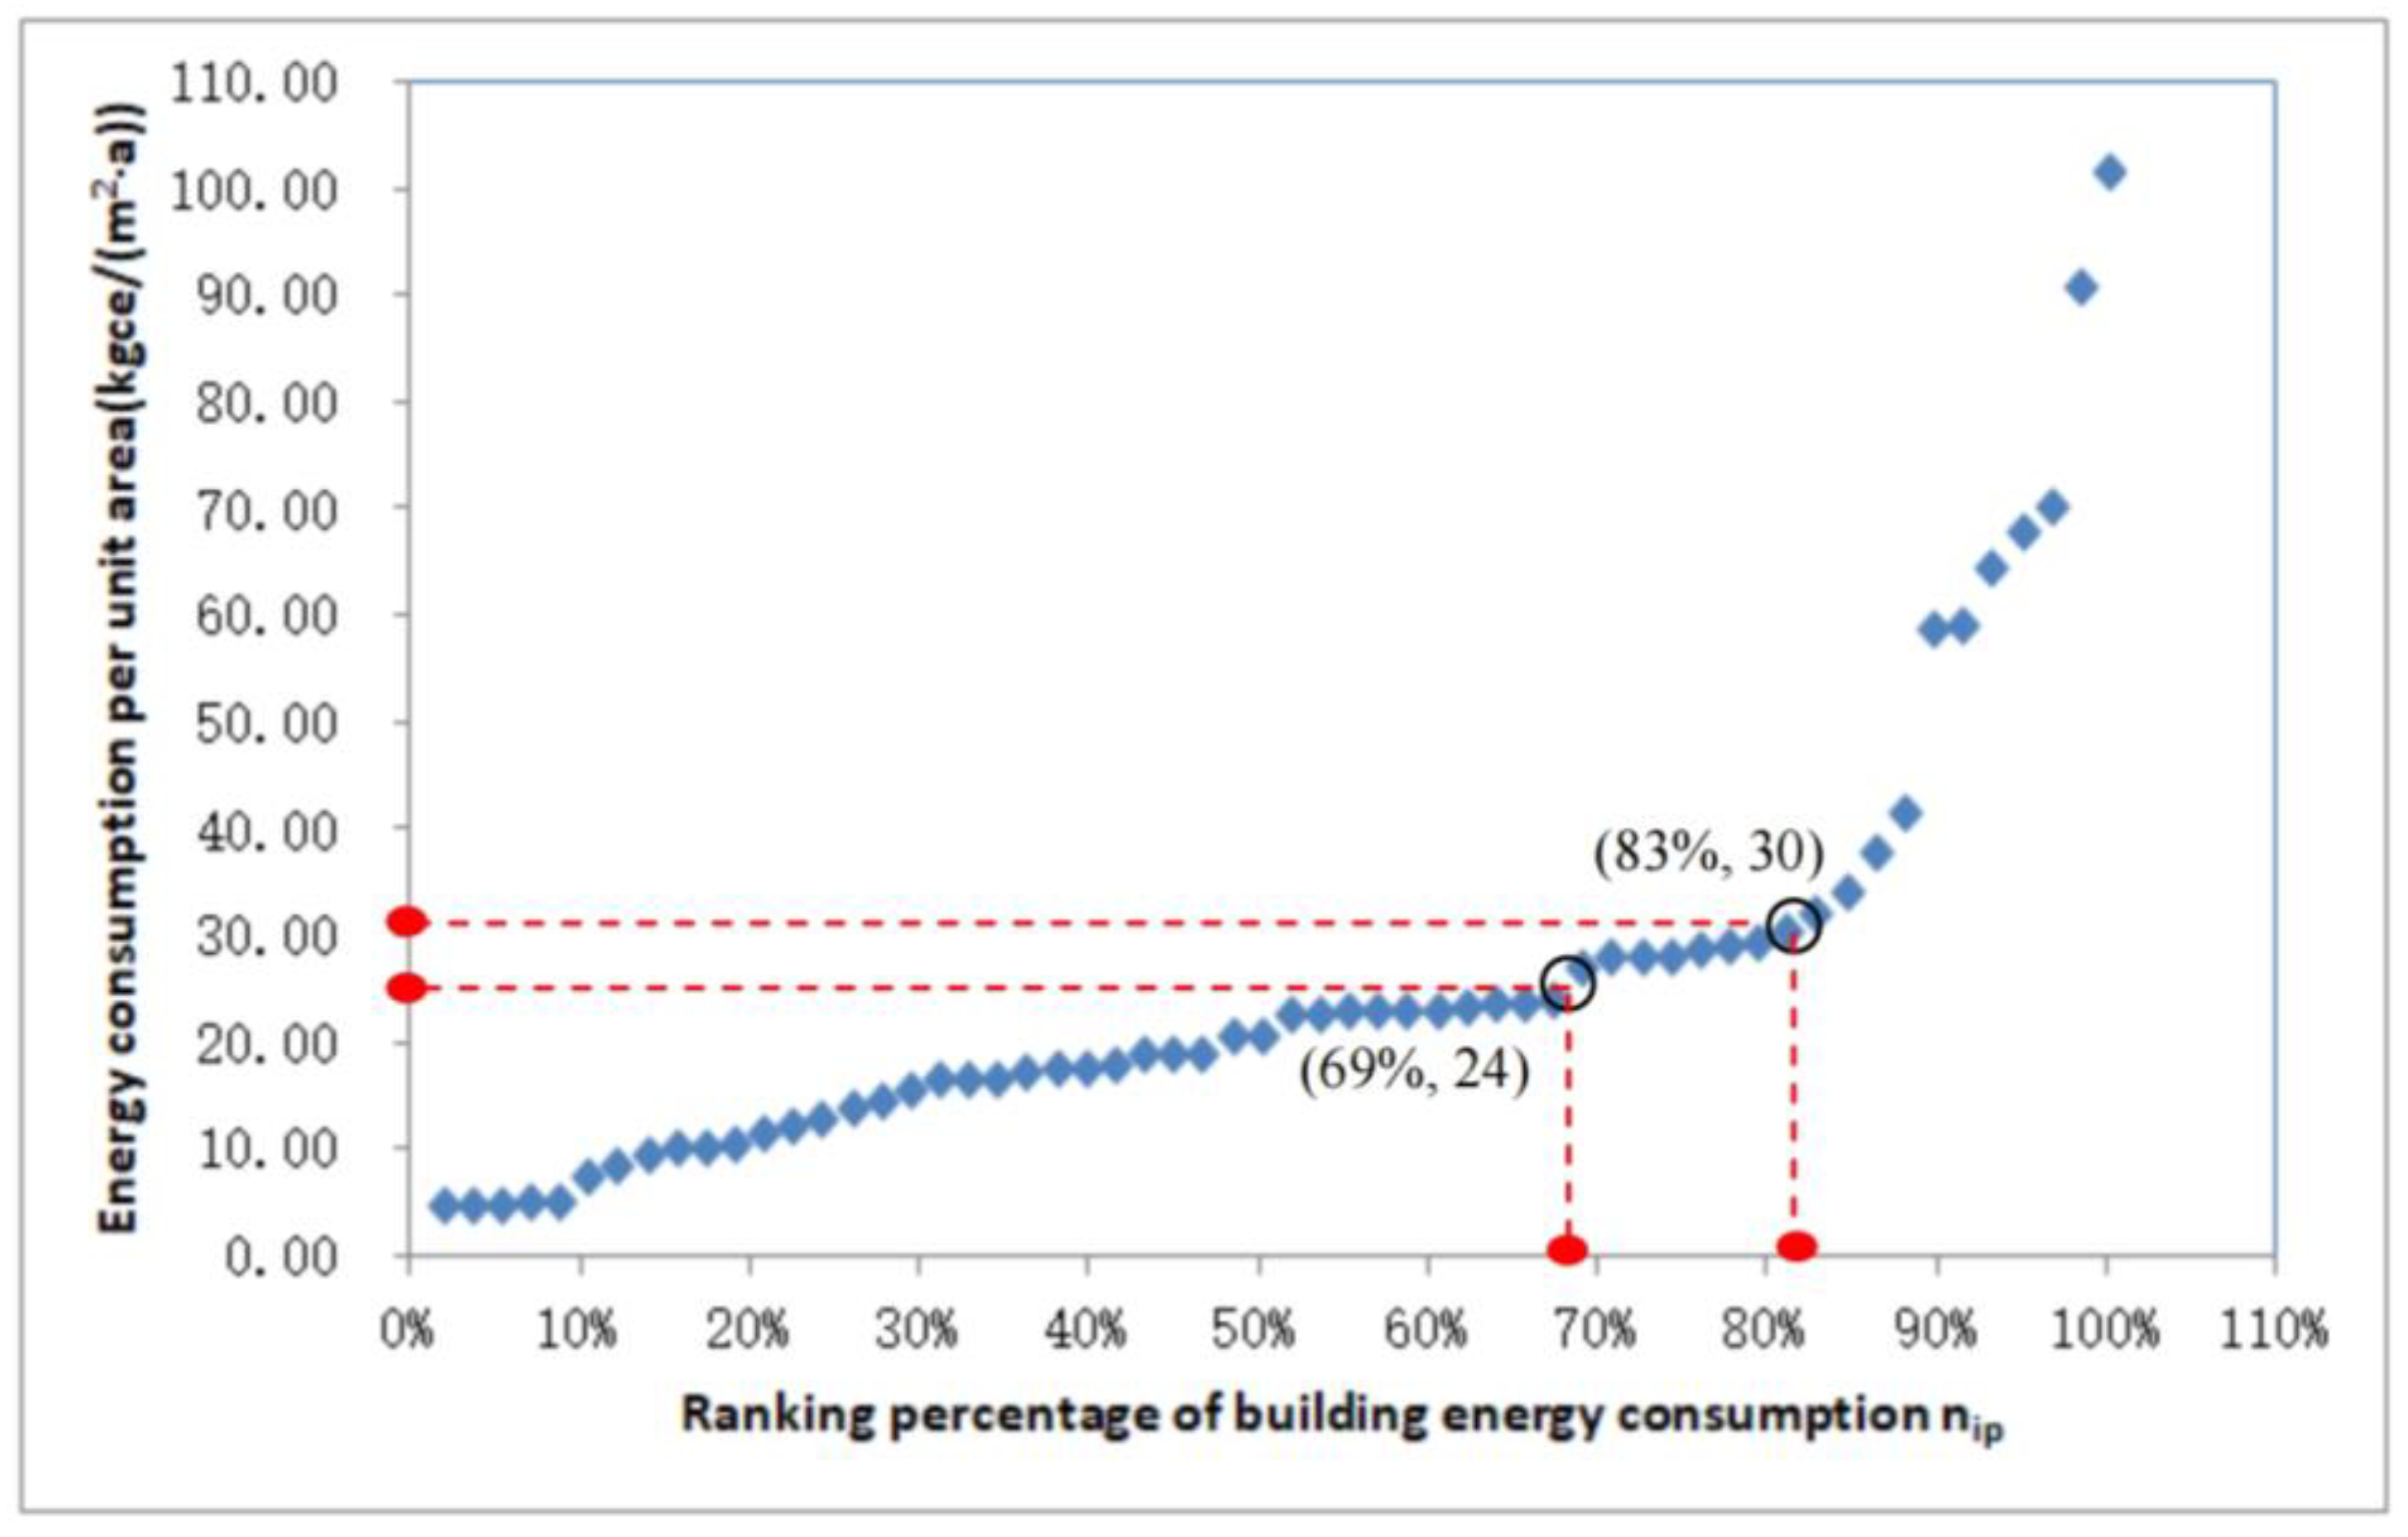
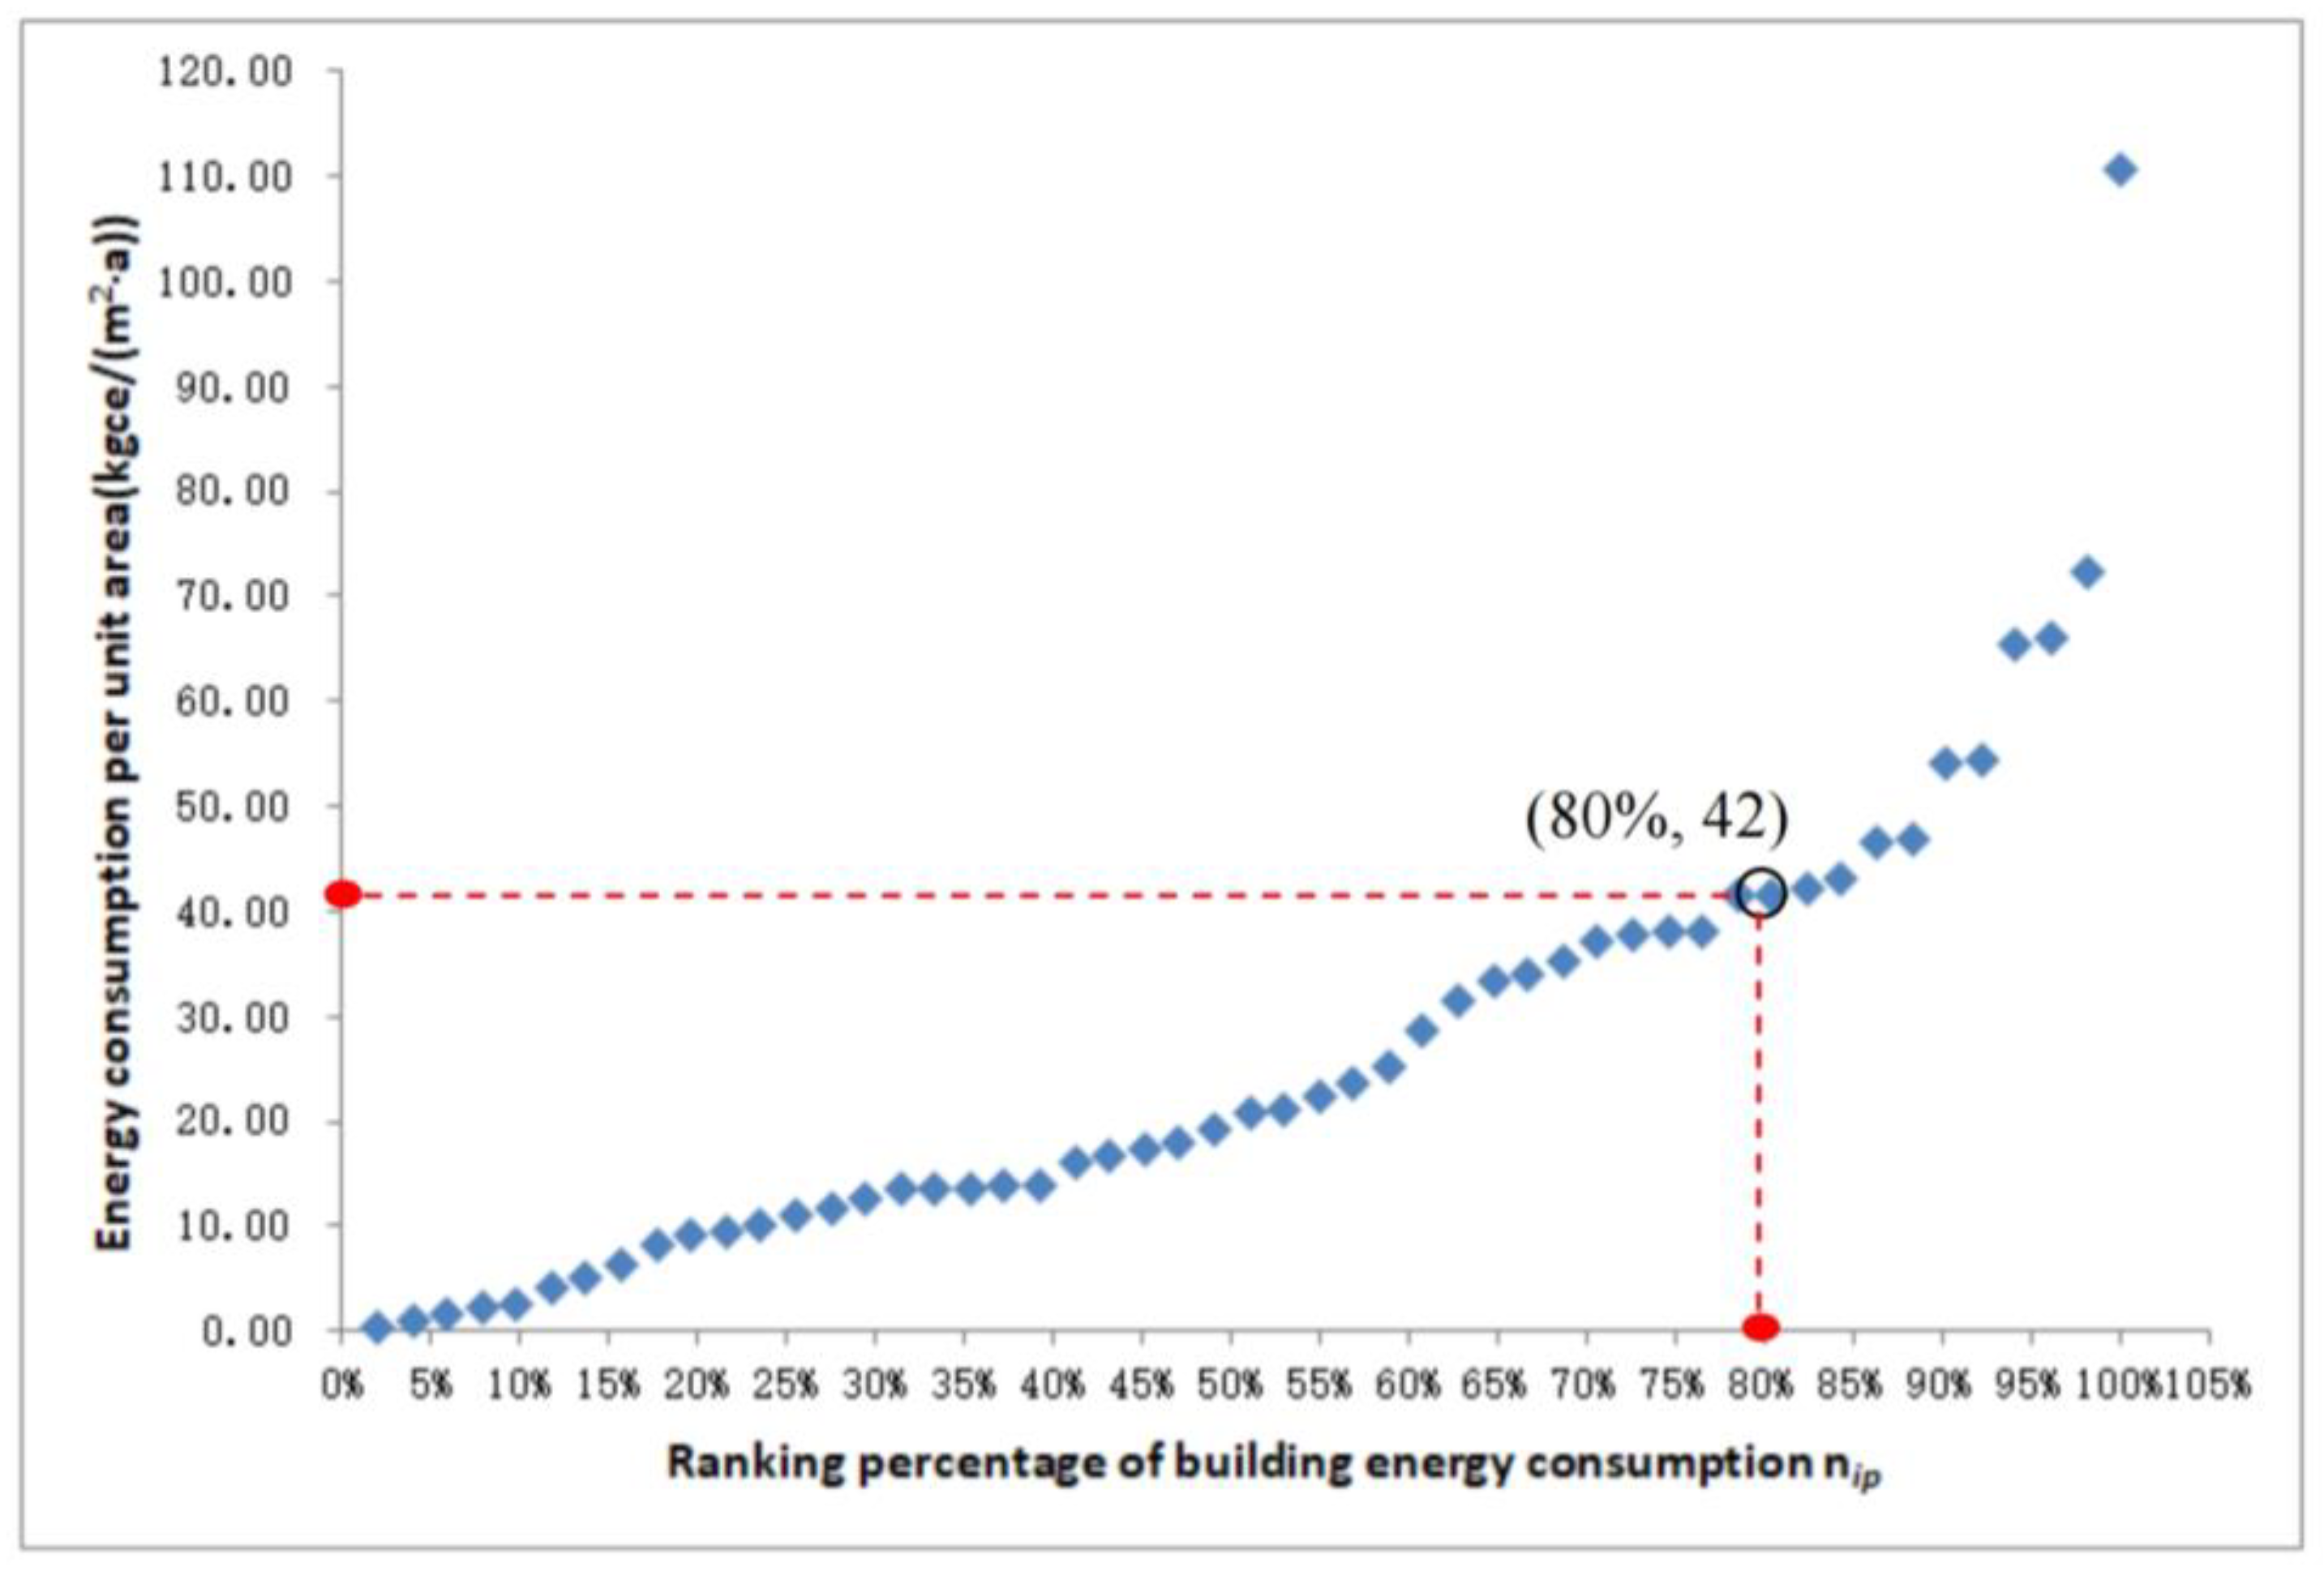
The energy consumption distribution of different types of buildings is shown in Figure 7, Figure 8, Figure 9 and Figure 10. The energy consumption limit (ECL), energy saving potential (ESP), and related calculation parameters are summarized in Table 4.
Figure 7.
Energy consumption distribution in office buildings.
Figure 8.
Energy consumption distribution in hospitals.
Figure 9.
Energy consumption distribution in shopping malls.
Figure 10.
Energy consumption distribution in commercial buildings.
Table 4.
Parameters of energy-saving potential are calculated for different types of buildings.
From Figure 7, it can be seen that the ranked office buildings were divided into three parts by two critical points at (85%, 17) and (95%, 22). The percentage ranking of office buildings between 85% and 95% was classified as high energy-consuming office buildings. When the ranking number is above 95%, the office buildings are identified as ultra-high energy-consuming buildings. A total of 17 kgce/(m2·a) was defined as the benchmark limit for office buildings expressed as ECLB. A total of 22 kgce/(m2·a) was defined as the constraint limit for office buildings expressed as ECLC. According to Equation (1), 38% and 54% of energy-saving potential could be achieved by promoting energy-efficient retrofits and management using the benchmark limits ECLB and ECLC, respectively.
It can be seen from Figure 8 that the percentage ranking number of hospitals ranked below 45% was mainly secondary hospitals. The benchmark limit ECLB for secondary hospitals was 32 kgce/(m2·a). This study did not conduct a detailed analysis of secondary hospitals due to their relatively low energy consumption. For the tertiary hospitals, two critical points (78%, 46) and (87%, 53) were presented in Figure 8. When the percentage ranking number was between 78 and 87% and above 87%, the hospitals were classified as high and ultra-high energy-consuming hospitals, respectively. The energy-saving potential for tertiary hospitals based on 46 kgce/(m2·a) of the benchmark limit ECLB was around 78%. ESP based on 53 kgce/(m2·a) of the constraint limit ECLC was about 87%.
For shopping malls, there were two critical points at (69%, 24) and (83%, 30), as shown in Figure 9. The benchmark limit ECLB and constraint limit ECLC were 24 kgce/(m2·a) and 30 kgce/(m2·a), respectively. The calculated ESP was about 51% and 57% based on ECLB and ECLC, respectively.
For commercial buildings, one critical point at (80%, 42) was presented in Figure 10. The calculated ESP was around 18% based on the 42 kgce/(m2·a) of the benchmark limit ECLB.
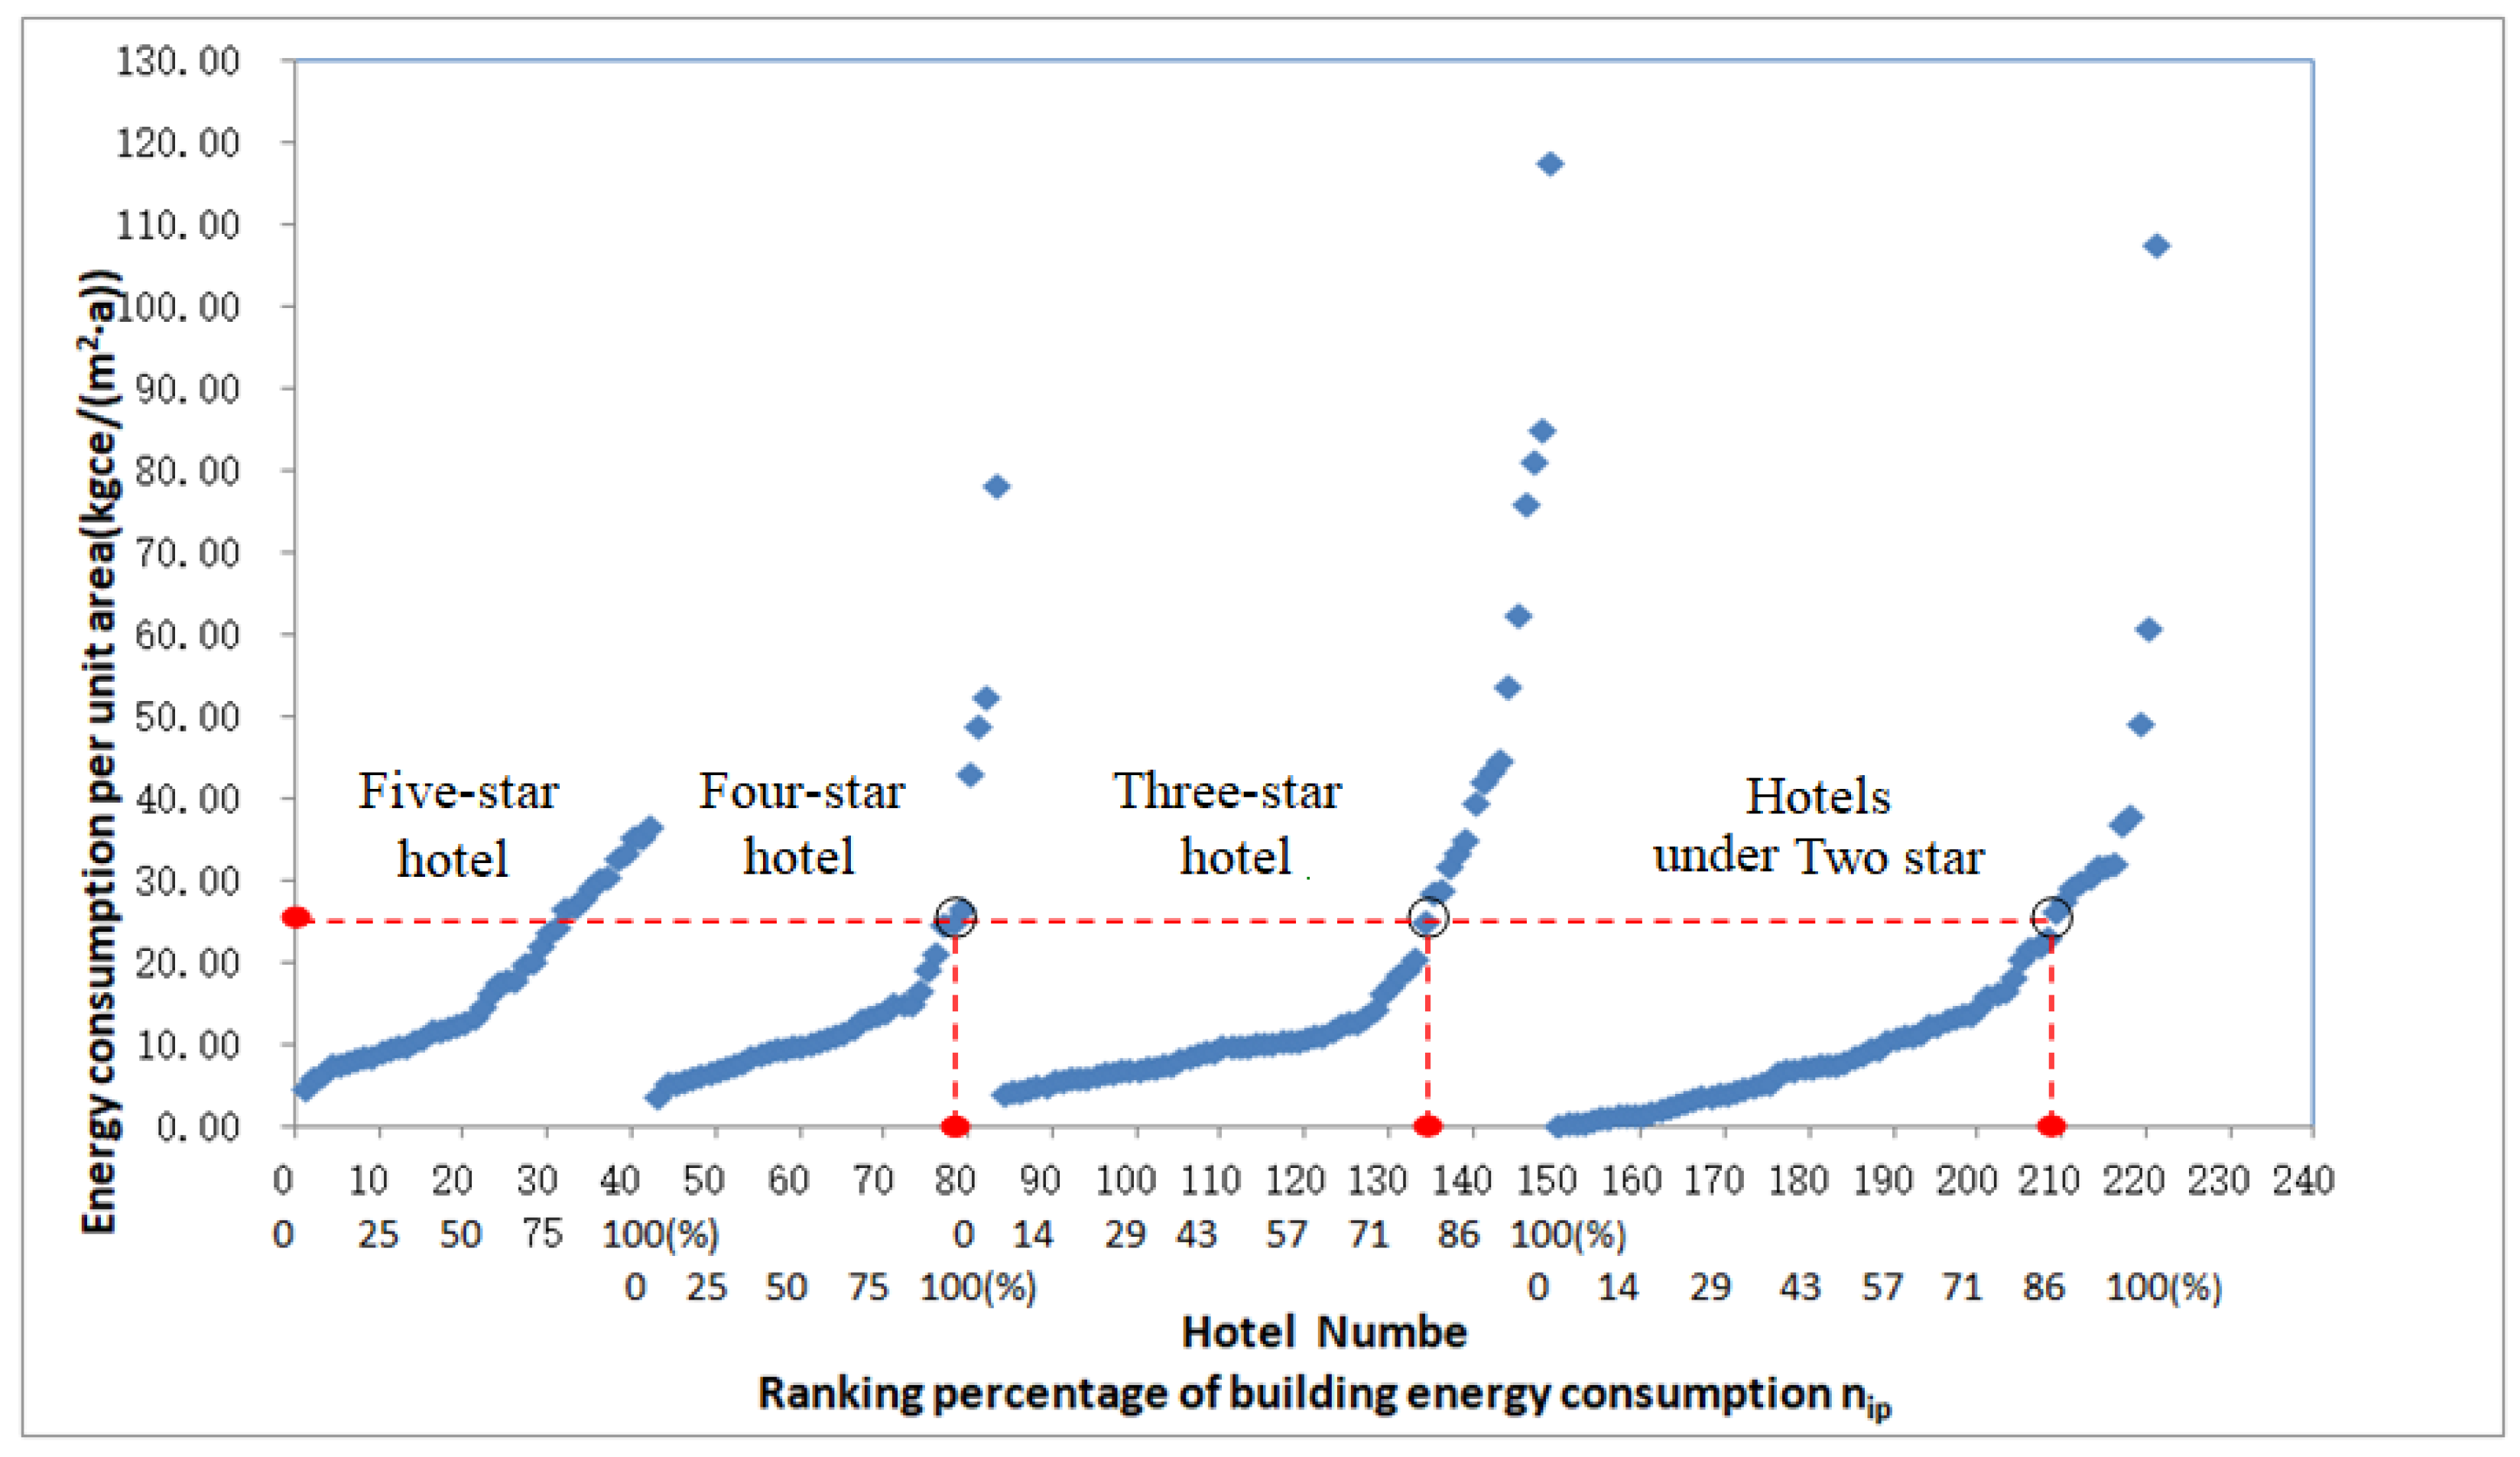
According to the “Rating Standards of Star Hotels of the People’s Republic of China”, the hotels were divided into four classes in this study to analyze the energy consumption characteristics of hotels, which are five-star, four-star, three-star, and one- and two-star hotels.
Figure 11 presents the average annual energy consumption per square meter based on the building ranking for different classes of hotels. The building with the highest energy consumption per square was the three-star hotel. The lowest energy consumption of five-star hotels was higher than that of other star-rating hotels. It was also found that the energy consumption of one- and two-star hotels was even higher than that of five-star hotels. This was mainly due to the operating status and characteristics of hotels. Four- and five-star hotels with high per-capita spending may have a relatively low occupancy rate and poor operating benefits. However, some low-star hotels could receive a large stream of customers due to their unique features, such as specialty restaurants. Therefore, some low-star hotels may consume more energy than high-star hotels. Energy consumption in hotels was not significantly affected by the star rating of influencing factors.
Figure 11.
Energy consumption distribution in hotels.
In addition, a reasonable energy consumption limit and energy-saving potential for various classes of hotels can also be obtained. All-star-rated hotels, except for five-star hotels, have critical points. Their energy consumption benchmark limits for ECLB were very close, around 25 kgce/(m2·a). Buildings with energy consumption above 25 kgce/(m2·a) were classified as high energy-consuming buildings. This benchmark limit was only used as a reference for building energy-saving improvements and was not used as a constraint on energy use because the hotel’s energy consumption was greatly affected by its operating status. The energy-saving potential of four-star, three-star, and one- and two-star hotels was 42%, 51%, and 42%, respectively. For five-star hotels, energy consumption distribution did not show a critical point, resulting in no obvious difference in energy consumption. The energy-saving potential of five-star hotels should be analyzed based on the influencing factors of energy consumption. The energy-saving potential of five-star hotels should be analyzed in combination with the influencing factors.
It can be seen from Table 4 that tertiary hospitals showed the highest energy consumption benchmark limit, followed by hotels and shopping malls. Hotels, shopping malls, and office buildings were the top three types of buildings with high energy-saving potential. Moreover, the energy-saving potential for the high energy-consuming buildings based on the benchmark limits of ECLB all reached more than 18%, and three-star hotels and shopping malls even reached 51%.
3.3. Correlation Analysis of Influencing Factors
The purpose of the correlation analysis is to find the influencing factors that are correlated with energy consumption, which lay the foundation for developing energy consumption evaluation models. Building energy consumption per floor area is generally used as a dependent variable. However, some surveyed buildings consisted of special areas such as catering and dataset centers. In this study, the total building energy consumption was selected as the dependent variable. The independent variables were the various influencing factors. Before conducting the correlation analysis, the z-score and min–max normalization techniques were used to pre-process the data to eliminate the dimension effect of variables.
In this work, office buildings, tertiary hospitals, and five-star hotels with high energy-saving potential and a large total area were selected to analyze the impacts of influencing factors on building energy consumption. Statistical analysis of the parameters was carried out using the SPSS17.0 software. When the Pearson correlation coefficient is less than 0.3, it can be considered that there is no linear correlation between variables [].
For office buildings, eight influencing factors that have a significant correlation with energy consumption were obtained, and the Pearson correlation coefficients are listed in Table 5.
Table 5.
Pearson correlation coefficients between variables influencing factors and energy consumption for office buildings.
As shown in Table 5, the Pearson correlation coefficients between the energy consumption of office buildings and the number of staff, the number of diners, and the floor area were all above 0.9. This indicated that three variables, including the number of staff, number of diners, and floor area, showed a significantly positive linear correlation with the energy consumption of office buildings. For lighting energy consumption and elevator energy consumption, the Pearson correlation coefficients were 0.787 and 0.562, respectively, indicating a certain linear correlation. The energy consumption of office buildings was weakly correlated with the thermal resistance of the building envelope, meteorological parameter (heating degree day), and energy efficiency of the HVAC system because the Pearson correlation coefficients between the building energy consumption and these tree variables were less than 0.3. The thermal resistance of the building envelope and energy efficiency of the HVAC system were found to be negatively correlated to building energy consumption, while there was a positive correlation between the heating degree day and building energy consumption. The influencing factors of thermal resistance of the building envelope, heating degree day, and energy efficiency of the HVAC system showed a weak influence on building energy consumption because the impact of these three factors on the energy consumption of air conditioning systems is smaller than factors such as building area and number of personnel. Even so, in buildings that use air conditioning, these three influencing factors that were weakly correlated with building energy consumption still need to be considered when assessing building energy performance and exploring energy-saving potential.
For tertiary hospitals, the energy consumption data and various influencing factors of hospitals were analyzed and screened using Pearson correlation analysis. Seven influencing factors that are significantly correlated with the building energy consumption of hospitals were obtained. The Pearson correlation coefficients are shown in Table 6.
Table 6.
Pearson correlation coefficients between variables influencing factors and energy consumption for hospitals.
From Table 6, the Pearson correlation coefficients between the energy consumption of tertiary hospitals, the number of hospital admissions, and the number of beds were less than 0.3, which indicated that there is no linear correlation between variables. The number of hospital admissions and number of beds reflected the hospital scale, and energy consumption per square meter was used as the index for correlation analysis, resulting in a weak correlation for the hospital scale. The number of patients and the number of beds were uncontrollable management factors, and their impacts on building energy consumption still need to be considered when evaluating the energy performance of hospitals. In addition, four variables, including the thermal resistance of the building envelope, heating degree day, the energy efficiency of the HVAC system, and the total power of elevators, showed a linear correlation with the energy consumption of tertiary hospitals. Aside from the weak correlation for the factor of heating degree day, the other three factors all presented significant correlations. The thermal resistance of the building envelope and energy efficiency of the HVAC system were found to be negatively correlated with building energy consumption, while the total power of elevators was positively correlated with building energy consumption.
For five-star hotels, the Pearson correlation coefficients are presented in Table 7. It can be seen that the relationship among these 13 variables was very complicated. The principal component analysis was used to transform these significantly correlated variables into five principal components that are independent or uncorrelated from each other []. The principal components were extracted from these 13 variables. The total variance of interpretation is presented in Table 8. The cumulative total variance of interpretation reached 89.01%. The coefficients of each principal component on the thirteen dependent variables are shown in Table 9. The correlation coefficient test for five principal components was carried out, and the results are shown in Table 10.
Table 7.
Pearson correlation coefficients between variables influencing factors and energy consumption for hotels.
Table 8.
Total variance of hotels.
Table 9.
Coefficient matrix of five principal components.
Table 10.
Coefficients of the five principal components.
From Table 9, it can be seen that the principal component PC1 is a parameter related to the total scale of the hotel, PC2 is a parameter related to the capacity and performance of hotel power equipment, PC3 is a parameter related to the area of hotel fitness and leisure venues, PC4 is a parameter related to lighting and elevator power, and PC5 is a parameter related to operating content such as cold storage capacity and meeting room area.
From Table 10, it can be seen that the five principal components were independent of each other, and the correlation coefficient between standard coal and the first principal component reached 0.956, indicating that the main influencing factor of standard coal was the first principal component. It can also be seen from Table 9 that the first principal component was mainly determined by the total floor area, turnover, number of booking rooms, number of staff, floor area of the canteen, floor area of the kitchen, and total power of elevators.
3.4. Suggestions for Improving Energy Efficiency
Based on the results of this survey, the following suggestions are proposed to improve the energy efficiency of the surveyed buildings in hot summer and cold winter areas:
- (1)
- The three types of buildings with the highest energy consumption benchmark limit are tertiary hospitals, hotels, and shopping malls. This means that these three types of buildings have the highest energy consumption when the buildings’ areas are the same. In response to the requirement of “carbon peak and carbon neutrality”, the energy efficiency of tertiary hospitals, hotels, and shopping malls should be significantly improved.
- (2)
- In each type of building, based on the benchmark limit ECLB, the energy-saving potential of each type of building was evaluated. It can be concluded that tertiary hospitals showed the highest energy consumption benchmark limit, followed by hotels and shopping malls. Hotels, shopping malls, and office buildings were the top three types of buildings with high energy-saving potential. Moreover, energy saving potential for the high energy-consuming buildings based on the benchmark limits of ECLB all reached more than 18%, and three-star hotels and shopping malls even reached 51%. Therefore, energy-saving renovation with three-star hotels, shopping malls, and office buildings is essential. For buildings that exceed the baseline, it is necessary to evaluate their energy consumption rationality and use appropriate technical and management measures to reduce their energy consumption.
- (3)
- This study examined the correlation between energy consumption and influencing factors in office buildings, terminal hospitals, and five-star hotels. Based on the research results, the factors with a high correlation with energy consumption should be considered in energy-saving renovations for various buildings to achieve more energy efficiency improvement.
4. Conclusions
This paper presents a statistical investigation of the energy consumption and influencing factors of five types of public buildings, including office buildings, shopping malls, hotels, hospitals, and commercial buildings, in a hot summer and cold winter zone in eastern coastal China. More than 2000 public buildings with 10-year real data on energy consumption were surveyed, and 1339 buildings with available data were used to analyze energy-saving potential (ESP) and the impacts of various influencing factors on building energy performance.
Based on the survey data, shopping malls, hotels, and office buildings were identified as the top three types of buildings with high energy consumption, which should be the focus of building energy conservation management. The concept of energy consumption limit (ECL) was proposed to identify high-energy-consuming buildings and determine their energy-saving potential. It was found that tertiary hospitals had the highest benchmark limit ECLB, followed by hotels and shopping malls. The highest ESP based on the benchmark limit ECLB was three-star hotels, followed by shopping malls and office buildings. ESP for the high energy-consuming buildings based on the benchmark limits all reached more than 18%, and three-star hotels and shopping malls even achieved 51%.
In addition, the impacts of various influencing factors on the energy consumption of office buildings, tertiary hospitals, and five-star hotels were carried out using Pearson correlation analysis and principal component analysis. The main factors that should be considered in the evaluation of building energy performance were identified, which laid the foundation for the development of building energy performance assessment and fault detection and diagnosis tools.
The results of this research could provide guidance for improving building energy efficiency in hot summer and cold winter areas, helping determine the types of high energy-consuming buildings and the main influencing factors of energy consumption, selecting cost-effective renovation options, effectively improving building energy efficiency, and achieving building energy conservation and carbon reduction.
Author Contributions
Conceptualization, X.G.; methodology, X.G. and J.C.; software, J.C.; validation, X.G., Y.L. and Z.M.; formal analysis, X.G. and Y.L.; investigation, X.G., S.H., B.P. and X.L.; resources, X.G.; data curation, X.G., S.H. and J.C.; writing—original draft preparation, X.G. and Y.L.; writing—review and editing, X.G., Z.M. and Y.L.; visualization, J.C.; supervision, Z.M.; project administration, X.G.; funding acquisition, X.G. All authors have read and agreed to the published version of the manuscript.
Funding
This research was supported by Zhejiang Provincial Natural Science Foundation of China under Grant No. LGF22E060002 and Ningbo Public Welfare Science and Technology Project of China under Grant No. 2021S096.
Data Availability Statement
Not applicable.
Acknowledgments
Thanks to all the students and teachers of Ningbo Institute of Engineering who participated in the energy consumption dataset survey and for the support of the GEF project. The authors also would like to express their gratitude for the support of the Ningbo Public Welfare Science and Technology Project of China under Grant No. 2021S096 and the Zhejiang Provincial Natural Science Foundation of China under Grant No. LGF22E060002.
Conflicts of Interest
The authors declare no conflict of interest.
Abbreviations
| UNEP | United Nations Environment Programme |
| EPBD | Energy Performance of Buildings Directive |
| FDD | Fault detection and diagnosis |
| GFA | Percentage of gross floor area |
| ECL | Energy consumption limit |
| ESP | Energy-saving potential |
| HVAC | Heating, ventilating, and air conditioning |
References
- IEA. Global Status Report for Buildings and Construction 2019; IEA: Paris, France, 2019; Available online: https://www.iea.org/reports/global-status-report-for-buildings-and-construction-2019 (accessed on 17 July 2023).
- Building Energy Consumption Report, 2020. China. Available online: https://cabee.org/site/content/24021.html (accessed on 17 July 2023).
- Building Energy Consumption and Carbon Emission Data Special Committee of China Building Energy Efficiency Association. 2022 China Building Energy Consumption and Carbon Emission Research Report; Building Energy Consumption and Carbon Emission Data Special Committee of China Building Energy Efficiency Association: Chongqing, China, 2022. [Google Scholar]
- United Nations Environmental Program (UNEP); United States Environmental Protection Agency (EPA). Reducing Greenhouse Gas Emissions: The Role of Voluntary Programs; United Nations Environmental Program Publication: Nairobi, Kenya, 1997.
- Poel, B.; van Cruchten, G.; Balaras, C.A. Energy performance assessment of existing dwellings. Energy Build. 2007, 39, 393–403. [Google Scholar] [CrossRef]
- Li, Z.; Han, Y.; Xu, P. Methods for benchmarking building energy consumption against its past or intended performance: An overview. Appl. Energy 2014, 124, 325–334. [Google Scholar] [CrossRef]
- Seyedzadeh, S.; Rahimian, F.P. Data-Driven Modelling of Non-Domestic Buildings Energy Performance; Green Energy and Technology; Springer: Cham, Switzerland, 2021. [Google Scholar] [CrossRef]
- Ma, Z.; Cooper, P.; Daly, D.; Ledo, L. Existing building retrofits: Methodology and state-of-the-art. Energy Build. 2012, 55, 889–902. [Google Scholar] [CrossRef]
- Deb, C.; Schlueter, A. Review of data-driven energy modelling techniques for building retrofit. Renew. Sustain. Energy Rev. 2021, 144, 110990. [Google Scholar] [CrossRef]
- Hong, T.; Koo, C.; Kim, J.; Lee, M.; Jeong, K. A review on sustainable construction management strategies for monitoring, diagnosing, and retrofitting the building’s dynamic energy performance: Focused on the operation and maintenance phase. Appl. Energy 2015, 155, 671–707. [Google Scholar] [CrossRef]
- Molina-Solana, M.; Ros, M.; Ruiz, M.D.; Gómez-Romero, J.; Martin-Bautista, M.J. Data science for building energy management: A review. Renew. Sustain. Energy Rev. 2017, 70, 598–609. [Google Scholar] [CrossRef]
- Pérez-Lombard, L.; Ortiz, J.; González, R.; Maestre, I.R. A review of benchmarking, rating and labelling concepts within the framework of building energy certification schemes. Energy Build. 2009, 41, 272–278. [Google Scholar] [CrossRef]
- Yan, C.; Wang, S.; Xiao, F.; Gao, D. A multi-level energy performance diagnosis method for energy information poor buildings. Energy 2015, 83, 189–203. [Google Scholar] [CrossRef]
- Masuda, H.; Claridge, D.E. Statistical modeling of the building energy balance variable for screening of metered energy use in large commercial buildings. Energy Build. 2014, 77, 292–303. [Google Scholar] [CrossRef]
- Bynum, J.D.; Claridge, D.E.; Curtin, J.M. Development and testing of an Automated Building Commissioning Analysis Tool (ABCAT). Energy Build. 2012, 55, 607–617. [Google Scholar] [CrossRef]
- Du, Z.; Fan, B.; Jin, X.; Chi, J. Fault detection and diagnosis for buildings and HVAC systems using combined neural networks and subtractive clustering analysis. Build. Environ. 2014, 73, 1–11. [Google Scholar] [CrossRef]
- Yan, C.; Wang, S.; Xiao, F. A simplified energy performance assessment method for existing buildings based on energy bill disaggregation. Energy Build. 2012, 55, 563–574. [Google Scholar] [CrossRef]
- Field, J.; Soper, J.; Jones, P.; Bordass, W.; Grigg, P. Energy performance of occupied non-domestic buildings: Assessment by analysing end-use energy consumptions. Build. Serv. Eng. Res. Technol. 1997, 18, 39–46. [Google Scholar] [CrossRef]
- Wang, H.; Xu, P.; Lu, X.; Yuan, D. Methodology of comprehensive building energy performance diagnosis for large commercial buildings at multiple levels. Appl. Energy 2016, 169, 14–27. [Google Scholar] [CrossRef]
- Zhao, Y.; Li, T.; Zhang, X.; Zhang, C. Artificial intelligence-based fault detection and diagnosis methods for building energy systems: Advantages, challenges and the future. Renew. Sustain. Energy Rev. 2019, 109, 85–101. [Google Scholar] [CrossRef]
- Borgstein, E.H.; Lamberts, R.; Hensen, J.L.M. Evaluating energy performance in non-domestic buildings: A review. Energy Build. 2016, 128, 734–755. [Google Scholar] [CrossRef]
- Yan, C. Energy Performance Assessment and Diagnosis for Information Poor Buildings. Ph.D. Thesis, The Hong Kong Polytechnic University, Hong Kong, China, 2013. [Google Scholar]
- Yoshino, H.; Hong, T.; Nord, N. IEA EBC annex 53: Total energy use in buildings—Analysis and evaluation methods. Energy Build. 2017, 152, 124–136. [Google Scholar] [CrossRef]
- Bourdeau, M.; Zhai, X.; Nefzaoui, E.; Guo, X.; Chatellier, P. Modeling and forecasting building energy consumption: A review of data-driven techniques. Sustain. Cities Soc. 2019, 48, 101533. [Google Scholar] [CrossRef]
- Li, Z.; Peng, S.; Cai, W.; Cao, S.; Wang, X.; Li, R.; Ma, X. Impacts of Building Microenvironment on Energy Consumption in Office Buildings: Empirical Evidence from the Government Office Buildings in Guangdong Province, China. Buildings 2023, 13, 481. [Google Scholar] [CrossRef]
- Ji, R.; Qu, S. Investigation and Evaluation of Energy Consumption Performance for Hospital Buildings in China. Sustainability 2019, 11, 1724. [Google Scholar] [CrossRef]
- Sun, Y.; Kojima, S.; Nakaohkubo, K.; Zhao, J.; Ni, S. Analysis and Evaluation of Indoor Environment, Occupant Satisfaction, and Energy Consumption in General Hospital in China. Buildings 2023, 13, 1675. [Google Scholar] [CrossRef]
- Gu, J.; Xu, P.; Ji, Y. A Fast Method for Calculating the Impact of Occupancy on Commercial Building Energy Consumption. Buildings 2023, 13, 567. [Google Scholar] [CrossRef]
- Sheng, Y.; Miao, Z.; Zhang, J.; Lin, X.; Ma, H. Energy consumption model and energy benchmarks of five-star hotels in China. Energy Build. 2018, 165, 286–292. [Google Scholar] [CrossRef]
- Shao, M.; Wang, X.; Bu, Z.; Chen, X.; Wang, Y. Prediction of energy consumption in hotel buildings via support vector machines. Sustain. Cities Soc. 2020, 57, 102128. [Google Scholar] [CrossRef]
- Salehi, M.; Filimonau, V.; Asadzadeh, M.; Ghaderi, E. Strategies to improve energy and carbon efficiency of luxury hotels in Iran. Sustain. Prod. Consum. 2021, 26, 1–15. [Google Scholar] [CrossRef]
- Priyadarsini, R.; Xuchao, W.; Eang, L.S. A study on energy performance of hotel buildings in Singapore. Energy Build. 2009, 41, 1319–1324. [Google Scholar] [CrossRef]
- Wang, J. A study on the energy performance of hotel buildings in Taiwan. Energy Build. 2012, 49, 268–275. [Google Scholar] [CrossRef]
- Bohdanowicz, P.; Martinac, I. Determinants and benchmarking of resource consumption in hotels—Case study of Hilton International and Scandic in Europe. Energy Build. 2007, 39, 82–95. [Google Scholar] [CrossRef]
- Xin, Y.; Lu, S.; Zhu, N.; Wu, W. Energy consumption quota of four- and five-star luxury hotel buildings in Hainan province, China. Energy Build. 2012, 45, 250–256. [Google Scholar] [CrossRef]
- Chan, W.W.; Lam, J.C. Prediction of pollutant emission through electricity consumption by the hotel industry in Hong Kong. Int. J. Hosp. Manag. 2002, 21, 381–391. [Google Scholar] [CrossRef]
- GBT2589-2020; General Rules for Calculation of Comprehensive Energy Consumption. State Administration for Market Regulation and Standardization Administration of China: Beijing, China, 2020.
- GB 50176-2016; Code for Thermal Design of Civil Buildings. Ministry of Housing, Urban and Rural Development and General Administration of Quality Supervision, Inspection and Quarantine of China: Beijing, China, 2016.
- Gao, X. Applied Multivariate Statistical Analysis; Peking University Press: Beijing, China, 2011; Volume 2. [Google Scholar]
Disclaimer/Publisher’s Note: The statements, opinions and data contained in all publications are solely those of the individual author(s) and contributor(s) and not of MDPI and/or the editor(s). MDPI and/or the editor(s) disclaim responsibility for any injury to people or property resulting from any ideas, methods, instructions or products referred to in the content. |
© 2023 by the authors. Licensee MDPI, Basel, Switzerland. This article is an open access article distributed under the terms and conditions of the Creative Commons Attribution (CC BY) license (https://creativecommons.org/licenses/by/4.0/).