1. Introduction
In the field of architecture, engineering, and construction (AEC), the earlier phases of architectural design have often dwelled in relative obscurity, their intricate, iterative, and uncertain nature perplexing both researchers and practitioners alike [
1]. This oversight has cast a shadow over conventional planning approaches when applied to design, leading to countless shortcomings [
2]. The pressing need remains for a comprehensive framework to plan, control, and manage the design workflow, one that can seamlessly accommodate the complexity and variability intrinsic to architectural design.
AEC projects traditionally navigate through a well-defined sequence of design stages, namely the (1) predesign, (2) schematic design, (3) design development, and (4) construction documentation (detailed design) phases [
3,
4]. While the predesign phase involves gathering information and learning about the client’s visions and requirements, the schematic design phase transforms these visions into a tangible, efficient building design. During this pivotal stage, designers explore design concepts and test different design alternatives, culminating in preliminary drawings ready for development [
5]. The design development phase marks a substantial leap forward, entailing refinements, the addition of structural engineers, preliminary cost estimations, and value engineering. The culmination of these phases results in the creation of detailed construction documents, furnishing all essential information for the general contractor [
6] in the detailed design phase. The design phases pave the way for the construction phase, where project execution takes place.
While the latter stages of detailed design and construction have been extensively explored, the earlier design phases remain relatively under-researched [
7]. These early phases suffer from ill-definition, iteration, and intricate information interdependencies [
1]. Challenges encompass inadequate coordination, communication gaps, imbalanced resource allocation, and unreliable decision-making. However, it is a common misconception that the complexity of these stages renders planning and control practices ineffective [
8,
9]. Architectural design, spanning the predesign, schematic design, and design development phases, serves as a pivotal phase in any construction project, as it converts a complex system into a tractable one [
10]. Therefore, the imperative to enhance production planning and control during architectural design is paramount to ensuring successful, streamlined project delivery. Quantifying the performance of the architectural design process emerges as one efficient approach for improvement.
Research into quantifying architectural design phase performance remains relatively limited. While Wong and Chan [
11] probed architectural design quality from a building maintenance perspective, and Stavrakakis et al. [
12] explored its impact on thermal comfort, lean thinking has sparked innovative assessment methods, such as value stream mapping of architectural executive design [
13] and an architectural design process model grounded in constructivist decision support [
14]. These quantification efforts have facilitated a shift from perceiving architectural design as chaotic and intuitive to envisioning more systematic, measurable processes. However, the application of formal planning methods like the Last Planner System
® (LPS) in architectural design remains largely unexplored.
The LPS is a project management and lean planning approach that focuses primarily on improving project delivery by enhancing workflow and project predictability, fostering collaboration, and reducing waste [
15]. It emphasizes the role of the “last planners”, or the people who are planning for those doing the work, such as construction workers, subcontractors, or architects, enabling them to have a more direct influence on planning and decision making [
16]. The LPS seeks to mitigate variability’s adverse effects and enhance planning reliability [
15,
16,
17] and has found widespread adoption in the construction phase, where its structured nature aligns with tangible benefits [
18]. However, the complexity inherent in architectural design has limited LPS exploration and research in this domain. This complexity makes the design phase susceptible to variability, uncertainty, and unreliability, which can jeopardize the design process’s stability and outcomes. LPS implementation in design has been primarily conceptual and qualitative, with few studies addressing knowledge sharing, design uncertainty, and interdependencies.
This paper redirects the focus of LPS research from construction to architectural design by uncovering the dynamics at play in architectural design and identifying common challenges hindering the effective implementation of formal planning methods. Relevant LPS principles and functions are proposed to address these issues, culminating in an LPS conceptual model designed to monitor, evaluate, and enhance architectural design planning performance. The proposed conceptual model includes vital guidelines, which are embedded into an LPS implementation model, which has undergone rigorous testing within a US-based architectural design firm. The study quantitatively assessed architectural design planning reliability and performance, tracking LPS metrics over a year. By monitoring and tracking architectural design planning mechanisms, reworking, errors, and associated time and cost, overruns are identified and reduced. The study findings were analyzed across metrics, office locations, and employees. The main contribution of this study is the proposal of a framework composed of conceptual and implementation models. This framework allows for a deeper understanding of LPS applicability, feasibility, and functionality in architectural design, serving as a blueprint to unearth latent inefficiencies and improve the architectural design process’s planning and management, ultimately dispelling the notion of inadequate planning in this crucial phase.
2. Literature Review
2.1. Architectural Design Problems
In the context of construction, design is defined as the process of developing a “solution” to the client’s requirements for the development of a built asset and then preparing the proper instructions allowing the construction of the solution. This process, despite being inevitable, is plagued with issues that often jeopardize the quality of the final product and that represent the architectural design phases’ underlying dynamics. In fact, Rittel [
19] described most problems that face designers as “wicked” problems. Accordingly, multiple issues are inherent in design problems. (1) Its ill-defined nature and inherent innovation and creativity often make it difficult to delineate design or transform into a structured process. (2) Even when designers manage to “define” a design process, some discrepancies exist among different explanations of the same design problem, which further complicates the process [
20]. (3) Uniqueness makes it even harder for designers to refer to similar or relatable projects [
21]. (4) A lack of “stopping rules” means designers often find it difficult to know how much detail is enough [
20]. (5) Wicked problems in design might sometimes be consequences of other “higher-level” problems, creating a never-ending cycle of fixing issues and being faced with newly emerging ones [
22]. (6) Once designers attempt a design solution, additional issues arise, such as lack of an enumerable or exhaustive set of feasible solutions, which further entangles the design process. (7) Developed solutions are never either correct or incorrect, but better or worse [
21]. (8) Additionally, these solutions cannot be tested to ensure their validity. (9) Finally, designers need to get it exactly right, as they have no right to be wrong with their solutions, which brings up the final problem with design, which is (10) the one-shot operation nature. These issues are augmented in architectural design, where poor co-ordination, frequent changes, design iterations, uncertainty of ends and means, complexity due to interdependencies, and inability to remove constraints due to the fast execution of design tasks [
9,
23] substantially affect the planning process.
2.2. Deficiencies in Traditional Planning of Design
The complex, iterative, ill-defined, and uncertain nature of design has often been ignored and misunderstood by researchers and practitioners, which has led to countless deficiencies when traditional planning approaches are implemented in design [
2]. Among the problems found in design are the lack of adequate documentation, poor communication, deficient input information, lack of interdisciplinary co-ordination, unbalanced resource allocation, and erratic decision making [
24]. Effective planning and control that are essential for minimizing the impacts of design’s complexity and uncertainty are also absent in most design processes. Variability inherent to the design process cannot be fully eliminated and results from inefficient planning strategies, sub-optimal levels of operation, lack of co-ordination between teams, and poor workflow between tasks [
25]. Variability is the imbalance, unevenness, or non-uniformity in processes and resulting products where substantial discrepancies exist between planned and performed work [
26,
27]. It is also defined as any component in the system that cannot be predicted or is not absolutely regular [
28]. Variability may be classified into two types based on queuing theory: (1) the process time needed for task execution and (2) the rate of arrival of tasks [
29]. Interruptions resulting from variability cause reworking, increased costs, time delays, inferior quality, and inefficient productivity. Therefore, a persisting need exists to properly plan, control, and manage design workflow in a way that accommodates the complex and variable nature of architectural design.
Inherent design phase variability and uncertainties disrupt workflow, rendering a dependency on traditional planning methods incompatible with the needs of the design process. Design planning entails deciding how to achieve certain goals and defining the plans or tasks required to accomplish them. Such plans are usually set by the project planning team without much involvement of the members who will be executing the defined tasks [
1]. As a result, little to no consideration is given to the requirements of defined tasks regarding whether they can be performed as planned or to the needs of the teams executing them [
30]. This traditional manner of pushing plans from the top down fails to consider the required information, resources, and other inputs necessary to ensure a smooth workflow within activities. Lack of collaboration and co-ordination between the planning and executing teams makes it difficult to establish agreements and commitments between each other towards achieving a proper design workflow. Consequently, the planning process becomes unreliable and is set to fail from the start.
While traditional planning approaches might be better suited for more streamlined and well-defined processes, they are ineffective when dealing with the complex nature of design [
25]. Furthermore, traditional planning adopts a reactive approach aimed at resolving problems such as delays and errors after their occurrence instead of proactively identifying them and developing plans to prevent them [
31]. Because of the mentioned setbacks of traditional planning and its unsuitability for the architectural design phase, exploration of new methods to adequately manage design while reducing errors and delays has increasingly become the focus of construction research and industry [
32].
2.3. Last Planner System® and Metrics
The construction industry is increasingly adopting lean principles as countermeasures for traditional management approaches [
33]. The LPS motivates planners to take on a comprehensive approach that shifts the focus from dealing only with the execution of tasks towards incorporating the workflow connecting them [
34]. Managing handoffs between teams, making promises and commitments, ensuring prerequisites are ready and constraints removed, and ensuring flow between tasks and trades are core actions within the LPS process [
16]. Accordingly, the long-term and short-term planning that the LPS entails as the project progresses enables planners to set realistic and manageable plans that consequently help them better manage workload, make reliable promises, and reduce project variabilities.
The LPS includes four main planning phases: (1) master planning; (2) phase planning; (3) look-ahead planning; and (4) weekly work planning [
16]. Look-ahead planning, along with weekly work planning and the shielding production mechanism, is accomplished by making quality assignments to increase reliability of commitment plans [
35] and is a vital process that differentiates the LPS from a more traditional planning approach by enhancing reliability and decreasing variability. Look-ahead planning enables a smooth and reliable transition of the master or phase schedule into an executable weekly work plan (WWP). The WWP includes tasks that were anticipated, made ready by removing constraints, or can be made ready during an execution week that the team then commits to completing [
17]. Compared to the traditional push system, look-ahead planning adopts a pulling and screening system that enables work to flow correctly into WWPs [
27]. However, even when tasks have been made ready and assigned to the WWP, some New Tasks emerge during the work execution week that were not anticipated or planned to be completed within the given time frame; these are known as “New Tasks” [
36]. These tasks disrupt workflow and impose a burden on planning as they tap into the limited resources [
27]. Hence, the reliability and success of the look-ahead process depends on its ability to properly plan, account for, and anticipate all required tasks and prevent the emergence of New Tasks.
Several metrics have since been developed for assessing the performance of LPS planning and aligning long-term plans with short-term ones. The most commonly used metric is percent planned complete (PPC), which measures planning reliability by comparing the percentage of actual completed tasks versus planned tasks for a given period [
16]. However, utilizing PPC as a sole metric to measure planning performance does not provide an objective and comprehensive assessment, and it must be complemented with other metrics to measure performance comprehensively [
37]. Therefore, researchers have developed other metrics to complement PPC. Some of these metrics currently being applied in the industry are tasks anticipated (TA) and tasks made ready (TMR). TA measures (1) how successfully look-ahead planning anticipated, a few weeks ahead, the tasks to be included in the WWP for implementation and (2) reflects how well planners can design operations and breakdown tasks from the master and phase schedule [
2,
26]. By better anticipating tasks in advance, more room is available to remove constraints and ensure prerequisites are ready. As an extension to TA, TMR measures how many anticipated tasks were successfully made ready for execution by identifying and removing their constraints [
27,
31]. These TA and TMR metrics help to more comprehensively measure LPS performance, better align near and long-term plans, and achieve a more effective and integrated LPS implementation.
2.4. LPS Applications and Limitations
Numerous studies have shown the global benefits of implementing the LPS during construction planning and its applicability regardless of firm size, project scale, and location [
38], and research is continuously focusing on improving LPS implementation in the industry. In this regard, Macomber et al. [
39] proposed a set of practices for reliably delivering project goals as a step towards the ideal of uninterrupted workflow. Likewise, Hamzeh et al. [
40] presented standardized practices to help improve look-ahead planning performance and achieve a strong link between look-ahead planning and activity execution in construction. Lagos et al. [
41] presented the significant improvements in LPS implementation resulting from the use of information technologies as supporting and facilitating LPS application tools.
While many research efforts and firms have explored and implemented the LPS, they have focused mostly on the construction phase, with only little attention given to the design phase. This can be attributed to the common misconception that the LPS is inadequate for design, at least without custom-tailoring it to the specific needs of the design phase. Miles [
42] demonstrated how the LPS can be tailored and implemented in design when performing required training, adjusting contractual relationships, and establishing collaborations between teams. Moreover, the pull planning technique, an integral part of the LPS whereby last planners collaboratively develop flows and allow work by defining final conditions required to complete a phase based on the current state of progress, was proposed as a potential response to the obstacles and complex nature of design planning by helping achieve more reliable workflow across the design phase [
15]. In this respect, Kerosuo et al. [
43] demonstrated benefits and enhanced collaboration resulting from implementing short-term planning in traditional design management. They also highlighted some obstacles that are still faced in design, mainly the resistance to changing old practices and the ill-defined goals of design management. However, these studies did not address the lack of prescriptive knowledge about the LPS in design; rather, they mainly present broad and descriptive benefits without specific guidelines that can be replicated under different organizational or project setups. Furthermore, Hamzeh et al. [
17] described adjustments introduced to the LPS to better suit the design process and highlighted the observations and lessons learned in the process. Yet, such studies are more oriented towards qualitatively assessing the benefits of the LPS in design compared to full assessment using a set of metrics. Additionally, Kortenko et al. [
44] conducted a literature review of LPS implementation in the design phase. However, all mentioned studies focused on LPS implementation in structural design, including schematic design, design development, and construction documents, rather than architectural design. They also, despite offering promising insights and steps to better manage design workflow and reduce its variability, remain limited in scope and impact, as they do not provide a measurable, replicable, holistic approach to assessing the efficacy of the LPS in the design phase. Without a comprehensive quantitative method or a definitive model for implementing the LPS in the architectural design phase, the performance of the LPS is more difficult to track or enhance, which in turn hampers improvements of the design phase and reducing process wastes.
3. Methodology
This study employed design science research (DSR) to create a framework that deploys the LPS in the architectural design phase of AEC projects. DSR is a method used to create and evaluate an artefact, which can be a construct, model, or method that resolves a prevailing problem in a certain context or environment [
45]. To this end, this study identifies prevailing issues in architectural design and presents an LPS framework composed of conceptual and implementation models (the artefacts) as part of advancing architectural design practices by rethinking the planning of projects within architectural firms. The conceptual model provides guidelines on how to implement the LPS to mitigate the problem of unreliable design planning and to continuously improve the design process, while the implementation model provides practical steps to implement the LPS in architectural design. It was tested within an architecture firm in the United States. Since design planning reliability is a global problem present across many AEC firms, showcasing the firm’s intervention efforts in this study allows the outcomes and gained knowledge from implementing the LPS model to be transferred to the wider industry and research domain [
46].
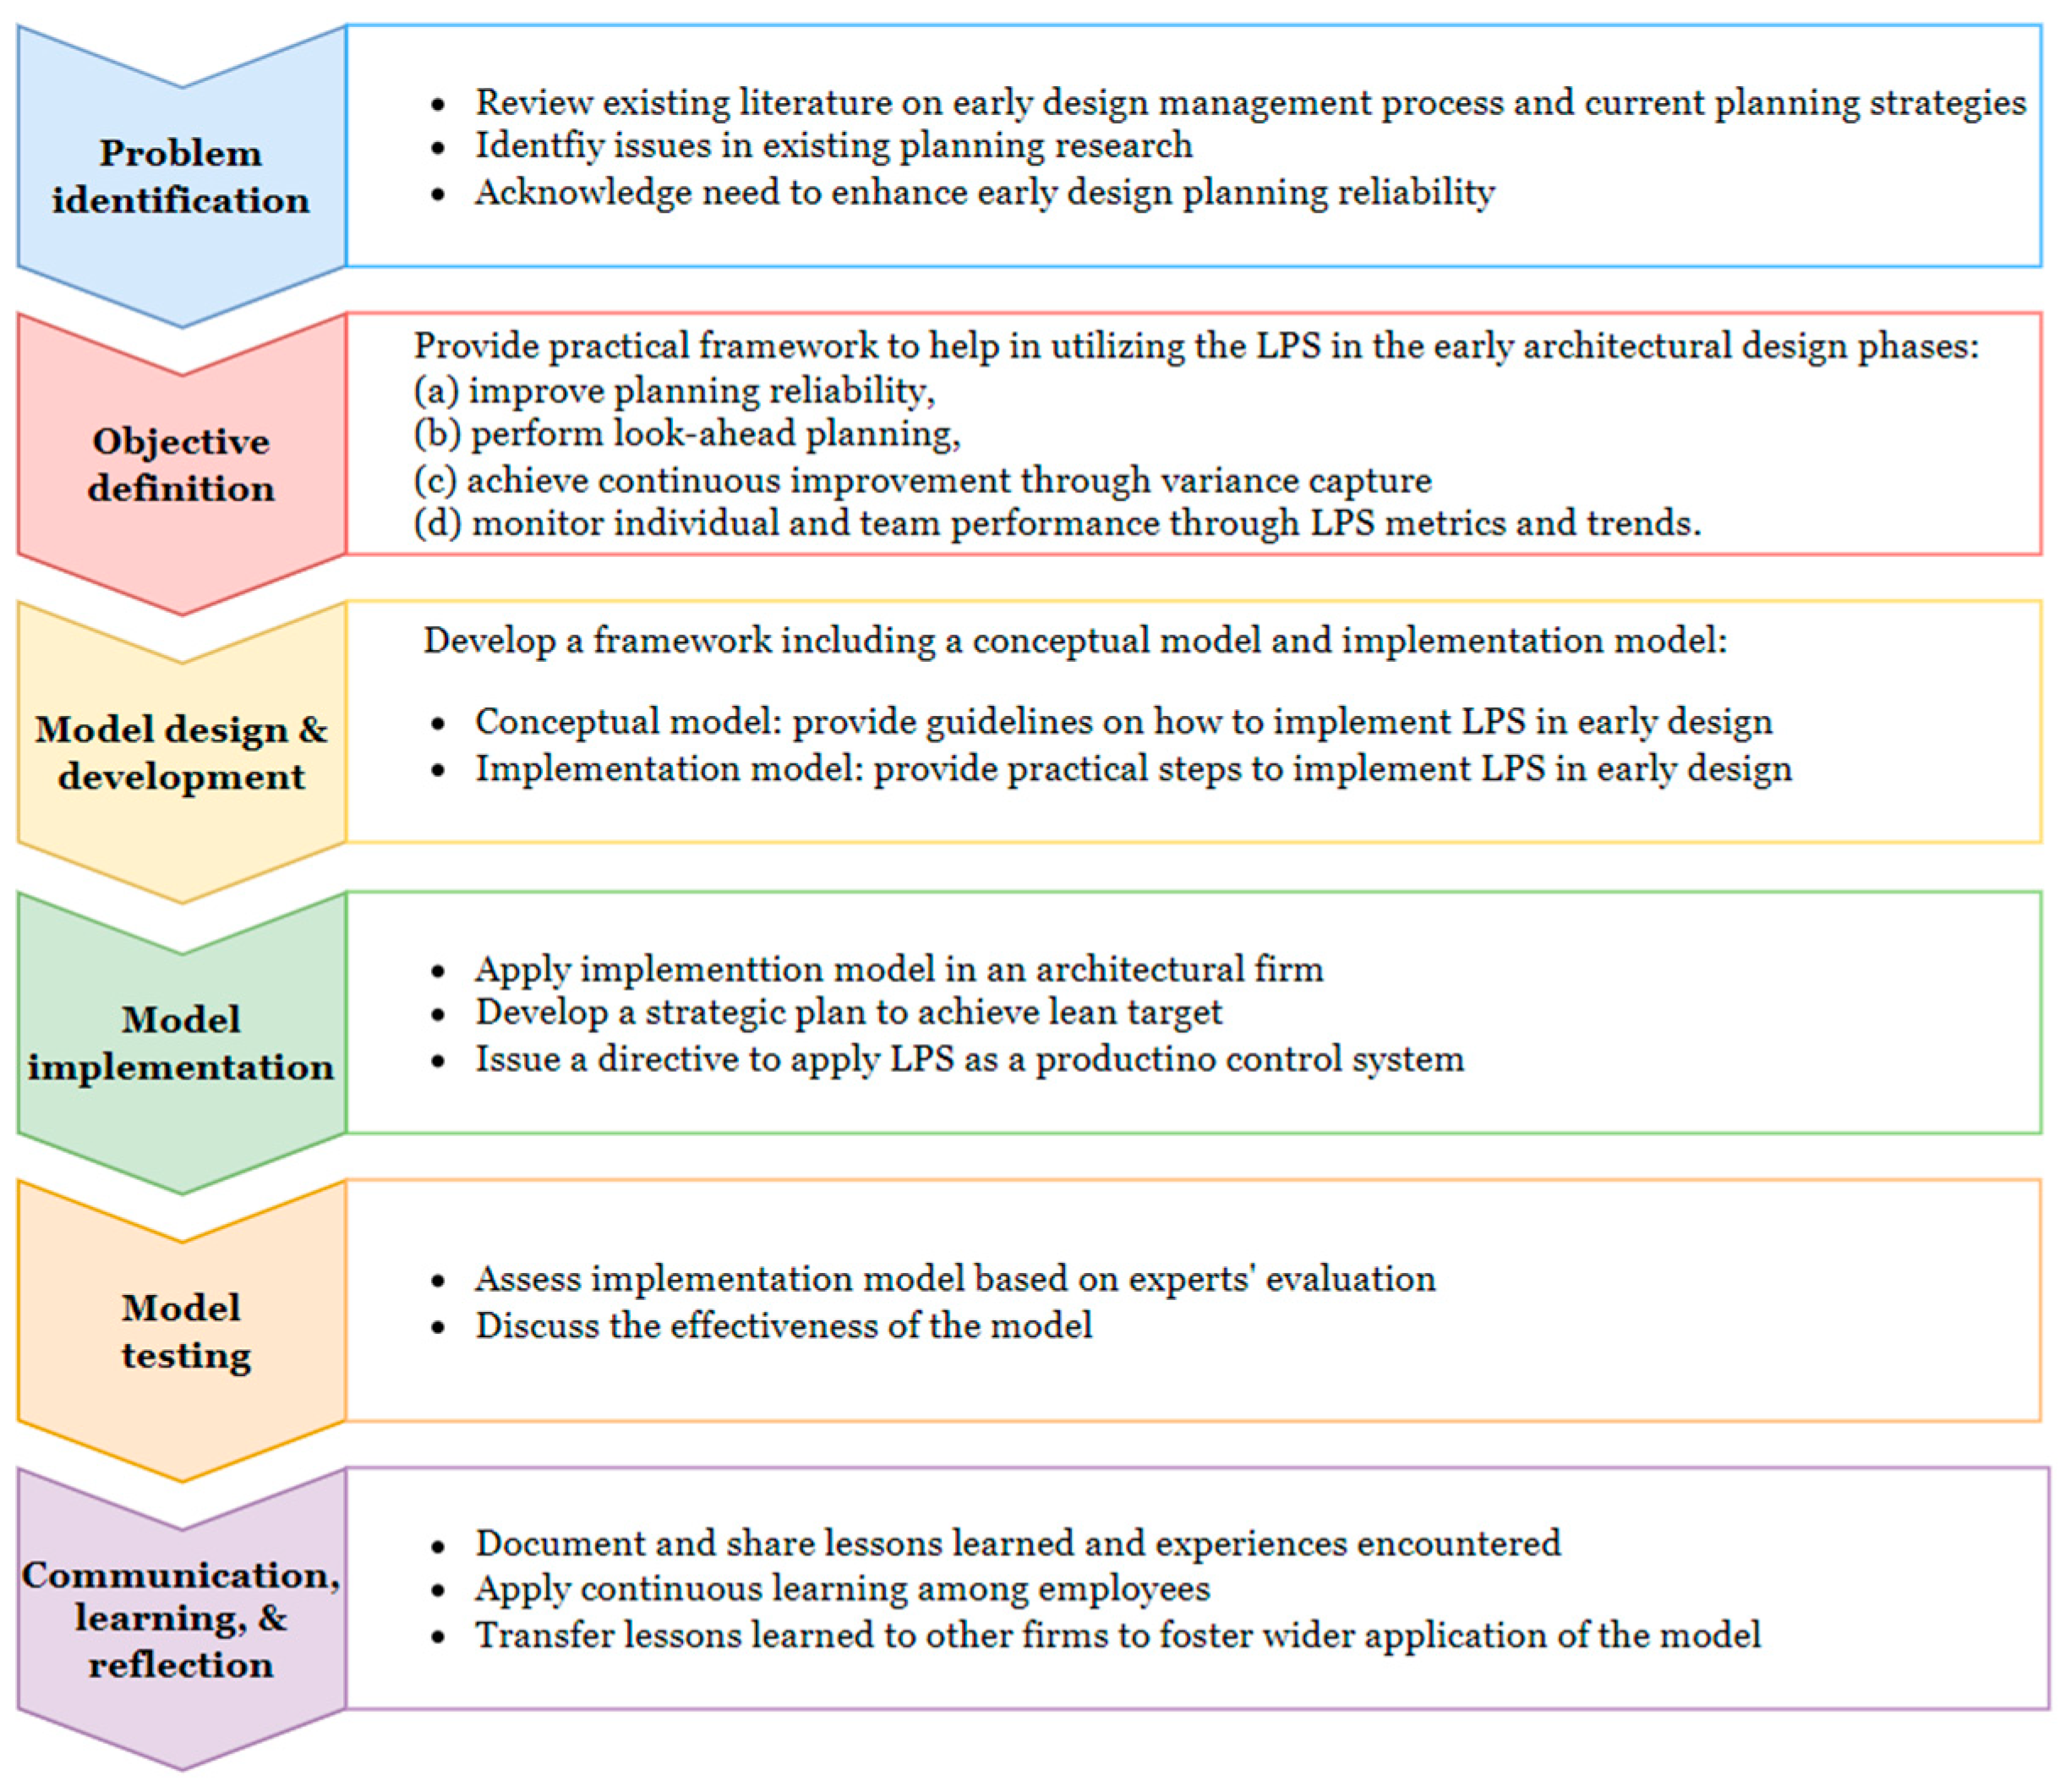
As shown in
Figure 1, the research process developed is based on the DSR six-step method obtained from [
47]. Generally, after identifying the problem and defining the objective based on the problem, a model that addresses the identified deficiencies is designed and developed. In order to test the applicability of the developed model, it is then implemented on a real-life project. Afterwards, model testing is essential to evaluate the model and its effectiveness from the experts’ perspective. Finally, communication, learning, and reflection are vital for ensuring continuous refinement and improvement of the model. Each of the six steps of the methodology is detailed in the following sub-sections.
3.1. Step 1—Problem Identification
The authors reviewed existing literature regarding the design management process, specifically in the early design phases, as well as the current state of the firm’s planning strategies. Accordingly, the authors identified issues in both the existing planning research and in the firm’s design planning approaches. The prevailing problem in such firms is the inability to plan the architectural tasks due to the nature of the design process during the early inception of projects. As opposed to the construction phase, the design phase suffers from more variability and uncertainty, which causes traditional management and planning strategies to be ineffective and unreliable. Furthermore, the potential benefits of the LPS towards improving design planning reliability have not been measured or documented enough to support its wider adoption in early design. As such, the authors and the firm acknowledged the need for a framework for establishing alternative planning approaches to enhance planning reliability.
3.2. Step 2—Objective Definition
Based on the problem description, the authors specified the main objective of this research, which is providing a practical framework to help in utilizing the LPS in the early architectural design phases. Specifically, the framework aims at (a) improving planning reliability, (b) performing look-ahead planning, (c) achieving continuous improvement through variance capture, and (d) monitoring individual and team performance through the LPS metrics and trends.
3.3. Step 3—Model Design and Development
The research team then worked on developing the framework which included a conceptual model and an implementation model. The conceptual model provides guidelines on how to implement the LPS to mitigate the problem of unreliable design planning and to continuously improve the design process. The conceptual model was then transformed into an implementation model. With the empirical demonstration and implementation, iterations to improve the implementation model were performed. Therefore, the model development was carried out in cycles. The first cycle was before the implementation, where planning for LPS implementation was initiated as a proposed plan of action; then, during implementation, adjustments were performed; and finally, after implementation, reflections were conducted for continuous improvement.
3.4. Step 4—Model Implementation
For the empirical implementation, the implementation model was applied in an architectural firm which was showing interest in improving the design team planning reliability. As such, the firm closely developed a strategic plan to achieve a lean target for individual and teamwork planning. Additionally, a directive was issued by the firm’s board to apply the LPS as a production control system to increase planning reliability across the different branches. The implementation model, to be further discussed in the upcoming sections, was thus executed on a company level.
3.5. Step 5—Model Testing
The implementation model assessment was performed based on the experts’ evaluation in the mentioned company. After the implementation, and based on the attained results, discussions with high management and the lean experts were carried out about the effectiveness of the model and the steps included in the standard work planning process. The experts expressed their confidence in the model and provided validation of its applicability in similar environments.
3.6. Step 6—Communication, Learning, and Reflection
The adoption of the LPS and the use of metrics at the firm showed that the implementation of the framework is a viable approach applicable during the early design of architectural firms. Lessons learned and experiences encountered by the firm during the roll-out and execution of its devised model were documented and shared with the team. The trends of the obtained metric results were shared with employees for genuine “continuous learning”. The lessons learned can also be transferred to other firms to foster the wider adoption of the model in architectural design and expand the body of knowledge of this research domain.
4. Conceptual Model
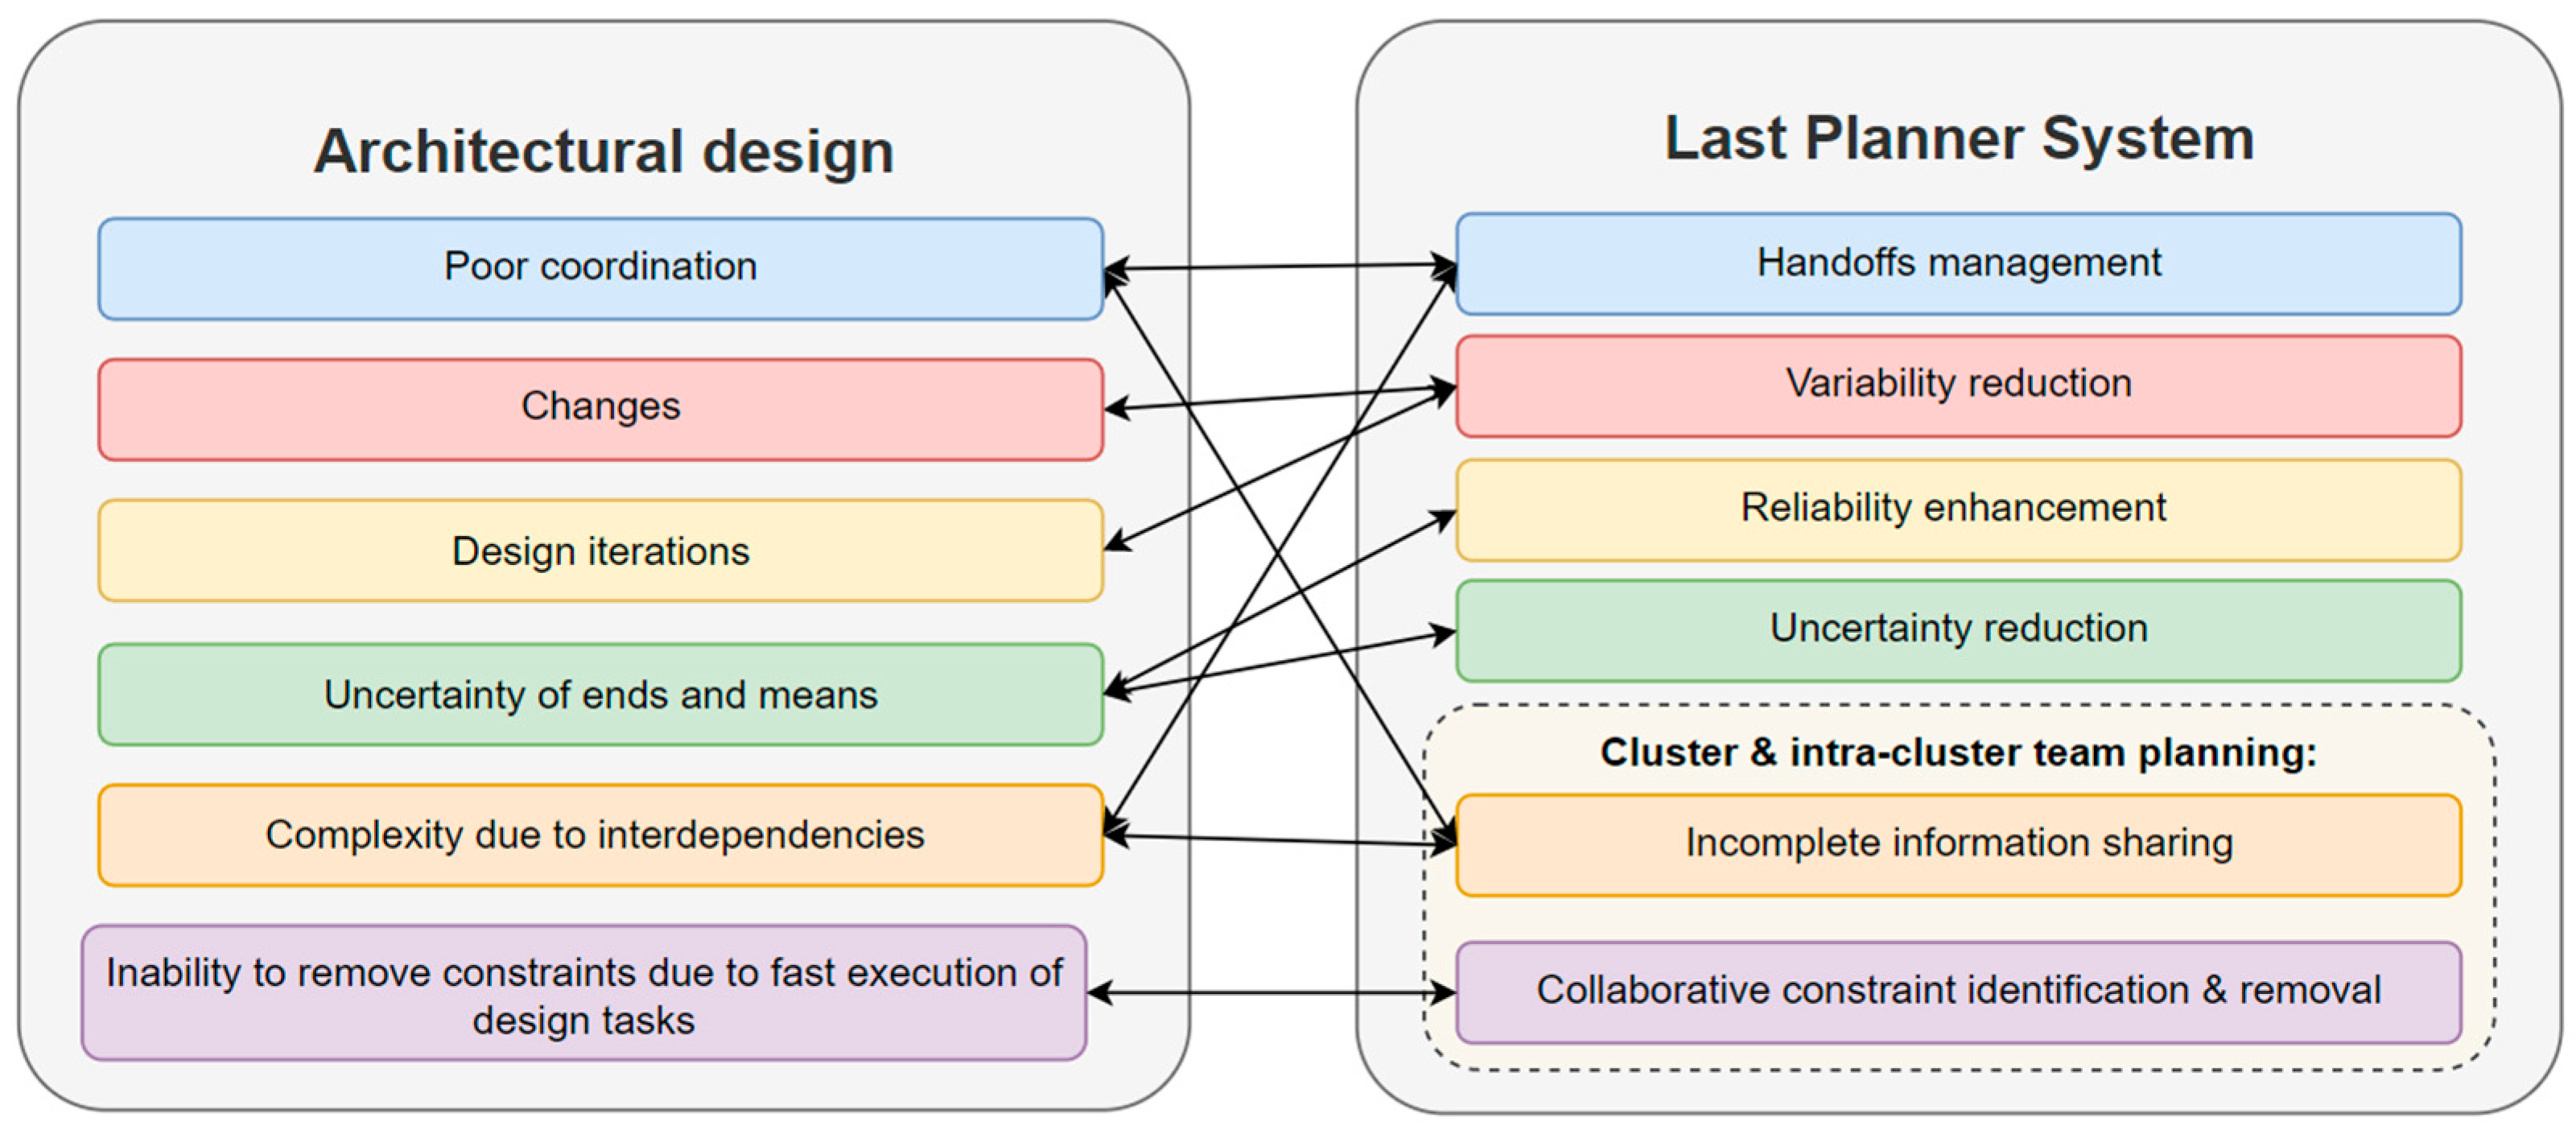
To address issues that plague the architectural design process representing its underlying dynamics, existing LPS principles and functions are exploited (
Figure 2). As the LPS facilitates handoff management [
16], co-ordination among different teams is improved and complexities due to interdependencies are minimized by enabling collaborative planning. Reductions in variability that accompany LPS implementation [
48] allow mitigation of the effects of inevitable changes in architectural design. Furthermore, the LPS’s ability to enhance reliability and reduce uncertainties [
49] tackles the architectural design’s uncertainties of ends and means that typically reduce the ability to foresee the sequence of future tasks. Additionally, as the LPS promotes interdisciplinary collaboration [
50], team planning among and within clusters is vital as it ensures knowledge sharing including incomplete information, in addition to collaborative constraint identification and removal. Sharing of incomplete information reduces complexities that arise from interdependencies among different teams or clusters, as each cluster unveils information that was not yet known by other clusters. Finally, constraint identification and removal can now be completed collaboratively among the different clusters, which further enhances the make-ready process.
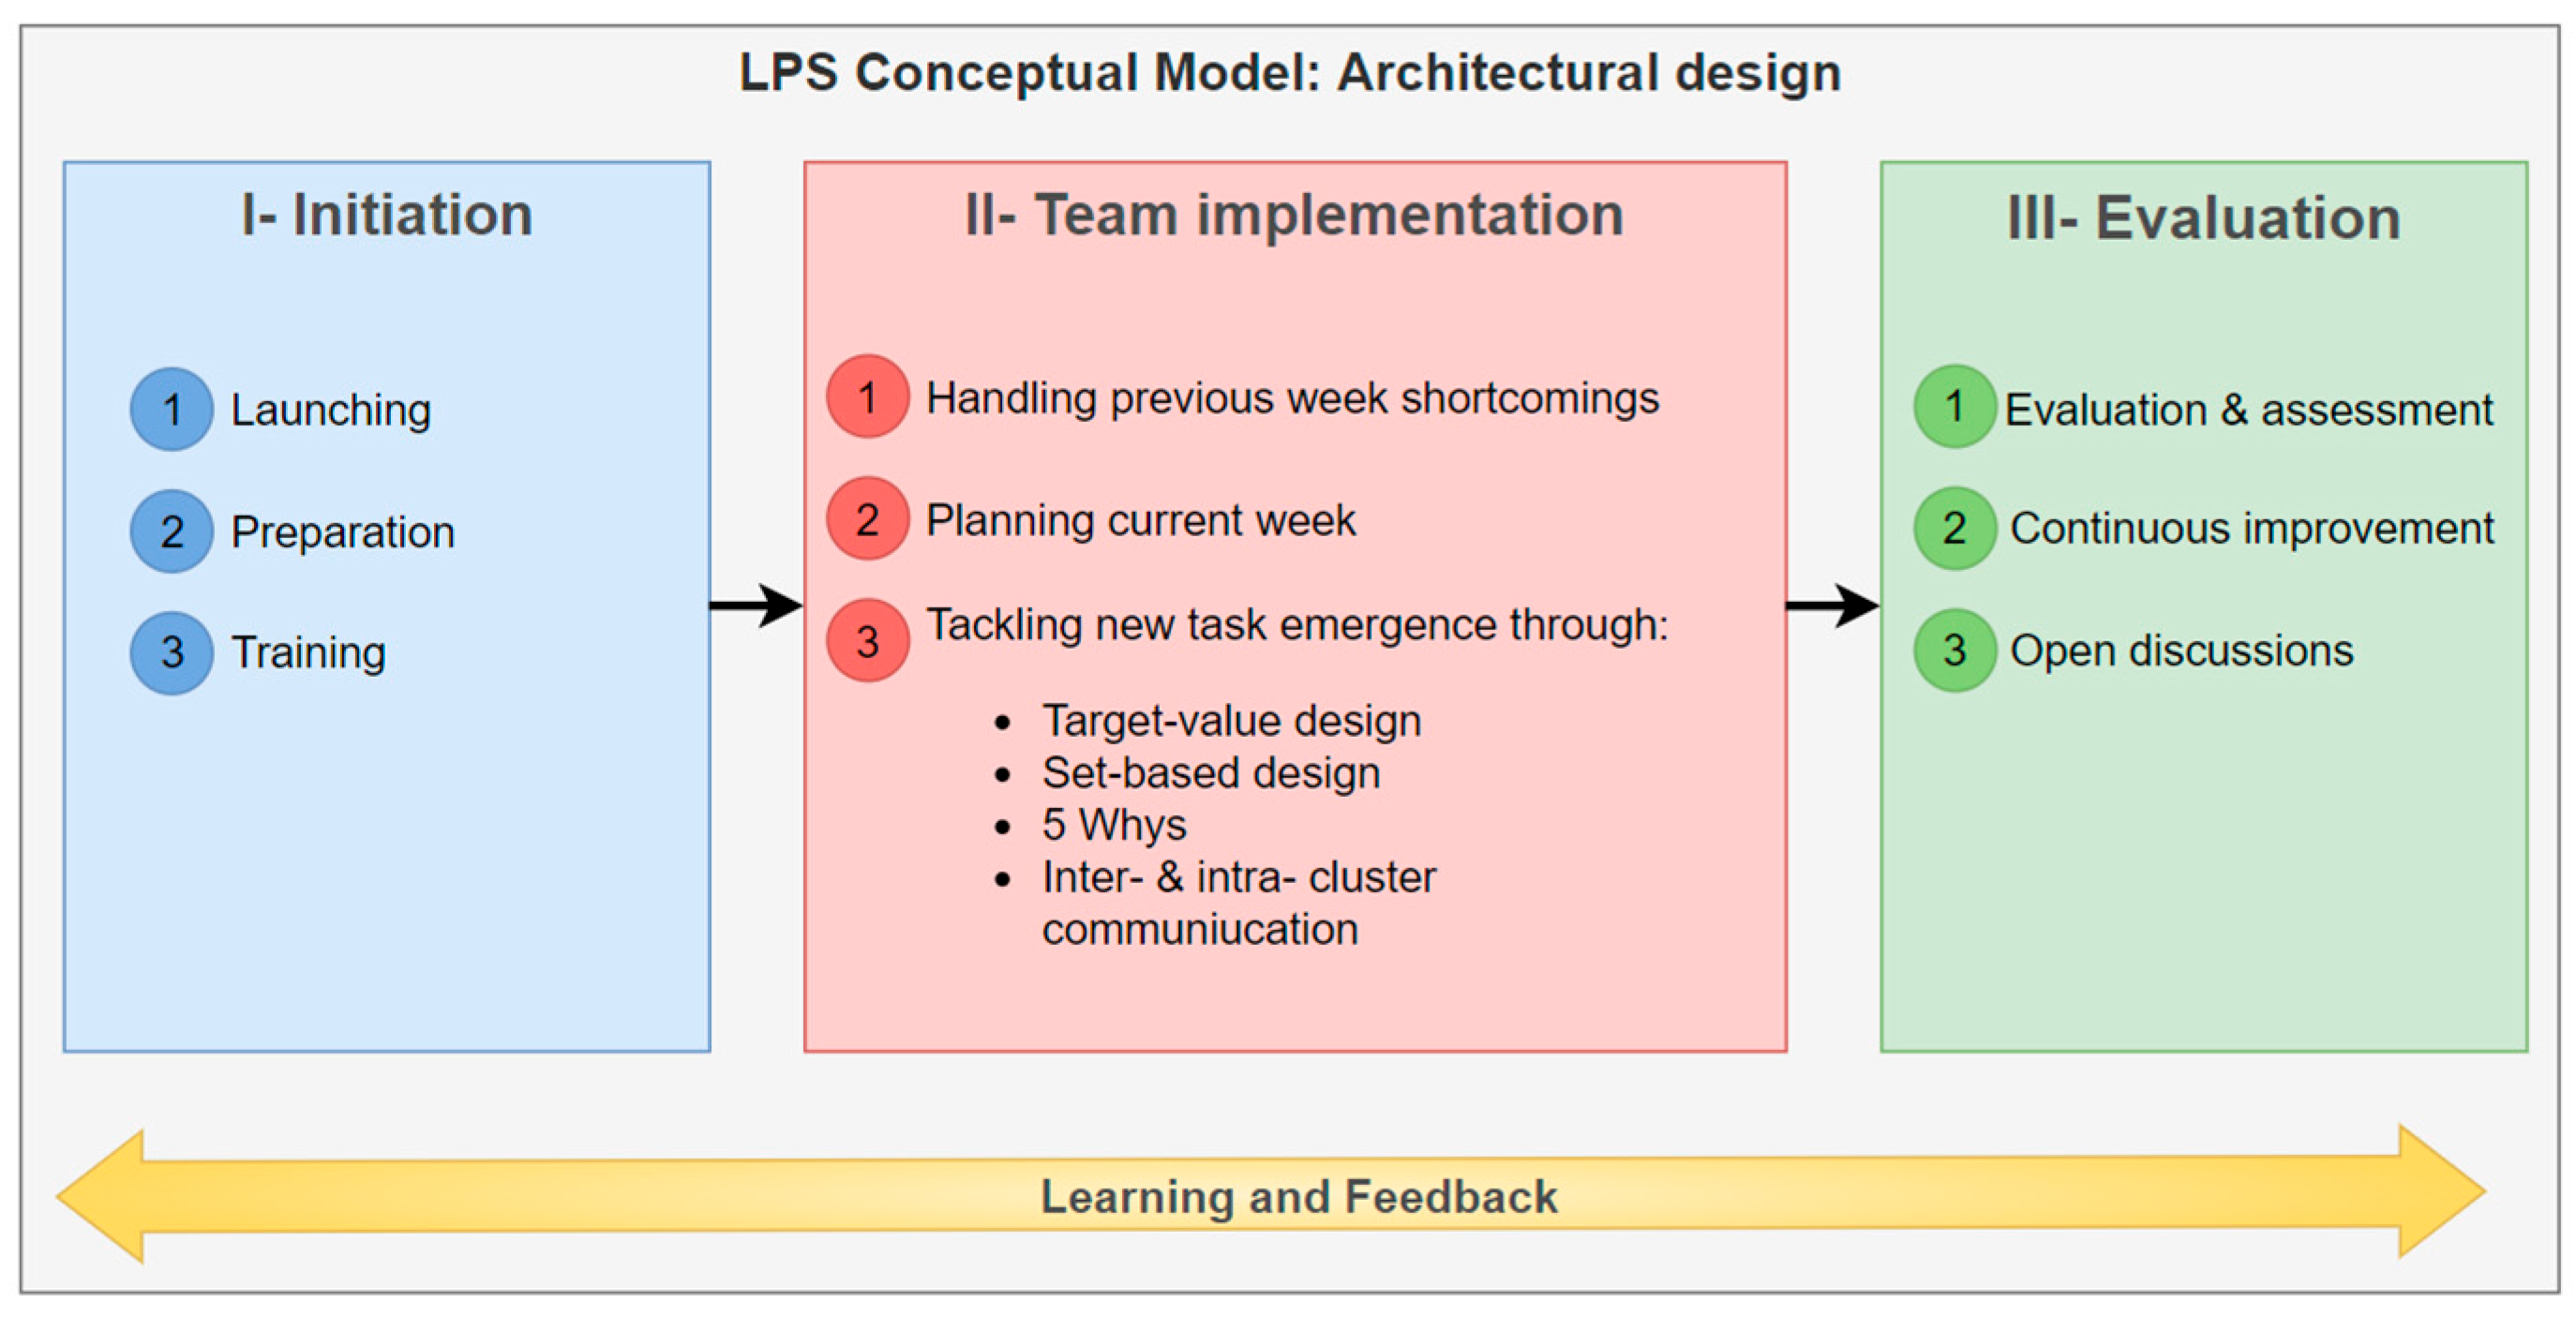
By addressing architectural design issues through LPS principles, a conceptual model for LPS implementation during architectural design was developed, as represented in
Figure 3. The model consolidates all relevant LPS principles pertaining to architectural design problems. It entails three main steps: initiation, team implementation, and evaluation.
Initiation includes (1) launching the LPS implementation plan, (2) preparing the architectural team for team implementation by introducing required forms, templates, and tools, and (3) training all team members for proper LPS implementation through seminars, workshops, and presentations.
During team implementation, proposed lean guidelines are followed in order to tackle the inevitable emergence of New Tasks that occurs in all projects, specifically during the architectural design phase. The guidelines include target value design (TVD), set-based design, asking the Five Whys, and inter-cluster and intra-cluster communication. TVD is the adaptation of target costing to construction projects [
51] and is closely correlated to lean thinking in design and construction. TVD is used to structure and manage the project definition and design phases, which are indispensable tasks in architectural design. Its main goal is to deliver value to the customer by satisfying their requirements, which typically include cost and time [
52]. The customer’s values are the main driver of design, which helps in satisfying the customer’s expectations and reducing waste [
53]. In set-based design, designers postpone committing to a specific design by considering multiple alternatives for longer than is typical with a point-based design where one alternative is explored, selected, and developed early in the design process [
54]. Sets of design alternatives are then reviewed and integrated by the design team to find compatible combinations. Accordingly, set-based design helps avoid negative iterations and fosters team-wide satisfactory designs [
54], both of which are essential for addressing architectural design issues. The Five Whys is a technique used to identify root causes of design problems [
55], fostering team communication and problem solving. It calls for asking “why” five times, where each answer uncovers a partial shortcoming and forms the basis of the next question (or “why”), until the root cause is revealed. This is specifically crucial in architectural design where root causes may be concealed due to complexities that arise from the process’s interdependent nature. Finally, inter-cluster and intra-cluster communication endorses transparency and collaboration among and within different clusters. This helps mitigate, if not eradicate, information retention among different clusters, thus stimulating the collective idea sharing and brainstorming essential to architectural design. During team implementation, aforementioned guidelines are followed, the previous week’s shortcomings are handled, and the current week’s tasks are planned.
Finally, in the evaluation step, performance assessment is conducted through various progress tracking means, continuous improvement is enforced, and open discussions are held. Learning and feedback is a global guideline in the developed conceptual model, where all team members are to ensure ceaseless pursuit of learning and refinement throughout the project.
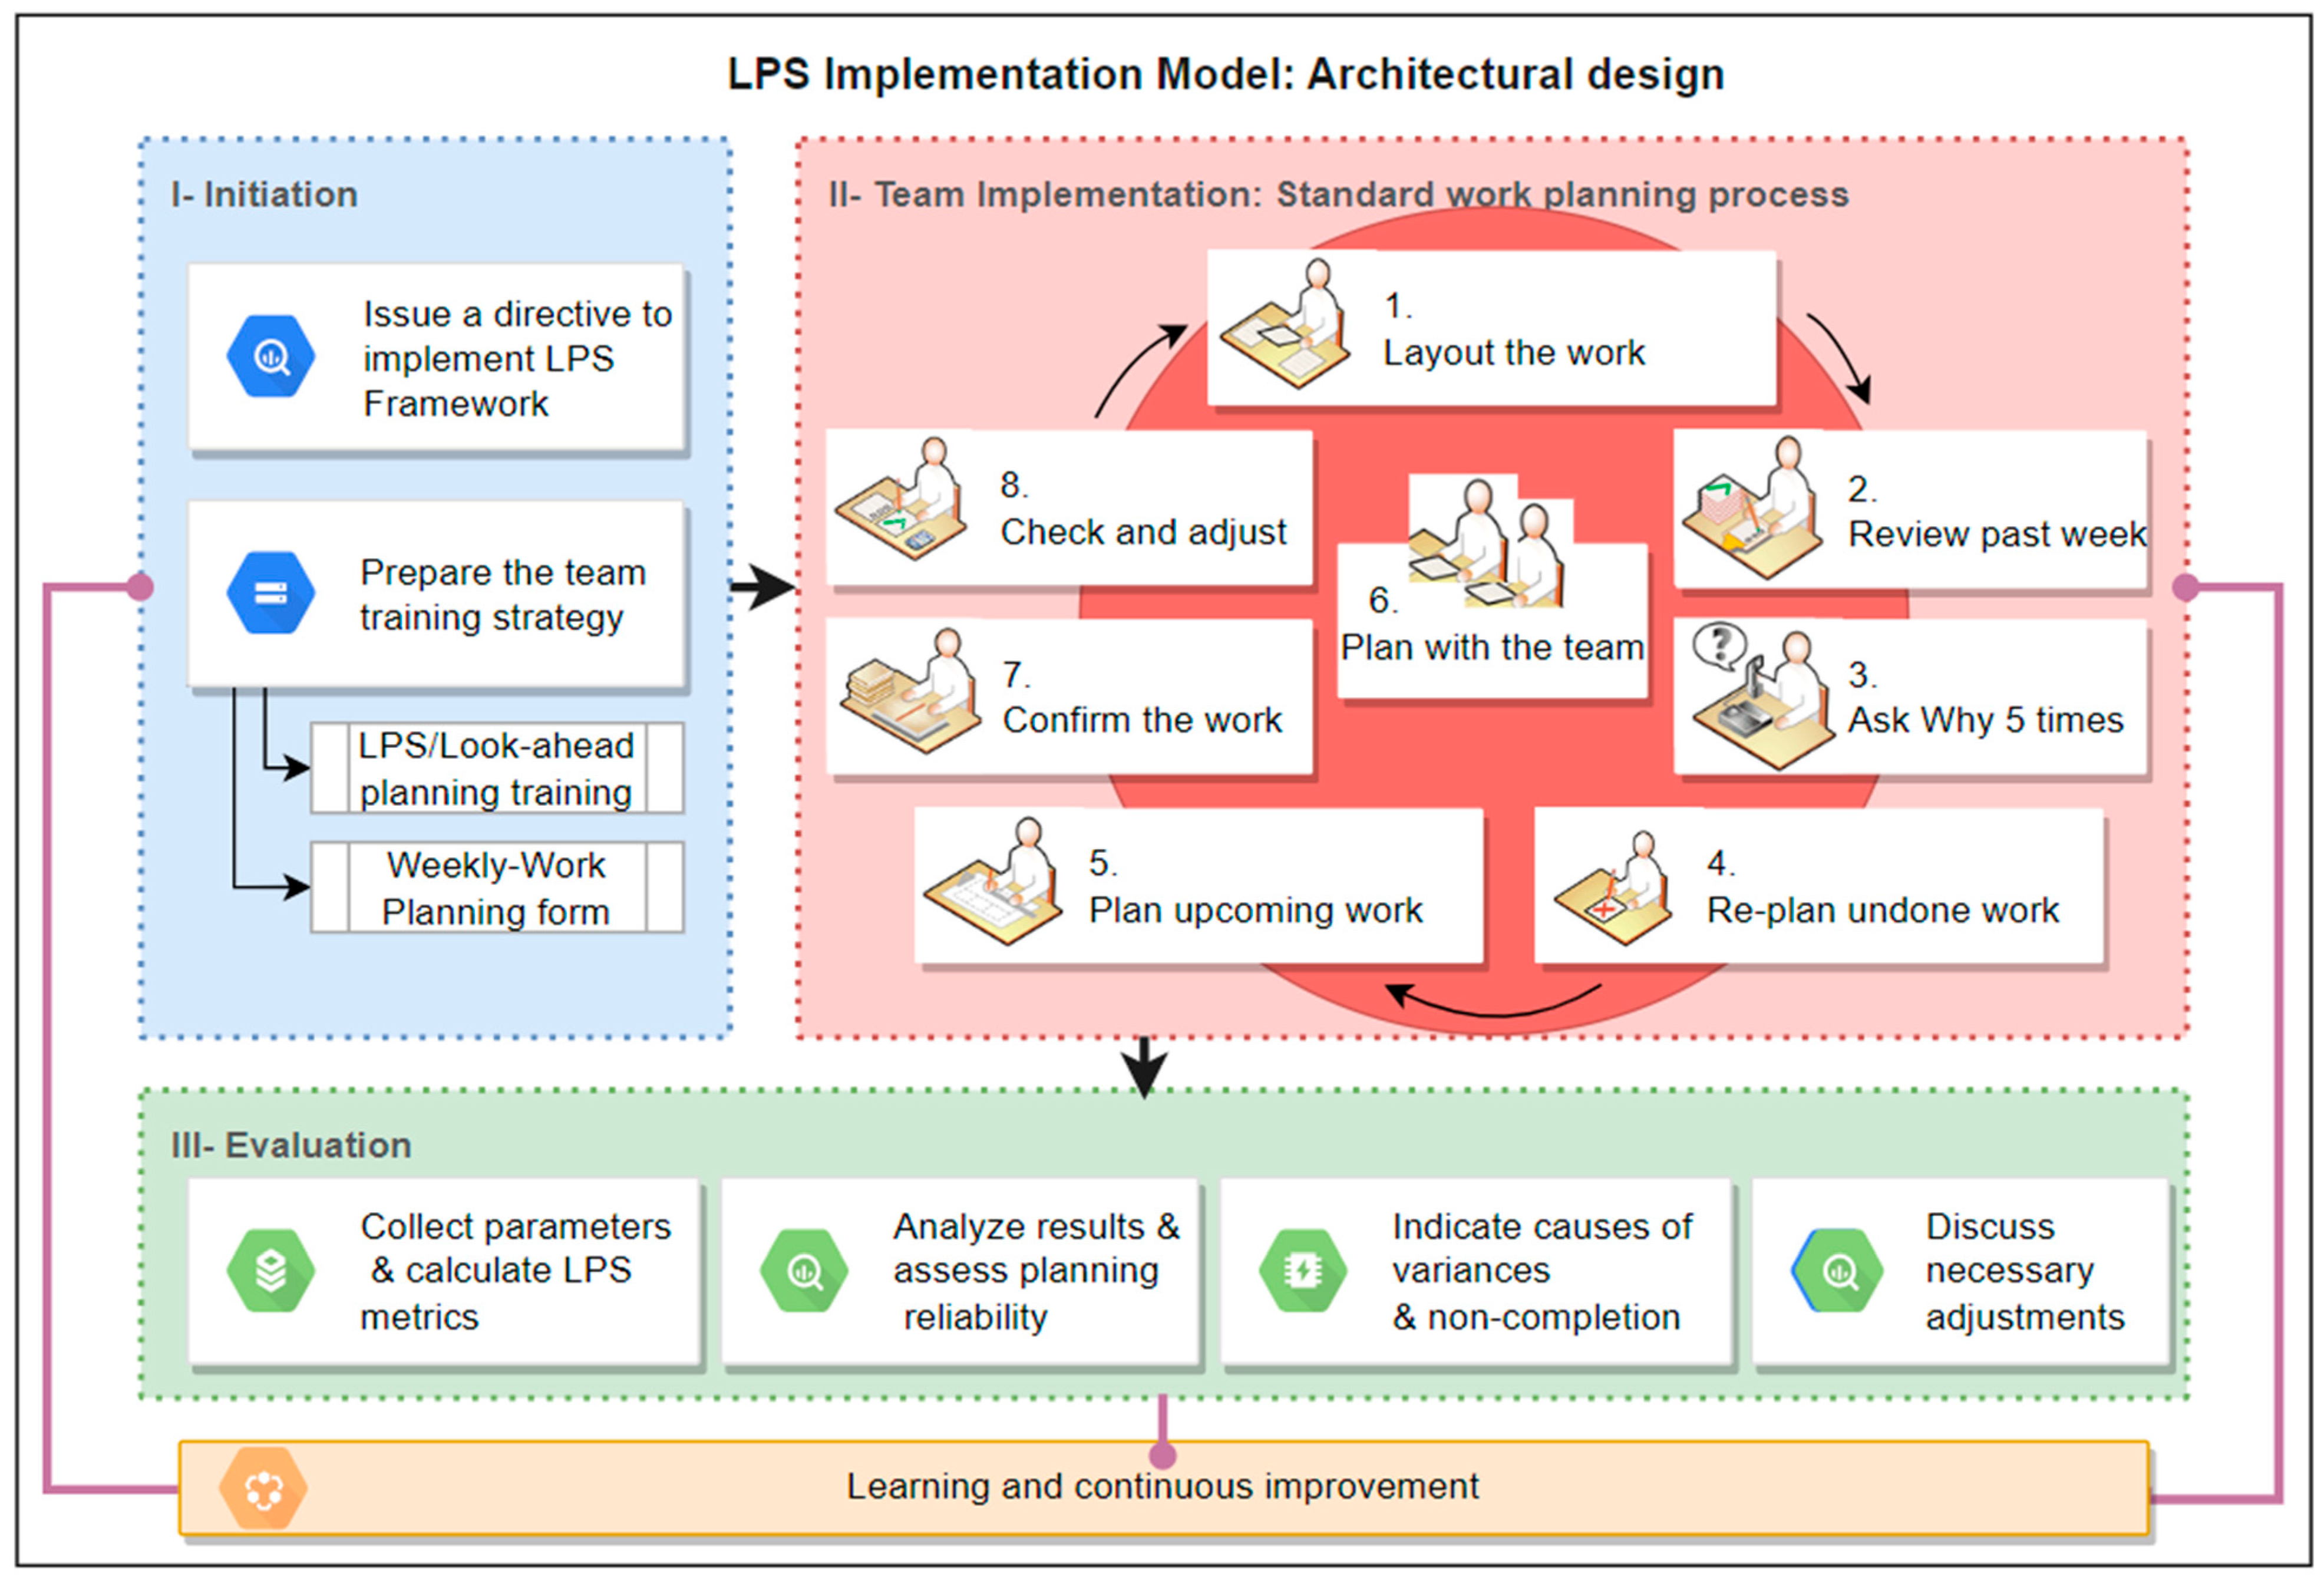
5. Implementation Model
Based on the developed conceptual model, an implementation model was proposed, as presented in
Figure 4, following the same three-step methodology: initiation, team implementation, and evaluation. During the initiation step, the LPS is implemented as part of the design phase, and necessary preparations are made to use look-ahead planning and WWP, which require the company to prepare the training strategy, for example choosing the team training and follow ups. In team implementation, a standard work planning process is developed. During evaluation, data are collected, metrics are calculated, results are analyzed, variance causes are identified, and necessary adjustments are performed. Detailed explanations of these phases and the included steps are demonstrated through the case study, as follows.
6. Case Study
The LPS implementation model was applied and tested firm-wide within an architectural design company in the United States, where architectural design planning reliability and performance were quantitively assessed, and LPS metrics were monitored over a one-year period.
For the initiation step, a team of lean construction experts trained project planners at the firm to learn how to perform the LPS. The training team ensured proper implementation by continually monitoring the employees’ progress. During the LPS implementation process, employees were asked to submit a WWP form to a central work planning account and utilize trend monitoring tools as a means to identify continuous improvement. The form included the following submittals:
Total tasks anticipated (TTA): tasks that were anticipated a week or two in advance;
Total tasks anticipated and completed (TTAC): completed tasks that were anticipated a week or two in advance;
Total tasks completed (TTC): total tasks completed within a given week;
Total tasks promised (TTP): total tasks promised (planned) within a given week.
The lead team and research team members recommended that new planners plan 15–20 tasks per week as a starting point and then find their individual planning style, reflective of their personal work style, at least in terms of the number of tasks promised each week.
In the team implementation step, the firm-wide lean experts developed a strategy to encourage voluntary planning among individuals and teams by teaching/training planners about reliable planning through the LPS, including at least two weeks of look-ahead planning. A standard work planning process was developed, as depicted in part II of
Figure 3, and was specifically tailored to suit the architectural design phase needs by involving eight steps for weekly work planning, per LPS methodology and lean principles. Each member and team were taught and trained on how to perform these eight steps: (1) Members and teams lay out upcoming work including plans for the current week and the two upcoming weeks. (2) Members and teams review the past week’s commitments, what was planned, what was completed, and what was anticipated in advance. (3) The Five Whys technique is used to find the root causes for tasks that were not completed and any variances. (4) Members re-plan unfinished work into the current or upcoming weeks with commitment to complete them. (5) Planning is completed for upcoming work in the next weeks and adjusted until a balanced number of achievable weekly tasks is identified. (6) Individuals plan with the team to resolve any requests, commit to each other to perform planned work, and co-ordinate and adjust plans accordingly. This step is effectively continuous throughout the process. It also ensures appropriate handoff identification and management among the teams. (7) Work to be carried out is confirmed by ensuring that everything is set and ready to complete the planned tasks and continuously adjusting the plan during the day and week. (8) Finally, individual and team planning performance is checked through the metrics, and actions are adjusted to meet desired goals. This is a critical step that allows quantitative and visual assessment of planning reliability under the LPS and is a cornerstone in improving the planning process.
In the evaluation step, to track the success of the LPS model implementation and planning reliability at the firm, the research team continually collected the following data: the number of forms submitted each day; the number of forms submitted by the end of each business Monday; and variances for submission errors, including incorrect form use, incorrect date, inverted data, errors in tabulating tasks, and missing variances. The research team coordinated to analyze the data and discussed the resulting feedback with individuals/teams.
For each non-completed task from the previous week, employees submitted their reasons for non-completion according to the nine variance criteria: (1) incorrect estimate of time required to complete a task, (2) need more internal information, (3) need more external information, (4) conditions of satisfaction not clearly defined, (5) superseded by other work on the project, (6) superseded by work on a different project, (7) commitment or promise was forgotten, (8) commitment or promise no longer required, and (9) technical failure, sickness, or casus fortuitus prevented work completion.
In addition to the data collected for TTA, TTAC, TTC, and TTP parameters from the employees’ submitted forms, total not completed tasks (TTNC) and New Tasks completed (NTC) were calculated in addition to the LPS metrics PPC, TA, and TMR. Moreover, the number of New Tasks that emerged (“New”) was also tracked.
Table 1 summarizes the definitions and the equations used to calculate the different parameters and metrics. Although not all parameters in
Table 1 were needed for calculations, they serve as a reference for any firm to use.
After collecting parameters and calculating metrics, the research team analyzed the resulting performance to assess the planning reliability. The team collaborated with company managers to discuss and evaluate the potential improvements and necessary adjustments resulting from LPS model implementation during design and tracking performance. Additionally, the team assessed causes for variances and non-completion of tasks as well as hurdles faced during team implementation. The outcomes of the proposed solution plan are presented and discussed in the next section.
7. Results
The following sub-sections discuss different aspects within the planning process that were made visible when assessing planning reliability and behavior through LPS metrics. Each sub-section addresses an aspect that, when evaluated in light of the other aspects, provided a more holistic understanding of the architectural design planning process under the LPS in the case study.
7.1. Weekly Work Plan Submittals
The collected data consisted of a total of 3289 WWPs submitted by employees out of a possible 3849 plans. This reflects an 86% participation rate from the staff out of the 90% that the strategic goal aimed for. Though the submittal rate was highest at the beginning of the year, the rate of submission remained reasonably high. The design professionals remained consistent in the number of tasks they submitted from week to week, with expected seasonal dips as shown in
Figure 5. TTP (total tasks promised) decreased slightly throughout the year, as did TTC (total tasks completed), while TTA (total tasks anticipated) slightly increased throughout. The resulting plots indicate that employees mostly adhered to completing the promised tasks for each week (an average of 19 tasks out of 23 planned) and were able to anticipate an average of eight tasks during look-ahead planning two weeks in advance. Further analysis of the data for “New” tasks is presented in the following sections.
7.2. Emergence of New Tasks
Considering that only eight tasks on average were anticipated out of the 23 planned ones each week, an examination of the number of New Tasks can yield more insight into the obtained results. Because New Tasks are tasks that emerge unexpectedly during the week of execution after the WWP has been put in place, they are not included in the WWP. Their “newness” is mostly chronological, as the sudden or unexpected emergence was due to practitioners executing tasks earlier than planned, thus giving them their “New” designation. Identification and/or creation of value in the architectural design process causes New Tasks to come up more frequently. In the construction phase of a project, since the design is already defined, value is apparent per the contract documents, and greater value can be gained through planning and in terms of execution and finding efficiencies therein. In the architectural design phase, however, new alternatives are still being identified and explored that by nature require new commitments. Another difference between the construction and architectural design phases is linearity of the overall process of a construction process. This linearity is often absent in the design phases, which because of its iterative nature is perceived as lacking proper structure to facilitate the implementation of proper planning methods, and it also leads to the emergence of high numbers of New Tasks that consequently impede the planning process and reduce planning reliability. Architectural design is by nature both a push and a pull activity, meaning some elements, such as owner conditions of satisfaction or code requirements, exert a pull to which a designer responds. However, the notions that guide the iterative stages of design are often nebulous and generative, meaning new activities are created through the act of exploration, and work must be accomplished before the results can be assessed relative to the ultimate goal, be it achieving proper adjacencies to support workflow or various factors that impact aesthetics, as two examples. This means that the amount of time may be known as a designer commits to a design schedule, but depending on how things go, a greater or smaller number of tasks may be completed during that time frame.
Figure 6 depicts the emergence of New Tasks in the WWPs submitted which were not anticipated in advance. The average number of weekly New Tasks is visibly high in the early parts of the year but decreases with time as more tasks are anticipated. The spike at mid-year can be attributed to design professionals working on a new project during its early design stages. The resulting emergence trend of New Tasks, combined with that of anticipated tasks, indicates that employees went through a learning curve in the beginning and improved at anticipating tasks with time. Additionally, the decrease New Tasks emerging and the increase in anticipated tasks reflects better commitment to planning and completing tasks, making design plans more reliable. Finally, the surprisingly large number of New Tasks is attributed to the nebulous nature of the architectural design phase, which comprises creative innovations, design iterations, and tasks that arise unexpectedly.
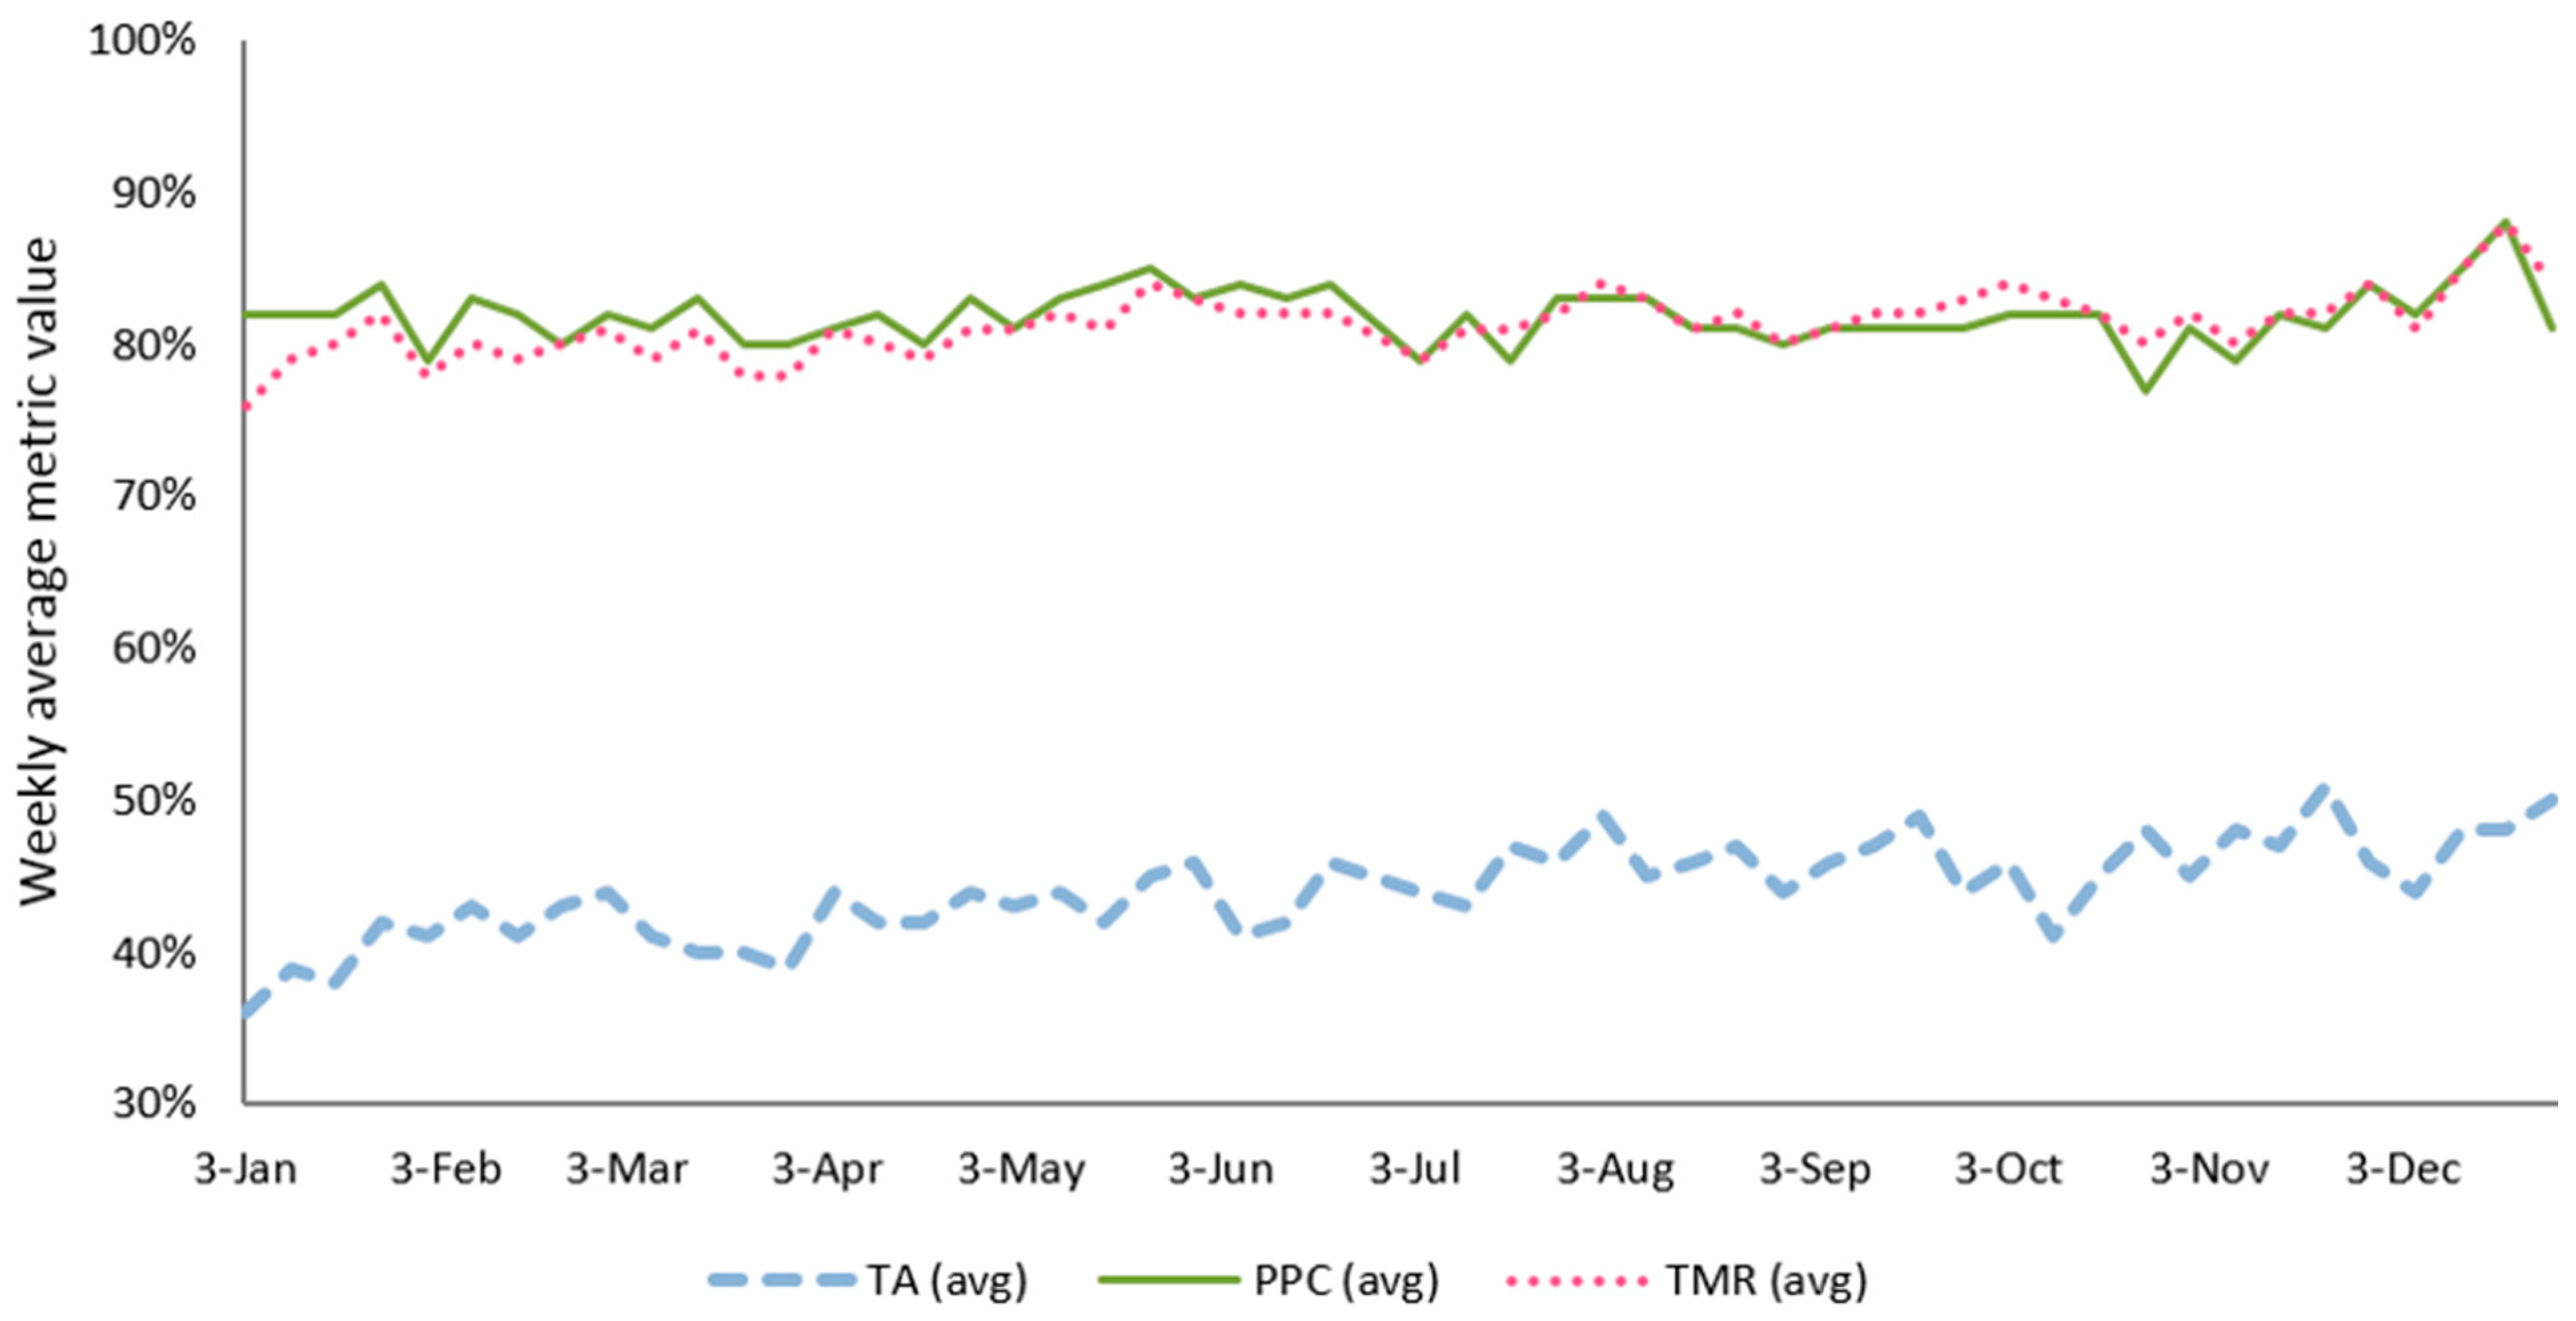
7.3. Trends of PPC, TA, and TMR Metrics
Based on the data collected for the parameters PPC, TA, and TMR, metrics were calculated using the equations in
Table 1. The resulting trends are plotted in
Figure 7. The firm achieved an annual percent planned complete (PPC) value of 83%, tasks anticipated (TA) value of 44%, and tasks made ready (TMR) value of 84%. Tracking the progress of each metric throughout the year, the PPC percentages rose modestly over the year from 82% in Quarter 1 to 85% in Quarter 4. TMR values showed a similar trend to PPC with an increase from 77% in Quarter 1 to 81% in Quarter 4. On the other hand, TA values increased steadily throughout the year from 38% in Quarter 1 to 45% by Quarter 4. Compared to PPC, the firm displayed a relatively low TA metric, which is mostly due to uncertainties in the early implementation of LPS methodology and the nature of the design phase itself. However, TA increased by 18% over one year, which reflects improvement in planning performance and better ability to anticipate tasks with time. Moreover, when considering the high number of New Tasks emerging each week in conjunction with high TMR and PPC values, it is evident that the design professionals were extremely responsive in removing constraints and making tasks ready during the execution week. The high PPC and TMR values together reflect high levels of employee commitment to ensure prerequisites are ready and complete tasks as promised.
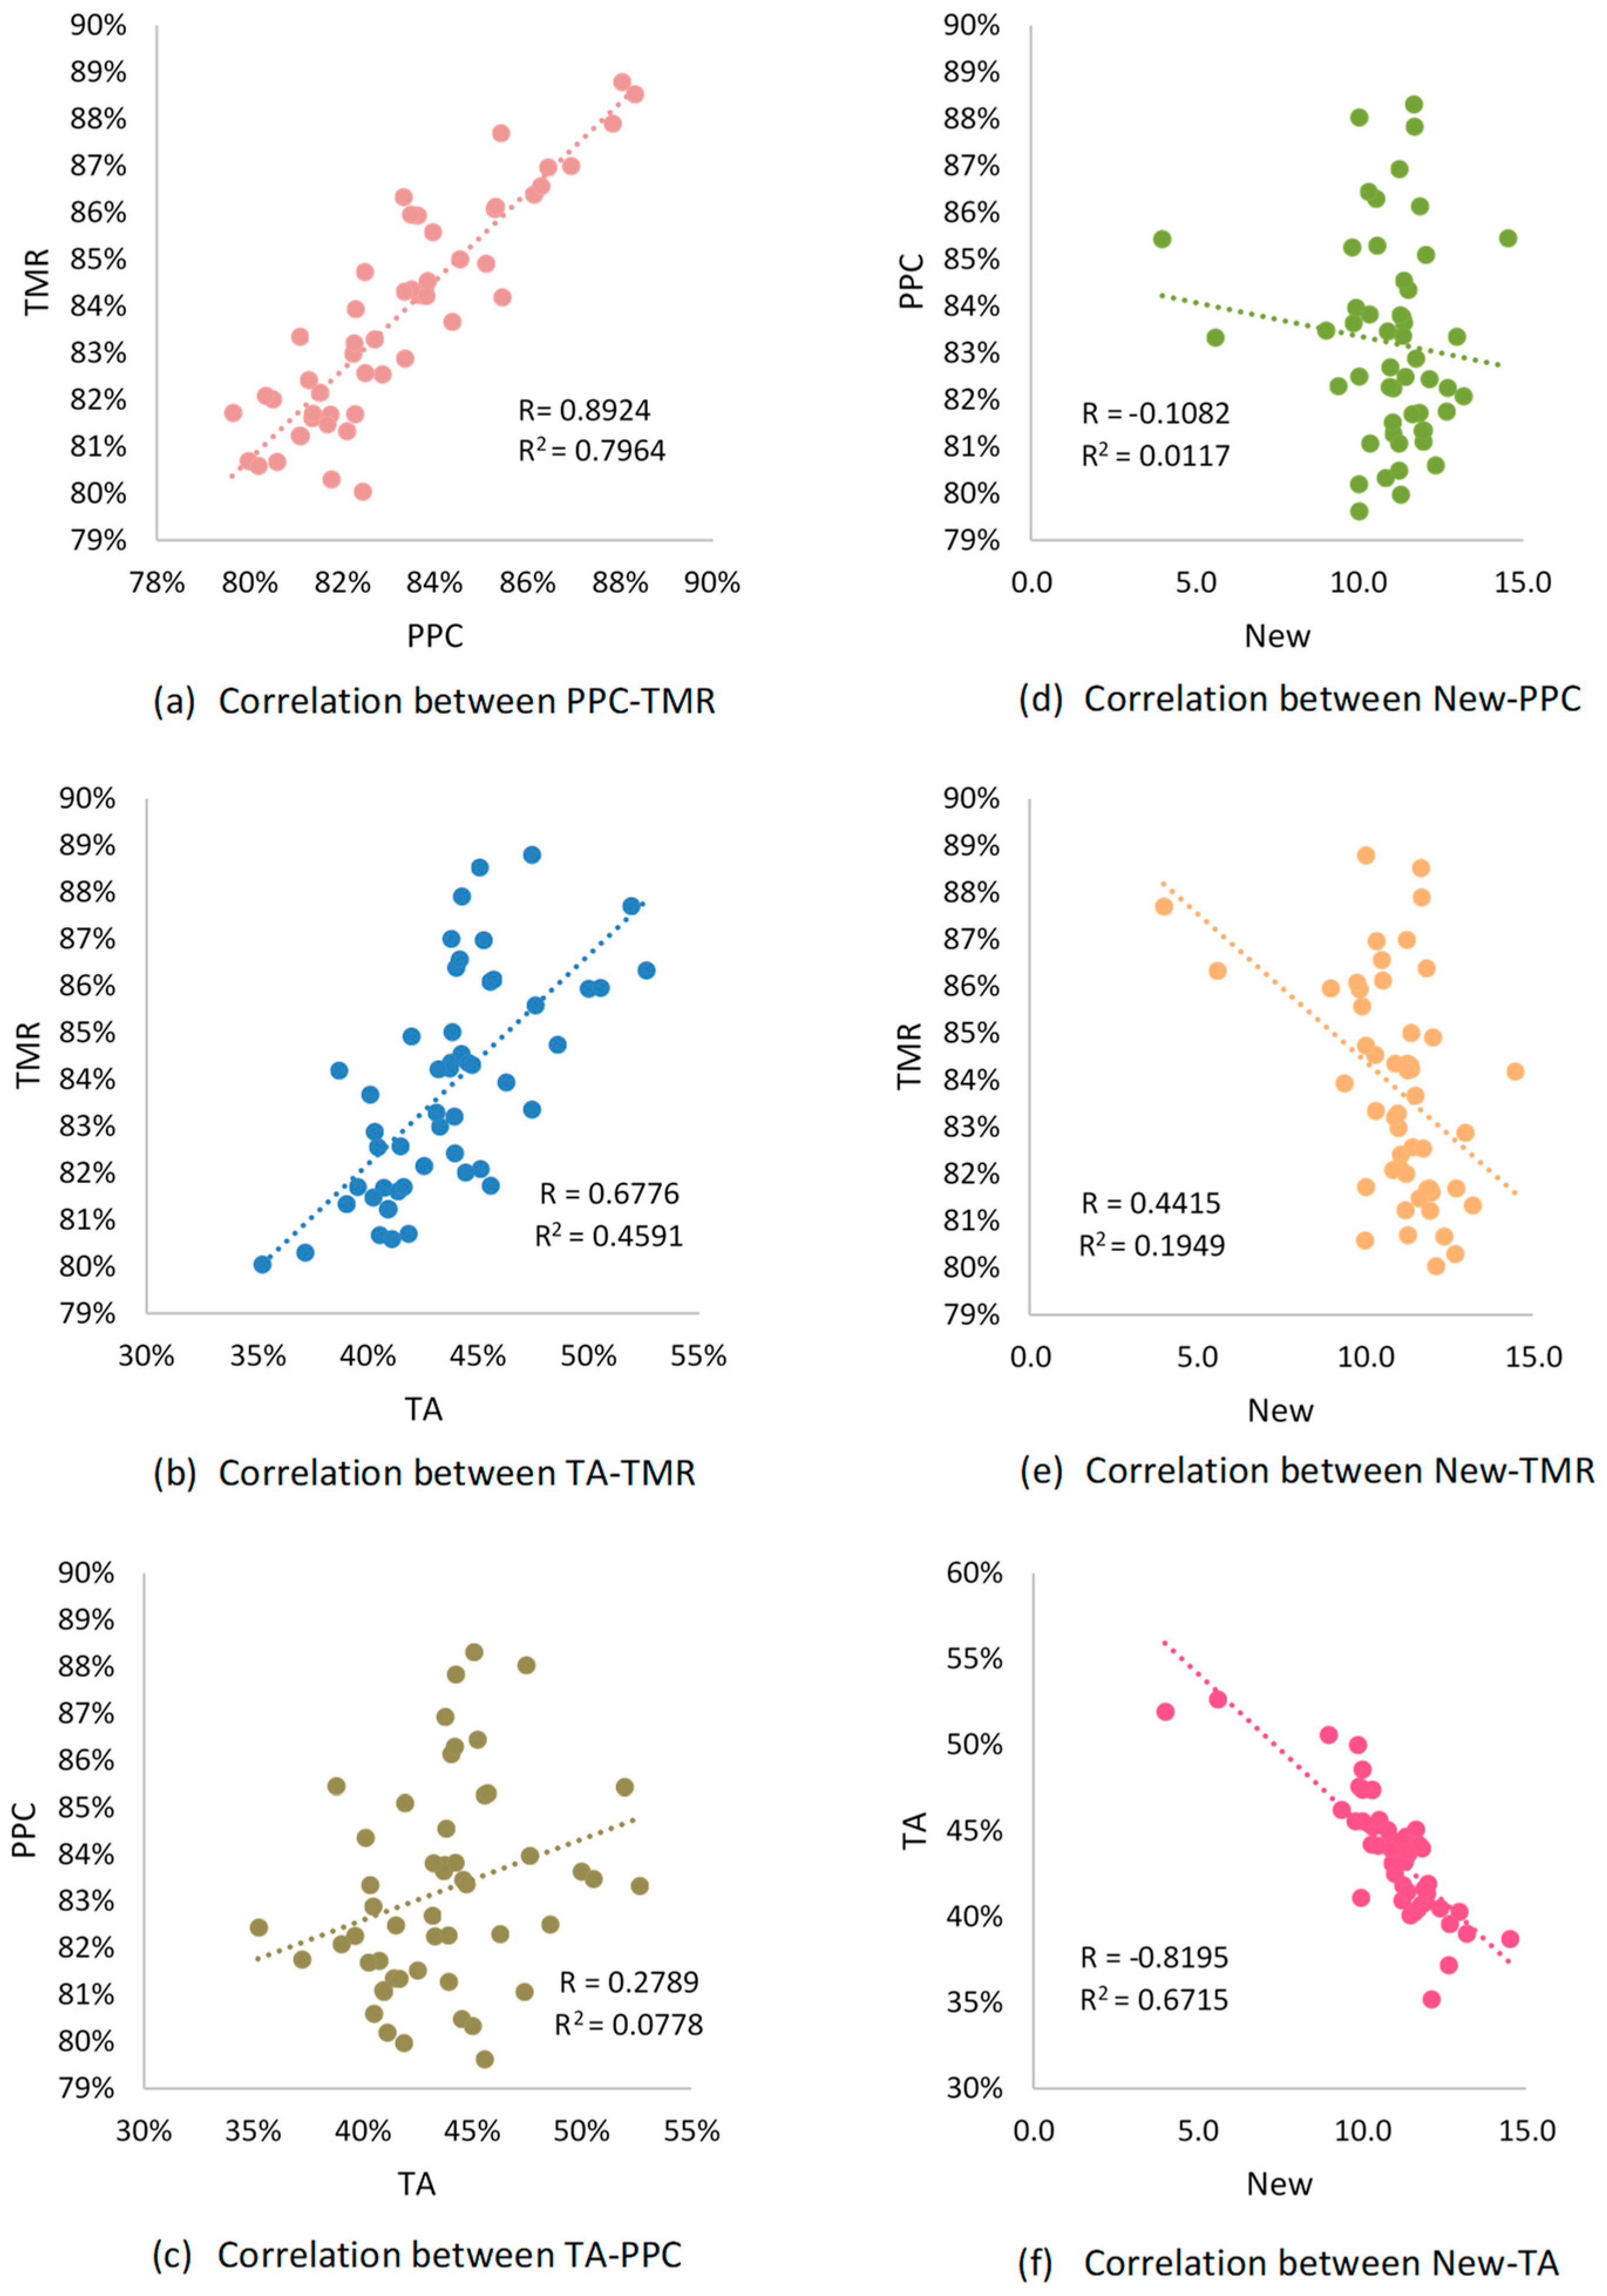
7.4. Correlations between the Metrics
To better understand and validate the conceptual associations between PPC, TA, and TMR metrics, an analysis of the correlations between them was conducted, as displayed in
Figure 8. The PPC–TMR pair (
Figure 8a) displayed a strong correlation, which is expected given that when tasks are made ready for execution, the rate of completion also increases accordingly. The TA–TMR pair (
Figure 8b) also displayed a good correlation where anticipating more tasks ahead of time gave ample room for removing constraints and making them ready.
On the other hand, the TA–PPC (
Figure 8c) and New–PPC (
Figure 8d) pairs both showed low correlation levels. The low correlation between TA and PPC can be attributed to the complex and unpredictable nature of architectural design where not all tasks may be anticipated ahead of time, leading to low TA values. This, however, did not hinder employees from managing to complete the newly emerging tasks on time, thus maintaining high PPC values despite the low correlation levels between TA and PPC. Regarding the low correlation between New Tasks and PPC, when new unplanned tasks emerge during a given week, the PPC value is expected to decrease significantly. However, the low correlation between New Tasks and PPC confirms the employees’ quick planning responsiveness when making New Tasks ready for execution during the week. This could be justified by the high TMR that the design professionals achieved by making tasks ready, which ensured that the PPC value was not affected by the emergence of New Tasks. This is further verified by the low correlation between New and TMR (
Figure 8e) where an increase in New Tasks did not impact or decrease the value of TMR. The design teams did, however, face some challenges in anticipating tasks as the number of New Tasks increased, as reflected by the strong correlation in New–TA (
Figure 8f).
The ability to track and observe these dynamics through the measured metrics highlights areas that need to be improved, such as better task anticipation. Yet, the ability of the designers to maintain high PPC and TMR values despite the emergence of New Tasks and not fully anticipating all tasks ahead of time indicates improvement in planning reliability as a result of LPS implementation.
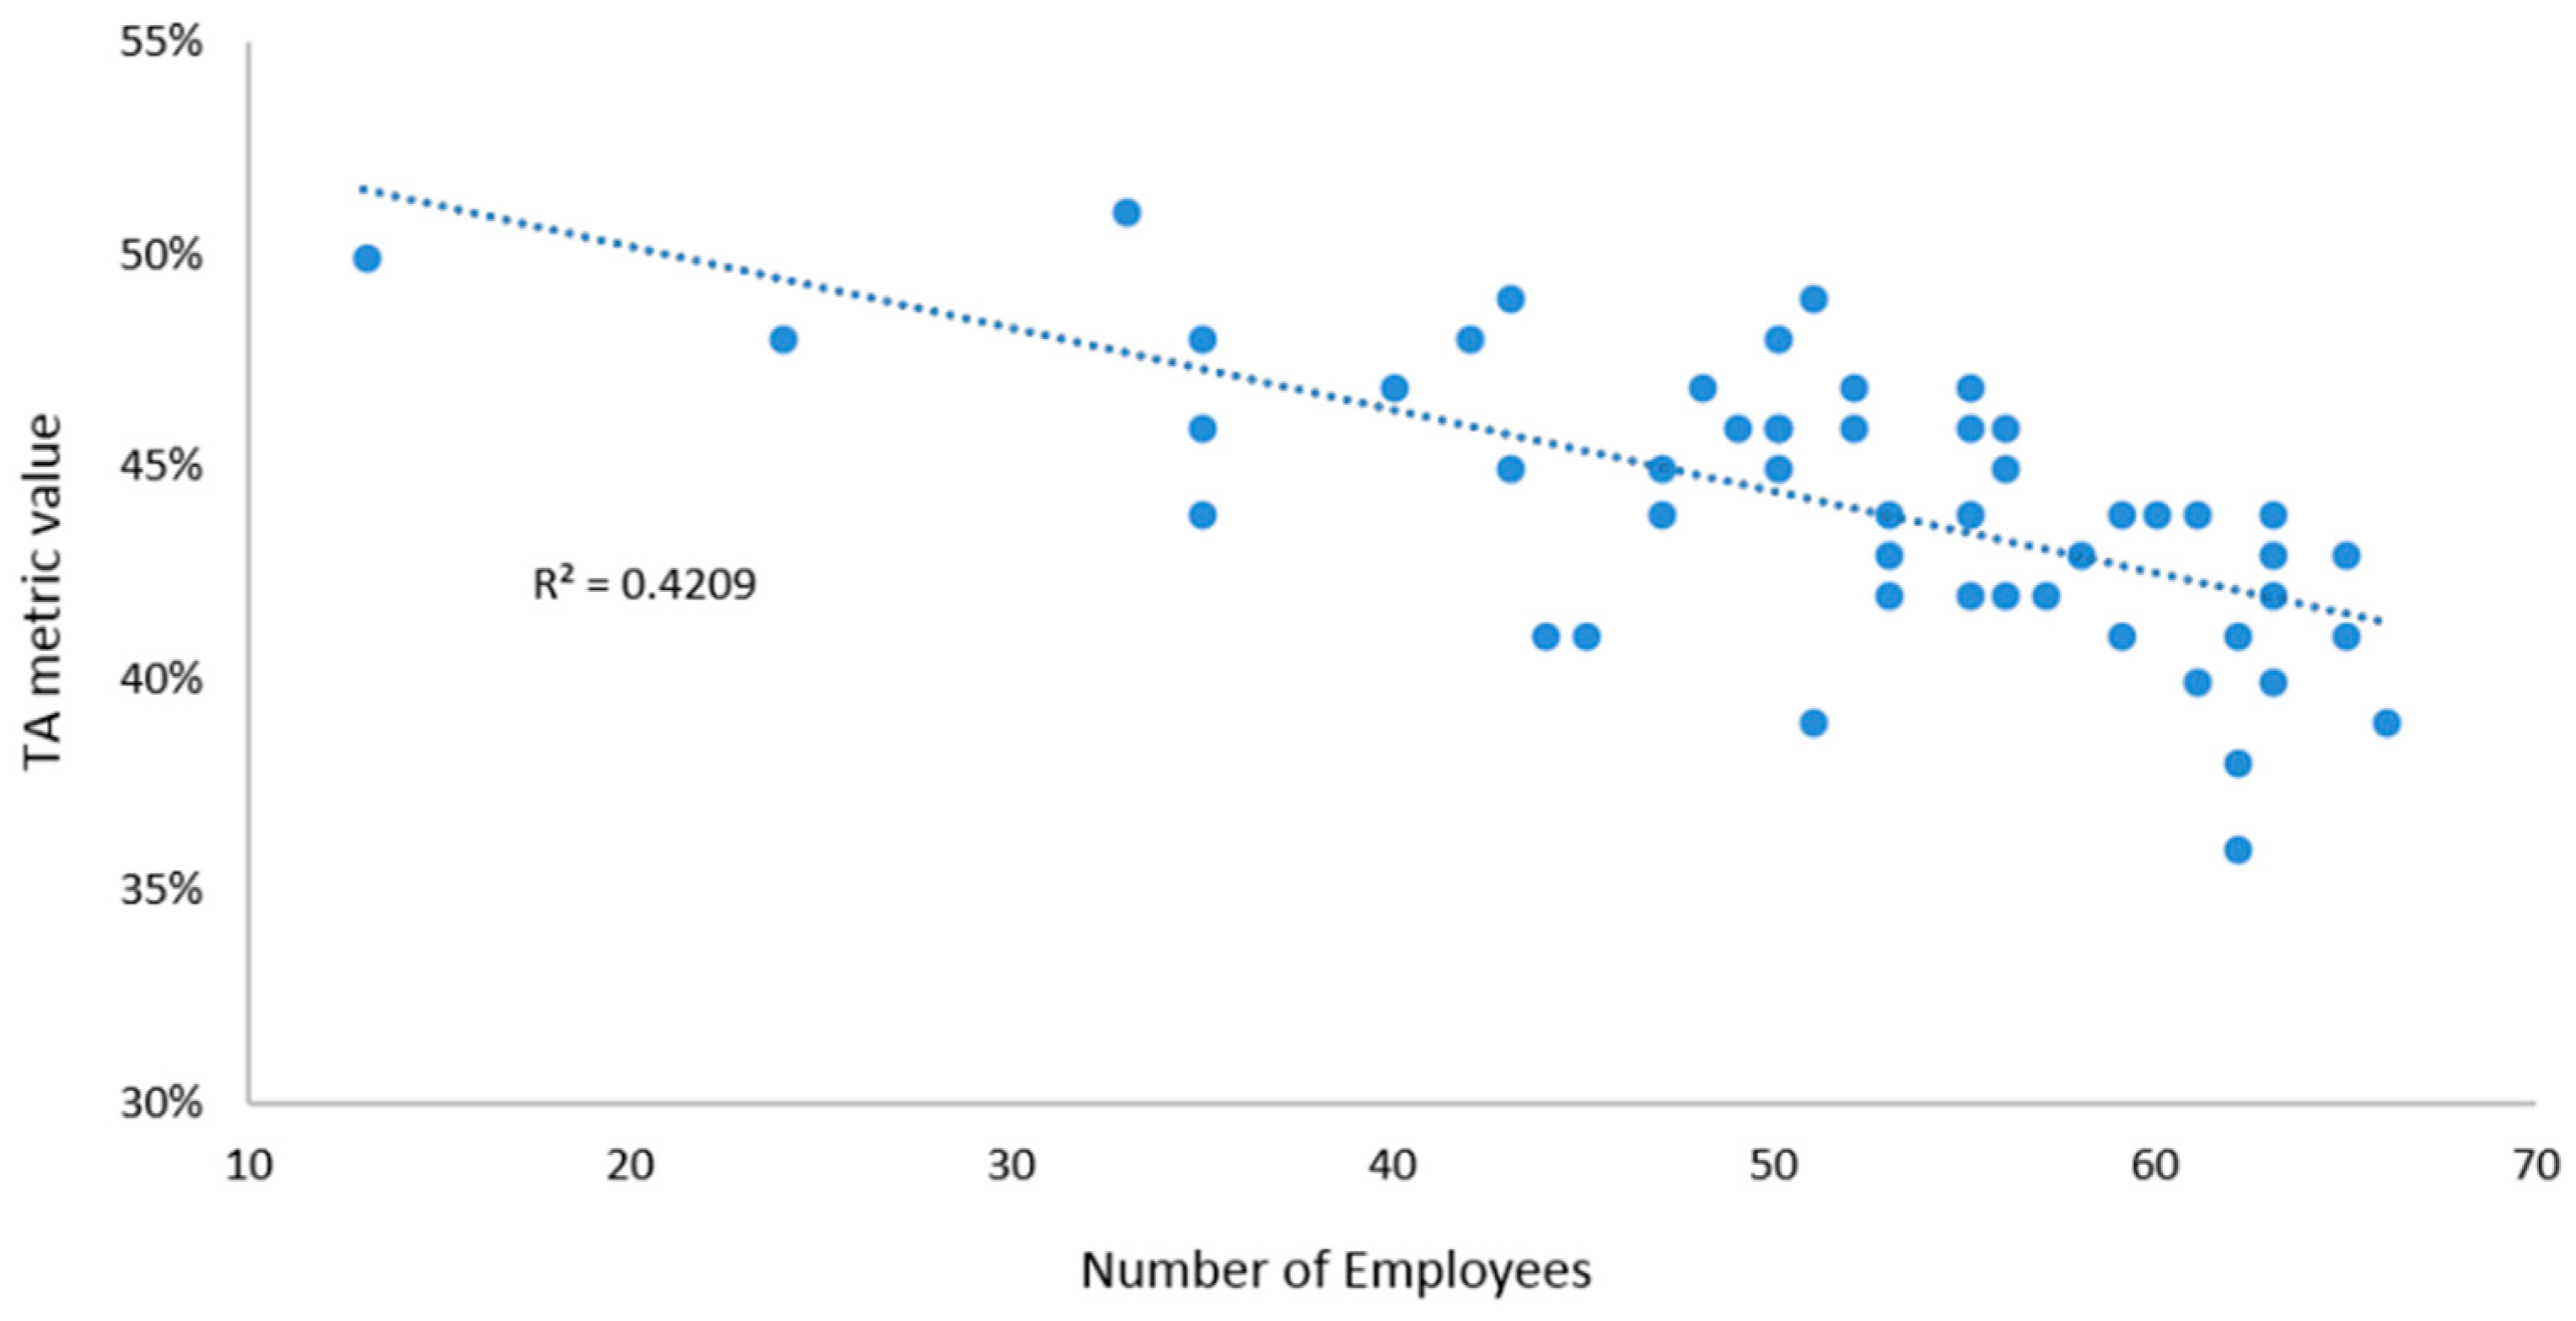
7.5. Participation and Its Impact on the Metrics
At the firm-wide level, the percentage of participation of employees in LPS implementation did not affect PPC values or the average number of tasks planned per week. However, a correlation analysis showed a link between the number of employees who participated in a given week and the respective TA percentages.
Figure 9 shows that as firm-wide participation increased, TA tended to decrease accordingly. Further examination of data from the submission records revealed a subset of planners who inconsistently submitted their form submissions, resulting in TA percentages that were lower than the firm average. This group of planners may have been reluctant to complete look-ahead planning compared to some co-workers, which resulted in their TA percentage being lower than expected. This would also explain the lower TA metric values observed between PPC and TMR: if more planners submitted their weekly plans and anticipated tasks ahead of time, the TA trends would show a more substantial increase over time. Therefore, these data further support the need for planners to commit to each other in order to make design planning more reliable. Moreover, having accurate quantitative LPS metrics and observational data to determine whether these correlations can provide more insight into the fundamental reasons shaping planning behavior.
7.6. Office Location-Based Results
The design firm had four offices implementing the LPS: Boulder (49 employees), San Francisco (6), Orange County (6), and Sacramento (14). To better understand the potential factors influencing planning behavior, performance analysis was conducted across the four offices to identify differences between them. The PPC, TMR, and TA metrics for each location are documented in
Figure 10. The results per office location were mostly similar to the firm-wide results, exhibiting an overall low yet steadily increasing TA metric over the course of a year, compared to high PPC and TMR values over the same period. The Boulder office (
Figure 10a) has the largest number of employees, so its results were the most closely aligned with the average firm-wide results, with stable PPC, TA, and TMR values. The San Francisco office (
Figure 10b) showed the greatest improvement in TA throughout the year, reaching a high of 93% by the end of Quarter 4. This increase in the TA value was eventually followed by improvements in both PPC and TMR metrics as more tasks were anticipated in advance. On the contrary, both the Orange County (
Figure 10c) and Sacramento (
Figure 10d) offices seemed to experience challenges with the look-ahead planning process. The Orange County office TA metric trend over the year was unstable, as it exhibited inconsistent peaks and dips throughout the year. This TA trend was followed by a steep decrease in both the PPC and TMR metrics at the end of the year. The Sacramento office displayed the lowest trend values of the TA metric, which was almost half of the TA values observed for the other locations.
The observed differences in planning behavior across the different offices can be attributed to several causes. Each firm location is normally assigned different numbers and types of projects simultaneously, so employees typically handle several projects at the same time. Whether there are more design professionals or not enough, the way the workload is divided among them depends on the number of projects and the scale and design phase of each project, which can play a major role in supporting or impairing the success of LPS implementation. For example, projects in the early design stage may not yet have clear requirements, which makes the process of anticipating tasks more challenging, resulting in unstable TA trends and consequently lower PPC and TMR if teams are not promptly responsive with respect to planning.
Observations of planning dynamics in these projects showed that the further the design phase progresses, the clearer the requirements become, resulting in better look-ahead planning. Moreover, when the workload was much higher and not evenly distributed, the ability of the design professionals to anticipate tasks and commit to their promised work was negatively impacted. By contrast, a workload balanced among the designers made the look-ahead planning process more robust and achievable. As noted earlier, employee participation can impact measures of planning reliability. As noted, some planners in the Orange Country and Sacramento offices may have been reluctant to submit their forms or have done so inconsistently, which negatively impacted TA measurements. The four locations also served as different data subsets demonstrating how diverse variables can impact planning reliability across different firms. In summary, several factors can impact the success of employees in achieving reliable planning. Investigating these factors and tracking performance requires more data collection and in-depth analysis in future studies to provide a basis for improvement.
7.7. Employee Role-Based Results
The collected data were also categorized under the different employee roles across the firm. However, it is important to note that planning is a collaborative effort that can be both individually and collaboratively allocated among team members. Thus, analyzing the results based on employee roles does not explicitly indicate each role’s direct impacts on the results, since every completed task is the result of several employees’ combined efforts. However, a possible conclusion may be drawn based on an average trend of the tracked metrics. The five major roles considered were principals, senior associates, associates, technical staff, and support staff, as summarized in
Table 2. In terms of the average number of work plans submitted, principals, associates, and technical staff ranked higher compared to senior associates and support staff. However, the number of submittals does not necessarily convey that either of the employee roles performed better at submitting plans, as this depends on how many employees were committed to submitting their forms. The firm targeted a 90–90 goal, meaning they challenged 90% of the staff to submit WWPs 90% of the time. Based on roles, most employees were close to this goal without much discrepancy among them. Principals had a marginally lower rate of 74%. Principals also performed best in anticipating tasks, with a TA of 56% and a PPC of 81%. Support staff ranked highest for PPC and TA metrics combined, at 91% and 55%, respectively. The technical staff also displayed good planning performance reflected in their 32% TA value and 83% PPC metric value. On the other hand, the senior associates and associates presented neither significantly good nor improper planning performance.
Principals and support staff clearly performed best in terms of anticipating tasks and completing those promised. Since principals serve as the planning unit concerned with decisions, management, and master planning, they are more likely to have a clearer and more complete vision of what needs to be accomplished and are thus more capable of anticipating work while ensuring its completion. Similarly, support staff are concerned with executing design work at a detailed level where such tasks are direct, clear, and well-defined. This makes planning and execution of tasks at the detailed, support-staff level more reliable, less variable, and achievable. On the other hand, the roles of senior associates, associates, and technical staff are concerned with transforming the large-scale plans into executable tasks. The transformation process in between requires high levels of co-ordination, collaboration, and integration between roles. Hence, it becomes critical to make reliable promises and commit to executing promised tasks while also anticipating other tasks ahead of time. As discussed earlier, the workload and number of projects being handled by each employee can influence the reliability of the planning process and the commitment to regularly update and submit these work plans. The collected LPS metrics can therefore provide valuable insights into the interlaying subtleties of the design planning process.
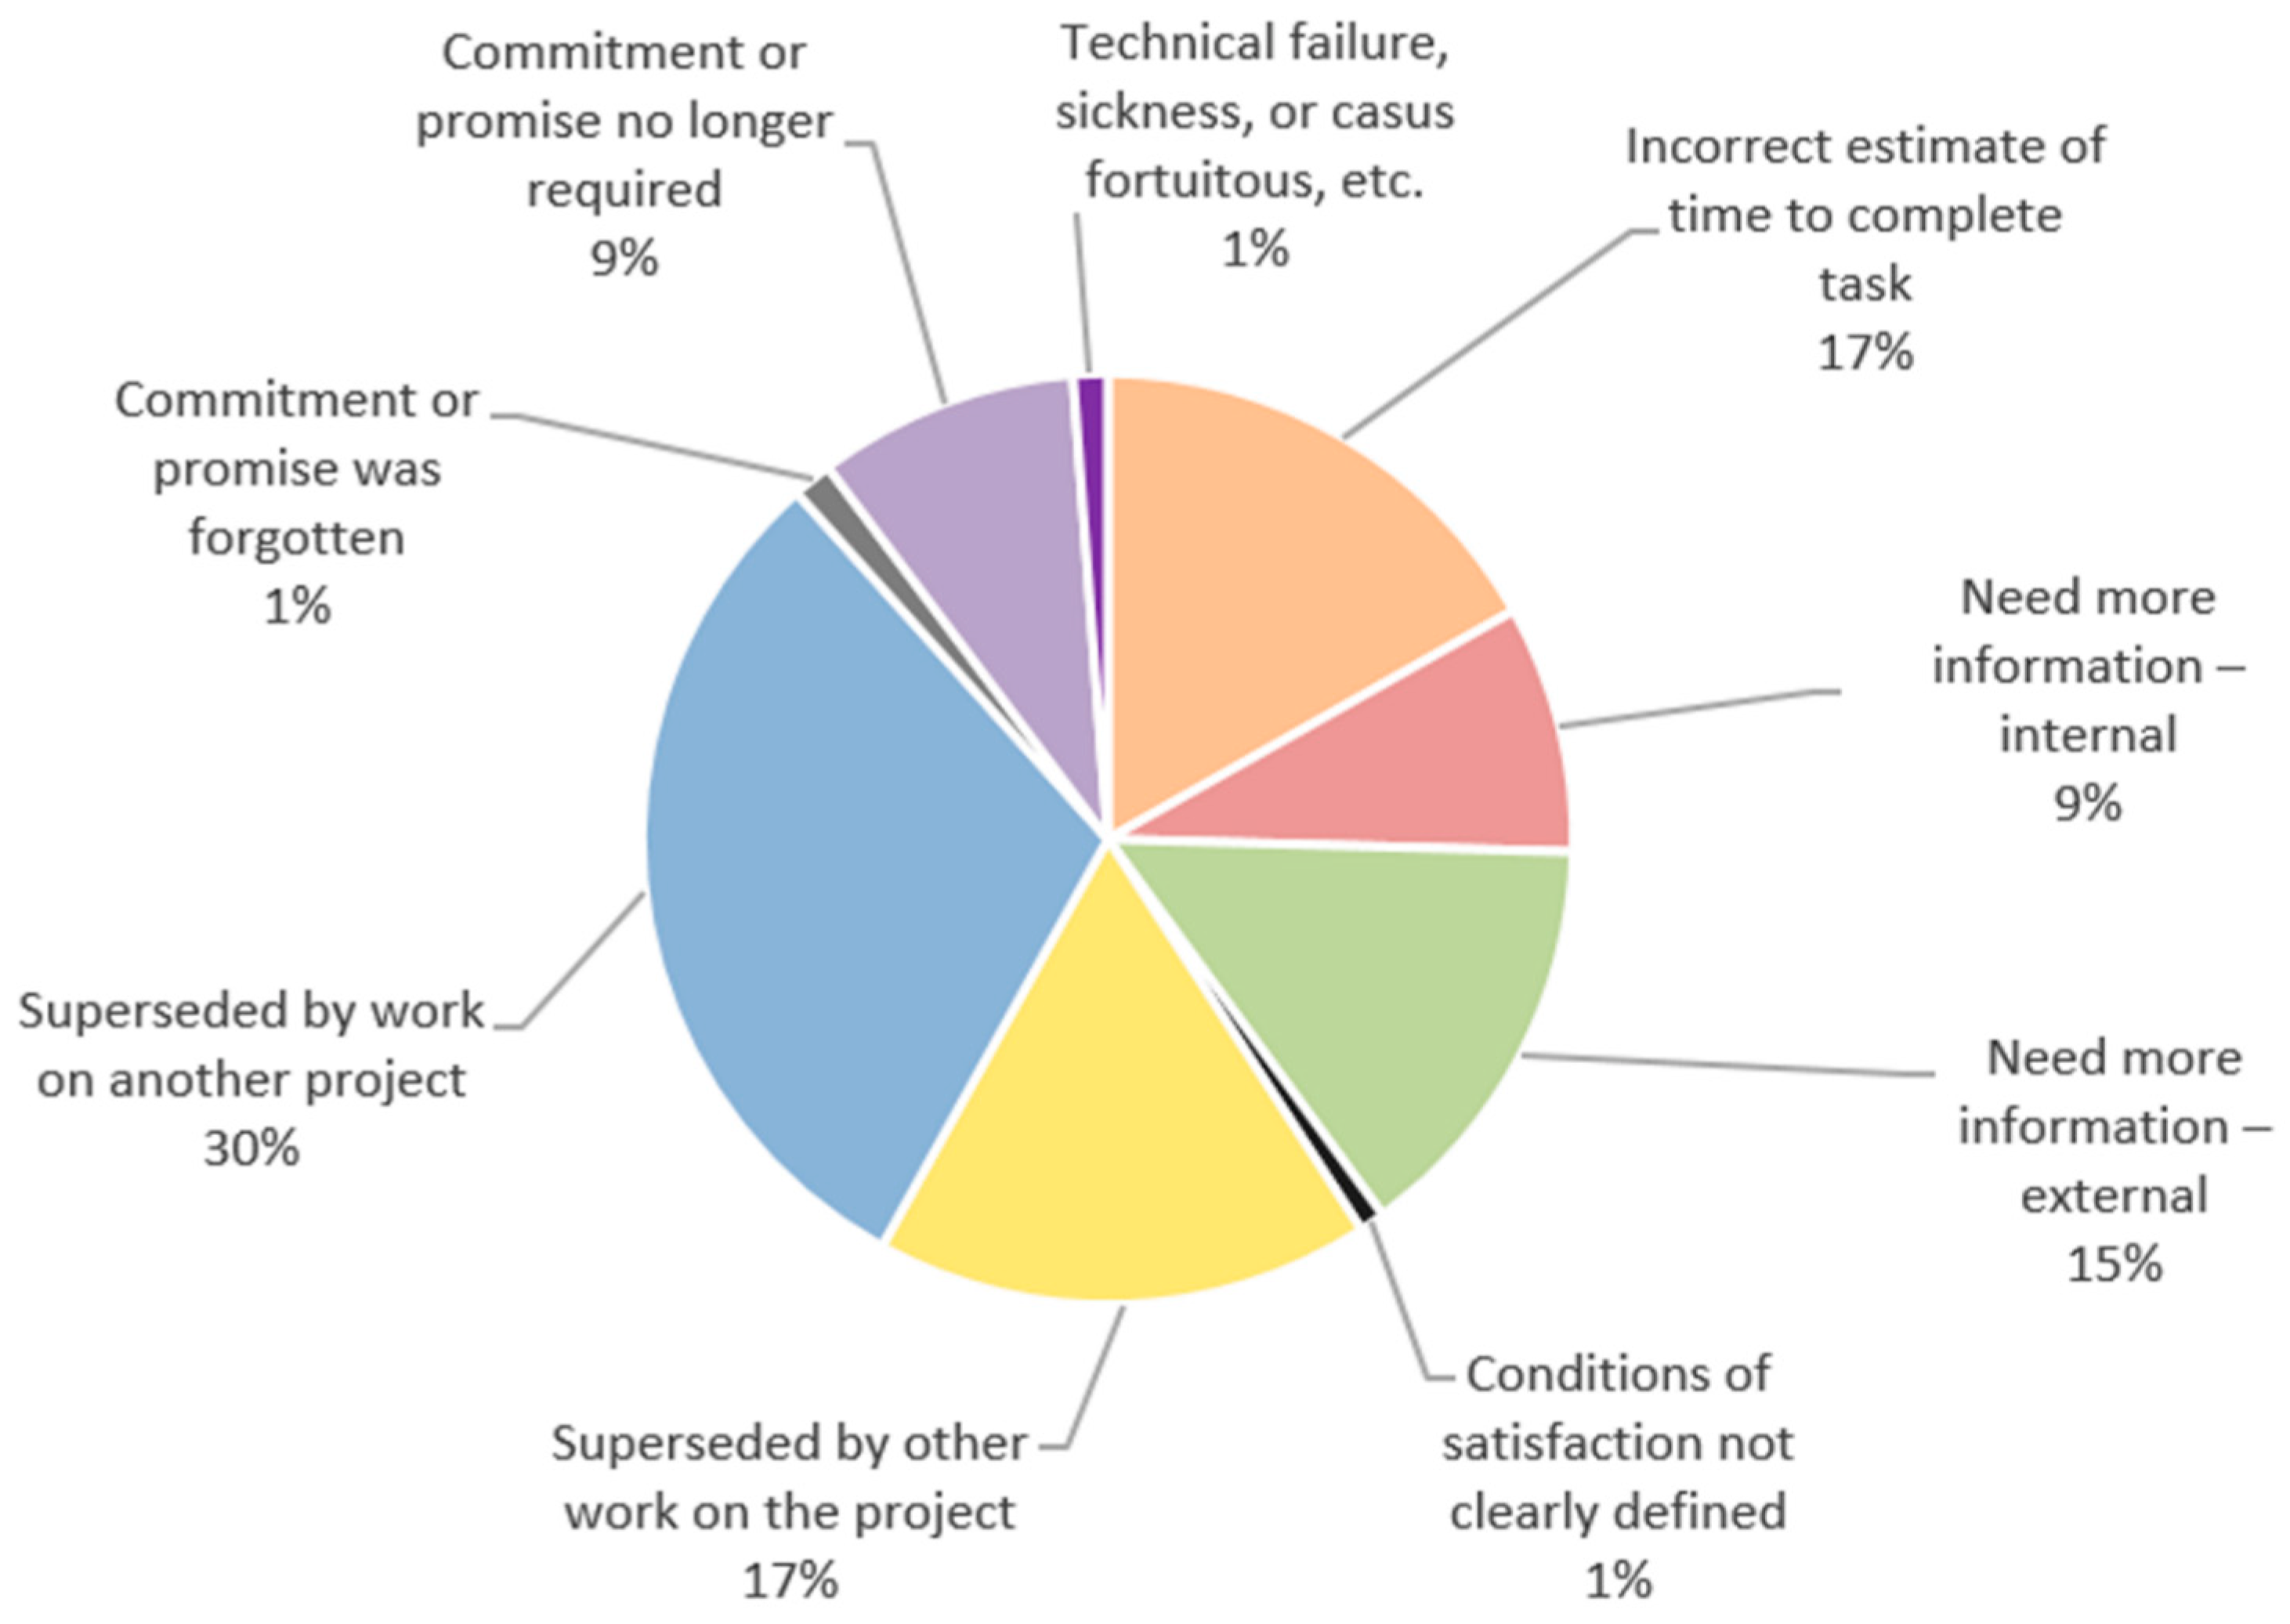
7.8. Non-Conformance Variances
The research groups tracked variances from planning based on nine causes, as summarized in
Figure 11. The most frequent reported variance cause was work plans being “superseded by work on a different project”, which accounted for nearly a third of all planning failures and was the top variance for every week. When employees handle multiple projects at the same time, anticipating tasks and committing to completing those on the WWPs becomes harder because the workload from multiple projects becomes overwhelming. Other main reasons for variances were due to “incorrect estimate of time to complete tasks” and “requiring more external information”. Acquiring timely, accurate information is crucial for properly and correctly anticipating tasks on the WWPs and committing to their completion. Accordingly, the main reasons for non-conformance of plans were identified by the firm, and resolving them became the company’s top strategic lean goal to improve reliable planning for the following year. Future studies may look into the root causes for these variances with enough in-depth data to analyze the time evolution of such variances and assess obstacles in order to guide future performance and management decisions in production planning.
8. Discussion
The resulting trends of the measured LPS metrics revealed a relatively high number of New Tasks, which is typical in architectural design because identification and/or creation of value is part of this design process. Part of the exploration process in architectural design is identifying and exploring new alternatives that by nature require new commitments. Additionally, as opposed to construction, linearity is often absent in architectural design, which is iterative in nature and thus lacks proper structure to facilitate the implementation of proper planning methods. It also leads to the emergence of high numbers of New Tasks, which consequently impede the planning process and reduce planning reliability. Collected data also showed relatively high average percentages of tasks completed as planned, which is reflected by the PPC metric. This indicates that the design professionals were successful in completing most of the work plans they committed to. Although the TA metric showed lower values than PPC and TMR, it consistently increased throughout the year, while the number of New Tasks decreased. This demonstrated that employees improved at anticipating tasks a few weeks ahead of time, which also decreased the emergence of New Tasks. Moreover, the high TMR metric values indicated that, despite having New Tasks emerging constantly, the design professionals were agile in making New Tasks ready for execution during the given week.
Further analysis of the metrics revealed good correlations in PPC–TMR and TA–TMR metrics, which means that the better the teams can anticipate tasks in advance, the more room they have to remove constraints and make tasks ready. Consequently, the completion rate of planned work also increases. However, despite the surprisingly large number of New Tasks, no correlation was found between New Tasks and PPC, which reflects a team’s quick responsiveness to the emergence of New Tasks and their ability to complete them on time and maintain high PPC values. As the number of New Tasks increased, planners faced further challenges to making these tasks ready in time for execution by removing the corresponding constraints. Hence, the LPS proved to be applicable during the architectural design phase and enabled architects to be responsive to emerging constraints. Other planning methods, such as Scrum, can be tested to compare performance with the LPS, although these methods share several key aspects [
56].
An important observation made by correlating the participation rate of employees and the TA metrics revealed that some planners inconsistently submitted their WWPs (possibly indicating that they were reluctant to do so), which caused lower average TA values for their office. This shows that LPS implementation in this case study can be improved, as happens with several LPS implementations [
57]. Yet the ability of architectural designers to maintain high PPC and TMR values despite the emergence of New Tasks and not fully anticipating all tasks ahead of time indicates the improvement in planning reliability resulting from LPS implementation at the firm.
It was possible to identify factors that influence planning performance by assessing the metric generated at the four office locations and analyzing the roles of the design professionals. The location-based and role-based results showed differences in planning performance between each location and each role. This can be attributed to the different projects handled by each office and the number of projects assigned to each employee, both of which directly impact workload balance and resulting planning performance. Additionally, the roles of employees and what stage of the design phase they were involved in can directly affect their ability to anticipate tasks. Roles of principals who have a broader and more complete project view can help better devise work plans and commit to them. Similarly, the roles of support and technical staff dealing with the documentation of detailed and well-defined design tasks have less ambiguity and are more capable of anticipating tasks and completing them.
Finally, the different reasons for variances and non-conformance to plans were analyzed. The three major causes for variances were “superseded by work on a different project”, “incorrect estimate of time to complete tasks”, and “requiring more external information”. This highlights the importance of planning at a higher level and across different projects to ability to increase the reliability of planning and commitment. Additionally, acquiring the necessary information when needed is important to achieve correct and reliable work plans. These causes were noted by the firm, who made resolving them a top priority.
9. Conclusions
Given the complex nature of the architectural design phase and its usually highly unreliable planning process, LPS implementation shows great promise for improving design planning in addition to being already widely implemented in the construction phase of building projects to attain better planning performance. This paper introduces an LPS framework tailored to facilitate LPS implementation in the architectural design phase. The framework includes a conceptual model and an implementation model. This paper also provides a case study of firm-wide adoption of a proposed LPS implementation model across the four offices of an AEC company in the U.S. The suggested LPS procedure is homogeneous to the traditional procedure but with additional emphasis on LPS concepts and aspects that are relevant to the architectural design phase. This was achieved by identifying architectural design issues and addressing them through LPS principles and functions. As the LPS encompasses numerous principles, and not all LPS implementation projects necessarily implement all available principles, those pertaining to addressing knowledge sharing, uncertainty in design, and complexities due to interdependencies, for example, were emphasized. The developed framework facilitates LPS implementation during architectural design by ensuring that the appropriate principles are employed for the purposes of the architectural design phase.
Since it is hard to improve what cannot be measured, LPS metrics of PPC, TA, and TMR were calculated to quantitatively track employees’ design planning performance. The firm collected data regarding WWPs submitted by its staff over a one-year period.
Analysis of the planning performance trends per the developed architectural-design-based LPS model case study indicated important reflections regarding improvements and challenges. The high PPC and TMR values together with high numbers of New Tasks reflected significant levels of employee commitment and their quick responsiveness in identifying and removing constraints to ensure prerequisites were ready and work plans were completed as promised. Additionally, the decrease in the number of emerging New Tasks and the increase in anticipated tasks indicates employees properly learning and adapting to the LPS planning system case study. Moreover, overall participation of employees in consistently and continually submitting their work plans throughout the year indicates willingness of the staff to improve their own and firm-wide planning performance. This willingness is a direct sign of commitment between employees to co-ordinate their work, collaboratively plan design tasks, and make the design process more reliable. On the contrary, the causes of variances and challenges experienced by employees were revealed by analysis and correlation of these metrics. If more planners were fully committed to submitting their weekly plans and anticipating tasks ahead of time, it is expected that the TA trends would have shown more substantial increase over time, which further supports the need for planners to commit to each other in order to make design planning more reliable.
Therefore, having accurate quantitative tools, such as the LPS metrics, to track and observe planning performance can provide valuable insights into the dynamic, iterative, and interrelated aspects of the design planning process. The collected data and calculated metrics provided a basis for understanding underlying dynamics shaping architectural design planning revealed by the LPS case study, namely the uncertain nature of the architectural design phase, constant changes in tasks, and the ability of architects to adopt to this chaotic environment by being more responsive in removing constraints in order to make tasks ready as they progressed during the last two weeks of look-ahead planning and task execution. They facilitated visualization and quantification of the architectural design phase, which reverses the common misconception of it as an unmeasurable process that cannot be monitored through data and metrics. Therefore, this study provides a bases for future attempts in implementing the LPS in the architectural design phase of construction projects to monitor and possibly reduce hidden waste which is often regarded as inevitable. Moreover, analysis of correlations between the different metrics yielded more insight into the fundamental reasons shaping and influencing the reliability of design planning. Accordingly, implementing the LPS and measuring performance though LPS metrics identified both improvements and challenges. Being able to assess the obstacles faced and performing root-case analysis can help guide future management decisions in production planning. By tracking and measuring performance, areas of improvement and underlying dynamics are better understood so that near- and long-term plans can be aligned, and a more integrated LPS implementation can be achieved.
The contribution of this study is the development of an architectural design phase-based framework for understanding LPS applicability, feasibility, and functionality in the architectural design phase of construction projects in order to help uncover, monitor, and possibly limit hidden waste. This study facilitates describing the dynamics of the planning process during the architectural design phase and quantitatively tracking planning performance while implementing the LPS in this phase, which can help improve the planning process and increase reliable promising. Moreover, it provides a benchmark of desired performance to guide necessary interventions in the architectural design process. Through design science research, the lessons learned and valuable observations from case study firm’s implementation of the LPS can help practitioners and researchers at a broader level understand the underlying dynamics and foster LPS application in architectural design.
Some of this study’s limitations include the fact that the study relies on results from a single architectural firm. Expanding the sample size by including more firms and diverse ones—small, medium, and large—might offer a more comprehensive understanding of LPS applicability across different organizational structures and cultures. It was also conducted over a one-year period. A longer duration might uncover trends, challenges, or benefits that are not immediately apparent and may provide insights into the LPS’s long-term viability and effectiveness in the architectural design phase. Moreover, the case study was conducted on projects located in locations where participants were relatively familiar with LPS principles and methodologies. A deeper investigation is required to explore the framework’s implementation results in other locations where participants have not been exposed to the LPS or have not had the chance to witness its practical implementation. Finally, no feedback from the architectural design team has been collected regarding their experience using the LPS compared to other delivery systems. While case study results provide a practical perspective, incorporating architects’ personal impressions would enrich the study by shifting the focus from traditional analysis approaches to a more personalized perspective from the architects’ point of view.

 ,
, 


