Abstract
One of the most energy-intensive facilities requiring a comprehensive and well-optimised cooling system is the data centre. Air containment across the data centre is a key thermal management and energy-saving strategy that enhances the performance of data centres. The majority of modern energy-efficient data centres use some type of air containment. The primary advantage of aisle separation and containment is the decrease in the air temperature at the server inlet by reducing the mixing of hot air with cold air. In order to ascertain the volume of literature relating to corridor insulation, we conducted a literature review. Currently, there have been numerous articles regarding the application of computational fluid dynamics (CFD) analysis, however, publications delineating the integration of building information modelling (BIM) principles for corridor separation are still limited. Research specifically targeting data centre corridor insulation is somewhat limited. As a result of this analysis, the most common methods used to isolate hot or cold aisles within a data centre were identified. To determine the most effective type of corridor insulation, the BIM family was created in Autodesk Revit. The model includes 15 telecom cabinets containing information technology (IT) equipment, eight inter-row air conditioners, and one UPS. The model was used for the CFD analysis of the air temperature in different zones of the room. Visualisation of the results using gradient temperature distributions at different levels provides a complete picture of the microclimate formation in the room and allowed the advantage of the hot aisle isolation scheme to be demonstrated.
1. Introduction
Using isolation systems is one of the most effective ways to increase the efficiency of a modern data centre. This is because the main consumer of excess capacity in the data centre is the cooling system. The lower the load on it, the higher the energy efficiency.
A green grid defines the data centre power usage effectiveness (PUE) as the proportion of total energy consumption of a data centre to the energy consumed by computing equipment [1], as presented in Equations (1) and (2).
The less efficient the data centre, the higher the PUE. The inverse of PUE is data centre infrastructure efficiency (DCiE).
Energy efficiency is improved by constantly controlling the temperature range in data centres. The approach of continuous temperature control is widespread and is a generally accepted standard of data centre operation.
Telecom cabinets housing IT equipment are located in the data centre. Constant cooling is required for this equipment. In order to prevent overheating, it is essential to provide cool air to the cabinet’s front door and remove hot air from its rear. However, if there is no barrier between the two zones—cold and hot—the two flows can mix, reducing cooling and increasing the load on the air conditioning units.
To prevent hot and cold air from mixing, it is essential to construct an air containment system. The principle is as follows: the closed container stores the cooled air, preventing it from mixing with hot air and ensuring that high-load cabinets are adequately cooled. The air container should be located between two rows of cabinets or between a row of cabinets and a room wall. All sides of the container separating the hot and cold zones must be separated by partitions so that cold air only passes through the IT equipment.
The energy consumption of IT equipment is directly related to the power requirements of the cooling fans. One can calculate the cooling power requirements of a data centre as per the rack inlet temperature. When the temperature rises, the IT equipment’s efficiency declines, and power consumption rises. Moreover, there is a sharp surge above 27 °C, and the power consumption can increase up to 20% in the range of 27–35 °C. For this reason, ASHRAE recommends that a temperature range of 18–27 °C should be maintained [2].
There are two basic options for installing a containerisation system in an existing engine room. The first is to isolate the cold aisle, and the second is to isolate the hot aisle. Each of these options has its own set of characteristics, advantages, and disadvantages.
In order to determine the volume of articles addressing the topic of corridor insulation, a literature review was conducted. There is little research on data centre corridor isolation, but when it comes to using CFD analysis, there are quite a few articles, however, regarding the use of the BIM concept, this paper is among the more recent ones. This article discusses the basic principles of cold- and hot-aisle containment systems.
To determine which type of corridor insulation is the most effective, a BIM family of corridor insulation in Autodesk Revit was created and an experimental model was developed. This model was analysed using CFD, and it was determined that hot corridor insulation is the optimal method.
The number of articles related to data centres is very limited, especially those related to cooling systems and the use of air corridor insulation. This section provides an overview of articles on the use of hot and cold corridor insulation for data centres.
Air cooling is presently the most widespread cooling system employed in data centres due to its ease of use and maintenance. Cold air is supplied to the data centre by computer room air conditioning (CRAC) units. These units have powerful fans that move large volumes of air. Servers are usually located in racks and have built-in fans that funnel air in from the front and hot air out from the rear. Depending on the direction of airflow in the room, various arrangements can be utilised. For instance, one can supply air from the underfloor space (plenum) through perforated tiles or from the ceiling in a suspended format. The assumption is that the hot air generated by the racks will be returned to the CRAC unaltered with the cold air supply to avoid thermodynamic inefficiencies.
Typically, racks are arranged in rows so that the rack inlets of adjacent rows face each other (likewise, the rack outlets of conjoined rows face each other) to create alternating hot and cold aisles (HACA). While this arrangement partially separates the hot and cold air paths, it is still possible for hot air to be drawn into the cold air stream or bypass the cold air directly. To more effectively reduce hot and cold air mixing, our study suggests a physical separation between the HACA. This separation can be achieved by either insulating the cold aisles or the hot aisles. Additionally, a return air duct configuration can be utilised to segregate the hot air emerging from each telecom cabinet and channel it into the return air duct. However, each approach has its benefits and drawbacks.
2. Main Principles of Building Air Corridor Insulation Systems for Data Centres
2.1. Research Methodology
The purpose of the literature review was to identify studies related to thermal management, corridor insulation systems, CFD, and BIM in data centres. These studies confirm that corridor isolation is the optimal cooling system option among many possibilities. However, despite the accuracy of the data, the use of CFD and BIM is still rare in studies.
Based on the area of use, several categories of articles could be identified: cold aisle containment (CAC) thermal control; hot aisle containment (HAC) thermal control; room cooling systems; energy consumption optimisation by using cooling systems. The most relevant papers were selected and reviewed within the framework of this article. Twenty-six articles were analysed and based on these, extensive analysis was carried out, which is reflected in Table 1.

Table 1.
Analysis of the articles related to HACA.
CFD modelling can be used to solve a wide range of problems. CFD contains special tools to model the thermal conditions of electronic devices. For example, if we are talking about data centres, the use of this technology makes it possible to optimise the air conditioning system and increase the energy efficiency. Therefore, CFD represents a logical and necessary extension of BIM design.
BIM incorporates details of the structure including its architectural and engineering systems. This model is subsequently imported into the AutoDesk CFD 2019 (CFD software), which analyses the room geometry, establishes appropriate boundary and initial conditions, and computes three-dimensional temperature, velocity, pressure, and additional physical parameters.
In reality, CFD provides a virtual testing facility to assess crucial and highly responsible engineering systems ahead of construction efforts. CFD computations assure system performance along with designing a room layout early on in the process, allowing for the placement of air conditioning units and IT equipment racks in a data centre. The final results display the temperature mode of the system operation.
Table 1 shows the extensive analysis for the main categories.
As described by Lee et al. [3], a containerised data centre with CAC has been proposed as an effective thermal control strategy. The system design utilises a downflow system with a heat exchanger positioned directly above the data centre on the air side. Additionally, there is an evaporative water cooler on the water side that facilitates a cooling process. The return temperature index (RTI), rack cooling index (RCI), and supply heat index (SHI) were used to evaluate the design performance of the proposed test data centre.
As reported in an ageing data centre retrofit project by Cho and Woo [4], the referenced data centre’s previous air conditioning system was replaced with a new, separate row-based cooling system, implemented in the same IT server room to meet the target. Quantitative evaluation metrics reflecting the performance of the data centre were used. The results of the performance analysis were validated by comparing them to the results obtained during an analysis using the same conditions as the experimental measurements. Air temperature, humidity, and air distribution efficiency in the IT environment were studied using in situ measurements of the performance indices. The differences and technical features of this experimental study were that two different forms of cooling systems were evaluated based on the same IT environment conditions, IT equipment location, and cooling load in the same server room. The results showed that data centre cooling systems using the “full cold and hot aisle containment” method are very effective in relieving the heat load from IT servers.
The article written by Rong et al. [5] examined the energy-saving technologies accessible for data centres. Energy-saving technologies have varying impacts on energy conservation at diverse stages of data centre evolution from a global viewpoint. In data centre site selection, proper site selection through scientific and rational use of natural energy can reduce the consumption of CRAC by about 30%. CRAC typically accounts for 40–50% of the total energy consumed, so careful siting can reduce the total energy consumption by up to 12–15%. When building data centres, energy consumption can be effectively reduced by 25–30% by selecting low-power servers and auxiliary energy-saving devices. Data centre operators can reduce the overall energy consumption by around 10–15% by optimising their resource planning algorithm and management strategy. The rational utilisation of renewable energy sources can also effectively lower the total energy consumption of data centres during their construction.
The article written by Cho and Kim [6] investigated the feasibility of available energy saving solutions for dedicated data centre cooling using a data centre energy consumption estimation tool. The research was carried out by employing energy or environmental norms together with a comprehensive building design technique. This approach guarantees that state-of-the-art knowledge and innovation are applied in all stages of planning and analysis. The integrated approach, also known as integrated building design, in the case of data centres includes data centre infrastructure management (DCIM). This study aimed to discover adaptive design strategies that can optimise energy consumption by continuously adjusting the environmental conditions and cooling systems of IT centres through simulation.
Data centre ventilation configurations and how the airflow is geometrically influenced by the floor inlet were examined by Lu et al. [7]. Experimental and numerical investigations of typical cases were also summarised, along with the relevant parameters. The advantages and limitations of different airflow control methods including CAC systems, HAC systems, and vertical exhaust duct system (VEDS) were analysed.
Wang et al. [8] examined the impact of different cold aisle blocking and containment schemes on the overall efficiency of a containerised data centre. A comprehensive understanding of airflow and temperature distribution is essential for proper thermal management in a data centre to maintain the temperature limits and avoid excessive cooling utilisation. The arrangement and characteristics of all data centres were similar. The most popular was the hot aisle/cold aisle configuration, which serves to reduce the blending of hot and cold air. Either a suspended ceiling or raised floor can be used to supply cold air. Full hot or cold aisle insulation can be used to further minimise hot air recirculation and cold air bypass.
Nada and Elfeky [9] investigated the thermal performance of data centres with different partitioning and cold aisle content. The objective of this study was to evaluate and compare three different cold aisle arrangements: (i) an open free cold aisle, (ii) a semi-closed cold aisle where the sides of the aisles were closed, and (iii) a completely closed cold aisle where the sides and top of the aisles were closed. The study explored the impact of distinct cold aisle arrangements on the distribution of temperature in the racks and servers as well as performance metrics (SHI and RHI) at varying power densities. For the purpose of this study, a physically simulated data centre with one row of three racks and four simulated servers in each rack was designed and built.
In the referenced article written by Khalaj et al. [10], an operating data centre was considered. In order to investigate the thermal behaviour of the air distributed inside the data centre, numerical simulations were carried out using experimental data. The simulation results showed several undesirable hotspots near the racks. To minimise the associated thermal inefficiencies, this study examined the effectiveness of utilising cold aisles as a highly efficient and industrially available method. The efficiency of this technique was measured based on three dimensionless indices called SHI, RCI, and the coefficient of performance (COP). In this example, the application of the proposed method improved the SHI, RCI, and COP of the cooling system by more than 0.45%, 17%, and 19.5%, respectively. The results demonstrate the effectiveness of the cold aisle containment method in improving the energy efficiency of data centres.
It is common for a data centre to generate heat that can cause damage to the equipment. Therefore, an air conditioning system is required to remove it. Typically, data centres use a CRAC system to blow cold air to achieve the necessary cooling capacity. The main contributions in the article by Lin et al. [11] are as follows:
- In order to reduce energy consumption in the air conditioning system, the mass flow rate in the optical distribution frame (ODF) can be decreased or the temperature difference between the supply and return branches of the ODF can be increased. The best temperature difference is 10.86 °C.
- Separating the hot and cold passages will prevent the mixing of hot and cold fluids, significantly reducing the rate of entropy generation and exergy destruction in the air system.
- Compared to the worst design point, the total exergy destruction can be reduced by 12.6% at the optimal design point. The energy saving is 7.5% compared to the mean value of the total exergy loss at the chosen design points. This can be majorly attributed to the reduced energy losses in the air conditioning system.
- At the optimal design point, the anticipated PUE is 1.30, which is lower than the average of 1.59 obtained in 2020.
- At the optimal design point, the three thermal efficiency indicators, namely RCILo (the subscript Lo represents the temperature conditions at low end of temperature range), RTI, and SHI, are 100%, 101%, and 0%, respectively, and are all within the range of ideal conditions.
Lu and Zhang [12] analysed how geometric configurations influence the thermal efficiency of data centres and offered extra insights into data centre design. This paper proposed a hypothesis of a significant relationship between the air distribution, geometry, and pressure field in a UFAD system, in conjunction with the existing knowledge. It provides additional insights into the design of retrofitted or newly built data centres. Furthermore, the paper experimentally examined the operating parameters of CRAC. The paper introduced and assessed improved methods to determine the thermal performance. Creating an effective cooling system for a data centre can dramatically impact its thermal performance. This paper discussed two types of factors affecting the thermal performance of a data centre. First, these were geometric configurations: plenum height (0.4, 0.5, 0.6, and 0.7 m), perforation percentage (10, 20, 30, and 40%), and the location of air conditioners in the computer room. Second, the operating parameters included air temperature and air volume. In order to investigate the effect of the location of the cooling system on the overall thermal performance of the data centre, 32 configurations were designed with varying percentages of perforation along the height of the plenum. The results showed that there is a critical range of plenum height (up to 0.6 m) and percentage of perforation (greater than 20%) in which the thermal performance of the system can be significantly improved by changing the geometric configurations. Outside this range, the performance is essentially unchanged.
Zhan et al. [13] proposed and experimentally verified a ducted hot aisle containment for refrigeration racks. A new type of hot aisle confinement system for refrigerated cabinets was proposed and experimentally validated. Experiments were conducted under different hot aisle conditions, door condition, diffusers, percentage of installed blanking panels, and airflow scenarios. The main results can be summarised as follows: for the overall improvement in the cooling effect of the racks, the sealed envelope was slightly better than the duct envelope. Sealing is obviously better than a collar alone. However, due to the high investment cost of airtight enclosures under realistic conditions, it was ultimately recommended that duct enclosures be used as the most effective method of improving the average rack inlet temperature.
The paper written by Chu et al. [14] addressed airflow management issues that have a significant impact on cooling efficiency in data centres. Based on the available airflow management techniques, long and short airflow paths were identified. Long paths can result in significant losses due to recirculation, bypass, misdistribution, and leakage, but are relatively inexpensive to install. In contrast, a short path cooling system can effectively reduce or eliminate the above disadvantages, but can be expensive to install. In addition, it may have the problem of improper airflow distribution. Typically, CFD is widely used to study thermal management and airflow control in data centres. However, to further improve the CFD model, it needs to be pre-calibrated with experimental data. Airflow control techniques applicable to raised floor data centres were discussed for long distance cooling systems. This paper reviewed and discussed airflow control techniques applicable to the most common raised floor data centres. The significant airflow control difficulties were hot air recirculation, cold air bypass, leakage, over- and under-supply, airflow, and temperature non-uniformity. Nonetheless, such effects tend to interact with the geometric arrangement of the data centre. Therefore, studies on the effects of plenum depth, perforated tiles, improved means such as forced bypass fans, aisle, and leakage containment, infrastructure layout were discussed and compared, and some air-flow manipulation rules based on previous studies were proposed. Furthermore, studies on the suspended airflow method were examined and contrasted with the raised floor method. Research was conducted on a closed cooling system utilising a heat exchanger and heat pipe for short-distance cooling.
Sundaralingam et al. [15] concentrated on experimentally characterising the following cold aisle configurations: open aisle, partially open aisle, and fully closed aisle. The presentation of the experimental data aimed to evaluate various configurations including rack inlet contour plots, tile and rack airflow, and measurements of pressure and temperature within the central processing unit (CPU) of the server to assess their respective performances. One of the aims of this paper was to present experimental data that could be used in the future, either for numerical modelling or to illustrate trends. The paper presented a significant amount of data obtained using a variety of measurement instruments. In addition, recommendations for cold aisle sealing can be made based on the experimental results. The following recommendations were proposed, having considered various factors relating to data centre conditions similar to those described in this paper: (1) Where possible, a fully sealed aisle with redundant provision is preferred; (2) Where there are geometric or cost constraints and partial sealing is considered, either an under-provisioned (UP) or over-provisioned (OP) top only arrangement is recommended.
Attia et al. [16] described the effects of three air distribution systems on the rack temperature profile and thermal management using two performance indices to analyse data centre air management systems. Two indices, SHI and RHI, were calculated experimentally to present the thermal performance of a scaled data centre model. Based on the size analysis, a scaled data centre with a four server rack was designed and built with a scaling factor of 1/6. The temperature distributions of the front and rear racks, server temperatures, and air inlet and outlet heat indices were measured to examine, compare, and assess the performance of three air distribution system configurations in the scaled data centre and to evaluate their effectiveness in simulating actual data centres. The results indicated that both methods of insulation, namely aisle partitioning and aisle enclosure, significantly reduced rack inlet temperatures at critical locations such as the tops of server racks. Insulation using aisle partitioning and aisle containment could reduce rack inlet temperatures up to approximately 3% to 13% for partitioning and around 13% to 15.5% for aisle containment at various power densities. Therefore, CAC provides the best thermal performance because aisle containment completely blocks the top airflow.
A CAC isolation method was considered, which is one of the most effective and industrially available methods to reduce thermal inefficiency. The effectiveness of this method was evaluated using three dimensionless indices: the SHI, RCI, and COP of the cooling system. In this example, Scherer et al. [10] presented an application of the proposed method that improved the SHI, RCI, and COP of the cooling system. The results obtained demonstrated the effectiveness of the cold aisle containment method in improving the energy efficiency of data centre systems.
The development of verified predictive models for CRAC in data centres was the focus of research written by Alkharabsheh et al. [17]. These models were based on measured fan curves for the CRAC unit as well as load banks used for server modelling. Validation of the models was conducted by measuring airflow and temperature at critical points within the data centre. The modelling process also included a thorough assessment of the effects of cold aisle leaks that affect the temperature and flow rates. A detailed approach to CAC system modelling was derived and the results were checked with experimental data. The results indicate a strong agreement between the flow and temperature measurements and the CFD results. A detailed model of the rack including the rails for its attachment was also modelled in CFD. This study found that under the conditions considered, rack leaks can raise the temperature by 4 degrees Celsius at the inlet to the upper third of all racks in the cold aisle. This suggests that the upper sections of the racks are highly vulnerable to recirculation. Therefore, they should be considered as crucial areas for characterising leakage in the CAC system. In this study, a certain leakage threshold value was also observed beyond which the inlet temperature of the protection system became irregular and exceeded the supply temperature. This limit was set to about 15% of the total surface area of the vessel. When the leakage level reaches 15%, the containment system permits too much hot air to recirculate, resulting in the loss of the benefits provided by the cold aisle containment.
Gondipalli et al. [18] explored the effect of CAC insulation on the rack inlet air temperature. Two data centre layouts with raised floor—simple and complex models—were considered in the study. Cold aisles were insulated in three ways: roof, door, roof and door. The analysis was performed for 60% and 80% CRAC airflow on a basic model comprised of 12 server racks. Both methods of insulation (i.e., roof and roof and doors) significantly reduced the rack inlet temperature at critical locations (tops of server racks). The improvement in thermoregulation was mainly due to the obstruction of the upper circulation cells. When the flow rate was at 60%, the CRAC experienced notable infiltration from both the top and edges. Therefore, an insulation technique that incorporates a roof and doors is the most effective. Conversely, when the flow rate increased to 80%, the optimal insulation method was just a roof, as it surpassed the efficiency of other insulation techniques. The door-only insulation technique has minor advantages and can improve the thermal performance of edge server racks by blocking edge recirculation chambers. However, blocking edge recirculation cells contributes to the deepening of the upper recirculation cells, causing the thermal performance at the top of the rack to deteriorate. For a complex scheme with 20 server racks and 80% CRAC flow rate, both insulation methods (i.e., roof and roof and doors) significantly reduced the rack inlet temperature at critical locations (tops of server racks). However, only the roof showed the best results.
The data centre studied in the article by Gao et al. [19] had an improvement in energy efficiency. The CRAC air conditioners provided plenty of cold air to make the thermal environment ideal. By optimising the airflow pattern with three measures, the energy efficiency was improved. By partially enclosing the cold aisles, the supply air temperature could be increased by 3 °C while still maintaining the thermal environment within the recommended range. This will lead to a corresponding improvement in the CRAC system efficiency, and hence the energy efficiency of the system. Regarding the cooling efficiency evaluation parameters, in some complex cases, the RTI is not suitable for evaluating the bypass or recirculation condition because a recirculation or bypass problem may exist even when the RTI is equal to 1, which is assumed to mean that there is no recirculation or bypass problem. Similarly, an RTI value less than or greater than one may not accurately indicate the presence of bypass or recirculation. Although some metrics have been developed to assess cooling efficiency and airflow patterns in data centres, there is still a need for a comprehensive metric that combines cooling efficiency, energy costs, and equipment failure rates that can also be easily applied.
To improve the cooling efficiency and reduce recirculation, an increasing number of data centres are turning to the hot aisle system. In accordance with heat transfer principles, Zhou et al. [20] provided a dynamic model for regulating cooling in open and closed environments and suggested decentralised model predictive controllers (MPCs) to manage CRAC units. The study examined an approach to segment the data centre into overlapping CRAC influence zones. In each zone, the MPC controller regulated the rack inlet temperature whilst minimising the cooling power consumption by controlling the CRAC unit fan speed and supply air temperature. The proposed decentralised cooling control method was tested in a production data centre featuring hot aisles enclosed with plastic strips. Experimental results demonstrated its robustness and ability to withstand various perturbations.
In Wibron et al. [21], CFD modelling was utilised to obtain precise information concerning airflow in a data centre. Experimental values were incorporated to validate the findings, ultimately enhancing the accuracy and reliability of the CFD modelling of the data centres. It is imperative to consider the buoyancy effect when modelling airflow. However, the simplified boundary conditions used in this study may not accurately reflect the results at the rack level (i.e., just upstream of the inlet surfaces located on the components). However, it is evident that the results at the room level were precise. The objective of this investigation was not only to certify the CFD model, but also to contrast the effectiveness of different turbulence models. It was observed that the fluid flow for the various turbulence models diverged at positions that were not adjacent to the main elements of the data centre. Of the three models compared, it was observed that the deviations from the experimental values were similar, with variations above the server racks. For future studies, it is advisable to conduct measurements at additional locations where the flow field is less influenced by boundary conditions than at many of the measurement locations in this research.
In the research by Onyiorah et al. [22], the idea of utilising rack-level containment was evaluated as a potential airflow management strategy, viable for certain data centre layouts and applications. A parametric investigation was conducted in this paper on a 1008 m2 fundamental data centre with an IT load of 161 kW. The study was based on a case analysis for CFD to compare the efficiency of independent rack-level containment and snorkels in eradicating hot spots by routing cold air from a lower sub-floor plenum to cabinet inlets, in turn, minimising the inlet temperatures. The article analysed over 40 CFD models and ascertained the comparative degrees of inlet temperature reduction and cooling enhancement achieved through this technique. Test cases such as simulations for comparison with traditional hot aisle/cold aisle containment systems, different combinations of containment strategies, and for different rack density distributions in a data centre model were also included. The results provide a preliminary understanding of the feasibility of this strategy and offer initial recommendations for implementing this concept based on the layout and design of the data centre.
The objective of [23] as mentioned by Tsuda et al. was to explore the disparities between the CAC and HAC approaches regarding the temperature of the air taken in by the information and communication technology (ICT) equipment in the rack. To achieve this aim, a setup was established to compare the two capping methods under the equivalent load and the same conditioned atmosphere, and the thermal conditions were then measured. With the ICT equipment mounted vertically in the centre of the rack, the intake air temperature was lower when using CAC compared to HAC. The inlet air temperatures of the ICT equipment were adjusted to the same level for both types of aisle sealing by regulating the volume of air provided through the air conditioner. As a result, while maintaining the same inlet temperature of each piece of equipment during capping tests, the power consumption of the air conditioner fan was twice as high when using HAC as opposed to CAC. This suggests that the CAC system can save more energy consumed by air conditioning systems as it can effectively maintain low temperature conditions.
Nemati et al. [24] examined three containment configurations: cold aisle, hot aisle, and duct (with suspended ceiling). In the first two cases, the CRAH flow rate was controlled based on the pressure differential measured by three sensors inside and outside the containment. In the third case, the CRAH flow rate was controlled based on the required IT airflow. To uphold the designated supply air temperature, the CRAH flow rate was modified by measuring the return air temperature and the overall heat load in the premises. Leakage was monitored by checking the temperature and pressure readings in the aisles and at the server inlets/outlets, respectively.
Shrivastava et al. [25] compared the performance and cooling energy costs of various types of air containment systems. Furthermore, they offered several recommendations that should be considered when selecting a containment system. Based on this paper, it can be concluded that a containment system can decrease the cooling energy costs by limiting the mixing of hot and cold air flows. The level of insulation directly affects the savings. For instance, if vertical exhaust duct (VED) or CAC insulation is implemented on all cabinets, a hypothetical situation with 100% containment results in low cooling airflow and high supply and return air temperatures. A VED system provides an advantage when high ambient room air temperatures are unacceptable. In typical data centres such as those with storage network cabinets where some equipment in the room cannot be isolated, a VED system captures exhaust air and prevents it from mixing with the cold supply air in an uninsulated area. Regardless of the type of cooling system used, the containment system provides significant opportunities for cooling energy savings. Due to an elevation in the permitted supply air temperature and an upsurge in the return air temperature, the water-based cooling systems analysed in the study exhibited increased savings with a CAC system, followed by a VED system, and ultimately a 100% isolated version of either system. Thus, it is evident that even a slight progressive increase in the supply and return air temperature results in economic benefits with the aforementioned cooling systems. These findings could also apply to an air-side economiser or evaporative cooling system as OpEx performance alone does not determine the optimal containment strategy.
Alkharabsheh et al. [26] interrogated the impact of distinct containment leakage coefficients on the flow rate and temperature in a typical data centre. The modular data centre represented a genuine cold aisle system in an experimental laboratory. The numerical model was verified through experimental measurements. The model included fan rotation curves in CRAC and IT equipment. Several parametric studies have been carried out, varying leakage rates from 0% (perfectly sealed protection system) to 100% (unsealed cold aisle), to investigate the impact of leakage factors on the airflow rate of the CRAC unit and IT equipment. Technical term abbreviations were explained and clear, concise language was used to maintain comprehensibility. Common academic sections and regular author and institution formatting were included in conventional structure. Precise word choice was used and the text was grammatically correct with no spelling or punctuation errors. Additionally, the effect on the inlet temperature was also studied. The register was formal with positions on subjects made clear through hedging. The results demonstrate that leakage in the containment system significantly affects the performance of the containment system. Objective evaluations were excluded unless clearly marked as such. The language was objective, avoided biased or ornamental language, and employed a passive tone. Clear causal connections were made between statements and a logical flow of information was maintained. A threshold leak rate was discovered beyond which a containment system offers no benefit over a traditional non-containerised cold aisle system. This methodology can be utilised to define leakage in localised systems.
The analysis by Tatchell-Evans et al. [27] and the corresponding experimental findings confirmed that cold aisle containment in server racks, used in data centres, could lead to considerable levels of bypass. There are numerous HVAC models for thermal comfort that forecast energy consumption under different conditions or schemes. At the cold aisle, up to 20% of the cold air provided can bypass the servers, depending on the level of DpCH and the degree of blockage of the leakage paths in the server racks. It is predicted that improvements in rack design or the blocking of leakage paths can lead to reductions in ET ranging from 1 to 8.8%. The reduction is significantly influenced by factors such as DpCH, IT power density, and server fan speed response to cold aisle pressure. Additionally, ET was found to be dependent on DpCH, with an up to 16% reduction in ET achievable through DpCH optimisation as a function of IT power density, server fan speed response to cold aisle pressure, and degree of rack leakage path blockage. The optimum pressure drop between the hot and cold aisles (DpCH) varies depending on certain parameters. This system model, developed for the first time, examines the impact of bypass and DpCH on the data centre’s total power consumption (ET).
As can be seen from the present study, the number of papers addressing issues related to the use of BIM and CFD for aisle isolation systems is quite minimal. As evidenced by the limited number of sources, the utilisation of BIM has received little attention, despite the fact that precise object geometry significantly enhances the accuracy of subsequent CFD modelling. It is important to note that BIM allows for filling the data centre element models with the necessary details needed to operate the data centre. It is important to explore this area as it is under-researched.
2.2. Main Principles of Building Air Corridor Insulation Systems for Data Centres
There are two ways to install a containerisation system in an existing machine room. The first is to isolate the cold corridor, and the second is to isolate the hot corridor. Each option has its own characteristics, advantages, and disadvantages. Figure 1 shows the basic principle of cold-aisle and hot-aisle containment systems in a data centre.
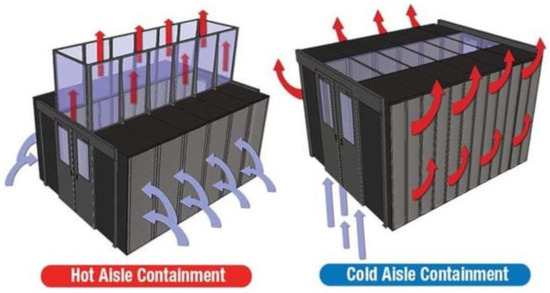
Figure 1.
Cold-aisle and hot-aisle containment systems in a data centre [28].
2.2.1. Cold-Aisle Containment System (CACS)
To supply cold air to the corridor, perforated plates are installed in front of the front door of the enclosure. The hot air is ‘discharged’ into the total volume of the room. To isolate the cold corridor, enclosure air handling units are positioned around the perimeter of the room, blowing the cold air stream under the raised floor. The enclosures are arranged in a row facing each other.
Advantages of CACS are the relatively low costs and the easy scalability: the cabinet air conditioner can be installed in any free space on the perimeter of the hall. The disadvantages are the difficulty of scaling: within several corridors, there may be problems with the uniformity of air supply to different rows; second, in the case of highly loaded equipment, it is difficult to increase the local supply of cold flow as this requires the installation of additional perforated raised floor slabs; third, these are not the most comfortable working conditions for personnel due to the fact that the entire room is in the hot zone. The design features are as follows:
- Additional height allowance is needed to install the raised floor and additional space is needed to install a ramp at the entrance;
- As the container is insulated along the inner perimeter of the corridor, the racks need front insulation and a blanking plate for the rack at the front.
2.2.2. Hot-Aisle Containment System (HACS)
In the case of hot corridor insulation, inter-row air conditioners are used, blowing the cold flow into the total volume of the room. The cabinets are installed in rows. The backs of the cabinets face each other. The air handling units are installed in line with the cabinets to minimise the length of the air flow and increase the capacity of the cooling system. The hot air is discharged into a closed container and is then fed back into the air conditioning system. This approach is more practical for operational buildings, small data centres, and retrofits.
Advantages of HACS are that it is a reliable, high-performance solution that can be used with heavy-duty racks as well as in low-ceilinged spaces as it requires neither a raised floor nor an overhead plenum; second, its easy scalability as each aisle is independent; third, the comfortable staff presence in the room. The disadvantages are the high costs, as this option requires more air conditioners, as each container needs its own back-up air conditioner; second, the inter-row air conditioning takes up space that could be used for server racks; third, the scaling difficulties: adding more air conditioners is only possible if additional connection points are provided in advance.
The design features are as follows:
- The room does not require additional height clearance;
- The enclosure itself is insulated around the perimeter of the corridor;
- The enclosures require front face insulation and a blanking plate as well as the insulation of all enclosure roofs;
- For the end cabinets in the corridor, the cabinet sides and plinth must be insulated along the outer perimeter.
2.3. Comparison between HACS and CACS
Regardless of the type of system, there are still people who need to work in the machine room. According to ISO 7243 [29], or the Occupational Safety and Health Administration (OSHA), the values must not exceed the wet bulb temperature (WBT). The WBT is an index that measures the thermal stress experienced by people working which is defined in Formula (3).
where NWB is the natural wet bulb temperature and GT is the temperature of the globe.
The maximum OSHA suggested WBT is 30 °C for continuous work and 32 °C for 25% work and 75% rest.
Experience shows that most work is carried out in front of the IT racks. According to WBGT, CACS allows staff to work in a work-rest mode (25% work and 75% rest), rather than HACS. This allows equipment to be operated more efficiently within the racks [30].
The ASHRAE standards [2] recommend temperatures in the range of 18–27 °C for Intel servers, but in the CACS, the temperature in most of these rooms can be higher than 27 °C. It is also necessary to count the leakage. In the case of raised floors, this will be in the range of 25–50%, rather than 3–10% for containment systems. In addition, data centre rooms may contain non-rack-mounted equipment that can be affected by hot air.
In a typical data centre operating at 50% capacity, IT energy is the largest contributor to energy costs, followed by cooling system energy costs. Compared to CACS in a healthy 20 °C working environment, HACS consumes 40% less cooling system energy. It is clear that hot aisle containment delivers significantly more economiser hours and a lower power usage effectiveness (PUE) than cold aisle containment under real-world work environment temperature constraints and temperature climates [30].
3. Implementation BIM and CFD Analysis for Corridor Isolation Systems
There are many solutions from different manufacturers of corridor isolation systems, in particular, manufacturers are preparing families for building information models. The geometry is of great importance for the possibility of modelling airflow propagation in the future and the subsequent use of the model in the operation phase. Based on this information, we developed a family of corridors that can be conveniently used for various data centres: modular and large data centres with several dozens of machine rooms.
To verify the effectiveness of the corridor isolation system, a CFD model was developed for both cases of isolation: hot and cold corridors. CFD represents a logical and necessary extension of BIM design. BIM incorporates details of the structure including its architectural and engineering systems. This model is subsequently imported into the CFD software, which analyses the room geometry, establishes appropriate boundary and initial conditions, and computes three-dimensional temperature, velocity, pressure and additional physical parameters.
3.1. Main Parameters of the Investigated Model and Constraints
The numerical model includes a three-dimensional model of the investigated room with the required detail; the boundary conditions that consider the thermal conductivity of enclosures; detailed models of air distributors and heat sources with specified flow and thermal characteristics. As a result of numerical modelling, air temperature values were determined at each point of the room. Visualisation of the results of numerical simulation with the help of gradient distributions on different planes and isosurfaces, provided a complete picture of microclimate formation in the room and allowed us to clearly demonstrate the quality of the selected air distribution scheme as well qualitatively and quantitatively compare different variants of the design solutions.
Cooling of the racks in the server room was performed by the following method: air is blown by inter-row air conditioners into the cold or hot corridor space, moves directly into the IT racks under the pressure of IT equipment fans, and is removed from the isolated hot or cold corridor.
We took the following as the model input data:
- The room contained 15 telecommunication cabinets with IT equipment with dimensions of 600 × 1200 × 42 Unit. The heat load in each cabinet was 10 kW.
- Also, in the room, there was one uninterruptible power supply (UPS), with dimensions of 600 × 1200 × 42 Unit and a heat load of 8.5 kW.
- Cooling was provided by eight inter-row air conditioners with the following parameters:
- Dimensions: 300 × 1200 × 2000 mm.
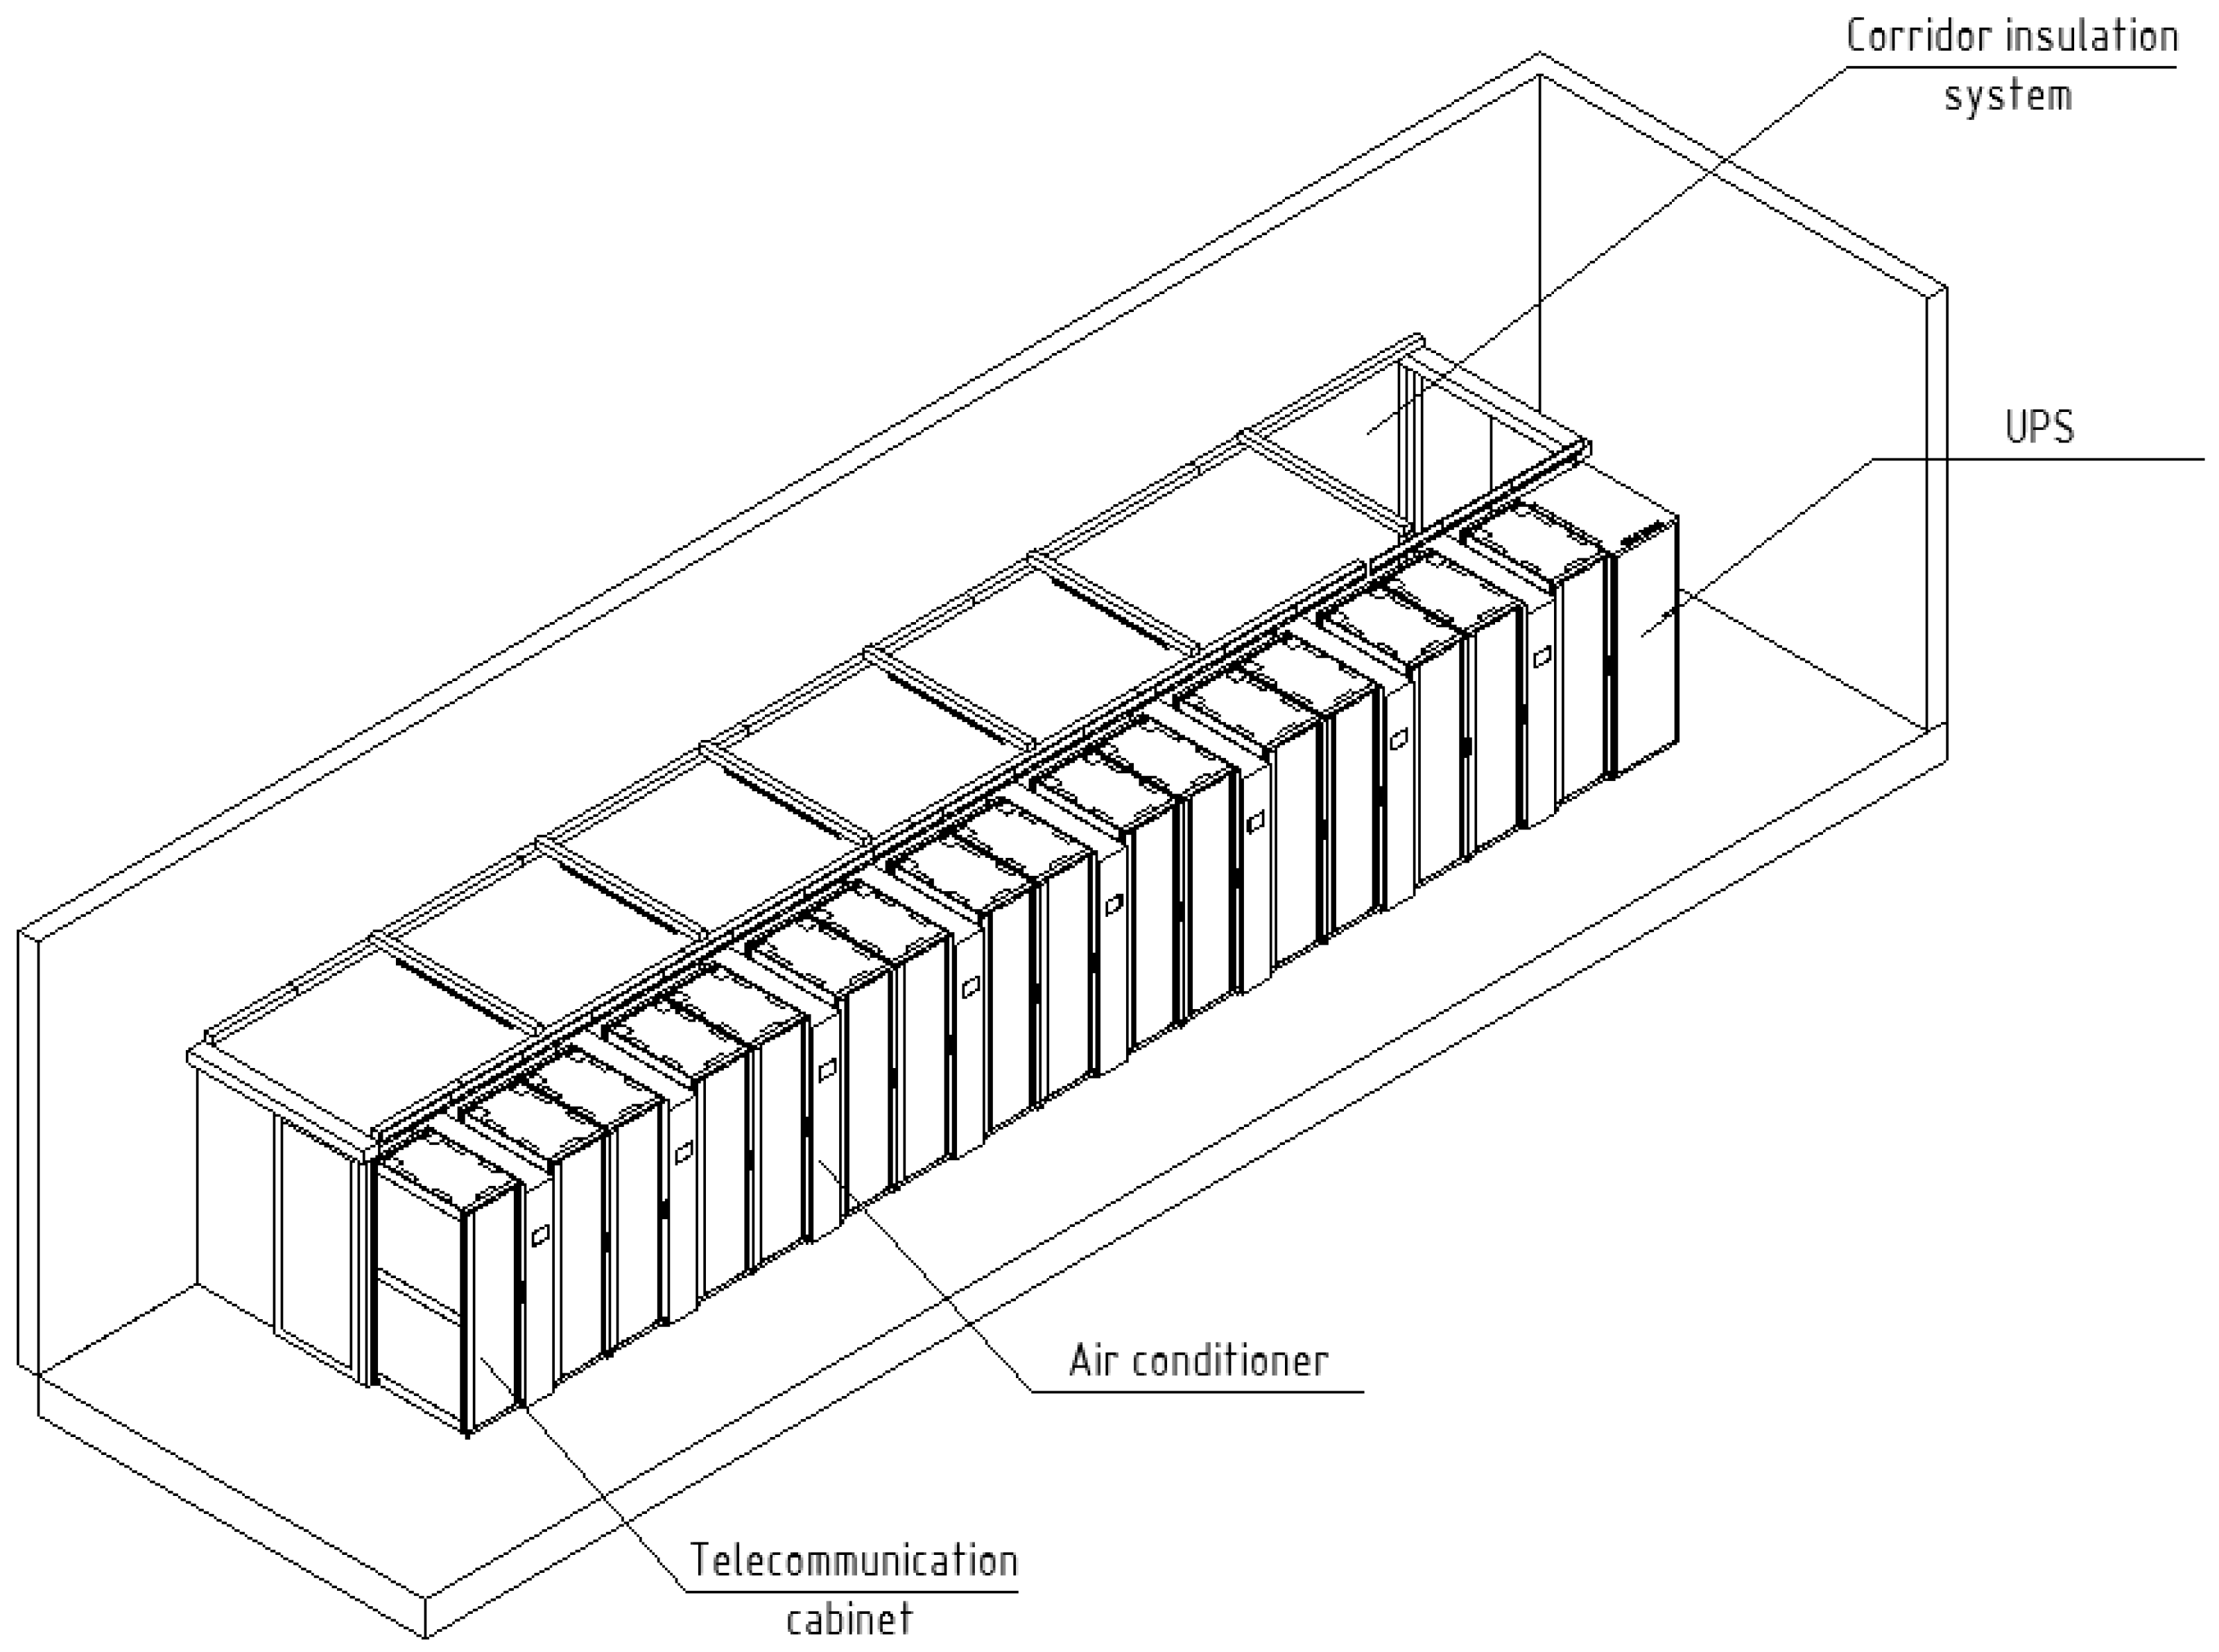
The geometric diagram in Figure 2 depicts the placement of the equipment.

Figure 2.
BIM.
In this paper, the layout of the facilities and engineering infrastructure were modelled at a conceptual level, so the following constraints and assumptions were present in the models:
- The model did not consider the general ventilation costs (as they were less than 1% of the total room flow);
- Heat inputs from the lighting system, maintenance personnel, and other small compared to the inputs from IT equipment are not taken into account;
- Heat loads from the equipment were evenly distributed throughout the internal volume of the telecom cabinets;
- IT equipment fans in one rack were combined in one volume with a constant air flow rate;
- Air flow rate through the telecommunication cabinets was calculated according to the basic parameters (inlet and outlet temperatures, heat dissipation of one IT rack).
For accurate calculations, it is necessary to set the material properties of the model elements. All architectural solid elements (walls, slabs, columns) will have the physical parameters of concrete material. The casing and plinth of the racks as well as the casing of precision air conditioners will have the properties of steel material. All of the other geometrical elements were assumed to be air, with the following parameters mentioned in Table 2 and Table 3.
Table 2.
Boundary conditions.
Table 3.
Main elements of the model parameters.
Accordingly, the main elements of the model have the following parameters:
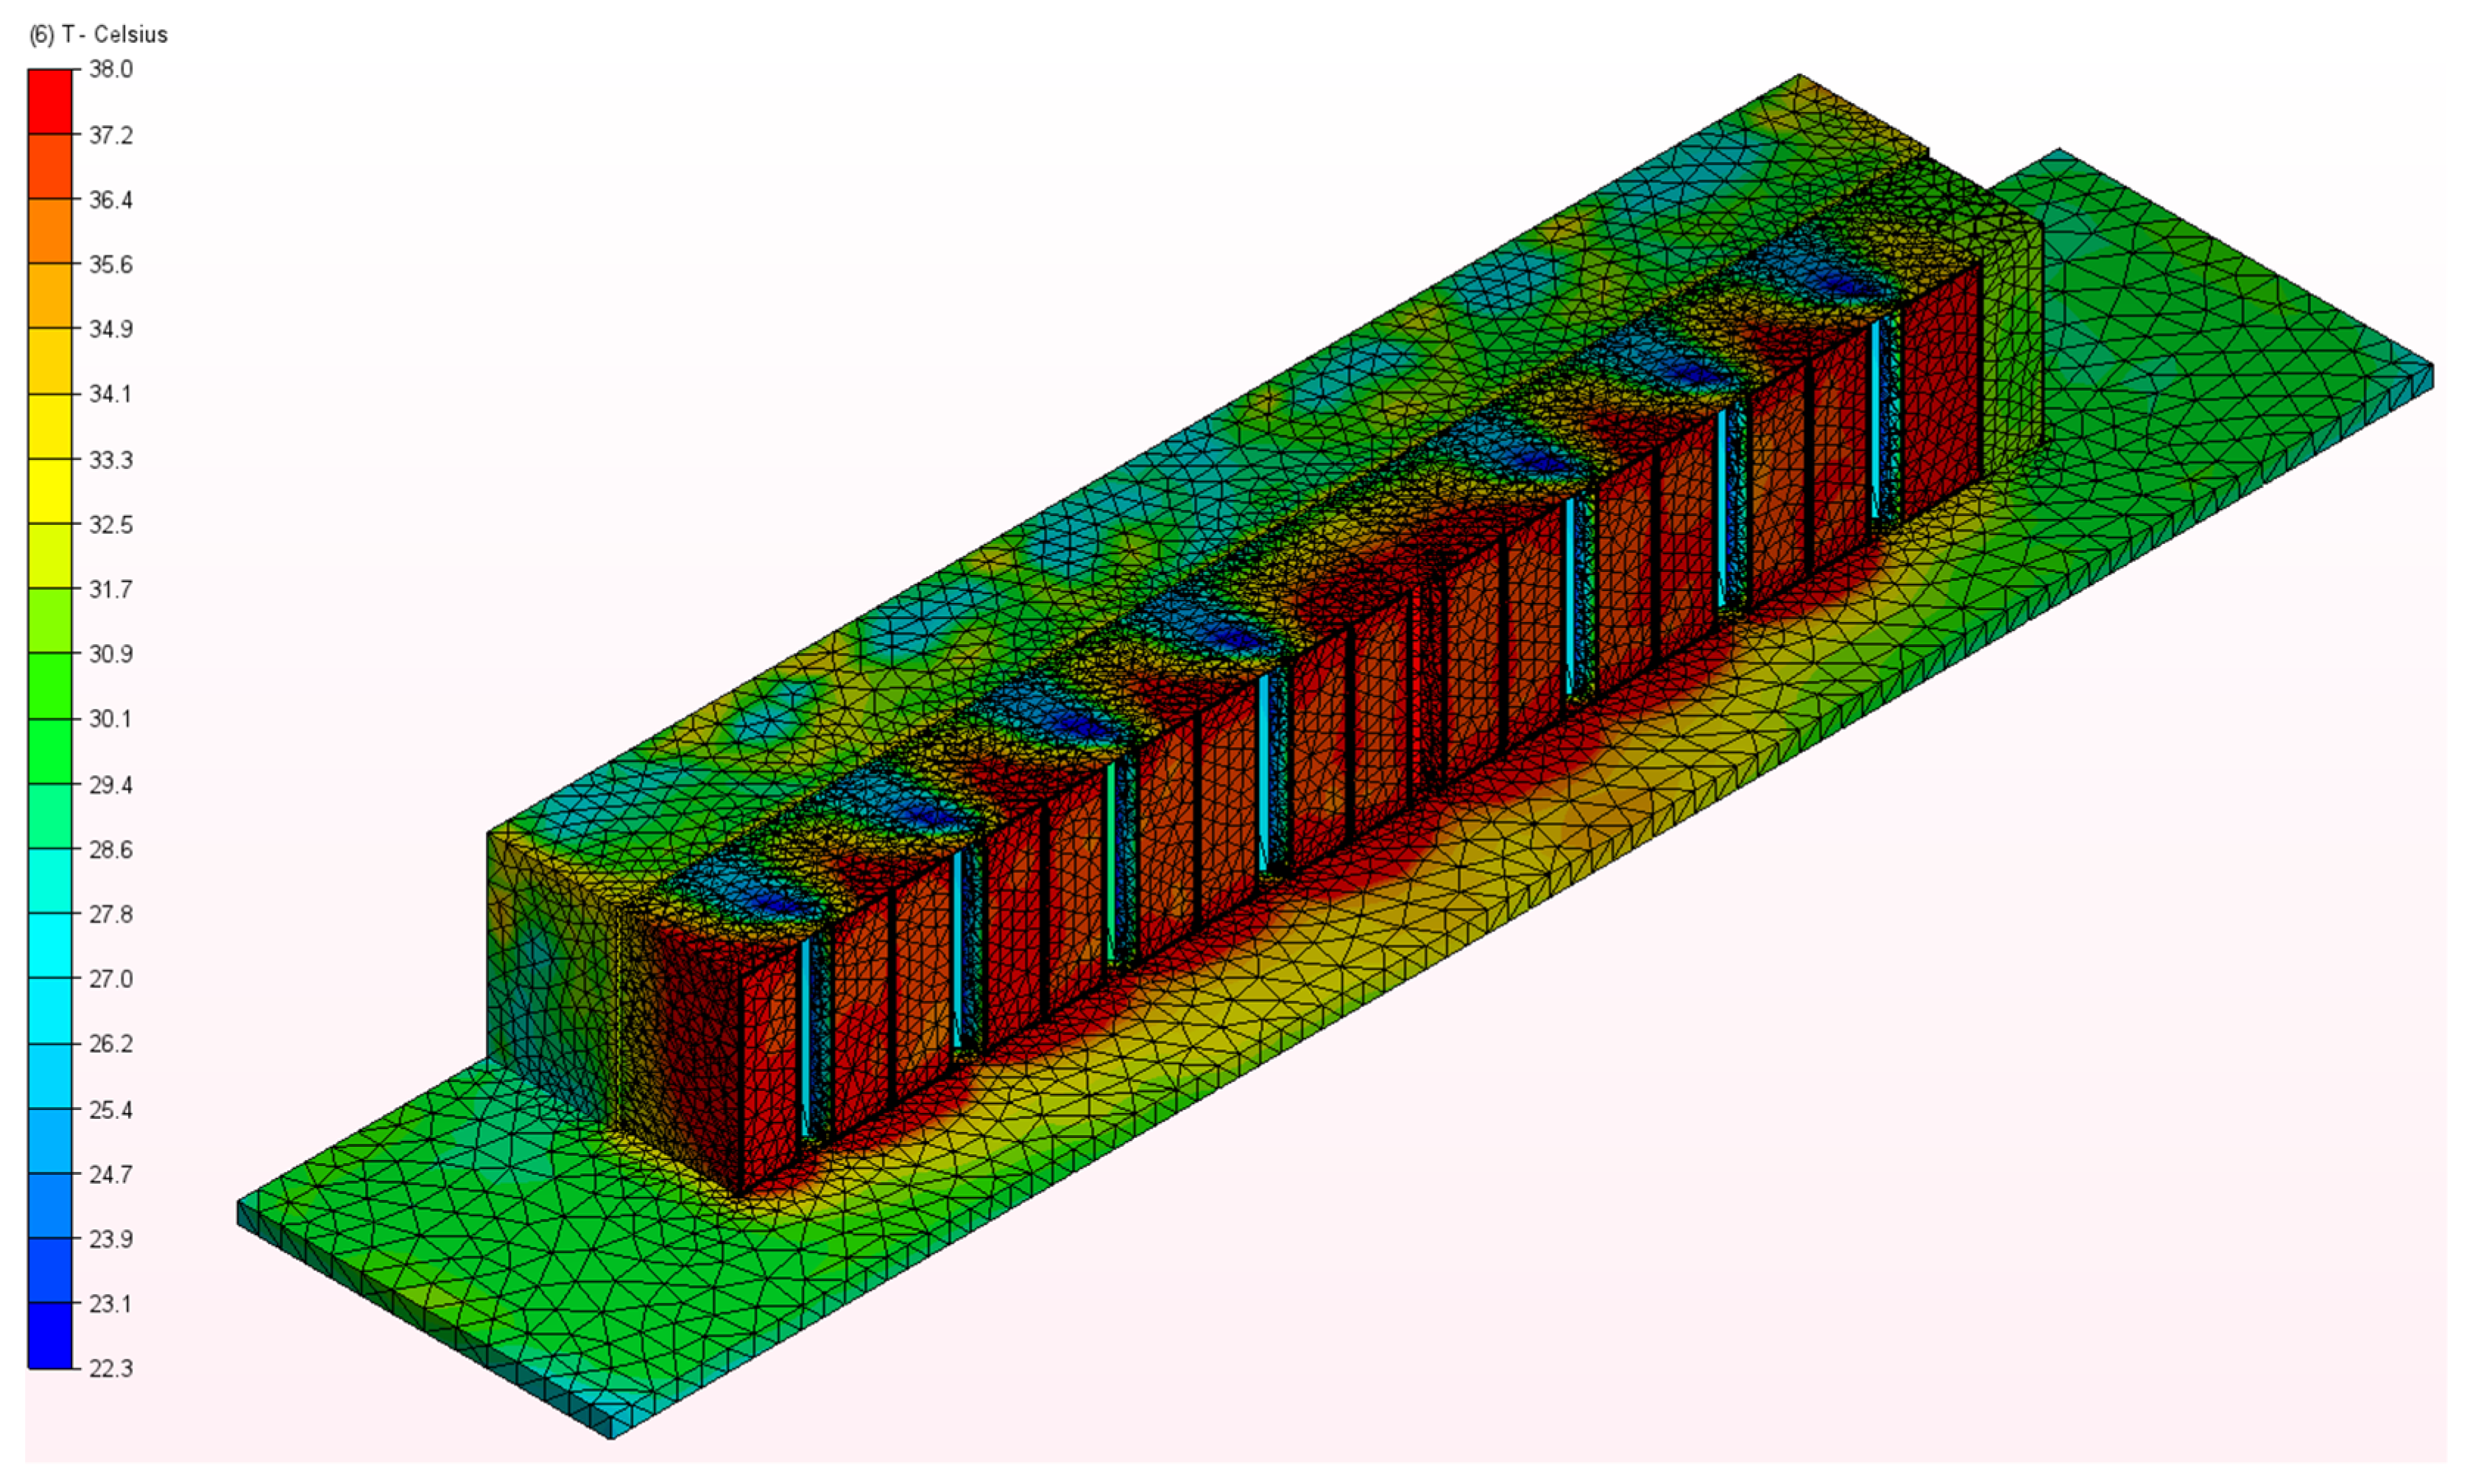
The minimum size of the tetrahedral element of the volume mesh was taken as 1 mm for the main elements of the model, which can provide the required accuracy in this research. Our study confirmed the findings of relevant sources on the choice of methods and settings for isolating corridors within a data centre, and we chose an automatic grid definition using Autodesk CFD. Figure 3 demonstrates the meshing for the main elements of the model.
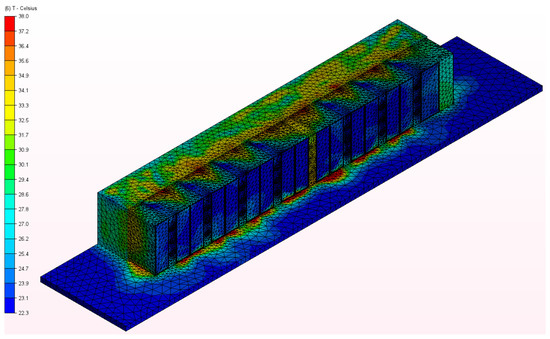
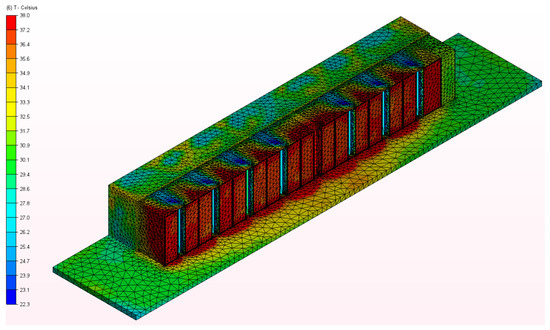
Figure 3.
Meshing for the main elements of the model. Hot corridor is insulated on top, cold corridor on the bottom.
3.2. Modelling Results
As a demonstration of the distinction between hot aisle insulation and cold aisle insulation, we illustrated the temperature analysis across various vertical and horizontal cross sections of a server room hall. Modelling was performed using AutoDesk CFD 2019 software (AutoDesk, San Francisco, CA, USA).
To compare the temperature flows, vertical sections of the server room in the area of the second and ninth telecommunication cabinet were made, which are shown in Figure 4 and Figure 5. The vertical section demonstrates that if the hot corridor is isolated, the area in the non-isolated zone will be in the region of 22.3–23.9 °C. This temperature range is comfortable for the constant maintenance of equipment in the racks. In the case of cold corridor isolation, however, the temperature outside the isolated area could be as high as 38 °C in some locations, which according to OSHA would cause engineers to pause their work.
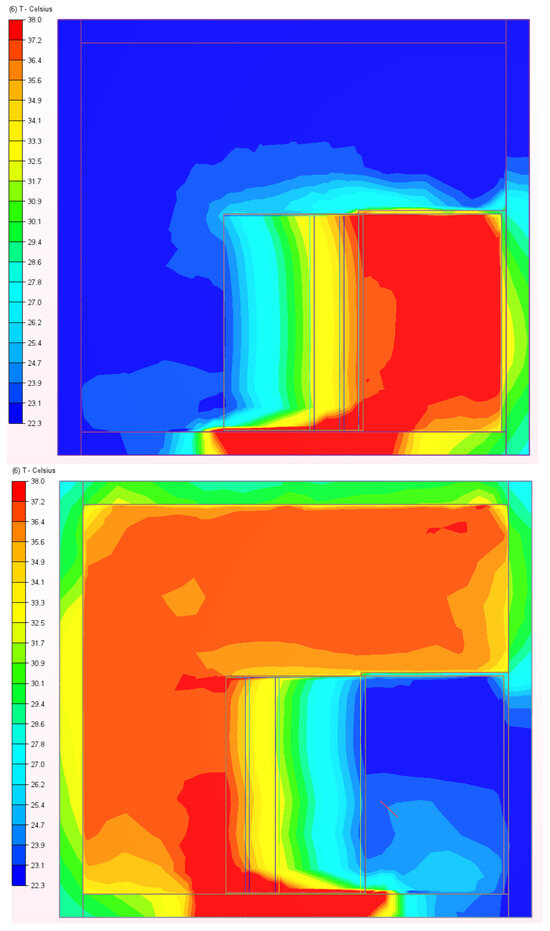
Figure 4.
Temperature field of the cross section on the second rack. Hot corridor is insulated on top, cold corridor on the bottom.

Figure 5.
Temperature field of the cross section on the ninth rack. Hot corridor is insulated on top, cold corridor on the bottom.
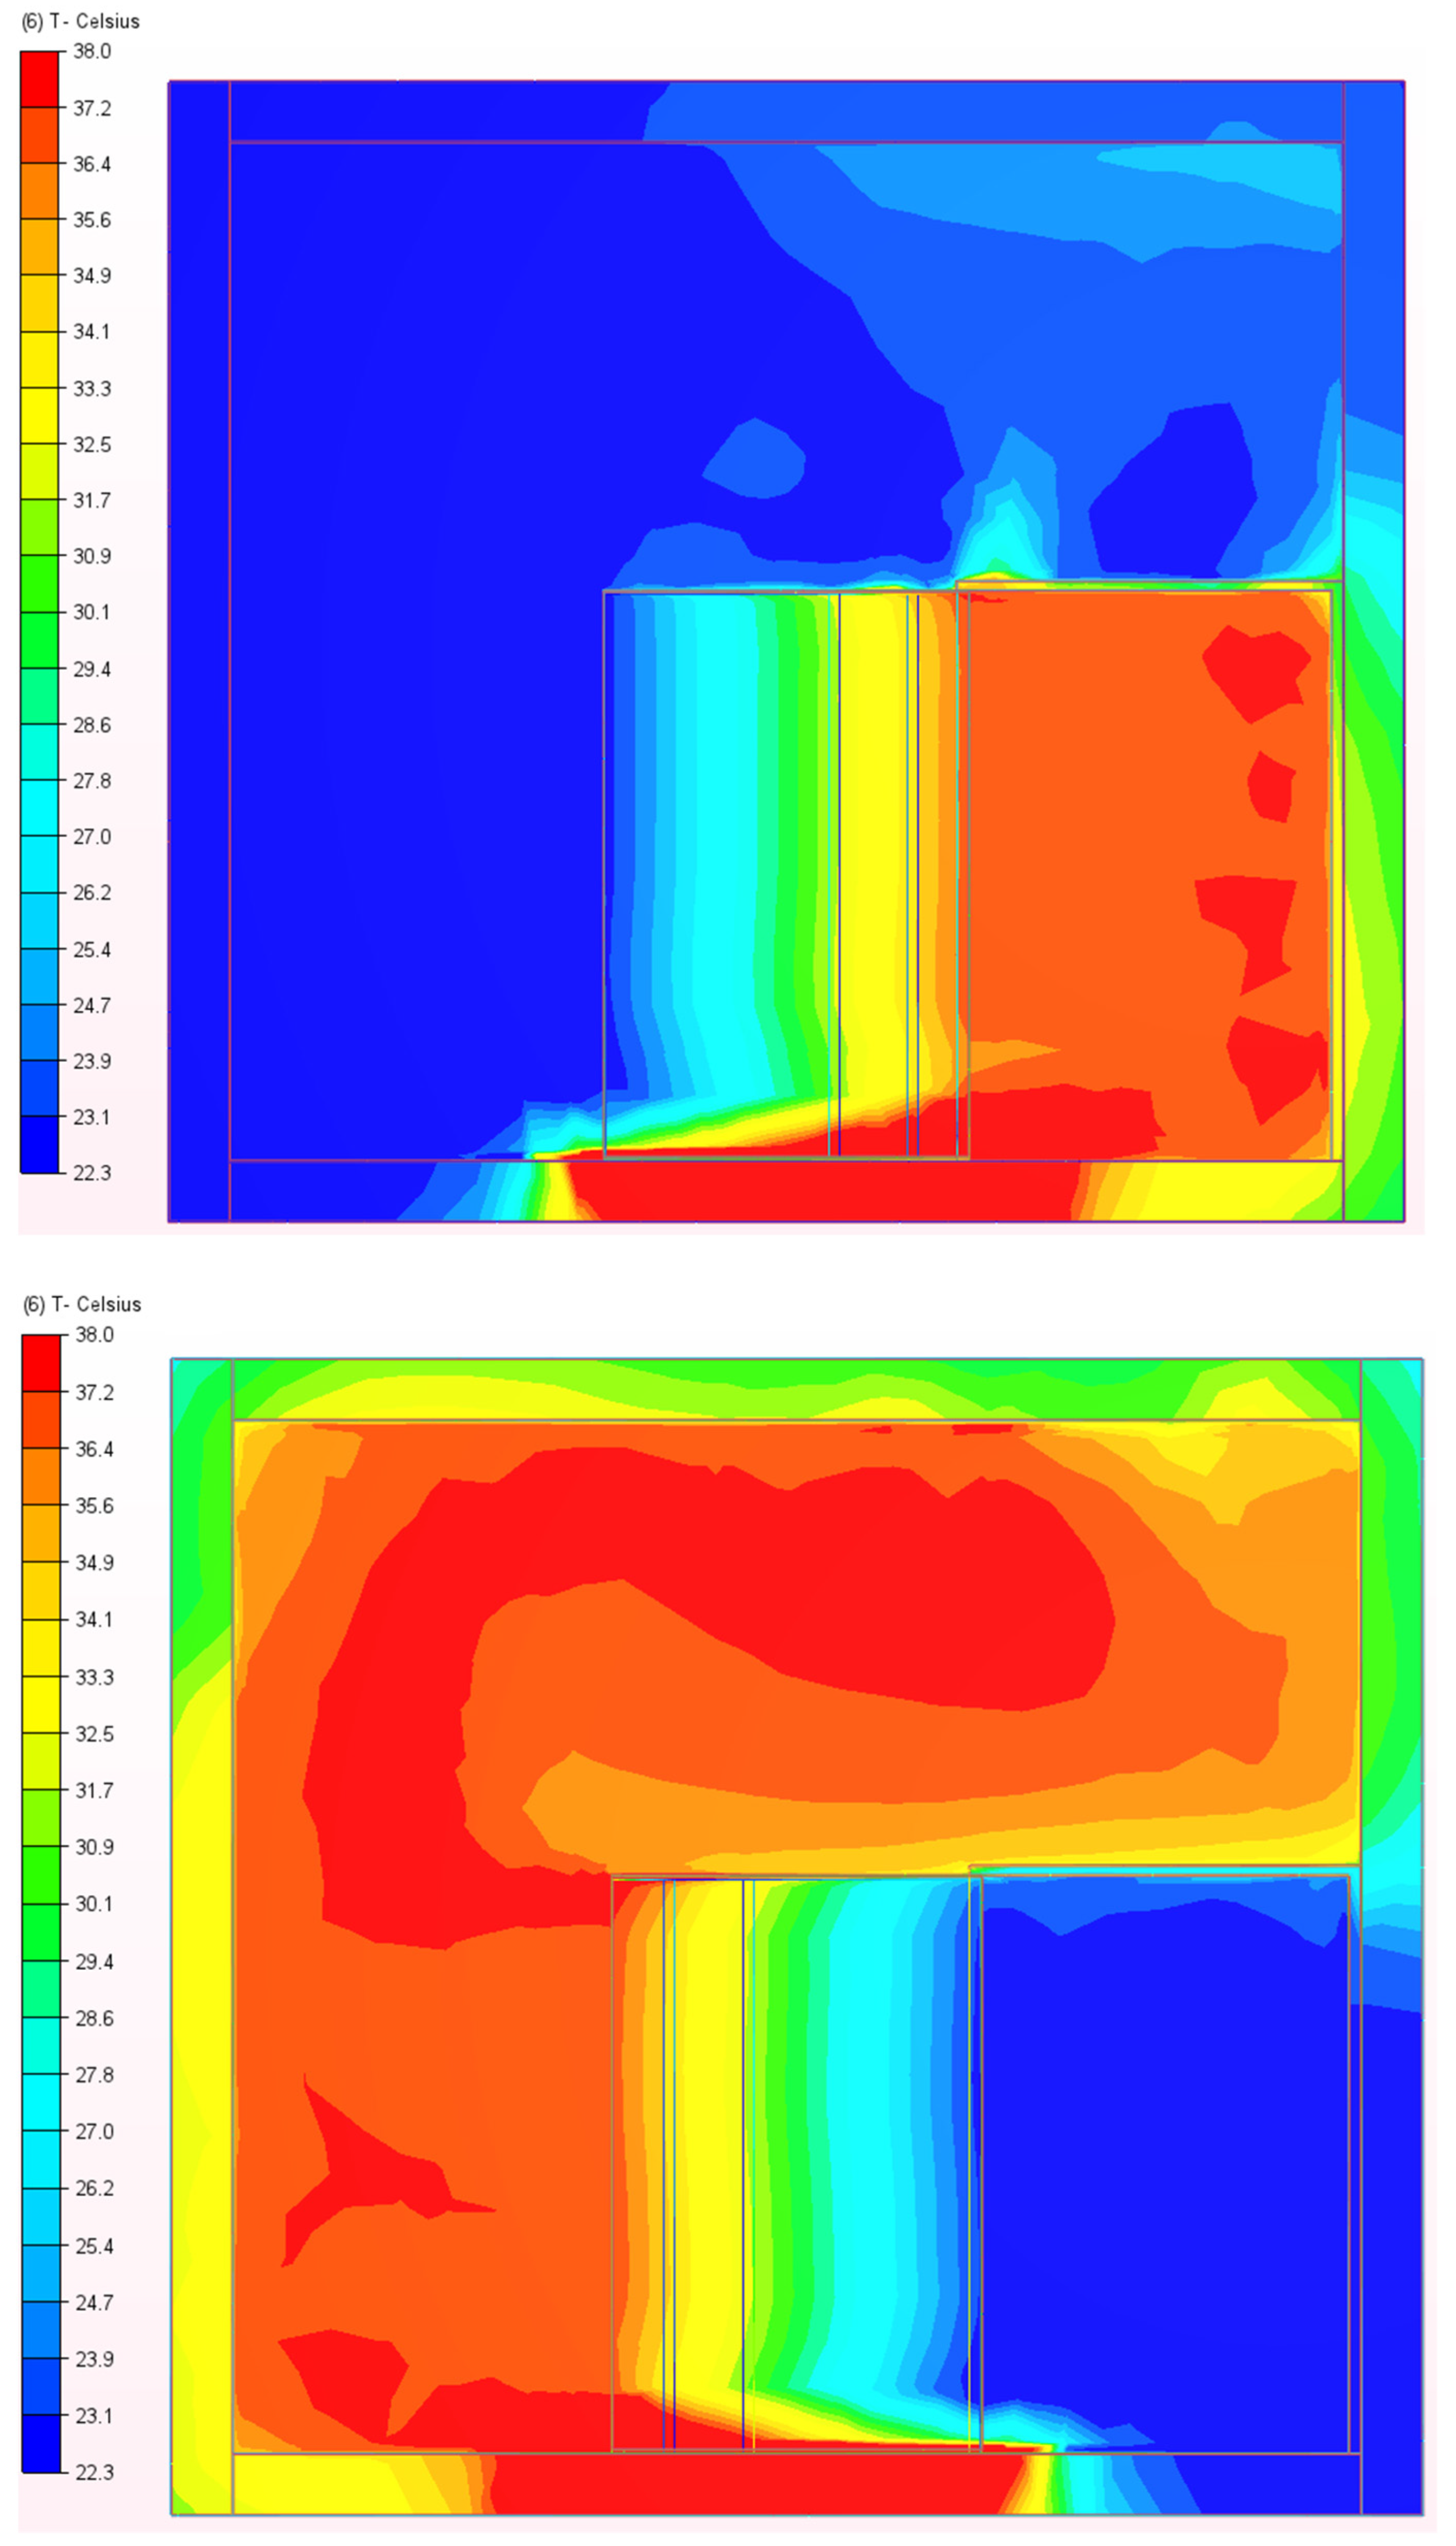
In addition to the vertical sections, horizontal sections of the server room around the 21 Unit and 42 Unit telecom cabinets were made and are shown in Figure 6 and Figure 7. Horizontal cross sections of the server room demonstrated that with hot corridor insulation, the temperature outside the insulated area was uniformly distributed in the range of 22.3–26.2 °C. Alternatively, with cold corridor insulation, the highest temperatures outside the isolated area were concentrated in the rack area and reached up to 38 °C.

Figure 6.
Temperature field of the cross section at the 21 Unit line. Hot corridor is insulated on top, cold corridor on the bottom.
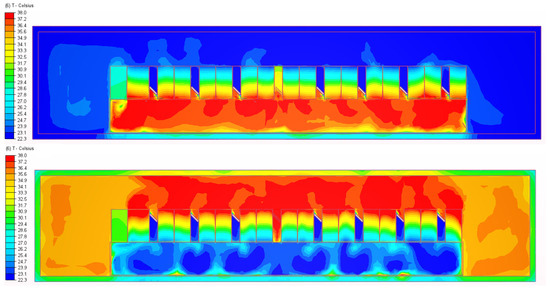
Figure 7.
Temperature field of the cross section at the 42 Unit line. Hot corridor is insulated on top, cold corridor on the bottom.
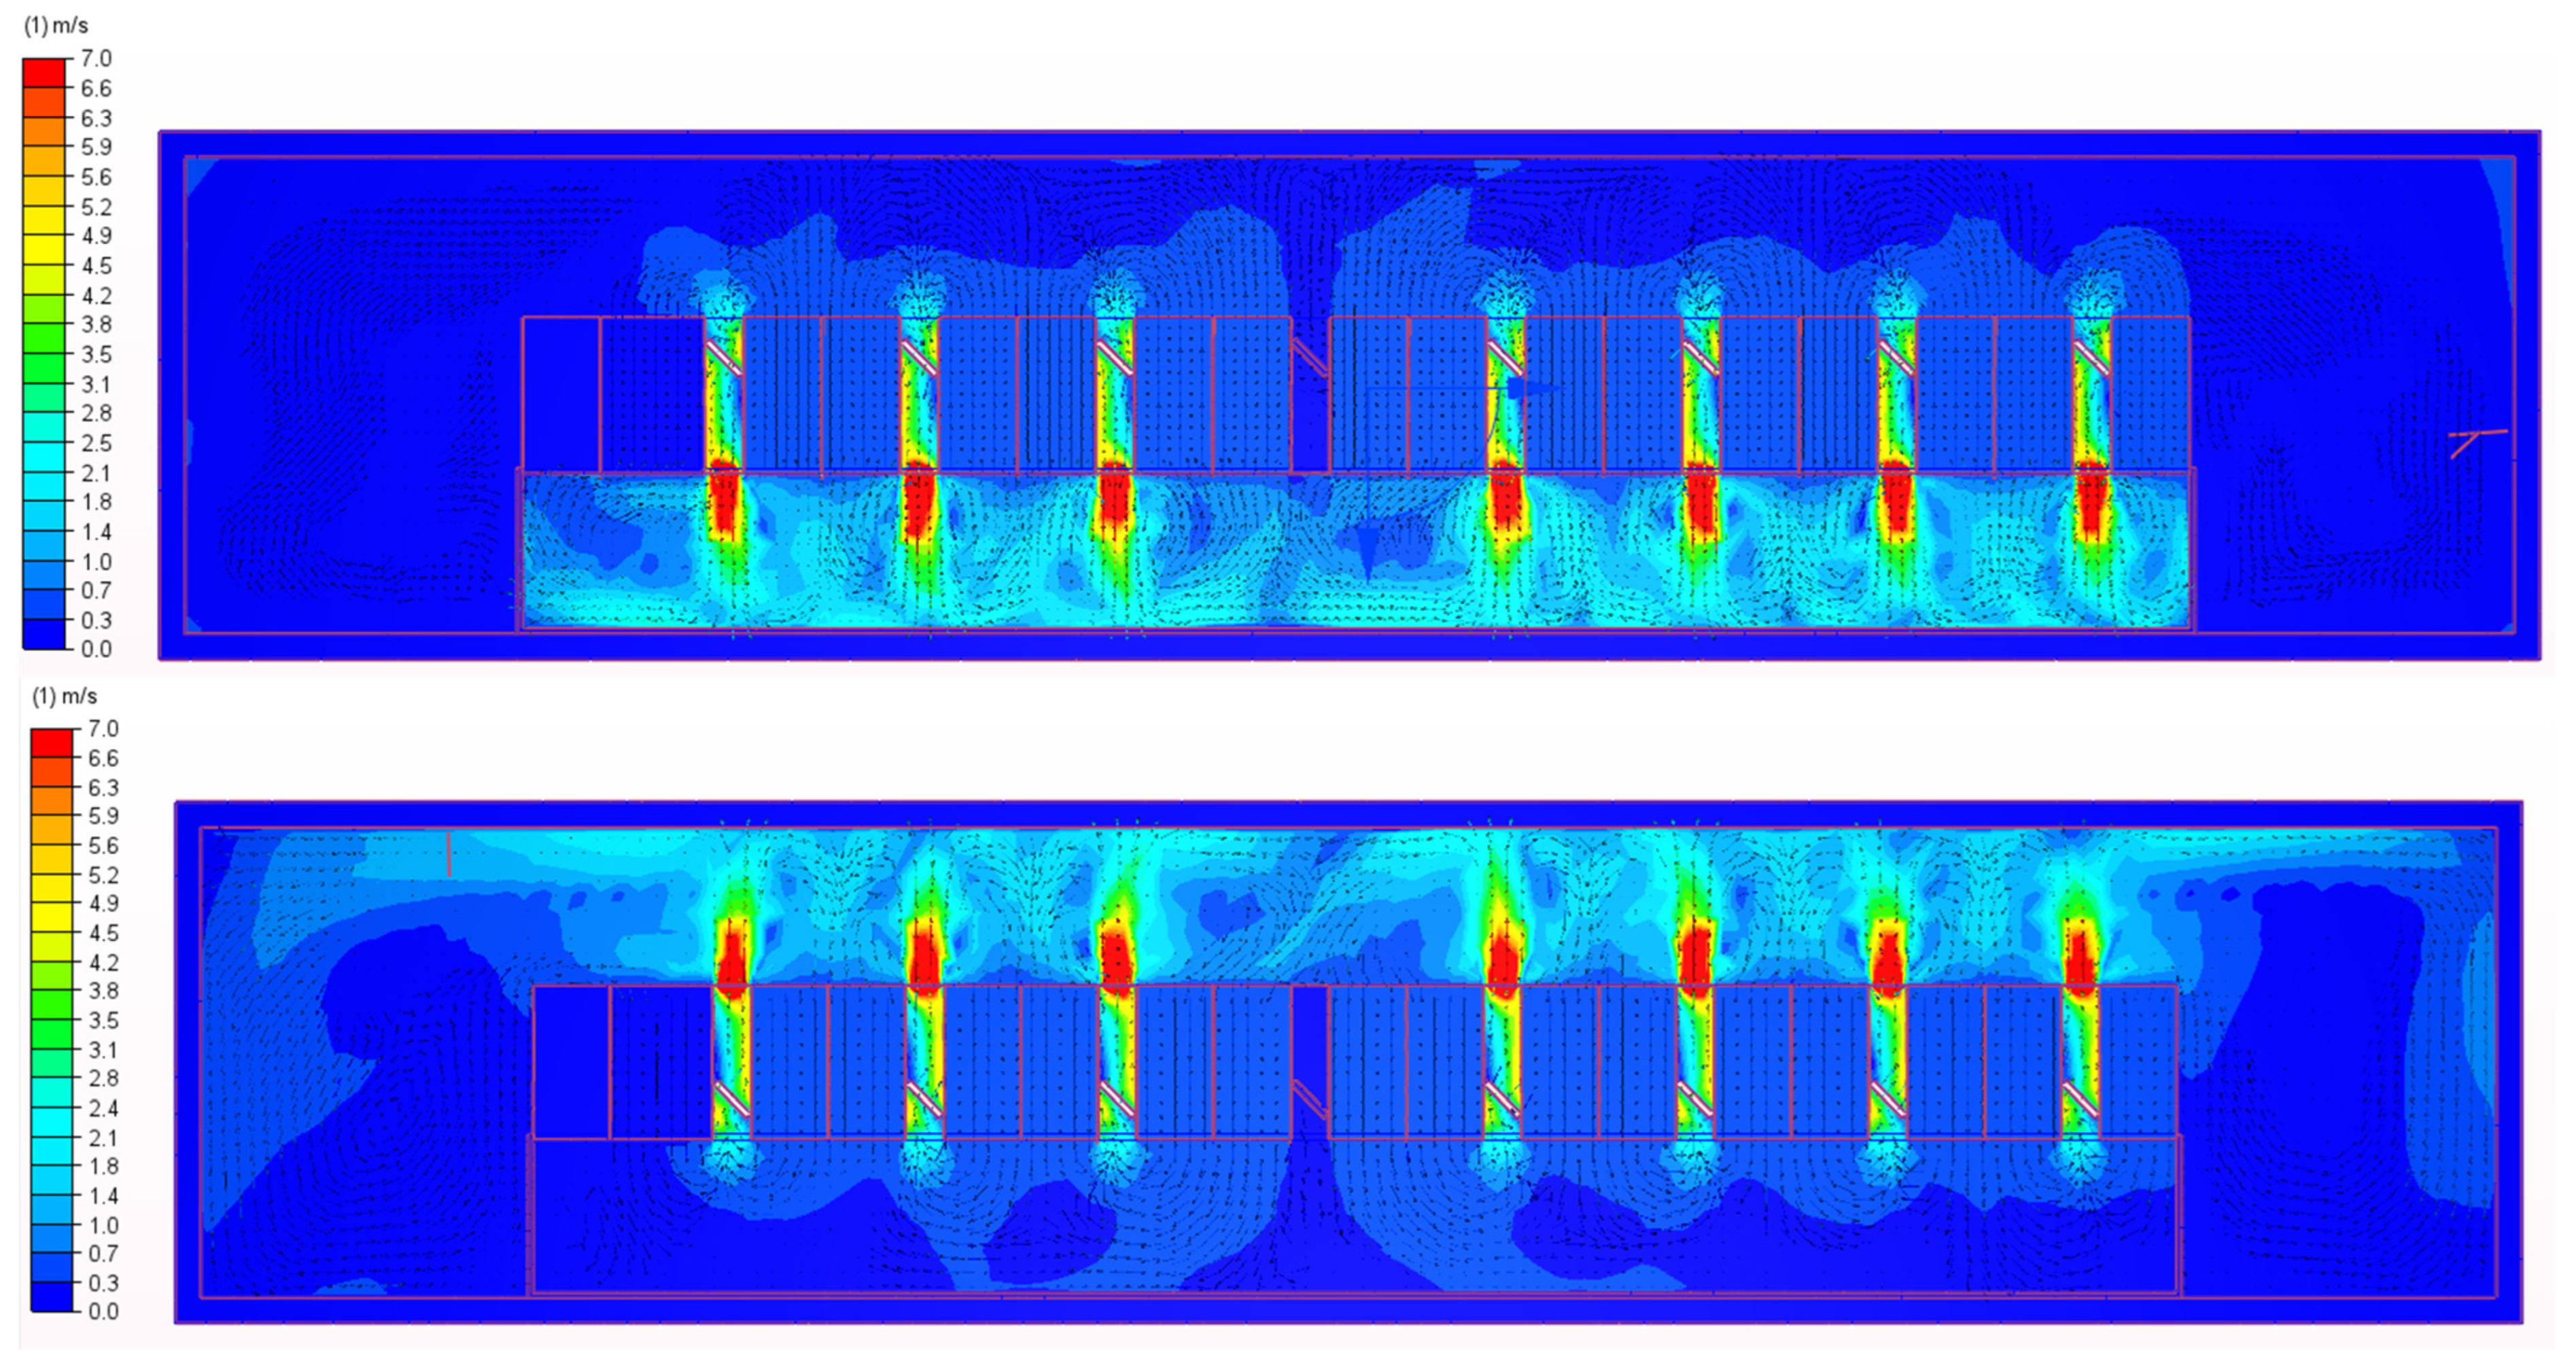
The simulated outcome of the parametric experiments in CAC and HAC is presented in Figure 8, demonstrating the airflow velocity distribution passing through the rack while displaying the temperature and motion dynamics.
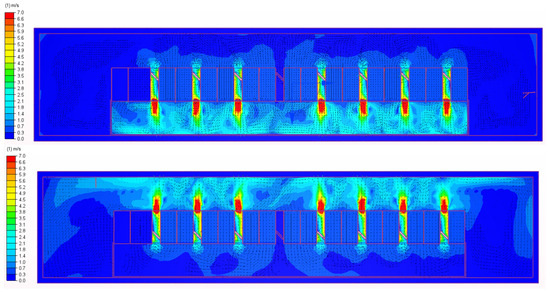
Figure 8.
Parametric tests of the cross section at the 21 Unit line. Hot corridor is insulated on top, cold corridor on the bottom.
The current system parameters show the permissible numerical temperature values from the point of view of being able to provide the required temperature conditions for the operation of computing and engineering equipment.
Based on the above diagrams of temperature fields, we can conclude that when the hot corridor was isolated, the temperature inside the isolated area reached 38 °C in some areas. At the same time, the temperature in the non-insulated area corresponded to a range of 22.3–27.8 °C. In contrast, cold corridor insulation provided temperatures inside the insulated area of 22.3–23.9 °C and outside the corridor in the range of 33 to 38 °C. Based on the OSHA recommendations, the WBT is 30 °C for constant work and 32 °C for 25% work and 75% rest. Our study confirms that hot aisle insulation provides a more comfortable working environment for personnel. The front of the equipment cabinets faces the cold aisle, and the temperature range is within acceptable limits, allowing for more hours of work.
Also, the visual data presented in this section verifies that the temperature range within the racks at the air inlet does not exceed 27 °C. This is significant as the temperature influences energy efficiency, as per [1]. As the air inlet temperature rises, the energy consumption increases, subsequently negatively impacting the energy efficiency.
4. Discussion
For a data centre air conditioning system to be effective and efficient, the path, temperature, and volume of cooling air delivered to IT equipment must be properly controlled to ensure that it does not mix with hot exhaust air from the racks. In addition, data centres need to be made more resilient by minimising energy losses due to excess airflow generated by CRAC units. For this reason, advanced airflow management techniques and cooling strategies are often used to optimise data centres, mainly related to air containment within the data centre.
Some of the most common methods used in data centres today include blanking panels, CAC, and HAC. In general, the primary benefit of aisle containment is the decrease in air temperature at the server inlet as a result of minimal mixing with hot air. As per the ASHRAE guidelines, the temperature of the air entering the server room should fall between 18 and 27 °C [2]. A possible conclusion from the analysis of the thermal management studies is that if the server room inlet does not have peak air temperature values, the supply air temperature provided by the CRACs can be increased while still meeting the server room inlet air temperature recommendations.
To design an insulation corridor effectively, it is vital to take into account the materials and geometry of the equipment. This is due to the fact that all architectural solid elements as well as the insulation elements within the corridor and enclosure possess physical parameters such as thermal conductivity, density, and specific heat capacity. The modelling of insulated spaces remains particularly challenging due to the small and complex geometric elements around and through which air leakage can occur. To this end, our study applied the concept of BIM to objects: telecommunications cabinets, air conditioning units, UPS, and the corridor isolation system.
CFD analysis was carried out to determine which of the two methods of aisle isolation was the more efficient in terms of temperature and operating conditions. This analysis offers valuable insights into the effectiveness of hot-aisle containment systems and identifies the areas of leakage that have the most significant impact on system performance. Enlarging the leakage area increases the rate of air loss, which subsequently decreases the cooling capacity of the supply air. Furthermore, the type and position of the leakage paths can influence the airflow patterns and cooling efficiency of hot-aisle containment systems. Increasing the supply airflow as a mitigation strategy does not reduce the frequency of air leakage. Rack cooling loads have little effect on the rates of air leakage in hot-aisle protection systems.
When insulating a cold aisle, the cabinets are arranged in a row facing each other, and the service area is confined within the cold aisle. Hot air is expelled into the uninsulated area. On the other hand, hot-aisle isolation requires installing cabinets in rows that face each other. Air conditioners are installed in the same row as the cabinets to minimise the airflow distance and increase the cooling capacity. The hot air is discharged into a closed container and then circulates back into the air conditioner. Both methods are viable, but for operational and data centre expansion purposes, isolating the hot aisles is the most effective option.
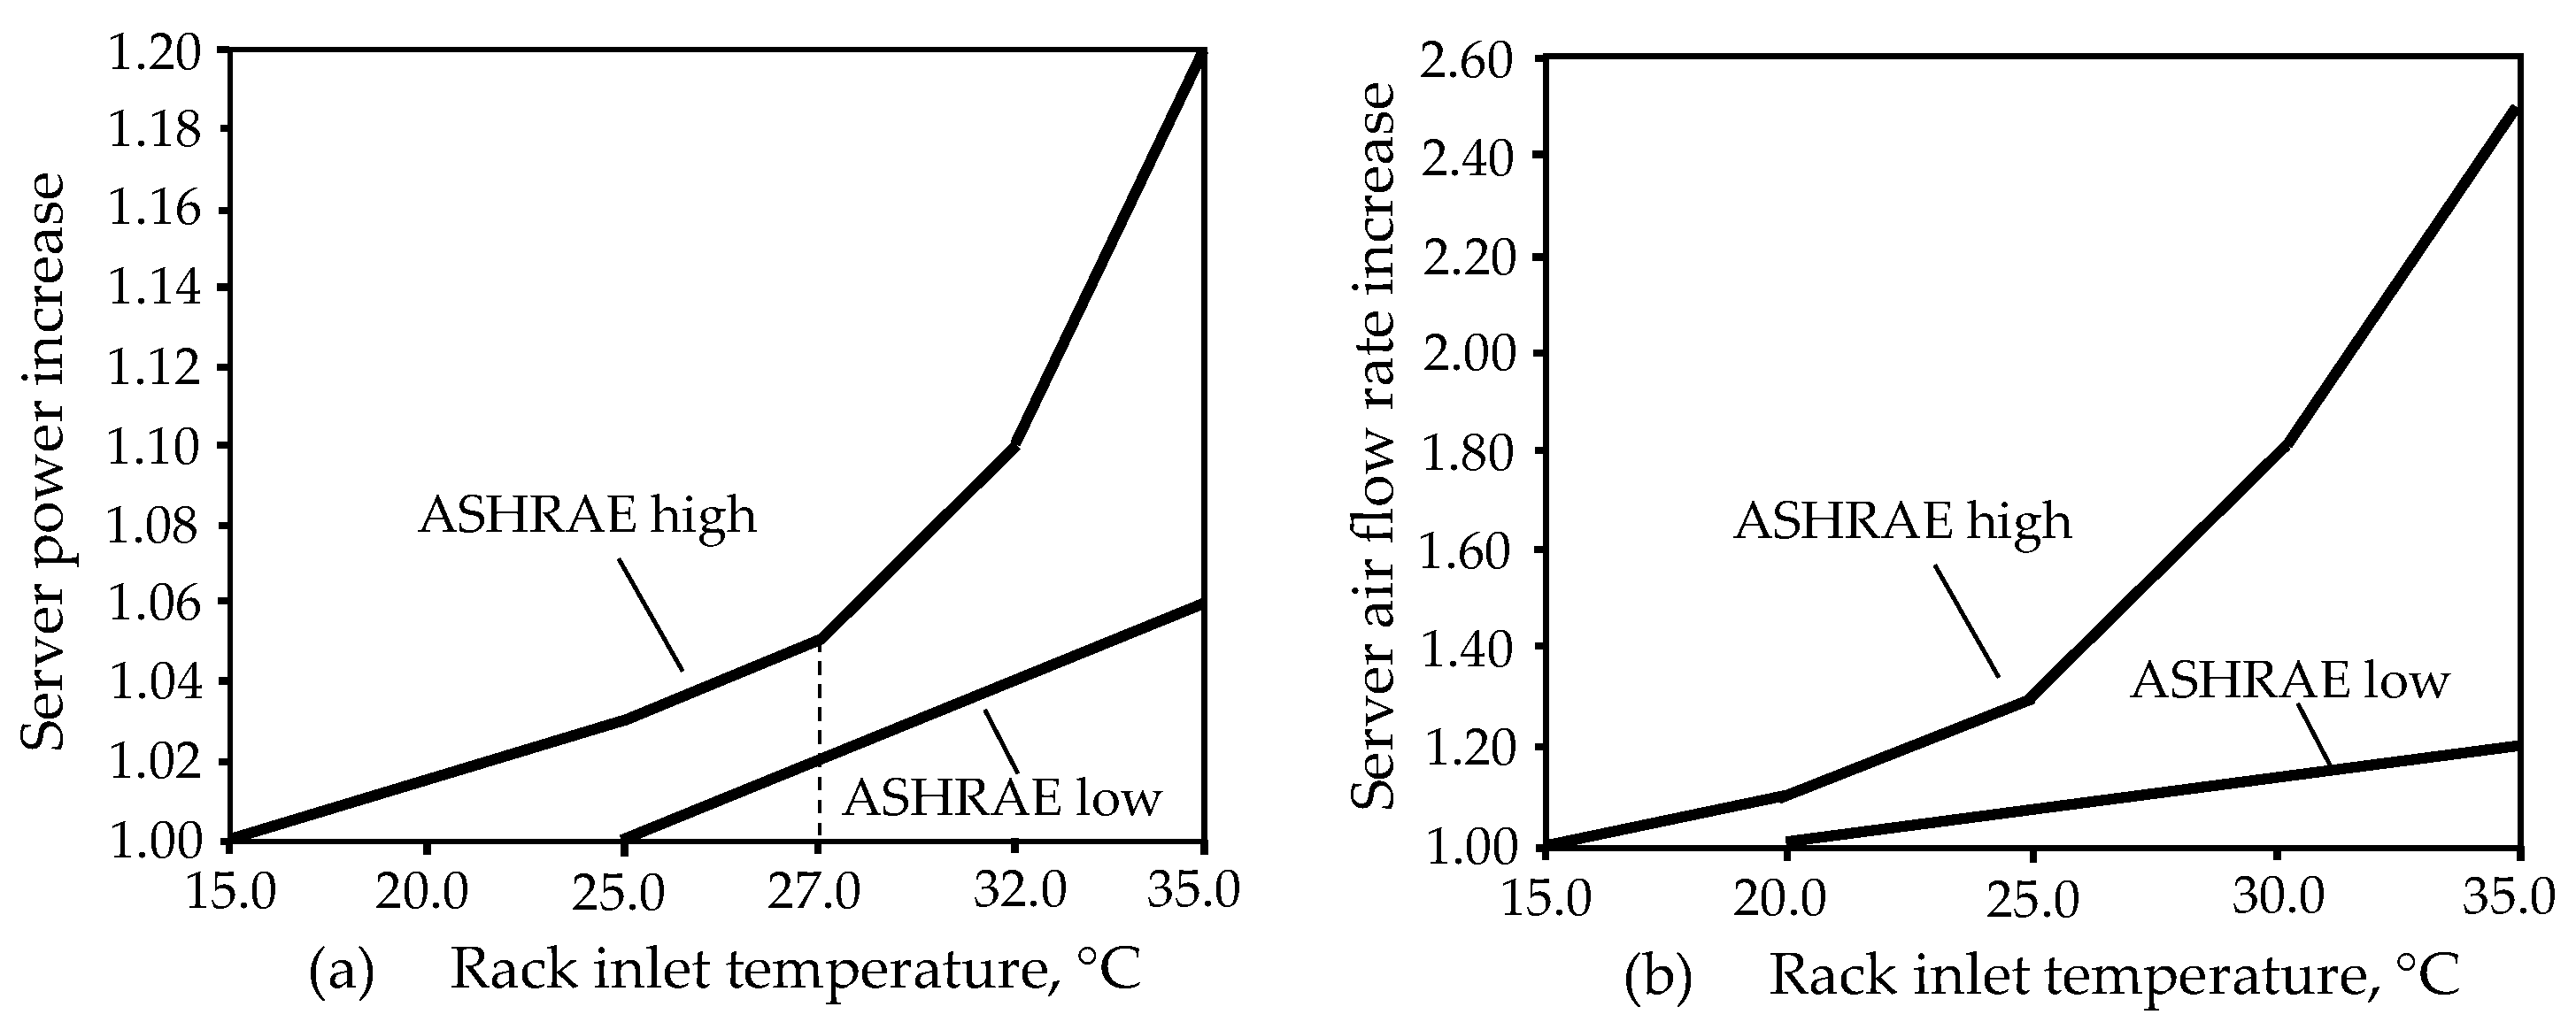
To illustrate the difference between hot-aisle insulation and cold-aisle insulation, the we provided a temperature analysis of different vertical and horizontal cross sections of a server room in Section 3.2. These visual data confirm that the temperature range inside the racks at the air inlet does not exceed 27 °C. This is important because, according to [1], energy efficiency depends on the temperature. As the air inlet temperature increases, the energy consumption increases, which negatively affects the energy efficiency. The increase in energy consumption is directly related to the increase in the power of the fans used to cool the equipment. The data centre’s cooling power requirement can be computed as a function of the rack inlet temperature, which is presented in Figure 9.
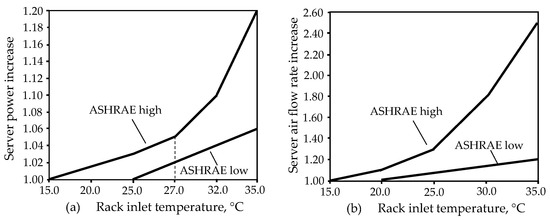
Figure 9.
(a) ASHRAE volume server power increase vs. inlet temperature. (b) ASHRAE volume server air flow rate increase vs. inlet temperature [31].
Moreover, as the growth occurs abruptly, when the temperature range overcomes the range of 27–35 °C, the electricity consumption can increase up to 20%.
Our research shows that CFD analysis and BIM can be a useful tool to guide the design and operation of hot-aisle containment systems.
5. Conclusions
Our research conducted a literature analysis on corridor isolation solutions and the utilisation of both CFD analysis and BIM to implement this concept. The conclusions drawn support the necessity of investigating BIM and CFD in tandem.
Furthermore, the process of modelling included CAC and HAC analysis with a 3D model. In Section 3.1, we outlined the key parameters of the model.
The objective of our article was to undertake a comprehensive literature review of corridor isolation systems. In this article, we analysed the use of corridor isolation and identified an optimal method.
To determine this method, BIM of the server room was carried out in addition to the analysis, taking into account the required elements, materials, and geometry. Hydrodynamic modelling was also used to identify the distribution of the temperature flows. CFD provides a reliable model that simulates real data centre scenarios.
Cold corridor insulation is appropriate for data centres with low loads (up to 5 kW per telecommunications cabinet), but it has a significant drawback in reducing the comfort of personnel. The hot zone encompasses the entire machine room, which is not very convenient for employees. A hot corridor is deemed to be more efficient and productive than a cold corridor, which is why it is commonly used in machine rooms with high loads (up to 10 kW per telecommunications cabinet).
As a demonstration of the differences between hot- and cold-aisle insulation, the authors of the research analysed the temperature in various vertical and horizontal segments of the server room hall.
The vertical cross section demonstrated that if the hot aisle is insulated, the temperature in the uninsulated area will be between 22.3 and 26.2 °C. This temperature range is comfortable for continuous equipment maintenance in the racks. However, if the cold aisle is insulated, temperatures outside the insulated zone could reach 38 °C in some locations, which OSHA believes will necessitate periodic work suspensions in these temperature zones.
Horizontal cross sections of the server room showed that when the hot corridor is insulated, the temperature outside the insulated area is evenly distributed between 22.3 and 26.2 °C.
The two most common corridor isolation methods were analysed in the study and the advantages of hot corridor isolation were proven. Our study assumed the use of inter-row conditioners in order to speed up the CFD modelling process. Both CAC and HAC scenarios were considered, with different target values depending on the type of corridor insulation.
For design tasks with higher accuracy requirements, grid optimisation using tools such as grid independence testing is required. To verify our model, models of larger server rooms for CFD analysis will be prepared and investigated in future work.
Author Contributions
Conceptualisation, S.P.; Methodology, S.P. and I.K.; Software, S.P.; Validation, S.P. and I.K.; Formal analysis, S.P.; Investigation, S.P.; Resources, S.P.; Data curation, S.P.; Writing—original draft preparation, S.P. and I.K.; Writing—review and editing, S.P. and I.K.; Visualisation, S.P.; Supervision, I.K.; Project administration, I.K.; Funding acquisition, I.K. All authors have read and agreed to the published version of the manuscript.
Funding
This research received no external funding.
Data Availability Statement
The data used in the study are original test data from a case study that was part of a private project. As researchers were involved in a specific part of the project, the authors have the right to publish the data obtained in this study. Other (non-relevant) data from the private project cannot be published.
Conflicts of Interest
The authors declare no conflict of interest.
Abbreviations
| APC | Article processing charges |
| ASHRAE | The American Society of Heating, Refrigerating and Air-Conditioning Engineers |
| BIM | Building information modelling |
| CAC | Cold-aisle containment |
| CACS | Cold-aisle containment system |
| CFD | Computational fluid dynamics |
| COP | Coefficient of Performance |
| CPU | Central processing unit |
| CRAC | Computer room air conditioning |
| CRAH | Computer room air handling |
| DCeET | Data centre energy efficiency evaluation tool |
| DCiE | Data centre infrastructure efficiency |
| DCIM | Data centre infrastructure management |
| DpCH | Differential pressure reading |
| GT | Temperature of the globe |
| HAC | Hot-aisle containment |
| HACA | Hot and cold aisles |
| HACS | Hot-aisle containment system |
| HVAC | Heating, ventilation and air conditioning systems |
| ICT | Information and communication technology |
| IT | Information technology |
| MPC | Model predictive controllers |
| NWB | Natural wet bulb temperature |
| ODF | Optical distribution frame |
| OP | Over-provisioned |
| OSHA | Occupational safety and health administration |
| PUE | Power usage effectiveness |
| RCI | Rack cooling index |
| RHI | Return heat index |
| RTI | Return temperature index |
| SAT | Supply air temperature |
| SHI | Supply heat index |
| UFAD | Underfloor air distribution |
| UP | Under-provisioned |
| UPS | Uninterruptible power supply |
| VED | Vertical exhaust duct |
| VEDS | Vertical exhaust duct system |
| WBT | Wet bulb temperature |
References
- Steve, S. The Green Grid, White Paper #50 “Data Center Efficiency and IT Equipment Reliability at Wider Operating Temperature and Humidity Ranges”. Available online: https://www.thegreengrid.org/ (accessed on 21 August 2023).
- The American Society of Heating, Refrigerating and Air-Conditioning Engineers. Available online: https://www.ashrae.org/ (accessed on 21 August 2023).
- Lee, Y.-T.; Wen, C.-Y.; Shih, Y.-C.; Li, Z.; Yang, A.-S. Numerical and experimental investigations on thermal management for data center with cold aisle containment configuration. Appl. Energy 2021, 307, 118213. [Google Scholar] [CrossRef]
- Cho, J.; Woo, J. Development and experimental study of an independent row-based cooling system for improving thermal performance of a data center. Appl. Therm. Eng. 2020, 169, 114857. [Google Scholar] [CrossRef]
- Rong, H.; Zhang, H.; Xiao, S.; Li, C.; Hu, C. Optimizing energy consumption for data centers. Renew. Sustain. Energy Rev. 2016, 58, 674–691. [Google Scholar] [CrossRef]
- Cho, J.; Kim, Y. Improving energy efficiency of dedicated cooling system and its contribution towards meeting an energy-optimized data center. Appl. Energy 2016, 165, 967–982. [Google Scholar] [CrossRef]
- Lu, H.; Zhang, Z.; Yang, L. A Review on Airflow Distribution and Management in Data Center. Energy Build. 2018, 179, 264–277. [Google Scholar] [CrossRef]
- Wang, C.-H.; Tsui, Y.-Y.; Wang, C.-C. On cold-aisle containment of a container datacenter. Appl. Therm. Eng. 2017, 112, 133–142. [Google Scholar] [CrossRef]
- Nada, S.A.; Elfeky, K.E. Experimental investigations of thermal managements solutions in data centers buildings for different arrangements of cold aisles containments. J. Build. Eng. 2016, 5, 41–49. [Google Scholar] [CrossRef]
- Khalaj, A.H.; Scherer, T.; Siriwardana, J.; Halgamuge, S. Increasing the thermal efficiency of an operational data center using cold aisle containment. In Proceedings of the 7th International Conference on Information and Automation for Sustainability, Colombo, Sri Lanka, 22–24 December 2014. [Google Scholar] [CrossRef]
- Lin, C.-C.; Shih, Y.-C. The optimal thermal management study of a next-generation data center. Case Stud. Therm. Eng. 2021, 26, 101031. [Google Scholar] [CrossRef]
- Lu, H.; Zhang, Z. Numerical and Experimental Investigations on the Thermal Performance of a Data Center. Appl. Therm. Eng. 2020, 180, 115759. [Google Scholar] [CrossRef]
- Zhan, B.; Shao, S.; Lin, M.; Zhang, H.; Tian, C.; Zhou, Y. Experimental investigation on ducted hot aisle containment system for racks cooling of data center. Int. J. Refrig. 2021, 127, 137–147. [Google Scholar] [CrossRef]
- Chu, W.-X.; Wang, C.-C. A review on airflow management in data centers. Appl. Energy 2019, 240, 84–119. [Google Scholar] [CrossRef]
- Sundaralingam, V.; Arghode, V.K.; Joshi, Y.; Phelps, W. Experimental Characterization of Various Cold Aisle Containment Configurations for Data Centers. J. Electron. Packag. 2014, 137, 011007. [Google Scholar] [CrossRef]
- Nada, S.A.; Elfeky, K.E.; Attia, A.M.A. Experimental investigations of air conditioning solutions in high power density data centers using a scaled physical model. Int. J. Refrig. 2016, 63, 87–99. [Google Scholar] [CrossRef]
- Alkharabsheh, S.A.; Sammakia, B.G.; Shrivastava, S.K. Experimentally Validated Computational Fluid Dynamics Model for a Data Center with Cold Aisle Containment. J. Electron. Packag. 2015, 137, 021010. [Google Scholar] [CrossRef]
- Gondipalli, S.; Bhopte, S.; Sammakia, B.; Iyengar, M.K.; Schmidt, R. Effect of isolating cold aisles on rack inlet temperature. In Proceedings of the 11th Intersociety Conference on Thermal and Thermomechanical Phenomena in Electronic Systems, Orlando, FL, USA, 28–31 May 2008. [Google Scholar] [CrossRef]
- Gao, C.; Yu, Z.; Wu, J. Investigation of Airflow Pattern of a Typical Data Center by CFD Simulation. Energy Procedia 2015, 78, 2687–2693. [Google Scholar] [CrossRef]
- Zhou, R.; Wang, Z.; Bash, C.E.; McReynolds, A. Modeling and Control for Cooling Management of Data Centers with Hot Aisle Containment. In Volume 4: Energy Systems Analysis, Thermodynamics and Sustainability; Combustion Science and Engineering; Nanoengineering for Energy, Parts A and B, Proceedings of the ASME International Mechanical Engineering Congress and Exposition, Denver, CO, USA, 11–17 November 2012; ASME: New York, NY, USA, 2012. [Google Scholar] [CrossRef]
- Wibron, E.; Ljung, A.-L.; Lundström, T. Computational Fluid Dynamics Modeling and Validating Experiments of Airflow in a Data Center. Energies 2018, 11, 644. [Google Scholar] [CrossRef]
- Onyiorah, C.; Eiland, R.; Agonafer, D.; Schmidt, R. Effectiveness of rack-level containment in removing data center hot-spots. In Proceedings of the Fourteenth Intersociety Conference on Thermal and Thermomechanical Phenomena in Electronic Systems (ITherm), Orlando, FL, USA, 27–30 May 2014. [Google Scholar] [CrossRef]
- Tsuda, A.; Mino, Y.; Nishimura, S. Comparison of ICT equipment air-intake temperatures between cold aisle containment and hot aisle containment in datacenters. In Proceedings of the 2017 IEEE International Telecommunications Energy Conference (INTELEC), Broadbeach, QLD, Australia, 22–26 October 2017. [Google Scholar] [CrossRef]
- Nemati, K.; Alissa, H.A.; Murray, B.T.; Sammakia, B. Steady-state and transient comparison of cold and hot aisle containment and chimney. In Proceedings of the 15th IEEE Intersociety Conference on Thermal and Thermomechanical Phenomena in Electronic Systems (ITherm), Las Vegas, NV, USA, 31 May–3 June 2016. [Google Scholar] [CrossRef]
- Shrivastava, S.K.; Calder, A.R.; Ibrahim, M. Quantitative comparison of air containment systems. In Proceedings of the 13th InterSociety Conference on Thermal and Thermomechanical Phenomena in Electronic Systems, San Diego, CA, USA, 30 May 2012–1 June 2012. [Google Scholar] [CrossRef]
- Alkharabsheh, S.A.; Shrivastava, S.K.; Sammakia, B.G. Effect of Cold Aisle Containment Leakage on Flow Rates and Temperatures in a Data Center. In Volume 2: Thermal Management; Data Centers and Energy Efficient Electronic Systems, Proceedings of the International Electronic Packaging Technical Conference and Exhibition, Burlingame, CA, USA, 16–18 July 2013; ASME: New York, NY, USA, 2013. [Google Scholar] [CrossRef]
- Tatchell-Evans, M.; Kapur, N.; Summers, J.; Thompson, H.; Oldham, D. An experimental and theoretical investigation of the extent of bypass air within data centres employing aisle containment, and its impact on power consumption. Appl. Energy 2017, 186, 457–469. [Google Scholar] [CrossRef]
- Siemon. Available online: https://ecatalog.siemon.com/ (accessed on 21 August 2023).
- ISO 7243. Ergonomics of the Thermal Environment—Assessment of Heat Stress Using the WBGT (Wet Bulb Globe Temperature) Index. Available online: https://www.iso.org/ (accessed on 10 October 2023).
- Niemann, J.; Brown, K.; Avelar, V. Impact of hot and cold aisle containment on data center temperature and efficiency. In Schneider Electric Data Center Science Center, White Paper; Schneider Electric: Rueil Malmaison, France, 2011; Volume 135, pp. 1–14. [Google Scholar]
- Pogorelskiy, S.; Kocsis, I. Efficiency Improvement with Data Center Monitoring Based on Building Information Modeling on the Facility Management Stage. Designs 2023, 7, 3. [Google Scholar] [CrossRef]


Disclaimer/Publisher’s Note: The statements, opinions and data contained in all publications are solely those of the individual author(s) and contributor(s) and not of MDPI and/or the editor(s). MDPI and/or the editor(s) disclaim responsibility for any injury to people or property resulting from any ideas, methods, instructions or products referred to in the content. |
© 2023 by the authors. Licensee MDPI, Basel, Switzerland. This article is an open access article distributed under the terms and conditions of the Creative Commons Attribution (CC BY) license (https://creativecommons.org/licenses/by/4.0/).