Article

Simulation Modelling for the Promotion of Green Residence Based on the Theory of Sustainability—Taking Jiangsu Province as an Example

1
School of Architecture and Planning, Yunnan University, Kunming 650500, China
2
School of Economics and Management, Jilin Jianzhu University, Changchun 130119, China
*
Author to whom correspondence should be addressed.
Buildings 2023, 13(10), 2635; https://doi.org/10.3390/buildings13102635
Submission received: 6 September 2023 / Revised: 7 October 2023 / Accepted: 12 October 2023 / Published: 19 October 2023
(This article belongs to the Topic Advances in Building Simulation)

Abstract

:
Green residences have enormous potential for energy savings, emission reduction, and other comprehensive benefits, and their growth is crucial to achieving China’s carbon neutrality and carbon peaking targets. Nevertheless, at the moment, the national green residence is impacted by complicated factors at several levels, including government agencies, green residence builders, and green residence consumers, which results in the low-quality development of domestic green residences overall. As of 2020, 94% of all labeled green residences are design-label residences that can only be achieved during the design stage, while less than 10% are operational-label residences with stronger energy and emission-saving benefits. This causes the phenomenon of “green residences on the planning” to be serious. In order to accomplish the promotion of high-quality development of green residences and to promote green residences in China, this paper analyzes the influencing factors of green residence promotion from the multi-level perspective of macro-landscape signals, meso-collective agent green residences, and micro-individual agent consumers, based on the multi-level perspective (MLP) framework of sustainability theory. The paper subsequently builds a simulation model of green residence promotion using the agent-based system dynamics modeling method. Additionally, Jiangsu Province’s green residence promotion data are chosen for analogue simulation experiments, and the simulation results are also used to analyze the success conditions as well as the path to green residence promotion. This study demonstrates that (1) the agent-based simulation model of dynamics for the green residence promotion system has high reference value for the simulation of the promotion of green residences, and the model can clearly simulate the impact of micro-individual agent–consumer factors on the promotion of green residences; (2) in order to promote green residences, exterior landscape signals must be continuously improved; the stronger the landscape signals, the quicker the development of operationally labeled green residences; (3) priority is given to the development of two-star design-labeled green residences before 2035, and three-star operationally labeled residences will occupy the majority of the market after 2040. Meanwhile, the duration of landscape signals and the change in behavioral preferences of individual agents must be maintained for a long time.

1. Introduction

High-star operational-labeled green buildings provide higher advantages in energy saving and emission reduction than standard energy-saving residence buildings [1]. The development of operationally branded green residences has been delayed in the process of promoting green residences, and it is challenging to measure their comprehensive benefits, such as energy savings and emission reduction. Approximately 6% of all projects with a designation are operationally labeled as green buildings, according to government statistical records [2]. The reason for this is that a variety of complicated elements operating at various levels have an impact on the marketing of high-star operationally labeled green buildings. Therefore, the success conditions and pathways for the promotion of green buildings are defined by researching the essential factors in the promotion of green buildings and elucidating their complicated functions. The findings of this investigation have beneficial significance for the promotion of operationally labeled green residences.
There are two main issues that deal with the success conditions and pathways around the promotion of green residences. Firstly, a thorough and precise identification of the crucial influencing factors affecting the promotion is required. Secondly, the intricate roles played by each influencing factor must be rigorously analyzed. Recently, numerous studies on factors influencing the promotion of green residences have been carried out by relevant academics, including crucial factors, such as promotion strategies, incremental costs, incremental benefits, energy savings, and pollution reduction advantages, etc., on green residences [3,4,5,6,7]. Green residences, in the opinion of Andrea Chegut, are useful for energy saving and emission reduction. However, incremental expenditures have also contributed to the phenomenon known as “green residences on the planning” [3]. For the development of green buildings, 40 elements were statistically examined by Chen LY [4]. The study’s findings indicate that policy incentives, legal mandates, the level of green technology innovation, the effect of energy saving and emission reduction, incremental costs, and incremental benefit factors all play a significant role in the promotion of green residences. A study by Zhangxia Song revealed that the development of green buildings is significantly influenced by construction costs [5]. According to Qiang Zhou, the development of green buildings is primarily driven by the economy, technology, culture, market, developers, and government [6]. In addition, Baoxing Qiu’s research on the trajectory of the development of green residences demonstrates that the factors affecting development are dynamic and complicated [7]. These existing studies are relatively homogenous in terms of the level of research involved, simply covering the macro-policy and the green residence’s individual components. However, for individual consumers, as the ultimate purchasers and users of green residences, their preference for green residences is a key factor influencing the promotion of green residences. There is currently little research on how consumer behavioral characteristics at the micro level affect the promotion of green buildings. Clarifying the role of the factor of individual consumer preference in the promotion of green residences is crucial to the process.
Structural equation modeling [8] and system dynamics [9,10,11] are two of the research methods that are now available to study the complex interactions between the factors that contribute to the promotion of green residences. Nuri Cihat Onat applied system dynamics to the study of the medium- and long-term impacts of green building-related policies on greenhouse gas emissions [9]. According to the study’s findings, green retrofit policies for existing buildings are more effective in energy saving and emission reduction than green residence policies for new buildings. Technology and policy are the two main influencing elements, according to Guoshuai Sun, that performed a system dynamics modeling simulation analysis on the interaction mechanisms of green construction technology drivers [10]. The system dynamics simulation of Dingxuan Huang’s symbiotic game model of building and conventional buildings revealed that the effectiveness of policy incentives is highly correlated with the behavioral preferences of micro customers [11]. There are numerous additional characteristics of modeling approaches. For instance, Heejung Park’s proposed stochastic programming model offers important benefits for the optimal capacity and optimal solution issues for utility-scale solar PV and battery storage systems [12]. Using this model helps to solve the second-order optimal solution problem.
Overall, structural equation modeling is suitable for statistical analysis but is less effective in establishing the complicated dynamic relationship between the influencing factors. System dynamics modeling is top-down global structural dependency perspective modeling, which is suitable for analyzing the dynamic interactions between multiple factors from a holistic perspective and simulating future outcomes. But it is difficult to reflect the impact of individual behavioral preferences at the micro level on outcomes. Huan Gao presented an overview of the development of research on carbon emission accounting and prediction modeling for buildings and made the case that system dynamics has the benefit of being able to successfully handle nonlinear, complex, and higher-order practical issues as well as reflecting the interaction between the internal and external factors of the research object [13].
Agent-based modeling consists of a space, frame, or environment in which interactions take place, and a number of individual agents whose behavior in this space is defined by a set of basic rules and characteristic parameters of the agent. These spaces, frames, or environments in which interactions occur identify and constrain the boundaries of the simulation system, a number of individual agents form the internal body of the simulation system, a set of basic rules define how individual agents move, and multiple characteristic parameters of the agents collectively construct a multidimensional practice space in which each individual agent occupies a position based on its heterogeneous characteristic parameters. Agents are associated with a specific location in a multidimensional practice space from which they may or may not move. The agent-based modeling paradigm emphasizes decentralization and is bottom-up modeling. This model defines behavior at the individual level and considers the macro-level behavior to be the result of the sum of millions of individual behaviors [14,15,16]. Agent-based modeling offers an approach of connecting a system’s micro-level behavior to its macro-level behavior, while system dynamics correlates system structure to system behavior. Barry G. Silverman investigated whether agent-based modeling and simulation can assist medical administrators in raising population health and the standard of treatment while lowering costs [17]. Attallah S O argued that previous sustainable decision making has often lacked subsequent outcome displays and that agent-based modeling approaches analyze sustainable decision making by building sustainable decision-making simulation models [18].
Aiming at the advantages and shortcomings of different simulation modeling methods, related scholars proposed to combine agent-based modeling methods with system dynamics modeling. In 2001, Scholl first published an article calling for a joint study of agent-based modeling and system dynamics modeling by comparing two approaches to modeling complex dynamic systems. Such techniques are known as agent-based approaches to modeling system dynamics. The two approaches complement each other, with details and macros coexisting. This combined modeling approach helps to select the appropriate modeling method for each subsystem in the system. Additionally, system dynamics and agent-based modeling can jointly speed up computation for many modeling issues. At the same time, another potential advantage of combining system dynamics and agent-based modeling is that the resulting simulation model allows for arranging agents in the spatial structure while integrating important features of system dynamics modeling. Examples involve continuity and nonlinear multiloop feedback. When individual agents move, the approach can be improved since the spatial dimension becomes dynamic. Accordingly, individual agents interact with different system dynamics sub-models depending on their multidimensional practice space location. Jo et al. designed dynamic alternatives for a cost–benefit analysis for infrastructure projects [19]. This research combined both agent-based and system dynamics modeling approaches, enabling dynamic feedback from the system dynamics modeling state to the agent-based modeling environment and from the agent-based modeling environment to the rate of change in system dynamics. Tran developed a multi-paradigm framework to analyze the dynamics of technological behavior in networks and to assess the impact of technology on society [20]. The framework integrates the concepts of system dynamics to explore the most aggregated and macroscopic layers of a system and agent-based concepts to study network structure and individual behavior. Lewe integrated modules for system dynamics modeling and agent-based modeling, which represent macro- and micro-level variables, respectively, to research intercity transportation. Kolominsky-Rabas et al. developed the framework ProHTA, an agent-based system dynamics modeling tool that aims to evaluate innovative health technologies before they are introduced [21]. There are case studies that integrate the two different techniques in other fields. As an example, Yajie Zhang offered two different energy management system approaches that integrate building physics with energy technologies, energy control, and management techniques, effectively addressing the issues of inaccurate building simulations and time-consuming control management [22].
The green residence promotion system, which is a long-term cyclical and nonlinear complex system, involves complex characteristics, including top-down macro landscapes, bottom-up micro individual market consumers, and meso-green residence types. The agent-based system dynamics modeling method is used to match the characteristics of complex systems. Therefore, this paper applies the agent-based system dynamics modeling approach to construct a simulation model for green residence promotion from a macro/meso/micro multi-level perspective. The model may successfully address the issues of successful conditions and pathways for the promotion of green residences as well as the issue of previous simulation models’ lack of micro-individual consumer preference factors. At the same time, simulation experiments are carried out to confirm the applicability and practicality of the model using the green residential development data from Jiangsu Province.
The contributions of this paper can be summarized as follows.
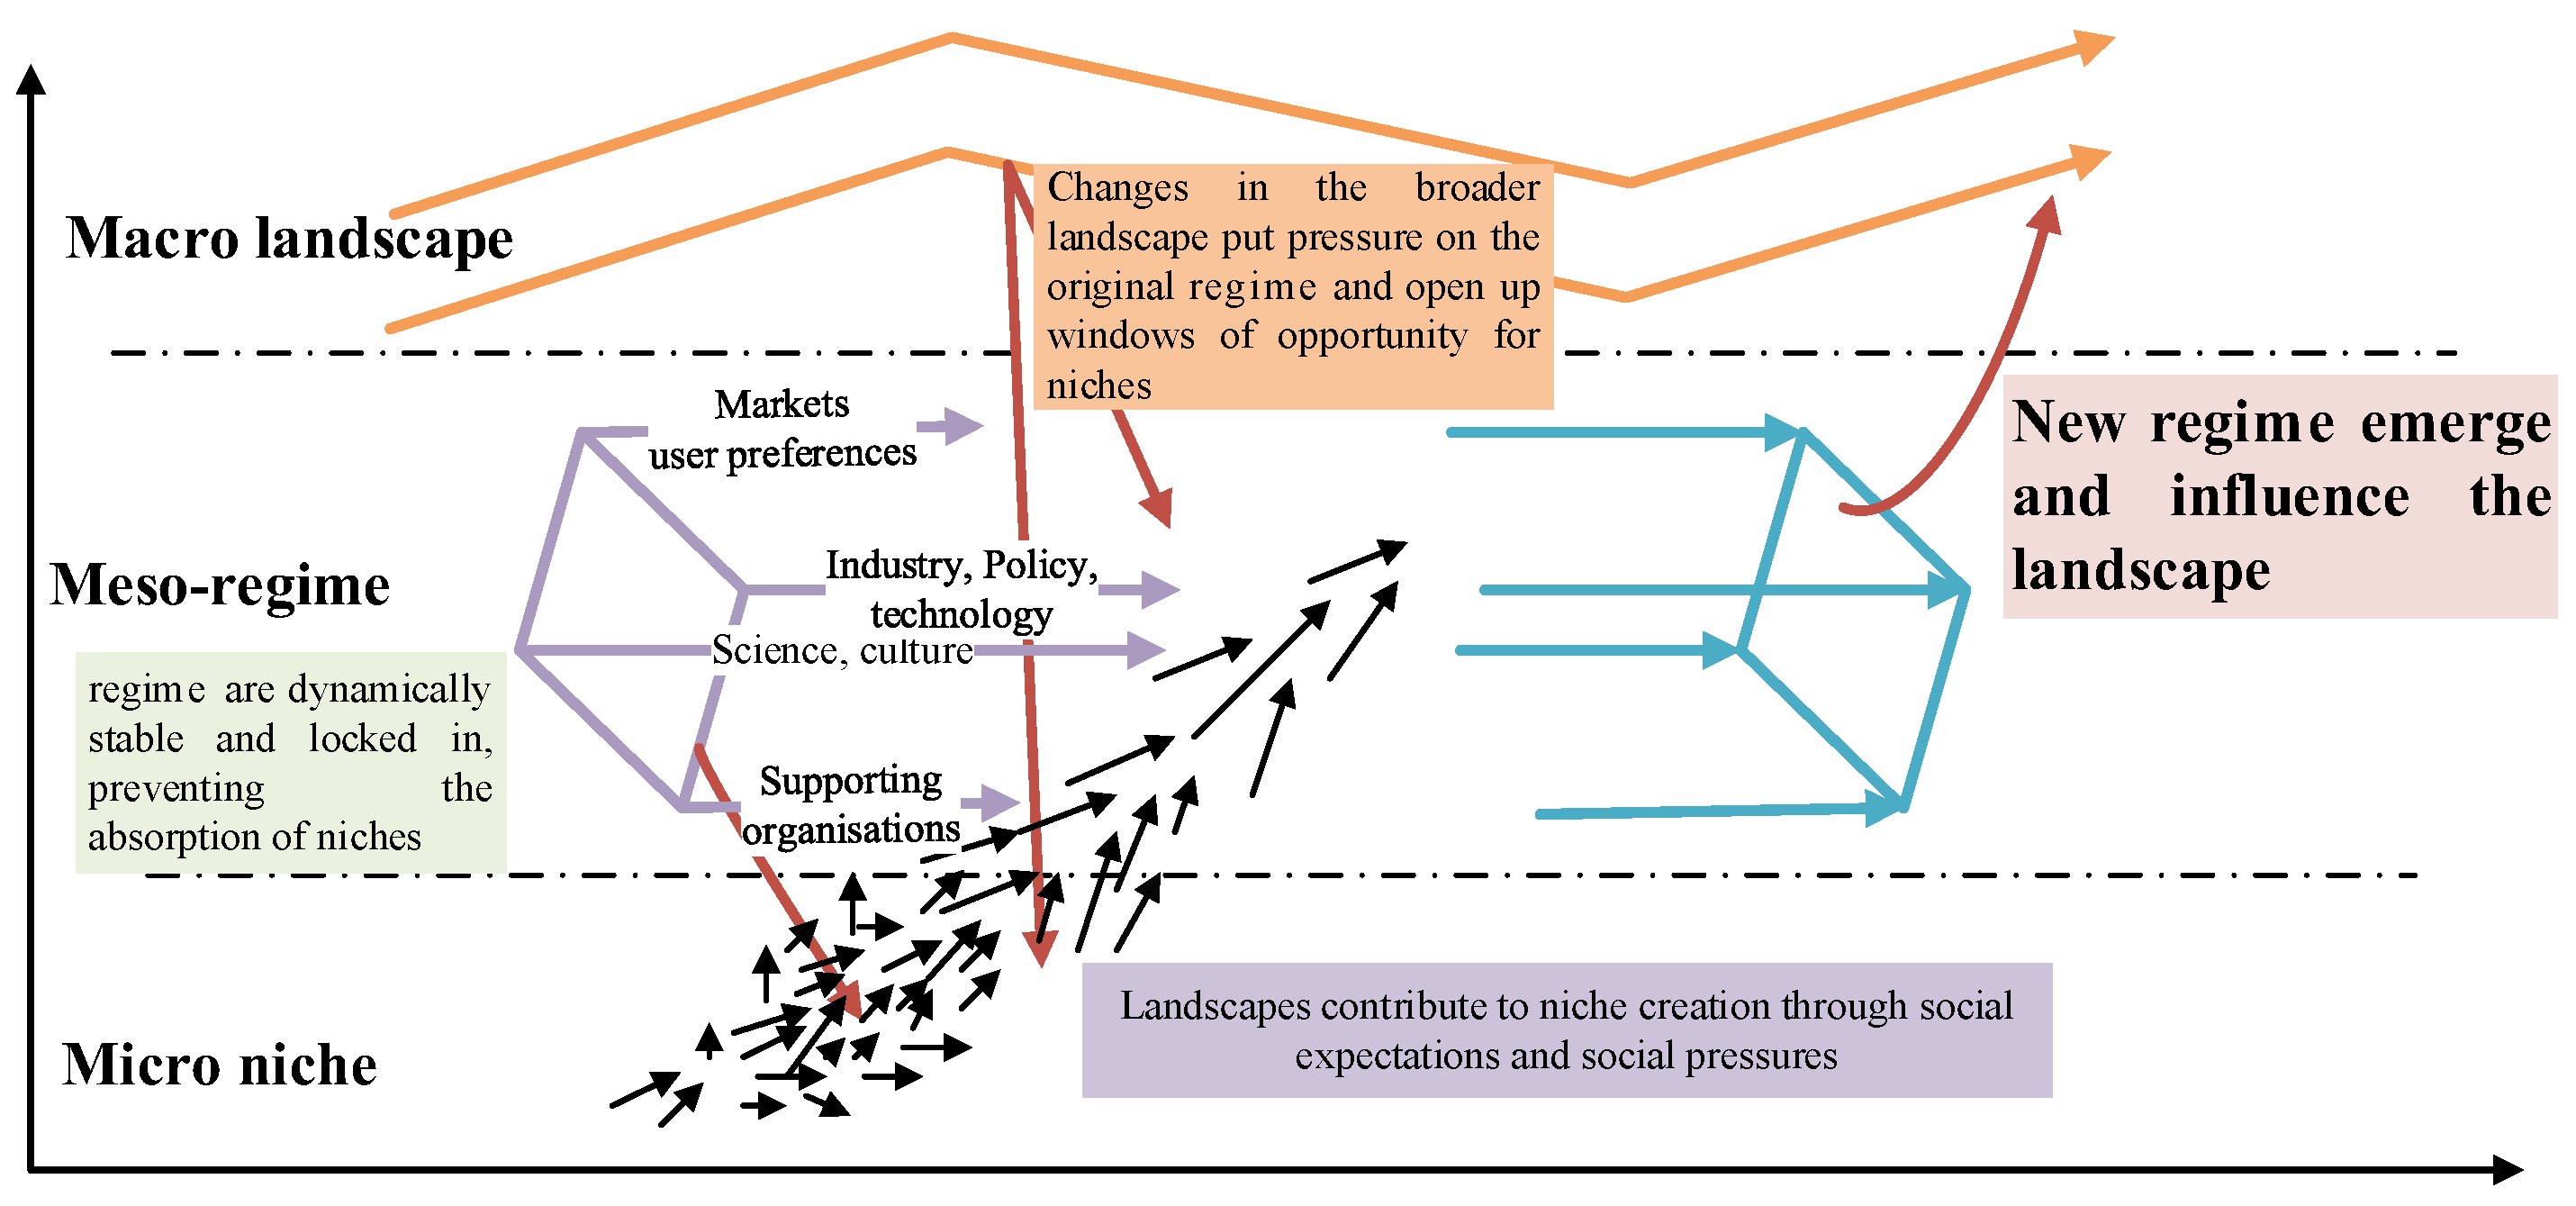
  • Using the macro/meso/micro multi-level perspective framework of sustainability theory, different levels of complex elements, such as landscape signals for green residence promotion at the macro level, each social functional attribute of green residence at the meso-level, and consumer preferences at the micro level, are analyzed.
  • Based on the macro/meso/micro multi-level complex factors derived from the analysis, an agent-based system dynamics modeling approach is used to construct a simulation model for green residence promotion.
  • To determine the success conditions and the pathways to green residence promotion, the model is applied to Jiangsu Province’s green residence promotion system. Additionally, this study serves as a resource for advancing the development of green residence promotion and helps the country achieve its carbon peak and carbon neutrality targets.

2. Principles of Model Construction

2.1. Model Theory

The theory of sustainability encompasses the theories of sustainable development and sustainable transformation, both of which work to further sustainable development [23]. The theory includes a multi-level perspective framework (also known as the MLP framework), which is made up of three perspective levels: macro-landscape, meso-institutional, and micro-niche (see Figure 1). This framework has characteristics, like several participating subjects, numerous constituent factors, multiple levels, and numerous models encountered [21,24,25,26]. Based on the theory of sustainable transition, RD and Lu YJ established a conceptual framework for green building promotion that demonstrates the challenges, complexities, and potential solutions for successful green building promotion [27]. According to Gibbs et al.’s analysis of the sustainable transition in the UK’s construction industry, policies that actively encourage or establish niche markets can advance the development of green buildings as a meso-regime [28]. A case study of the development of green buildings in Norway was carried out by Nykamp, H [9]. The findings indicated that the development of green buildings is a complex process of innovation and diffusion, in which technologies, visions, players, and policies evolve together over time and are all influenced by the level of support from actors (consumers).
From a macro/meso/micro multi-level perspective, this analytical framework systematically evaluates the elements impacting the promotion of green residences. It also provides theoretical support for a clear exposition of the role correlations among the influencing components.

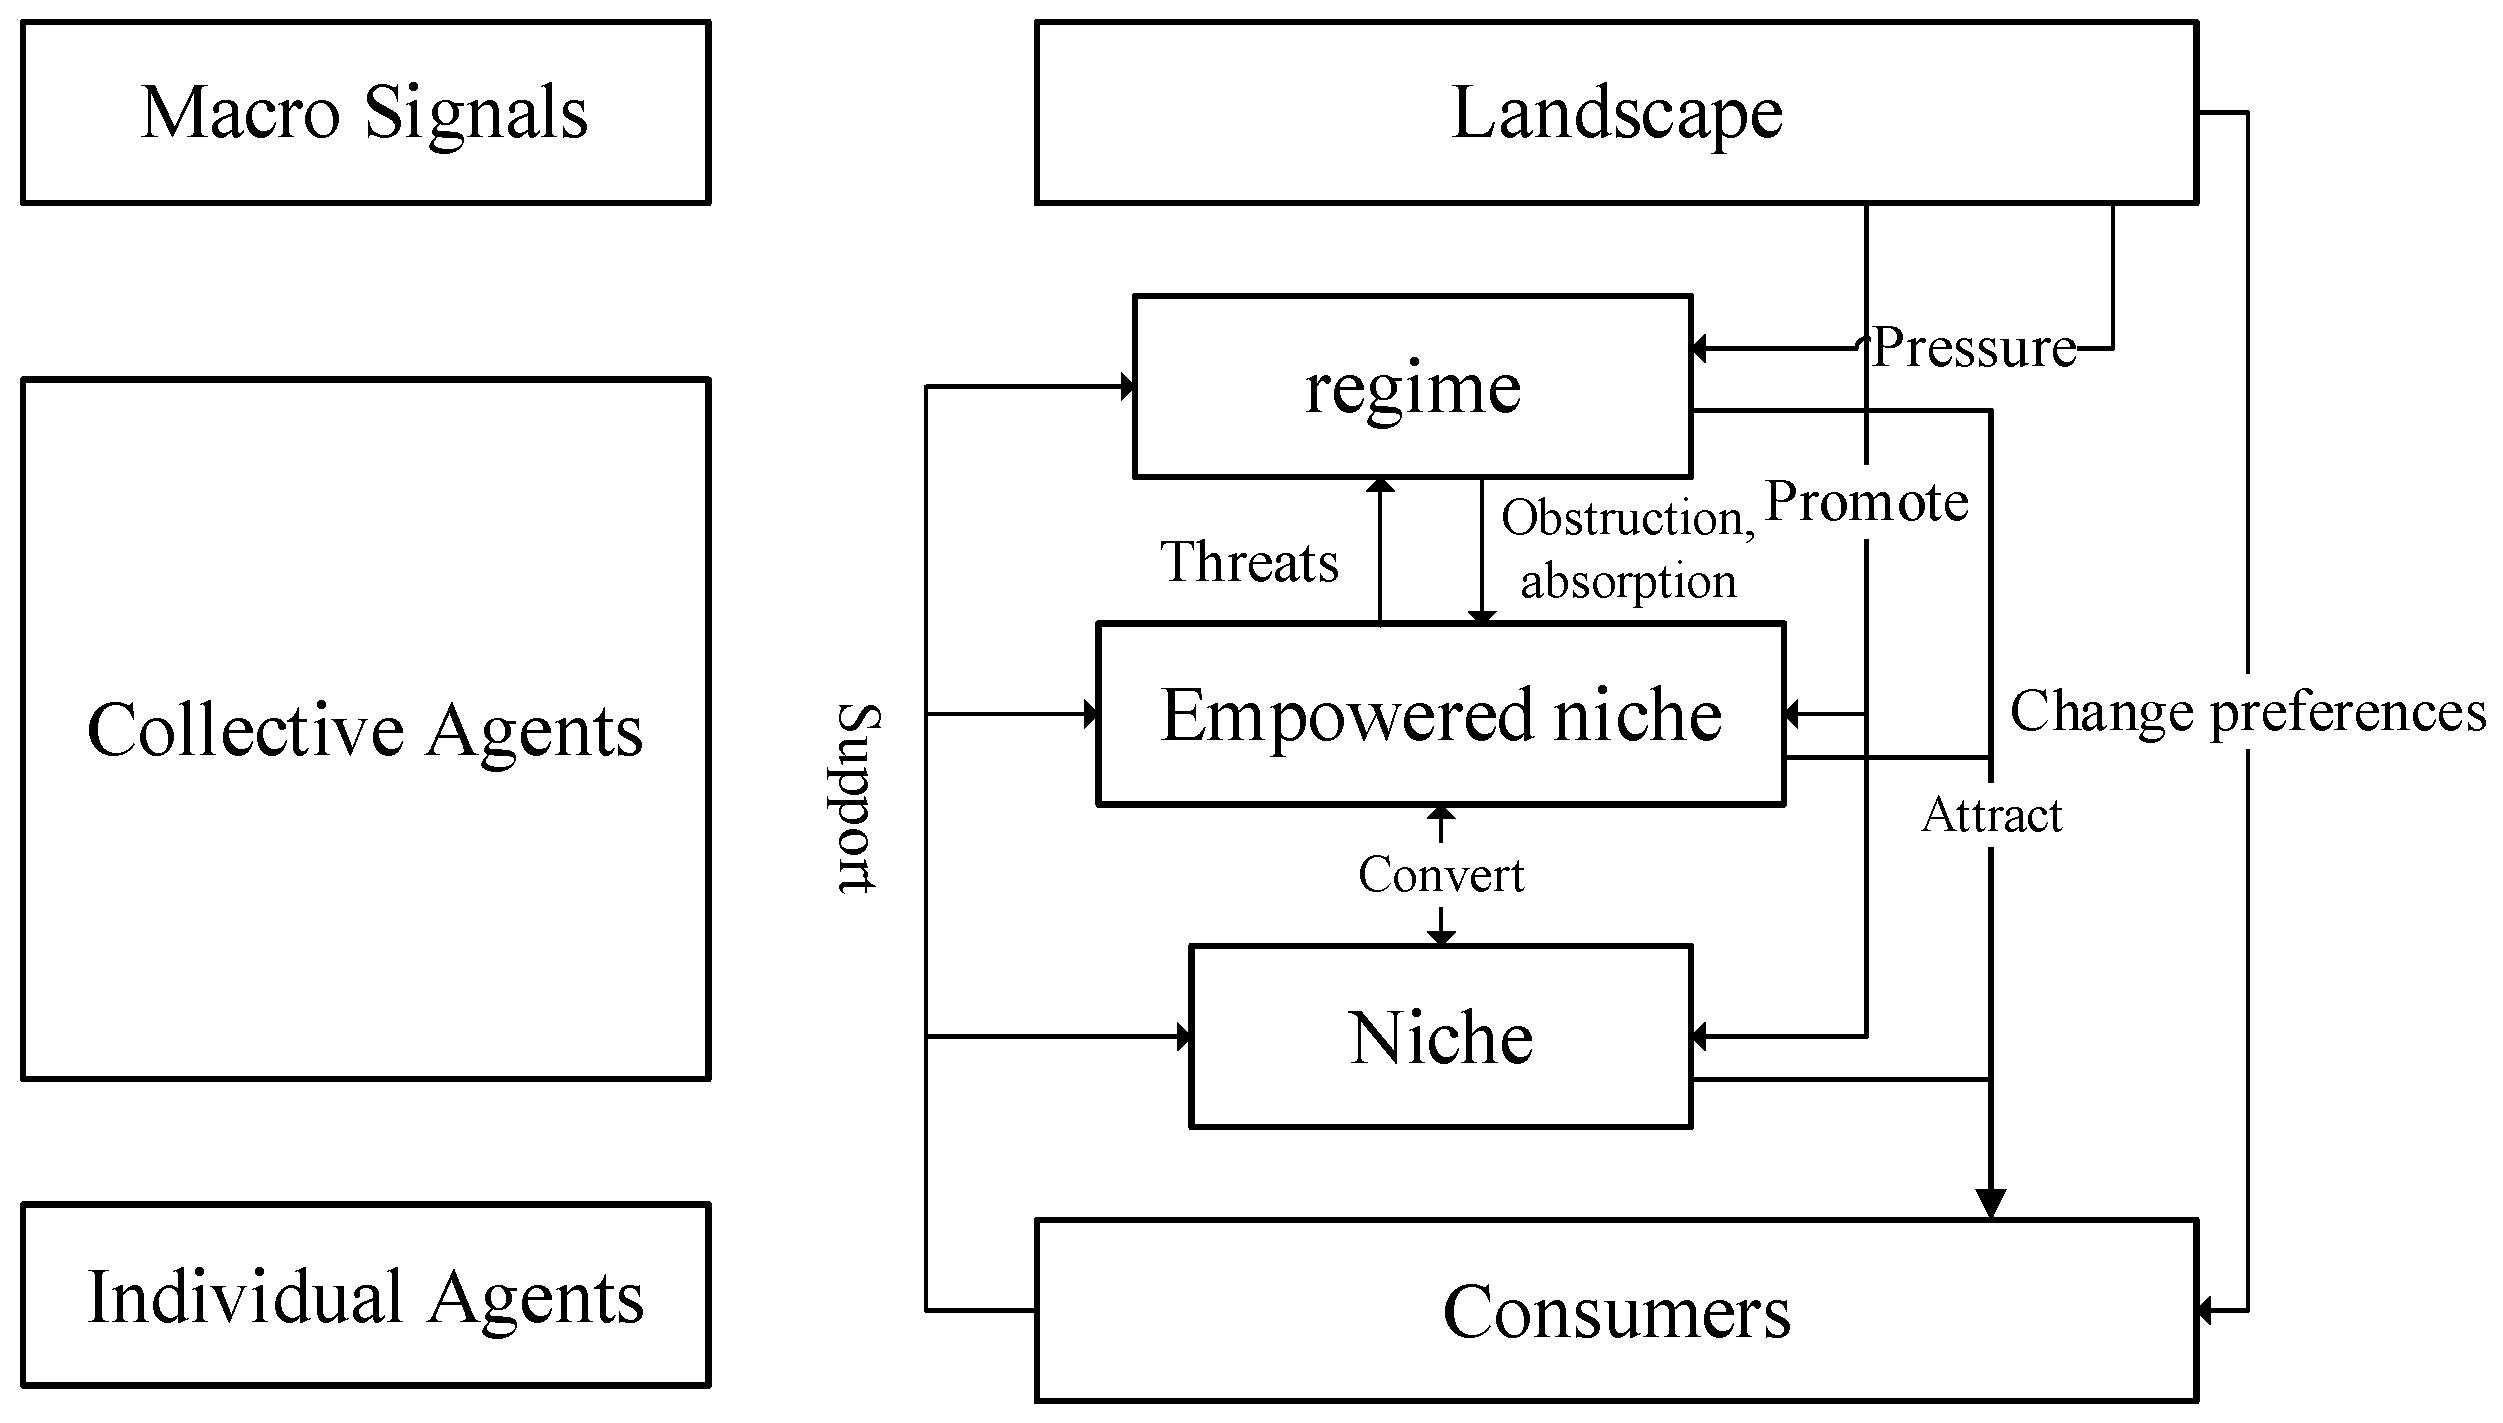
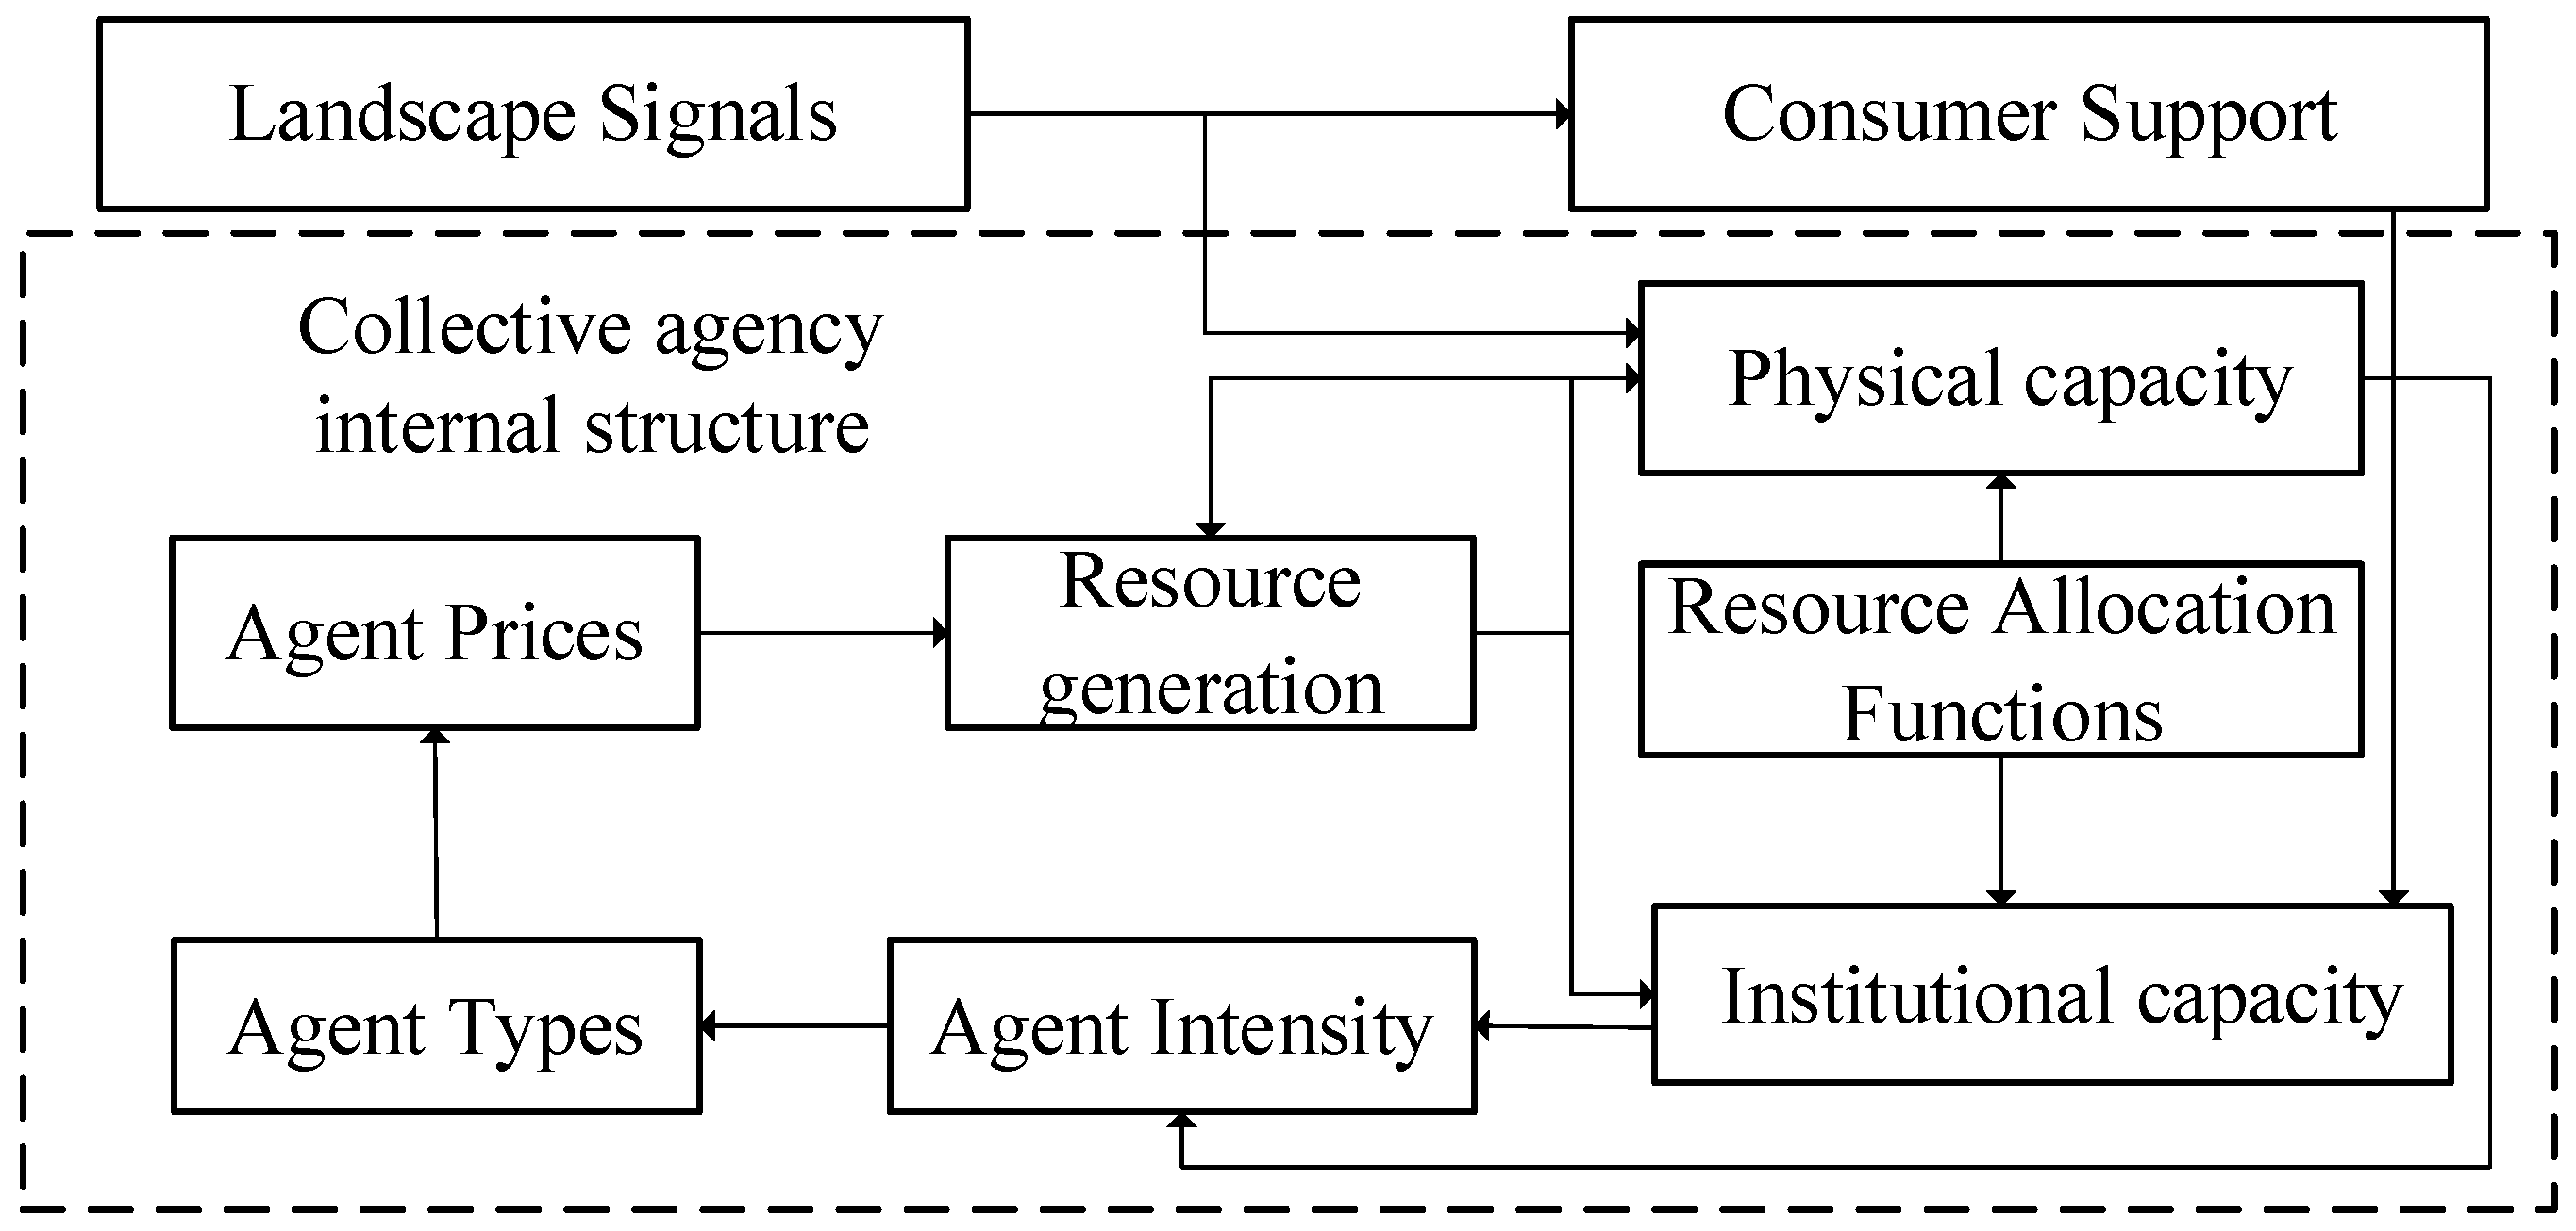
2.2. Model Structure

The green residence promotion system is divided into two categories by the agent-based system dynamics modeling method: collective agents and individual agents. Collective agents, which include subsystems, like the general residence system and the one-star design-labeled green residence system, are systems with an internal structure. Individual agents are individual consumers of green residence systems. According to the MLP framework, the model structure can be divided into three functional levels: landscape, regime, and niche. This study’s model structure comprises a landscape, a regime, an empowered niche, a niche, and a consumer.
The model exists in two compositional forms: one with only one regime and numerous niches, and the other just includes niches. The role that dominates the system is that of the regime, with empowered niches representing those that are more powerful but have not yet reached the regime. By altering the optimal point of consumer preferences, landscape signals put pressure on the present regime and open up a window for niche to become regime. At the same time, there is a two-way coupling between collective agent and individual agent behavior in the form of support mechanisms. Consumer support gives niche and regime resources and space for development, and niche and regime adapt their operations to win over consumers. Figure 2 illustrates how regime frequently obliterates or abolishes niche as opposed to changing “self-maintenance” through innovation.
Agent-based models also simulate, in some detail, ways in which individual agents make decisions, specifically how an individual agent chooses which collective agents to support. Multidimensional “practice spaces” are used to encode the preferences of individual agents as well as the many different social system functions of collective agents. The dimensions are usually in a range of 2–6 numbers, with a continuous range of values from 0 to 100, and each agent occupies a position in the practice space based on the value of its dimension. Because distance represents real-world positions, and the closer the distance depicting those positions, the more similar they are, individual agents support the collective agents with the shortest distance. According to the conclusions of related research, two thresholds of agency intensity, 0.15 and 0.5, are set to distinguish collective agency. That is, 0 ≤ niche < 0.15 ≤ empowered niche < 0.5 ≤ regime.
Collective agents have an internal structure. Their internal structure is abstractly defined as physical and institutional capacity (as shown in Figure 3). Resource generation is introduced to characterize how the size of various types of collective agents develops or declines over time and, at the same time, to make explicit the impact of such changes in size on other agents as well as on the landscape. The intensity of a collective agent is an abstract concept that indicates the relative size of the collective agents. Intensity is the result of adding physical capacity and institutional capacity, and it additionally decides how collective agents behave in the practice space. The collective agents’ infrastructure, production potential, and other factors that affect resource generation are represented by physical capacity. Physical capacity and producing resources have an important feedback cycle. If the system expands its physical capacity (building new factories), it can produce more resources (cars). If not, the system’s physical capacity become depleted. The produced resources are primarily distributed to its two capabilities, and a resource allocation rule is established to indicate the percentage of resource allocation required for physical and institutional capabilities.
Landscape signals are often configured using a group of two to six quantities, which frequently contain important external variables like policy.

2.3. Modelling Method

  • Function for Generating Resources
It is thought of as a simple production function with output and a price that generates resources for a collective agent. Resource production is influenced by both the collective agents’ existing physical capabilities (infrastructure productivity, etc.) and the support price of each individual agent.
R = P r i c e × P C .
R stands for the quantity of resources produced, P C for the physical capability of a collective agent, and P r i c e for the cost of support from an individual agent to a collective agent. Based on realistic values, they are currently calibrated to an exact value. Resource production is used for the growth and maintenance of the physical capacity and the institutional capacity. Assuming that the resources are distributed equally, the resource allocation ratio is f p c to f i c in this study.
f p c + f i c = 1 ,
f p c = f i c = 0.5 .
2.
Physical Capability Function of Collective Agents
The stock of physical capacity at moment t 0 and the landscape signals both have an impact on the physical capacity at moment t 1 .
P C t 1 = P C t 0 + Δ P C ,
Δ P C = R × f p c × l a n d s c a p e   s i g n a l s .
The physical capacities of the collective agents at times t 0 and t 1 are, respectively, P C t 1 and P C t 0 .
3.
Movement Function of Collective Agents in Practice Space
In order to obtain additional resources, collective agents require more assistance from individual agents. This means that the collective agent needs to constantly change its position in the practice space. Additionally, the type of agent, the landscape signals, and the level of support from individual agents all have an impact on how collective agents move. Collective agents move in the same direction as long as individual agents continue to support them; otherwise, they move in the opposite direction. At the same time, agents have inertia of movement; the more powerful the agents, the greater their inertia of movement. According to Bergman’s research, the regime, empowered niche, and niche all move at 0.1, 0.15, and 0.25 mph, respectively [29,30]. By altering collective agents’ functional bias, landscape signals have an impact on the direction and speed of their movement. We assume that the collective agents’ position in the practice space is ( C i , t 0 ) at time t0 and that the collective agents’ velocity of movement at time t1 is V c i t :
C i , t 1 = C i , t 0 + Δ C i , t ,
Δ C i , t = C i , t 0 × V c i t × l a n d s c a p e   s i g n a l s .
4.
Motion Function of Individual Agents in Practice Space
Similar to collective agent movements, individual agent movements are influenced by landscape signals. These signals have the ability to alter an individual agent’s optimum points, reflecting alterations to that agent’s desired consumption habits and way of life. According to Geels F’s research, the movement speed V m i t , which is inversely proportional to the intensity of landscape signals, regulates the movement of individual agent consumers [25,26]. The pressure and, consequently, the direction and speed of consumer movement depend on the consumer’s ideal point. Additionally, the movement of different types of individual agent consumers in the multidimensional practice space is influenced by the consumer weights of individual agents. In the multidimensional practice space region, we set the value of W for the weight of the number of individual agents supporting other collective agents over the number of all individual agents. The weight ( 1 W ) is the ratio of the number of individual agents supporting this collective agent to the total number of agents. We assume that the individual agents’ position in the practice space is ( M i , t 0 ) at time t 0 and that the collective agents M i ’s movement speed at time t1 is V m i t :
M i , t = M i , t 0 + Δ M i , t ,
Δ M i , t = Δ M i , t × V m i t ,
V m i t = ( 1 W t ) 2 × l a n d s c a p e   s i g n a l .
5.
Support Function of Individual Agents
Each individual agent is dynamically linked to a collective agent in a process called “supporting” the collective agents. The concept of “support” is used to indicate the effect of an individual agent’s support for a specific collective agent, whether through monetary trade or social acceptance. For instance, it is possible that an individual agent buys a product from the “regime” and then, over time, it transfers that purchase to a product produced by a growing “niche”. Every time a simulation step occurs, each individual agent chooses which collective agents to support. Based on their choices, individual agents automatically adopt the practices used by the collective agents they support. Based on their Euclidean distance from each collective agent in the practice space, individual agents decide which supports to provide. The collective agent is more alluring to this individual agent the closer the distance between them, which indicates how similar their positions are. In other words, the attraction of the collective agent to the individual agent is measured using the inverse of the Euclidean distance between the two. Assuming that the collective agent C and the individual agent M are in the practice space at time t0 as ( C i , t 0 ) and ( M i , t 0 ), respectively, the attraction between the two agents at that time can be written as ( C , M ):
C , M = 1 i n C i , t M i , t 2 .
Support ( S c ) is the abbreviation for individual agent M ’s assistance to collective agent C .
S c = i × M i G r o u p   w e i g h t s   W × n o r m a l i s e d ( C , M i ) .
6.
Institutional Capacity Function of Collective Agents
Institutional capacity is a collective agent quality that changes over time. The institutional capacity includes the relational network of stakeholders and the level of support of individual agents, etc., which is influenced by the resource allocation and the support of individual agents. The institutional capacity of the collective agent M is designated as I C m .
I C m = R × f i c + S c m .
7.
Intensity Function of Collective Agents
The Intensity of the collective agent, designated as η c in the model, is the sum of the physical capacity P C and institutional capacity IC of collective agent C .
η c = P C + I C

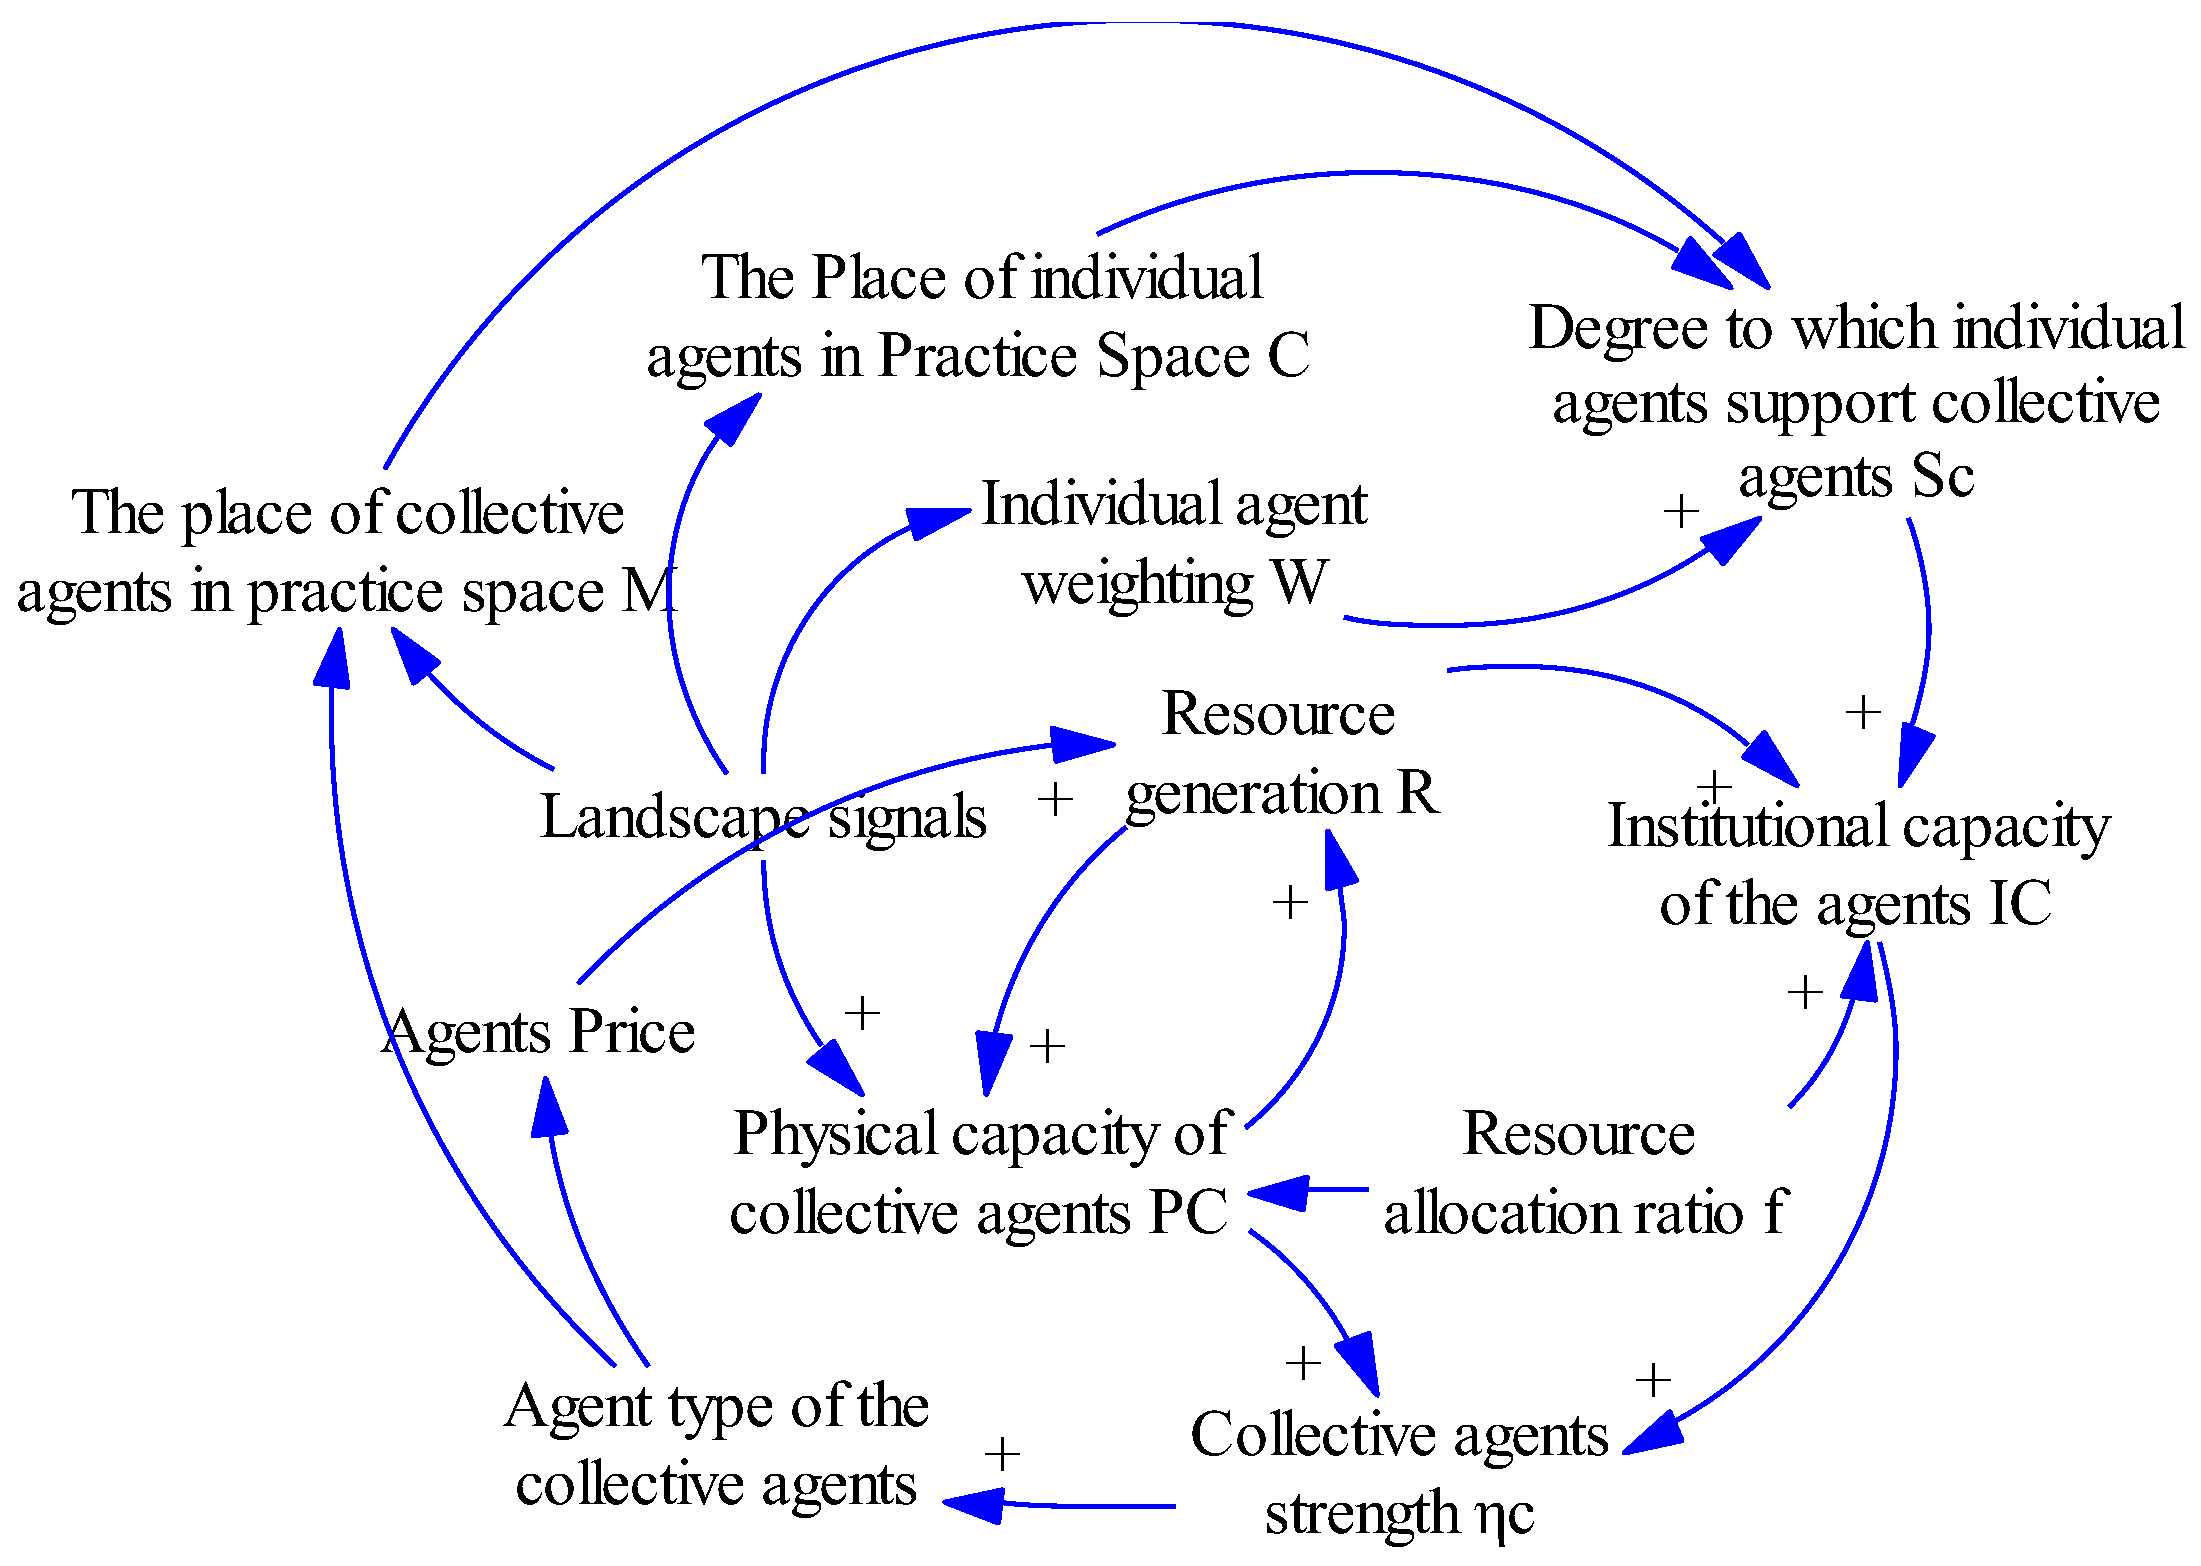
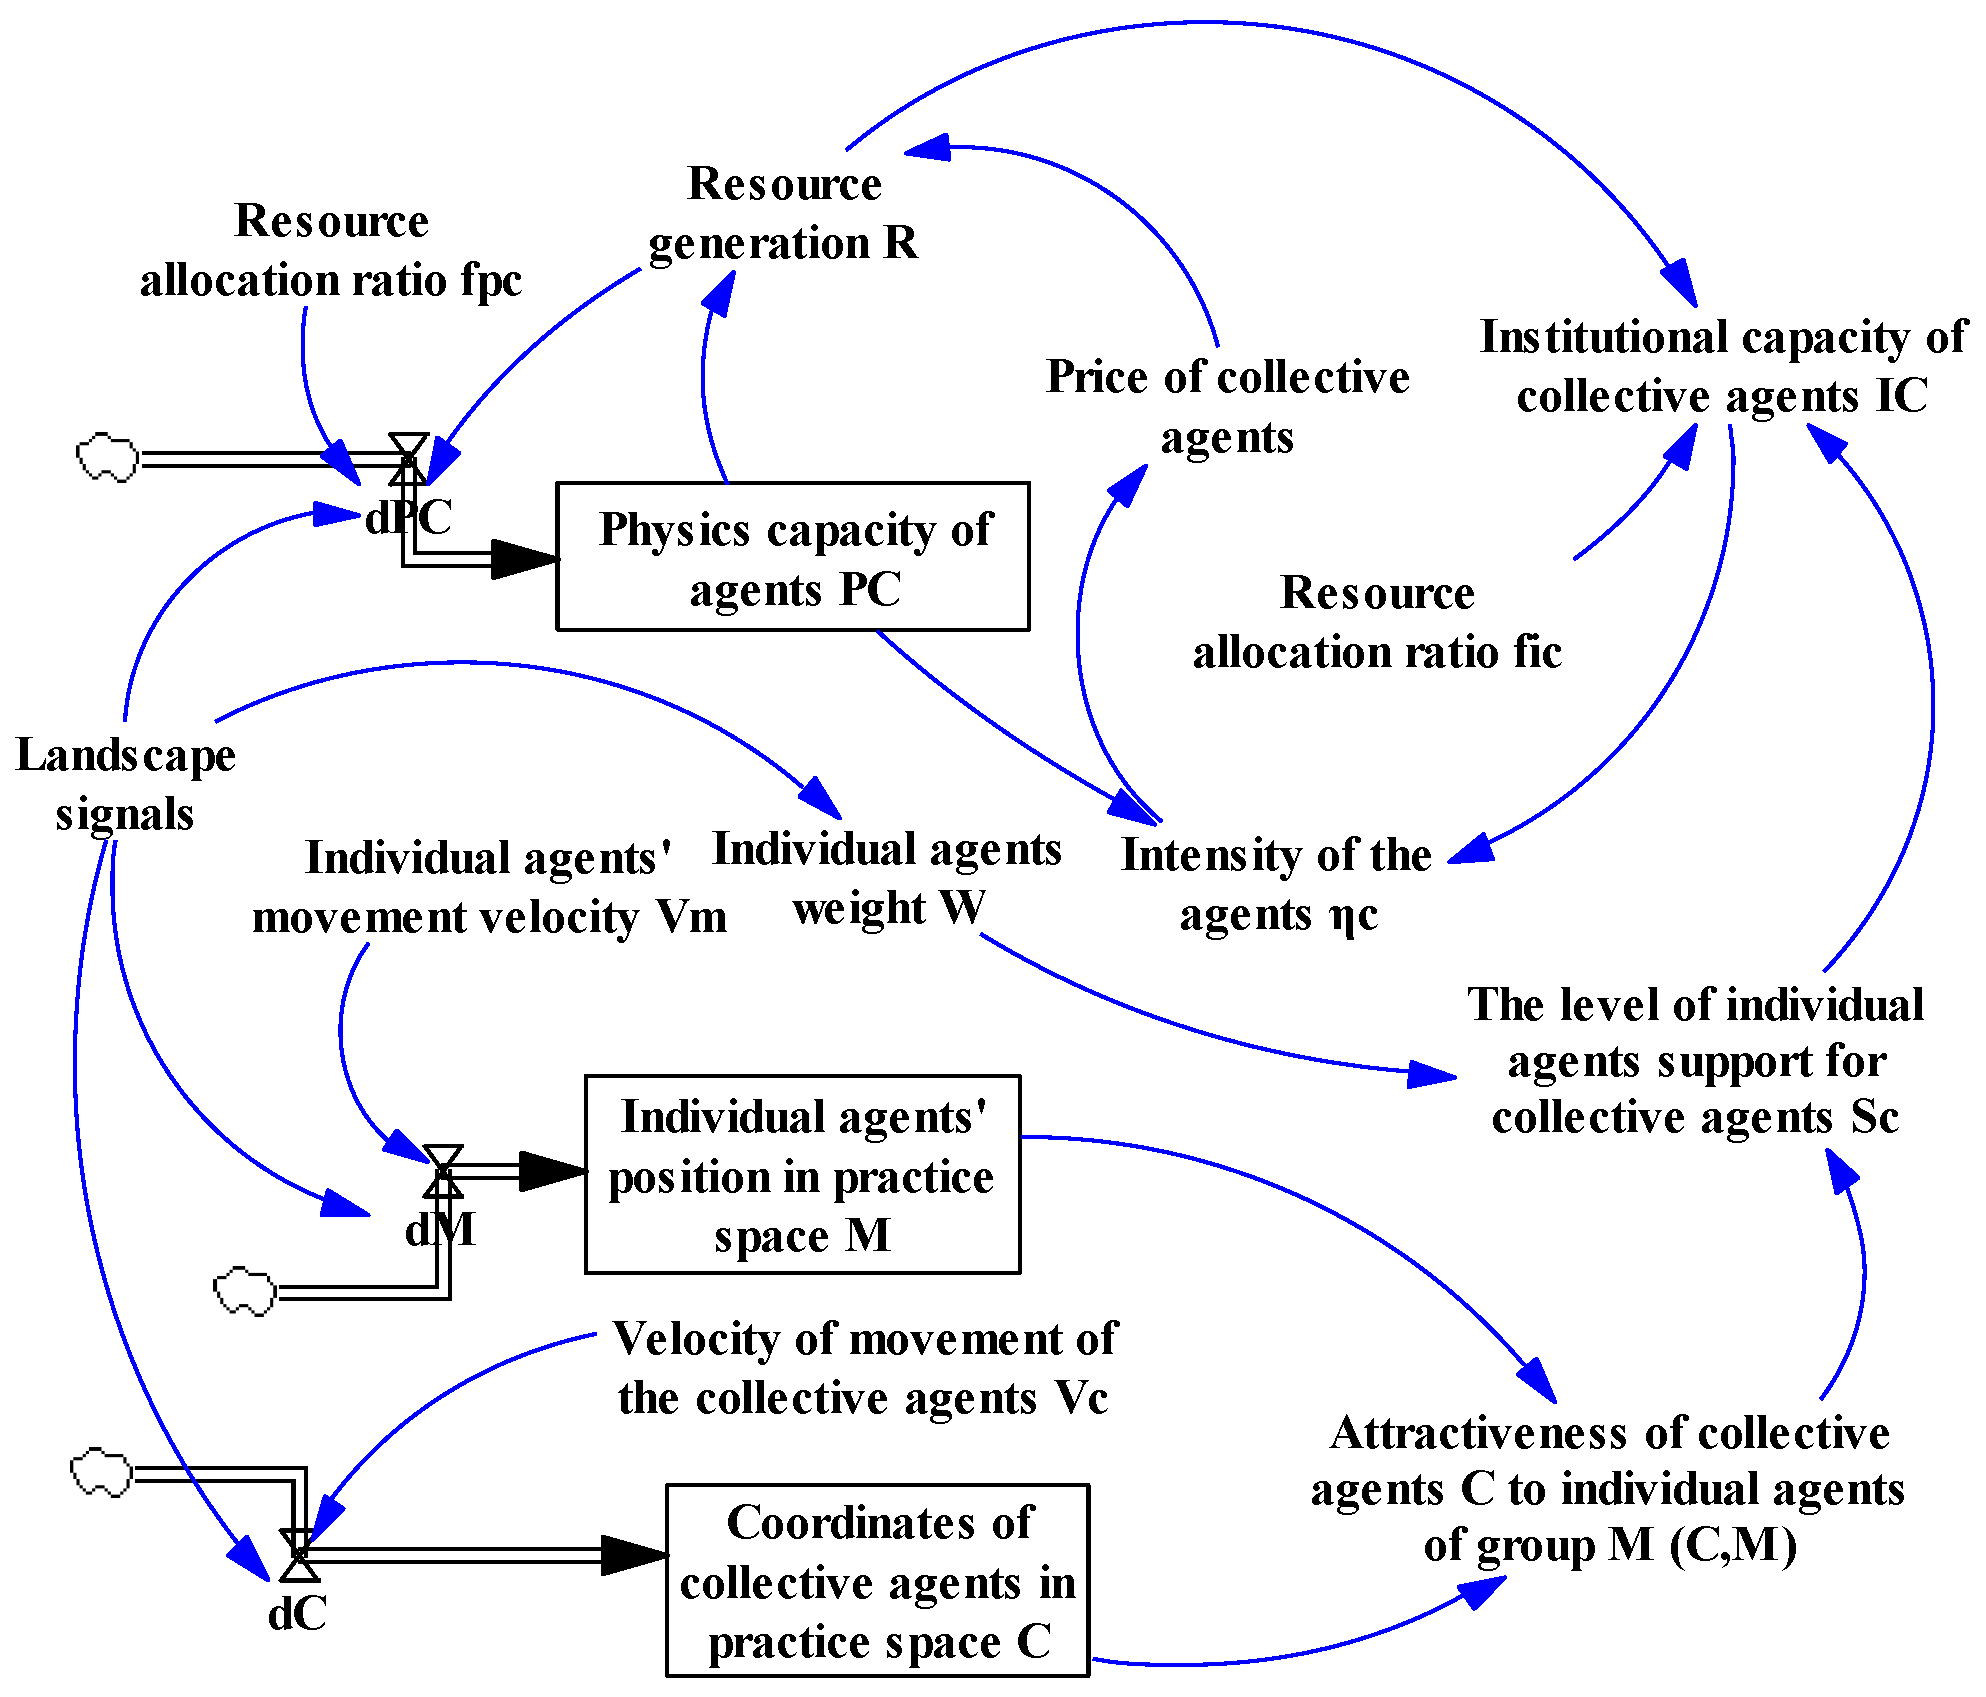
2.4. Causal Loop Diagram and Stock Flow Diagram of the Model

Landscape signals, which have the attribute of being a function of time, are employed as external input variables in the model. The function of collective agents and the preferences of individual agents can change in response to changes in the landscape signals’ vectorial qualities, which further reflect changes in the positions of the agents in the practice space.
In summary, the effects of external variable landscape signals on the system’s internal variables are underlined in terms of a change in the collective agents’ intensity and, consequently, in the type of collective agents. Agent-based system dynamics modeling was used to create the causal loop diagram (as shown in Figure 4) and stock flow diagram (as shown in Figure 5) of this study’s model.

3. Model Data and Landscape Signal Determination

Jiangsu Province is at the forefront of the nation in the development of green residences, but the issue of “green residences is on the planning” is significant. By choosing Jiangsu Province as a model, other provinces can follow. As a result, a sample of data from Jiangsu Province is chosen.

3.1. Identify Institutions, Niches, and Consumers for the Model

Based on the residential market data in Jiangsu Province, one-, two-, and three-star labeled and operated green residential properties in Jiangsu Province in 2016 were, respectively, 85%, 5.34%, 0.11%, 7.93%, 0.21%, 0.77%, 0.77%, and 0.16%, and based on the area of each type of residential property and the collective agency intensity of the seven categories of general residential property. For each type of residence, the equivalent agent categories are Institutional, Niche 2, Niche 4, Niche 1, Niche 3, Niche 5, and Niche 6 (see Table 1).
Individual agent consumers are divided into two distinct categories based on consumption statistics from the Chinese residential market: green residential consumers and general residential consumers. Each group takes up a position in the practice space in the form of a normal distribution.

3.2. Selection of Practice Indicators and Determination of Data

3.2.1. Selection of Practice Indicators

This paper selects practice indicators from both qualitative and quantitative perspectives in order to better respond to the preferences of consumer points and the social system function of green residences in collective agency. Among these, the quantitative indicators are accurately depicted by utilizing Jiangsu Province’s green residential development data. The quantitative metrics include the green residences’ carbon dioxide emissions (kg CO2eq/(m2·a)), incremental costs (CNY/m2), incremental benefits (CNY/m2/year), and energy consumption (kWh/(m2·a)). Only descriptive assignments are accepted for the qualitative indicators, which are chosen from the categories of green technology, health, and comfort.

3.2.2. Identifying Collective and Individual Agent Locations in Practice Space

The initial locations of both collective and individual agents in the practice space were established through statistical analysis of data pertaining to green residences in Jiangsu Province. Following dimensionless processing, all practice indicators ranged from 0 to 100; see Table 2 and Table 3.
As the landscape signals change, the proportion of individual proxy consumers in each group changes from moment to moment. An early period in 2016 when 30% of the green residential customers and 70% of the general residential consumers were each represented was determined via statistical analysis of the green residential market data.

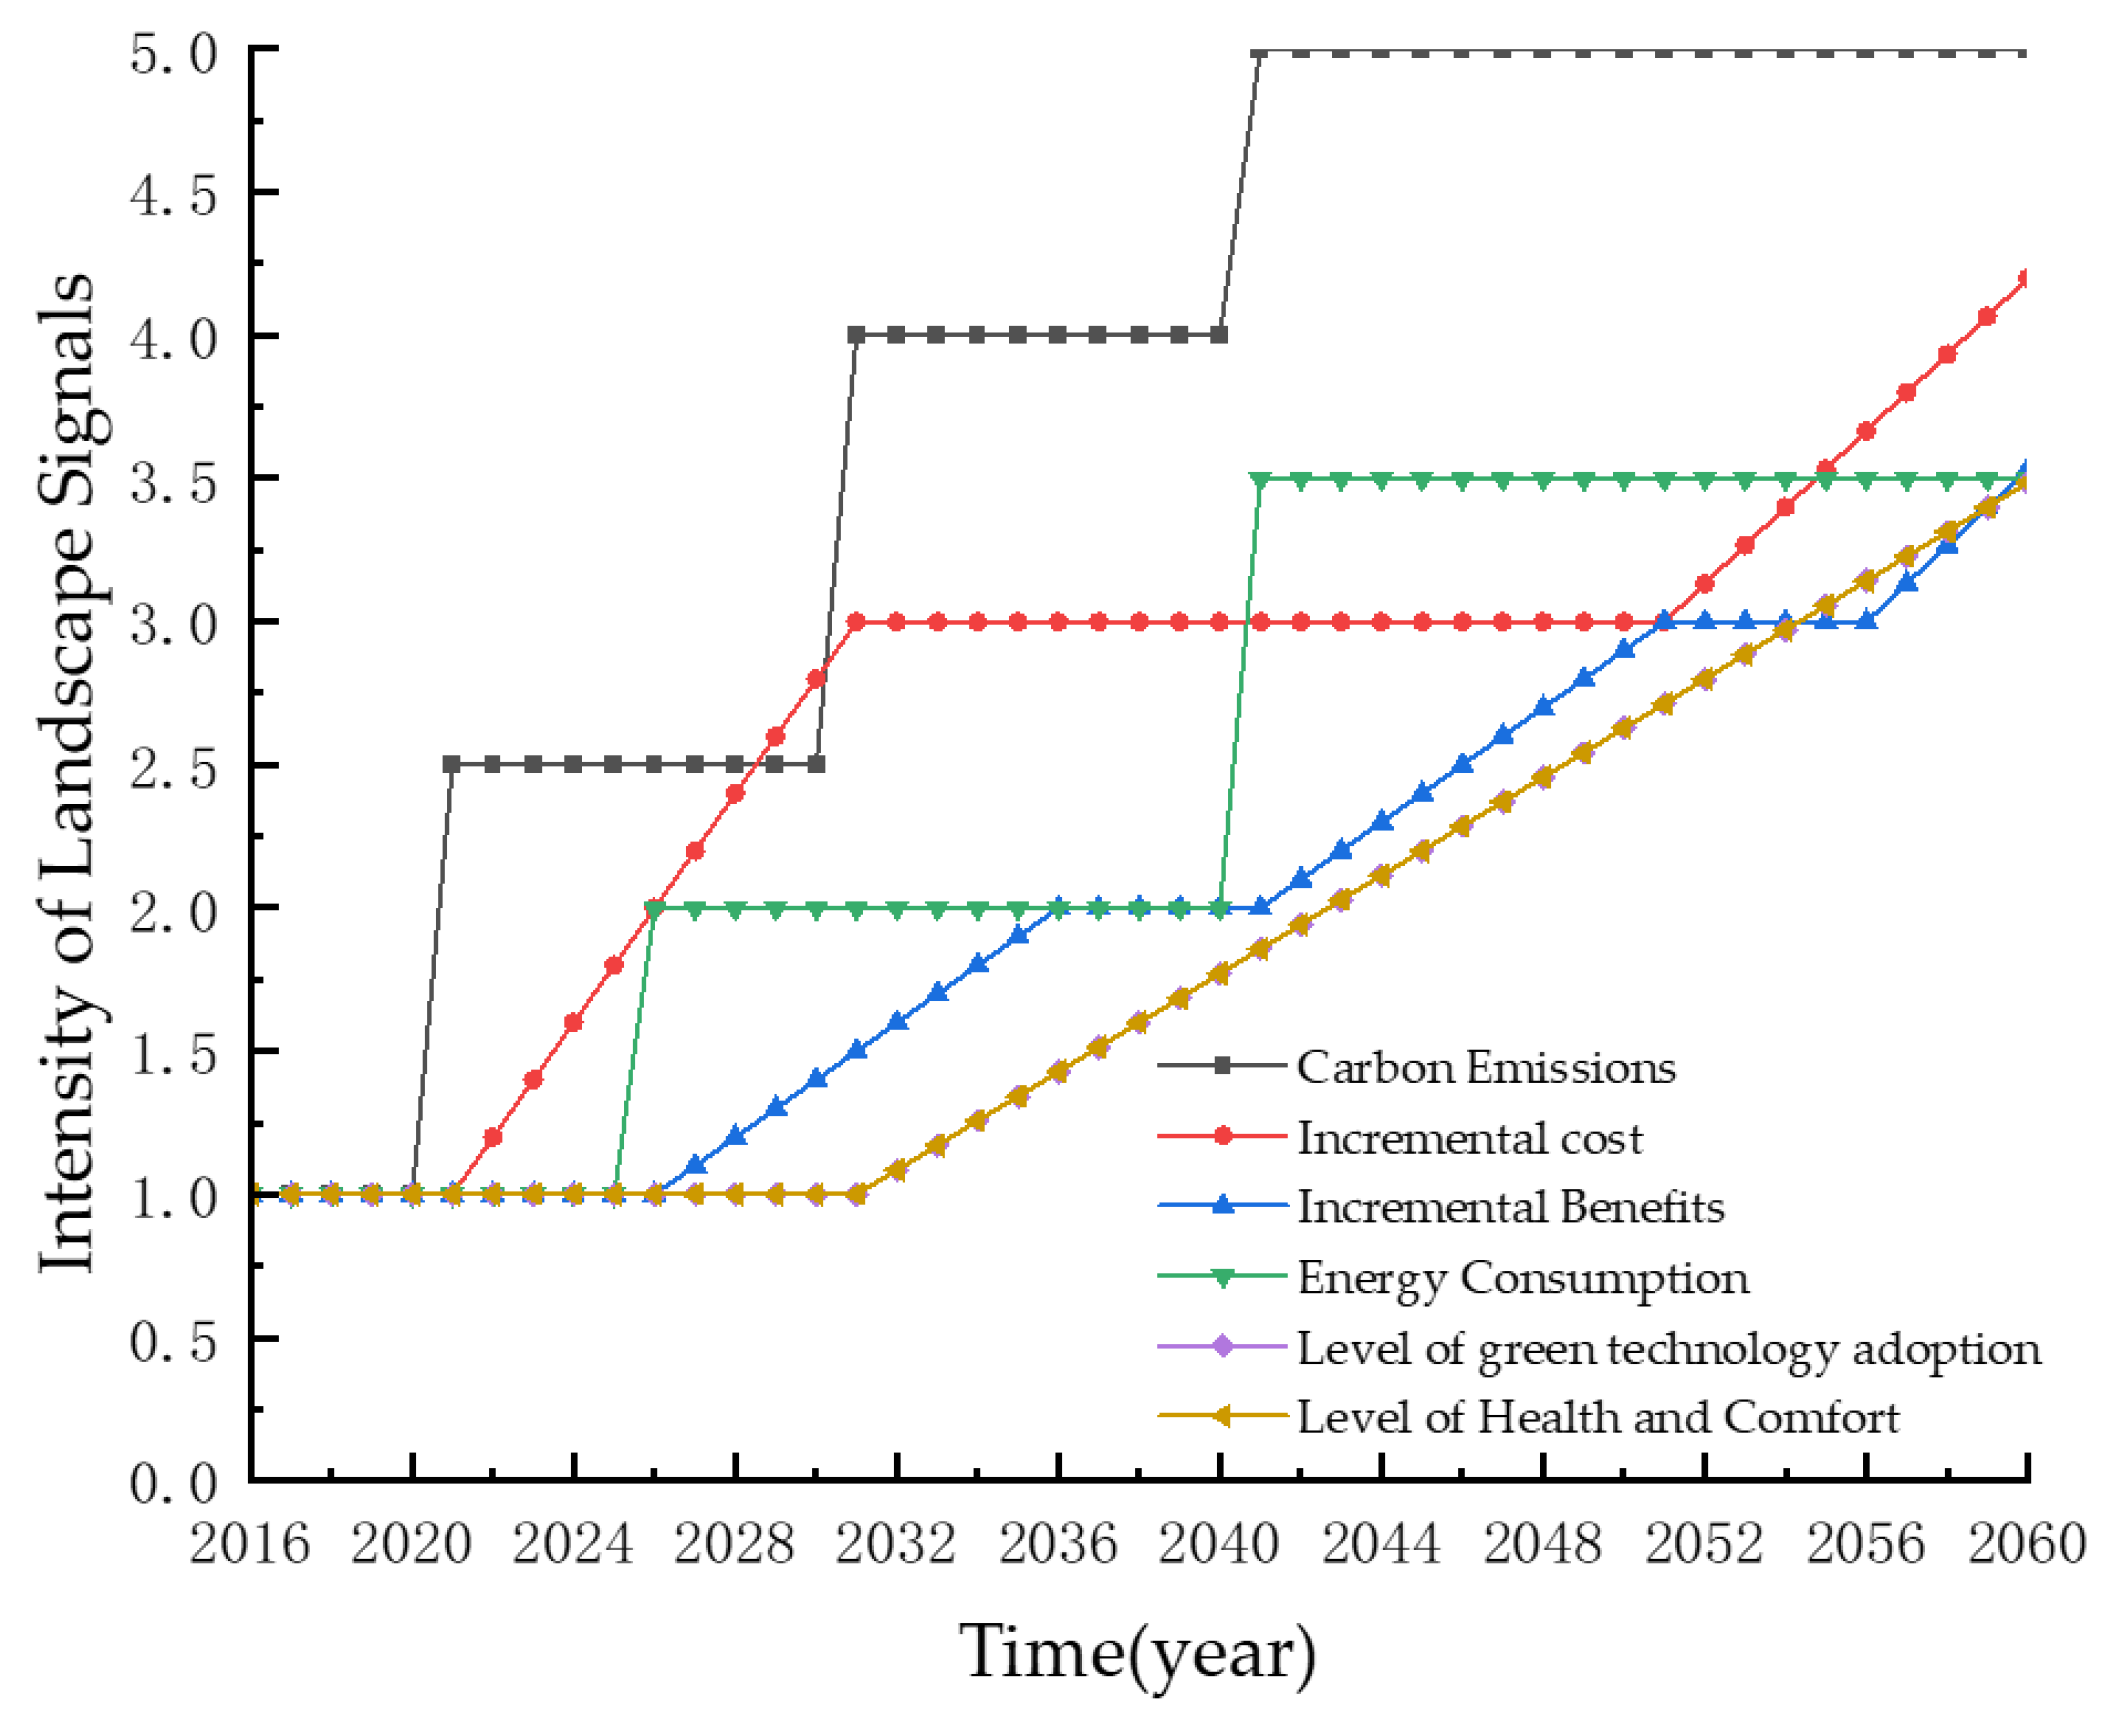
3.3. Landscape Signal Determination

The development of green residences in Jiangsu Province from 2016 to 2060 was predicted using the contextual analysis approach to analyze and summarize the texts of policies, announcements, opinions, etc., and the related literature. The results are shown in Figure 6.

4. Simulation Results

4.1. Testing of Model Validity

For the period of 2016–2060, simulations were run using Vensim@ PLE7.3.5 (Single Precision) x32 software with a 1-year simulation step. The years for simulating the current scenario were 2016–2020, while the years for simulating the anticipated growth of green residences in Jiangsu Province were 2021–2060. The data related to green residences in Jiangsu Province in 2016 were brought into the model, and the market share of each type of green residence was used as the test variable. Table 4 displays the test results, which indicate that the relative inaccuracy is less than ±10%, better reflecting the real conditions and allowing for simulation to be performed [31].

4.2. Simulation Results of Green Residence Promotion

Two sets of simulated signals are designed in this paper.
  • An energy–carbon dual-control group with landscape indications that only operates in 2020–2030. Figure 7 displays the fundamental control group signals, and Figure 8 displays the simulation results.
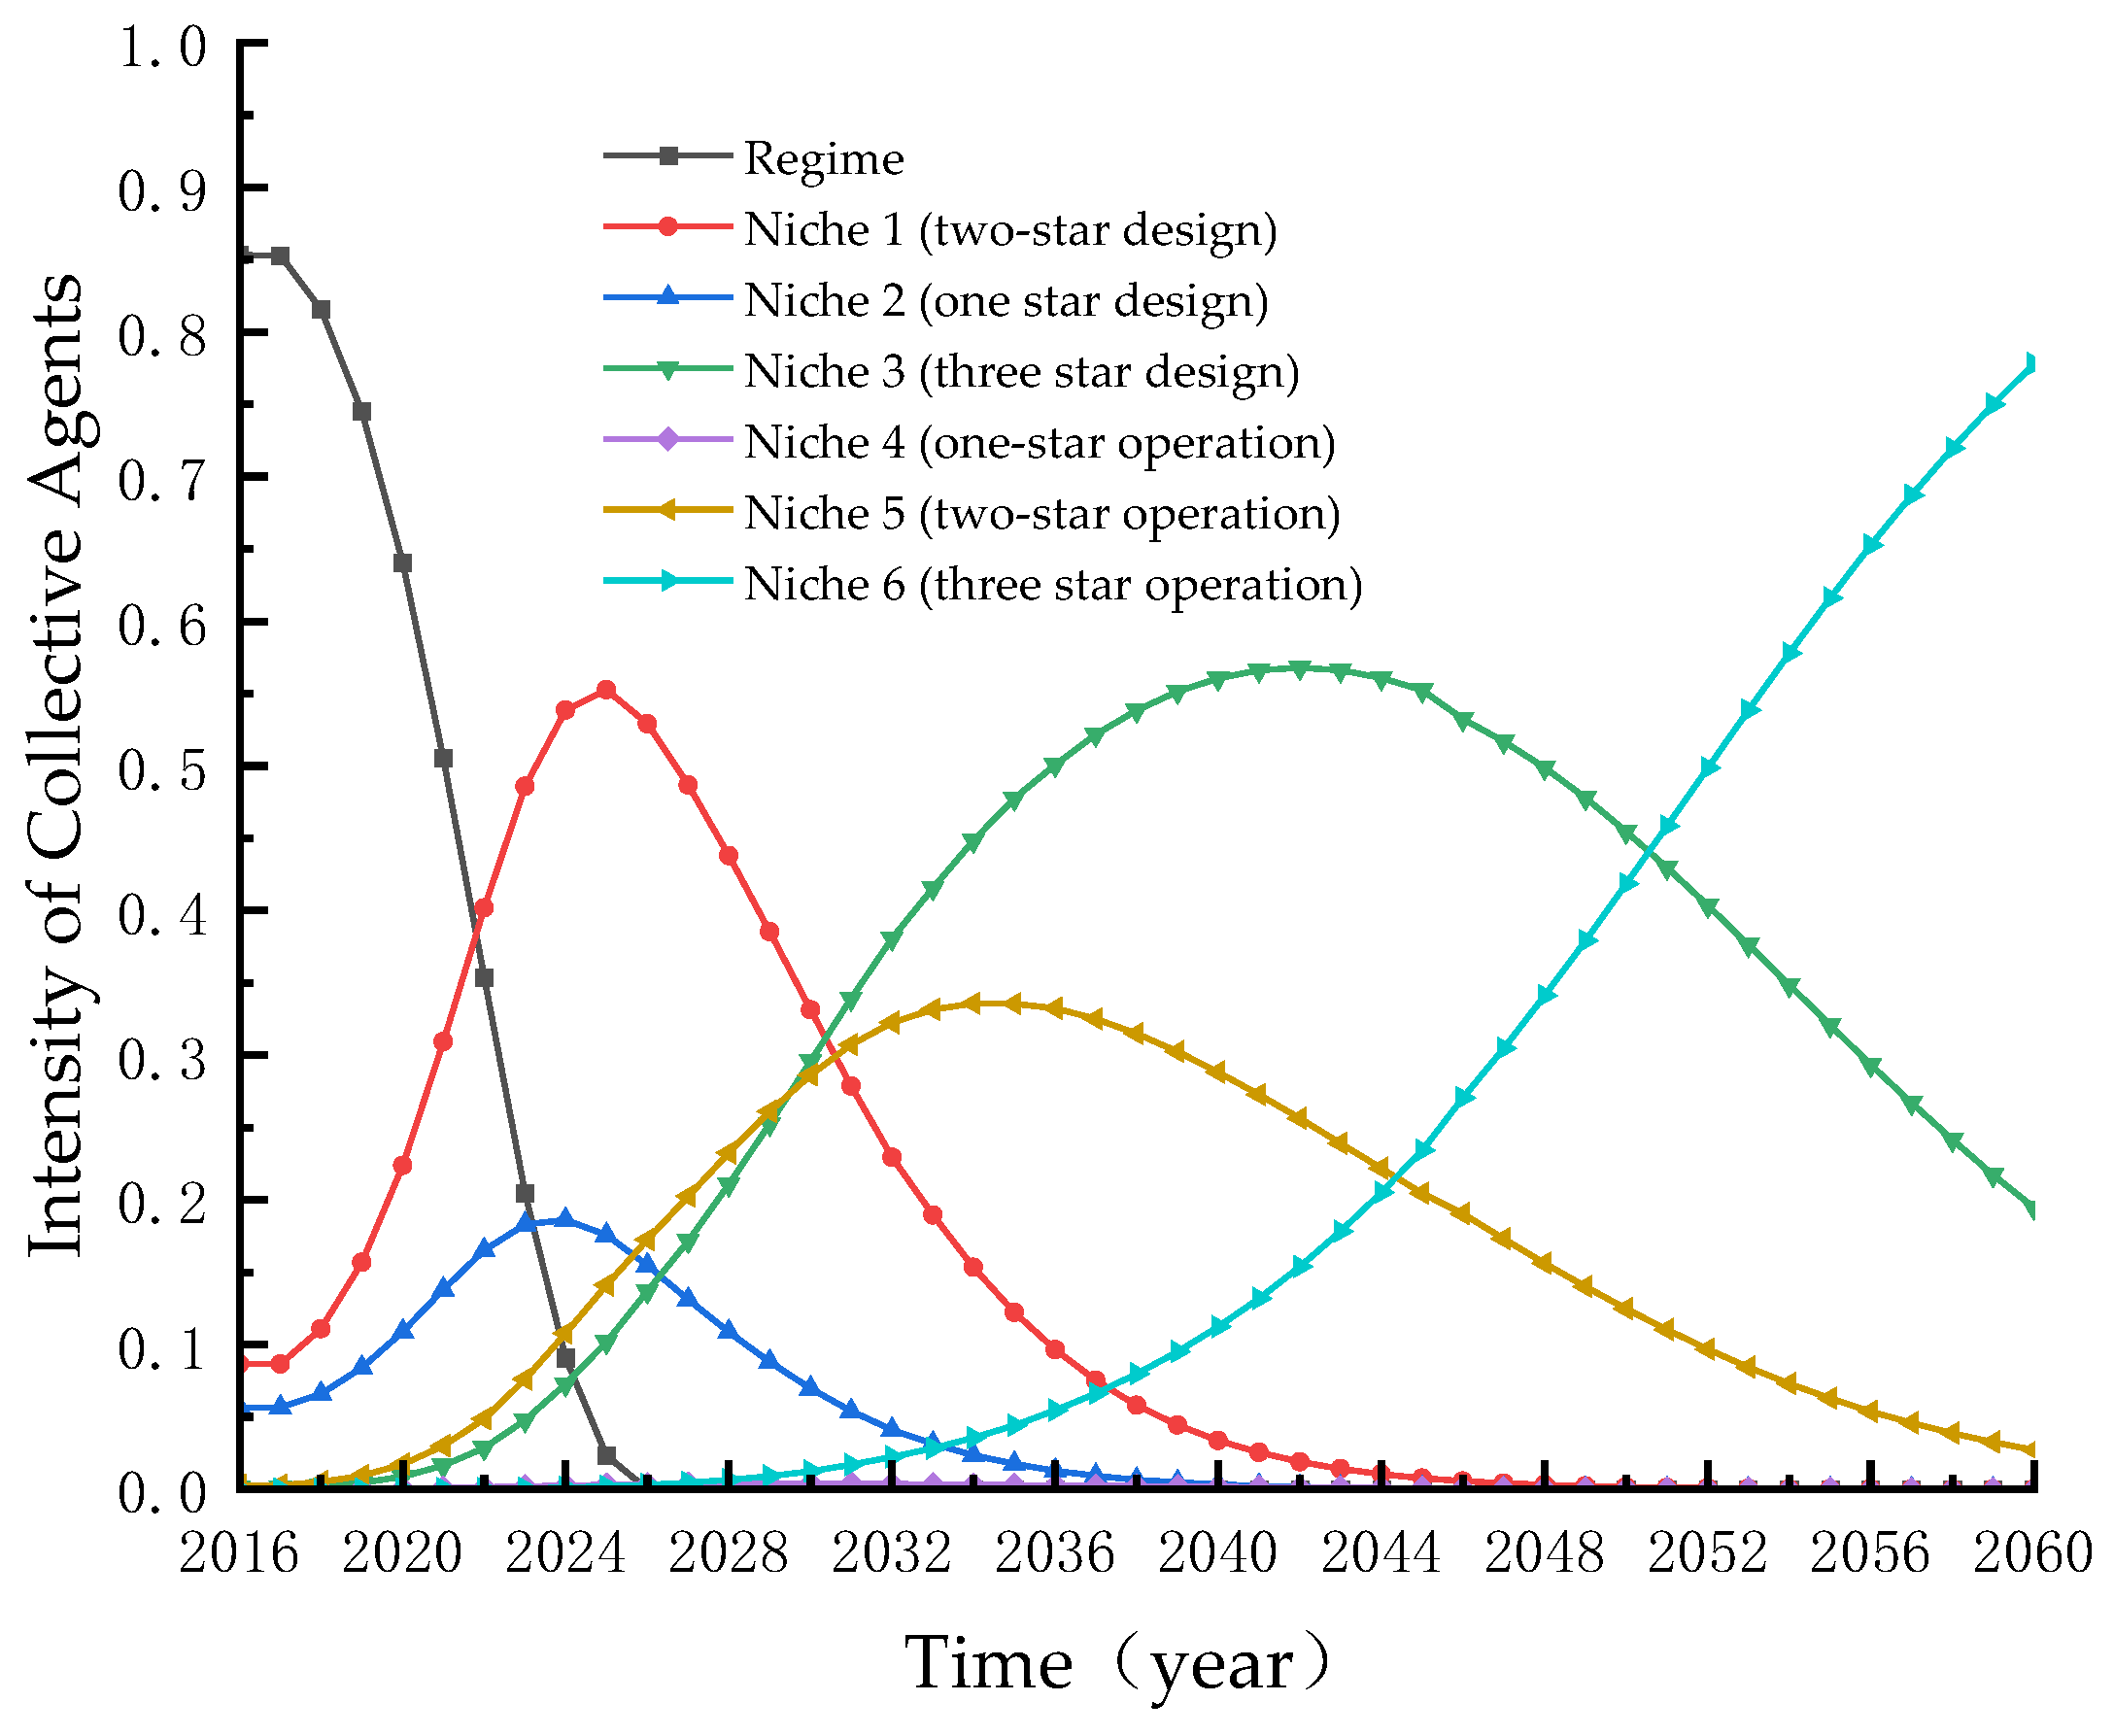
  • The experimental group was recognized using Section 3.3’s textual description of the landscape signals. Figure 6 displays the experimental group signals, whereas Figure 9 displays the outcomes of the simulation.
The fundamental control group signals (Figure 7) and the simulation results (Figure 8) are presented. The quick reduction in general residential intensity disappears in 2025 only in the case of the energy–carbon dual-control signals between 2021 and 2030, which is in line with Jiangsu Province’s 14th Five-Year Plan’s aim. The system’s remaining collective agents are slowly starting to advance, with two-star design mark green residences assuming regime roles. The one-star design mark green residences continue to decline until disappearing after reaching the authorized niche. In the years 2031 to 2060, the landscape signals vanish, and the proportion of green residences with two-star operational labels and three-star design labels progressively increases before gradually declining. In 2050, the percentage of three-star operational green residences will overtake three-star design green residences as the predominate residences regime in Jiangsu Province. In 2060, 77.92% of all residential systems will be three-star operationally labeled green residences.
The basic control group signals (Figure 6) and simulation results (Figure 9) are analyzed. The proportion of general residences decreases from 46.17% in 2021 to 0% in 2026. The share of two-star design-labeled green residences rises from 36.8% to a peak of 65.9% in 2025, becoming the dominant residential system in Jiangsu Province, and then continues to decline until it disappears in 2044. Although it expands, the percentage of one-star design-labeled green residences does not yet reach the permitted niche, which is declining to nothing by 2034. The percentage of operational two-star and operational three-star green residences exhibits a clear growing trend, with the development of three-star operational green residences. After 2030, the three-star operational labeled green residences rise from a niche to an empowered niche, reaching 50.3% in 2040 and becoming a regime, eventually reaching 98.44% in 2060 to occupy the absolute dominance of building types in Jiangsu Province. In Jiangsu Province, the objective of high-quality green residence development is accomplished.

5. Discussion

A thorough and precise identification of these factors is essential for the effective advertising of green residences because the growth of green residences is influenced by numerous factors, leading to a market failure [32]. Existing research supports this viewpoint and provides proof of this idea. Xi Liang et al. found that the policy combination of dynamic subsidies and static taxes is superior to other policies in promoting green building development [33]. Yanyu Wang et al. found that the incremental cost of green residences is one of the key factors constraining their development [34]. Andrea Chegut found that current economic analysis of more efficient green buildings ignores input costs [3]. This finding also explains why green buildings have been adopted rather slowly in actual construction, despite there being economic rationality. Wei Wang et al. considered the development and popularization of green building technology as a key element influencing the development of green buildings [35]. Weimin Wang [36], Xiaodong Yang [37], and Yong Liu [38] et al. found that consumer preference for green residences has a significant influence in the growth of green residences. These factors involve three levels of perspective: macro-level policies, meso-level social functional attributes of green residences, and micro-level individual consumer behavioral preferences. Only a small percentage of research findings on the promotion of green residences, however, adequately accounts for the three levels of macro/meso/micro. The macro landscape signals, the six meso-social function attributes of residences (health and comfort, incremental cost, green technology adoption level, incremental benefit, energy saving, and carbon emission), and the micro-level individual actor’s preference for the six social function attributes of residences are all thoroughly taken into account in this paper using the MLP analysis framework in sustainability theory. The examination of the elements impacting the promotion of green residences is more pertinent and useful when it is conducted from a macro/meso/micro multi-level analytical perspective.
Simulation modeling studies of green residence promotion can effectively show the dynamic relationship between the factors of green residence promotion. This was confirmed by Nuri et al. Nuri applied system dynamics to study the short- and long-term effects of green building-related policies on greenhouse gas emissions [9]. The study’s findings demonstrated that the green building policy for new buildings has less of an impact on reducing emissions and saving energy than the green retrofit strategy for existing buildings. According to Fei’s simulation studies of multi-subject games in the promotion of green buildings, the government is the industry pioneer in this field, and business consumer decision making greatly depends on its support [39]. However, these studies mainly focus on macro and meso-influences, with no examination of micro individual consumer characteristics, failing to highlight the complex systematic challenge of green residential promotion thoroughly and precisely. The agent-based modeling approach, which is a bottom-up modeling approach that can clearly depict the influence of individual customers on the system, is introduced in this study. The agent-based system dynamics modeling method is used in this study to merge the two simulation modeling approaches to construct a simulation model of green residence promotion based on macro/meso/micro multi-level complex factors. It accurately depicts the interactions between the factors at all levels of the green residence system during the promotion process, particularly the influence of individual agents’ behavioral preferences on the promotion of green residence at the micro-level, which can be difficult to accomplish using traditional system dynamics techniques.

6. Conclusions

With the increasing seriousness of resource consumption and environmental pollution, it is imperative to promote green residences with good energy-saving and emission reduction benefits. However, the number of green residences with operational labels is grossly insufficient. Clarifying the success conditions and pathways for the occurrence of successful green residence promotion is the key to promoting the achievement of the carbon peak and carbon neutral targets in China. Using MLP as a conceptual framework, we analyze the green residential system from different levels, incorporate agent-based modeling ideas into system dynamics modeling, construct an agent-based system dynamics model, and simulate the change in the area share of each type of residential property in Jiangsu Province from 2016 to 2060. The main research conclusions are as follows:
(1)
The agent-based simulation model of the dynamics of the green residence promotion system has a good reference value for the simulation of green residence promotion. According to the simulation results of the test group in Figure 9, the development trend of various types of green residence has the same trend as the results of previous studies. The small differences in turning points and peaks are due to the inclusion of micro-individual agent consumers in the model.
(2)
Macro landscape signals are necessary for the success of green residence promotion. Furthermore, landscape signals indirectly promote green residences by changing the behavioral preferences of micro-individual agents. The longer the duration and intensity of the landscape signals, the faster and larger the development of high-star operationally labeled green residences, and vice versa.
(3)
Macro-level landscape signals are crucial for the success of promoting green residences. However, until 2035, two-star design-labeled green residences will continue to be a crucial transitional product. This is because two-star design-labeled green residences have relatively low technical requirements and incremental costs, good infrastructure, high individual agent consumer acceptance, and relatively good energy efficiency and emission reduction benefits, when landscape signals change individual agent behavioral preferences.
(4)
Under regular landscape signal intensity, the intensity of three-star operationally labeled green residences will reach more than 50% of the building system in 2040, becoming the regime of the building system in Jiangsu. This illustrates that the landscape signal duration and the behavioral preference shift of individual agents must be maintained for a long period of time in the process of sustainable development in the building sector in Jiangsu Province. Only in this way will the high-star green residences of the operational designation achieve a level of foundational perfection and technological advancement greater than that of the existing general residence.
The results of this study provide important guidance for the formulation of high-quality development strategies for green residences. Researchers can utilize the agent-based simulation model of green residence promotion system dynamics for in-depth study. Meanwhile, policy makers can be guided by the continuously enhanced landscape signals and the promotion pathway of developing two-star design-labeled green residences by 2035 and three-star operational labeled green residences by 2040 to achieve the carbon peaking and carbon neutrality goals.

Author Contributions

Conceptualization, H.X. and J.Z.; methodology, H.X., Z.Z. and Y.X.; investigation, H.X., J.Z., Y.X., J.Y. and J.L.; resources, H.X., X.X. and J.Z.; data curation, H.X., Z.Z., J.Y. and J.L.; writing—original draft preparation, H.X. and X.X.; writing—review and editing, Y.X., J.Y., X.X. and J.L.; visualization, H.X., X.X. and J.L.; supervision, H.X. and X.X. All authors have read and agreed to the published version of the manuscript.

Funding

This research received no external funding.

Data Availability Statement

The data presented in this study are available on request from the corresponding author. The data are not publicly available in order to safeguard the information of the survey respondents.

Conflicts of Interest

The authors declare no conflict of interest.

References

  1. Wang, Q.Q.; Meng, C.; Zhu, R.X.; Li, J.W. Research on carbon emission of green buildings based on whole life cycle theory. Contemp. Archit. 2022, 8, 14–16. [Google Scholar]
  2. Zhang, K.; Lu, Y.M.; Lu, H.S. Countermeasures for the high-quality development of green buildings in China under the background of dual-carbon target. Construct 2022, 43, 14–20. [Google Scholar] [CrossRef]
  3. Chegut, A.; Eichholtz, P.; Kok, N. The price of innovation: An analysis of the marginal cost of green buildings. J. Environ. Econ. Manag. 2019, 98, 102248. [Google Scholar] [CrossRef]
  4. Chen, L.; Chan, A.P.; Owusu, E.K.; Darko, A.; Gao, X. Critical success factors for green building promotion: A systematic review and meta-analysis. Build. Environ. 2022, 207, 108452. [Google Scholar] [CrossRef]
  5. Song, Z.X.; Chen, L. Analysis of key drivers of green building costs. Value Eng. 2017, 36, 20–22. [Google Scholar] [CrossRef]
  6. Zhou, Q.; Wang, H.P.; Xue, H. Research on driving mechanism of green building development. J. Xi’an Univ. Archit. Technol. (Soc. Sci. Ed.) 2019, 38, 28–38. [Google Scholar] [CrossRef]
  7. Qiu, B.X. Green building development misunderstanding and promotion path. Architecture 2019, 13, 20–22. [Google Scholar]
  8. Yu, H.L.; Chen, J.L. Research on the risk chain of green building projects under EPC mode based on SEM. Sci. Technol. Manag. Res. 2021, 41, 199–205. [Google Scholar]
  9. Onat, N.C.; Egilmez, G.; Tatari, O. Towards greening the U.S. residential building stock: A system dynamics approach. Build. Environ. 2014, 78, 68–80. [Google Scholar] [CrossRef]
  10. Sun, G.S.; Jiang, D.L.; Feng, J.; Chen, X.X. Mechanisms of green construction technology drivers in China under the carbon peaking target: A system dynamics-based simulation analysis. Sci. Technol. Manag. Res. 2022, 42, 194–201. [Google Scholar]
  11. Huang, D.X.; Li, S.L.; Wu, Y.J.; Lu, R. Symbiosis between green buildings and traditional buildings with simultaneous consideration of game payment and limited market capacity. China Admin. Sci. 2021, 29, 94–105. [Google Scholar] [CrossRef]
  12. Park, H. A Stochastic Planning Model for Battery Energy Storage Systems Coupled with Utility-Scale Solar Photovoltaics. Energies 2021, 14, 1244. [Google Scholar] [CrossRef]
  13. Gao, H.; Wang, X.; Wu, K.; Zheng, Y.; Wang, Q.; Shi, W.; He, M. A Review of Building Carbon Emission Accounting and Prediction Models. Buildings 2023, 13, 1617. [Google Scholar] [CrossRef]
  14. Borshchev, A.; Filippov, A. From System Dynamics and Discrete Event to Practical Agent Based Modeling: Reasons, Techniques, Tools. In Proceedings of the 22nd International Conference of the System Dynamics Society, Oxford, UK, 25–29 July 2004. [Google Scholar]
  15. Siebers, P.O.; Macal, C.M.; Garnett, J.; Buxton, D.; Pidd, M. Discrete-event simulation is dead, long live agent-based simulation! J. Simul. 2010, 4, 204–210. [Google Scholar] [CrossRef]
  16. Macal, M.C.; North, J.M. Tutorial on agent-based modelling and simulation. J. Simul. 2010, 4, 6–20. [Google Scholar] [CrossRef]
  17. Silverman, B.G.; Hanrahan, N.; Bharathy, G.; Gordon, K.; Johnson, D. A systems approach to healthcare: Agent-based modeling, community mental health, and population well-being. Artif. Intell. Med. 2015, 63, 61–71. [Google Scholar] [CrossRef]
  18. Attallah, S.O. A Life Cycle Analysis Approach for the Enhancement of Sustainability Decision-Making in the Construction Industry Using Agent-Based Modeling. Ph.D. Thesis, Purdue University, West Lafayette, IN, USA, 2014. [Google Scholar]
  19. Jo, H.; Lee, H.; Suh, Y.; Kim, J.; Park, Y. A dynamic feasibility analysis of public investment projects: An integrated approach using system dynamics and agent-based modeling. Int. J. Proj. Manag. 2015, 33, 1863–1876. [Google Scholar] [CrossRef]
  20. Tran, M. A general framework for analyzing techno-behavioural dynamics on networks. Environ. Modell. Softw. 2016, 78, 225–233. [Google Scholar] [CrossRef]
  21. Kolominsky-Rabas, P.L.; Djanatliev, A.; Wahlster, P.; Gantner-Bar, M.; Hofmann, B.; German, R.; Sedlmayr, M.; Reinhardt, E.; Schuttler, J.; Kriza, C.; et al. Technology foresight for medical device development through hybrid simulation: The ProHTA Project. Technol. Forecast. Soc. Chang. 2015, 97, 105–114. [Google Scholar] [CrossRef]
  22. Zhang, Y.; Vand, B.; Baldi, S. A Review of Mathematical Models of Building Physics and Energy Technologies for Environmentally Friendly Integrated Energy Management Systems. Buildings 2022, 12, 238. [Google Scholar] [CrossRef]
  23. Wang, J.; Zhang, X. Sustainable energy transition: Modeling and analysis. China Popul. -Resour. Environ. 2020, 30, 74–82. [Google Scholar]
  24. Loorbach, D. Transition Management: New Mode of Governance for Sustainable Development. Ph.D. Thesis, Erasmus School of Social and Behavioural Sciences, Burgemeester Oudlaan, Rotterdam, The Netherlands, 2007. [Google Scholar]
  25. Geels, F.W.; Schot, J. Typology of sociotechnical transition pathways. Res. Policy 2007, 36, 399–417. [Google Scholar] [CrossRef]
  26. Geels, F.W. Technological transitions as evolutionary reconfiguration processes: A multi-level perspective and a case-study. Res. Policy 2002, 31, 1257–1274. [Google Scholar] [CrossRef]
  27. Chang, R.; Lu, Y. Facilitating Systemic Changes Towards Green Buildings: Developing Conceptual Frameworks of Socio-Technical Transitions. Energy Procedia 2017, 143, 31–306. [Google Scholar]
  28. Gibbs, D.; O’Neill, K. Building a green economy? Sustainability transitions in the UK building sector. Geoforum 2015, 59, 133–141. [Google Scholar]
  29. Schilperoord, M.; Rotmans, J.; Bergman, N. Modelling societal transitions with agent transformation. Comput. Math. Organ. Theory 2008, 14, 283–301. [Google Scholar] [CrossRef]
  30. Alex Haxeltine, L.W.; Bergman, N.; Rotmans, J.; Schilperoord, M.; Kohler, J. A Conceptual Framework for transition modelling. Int. J. Innov. Sustain. Dev. 2008, 3, 93–114. [Google Scholar] [CrossRef]
  31. Kong, Y.H.; Wang, L.; Guo, Z.L.; Jiang, Y.C.; Wang, B. Prediction of peak carbon emissions in Gansu Province based on system dynamics. J. Environ. Eng. Technol. 2018, 8, 309–318. [Google Scholar]
  32. Li, X.L.; Yin, H.P. Analysis of operational energy consumption and optimization suggestions for green public buildings in hot summer and cold winter regions. HVAC 2017, 47, 25–32. [Google Scholar]
  33. Liang, X.; Fu, Y. Research on the supply-side evolution game of green building under the government dynamic reward and punishment mechanism. China Manag. Sci. 2021, 29, 184–194. [Google Scholar] [CrossRef]
  34. Wang, Y.Y.; Chen, H.Y.; Teng, J.Y.; Ran, L.Y.; Wu, X.G. Current status and suggestions for incremental cost of green building certification program in China. J. Civ. Eng. Manag. 2017, 34, 175–179. [Google Scholar] [CrossRef]
  35. Wang, W.; Zhang, S.; Su, Y.; Deng, X. An Empirical Analysis of the Factors Affecting the Adoption and Diffusion of GBTS in the Construction Market. Sustainability 2019, 11, 1795. [Google Scholar]
  36. Wang, W.M.; Liu, A.D. Empirical study on factors influencing consumers’ green residences purchasing behavior. J. Xi’an Univ. Archit. Technol. (Nat. Sci. Ed.) 2018, 50, 454–462. [Google Scholar] [CrossRef]
  37. Yang, X.D.; Wu, Y.X. Factor analysis and relationship study of green residences choice behavior. China Soft Sci. 2017, 6, 175–182. [Google Scholar]
  38. Liu, Y.; Zhang, H. Research on factors influencing potential consumers’ green residences purchase intention. Shanghai Manag. Sci. 2017, 39, 57–62. [Google Scholar]
  39. Xue, F.; Zhou, X.W.; Yan, G.L.; Xu, S.T. Evolutionary Game Analysis of Green Building Promotion Mechanism Based on SD. In Proceedings of the International Conference on Economic Management and Model Engineering (ICEMME), Malacca, Malaysia, 6–8 December 2019; pp. 356–359. [Google Scholar]
Figure 1. Theoretical model of MLP for sustainable transformation.
Buildings 13 02635 g001
Figure 2. Model’s overall structure.
Buildings 13 02635 g002
Figure 3. The internal structure of collective agents.
Buildings 13 02635 g003
Figure 4. Causal loop diagram of the model.
Buildings 13 02635 g004
Figure 5. Stock flow diagram of the model.
Buildings 13 02635 g005
Figure 6. The date of Jiangsu Province landscape signals from 2016 to 2060. Note: The purple line for ‘Level of Green Technology Adoption’ overlaps with the yellow line for ‘Level of Health and Comfort’.
Buildings 13 02635 g006
Figure 7. Landscape control group signals are used. Note: The black line for “Carbon Emissions” overlaps with the green line for “Energy Consumption”; at the same time, the red-red line for “Incremental Costs”, the blue line for “Incremental Benefits”, the purple line for “Level of Green Technology”, and the purple line for “Green Technology” are the same. The red line for “Incremental Costs”, the blue line for “Incremental Benefits”, the purple line for “Level of Green Technology”, the red line for “Adoption, Level of Green Technology” and the purple line for “Energy Consumption” all overlap. Adoption, Level of Health and Comfort” yellow line.
Buildings 13 02635 g007
Figure 8. Results of the fundamental control group’s simulation.
Buildings 13 02635 g008
Figure 9. Results of an experimental group simulation.
Buildings 13 02635 g009
Table 1. Collective agent categories in the residential system in Jiangsu Province in 2016.
Type of ResidencesArea (Million Square Meters)Weight of Area
General Residences15,165.2285%
One Star Design Label Green Residences947.165.34%
One Star Operation Label Green Residences19.010.11%
Two-star Design Mark Green Residences1407.437.93%
Two Star Operational Label Green Residences36.690.21%
Three-star Design Label Green Residences136.250.77%
Three Star Operational Label Green Residences28.240.16%
Table 2. Jiangsu Province practice space initial location of collective agents in 2016 (after dimensionless processing) (0–100).
Carbon EmissionsIncremental CostIncremental BenefitsEnergy ConsumptionLevel of Green Technology AdoptionLevel of Health and Comfort
Regime1000010055
Niche 149.2919.4431.5454.193530
Niche 260.859.4212.7476.341515
Niche 329.7157.7356.3723.385065
Niche 444.7720.6617.5159.563045
Niche 532.8244.5046.7139.156585
Niche 60100100085100
Table 3. Individual agent initial positions in Jiangsu Province in 2016 (0–100).
Individual Agent TypeGeneral Residential CustomersGreen Residential Customers
Carbon Emissions90 Approaching regime’s carbon footprint45 Near Niche 1’s carbon emissions
Incremental Costs0 The regime’s incremental cost is the same15 Increasing expense of entering a specialty
Incremental Benefits0 Having no incremental advantage over the regime40 Added advantages of going after Niche 5
Energy Consumption85 Closeness to the regime’s energy use35 Energy use in the vicinity of Niche 5
Level of Green Technology Adoption5 Adoption of green technologies at the same level as the regime30 Adoption of green technology at the same level as that of Niche 1
Level of Health and Comfort5 The same level of comfort and health as the programHealth and comfort level 35 Slightly above the Niche 5
Consumer Weighting0.70.3
Table 4. Results of the model validity testing.
VintagesRelative Tolerance
20162017201820192020
Regime1.90%4.20%5.24%−3.08%2.71%
Niche 1−4.14%−2.50%6.28%0.35%−6.46%
Niche 22.46%−3.79%1.66%−3.23%−0.94%
Niche 3−4.58%−6.48%1.78%5.39%0.88%
Niche 4−0.47%−2.72%−8.98%0.00%0.00%
Niche 59.25%9.64%6.47%0.90%2.91%
Disclaimer/Publisher’s Note: The statements, opinions and data contained in all publications are solely those of the individual author(s) and contributor(s) and not of MDPI and/or the editor(s). MDPI and/or the editor(s) disclaim responsibility for any injury to people or property resulting from any ideas, methods, instructions or products referred to in the content.

